Article

Analysis of EAF Energy Efficiency Characteristics Based on Industrial Data and Energy Balance

1
Institute for Carbon Neutrality, University of Science and Technology Beijing, Beijing 100083, China
2
Beijing Key Laboratory of Research Center of Special Melting and Preparation of High-End Metal Materials, University of Science and Technology Beijing, Beijing 100083, China
3
State Key Laboratory of Advanced Metallurgy, University of Science and Technology Beijing, Beijing 100083, China
4
Special Steel Business Division, Benxi Iron and Steel Group Co., Ltd., Benxi 117000, China
5
Zhangxuan Technology, HBIS Group, Zhangjiakou 075100, China
6
Jingjiang Special Steel Co., Ltd., CITIC Pacific Special Steel Group, Jingjiang 214516, China
*
Authors to whom correspondence should be addressed.
Metals 2026, 16(6), 594; https://doi.org/10.3390/met16060594 (registering DOI)
Submission received: 13 April 2026 / Revised: 14 May 2026 / Accepted: 27 May 2026 / Published: 29 May 2026

Abstract

Improving energy efficiency of electric arc furnace (EAF) steelmaking is a key pathway for the iron and steel industry to achieve carbon neutrality. Based on statistical data from 56 industrial EAFs, this study established and validated a comprehensive mass and energy balance model with a verification error of less than 5% and systematically quantified the effects of furnace type, furnace capacity, hot metal charging ratio, and scrap preheating on EAF energy efficiency through statistical analysis and scenario simulation. The results show that furnace type is the decisive factor for energy efficiency; Consteel and shaft furnace EAFs with scrap preheating are significantly more efficient than conventional EAFs, with the shaft furnace exhibiting the highest preheating efficiency and best stability. The scale effect of furnace capacity on energy efficiency is weak and fully overshadowed by furnace type. Each 10% increase in hot metal ratio reduces specific power consumption by about 50 kWh/t in conventional furnaces, and the optimal hot metal ratio is 40–50% to balance power consumption and total energy consumption. Scrap preheating saves electricity by recovering physical heat, with each 100 °C temperature increase reducing power consumption by 25 kWh/t; compared with the Consteel process, the shaft furnace process reduces total energy consumption by approximately 14% and increases energy efficiency by 9%. This study provides theoretical support and practical guidance for process optimization in the low-carbon transformation of EAF short-flow steelmaking.

1. Introduction

The steel industry is energy-intensive, consuming a lot of energy (coal, gas, electricity, etc.) while providing a large amount of steel products to society [1,2]. In China, the steel industry reportedly accounts for 11% of society’s total energy demand in 2020 [3]. In the face of the current situation of high energy consumption in the steel industry, how to reduce energy consumption has become a hot topic. Electric arc furnace (EAF) steelmaking is a low-energy production process with scrap as the main raw material, and its energy consumption is only about 1/3 of the blast furnace-converter (BF-BOF) process [4,5]. Therefore, the development of electric arc furnace steelmaking is an important way to reduce the energy consumption of steel production [6].
For many years, researchers have been looking for ways to reduce the energy consumption of electric arc furnaces. Traditional EAF smelting uses cold scrap as the main raw material, but ferrous raw materials can also be accepted, such as scrap, hot metal, pig iron, hot pressed iron (HBI), direct reduced iron (DRI), etc. [7]. EAF energy efficiency, defined as the ratio of the physical heat of the final steel product to the total energy input [4,8], serves as a direct indicator of the energy status of EAFs and plays a key role in the steelmaking process [9]. Statistical data-based mathematical models represent a low-cost, rapid, and safe solution for evaluating EAF power consumption [10,11,12,13]. Numerous heat transfer models have been developed to predict heat flow in EAF operations [14,15,16,17]. Marcus carried out extensive research on the mass and energy balance of EAF melting [18,19,20] and provided measured data from a variety of EAF facilities. Some researchers have studied the influence of changing electric arc furnace charge structures on energy consumption. Pfeifer’s study found that increasing the charge of hot metal in an electric arc furnace can effectively reduce power consumption [21]. Kirschen [20] modeled the effect of the addition of DRI on the energy consumption of an electric arc furnace. Y. Chen [22] put forward the concept of the DRI, pig iron and scrap charging triangle of an EAF to reduce energy consumption by optimizing its structure. Through the study of factory data, a new EAF smelting method with hot metal was proposed, which achieved a high ratio of hot metal and reduced the smelting power consumption by about 50 kWh/t [23]. Some researchers have studied ways to improve the energy efficiency of electric arc furnace smelting to reduce energy consumption and analyzed the impact of operational factors such as gas burner use [4], power loss and cooling system loss [14] on energy efficiency. Some researchers predict and analyze the change in energy efficiency in the arc furnace smelting process through numerical modeling and simulation [24,25].
At present, research on energy efficiency and energy consumption prediction for electric arc furnace (EAF) steelmaking mainly falls into three categories: mechanism modeling, data-driven methods, and hybrid approaches. Yang et al. [26] evaluated energy utilization efficiency and optimized operating parameters based on association rule mining. Lu et al. [27] proposed a mechanism–data hybrid framework that significantly improves the prediction accuracy of electric energy consumption. Al-Harbi et al. [28] conducted physically consistent energy efficiency analysis using feature engineering and XGBoost. Yi et al. [29] adopted the NSGA-II algorithm to achieve multi-objective optimization of cost, energy consumption, and carbon emissions. Carlsson et al. [30] demonstrated that scrap shape has a significant impact on prediction models, and their review [31] highlighted the limitations of statistical models in terms of validation and transparency. Jawahery et al. [32] and Opitz et al. [33] developed dynamic first-principle models suitable for online optimization, respectively. Tomažič et al. [34] compared multiple data-driven methods and reduced electric energy consumption by eliminating outlier batches. Matino et al. [35] pointed out that existing studies often focus on process optimization or individual environmental indicators in isolation, lacking a comprehensive evaluation of process performance, resource management, and integrated energy-environmental impacts. To address this gap, they developed an integrated EAF process simulation tool using Aspen Plus ®V11, which was validated with industrial data showing a global energy consumption error of only 0.4%, supporting scenario optimization and sustainability decision-making. The above studies provide systematic theoretical and technical support for energy conservation and intelligent control in EAF steelmaking.
In summary, researchers have carried out various studies on the influence of raw material structure and operation on energy consumption and energy efficiency of EAF. Due to the shortage of steel scrap in China [36,37], the charging mode of hot metal + steel scrap is widely used in EAFs [38]. At present, EAF steelmaking is characterized by diversified furnace types, complex burden structures and complicated energy compositions. Relying only on traditional techno-economic indicators such as power consumption and oxygen consumption can hardly fully reflect the energy utilization level, nor is it conducive to the evaluation and comparison among different furnace types. To systematically reveal the influencing laws and internal mechanism of energy efficiency in EAF-based short-process steelmaking in China, this study established a mass and energy balance model for EAFs based on field production data from 56 furnaces. The influences of key factors including furnace structure, capacity, hot metal ratio and scrap preheating were analyzed, and the formation mechanism of energy efficiency differences under various conditions was clarified, with corresponding directions for energy efficiency improvement proposed. The results can provide theoretical support for process adjustment and furnace type selection in new construction or renovation projects of EAF enterprises and have practical guiding significance for promoting energy efficiency improvement in the EAF steelmaking process.

2. Research Methodology

2.1. Data Collection and Description

The industrial data used in this study are derived from two independent sources: a questionnaire survey of 56 EAF plants and 300 consecutive production heats from a typical EAF. The questionnaire data cover basic operational parameters (furnace type, capacity, hot metal ratio, and average energy consumption) for cross-sectional statistical analysis. The 56 EAFs are grouped as conventional EAFs (n = 34), Consteel EAFs (n = 16), and shaft furnace EAFs (n = 6). Missing values in the questionnaire were imputed using furnace type and capacity as covariates. The dataset represents mainstream Chinese EAFs with capacities ranging from 30 t to 150 t, reflecting typical industrial practices, although potential sampling bias toward large-scale enterprises may exist (Table 1).
In Table 2, the zero specific electric consumption corresponds to operating conditions with an extremely high hot metal ratio (>80%), where the chemical and sensible heat from hot metal nearly meet the total energy demand. The tap-to-tap time of 133 min represents a small-capacity EAF operating under non-continuous production and low-load conditions, which is not representative of mainstream industrial practice.
The 300 consecutive heats were collected from a single typical EAF, mainly for mass and energy balance model calibration and validation. Its basic information is listed in Table 3. Abnormal records were excluded if (1) power consumption deviated beyond ±3σ from the mean; (2) material balance data were incomplete; or (3) the heat was operated under non-steady-state conditions.
In addition, the average temperature and chemical composition of hot metal (including contents of main elements such as C, Si, Mn, P, S) during this period were collected from the production scheduling department, which were used to calculate the sensible heat of hot metal and chemical reaction heat in the model. The typical compositions of scrap and pig iron were determined according to the raw material quality reports of the plant.
Based on the above data, the actual operating parameters of each heat (hot metal ratio, pig iron ratio, scrap ratio, tapping temperature, etc.) were input into the energy balance model to calculate the theoretical power consumption, which was then compared with the measured power consumption for model verification.

2.2. Mass and Energy Balance Model

2.2.1. System Boundary and Basic Assumptions

The boundary of the EAF process starts from the input of raw materials (scrap, pig iron, direct reduced iron, hot metal, etc.), energy and energy-consuming media, and ends at the output of the final product (liquid steel), by-products (slag), as well as flue gas and dust. Figure 1 shows the system boundary defined in this model. The system boundary encloses the EAF main body and the scrap preheating section (such as shaft furnace or horizontal preheating passage). The main energy flows across the boundary are labeled in the figure.
Key energy terms are defined in the Nomenclature section for consistent use throughout the manuscript. System boundary clarification: Scrap preheating heat is regarded as internal waste heat recovery and is not counted as external energy input. Hot metal sensible heat and chemical energy are defined as external energy inputs and are included in total energy consumption. This boundary ensures consistent cross-furnace energy accounting.
In addition, heat loss from endothermic reactions (endothermic reaction, e.g., carbonate decomposition) occurs within the boundary and is treated as an independent output item in the energy balance.
The chemical reactions, combustion, heat transfer and scrap preheating processes inside the boundary are regarded as internal processes of the system and are not separately counted as boundary fluxes.
To simplify calculations and ensure model operability, the following assumptions are adopted in the mass and energy balance:
① The entire process is regarded as steady state within one tapping cycle.
② Chemical reactions are assumed to reach equilibrium. If secondary combustion exists, it is assumed to occur in the preheating zone and be complete combustion.
③ Simplification of slag composition: only major oxides (CaO, SiO2, FeO, MgO, Al2O3, MnO, P2O5) are considered; trace elements and complex compounds are neglected.
④ Lumped treatment of heat losses: cooling water heat loss is directly used if measured data are available; otherwise, it is estimated as a fixed proportion (5–15%) of total input energy and related to melting duration. Radiation and other heat losses are combined into one item and calculated as the residual of the energy balance.
⑤ Due to the lack of raw material composition in the questionnaire, uniform typical raw material compositions are used for all questionnaire heats, as follows:
  • Hot metal: C 4.3%, Si 0.8%, Mn 0.6%, P 0.05%, S 0.03% (mass fraction);
  • Hot metal temperature: 1300 °C;
  • Pig iron: C 4.2%, Si 0.8%, Mn 0.21%, P 0.05%, S 0.04%;
  • Scrap: Fe 98.3%, C 0.18%, Si 0.25%, Mn 0.55%, P 0.03%, S 0.03%, balance impurities.
⑥ Scrap preheating treatment: owing to the absence of preheating temperature and fuel consumption records in the questionnaire, and the inability to distinguish energy sources for preheating, this study uniformly assumes that all preheating energy originates from flue gas waste heat recovery (internal recovery). No external fuel (e.g., burners) is used for scrap preheating; thus, no additional chemical energy from external fuel is included in the input energy. Under this assumption, preheating sensible heat is not independently counted as an input item of total energy consumption, and its effect is reflected by reducing electric power consumption via increasing the charging temperature of scrap (and pig iron).
⑦ Temperature reference: all sensible heat calculations are based on a reference temperature of 25 °C (room temperature).

2.2.2. Mass Balance

The mass balance is established based on the law of conservation of mass. The total input mass equals the total output mass plus the accumulation term, which is negligible for a batch process.
Main input materials include iron-bearing raw materials such as scrap, pig iron, hot metal, and direct reduced iron (DRI), as well as fluxes (lime, dolomite), oxygen, carbon powder, and electrode consumption. Outputs include liquid steel, slag, flue gas, dust, etc., among which liquid steel is the primary product. In the mass balance calculation, all mass quantities are normalized to the unit mass of product, i.e., the consumption and output per ton of liquid steel (1 t). The following factors should be taken into account:
(1) Iron Balance
m F e , i n = m F e , s t e e l + m F e , s l a g
In the equation, m F e , i n is the total iron mass in all charged materials, kg; m F e , s t e e l is the iron mass in tapped liquid steel, kg; and m F e , s l a g is the iron mass in slag (mainly present as FeO), kg. The distribution of iron can be expressed by the iron yield, η F e = m F e , s t e e l / m F e , i n , which generally ranges from 0.90 to 0.95, depending on the process level.
(2) Slag Reactions and Oxidation Amount of Each Element
The slag mass is calculated based on the input flux amount and oxidation products of impurity elements (C, Si, Mn, P, Fe, etc.) in raw materials. The slag mass is calculated as follows:
m s l a g = i m i , f l u x + j m j , o x i d a t i o n + m r e f r a c t o r y
where m i , f l u x is the mass of flux component i, kg; m j , o x i d a t i o n is the mass of oxide j formed by element oxidation, kg; and m r e f r a c t o r y is the mass of refractory erosion, kg (small in magnitude, usually negligible or estimated).
The oxidation amount of each element depends on its initial content and final residual content in liquid steel. Taking silicon (Si) as an example, the mass of its oxide is calculated as follows:
m S i O 2 = M S i M S i O 2 ( m S i , s c r a p + m S i , p i g + m S i , h o t   m e t a l ) η S i
where M denotes the relative atomic mass; m S i , s c r a p is the mass of Si contained in scrap, kg; similarly, the subsequent terms represent the Si mass in other iron-bearing raw materials. η S i is the oxidation ratio of Si,%.
In the calculation of oxidation reactions for each element, the oxidation proportion of carbon (C) is determined by oxygen blowing amount and end-point carbon content, which can be calculated based on the carbon balance. For other elements, typical values are adopted to describe their oxidation ratios. The values used in the model are as follows:
Si 100%, Mn 80%, P 100%, Fe 1–3%.

2.2.3. Energy Balance

While satisfying the mass balance, the energy balance must also be satisfied. In this model, the energy balance is expressed as
E i n = E o u t + E l o s s
where E i n is the input energy per ton of steel product, kWh/t. As shown in Figure 1, there are three types: electric energy, chemical energy, and material sensible heat. E o u t is the energy carried out by products, kWh/t, including liquid steel, slag, dust, etc. E l o s s is the energy dissipated to the surroundings, kWh/t, including flue gas loss, circuit loss, cooling water heat loss, and energy consumed by endothermic chemical reactions.
Energy Input
For the total energy input E i n = E e l c + E c h e m + E s e n s i b l e , the calculation methods for the three types of energy are introduced separately below.
(1) Electric Energy: Electric energy E e l e c is obtained from industrial data and used to compensate the energy deficit in simulation.
(2) Chemical Energy: Chemical energy E c h e m consists of three components: heat of element oxidation (oxidation of C, Si, Mn, P, Fe, etc.), heat of slag formation, E s l a g   f o r m a t i o n and heat of fuel combustion E f u e l , kWh/t. The heat of element oxidation is calculated based on the reaction enthalpy change corresponding to the oxidation amount of each element per ton of product. The enthalpy values for each element are listed in Table 4 [38].
Therefore, the chemical energy is calculated as follows:
E c h e m = k m k ( Δ H k ) + E f u e l + E s l a g   f o r m a t i o n
where mk is the oxidized mass of element k, kg; Δ H k is the reaction enthalpy change per unit mass of oxidized element k, kWh/kg.
(3) Charge Sensible Heat
In this study, it is uniformly assumed that the energy for scrap preheating originates from flue gas waste heat recovery (an internal energy cycle), and thus the sensible heat from scrap preheating is not independently counted as an input item. For materials with inherent physical heat input, such as hot-charged hot metal, the physical sensible heat they carry needs to be calculated separately.
E H M , s e n s i b l e = m H M c s , H M ( T m 25 ) + Δ H m + c l , H M ( T H M T m )
where E H M , s e n s i b l e is the sensible heat carried by hot metal, kWh/t; m H M is the hot metal charging amount per unit product, kg; c s , H M is the solid specific heat capacity of pig iron corresponding to hot metal composition, kWh/(kg·°C); T m is the melting point of hot metal, °C; Δ H m is the latent heat of fusion of hot metal, kWh/kg; c l , H M is the liquid specific heat capacity of hot metal, kWh/(kg·°C); and T H M is the hot metal temperature, °C.
For the internal calculation of the physical heat recovered from scrap preheating, the calculation method is as follows:
E p r e h e a t = m s c a r p c s , s c ( T p r e h e a t 25 )
where E p r e h e a t is the physical heat recovered via scrap preheating, kWh/t; c s , s c is the specific heat capacity of scrap, kWh/(kg·°C); and T p r e h e a t is the temperature of scrap after preheating, °C.

2.2.4. Energy Output

(1) Sensible Heat of Liquid Steel
E s t e e l = c s , s t e e l ( T l 25 ) + Δ H m , s t e e l + c l , s t e e l ( T t a p T l )
where E s t e e l is the physical heat per ton of liquid steel product, kWh/t; c s , s t e e l is the solid specific heat capacity of steel, kWh/(kg·°C); and Tl is the melting point of liquid steel, °C. The liquid steel temperature (Tl) is calculated based on measured steel composition rather than fixed values, with key elements (C, Si, Mn, P, S) input as actual operational data to ensure calculation accuracy. Δ H m , s t e e l is the latent heat of fusion of liquid steel, kWh/kg; c l , H M is the liquid specific heat capacity of liquid steel, kWh/(kg·°C); and T t a p is the tapping temperature, °C.
(2) Sensible Heat of Slag
E s l a g = m s l a g c s l a g ( T s l a g 25 )
where m s l a g is the slag mass per ton of steel, kg; c s l a g is the average heat capacity of slag, kWh/(kg·°C); and T s l a g is the slag temperature, °C, which is assumed equal to the tapping temperature.
(3) Off-gas Heat Loss
E g a s = V g ρ g C g ( T g 25 )
where V g is the off-gas discharge flow rate, m3/min; ρ g is the average density of off-gas, kg/m3; C g is the specific heat capacity of off-gas, kWh/(kg·°C); and T g is the off-gas temperature at the 4th hole discharge, °C.
(4) Cooling Water Heat Loss
E c w = i ρ w q w , i C w T o u t , i T i n , i
where ρ w is the cooling water density, kg/m3; q w , i , is the flow rate of the i-th water-cooled component, m3/min; C w is the specific heat capacity of cooling water, kWh/(kg·°C); and T o u t , i , T i n , i are the outlet and inlet cooling water temperatures of the i-th water-cooled component, °C.
(5) Other Heat Losses: (radiation, convection, electrode loss, endothermic reactions) are lumped as a residual term E o t h e r (kWh/t).

2.2.5. Energy Balance Equation and Energy Efficiency Index Calculation

Based on the above calculations, the complete energy balance equation is
E e l e c + E c h e m + E s e n s i b l e = E s t e e l + E s l a g + E g a s + E c w + E o t h e r
All items are converted into a uniform unit: kWh/t.
On the basis of the above balance, this study calculates the following indicators to evaluate the energy utilization performance of the electric arc furnace:
(1) Electric power consumption per ton of steel (specific electric energy consumption): E e l e c (kWh/t)
(2) Specific total energy consumption: total external energy input per ton of steel: E i n (kWh/t)
(3) Energy efficiency η E (%): ratio of useful energy to total input energy:
η E = E u s e f u l E i n × 100 % = E s t e e l E i n × 100 %

2.2.6. Model Application

The established energy balance model of the electric arc furnace is mainly applied to industrial energy efficiency analysis and multi-case simulation and optimization. Based on field production data, the model is used to quantitatively calculate the specific electric consumption, total energy consumption, energy efficiency and distribution of various energy losses, so as to identify the energy consumption characteristics under different operating conditions and provide data support for regularity analysis. By adjusting parameters such as hot metal ratio and scrap preheating temperature, multi-scenario simulations are carried out to obtain the electric consumption, total energy consumption, energy efficiency and energy structure distribution under each case. The influence laws of process parameters on EAF energy consumption and efficiency are revealed, which provides a theoretical basis for process optimization and energy saving.

2.3. Model Validation and Sensitivity Analysis

2.3.1. Model Validation

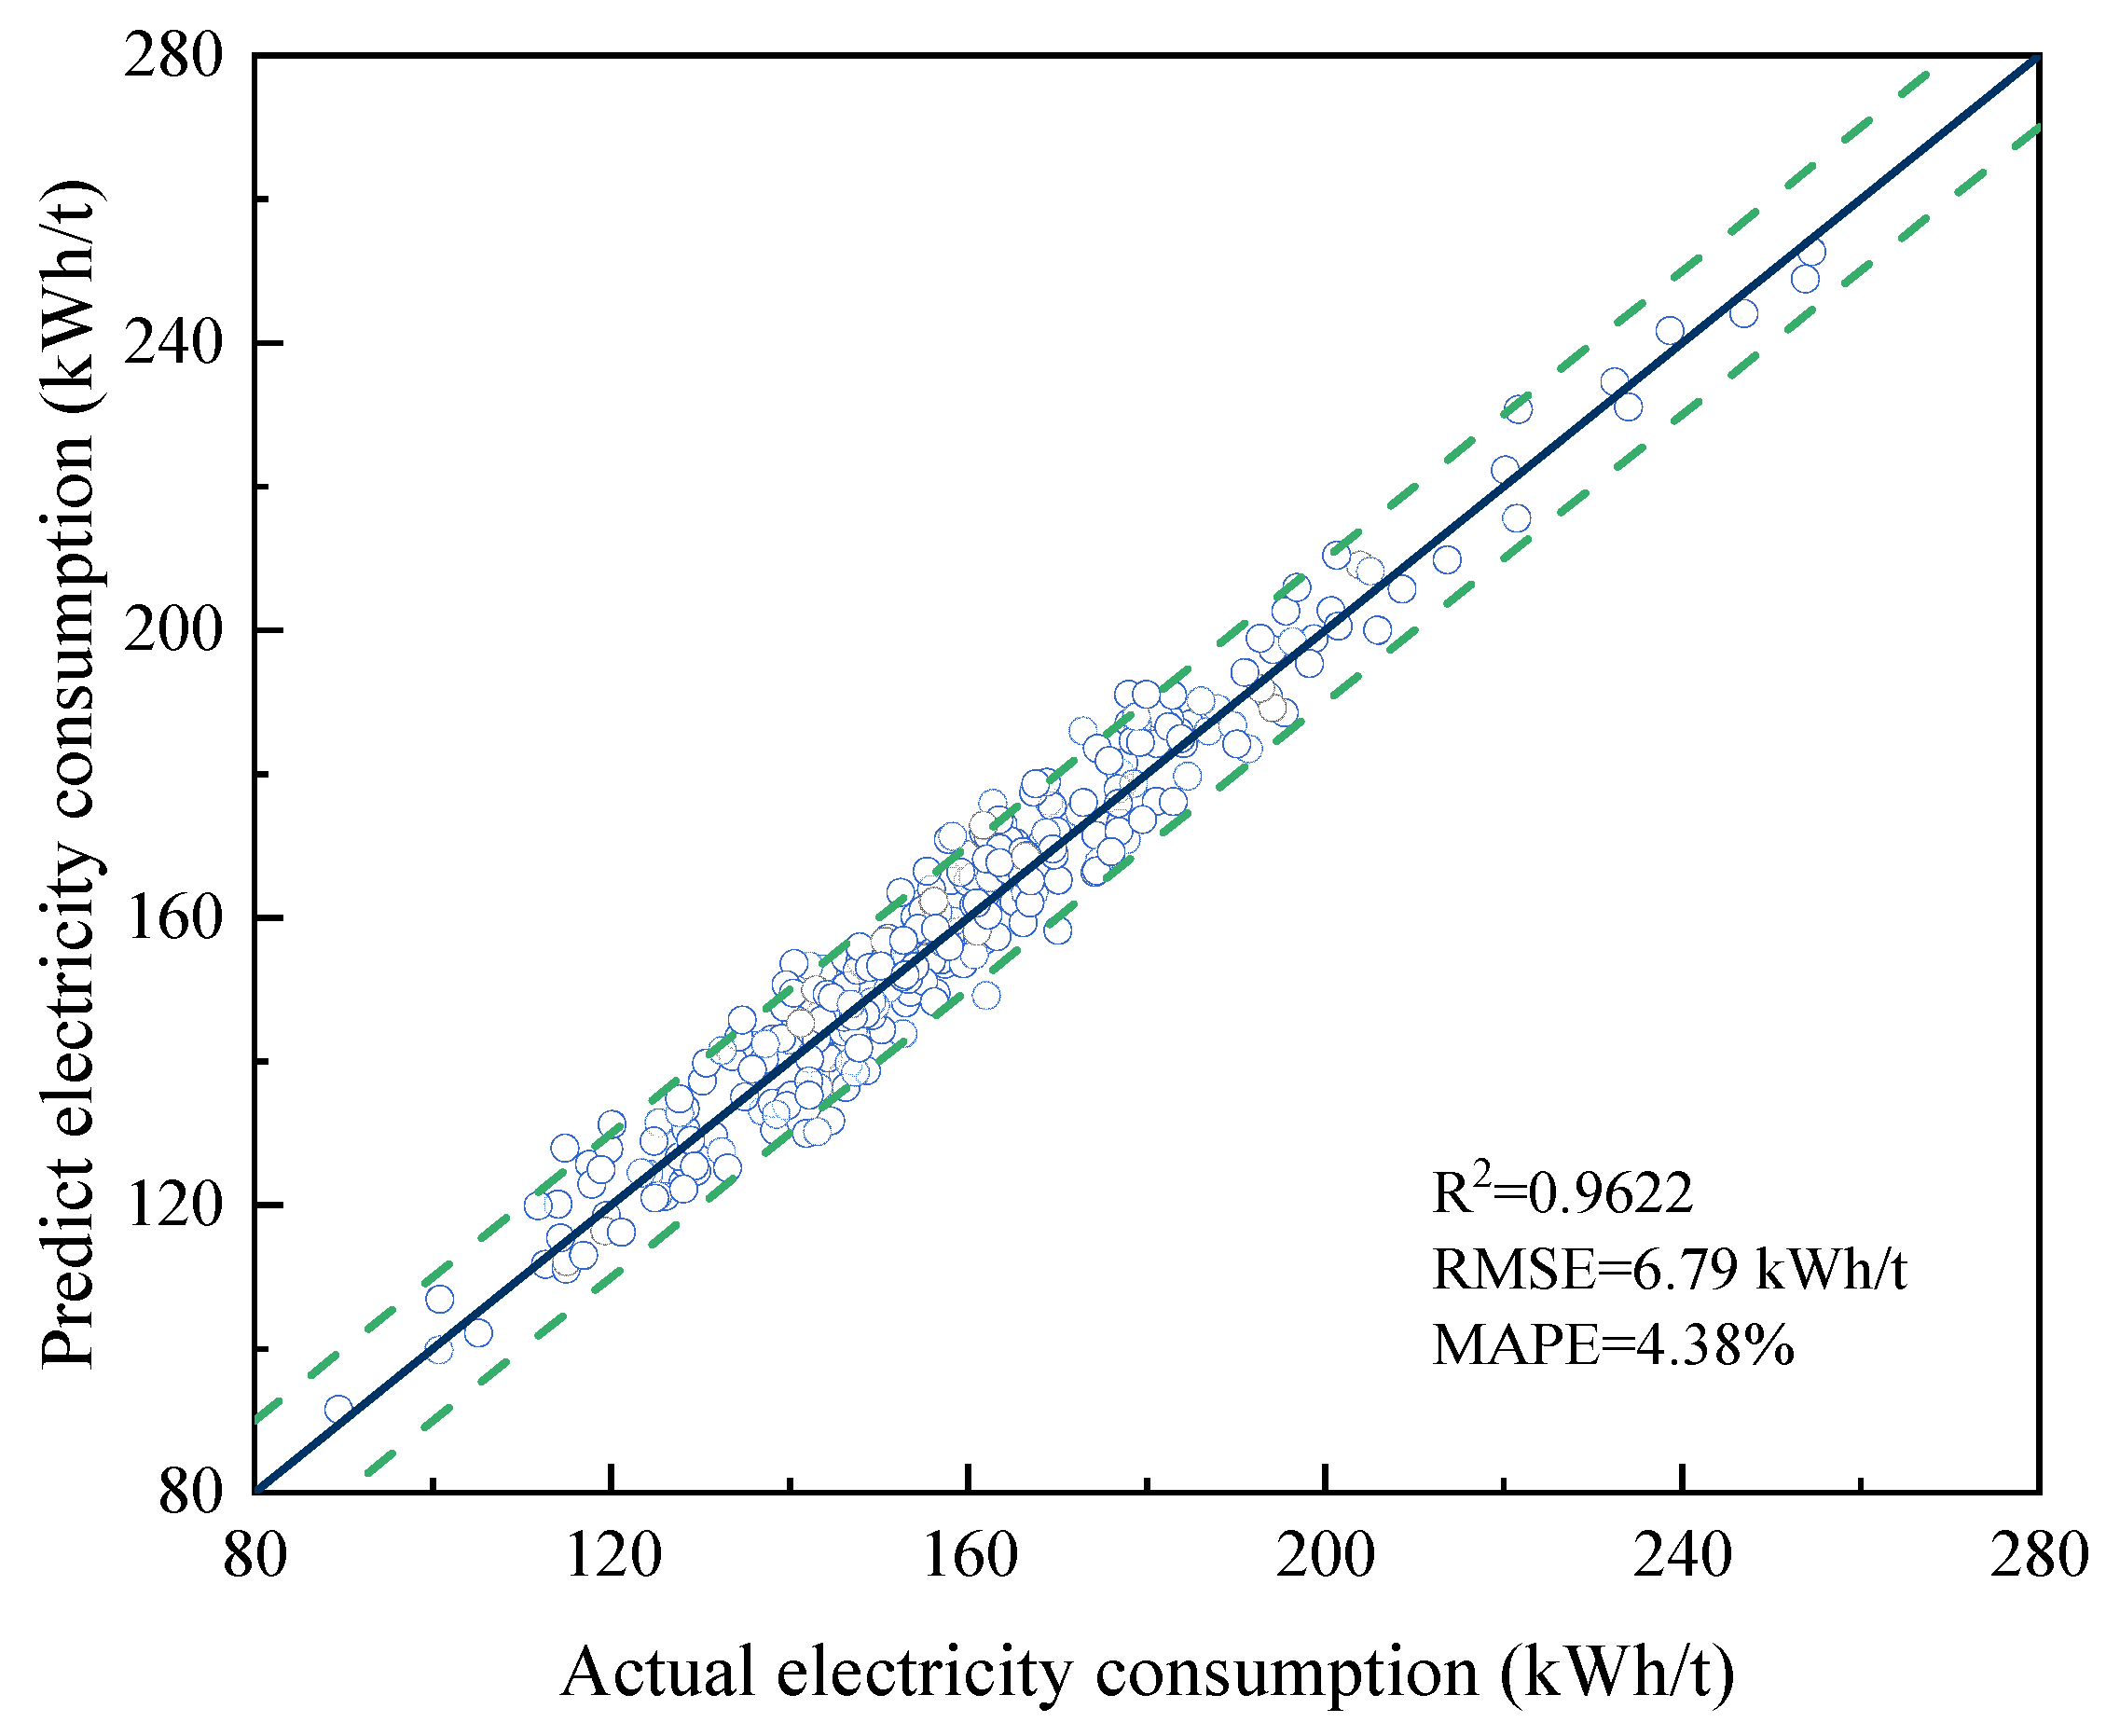
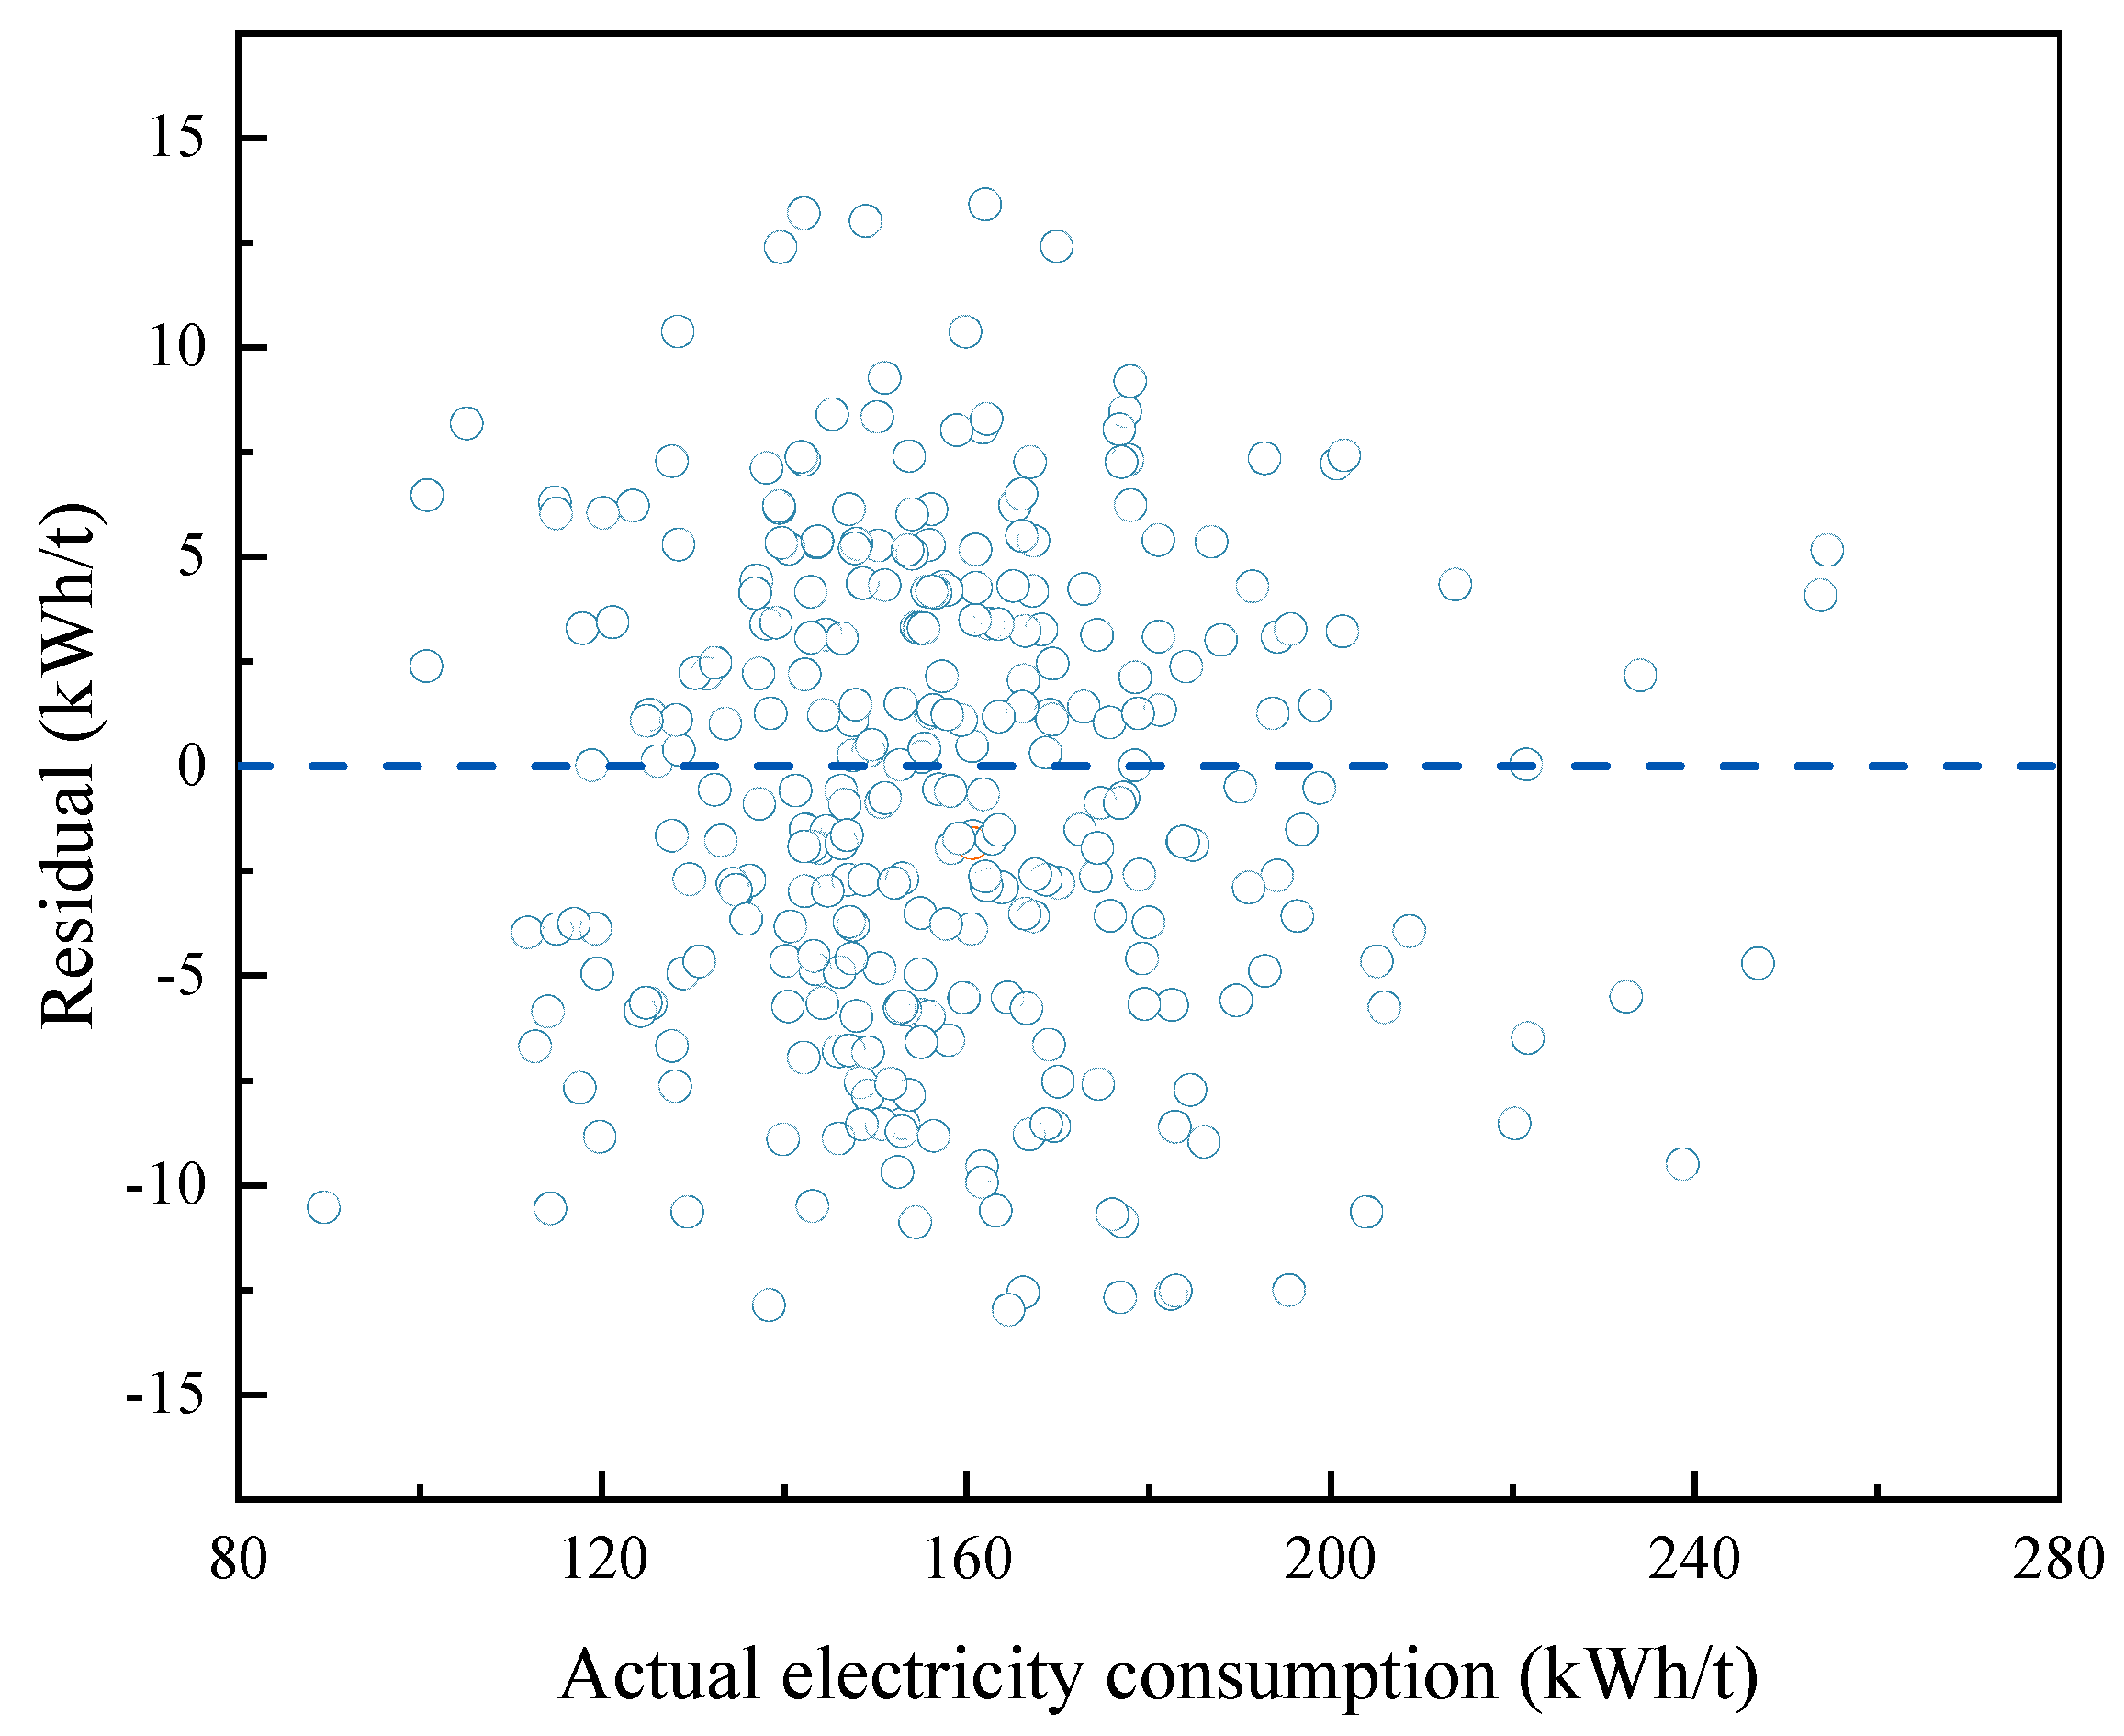
The model was validated using 300 consecutive heat data points from a representative electric arc furnace in the industrial survey. Actual operating parameters (hot metal ratio, pig iron ratio, scrap ratio, tapping temperature, etc.) of each heat were input into the model to calculate the theoretical electric consumption, which was then compared with the measured electric consumption. Measured inputs include actual power consumption, hot metal ratio, scrap composition, and flue gas temperature. Assumed parameters include heat loss coefficients, reaction efficiencies, and preheating heat transfer ratios, calibrated using industrial data. The validation results, including scatter diagram and residual analysis, are shown in Figure 2 and Figure 3.
The scatter diagram shows good alignment between predicted and measured values, with R2 = 0.9622, RMSE = 6.79 kWh/t, and MAPE = 4.38%. The model exhibits high explanatory power and low error, with most data points distributed within the error band of ±10 kWh/t (green dashed line). In the residual plot, residuals are randomly and uniformly distributed around zero without systematic deviation or heteroscedasticity, indicating stable prediction accuracy over the entire electric consumption range.
Both results demonstrate that the model has excellent prediction accuracy and reliability and can be used for subsequent process analysis and simulation.
Model validation is extended to three furnace types (conventional, Consteel, shaft furnace), with good agreement between simulated and measured electricity consumption, total energy consumption, and energy efficiency (error < 5%), confirming model transferability.

2.3.2. Sensitivity Analysis

A simple sensitivity analysis was conducted to assess the impact of key assumptions on model outputs. Three critical parameters were varied within reasonable industrial ranges: hot metal temperature (±50 °C), element oxidation ratios (±10%), and heat loss proportion (±5%). The results indicate that variations in these parameters lead to small changes in specific electricity consumption (±8–15 kWh/t) and total energy consumption (±12–18 kWh/t). These deviations are acceptable for industrial analysis, confirming that the model is robust and the main conclusions are not sensitive to reasonable parameter uncertainties.

3. Results and Discussion

3.1. Analysis of Industrial Data

3.1.1. Industrial Data—Overall Statistics

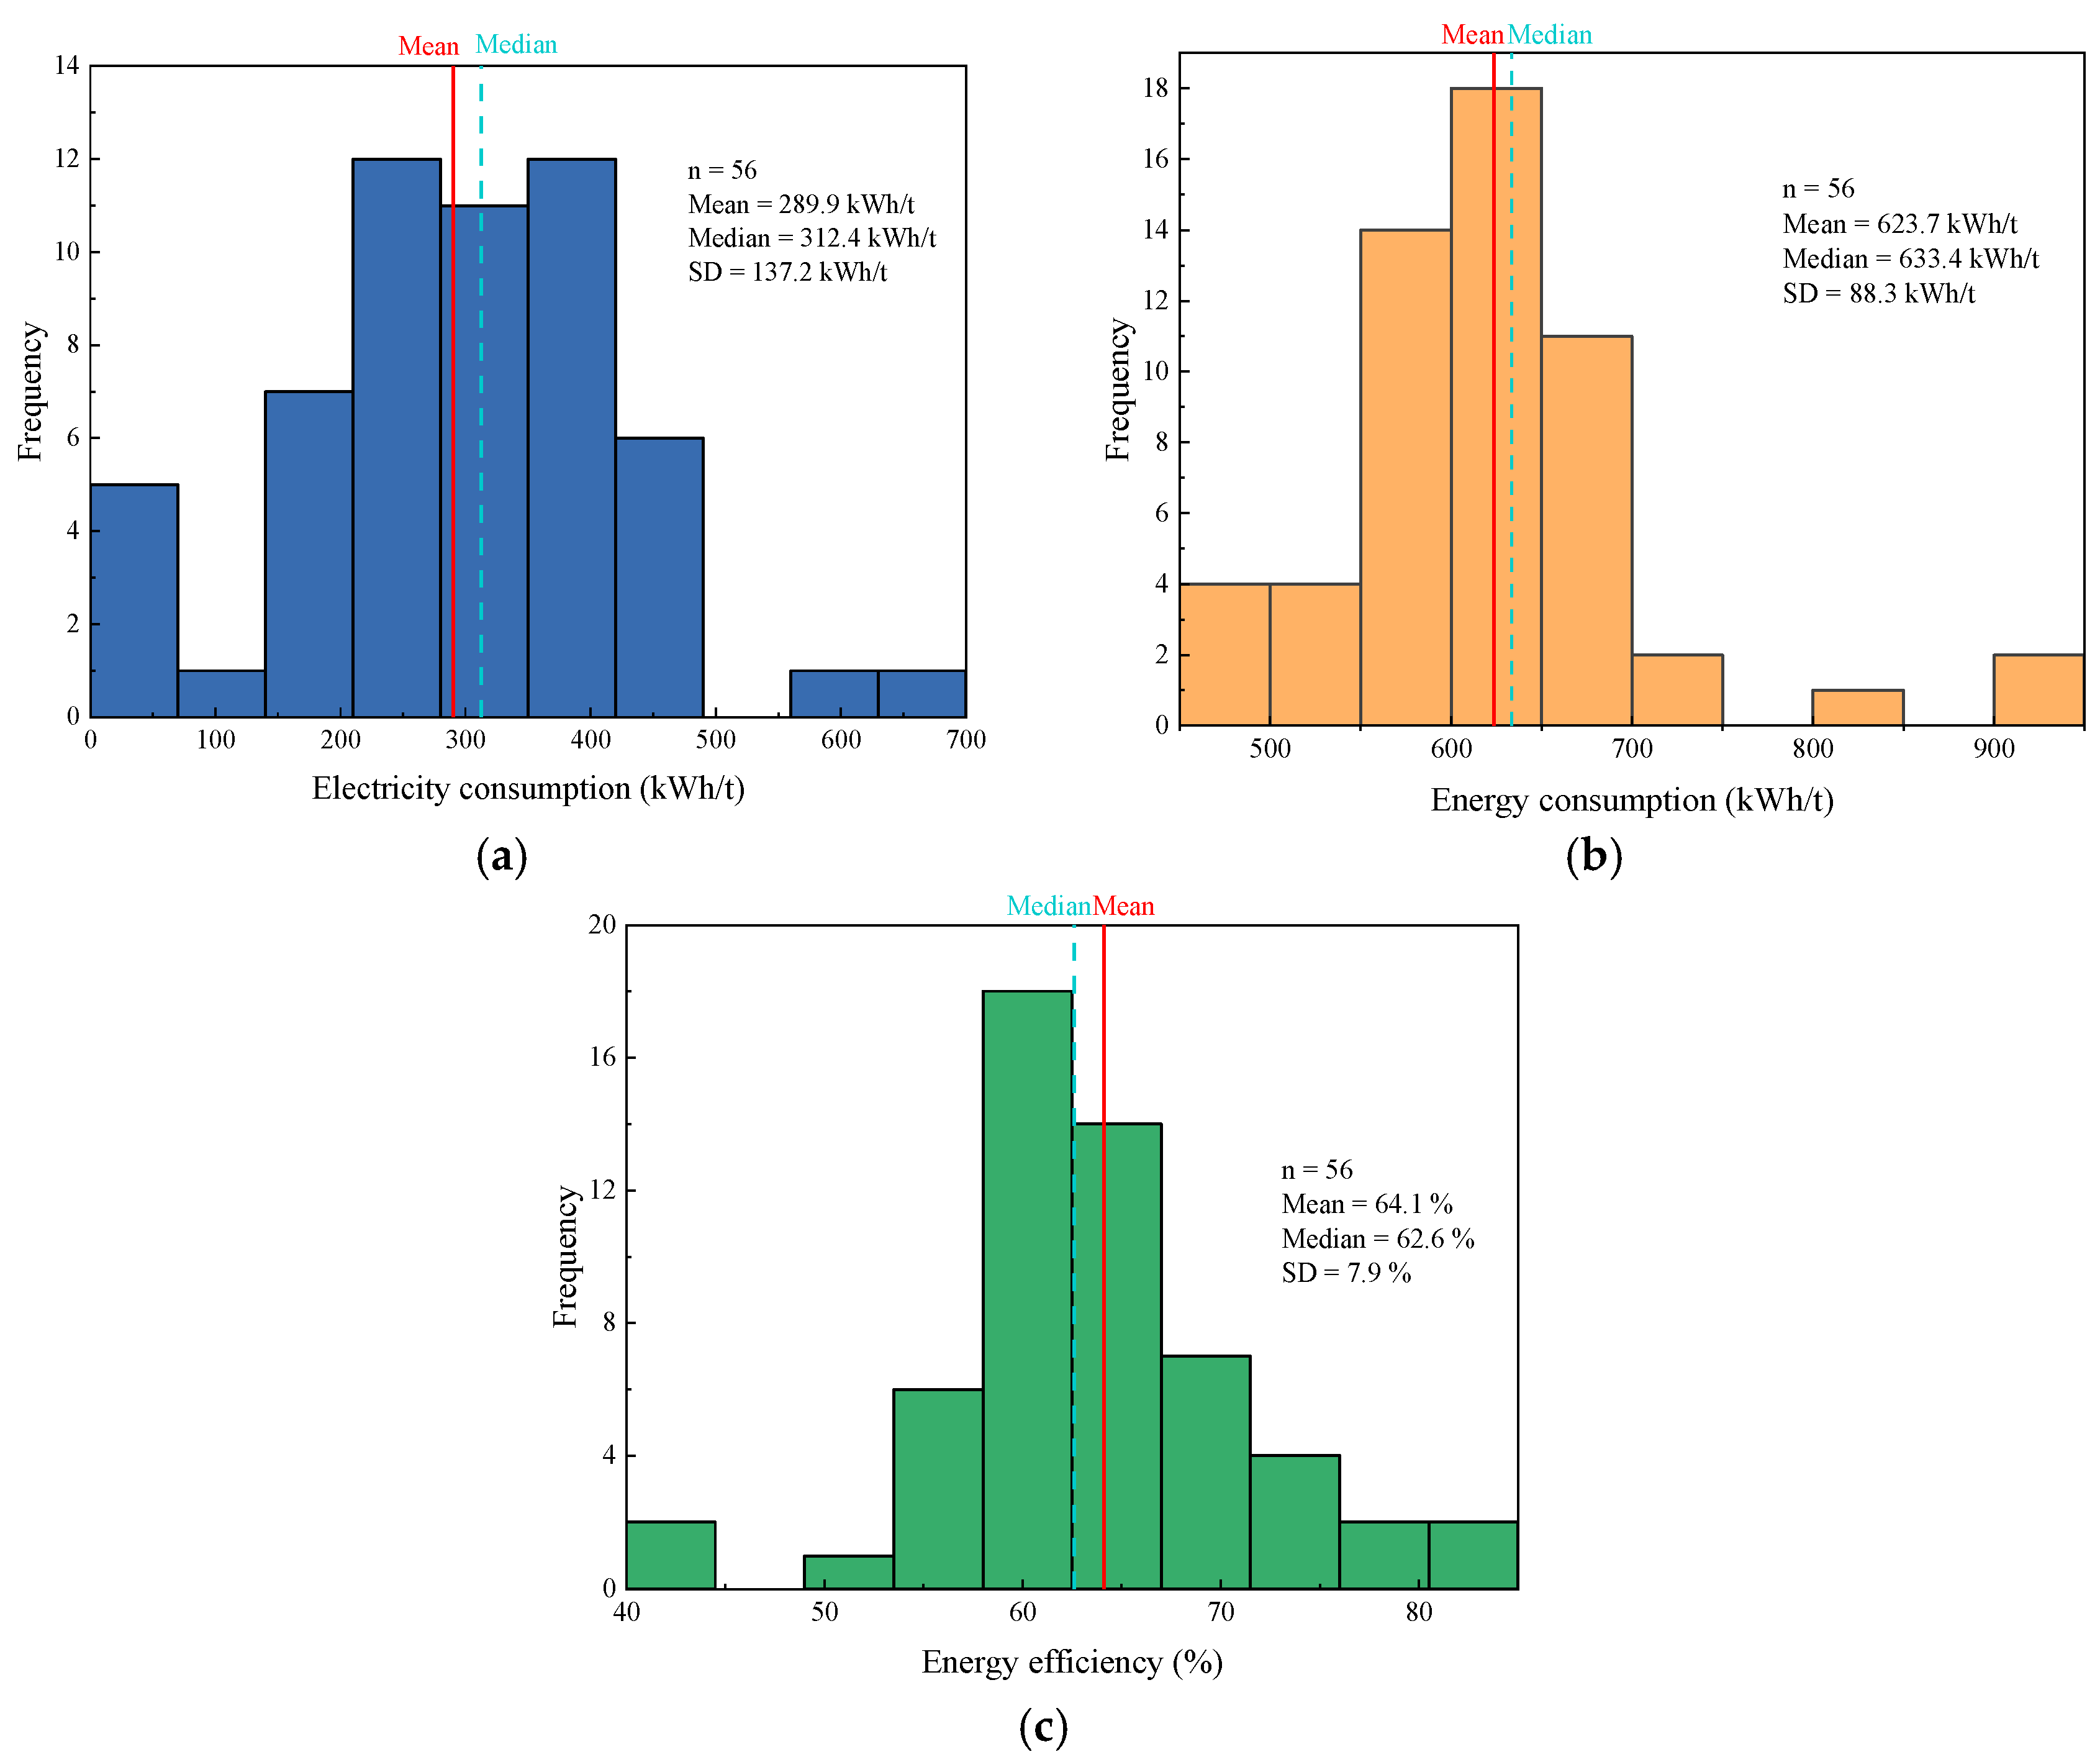
Based on the accuracy validation of the EAF energy balance model in Section 3.1, the actual operating indicators of 56 electric arc furnaces sourced from various regions across China from the survey were substituted into the validated model to calculate three core energy efficiency indicators: electric consumption, total energy consumption, and energy efficiency for each furnace, as illustrated in Figure 4. Without distinguishing furnace type, capacity, raw material structure, or process conditions, this section only conducts overall statistics and distribution analysis on all samples. Three groups of diagrams are used to systematically reveal the overall distribution and basic characteristics of the energy efficiency indicators of the surveyed EAFs.
Among the 56 surveyed EAFs, the distribution of electric consumption is shown in Figure 4a. The key statistical parameters are sample size n = 56, mean x ¯ = 289.9 kWh/t, median Me = 312.4 kWh/t, and standard deviation SD = 137.2 kWh/t. The electric consumption data exhibit an obvious left-skewed distribution, with the mean smaller than the median, indicating the existence of a large number of extremely low electric consumption samples (e.g., near-zero electricity consumption under ultra-high hot metal ratio), which lowers the overall mean. Therefore, the median of 312.4 kWh/t better represents the typical level of the 56 EAFs. The large standard deviation suggests significant differences among different furnaces, with ultra-low electricity consumption (0–100 kWh/t) and inefficient high-consumption furnaces (600–700 kWh/t). This indicates that EAF electric consumption is significantly affected by furnace type, raw material structure, and process level, and a large energy-saving potential exists in the industry.
The distribution of total energy consumption is presented in Figure 4b. The key statistical parameters are n = 56, x ¯ = 623.7 kWh/t, Me = 633.4 kWh/t, SD = 88.3 kWh/t. The mean and median are close, and the overall distribution approximates a normal distribution. Thus, the mean value of 623.7 kWh/t can represent the benchmark level of industrial total energy consumption. The standard deviation is noticeably smaller than that of electric consumption, implying better consistency in total energy consumption. The main reason is that total energy consumption is a comprehensive indicator involving multiple energy sources. Energy structures differ among EAFs: sensible and chemical heat from hot metal partially replaces electricity, and increased chemical energy reduces electric consumption, while total energy consumption changes slightly. Accordingly, most samples are concentrated in 550–700 kWh/t, except for a few inefficient furnaces at 800–900 kWh/t.
The distribution of energy efficiency is shown in Figure 4c. The key statistical parameters are n = 56, x ¯ = 64.1%, Me = 62.6%, SD = 7.9%. The data show a distinct right-skewed distribution, with the mean larger than the median, caused by several high-efficiency outliers that raise the average value. These samples are mainly EAFs equipped with scrap preheating devices, such as Consteel and shaft furnaces. Especially for shaft furnaces, the physical heat of preheated scrap is not counted as external energy input in the model, so scrap preheating greatly improves energy efficiency and elevates the mean. Regarding dispersion, energy efficiency is mainly concentrated around 60–70%, but low-efficiency furnaces (40–50%) and high-efficiency benchmark furnaces (over 80%) also exist. This shows that the overall energy efficiency of the EAF industry is above 60%, while some low-efficiency furnaces are in urgent need of performance improvement.

3.1.2. Industrial Data—Furnace Type

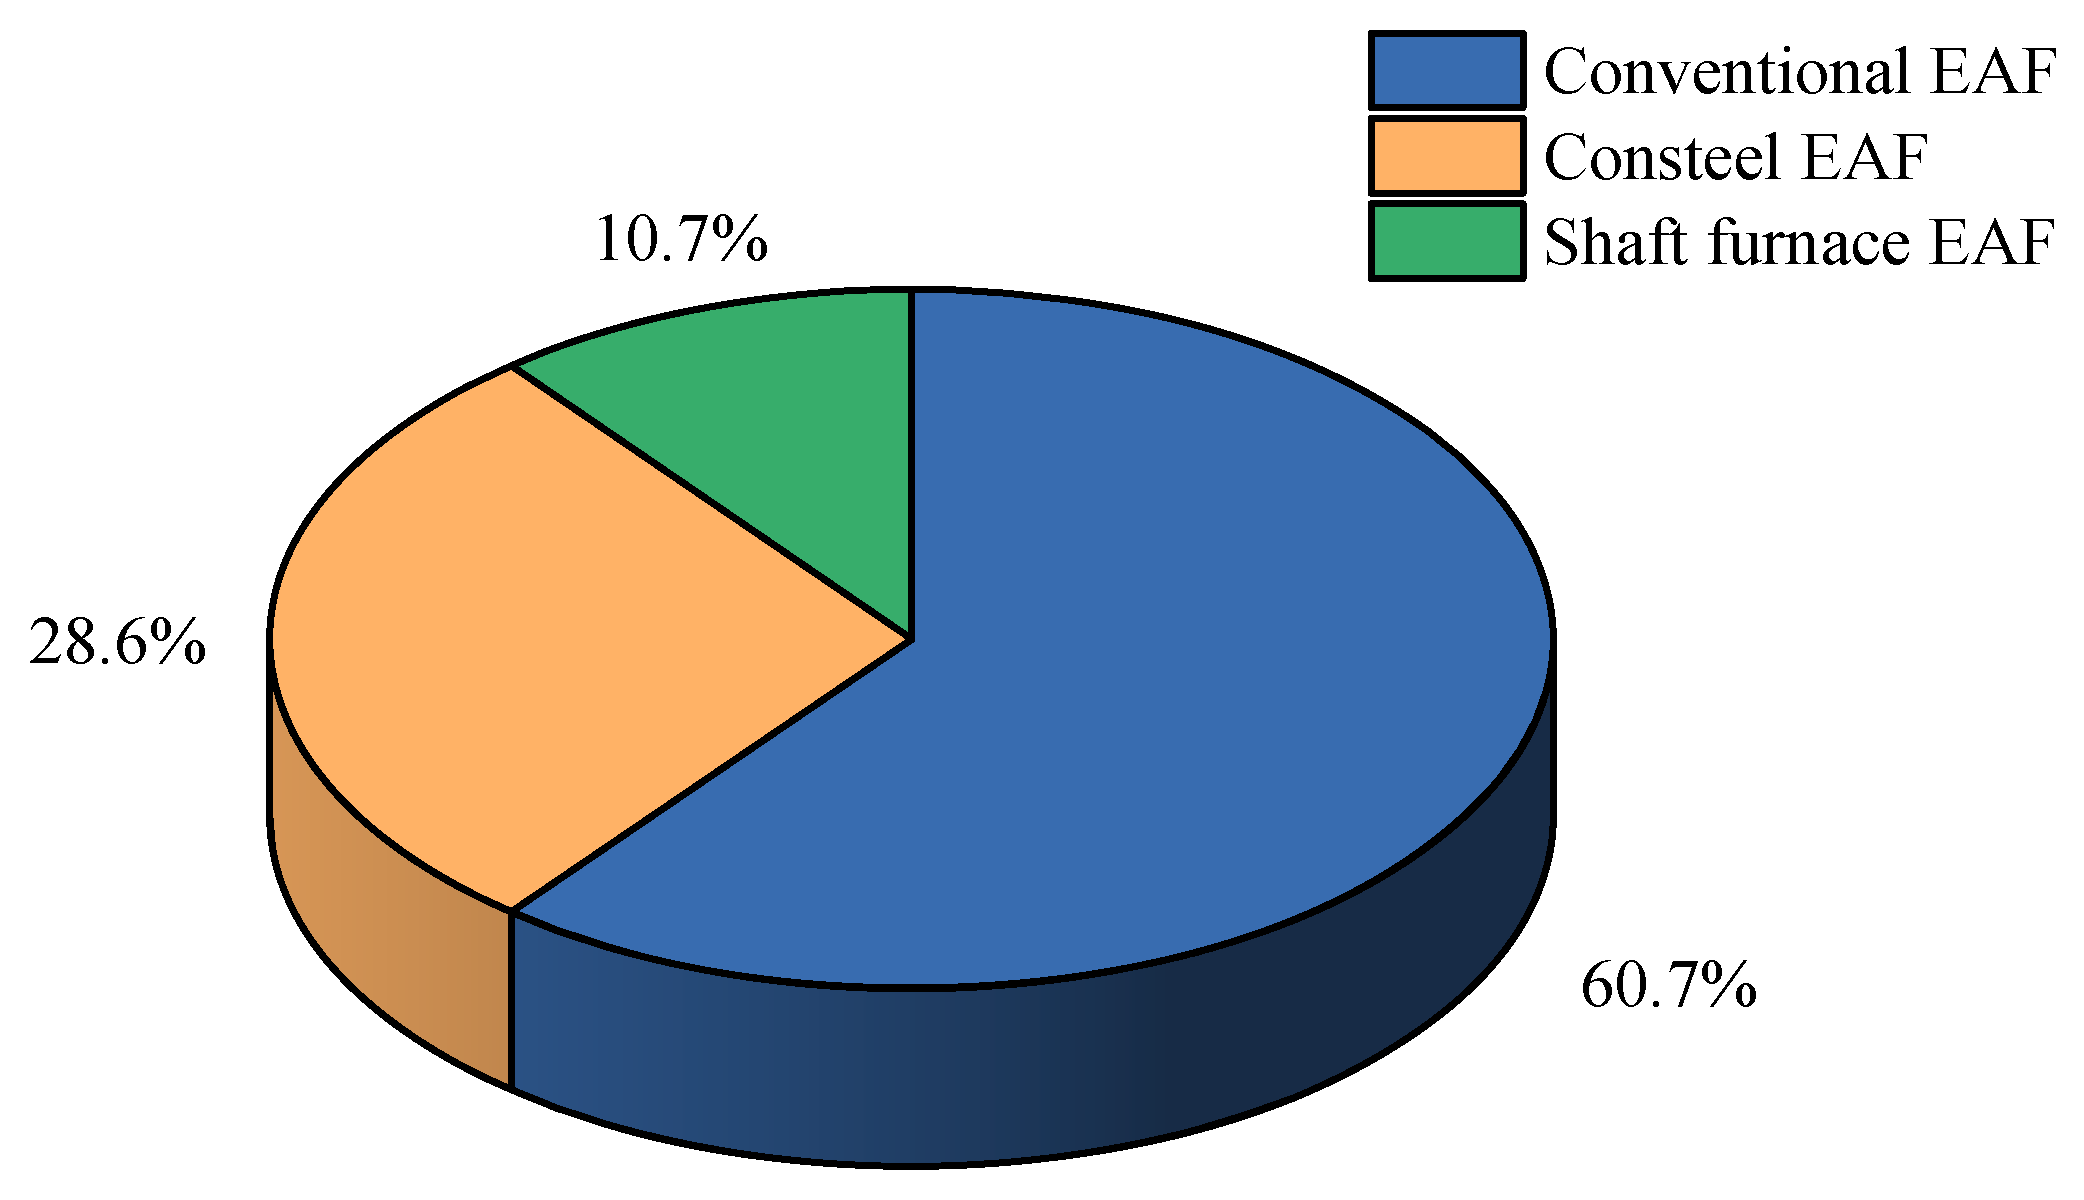
Before comparing the energy efficiency under different furnace types and capacities, the furnace types of the 56 surveyed EAFs were classified to clarify their representativeness and distribution characteristics. According to the survey data, the 56 EAFs were divided into three categories: conventional EAF, Consteel EAF, and shaft furnace EAF. The statistics are listed in Table 1.
As shown in Figure 5, Conventional EAF accounts for the largest proportion (60.7%), representing the mainstream EAF type in China. Consteel EAF accounts for 28.6% and is being increasingly applied in China, as many newly built EAFs adopt the Consteel configuration. The shaft furnace EAF has the lowest proportion (10.7%), which is consistent with the actual distribution in China. Although this type exhibits outstanding energy-saving performance, its application is limited due to high investment and complex equipment, and most shaft furnaces are imported.
On the basis of the overall energy efficiency analysis of all samples in Section 3.1.1, this section presents a detailed comparison of energy efficiency characteristics among different furnace types and capacities. It should be noted that as the mainstream furnace type, conventional EAFs exhibit significant differences in raw material structure: some use 100% scrap, while others adopt the scrap–hot metal charging process. The energy input structure and consumption level differ essentially between the two routes. Therefore, for energy efficiency analysis, conventional EAFs are further divided into two subgroups: conventional EAF with 100% scrap and conventional EAF with hot metal charging. Together with Consteel EAF and shaft furnace EAF, four furnace types are compared to accurately reveal the energy efficiency differences under different process routes. (Figure 5)
Notably, abnormal samples were excluded before the furnace-type energy efficiency analysis. Three heats with excessively high pig iron ratio (25–60%) were removed from the 100% scrap conventional EAF group; three heats with hot metal ratio ≥ 50% were eliminated from the Consteel EAF group; and one heat with hot metal addition was excluded from the shaft furnace EAF group. The final effective sample size was 49 heats. These abnormal samples were inconsistent with other furnaces in the same group, and their quantity was insufficient for independent factor analysis with a statistically significant gradient distribution. To ensure the reliability of the analysis, the above samples were excluded.
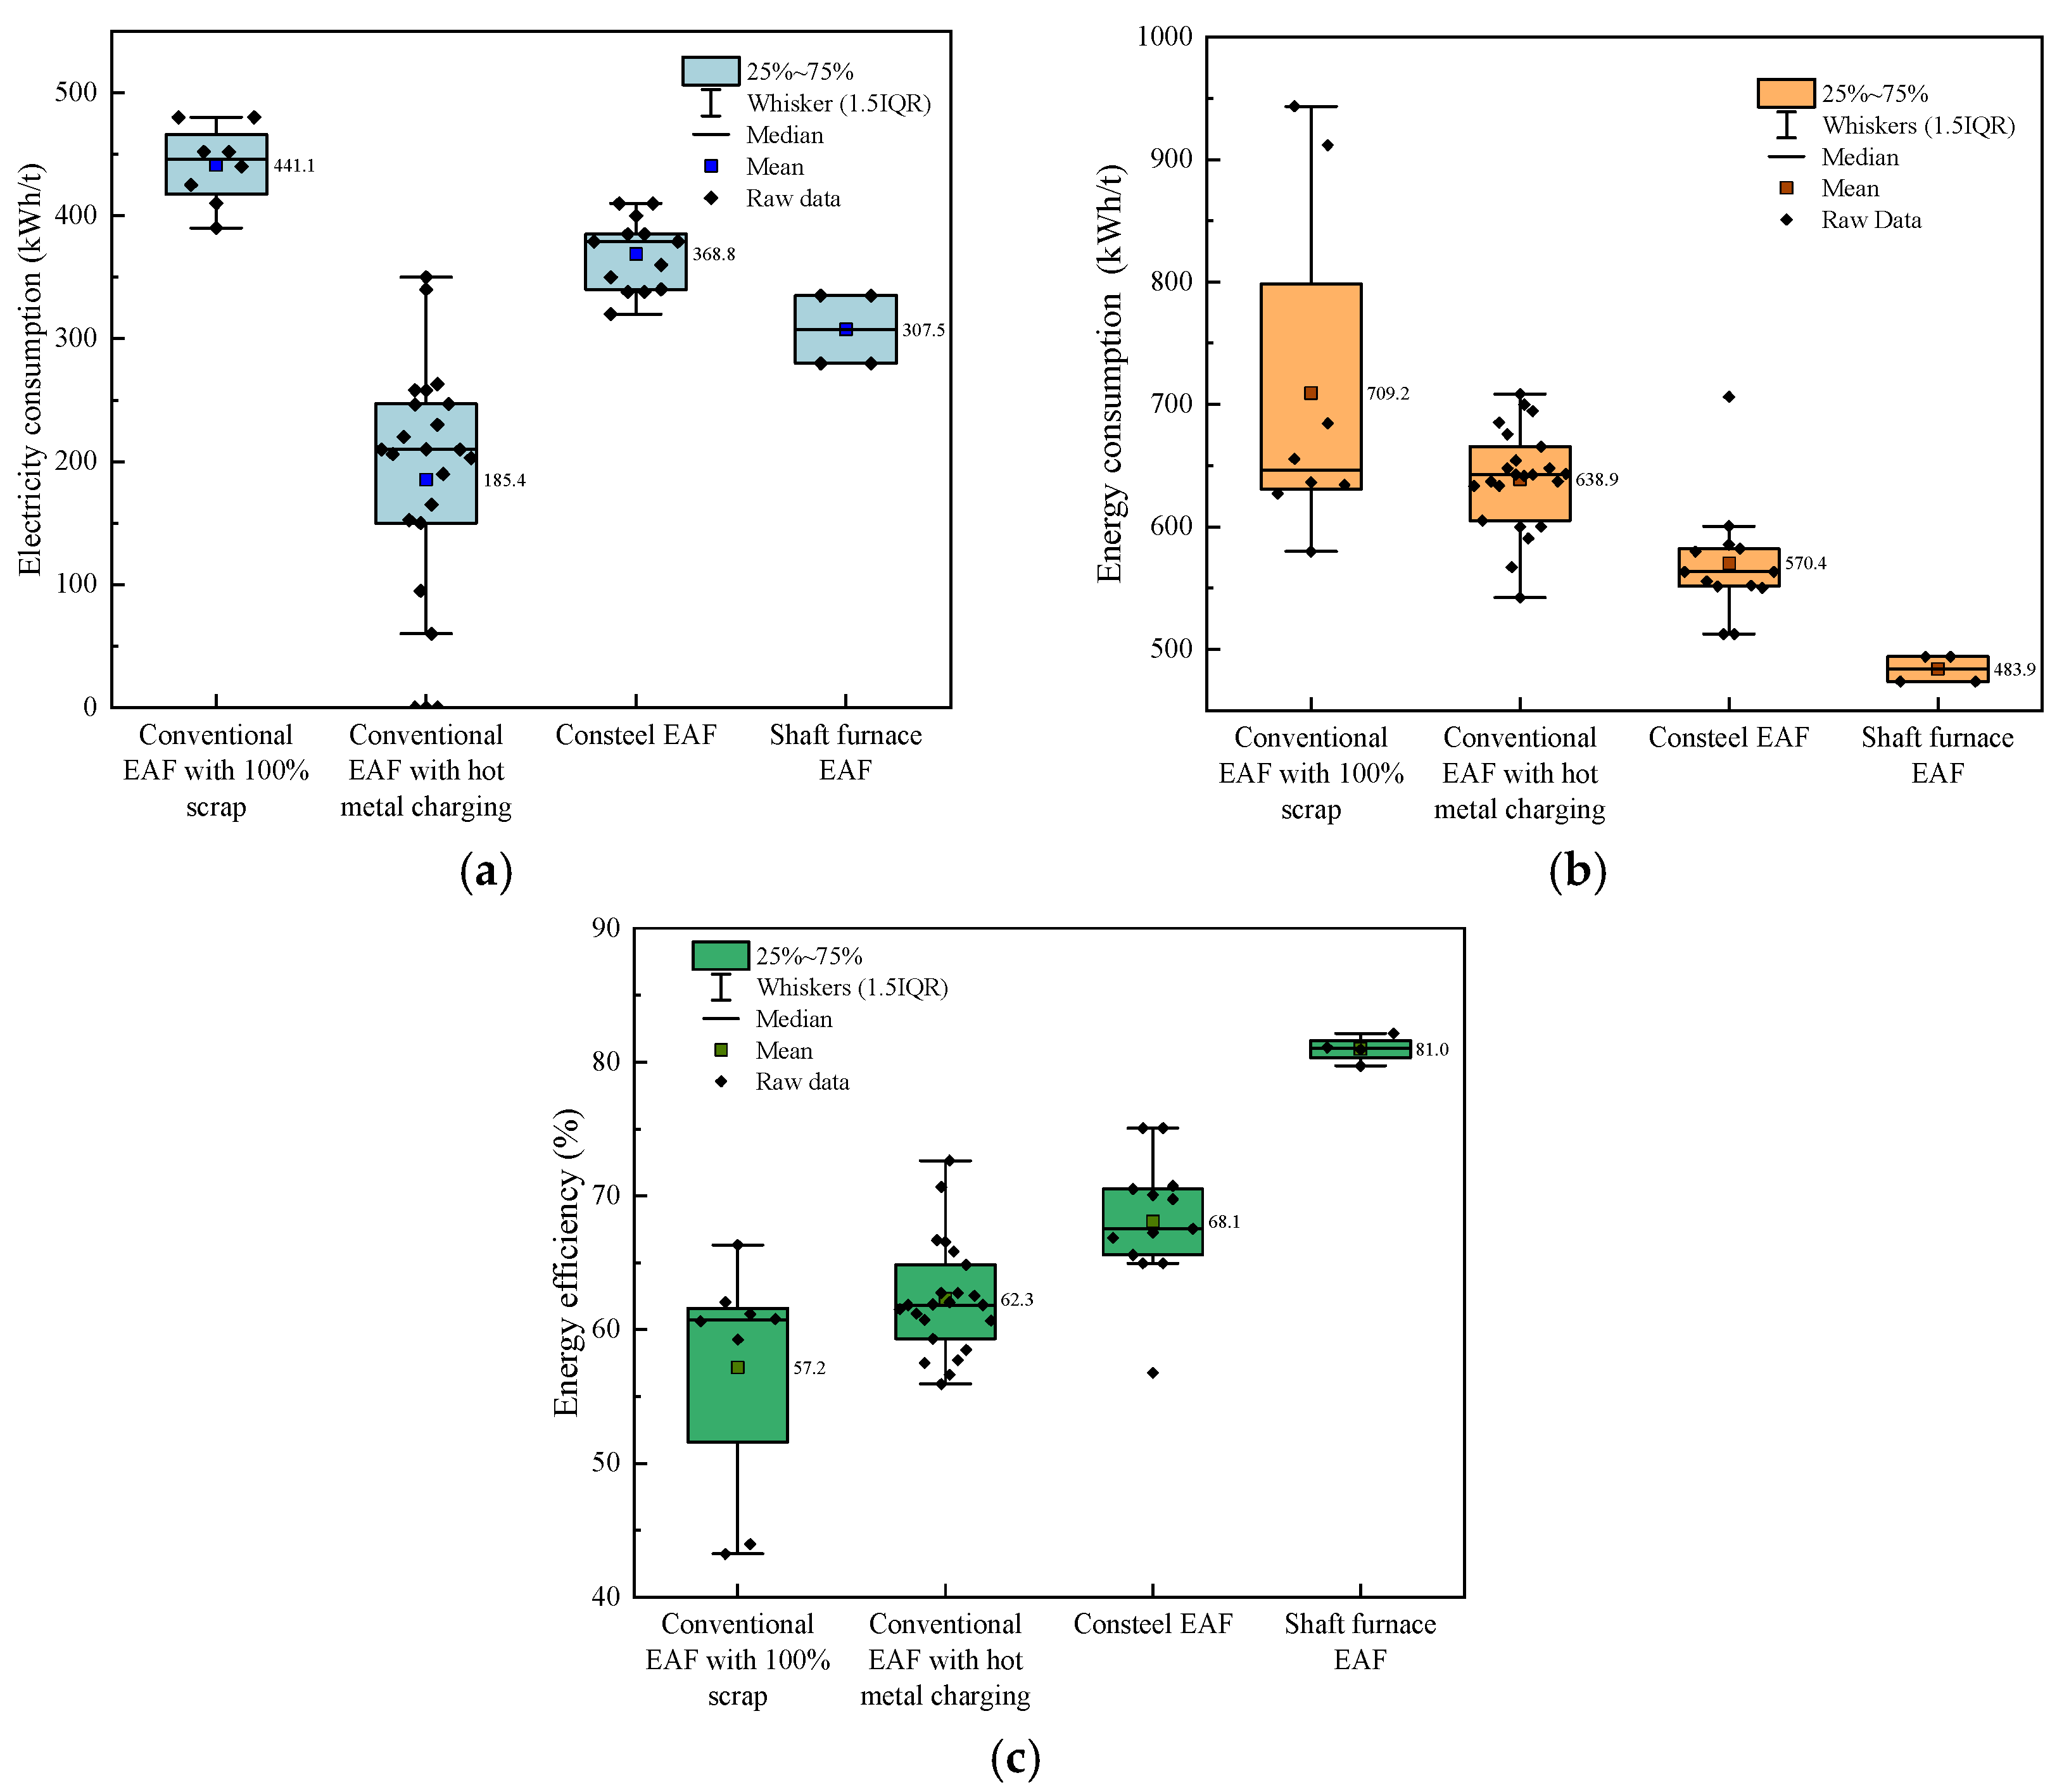
Figure 6a shows the boxplot (with raw data points) of specific electric energy consumption for different EAF types. The near-zero kWh/t data points in the hot metal charging conventional EAF group correspond to ultra-high hot metal ratio conditions (>70%). In such cases, the sensible and chemical heat of hot metal can largely replace electric energy, and the extremely low power consumption is verified as a reasonable process result through simulation, thus retained without being excluded as outliers. One-way ANOVA was performed with furnace type as the factor to investigate its effect on specific electric consumption. The results show that furnace type has an extremely significant effect on specific electric consumption (F = 33.48, p < 0.001). As shown in the figure, the means of specific electric consumption of the four groups are 441.1 kWh/t for 100% scrap conventional EAF, 185.4 kWh/t for hot metal charging conventional EAF, 368.8 kWh/t for Consteel EAF, and 308 kWh/t for shaft furnace EAF, with significant differences among all groups. Among them, 100% scrap conventional EAF has the highest power consumption (441.1 kWh/t), while hot metal charging conventional EAF has a mean power consumption of only 185.4 kWh/t due to the large substitution of hot metal heat, which is significantly lower than other types. However, the dataset shows high dispersion, indicating insufficient process stability. Under different hot metal charging ratios, the power consumption distribution varies greatly due to process differences, and even some heats with ultra-high hot metal ratio (>70%) achieve near-zero power consumption, completing smelting without external power supply. Consteel and shaft furnace EAFs achieve significant power consumption reduction through scrap preheating, verifying the key role of furnace structure optimization in EAF energy saving. The power consumption distribution of these two preheating processes has low dispersion, indicating stable energy-saving effects.
Figure 6b presents the boxplot (with raw data points) of specific total energy consumption for different EAF types. Extremely significant differences exist in energy consumption levels among different processes (F = 13.08, p < 0.001). The average energy consumption of 100% scrap conventional EAF is the highest at 709.15 kWh/t; that of hot metal charging conventional EAF and Consteel EAF decreases to 638.93 kWh/t and 570.42 kWh/t, respectively; and shaft furnace EAF has the lowest average energy consumption of only 483.95 kWh/t with the smallest data dispersion and the most stable energy-saving effect. The 100% scrap conventional EAF has the highest and most fluctuating energy consumption due to small residual steel and a large amount of cold charge. Hot metal charging EAF shows a certain advantage in total energy consumption over 100% scrap conventional EAF, with higher stability, but the energy-saving amplitude is far lower than the power consumption reduction in the previous section. This result indicates that hot metal charging only realizes in-process energy substitution without fundamentally reducing the comprehensive energy input, leading to a limited energy consumption decrease. Technologies such as continuous charging and shaft furnace preheating recover flue gas energy through scrap preheating, increase the charge temperature, and optimize the smelting rhythm, achieving significant energy-saving effects. Among them, shaft furnace preheating has the greatest energy-saving potential and can greatly reduce energy consumption fluctuation, making it one of the optimal energy-saving processes for short-process EAF steelmaking.
Figure 6c displays the boxplot (with raw data points) of energy efficiency for different EAF types. One-way ANOVA results show extremely significant differences in energy efficiency levels among different processes (F = 22.32, p < 0.001). The 100% scrap conventional EAF has the lowest average energy efficiency of 57.18% with the largest data dispersion due to large process differences; the average energy efficiency of hot metal charging conventional EAF and Consteel EAF increases to 62.29% and 68.09%, respectively; and shaft furnace EAF achieves the highest average energy efficiency of 80.98% with the smallest data dispersion and optimal energy efficiency stability.

3.1.3. Industrial Data—Furnace Capacity

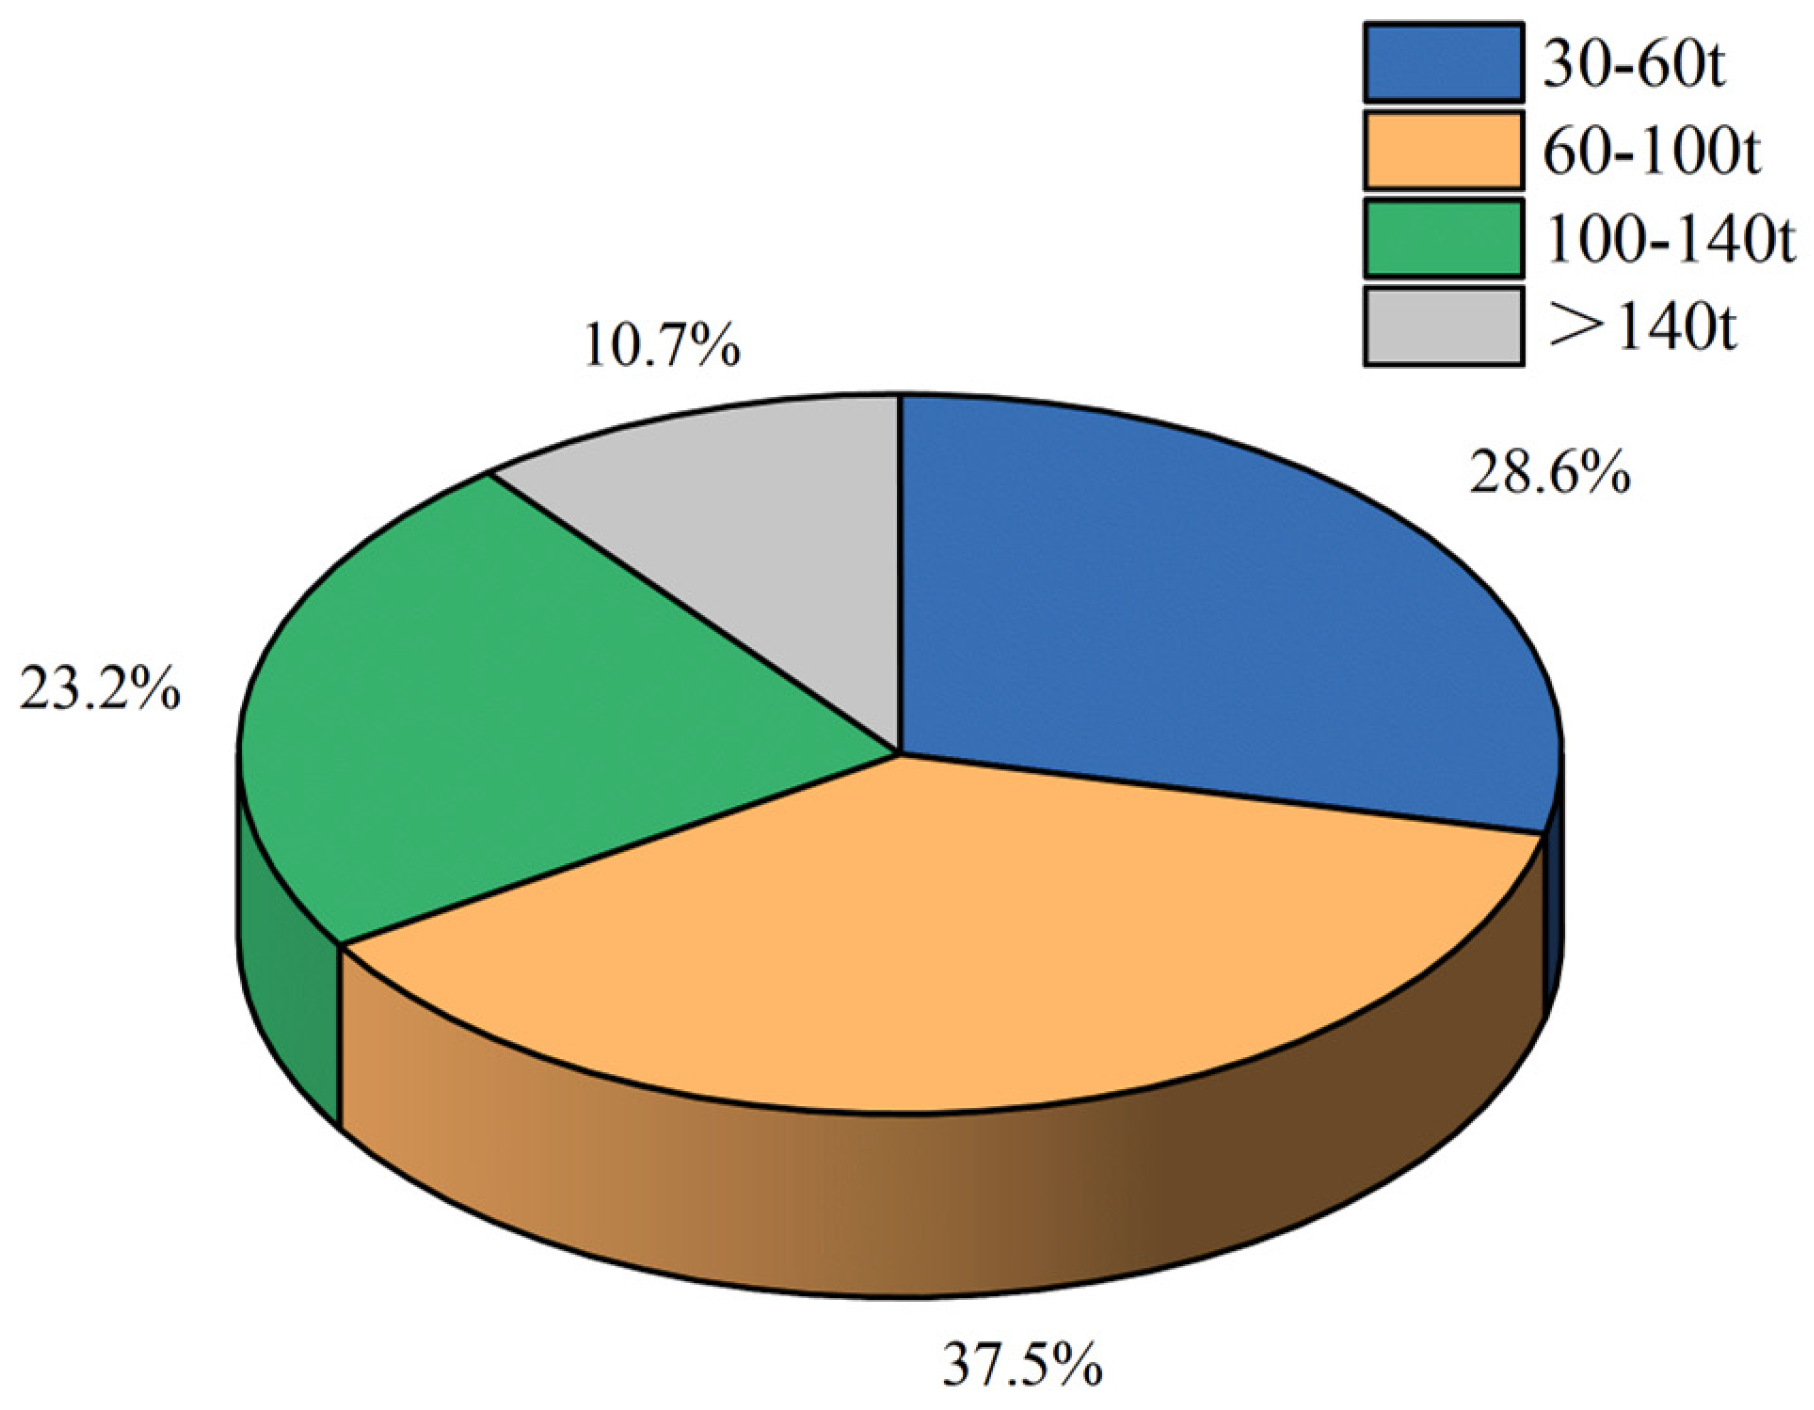
As shown in Figure 7, the furnace capacity of the 56 investigated EAFs ranges from 30 t to 150 t. The overall distribution presents a typical industrial structure dominated by small and medium-sized furnaces with a low proportion of large-capacity furnaces.
Furnaces with a capacity of 60–100 t represent the mainstream grade in China, accounting for the highest proportion of 37.5% (about 21 furnaces). Small and medium-sized furnaces of 30–60 t rank second with 28.6% (about 16 furnaces), indicating that small and medium-scale EAFs still maintain a large stock in the market. The proportion of medium-to-large furnaces of 100–140 t is 23.2% (about 13 furnaces). Large and extra-large furnaces above 140 t account for the lowest proportion (only 10.7%, about 6 furnaces), suggesting that the popularization of large and extra-large EAFs in China still has considerable room for improvement.
In this section, the energy efficiency of electric arc furnaces (EAFs) with different furnace volumes is analyzed based on the samples. All valid industrial heat data are retained, including those with fluctuating operating conditions such as hot metal charging, without further classification by raw material conditions. Only furnace type is adopted as the criterion for data grouping. The conclusions reflect the overall influence of furnace volume on specific power consumption under actual industrial production conditions, which can provide a theoretical basis for EAF type selection, capacity expansion and energy saving. Statistical analysis of power consumption, energy consumption and energy efficiency of all samples is shown in Figure 8.
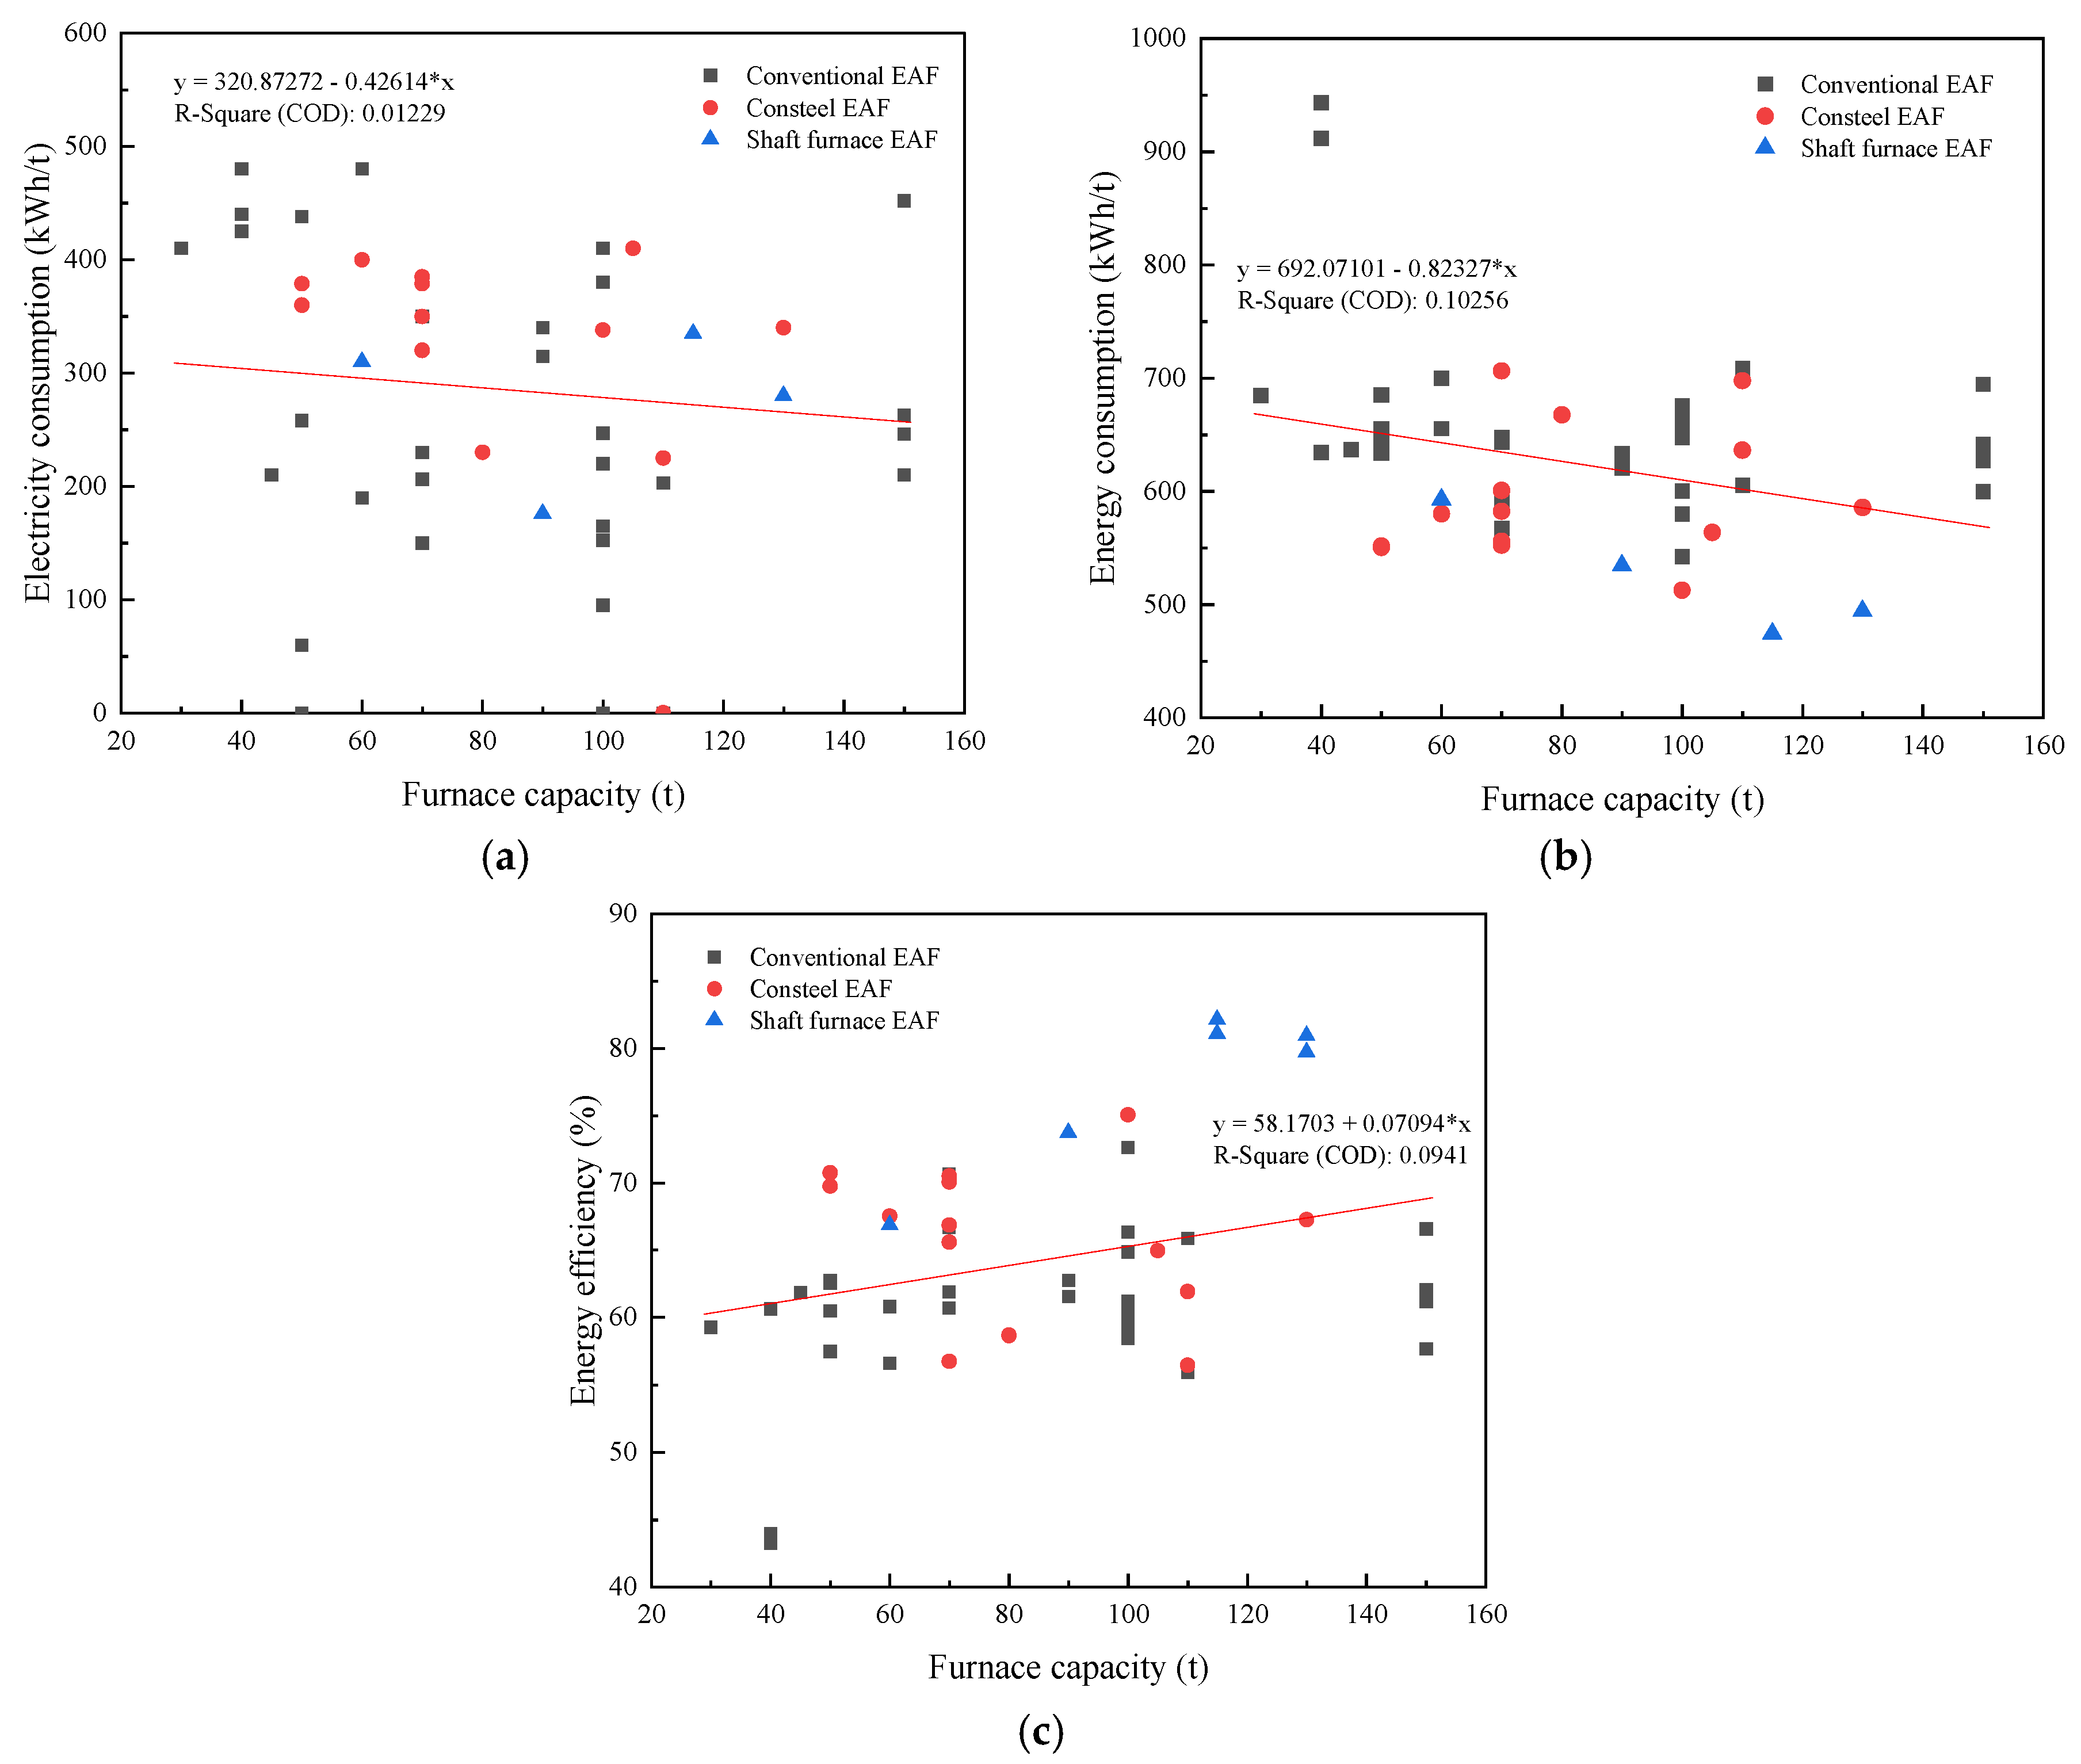
Figure 8a shows the scatter distribution and global linear fitting of specific power consumption for EAFs with different furnace capacities. Different symbols denote three furnace types, and the red solid line represents the overall fitting result to reflect the influence of furnace capacity. Obvious hierarchical differences are observed: shaft furnace EAF presents the lowest power consumption (170–340 kWh/t), followed by Consteel EAF (0–410 kWh/t), while conventional EAF shows the highest and most dispersed power consumption (0–480 kWh/t). This indicates that furnace type is the dominant factor affecting specific power consumption, consistent with previous conclusions. The global fitting reveals that specific power consumption decreases linearly with increasing furnace capacity under full furnace types and operating conditions, with the equation y = 320.87272 − 0.42614x. Each 10 t increase in furnace capacity reduces specific power consumption by approximately 4.26 kWh/t, showing a notable negative scale effect. However, the low coefficient of determination R2 = 0.01229 indicates weak linear correlation, mainly because the process difference between furnace types exerts a far greater impact than the scale effect of furnace capacity.
Figure 8b illustrates the scatter distribution and fitting curve of total energy consumption versus furnace capacity. The total energy consumption also exhibits a hierarchical order: shaft furnace EAF is the lowest (470–600 kWh/t), Consteel EAF is moderate (510–710 kWh/t), and conventional EAF is the highest with the largest fluctuation (580–950 kWh/t). The fitting equation is y = 692.07101 − 0.82327x, and each 10 t rise in furnace capacity reduces total energy consumption by about 8.23 kWh/t, confirming the negative scale effect. With R2 = 0.10256, the linear correlation is weak, suggesting that total energy consumption is still dominated by furnace type processes.
Figure 8c presents the scatter distribution and global fitting of energy efficiency for EAFs with different furnace capacities. Energy efficiency differs significantly among three furnace types: shaft furnace EAF is the highest (74–82%), Consteel EAF is intermediate (56–75%), and conventional EAF is the lowest with the largest dispersion (43–73%). The fitting equation is y = 58.1703 + 0.07094x, and each 10 t increase in furnace capacity improves energy efficiency by approximately 0.71%, showing a positive scale effect. The low R2 = 0.0941 indicates weak linear correlation, further verifying that furnace type processes play a leading role in energy efficiency, which is consistent with previous conclusions.

3.1.4. Industrial Data—Hot Metal Ratio

To eliminate the interference of process differences among furnace types and accurately reveal the influence of raw material structure on the energy efficiency of electric arc furnaces, this section only analyzes samples of conventional electric arc furnaces. The overall distribution of hot metal ratio in the samples is first clarified, followed by a systematic investigation into the correlation between hot metal ratio and energy efficiency indicators.
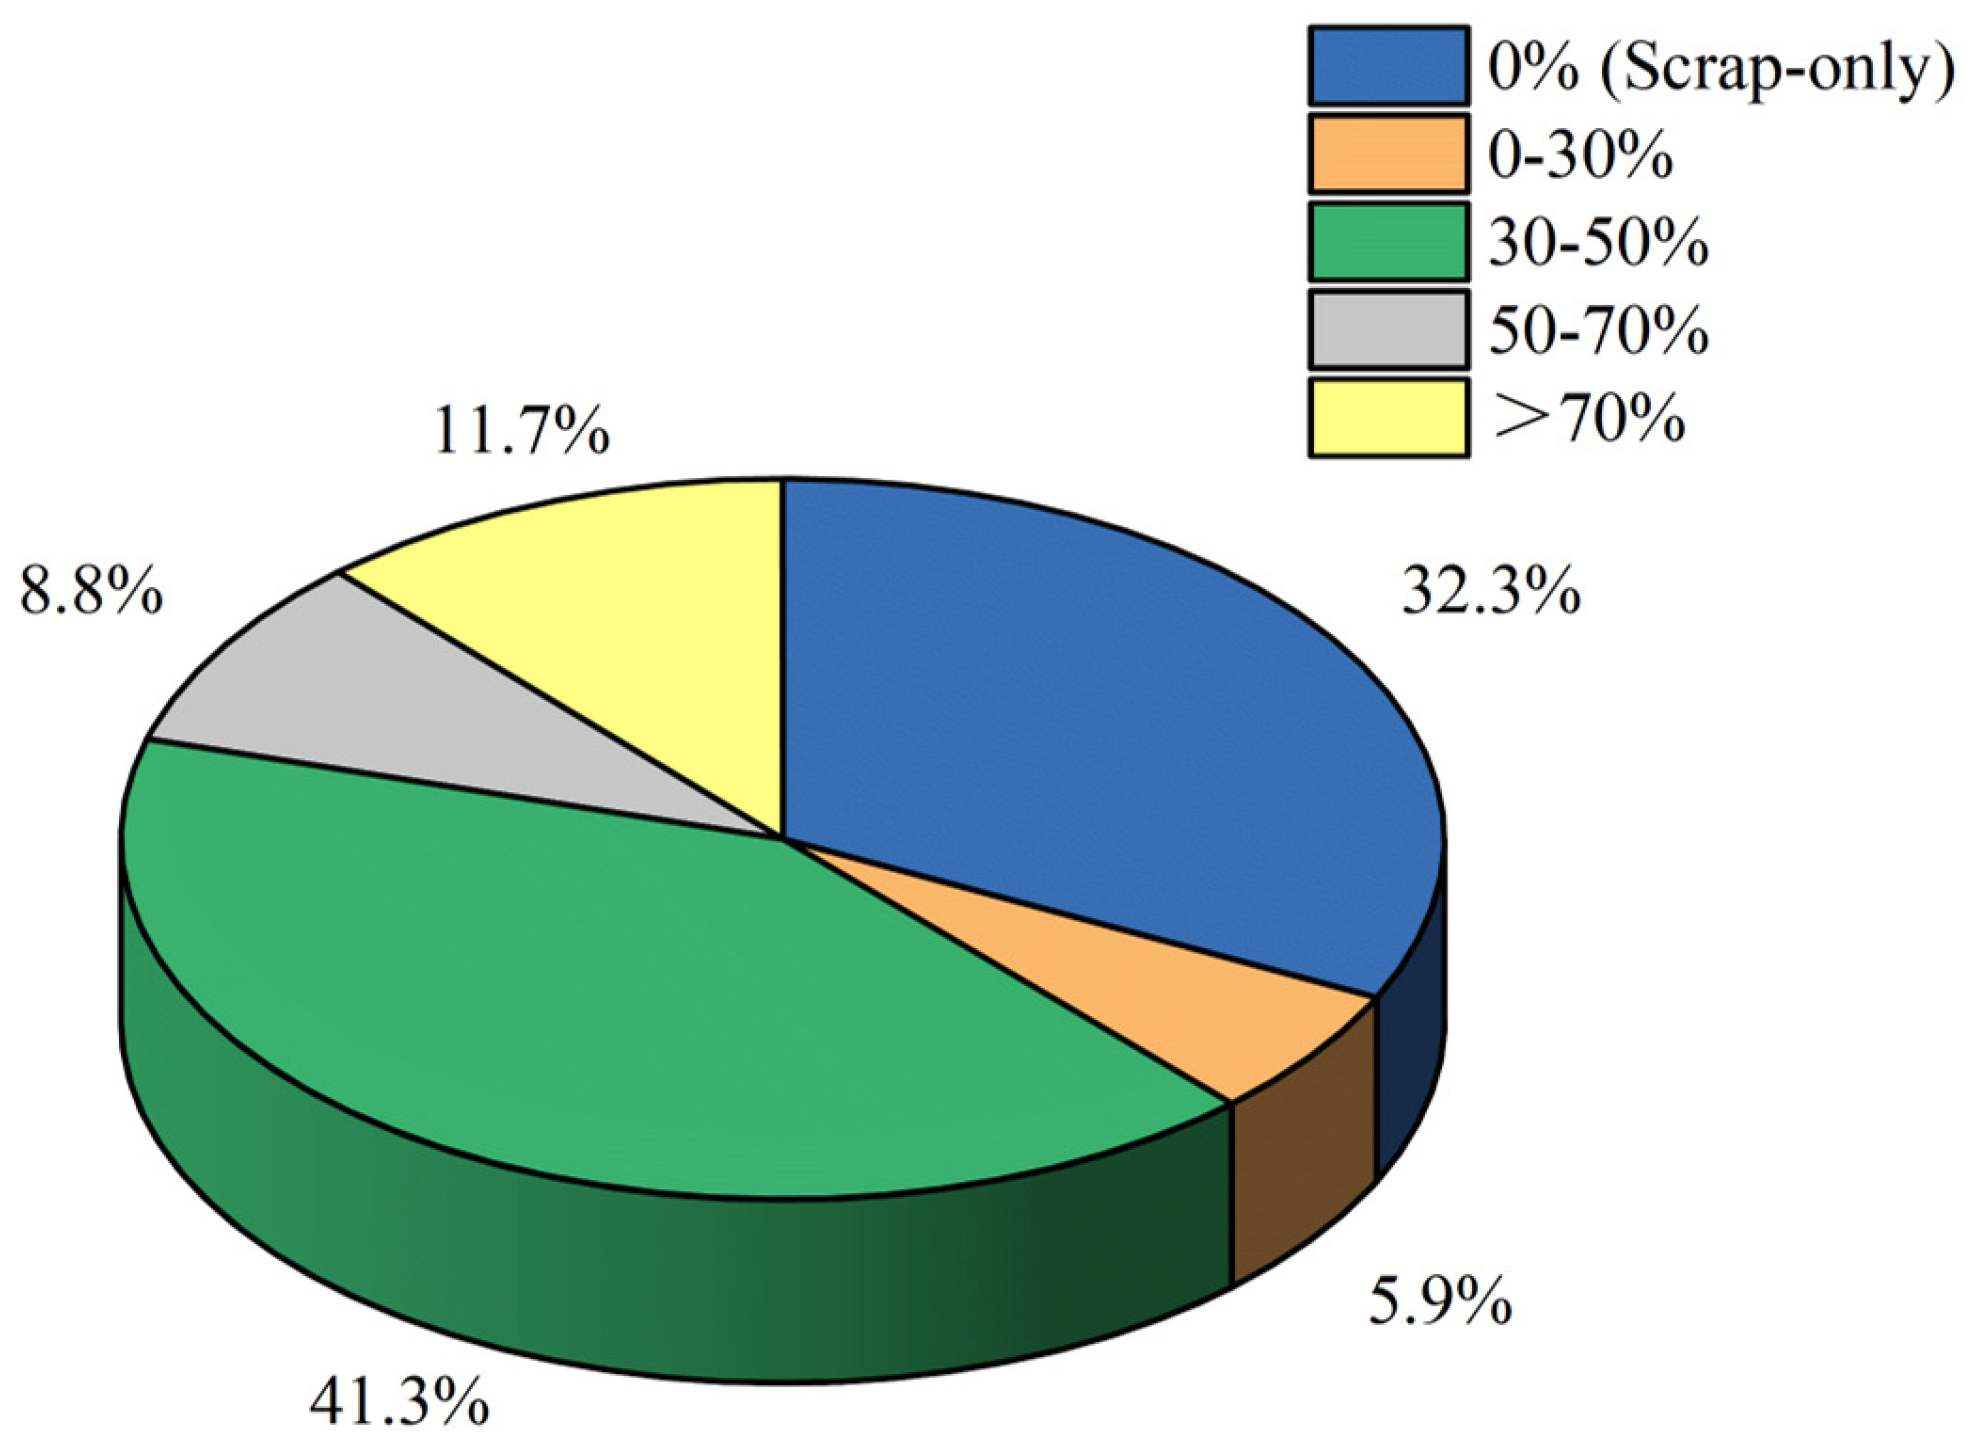
A total of 34 conventional EAFs were statistically analyzed, and the distribution of their hot metal charging ratio is shown in Figure 9. Overall, the raw material structure of domestic conventional EAFs is characterized by the dominance of a medium-to-high hot metal ratio and the coexistence of all-scrap processes. The hot metal ratio of 30–50% is the most mainstream, accounting for 41.3%. The all-scrap mode (0%) accounts for 32.3%, representing another important raw material route. The high hot metal ratio of 70% accounts for 11.7%, 50–70% accounts for 8.8%, and the low ratio of 0–30% accounts for the lowest share of only 5.9%. The above distribution indicates that hot metal charging is a typical production mode for conventional EAFs in China. The hot metal ratio covers a wide range, mostly concentrated at 30–50%, and even exceeds 70% in some heats.
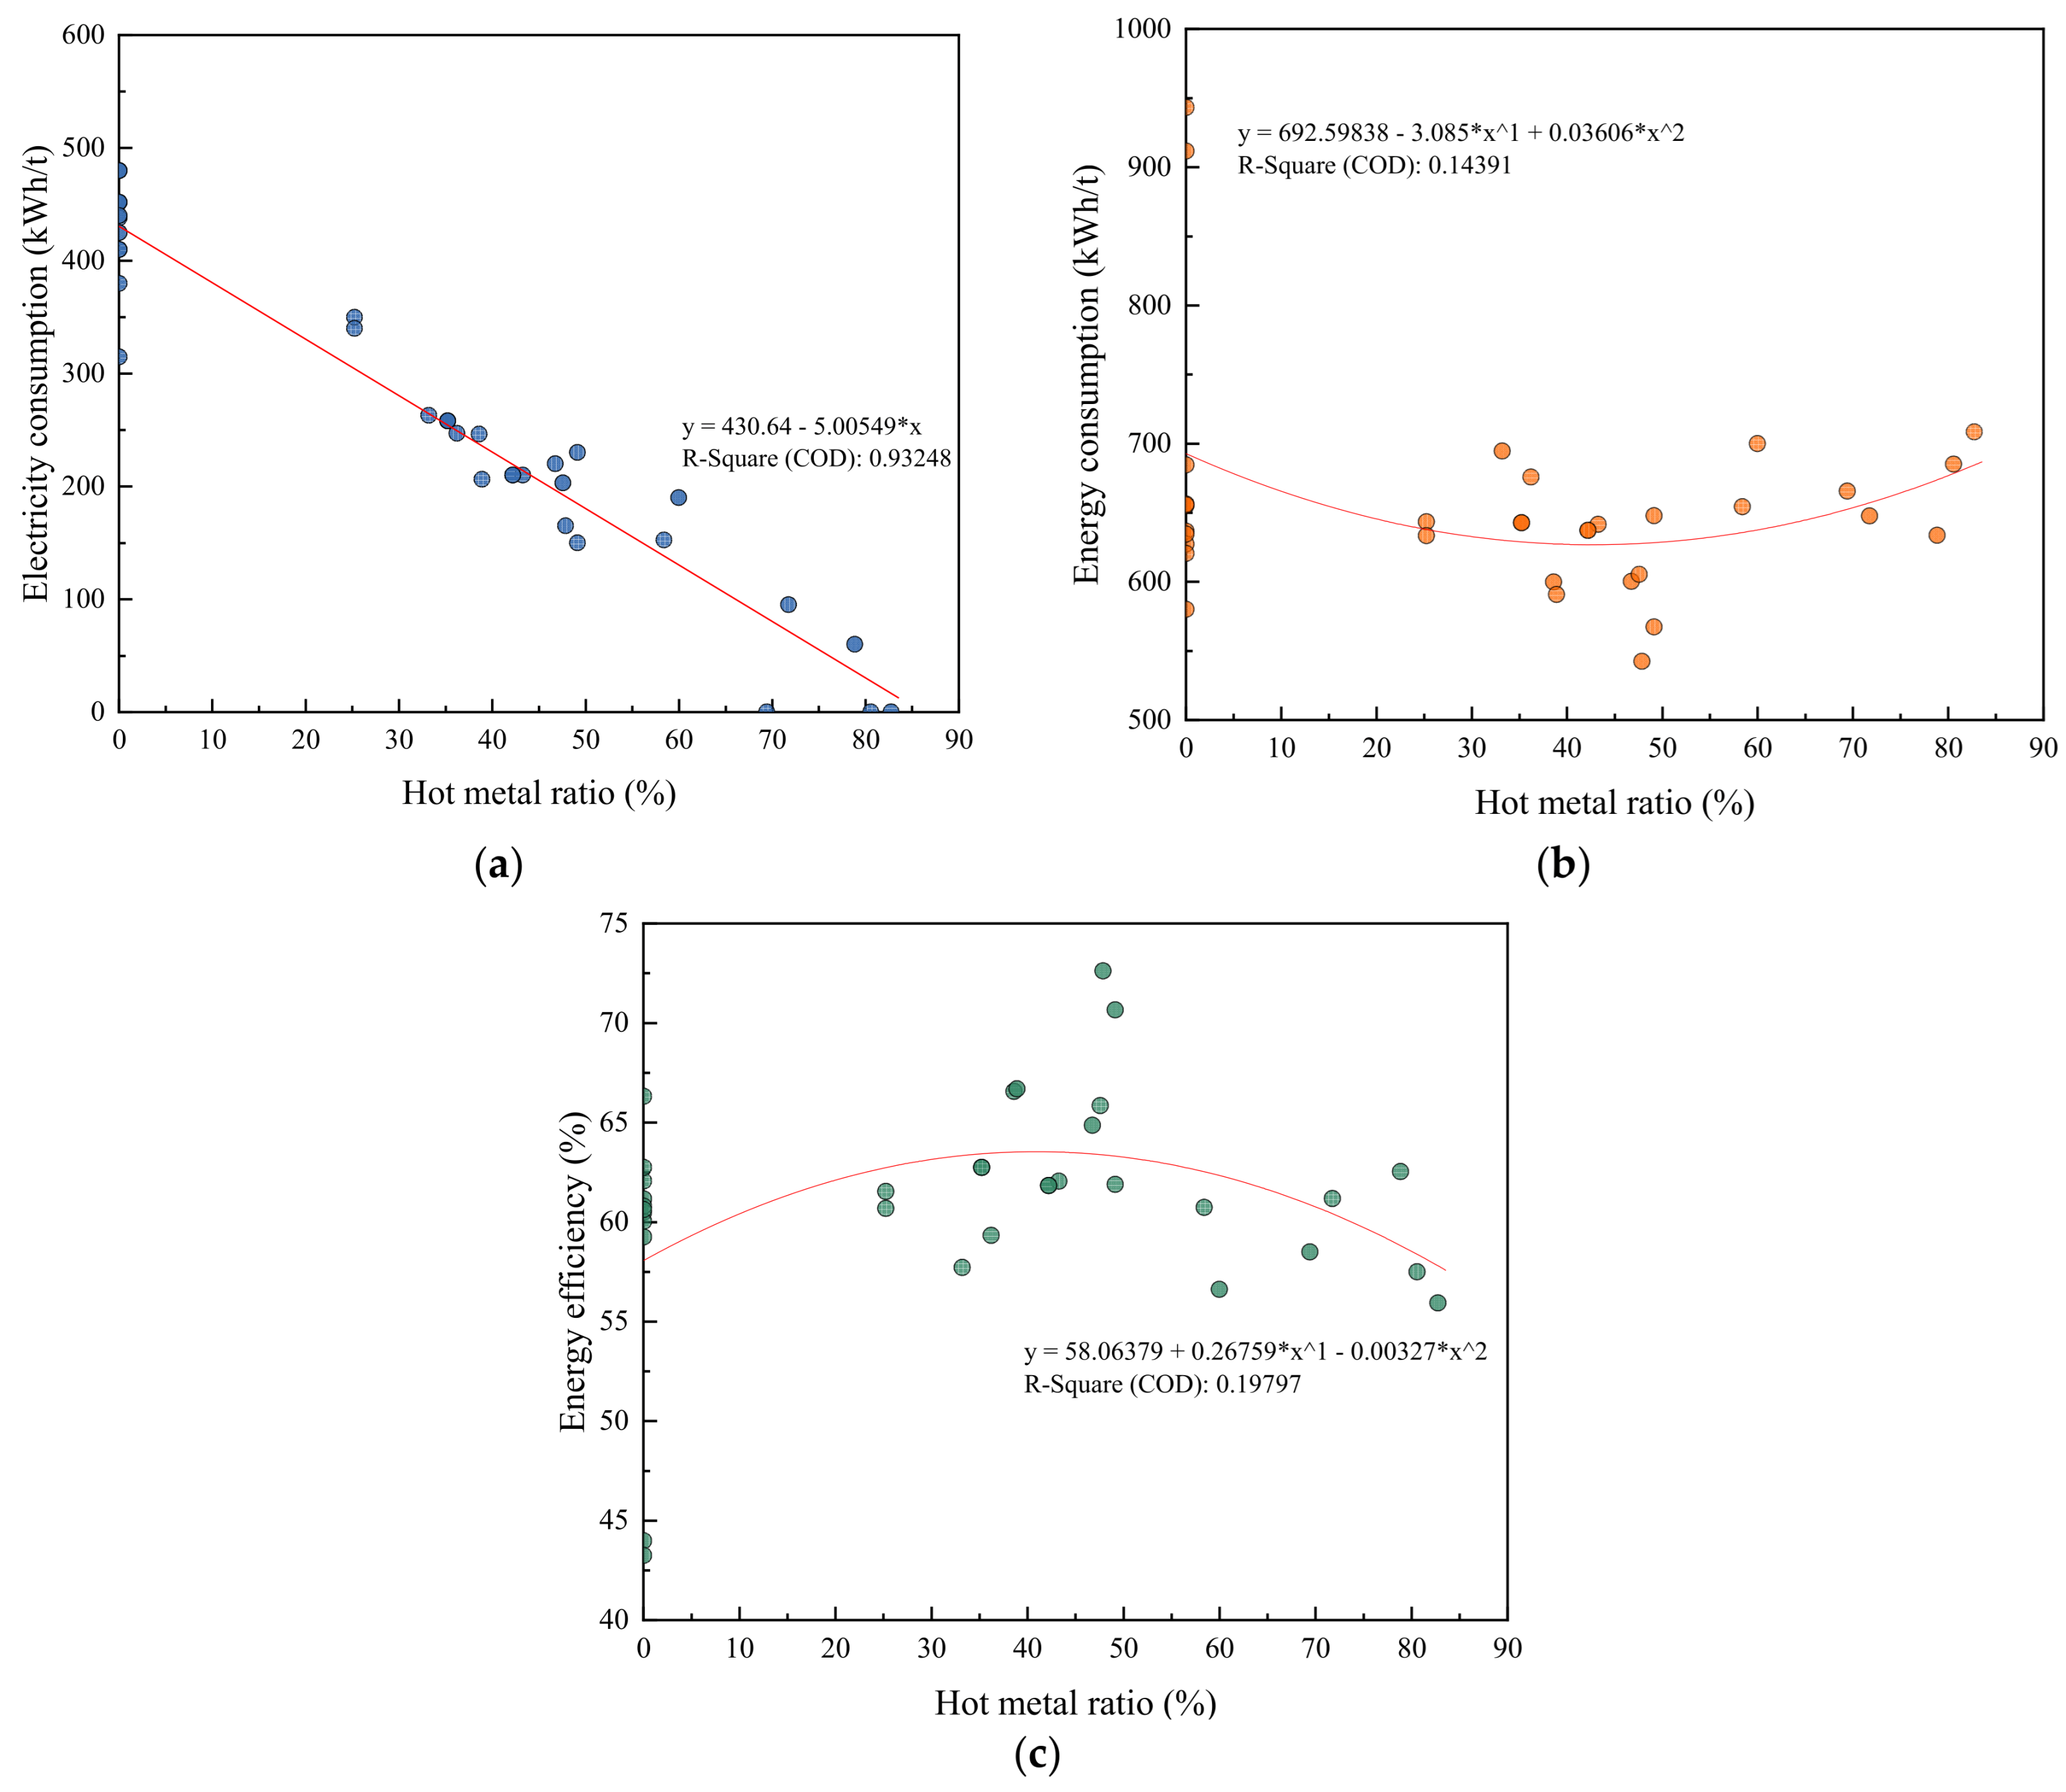
Figure 10a shows the scatter distribution and linear fitting curve of specific power consumption for conventional EAFs versus hot metal ratio. The results indicate that specific power consumption decreases significantly with increasing hot metal ratio, following the equation y = 430.64 − 5.00549x. For each 10% increase in hot metal ratio, the specific power consumption is reduced by approximately 50.05 kWh/t, with a high coefficient of determination R2 = 0.93248. This confirms that hot metal ratio is the dominant factor controlling power consumption, exhibiting a strong linear correlation. It is worth noting that the fitting trend suggests power consumption approaches zero at a hot metal ratio of approximately 86%, yet only three actual samples (with ratios of 70%, 81%, and 83%, respectively) come close to this level. The power consumption range for all-scrap samples is broad, spanning 320 to 480 kWh/t. Consequently, this linear relationship is primarily applicable within the medium hot metal ratio range of 30% to 60%, with larger deviations occurring at all-scrap and ultra-high hot metal ratio conditions.
Figure 10b presents the scatter distribution and quadratic fitting curve of total energy consumption for conventional EAFs versus hot metal ratio. Total energy consumption displays a distinct U-shaped trend, described by the equation y = 692.59838 − 3.085x + 0.03606 × 2 with R2 = 0.14391. The minimum energy consumption point occurs at a hot metal ratio of approximately 42% to 45%, representing the optimal raw material structure for minimizing total energy consumption in conventional EAFs.
Figure 10c illustrates the scatter distribution and quadratic fitting curve of energy efficiency for conventional EAFs versus hot metal ratio. Energy efficiency exhibits a clear inverted U-shaped trend, fitted by the equation y = 58.06379 + 0.26759x − 0.00327x2 (R2 = 0.14391). The efficiency curve pattern is inversely correlated with total energy consumption. This is because, under a constant tapping temperature, the physical heat of the molten steel is fixed, making energy efficiency essentially inversely proportional to total energy consumption. Statistical analysis shows that peak energy efficiency also occurs at the 42% to 45% hot metal ratio range, identifying this as the optimal raw material structure for maximizing energy efficiency in conventional EAFs.

3.2. Model-Based Simulation Results

This section presents simulation results derived from the calibrated energy balance model, complementing the statistical analysis of the 56-EAF industrial dataset. While the industrial data reflect actual production status, the model enables controlled variable analysis (e.g., single-factor impact of preheating temperature or hot metal ratio) and extends the investigation to unmeasured operating conditions.

3.2.1. Hot Metal Ratio Simulation (0–100%)

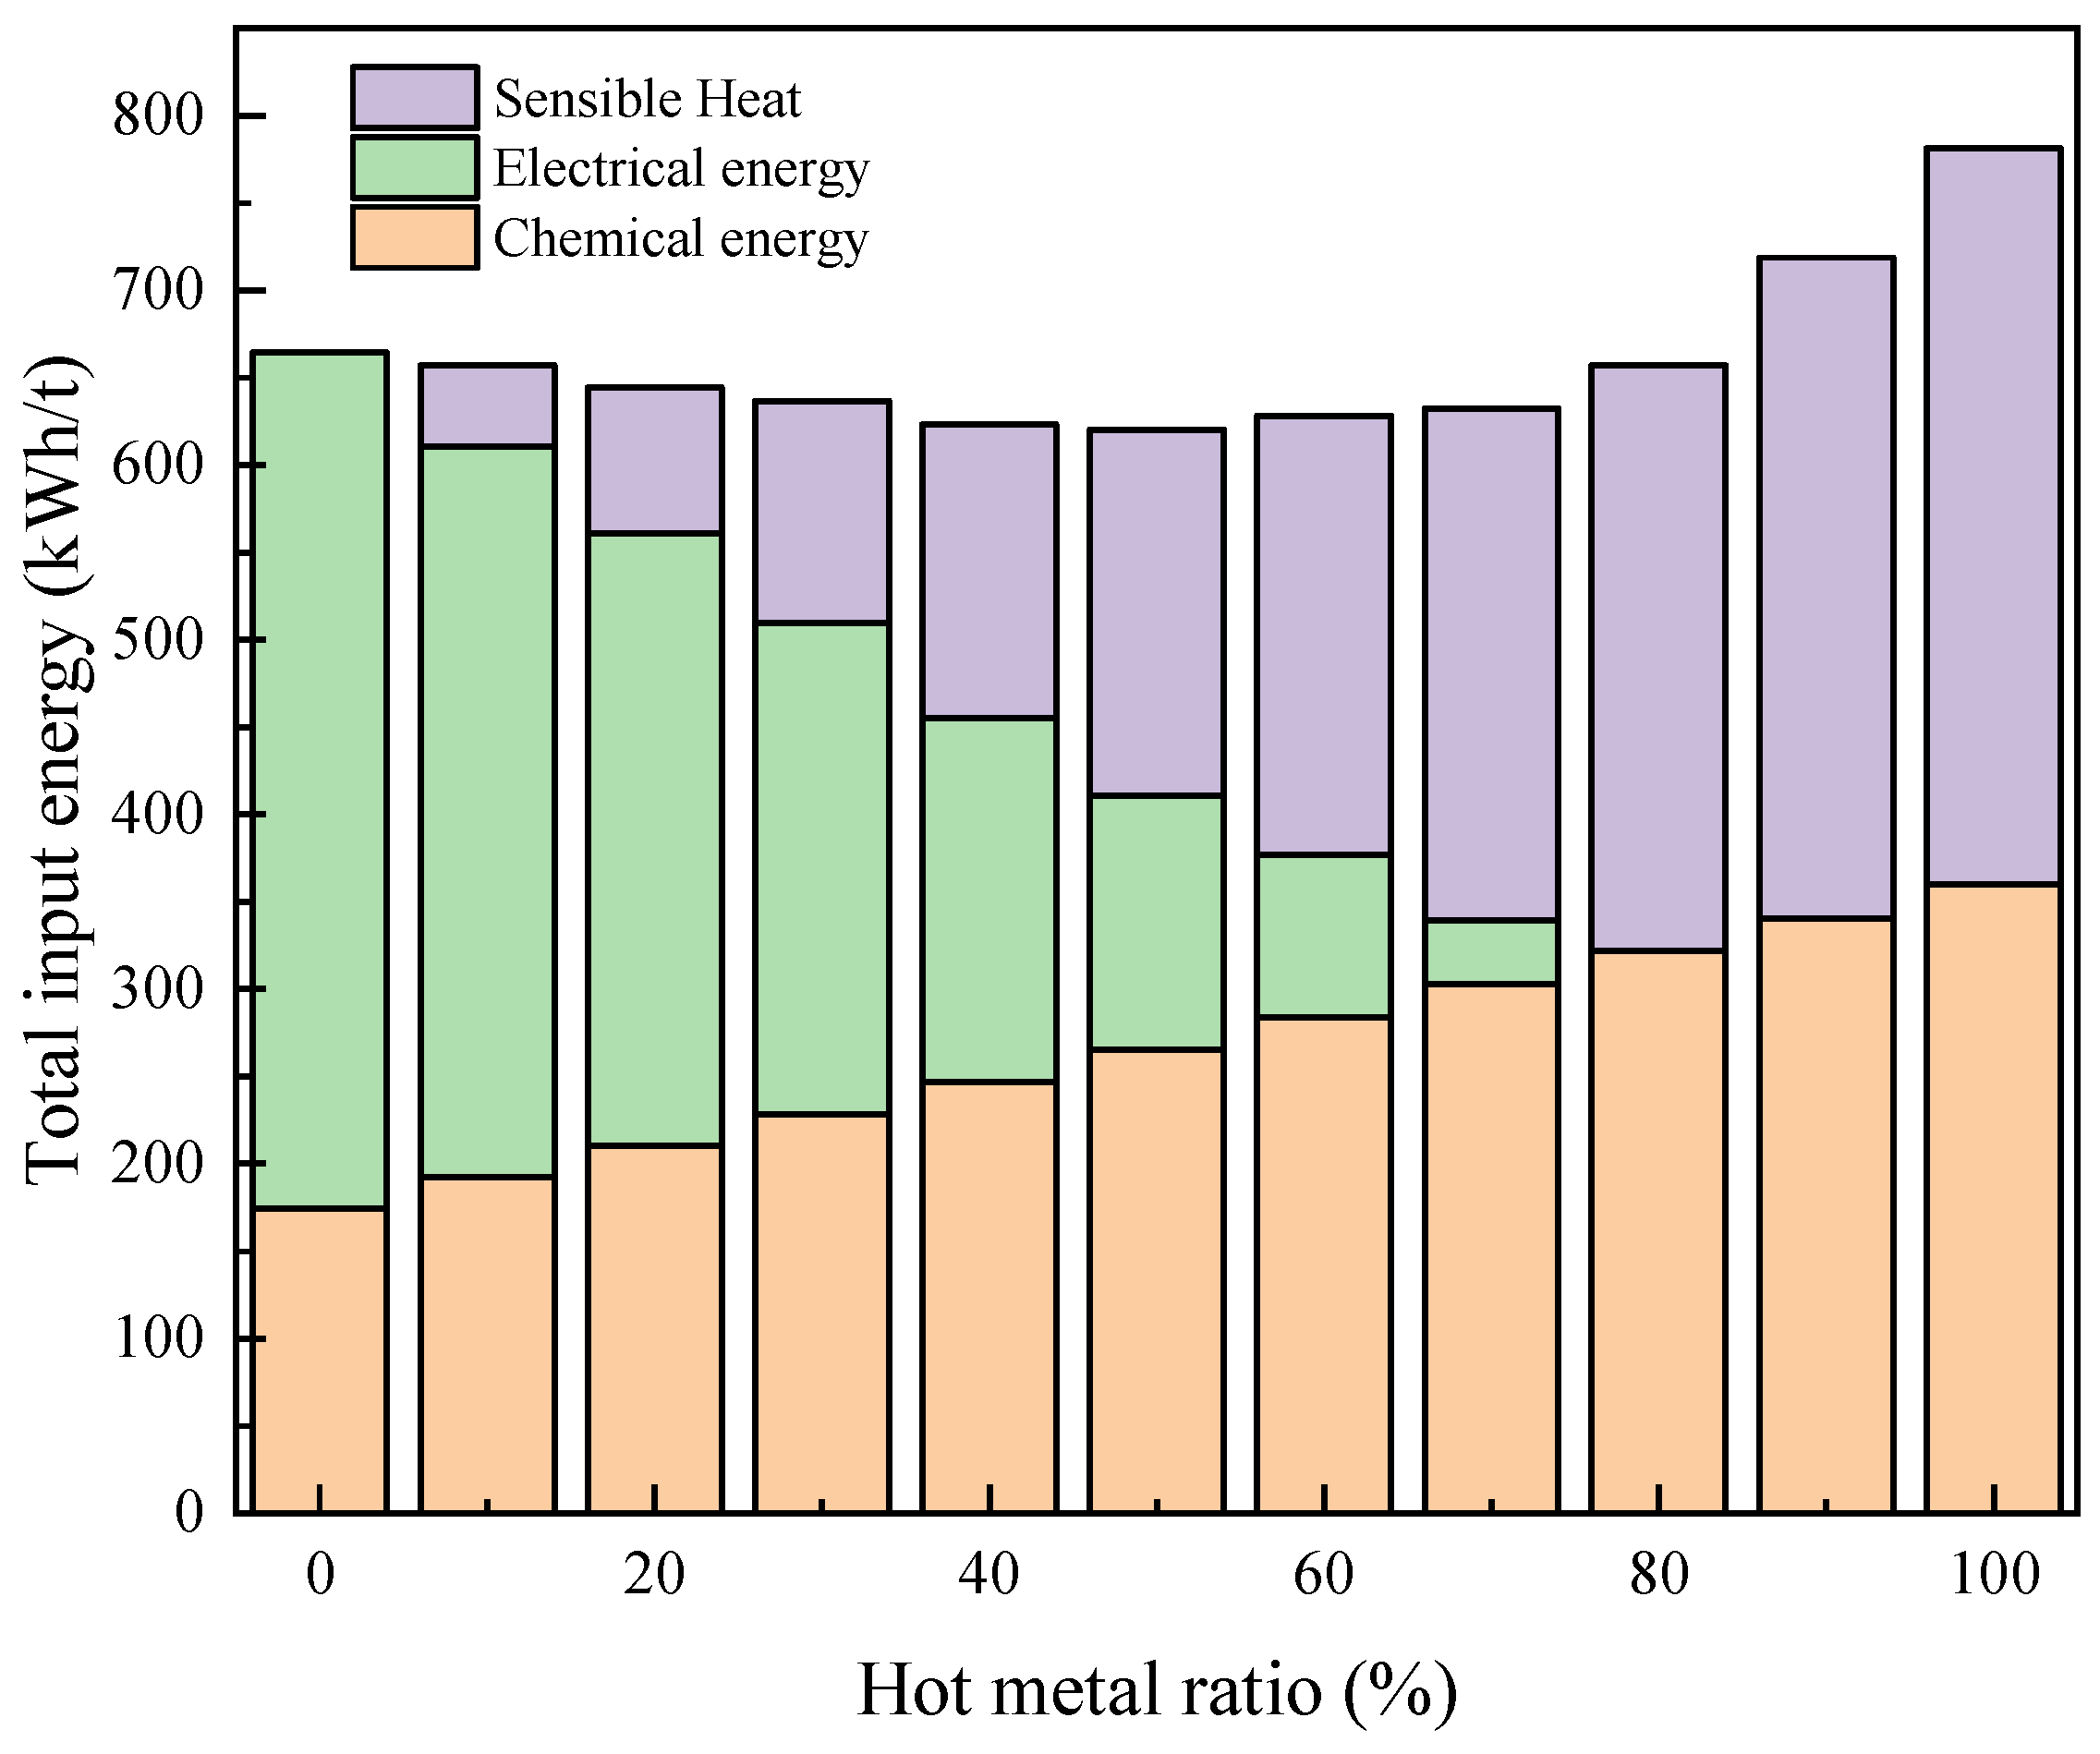
To reveal the influence mechanism of hot metal ratio from the perspective of energy essence and overcome the coverage limitation of field samples, the evolution law of input energy structure in the full hot metal ratio range of 0–100% was analyzed based on the previously verified EAF energy balance model. The smelting time under different hot metal ratio processes was taken into account in the model calculation, and the results are shown in Figure 11.
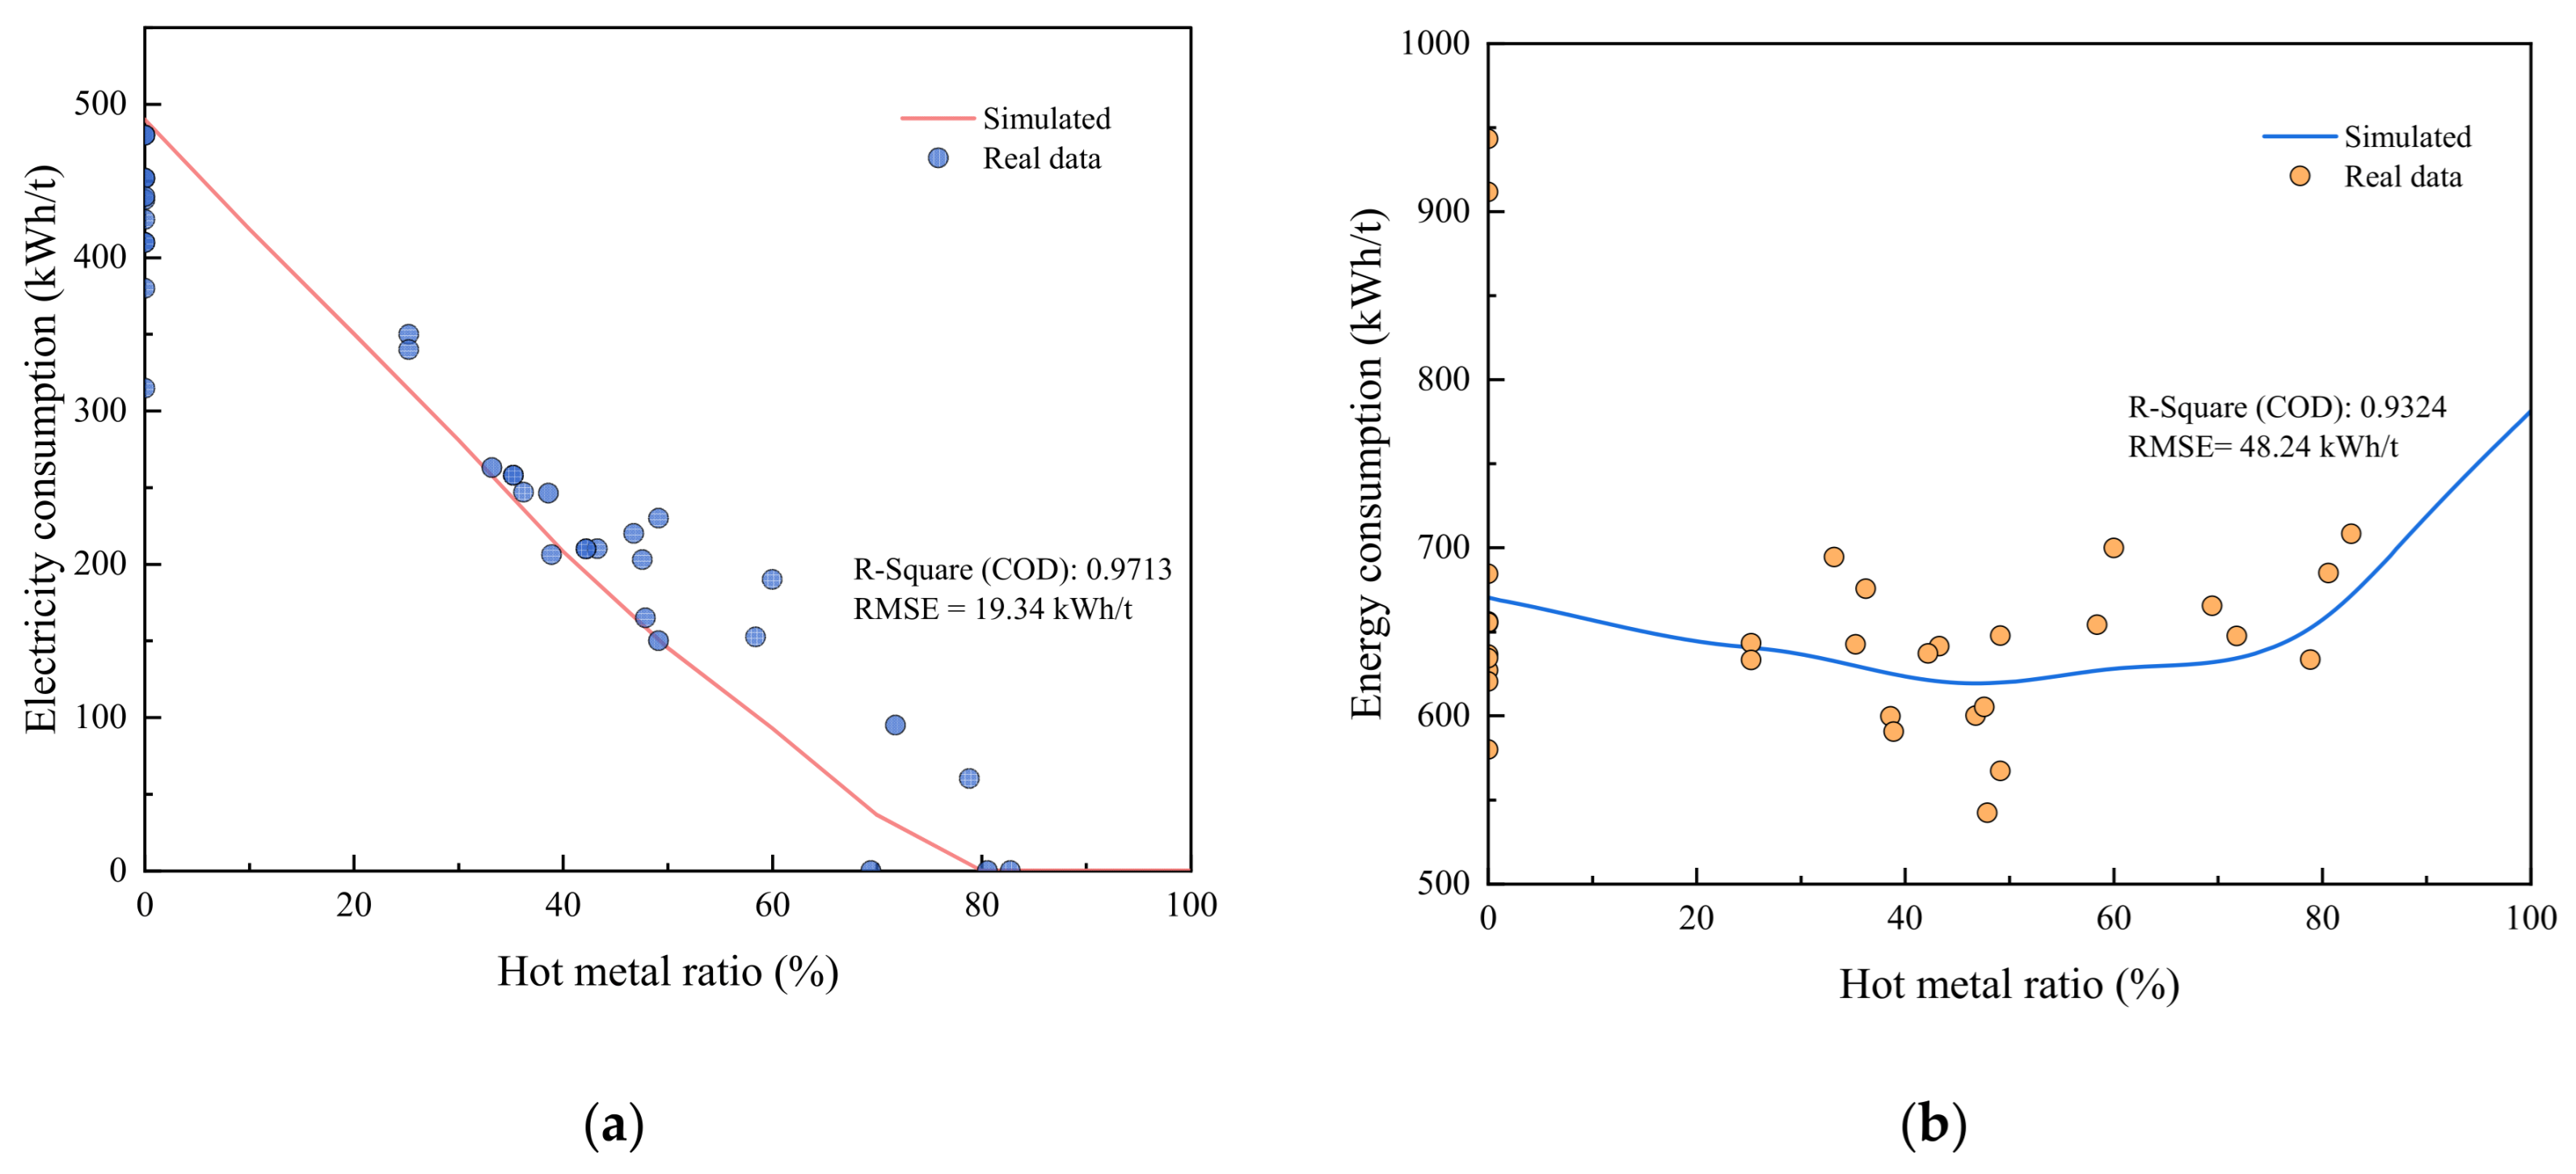
To verify the reliability of the established EAF energy balance model, the calculated curves of specific power consumption and specific total energy consumption versus hot metal ratio from the model were compared with field measured data. Meanwhile, the model predictions were used to extend the research scope to the full hot metal ratio range, thereby compensating for the insufficient data coverage of field samples at ultra-high hot metal ratios. Since energy efficiency is essentially inversely proportional to energy consumption, to avoid redundancy, this section only conducts a comparative analysis of the simulated and measured results for power consumption and total energy consumption. The model-predicted curves were plotted together with the experimental scatter points, as shown in Figure 12.
It can be seen from the figure that the calculated values from the model are highly consistent with the variation trend of the measured data. After excluding discrete points near the all-scrap condition, within the hot metal ratio range of 20–100%, the coefficient of determination of the specific power consumption prediction model is R2 = 0.9713 and the root mean square error is RMSE = 19.34 kWh/t. The model prediction shows a nearly linear relationship between specific power consumption and hot metal ratio in the range of 0–50%, with a reduction of 6.13 kWh/t per 1% increase in hot metal ratio. The slope changes in the range of 50–70%, and the reduction rate decreases to 5.02 kWh/t. The model predicts that power consumption drops to approximately 0 kWh/t at a hot metal ratio of 80%, which is basically consistent with actual data, and the prediction accuracy is higher than that obtained from sample statistical fitting. The higher simulated slope compared with the measured fitting slope is mainly attributed to the difference between the model-set composition and temperature of hot metal and those in actual heat. The model also reveals a diminishing effect of hot metal ratio on power consumption reduction; the energy substitution effect weakens significantly when the hot metal ratio exceeds 50%.
For the specific total energy consumption prediction model, the coefficient of determination is R2 = 0.9324 and the root mean square error is RMSE = 48.24 kWh/t. Simulation results show that total energy consumption first decreases and then increases with rising hot metal ratio, reaching the minimum at 40–50% hot metal ratio, which is fully consistent with sample statistics, indicating that this range is also the optimal interval for energy efficiency. Both indicators exhibit high fitting degree and low deviation, fully demonstrating that the established energy balance model can accurately reproduce the real variation law of EAF energy consumption with hot metal ratio, with favorable prediction accuracy and mechanism reliability.

3.2.2. Scrap Preheating Inversion and Performance Analysis

Sample and Model Simulation Analysis
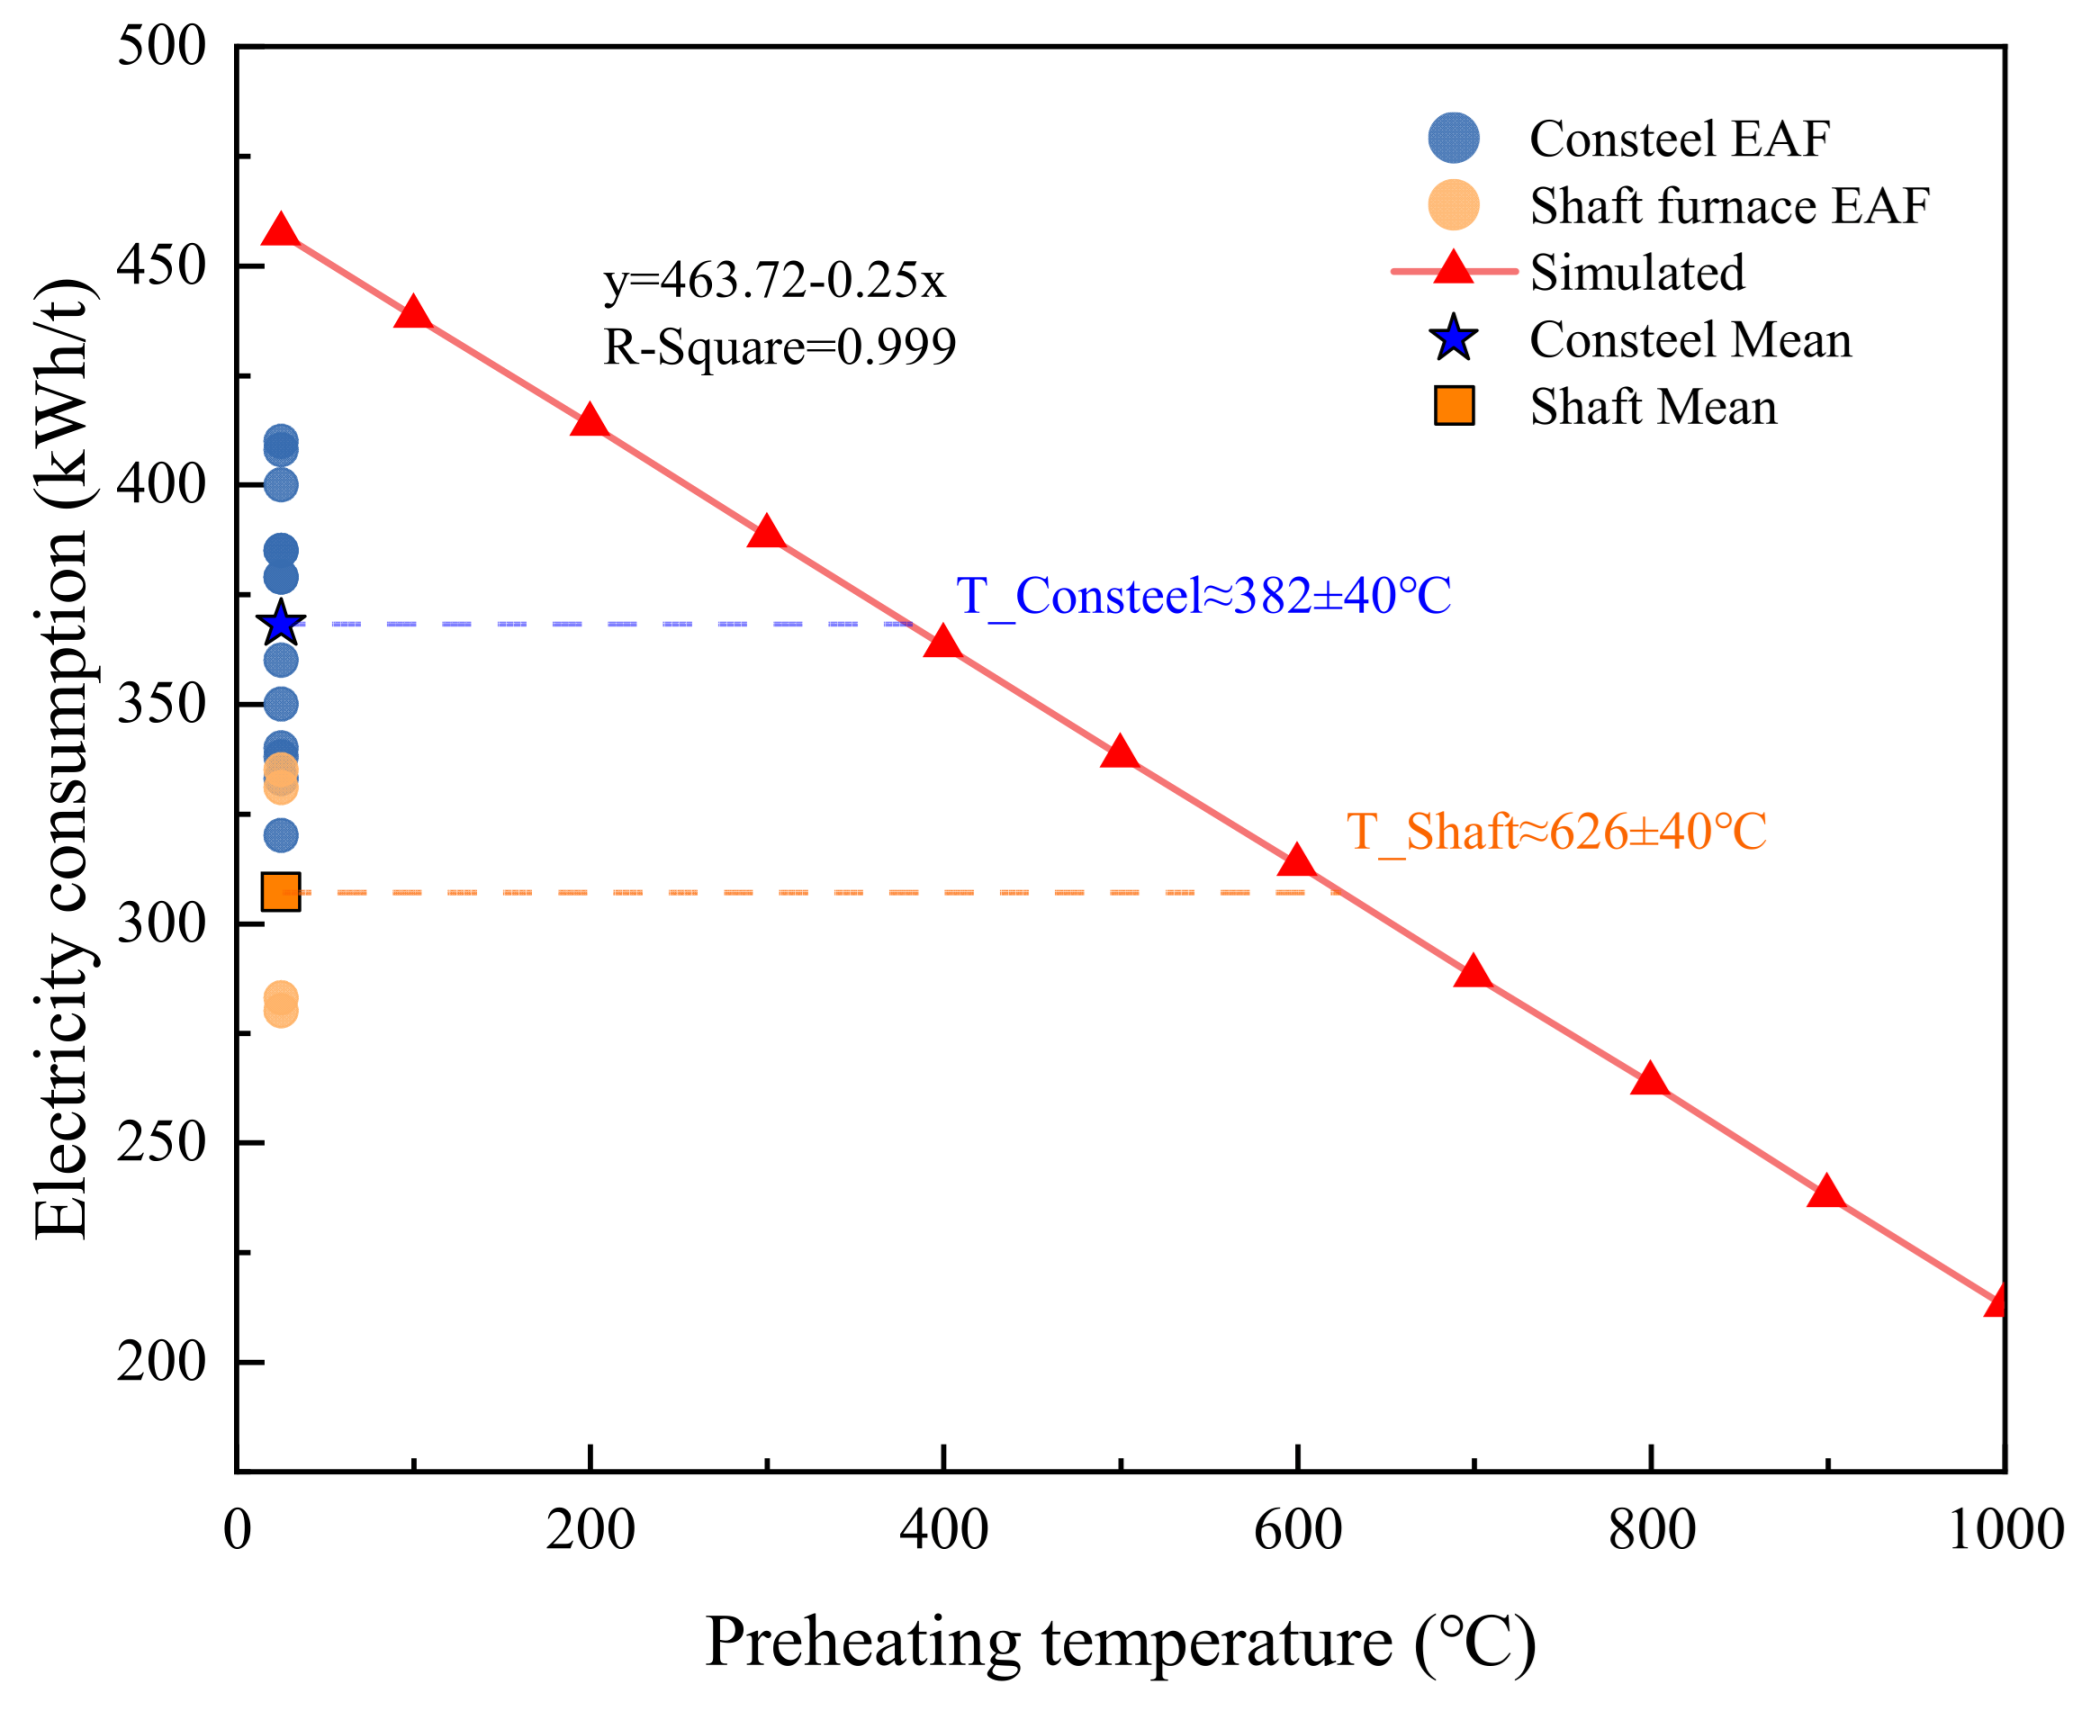
Scrap preheating represents an important technological advancement in EAF steelmaking and plays a significant role in energy conservation and consumption reduction. Consteel EAF and shaft furnace EAF are typical furnace types equipped with scrap preheating devices and are also the most widely applied in industry. This section focuses on analyzing the effect of scrap preheating on EAF energy efficiency. Given the limited number of samples with scrap preheating (22 heats in total) and the lack of measured preheating temperature data, a model inversion method is adopted to quantitatively analyze the equivalent preheating temperature for different furnace types. Based on the linear relationship between preheating temperature and energy consumption obtained from the established energy balance model, the actual power consumption data of each heat are plotted in the figure with a fixed virtual abscissa of 25 °C, so that the difference in power consumption is only reflected by the ordinate. The inversion principle is based on the first law of thermodynamics: the waste heat recovered from EAF off-gas is transferred to the scrap, and the recovered heat is quantified via measured flue gas temperature, flow rate, and composition, combined with calibrated heat transfer efficiency coefficients. Key assumptions in the inversion include steady-state heat transfer, negligible heat loss from the preheating zone, and uniform scrap temperature distribution. To avoid clutter in the figure, horizontal dashed projection lines are only drawn for the average power consumption of each furnace type. The abscissa corresponding to the projection on the model curve is defined as the equivalent average preheating temperature of the furnace type, which quantitatively characterizes the scrap preheating performance of shaft furnace EAF and Consteel EAF. The inversion uncertainty is estimated at ±40 °C.
To verify the reliability of the established EAF energy balance model, actual industrial power consumption data were compared with the preheating temperature–power consumption relationship calculated by the model, as shown in Figure 13. The linear model is expressed as y = 463.72 − 0.25x (R2 = 0.999) where y is specific power consumption (kWh/t) and x is scrap preheating temperature (°C). The results show that each 100 °C increase in scrap preheating temperature reduces EAF power consumption by approximately 25 kWh/t. Inversion calculation gives an equivalent average preheating temperature of about 382 ± 40 °C for the Consteel EAF and 626 ± 40 °C for the shaft furnace EAF. The significantly higher preheating temperature of the shaft furnace is the key reason for its lower power consumption. The difference in preheating performance between the two furnace types arises mainly from their distinct preheating structures and heat transfer efficiencies: the shaft furnace adopts a vertical countercurrent heat exchange mode, where high-temperature flue gas directly passes through the scrap bed, leading to high heat transfer efficiency; the Consteel furnace uses horizontal continuous preheating, with most flue gas flowing above the scrap layer, resulting in relatively mild heat exchange and lower preheating temperature.
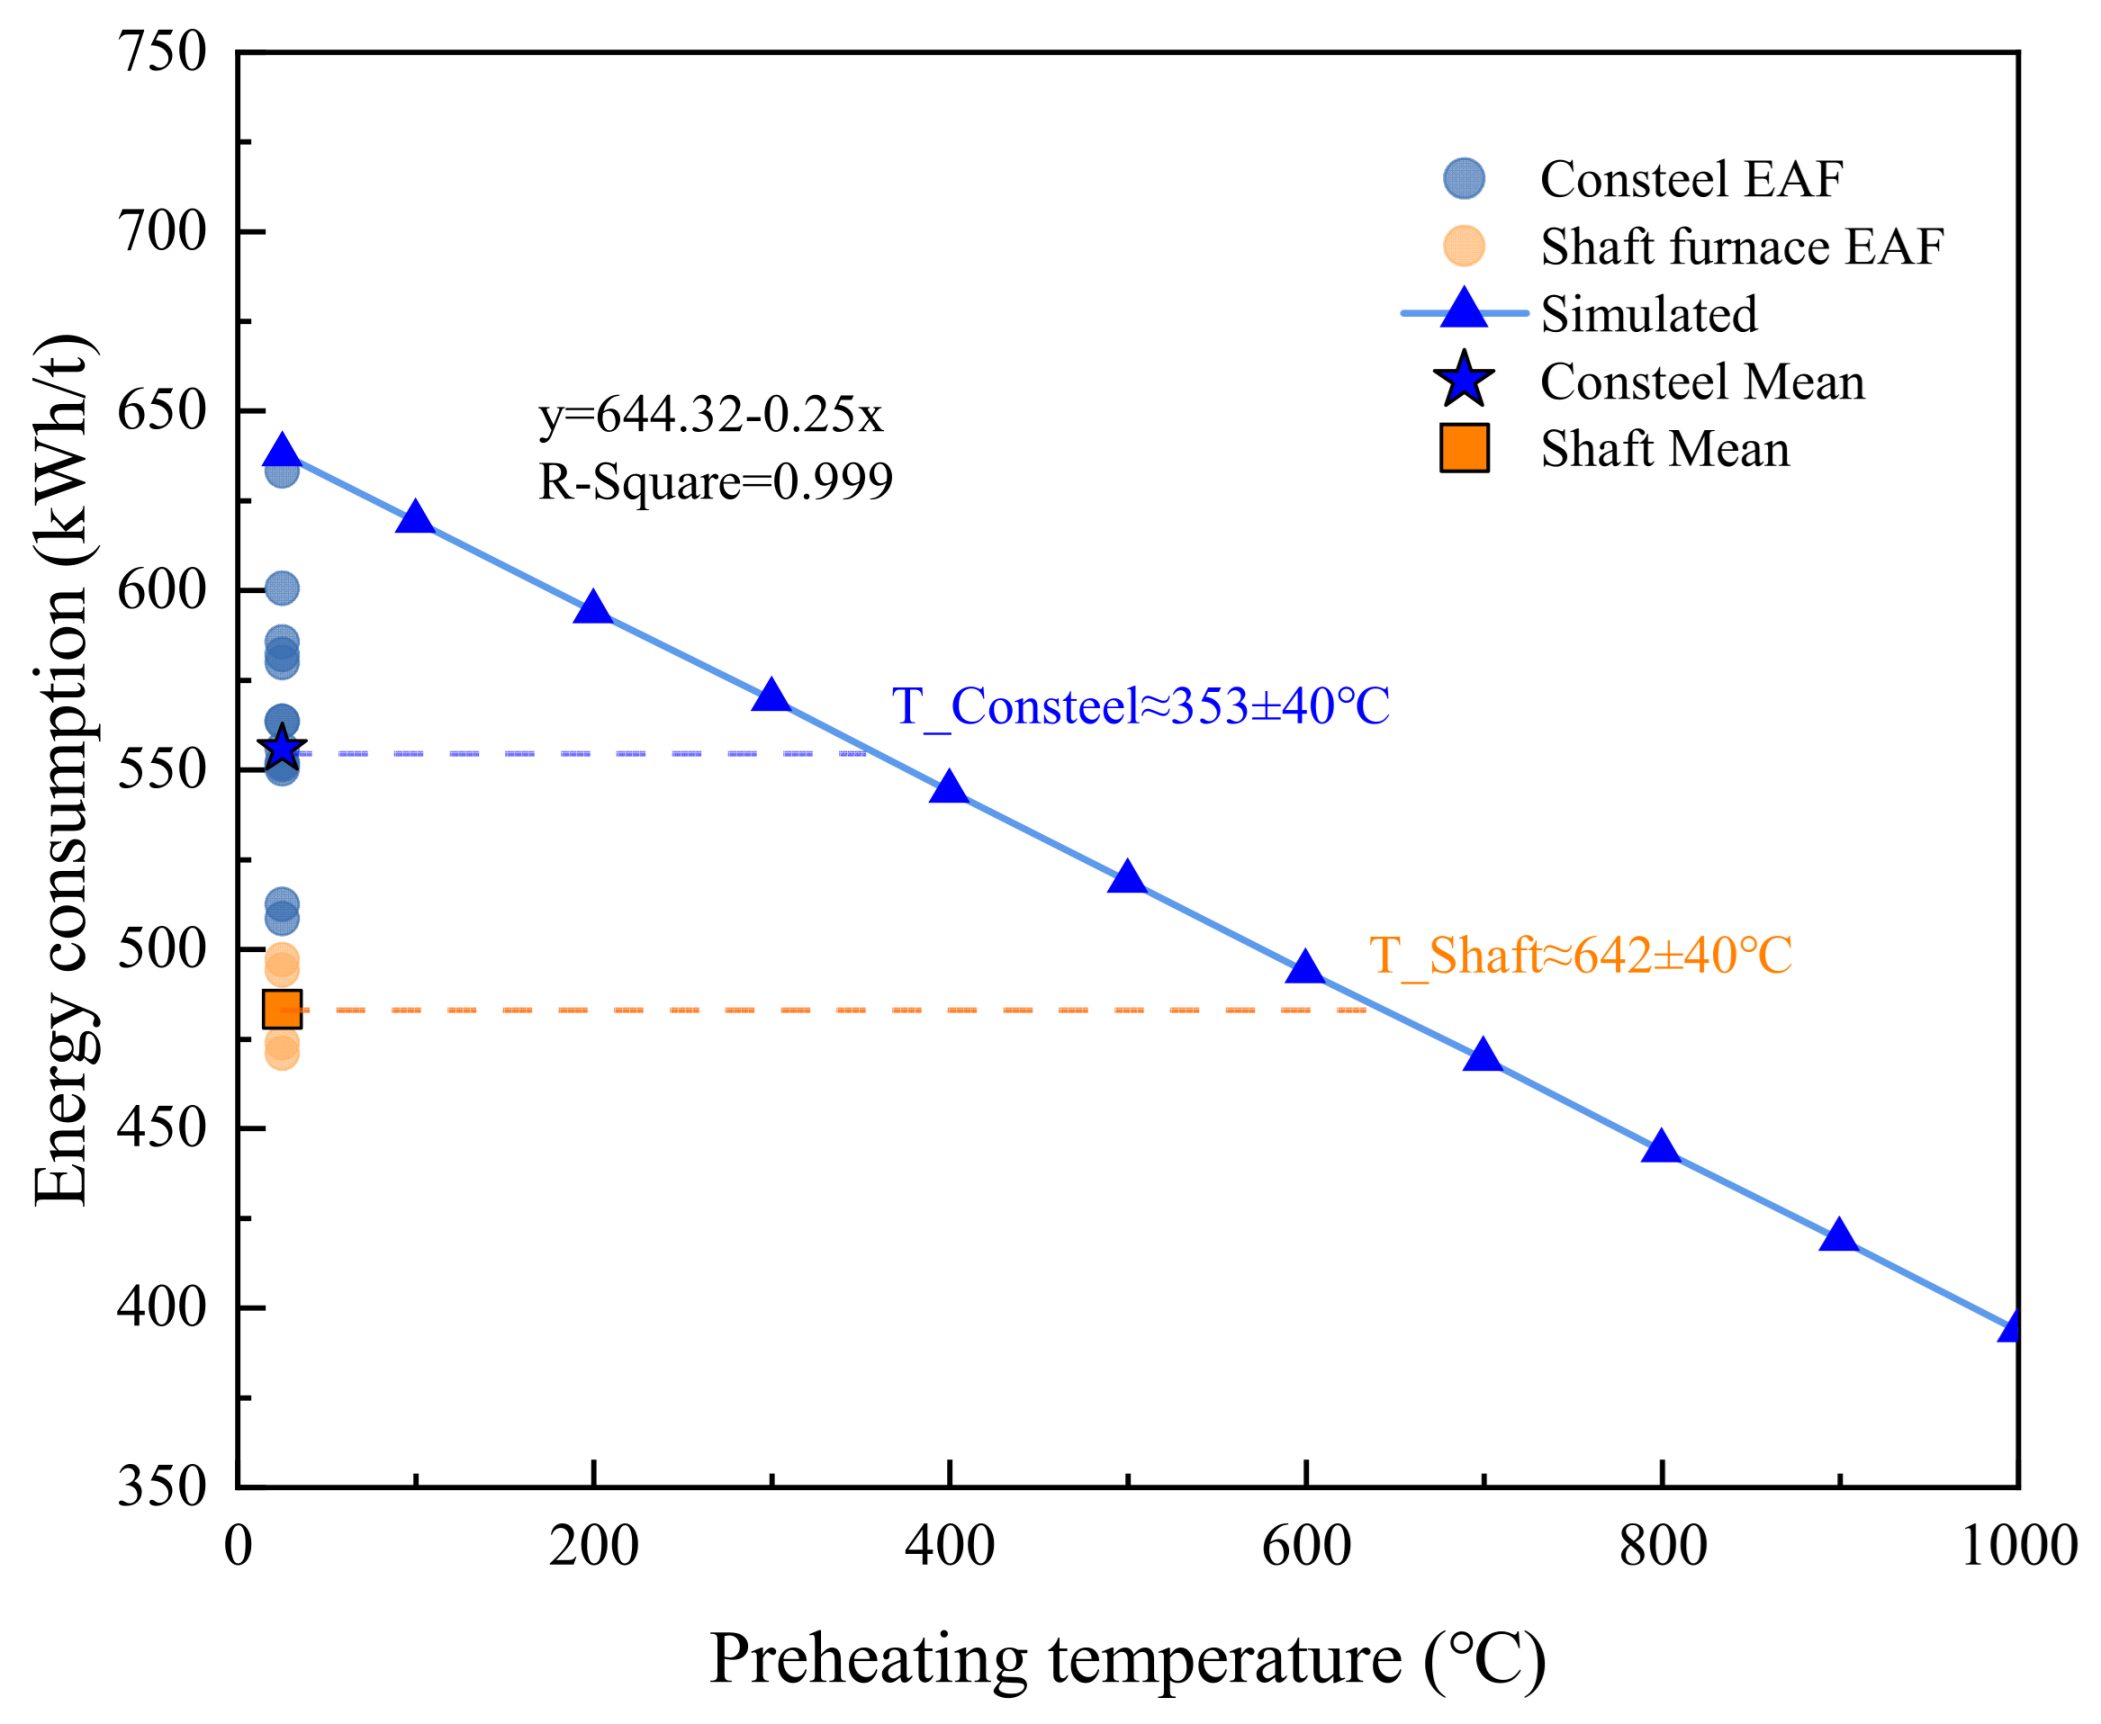
For total energy consumption, as shown in Figure 14, the linear model is y = 644.32 − 0.25x (R2 = 0.999), where y is specific total energy consumption (kWh/t). Total energy consumption also decreases by about 25 kWh/t per 100 °C rise in preheating temperature, consistent with the trend of power consumption. A slight discrepancy exists between the equivalent preheating temperatures inverted from power consumption and total energy consumption for the Consteel EAF, with the total energy consumption inversion yielding a lower value (approximately 350 ± 40 °C). This is attributed to the higher actual input of chemical energy (pulverized coal, natural gas, etc.) in industrial practice to ensure continuous charging and stable smelting rhythm, which increases the total energy consumption. Since total energy consumption includes both electric and chemical energy, additional chemical energy input at the same preheating temperature leads to a lower inverted preheating temperature, in good agreement with actual operating conditions. Despite minor numerical differences, the core conclusion that the shaft furnace achieves a significantly higher preheating temperature than the Consteel remains unchanged, confirming the reliability of the model and inversion results.
As demonstrated in previous sections, the stability of EAF power consumption is inferior to that of total energy consumption, which may affect the distribution of results to some extent. Therefore, the preheating temperatures inverted from total energy consumption are adopted in subsequent analyses.
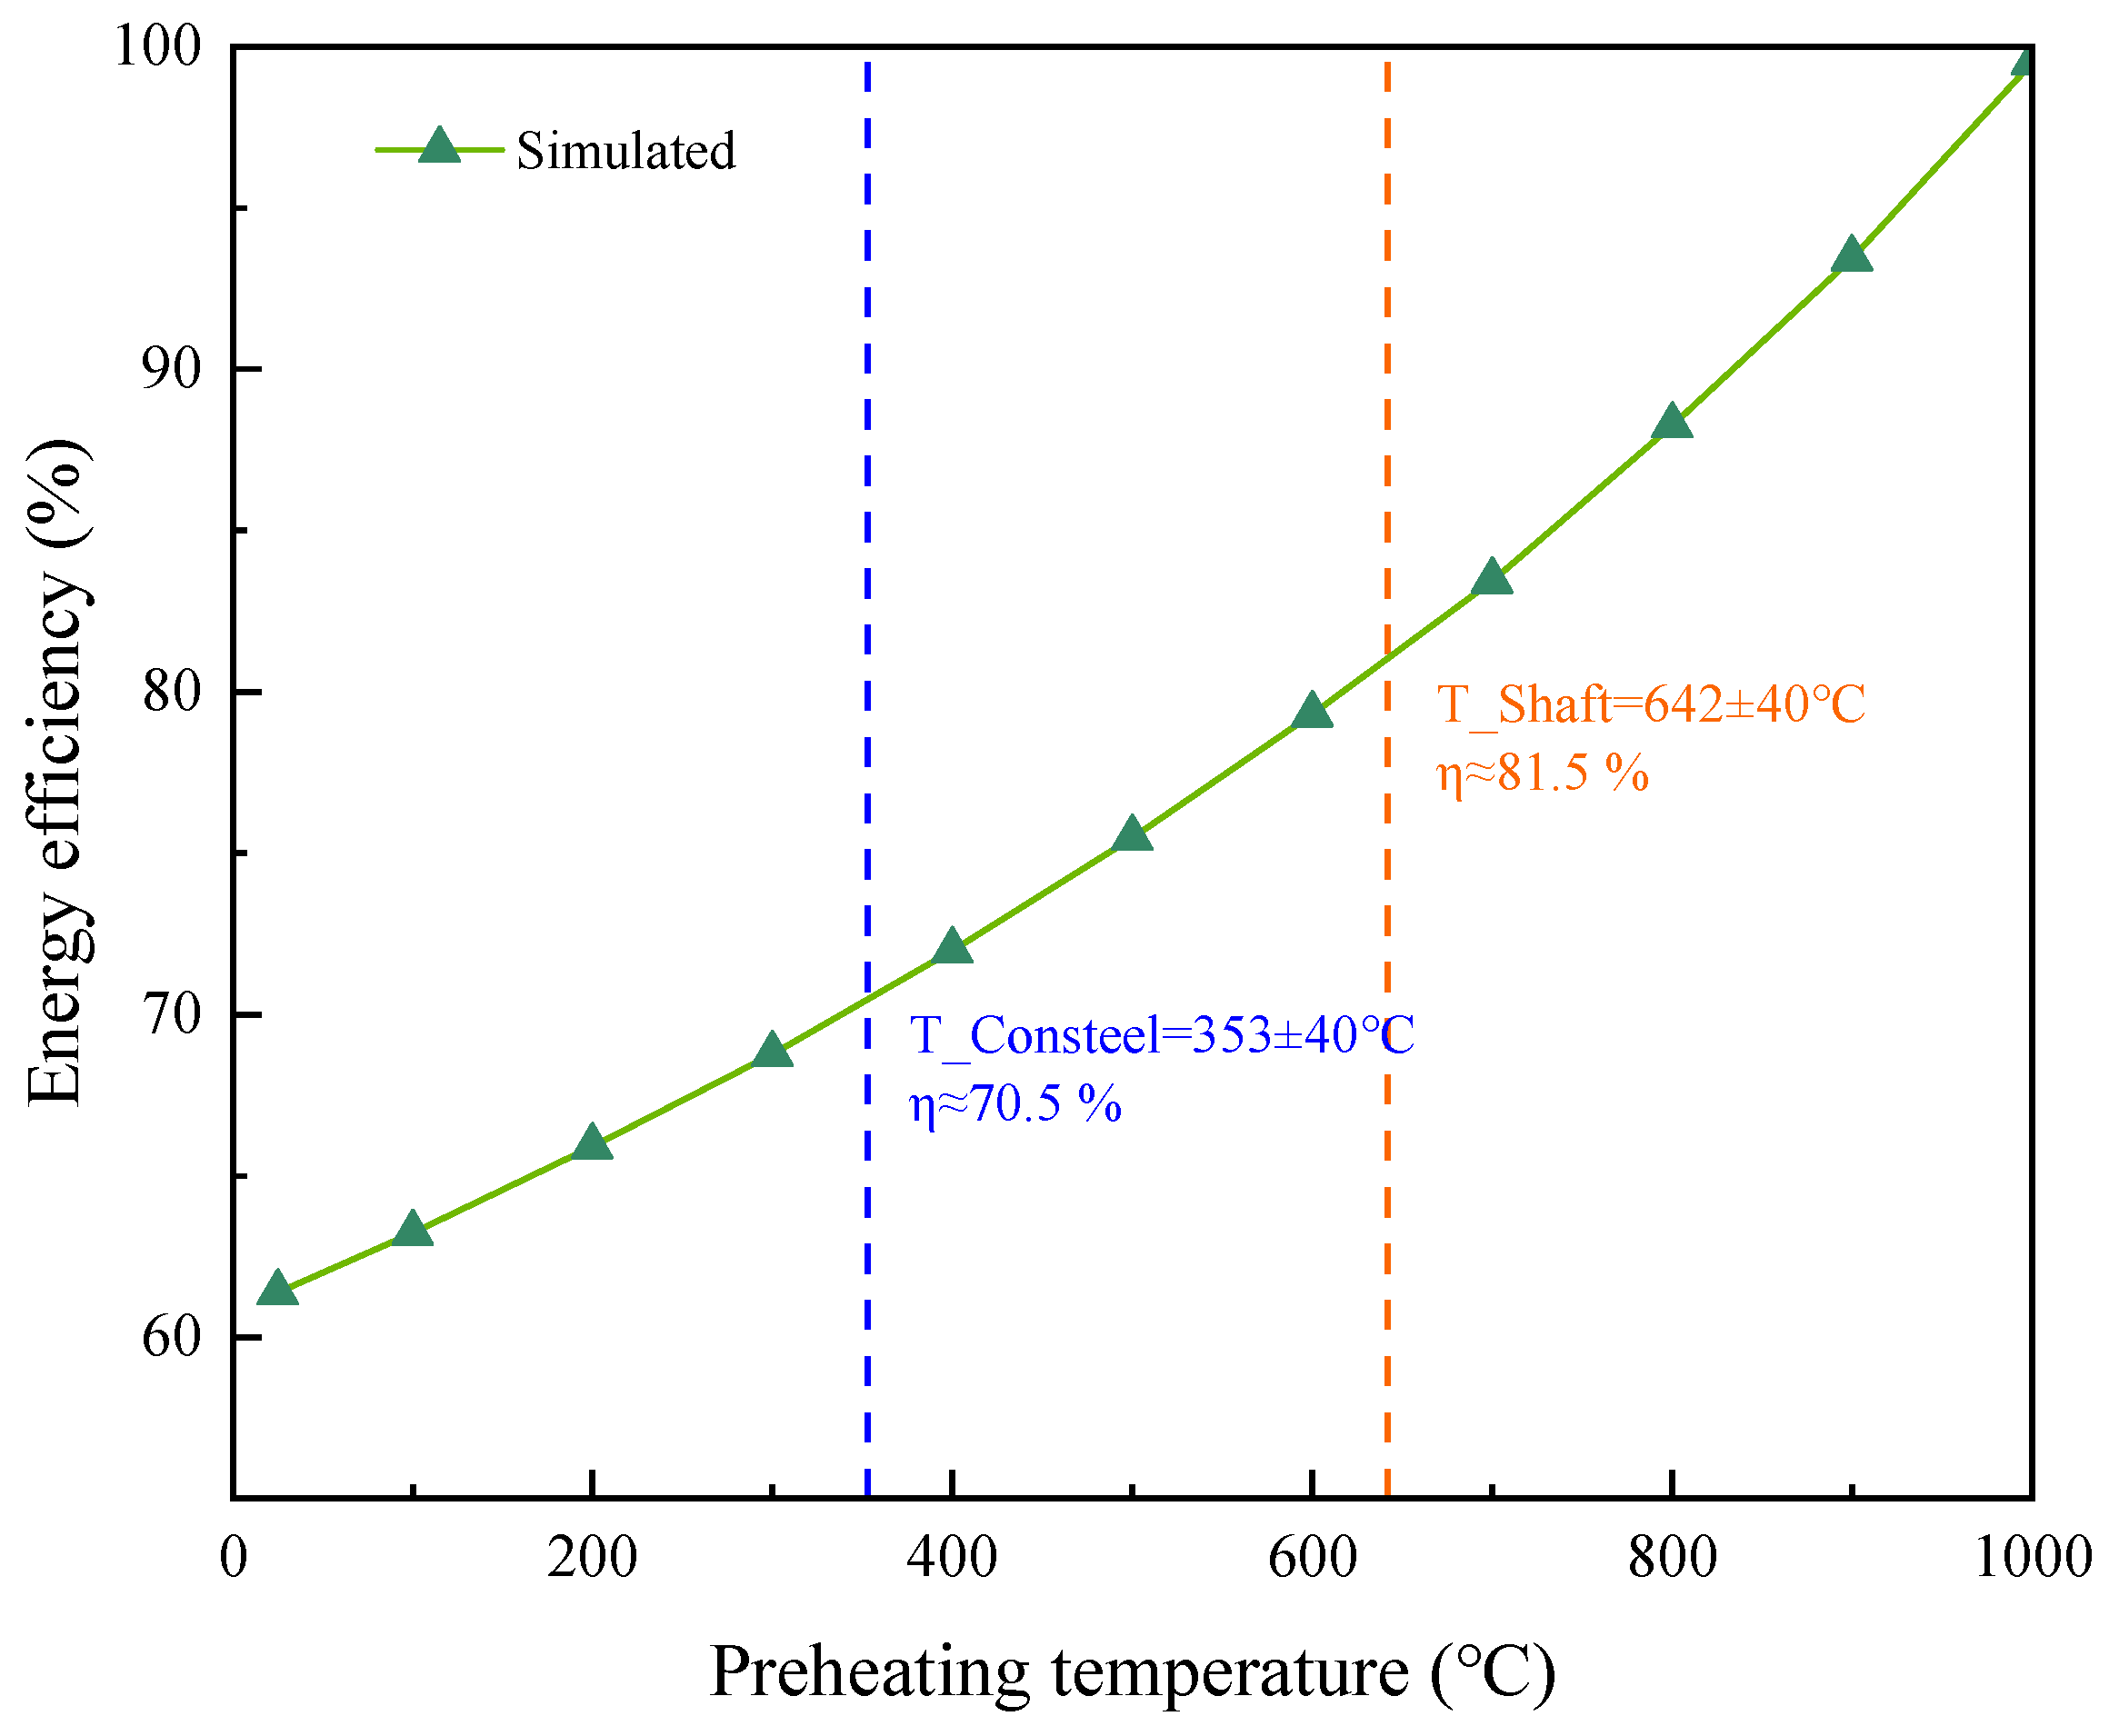
For the energy efficiency analysis, since the preheating temperature has been inverted based on the data relationships in the previous two figures, only the model simulation results are presented here. As shown in Figure 15, the system energy efficiency increases with rising preheating temperature. However, limited by physical constraints, a preheating temperature of approximately 800 °C represents the theoretical upper limit. Consequently, data beyond 800 °C are merely speculative and lack practical engineering significance. Combining the equivalent preheating temperatures of the two furnace types, the system energy efficiency of the Consteel EAF (approximately 353 ± 40 °C) is about 70.5%, while that of the shaft furnace EAF (approximately 642 ± 40 °C) reaches 81.5%. Benefiting from the higher scrap preheating temperature, the shaft furnace EAF achieves an approximately 11% improvement in energy efficiency compared to the Consteel EAF, fully demonstrating the critical role of scrap preheating in enhancing EAF energy efficiency.
Beyond preheating temperature, confounding factors contributing to efficiency differences include continuous charging mode (Consteel vs. batch charging), post-combustion burner configuration, variable scrap mix (shredded vs. heavy scrap), and off-gas heat recovery system design. These factors collectively influence energy performance, and preheating temperature is a key but not the sole determinant.
Energy Structure Analysis
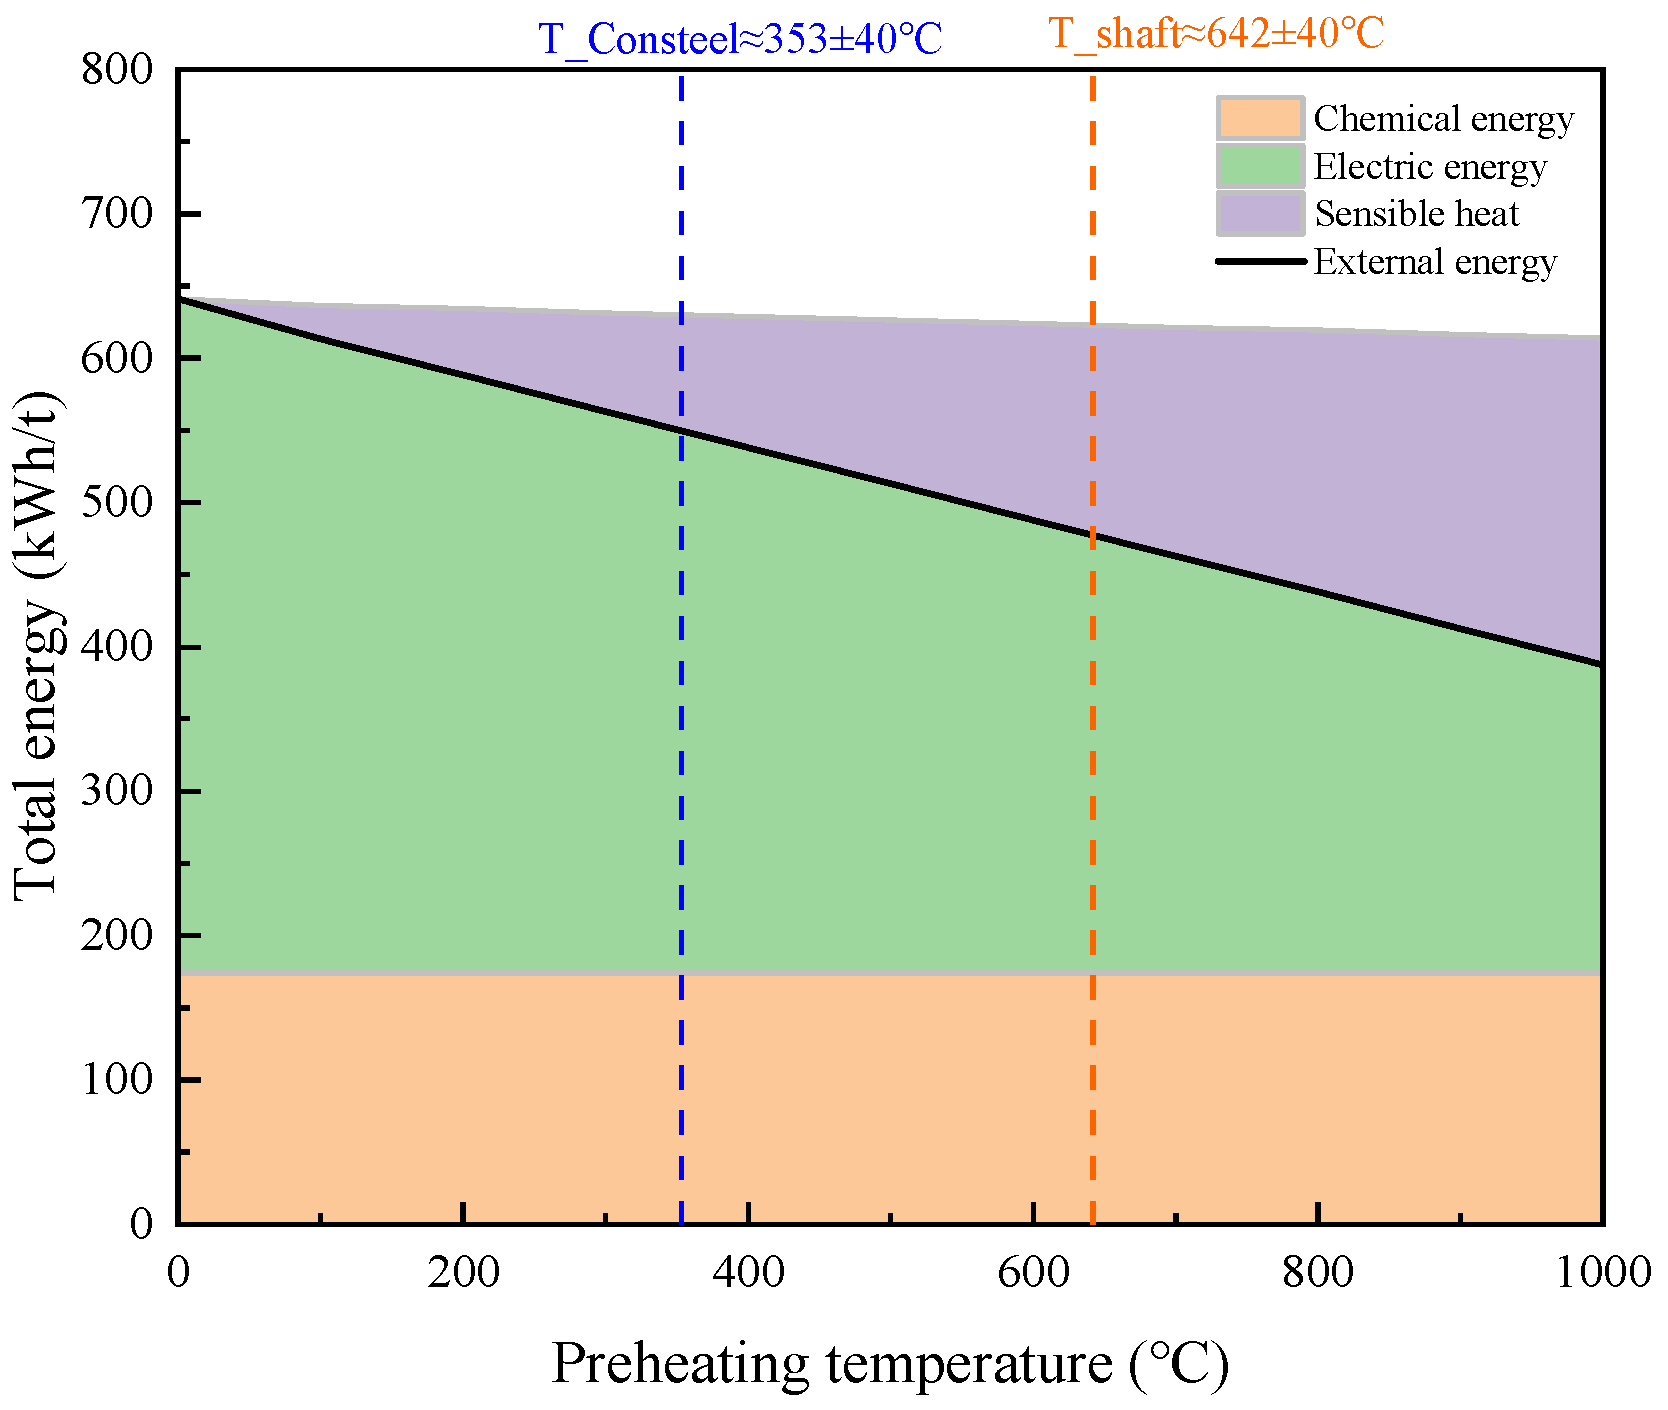
The relationship between the calculated preheating temperature and various input energy terms was plotted as a stacked area chart (see Figure 16). This figure clearly illustrates the influence of preheating temperature on each energy component and the total external energy during EAF steelmaking. Since the chemical reaction volume remains relatively constant, the chemical energy input stays stable. The electric energy shows a significant linear decrease with rising preheating temperature, while the sensible heat increases slowly. Dominated by the substantial reduction in electric energy, the total external energy decreases linearly overall.
Comparative analysis reveals that compared with the Consteel process (approx. 353 ± 40 °C preheating), the shaft furnace process (approx. 642 ± 40 °C preheating) achieves a significant reduction in total energy consumption, fully demonstrating the excellent energy-saving effect of increasing scrap preheating temperature.
From the perspective of energy structure, this figure intuitively reveals the energy-saving mechanism: the physical heat recovered from scrap preheating, acting as internal waste heat, directly displaces externally input electric energy. This mechanism significantly increases the proportion of effective heat in molten steel without increasing the total external energy consumption, thereby clarifying the fundamental essence of energy efficiency improvement from a mechanistic perspective.

4. Discussion

4.1. Key Mechanisms Underlying EAF Energy Efficiency

4.1.1. Furnace Type as the Decisive Factor

Statistical results confirm that furnace type and process configuration are the core factors determining EAF energy efficiency, with distinct energy performance and technical mechanisms across different furnace designs.
Conventional EAFs operating with 100% scrap exhibit the highest electricity consumption, highest total energy consumption, and the lowest energy efficiency. This is primarily attributed to the absence of scrap preheating and longer smelting times, which lead to substantial heat losses. Hot metal charging is widely applied in Chinese EAFs, as its sensible and chemical heat substitutes for electricity and reduces power consumption. However, this practice does not substantially lower overall energy consumption. It represents a temporary energy substitution measure dependent on blast furnace supply, which is inconsistent with full-process low-carbon development goals.
Advanced EAF technologies, including Consteel and shaft furnace designs, fundamentally reduce energy losses via integrated scrap preheating, continuous charging, and efficient flue gas waste heat recovery. These systems achieve simultaneous reductions in both electricity and total energy consumption, accompanied by significant improvements in energy efficiency. The shaft furnace EAF stands out with superior waste heat recovery, delivering the lowest total energy consumption, highest efficiency, and best operational stability, making it the optimal choice for energy saving and carbon reduction. The Consteel EAF offers good adaptability for retrofitting conventional furnaces and yields notable efficiency gains.
Notably, low electricity consumption does not equal low total energy consumption or high energy efficiency. For hot metal-charged EAFs, the reduction in electricity consumption is much larger than the reduction in total energy consumption. This demonstrates that evaluating performance solely by electricity consumption is one-sided; comprehensive assessment requires consideration of both total energy consumption and energy efficiency.

4.1.2. Secondary Effect of Furnace Capacity

Furnace capacity exerts a secondary scale effect on EAF energy efficiency. Larger furnaces generally have a smaller surface-area-to-volume ratio, which reduces unit heat loss and improves energy performance. However, the correlation between capacity and energy efficiency is weak across all samples, as the dominant influence of furnace type completely masks the scale effect.
For conventional EAFs, capacity expansion only yields marginal efficiency improvements and cannot resolve their inherent high-energy-consumption characteristics. In furnaces with hot metal charging, the capacity effect is further overshadowed by the energy substitution from hot metal. By contrast, advanced Consteel and shaft furnaces can leverage both process advantages and scale effects, leading to more significant efficiency gains.
Overall, furnace capacity acts only as an amplifying factor. Even large-capacity conventional furnaces may underperform compared to smaller advanced furnaces, confirming that furnace type remains the primary determinant of energy efficiency.

4.1.3. Hot Metal Ratio: In-Process Substitution Rather than Net Energy Saving

Hot metal charging reduces electricity consumption significantly via its sensible and chemical heat [39], but it represents in-process energy substitution rather than full-process energy saving.
For conventional EAFs, each 10% increase in hot metal ratio lowers specific electricity consumption by approximately 50 kWh/t. However, total energy consumption follows a U-shaped trend, while energy efficiency shows an inverted U-shaped trend, with an optimal operational range of 40–50% for balancing power demand and overall energy performance. However, this ratio is not optimal under deep decarbonization scenarios, where reducing hot metal reliance (to replace blast furnace capacity) becomes a priority.
At excessively high ratios (>70%), the high inherent energy cost of hot metal, redundant heat losses, and prolonged decarburization time lead to increased total energy consumption. This “converter-like operation” in EAFs is inefficient and unsuitable for long-term low-carbon strategies. Importantly, although the 40–50% range is energy-optimal for conventional EAFs, it still relies on blast furnace supply and does not align with the long-term decarbonization goal of reducing hot metal dependence.

4.1.4. Scrap Preheating: Process and Equipment Drivers of Energy Efficiency

Scrap preheating is a pivotal technological measure for improving EAF energy efficiency and promoting low-carbon steelmaking, as it directly optimizes the energy structure of the smelting process. This study systematically analyzed the impact of scrap preheating temperature on EAF energy consumption and efficiency by integrating numerical simulation and industrial production data, confirming that preheating temperature has a strong linear negative correlation with both specific power consumption and total specific energy consumption. As preheating temperature increases from room temperature to 1000 °C, total external energy consumption decreases from approximately 640 kWh/t to 390 kWh/t, and the underlying mechanism lies in the efficient displacement of high-grade electric energy by the sensible heat stored in preheated scrap—this “sensible heat displacement” effect reduces external electric energy input and enhances overall energy utilization efficiency throughout the entire process.
To further clarify the performance differences of scrap preheating technologies, two typical processes (shaft furnace and Consteel furnace) were compared, considering not only preheating temperature but also their inherent equipment configurations and process characteristics. As revealed from the data inversion in Section 3, the shaft furnace corresponds to a much higher average preheating temperature than the Consteel process, forming a fundamental gap in energy-saving performance between the two technical routes. This temperature gap is essentially driven by differences in equipment and process design.
For the shaft furnace EAF, the core equipment is a vertical preheating shaft, which adopts a countercurrent heat exchange process—high-temperature flue gas flows downward while scrap moves upward, enabling full contact between the two and maximizing heat transfer efficiency. This equipment design not only achieves higher preheating temperatures but also ensures uniform heating of scrap, avoiding local overheating or incomplete preheating and reducing heat loss during the preheating process.
In contrast, the Consteel EAF adopts a continuous charging process; scrap is preheated gradually by flue gas during continuous feeding, which reduces heat loss caused by intermittent charging but has limited heat transfer efficiency due to the lack of a dedicated vertical preheating structure. The relatively simple equipment configuration and non-countercurrent heat exchange process restrict its preheating temperature and energy utilization efficiency.
The comprehensive effect of temperature, equipment, and process leads to significant differences in energy performance: Accordingly, the shaft furnace EAF delivers markedly lower total energy consumption and superior system energy efficiency compared with the Consteel furnace, showing clear technical advantages in energy saving and emission reduction. This confirms that the shaft furnace’s superior preheating equipment (vertical preheating shaft) and more efficient heat exchange process (countercurrent flow) are the core reasons for its better energy-saving and carbon emission reduction effects, making it the optimal choice for EAF low-carbon transformation.

4.2. Practical Implications

Based on the above mechanistic analysis of EAF energy efficiency, practical operational suggestions are proposed to guide industrial energy saving, carbon reduction, and efficiency improvement, aligning with both short-term operational optimization and long-term low-carbon transformation goals.
For conventional EAFs (the main type in current industrial applications), the optimal hot metal ratio should be controlled within the 40–50% range to balance electricity consumption reduction and total energy performance. Excessively high hot metal ratios (>70%) should be avoided, as they lead to increased total energy consumption and do not conform to full-process low-carbon development. Meanwhile, conventional EAFs should prioritize retrofitting with simple scrap preheating equipment to reduce heat loss, laying a foundation for subsequent efficiency improvement.
For industrial upgrading and retrofitting, shaft furnace EAFs are recommended as the preferred route for low-carbon transformation, given their superior energy efficiency driven by the vertical preheating shaft (countercurrent heat exchange equipment) and advanced process design. For enterprises with limited retrofitting investment, Consteel EAFs are a feasible alternative, as their continuous charging process and scrap preheating system can achieve significant efficiency gains with relatively low transformation costs.
Regarding furnace capacity optimization, enterprises should focus on furnace type upgrading rather than blind capacity expansion. Even small-capacity advanced EAFs (shaft or Consteel) can outperform large-capacity conventional EAFs in energy efficiency, confirming that process and equipment advantages are more critical than scale effects.
In terms of long-term low-carbon development, reducing dependence on hot metal is essential. Scrap preheating technology should be widely promoted, as it achieves efficient substitution of electric energy with scrap sensible heat, optimizing the energy structure and promoting full-process decarbonization. The thermodynamic model established in this study can provide theoretical support for the optimization of scrap preheating temperature and hot metal ratio in industrial practice.

4.3. Research Limitations

Despite the systematic investigation of EAF energy efficiency based on industrial data and numerical simulation, this study still has certain limitations that need to be acknowledged. Firstly, the current analysis is primarily based on steady-state operating conditions, and the impact of transient fluctuations in smelting processes (e.g., variations in raw material quality, real-time changes in smelting temperature, and unstable power supply) on energy efficiency has not been fully incorporated into the model. Secondly, in the calculation of energy balance, certain minor heat loss components (e.g., heat dissipation from equipment surfaces and energy loss during material transfer) were simplified, which may lead to slight deviations between the model’s predicted results and actual industrial operation data. Thirdly, this research focuses on the influence of typical factors such as furnace type and hot metal ratio, but the potential interactions between multiple factors (e.g., the synergistic effect of hot metal ratio and preheating temperature on energy efficiency) have not been further explored.
In view of the aforementioned limitations, future research can be carried out in the following directions. First, a dynamic transient model will be established to integrate real-time operating parameters (e.g., raw material composition, smelting temperature, and power input) to improve the accuracy and applicability of the model. Moreover, detailed non-equilibrium reaction kinetics and variable oxidation mechanisms will be incorporated, replacing the current assumptions of equilibrium reactions and fixed oxidation ratios, to better reflect the actual smelting process. Second, more detailed industrial field data will be collected, including the influence of auxiliary material dosage, oxygen injection strategy, and smelting time on energy efficiency, to construct a more comprehensive evaluation system for EAF energy performance. Third, further research will be conducted on the low-carbon transformation path of EAF steelmaking, combining the optimization of process parameters with clean energy substitution, to provide more targeted technical support for the low-carbon development of the steel industry.

5. Conclusions

This study systematically quantifies the energy efficiency disparities among mainstream electric arc furnace (EAF) technologies through integrated industrial statistics and model simulation and clarifies the key factors and optimal operating ranges governing EAF energy performance. The main findings are summarized as follows:
(1) Furnace type is the dominant factor determining EAF energy efficiency. Significant performance gaps exist across four typical EAF groups: all-scrap conventional EAFs, conventional EAFs with hot metal charging, Consteel EAFs, and shaft furnace EAFs. Consteel and shaft furnace EAFs outperform conventional EAFs by enabling efficient flue gas waste heat recovery via continuous feeding and scrap preheating, with shaft furnace EAFs demonstrating the highest energy efficiency and stability.
(2) Furnace capacity exerts a limited effect on energy efficiency. Although larger capacity reduces unit heat loss, its impact is weak and secondary to furnace type, which masks the scale effect in the full sample.
(3) Hot metal ratio primarily reduces on-site power consumption rather than overall energy use. A 10% increase in hot metal ratio lowers power consumption by approximately 50 kWh/t, while total energy consumption follows a U-shaped trend and energy efficiency rises then declines. The optimal hot metal ratio of 40–50% achieves the best trade-off between power demand and total energy performance for conventional EAFs, but this ratio conflicts with low-carbon goals that require reducing blast furnace reliance.
(4) Scrap preheating is the core technical solution for energy saving in all-scrap EAF operations. Each 100 °C increase in preheating temperature reduces power consumption by 25 kWh/t. The shaft furnace process (average preheating temperature of 642 ± 40 °C) outperforms the Consteel process (353 ± 40 °C), delivering a 14% reduction in total energy consumption and an increase in energy efficiency from 71% to 80%.
(5) This study provides practical guidance for EAF energy efficiency optimization and low-carbon transformation. Enterprises should prioritize scrap-preheating equipped furnace types in new construction and retrofitting, while controlling the hot metal ratio within 40–50% for conventional EAFs. The findings offer quantitative references for balancing raw material structure and process technology, supporting the sustainable development of EAF short-flow steelmaking.

Author Contributions

Conceptualization, G.W. and F.L.; methodology, H.Z.; validation, S.H., X.Z. and J.W.; formal analysis, H.Z.; investigation, S.H.; resources, X.Z., J.W. and X.L.; data curation, S.H., X.Z., J.W. and X.L.; writing—original draft preparation, H.Z.; writing—review and editing, G.W. and F.L.; visualization, H.Z.; supervision, G.W. and F.L.; project administration, G.W. and F.L.; funding acquisition, G.W. and F.L. All authors have read and agreed to the published version of the manuscript.

Funding

This work was supported by the Jing-Jin-Ji Regional Integrated Environmental Improvement-National Science and Technology Grant No. 2025ZD1206102; National Natural Science Foundation of China Grant Nos. 52322407 & 52293392 & 52274313; Fundamental Research Funds for the Central Universities Grant No. FRF-TP-24-06C; Fundamental and Interdisciplinary Disciplines Breakthrough Plan of the Ministry of Education of China Grant No. JYB2025XDXM405.

Data Availability Statement

The data presented in this study are available on request from the corresponding author. The data are not publicly available due to industrial confidentiality agreements with the participating steel plants.

Conflicts of Interest

Xiaodan Zhong was employed by the company Special Steel Business Division, Benxi Iron and Steel Group Co., Ltd. Jianzhong Wang was employed by the company Zhangxuan Technology, HBIS Group. Xiaoyun Luo was employed by the company Jingjiang Special Steel Co., Ltd., CITIC Pacific Special Steel Group. The remaining authors declare that the research was conducted in the absence of any commercial or financial relationships that could be construed as a potential conflict of interest.

Nomenclature

TermDefinitionUnit
Energy consumption Total external energy input per ton of steel, including electricity, hot metal energy, and fuel inputskWh/t
Electricity consumptionElectrical energy consumed per ton of steelkWh/t
External energyEnergy supplied from outside the EAF system, excluding internal waste heat recoverykWh/t
Chemical energyEnergy released from oxidation reactions (C, Si, Mn) in hot metalkWh/t
Sensible heatThermal energy stored in materials proportional to temperaturekWh/t
Hot metal ratioMass fraction of hot metal in the total charge%
Scrap preheating temperatureAverage temperature of scrap after preheating by flue gas waste heat°C
Energy efficiencyRatio of effective energy for steelmaking to total external energy input%
Consteel EAFEAF with continuous scrap charging and flue gas preheating
Shaft furnace EAFEAF equipped with a vertical preheating shaft for countercurrent heat exchange

References

  1. Quader, M.A.; Ahmed, S.; Ghazilla, R.A.R.; Ahmed, S.; Dahari, M. A comprehensive review on energy efficient CO2 breakthrough technologies for sustainable green iron and steel manufacturing. Renew. Sust. Energ. Rev. 2015, 50, 594. [Google Scholar]
  2. Na, H.; Du, T.; Sun, W.; He, J.; Sun, J.; Yuan, Y.; Qiu, Z. Review of evaluation methodologies and influencing factors for energy efficiency of the iron and steel industry. Int. J. Energy Res. 2019, 43, 5659. [Google Scholar] [CrossRef]
  3. Association, China Iron and Steel Industry Yearbook 2020; Metallurgical Industry Press: Beijing, China, 2021.
  4. Kirschen, M.; Risonarta, V.; Pfeifer, H. Energy efficiency and the influence of gas burners to the energy related carbon dioxide emissions of electric arc furnaces in steel industry. Energy 2009, 34, 1065. [Google Scholar] [CrossRef]
  5. Tian, B.; Wei, G.; Li, X.; Zhu, R.; Bai, H.; Tian, W.; Dong, K. Effect of hot metal charging on economic and environmental indices of electric arc furnace steelmaking in China. J. Clean. Prod. 2022, 379, 134597. [Google Scholar] [CrossRef]
  6. Lu, Z.; Cai, J.; Du, T.; Yue, Q.; Gao, C.; Wang, H. The macro-control on energy consumption, material consumption & waste emission of steel industry. Strateg. Study Chin. Acad. Eng. 2015, 17, 126–132. [Google Scholar]
  7. Irawan, A.; Kurniawan, T.; Alwan, H.; Muslim, Z.A.; Akhmal, H.; Firdaus, M.A.; Bindar, Y. An energy optimization study of the electric arc furnace from the steelmaking process with hot metal charging. Heliyon 2022, 8, 11448. [Google Scholar] [CrossRef] [PubMed]
  8. Pfeifer, H.; Kirschen, M. Thermodynamic analysis of EAF energy efficiency and comparison with a statistical model of electric energy demand. In Proceedings of the 7th European Electric Steelmaking Conference, Venice, Italy, 26–29, May 2002; p. 1. [Google Scholar]
  9. Qian, F.; Zhong, W.; Du, W. Fundamental Theories and Key Technologies for Smart and Optimal Manufacturing in the Process Industry. Engineering 2017, 3, 154–160. [Google Scholar] [CrossRef]
  10. Hay, T.; Visuri, V.-V.; Aula, M.; Echterhof, T. A Review of Mathematical Process Models for the Electric Arc Furnace Process. Steel Res. Int. 2020, 92, 2000395. [Google Scholar] [CrossRef]
  11. Çamdali, Ü.; Tunç, M.; Karakaş, A. Second law analysis of thermodynamics in the electric arc furnace at a steel producing company. Energy Convers. Manag. 2003, 44, 961–973. [Google Scholar] [CrossRef]
  12. Chirattananon, S.; Gao, Z. A model for the performance evaluation of the operation of electric arc furnace. Energy Convers. Manag. 1996, 37, 161–166. [Google Scholar] [CrossRef]
  13. Babos, L.; Martegani, A.D. Energy conservation and recovery in electric arc furnaces dedusting plants. Energy Convers. Manag. 1982, 22, 347–355. [Google Scholar] [CrossRef]
  14. Trejo, E.; Martell, F.; Micheloud, O.; Teng, L.; Llamas, A.; Montesinos-Castellanos, A. A novel estimation of electrical and cooling losses in electric arc furnaces. Energy 2012, 42, 446–456. [Google Scholar] [CrossRef]
  15. Khodabandeh, E.; Ghaderi, M.; Afzalabadi, A.; Rouboa, A.; Salarifard, A. Parametric study of heat transfer in an electric arc furnace and cooling system. Appl. Therm. Eng. 2017, 123, 1190–1200. [Google Scholar] [CrossRef]
  16. Yigit, C.; Coskun, G.; Buyukkaya, E.; Durmaz, U.; Güven, H.R. CFD modeling of carbon combustion and electrode radiation in an electric arc furnace. Appl. Therm. Eng. 2015, 90, 831–837. [Google Scholar] [CrossRef]
  17. Khodabandeh, E.; Rahbari, A.; Rosen, M.A.; Najafian Ashrafi, Z.; Akbari, O.A.; Anvari, A.M. Experimental and numerical investigations on heat transfer of a water-cooled lance for blowing oxidizing gas in an electrical arc furnace. Energy Convers. Manag. 2017, 148, 43–56. [Google Scholar] [CrossRef]
  18. Kirschen, M.; Velikorodov, V.; Pfeifer, H. Mathematical modelling of heat transfer in dedusting plants and comparison to off-gas measurements at electric arc furnaces. Energy 2006, 31, 2926–2939. [Google Scholar] [CrossRef]
  19. Kirschen, M.; Pfeifer, H.; Wahlers, F.-J.; Mees, H. Off-gas measurements for mass and energy balances of a stainless steel EAF. In Electric Furnace Conference Proceedings, Dallas, Texas, USA, 11 November 2001–14 November 2026; Iron and Steel Society (ISS): Warrendale, PA, USA, 2001; pp. 737–748. [Google Scholar]
  20. Kirschen, M.; Badr, K.; Pfeifer, H. Influence of direct reduced iron on the energy balance of the electric arc furnace in steel industry. Energy 2011, 36, 6146–6155. [Google Scholar] [CrossRef]
  21. Pfeifer, H.; Kirschen, M.; Simoes, J.P. Thermodynamic analysis of electrical energy demand. In Proceedings of the 8th European Electric Steelmaking Conference, Birmingham, UK, 9–11 May 2005; p. 9. [Google Scholar]
  22. Chen, Y.; Li, S.Q.; Ji, S.J.; Liu, R. Theory and practice of the optimizing of charging structure in EAF steelmaking. J. Univ. Sci. Technol. Beijing 2005, 12, 313. [Google Scholar]
  23. Duan, J.-P.; Zhang, Y.-L.; Yang, X.-M. EAF steelmaking process with increasing hot metal charging ratio and improving slagging regime. Int. J. Miner. Metall. Mater. 2009, 16, 375. [Google Scholar] [CrossRef]
  24. Hernández, J.D.; Onofri, L.; Engell, S. Modeling and Energy Efficiency Analysis of the Steelmaking Process in an Electric Arc Furnace, Metall. Mater. Trans. B 2022, 53, 3413. [Google Scholar] [CrossRef]
  25. Manojlović, V.; Kamberović, Ž.; Korać, M.; Dotlić, M. Machine learning analysis of electric arc furnace process for the evaluation of energy efficiency parameters. Appl. Energy 2022, 307, 118209. [Google Scholar] [CrossRef]
  26. Yang, L.; Li, Z.; Hu, H.; Zou, Y.; Feng, Z.; Chen, W.; Chen, F.; Wang, S.; Guo, Y. Evaluation of energy utilization efficiency and optimal energy matching model of EAF steelmaking based on association rule mining. Metals 2024, 14, 458. [Google Scholar] [CrossRef]
  27. Lu, H.; Zhu, H.; Jiang, Z.; Li, H.; Yang, C. A novel hybrid framework for precise electric energy consumption prediction in steel production via electric arc furnace: Coupling mechanistic models with advanced data-driven algorithms. Metall. Mater. Trans. B 2026, 57, 1865–1883. [Google Scholar] [CrossRef]
  28. Al-Harbi, M.N.; Pistorius, P.C. Feature engineering to embed process knowledge: Analyzing the energy efficiency of electric arc furnace steelmaking. Metals 2024, 15, 13. [Google Scholar] [CrossRef]
  29. Yi, X.; Yue, Q.; Dou, Z.; Bu, Q. Enhancing efficiency in electric arc furnace steelmaking: A multi-objective optimization approach using the non-dominated sorting genetic algorithm II. Steel Res. Int. 2025, 96, 2400370. [Google Scholar] [CrossRef]
  30. Carlsson, L.S.; Samuelsson, P.B.; Jönsson, P.G. Modeling the effect of scrap on the electrical energy consumption of an electric arc furnace. Processes 2020, 8, 1044. [Google Scholar] [CrossRef]
  31. Carlsson, L.S.; Samuelsson, P.B.; Jönsson, P.G. Predicting the electrical energy consumption of electric arc furnaces using statistical modeling. Metals 2019, 9, 959. [Google Scholar] [CrossRef]
  32. Jawahery, S.; Visuri, V.-V.; Wasbø, S.O.; Hammervold, A.; Hyttinen, N.; Schlautmann, M. Thermophysical model for online optimization and control of the electric arc furnace. Metals 2021, 11, 1587. [Google Scholar] [CrossRef]
  33. Opitz, F.; Treffinger, P. Physics-based modeling of electric operation, heat transfer, and scrap melting in an AC electric arc furnace. Metall. Mater. Trans. B 2016, 47, 1489–1503. [Google Scholar] [CrossRef]
  34. Tomažič, S.; Andonovski, G.; Škrjanc, I.; Logar, V. Data-driven modelling and optimization of energy consumption in EAF. Metals 2022, 12, 816. [Google Scholar] [CrossRef]
  35. Matino, I.; Alcamisi, E.; Colla, V.; Baragiola, S.; Moni, P. Process modelling and simulation of electric arc furnace steelmaking to allow prognostic evaluations of process environmental and energy impacts. Matériaux Tech. 2016, 104, 104. [Google Scholar] [CrossRef]
  36. Rong, Z.; Bohan, T. Cost analysis and cost reduction of EAF steel. Henan Metall. 2019, 27, 1. [Google Scholar]
  37. Chen, Q.; Gu, Y.; Tang, Z.; Wei, W.; Sun, Y. Assessment of low-carbon iron and steel production with CO2 recycling and utilization technologies: A case study in China. Appl. Energy 2018, 220, 192. [Google Scholar] [CrossRef]
  38. Li, L.F.; Hu, Y.B. Energy Balance and Energy Efficiency Analysis of 100t Consteel Electric Arc Furnace with All Scrap. In Proceedings of the 14th China Iron and Steel Annual Conference—5. Electrometallurgy and Scrap Steel, Chongqing, China, 25–26 October 2023; pp. 15–24. [Google Scholar]
  39. Lee, B.; Ryu, J.W.; Sohn, I. Effect of Hot Metal Utilization on the Steelmaking Process Parameters in the Electric Arc Furnace. J. Iron Steel Res. Int. 2015, 86, 302. [Google Scholar] [CrossRef]
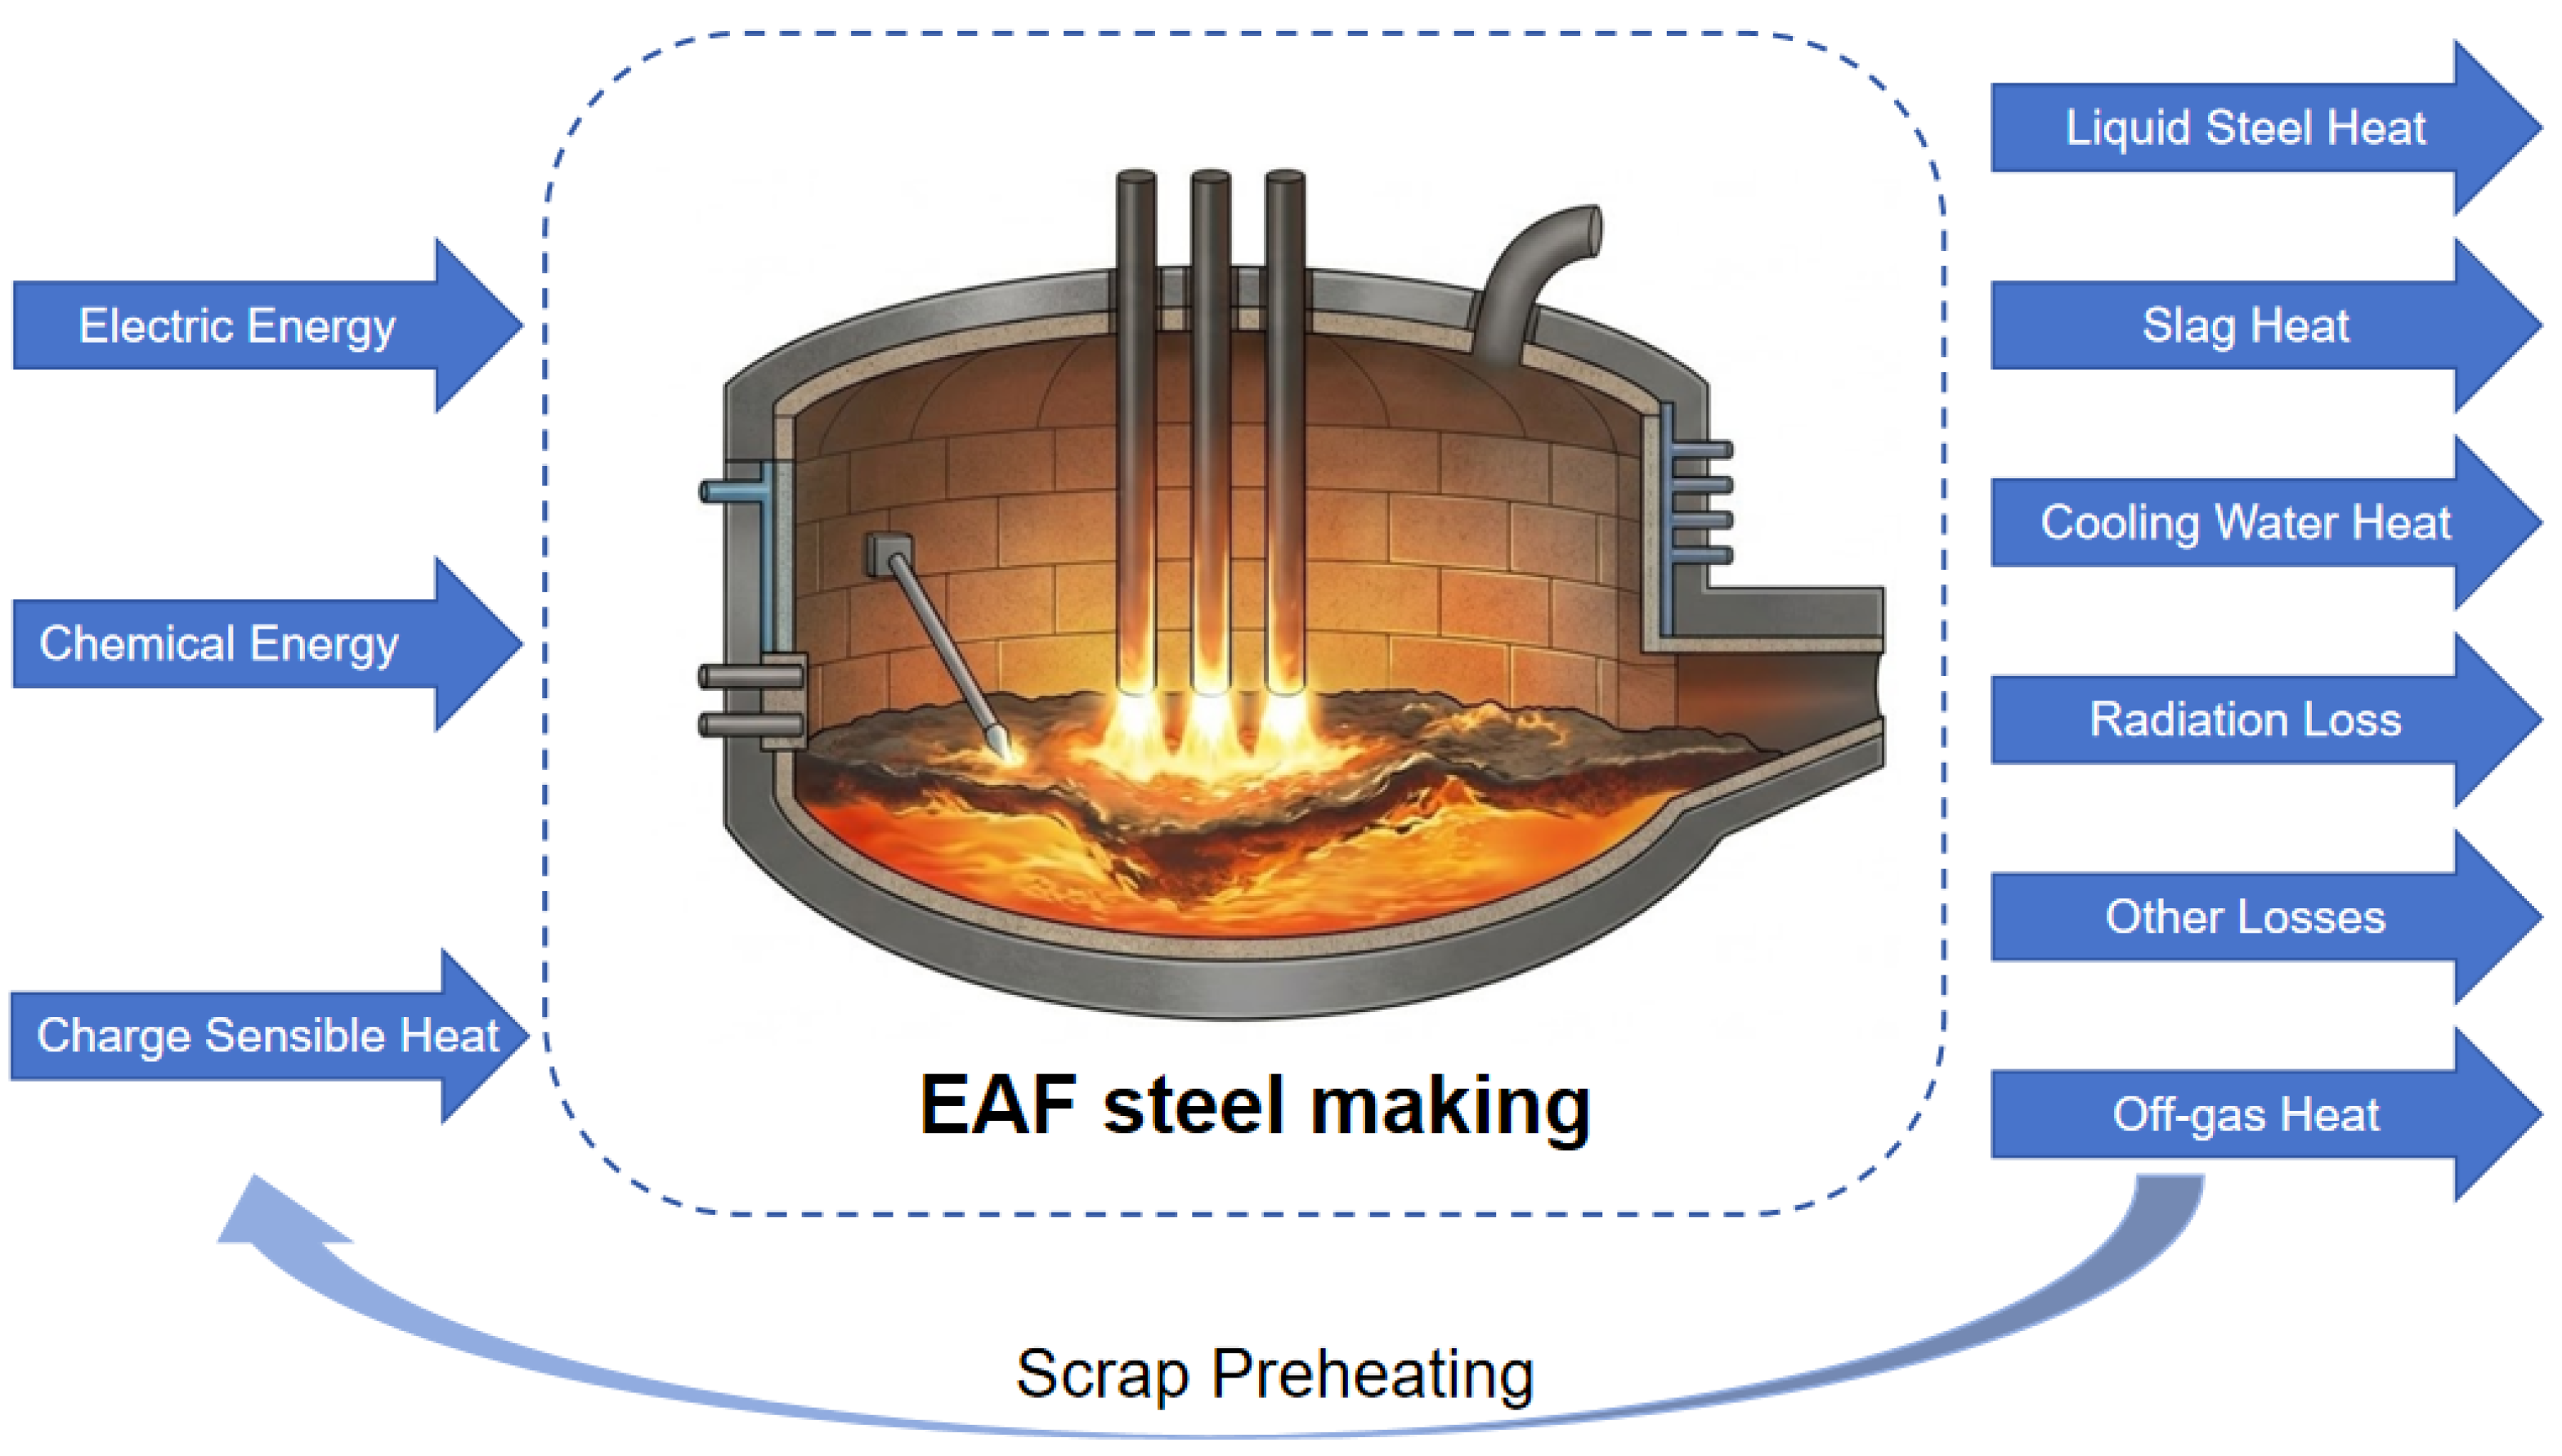
Figure 1. Energy flow schematic of EAF steelmaking.
Metals 16 00594 g001
Figure 2. Comparison between predicted and actual electricity consumption of EAF (green dashed lines represent ±10 kWh/t error band).
Metals 16 00594 g002
Figure 3. Residual analysis of EAF electricity consumption prediction model.
Metals 16 00594 g003
Figure 4. Overall distribution of energy efficiency indicators for 56 EAFs. (a) Distribution of electricity consumption. (b) Distribution of total energy consumption. (c) Distribution of energy efficiency.
Metals 16 00594 g004
Figure 5. Proportion distribution of furnace types of 56 investigated EAFs.
Metals 16 00594 g005
Figure 6. Distribution of energy consumption and efficiency for different EAF types: (a) specific electric energy consumption; (b) specific total energy consumption; (c) energy efficiency.
Metals 16 00594 g006
Figure 7. Distribution of furnace capacity for the 56 investigated EAFs.
Metals 16 00594 g007
Figure 8. Distribution of energy efficiency indicators of EAFs with different furnace capacities: (a) specific electric energy consumption; (b) specific total energy consumption; (c) energy efficiency.
Metals 16 00594 g008
Figure 9. Distribution of hot metal charging ratio in conventional EAFs.
Metals 16 00594 g009
Figure 10. Distribution of EAF energy efficiency indicators under different hot metal ratios: (a) specific electric energy consumption; (b) specific total energy consumption; (c) energy efficiency.
Metals 16 00594 g010
Figure 11. Simulation results of input energy structure in conventional EAFs under different hot metal charging ratios.
Metals 16 00594 g011
Figure 12. Comparison and verification between calculated results and measured data: (a) specific power consumption; (b) specific total energy consumption; Note: The data in the full scrap steel region (0% hot metal ratio) were excluded due to the large dispersion of industrial data.
Metals 16 00594 g012
Figure 13. Relationship between scrap preheating temperature and specific electricity consumption.
Metals 16 00594 g013
Figure 14. Relationship between scrap preheating temperature and specific energy consumption.
Metals 16 00594 g014
Figure 15. Relationship between scrap preheating temperature and energy efficiency.
Metals 16 00594 g015
Figure 16. Simulation of the effect of scrap preheating temperature on EAF energy structure.
Metals 16 00594 g016
Table 1. Statistics of basic information of investigated EAFs.
Furnace TypeProduced Steel Grades
Conventional EAFConsteel EAFShaft Furnace
EAF
Carbon SteelAlloy SteelStainless Steel
3416642104
Table 2. Basic parameters of investigated EAFs.
Furnace TypeFurnace Capacity/tTransformer Capacity
/MVA
Hot Metal Ratio
/%
Electric Consumption
/kWh/t
Tap-to-Tap Time
/min
Oxygen Consumption
/Nm3/h
Conventional EAF30~1509~1550~82.70~48035~13322~58
Consteel
EAF
50~13035~1000~83.80~41035~7025~45
Shaft Furnace
EAF
60~13036~1400~39.4175~33530~6525~49
Table 3. Basic information of high-frequency production sample EAF.
ItemParameter
Furnace TypeTop-charged Conventional EAF
Furnace Capacity100 t
Raw Material Charge49% Hot Metal + 51% Scrap
Transformer72 MVA, 602~876 V, 12 tap positions
Oxygen Lances4 lances (2500 Nm3/h × 4)
Carbon Injection Lances2 lances (60 kg/min × 2)
Tap-to-Tap Time38 min
Specific Power Consumption175 kWh/t
Table 4. Released chemical energy for main oxidation reactions in EAF steelmaking at 1585 °C [38].
Chemical ReactionReleased Chemical Energy
C + 0.5 O2 → CO2.73 kWh/kg (C)
C + O2 → CO29.19 kWh/kg (C)
[C] + 0.5 O2 → CO3.22 kWh/kg ([C])
[C] + O2 → CO29.68 kWh/kg ([C])
[Fe] + 0.5 O2 → (FeO)1.27 kWh/kg ([Fe])
2[Fe] + 1.5 O2 → (Fe2O3)2.06 kWh/kg ([Fe])
[Si] + O2 → (SiO2)7.67 kWh/kg ([Si])
2[Al] + 1.5 O2 → (Al2O3)8.20 kWh/kg ([Al])
[Mn] + 0.5 O2 → (MnO)2.04 kWh/kg ([Mn])
2[P] + 2.5 O2 → (P2O5)5.87 kWh/kg ([P])
Disclaimer/Publisher’s Note: The statements, opinions and data contained in all publications are solely those of the individual author(s) and contributor(s) and not of MDPI and/or the editor(s). MDPI and/or the editor(s) disclaim responsibility for any injury to people or property resulting from any ideas, methods, instructions or products referred to in the content.