1. Introduction
The wrought aluminum (Al) alloy AlMg4.5Mn0.7 (numerical symbol EN AW-5083) offers an attractive combination of low density, high specific properties, corrosion resistance, weldability, superplasticity [
1], and formability [
2]. This combination of properties enables EN AW-5083 to be used in various sectors, such as the automotive, shipbuilding, and construction industries [
3]. As EN AW-5083 is not heat-treatable, its mechanical properties and corrosion resistance are improved by work hardening and solid solution strengthening. Both strengthening mechanisms result from using magnesium (Mg) as the primary alloying element (Mg content above 3.5 wt.%) [
4]. Work hardening, or strain hardening, is achieved by mechanical processing, often combined with annealing to develop the required properties [
5]. This hardening mechanism is based on the formation, multiplication, movement, and annihilation of dislocations [
6]. In the 5xxx series of aluminum alloys, Mg additions increase the work-hardening rate [
7] by suppressing dynamic recovery and influencing grain refinement during severe plastic deformation [
8,
9]. In the aluminum–magnesium (Al-Mg) system, both elements have high mutual solid solubility, which leads to an increase in lattice misfit strain and solid solution strengthening [
10]. The maximum solid solubility of Mg in a α
Al solid solution decreases from 17.4 wt.% at the eutectic temperature of 437.0 °C to 1.8 wt.% at room temperature. In the Al-rich corner of the binary Al-Mg system, Al
8Mg
5 (β) solidifies from the Liquid (L) as a stable eutectic phase [
11,
12]. Due to the similarity in Mg content between the Liquid (L) (38.5 at.%) and Al
8Mg
5 (β) phase (38.5 at.%), the congruent melting point is registered at 451.0 °C [
13,
14]. The eutectic reaction is preceded by the precipitation of metastable phases, as indicated by Equation (1) [
15]:
Depending on the Mg content, Guinier–Preston zones (GP) can precipitate from the supersaturated α
Al solid solution (SSS) at a temperature of 110.0 °C [
13]. The metastable Al
3Mg (β″) phase with needle-like morphology [
16] forms by the martensitic transformation of globular Guinier–Preston zones (GP) at temperatures of 180.0 °C [
17]. Transformation of Al
3Mg (β″) into the Widmannstätten Al
8Mg
5 (β′) phase was observed during isothermal artificial aging at 150.0 °C. This phase remains stable for a long aging time and eventually transitions completely into the equilibrium eutectic Al
8Mg
5 (β) phase [
15]. Apart from the eutectic reaction, heterogeneous nucleation and growth of Al
8Mg
5 (β) can occur due to Mg segregation at α
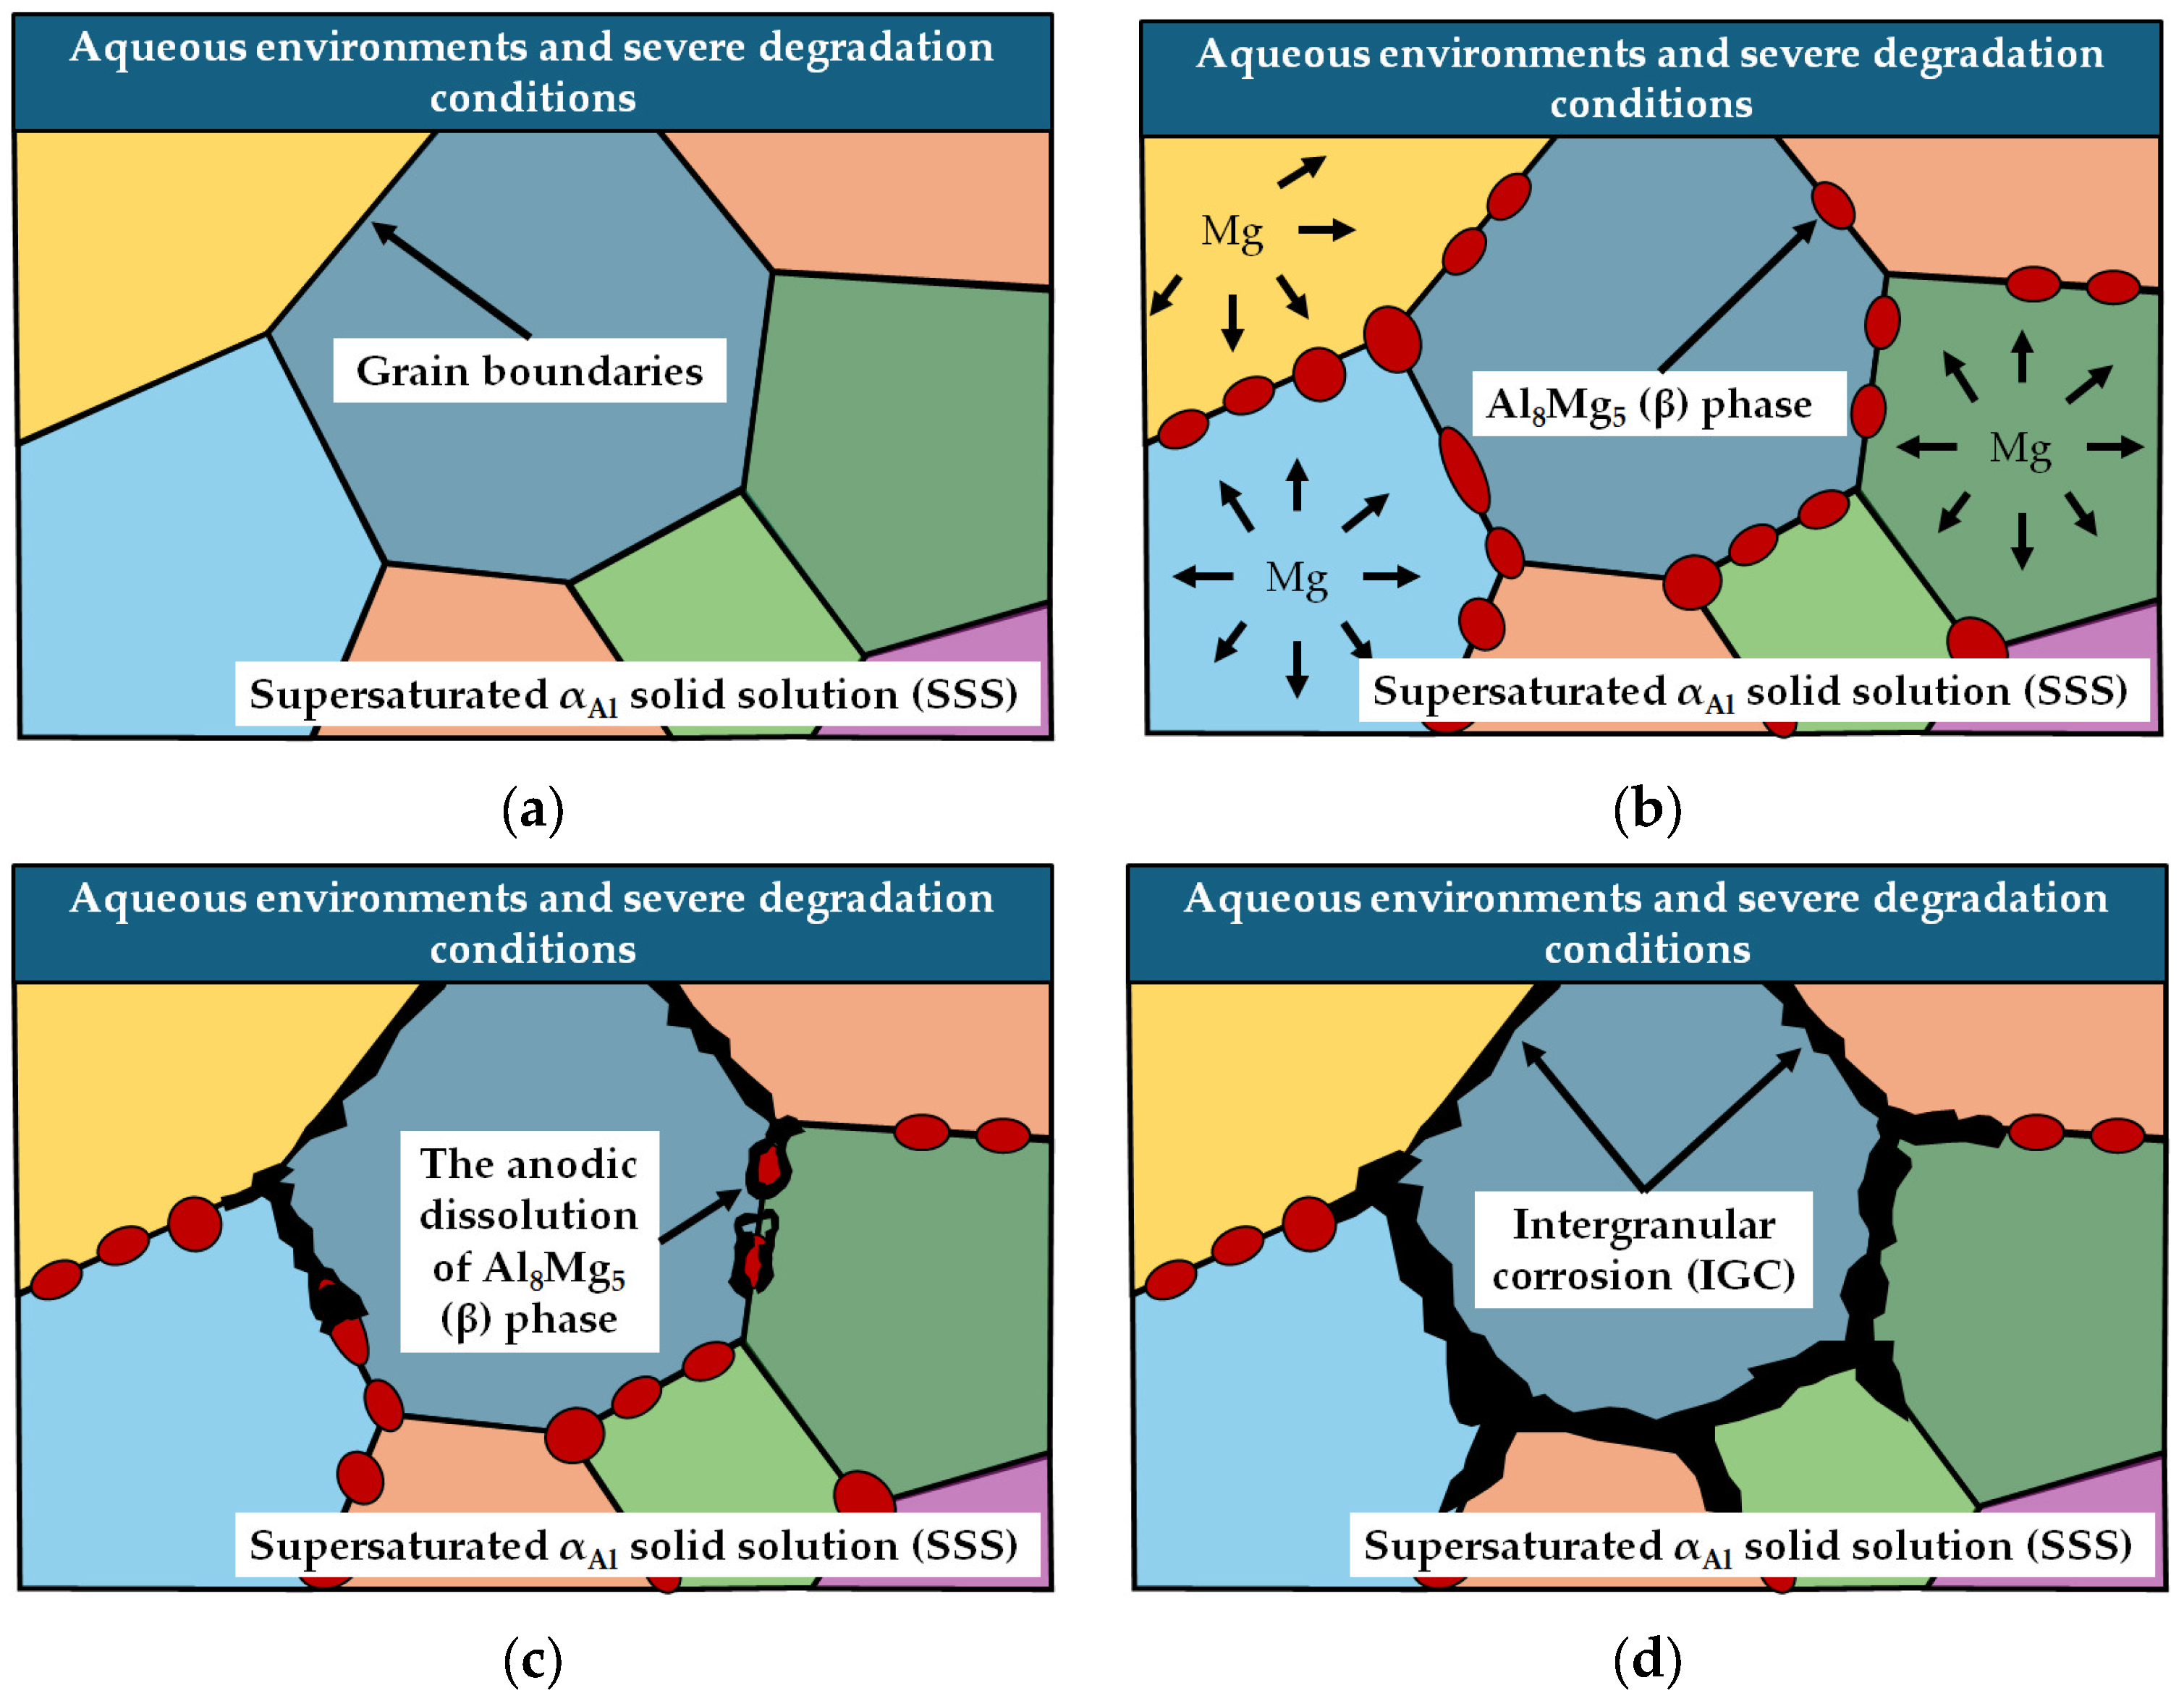
Al grain boundaries during natural or artificial aging at moderate temperatures [
18] (
Figure 1a,b). This behavior is described as sensitization [
18,
19] (
Figure 1b).
The Al
8Mg
5 (β) phase is hard and brittle [
21], solidifying along grain boundaries in a semi-continuous or continuous structure [
4]. It adversely affects mechanical properties and corrosion resistance [
21]. Due to the difference in corrosion potential between the α
Al matrix (−0.82 V vs. saturated calomel electrode (SCE) [
6]) and the Al
8Mg
5 (β) phase (−1.15 V vs. SCE [
6]), galvanic activity and anodic dissolution can occur when exposed to aqueous environments and severe degradation conditions [
22] (
Figure 1c). In addition to the anodic potential, the continuous morphology of the Al
8Mg
5 (β) phase is the main reason for exfoliation, intergranular corrosion cracking (IGC), or stress corrosion cracking (SCC) at standard service temperatures (>35.0 °C) [
23,
24] (
Figure 1d). The degree of sensitization is influenced by chemical composition, thermo-mechanical processing, microstructural constituent development [
25,
26], and the type of degradation environment [
27]. Besides Mg as the main alloying element, EN AW-5083 also contains additional alloying elements such as silicon (Si), iron (Fe), copper (Cu), manganese (Mn), chromium (Cr), zinc (Zn), and titanium (Ti) [
28]. These ancillary elements increase the degree of sensitization and influence the corrosion behavior of EN AW-5083 by promoting solidification and precipitation of secondary intermetallic phases [
29]. As the electrochemical activity of Mn, Fe, Cu, Zn, Ti, and Cr is lower compared to the α
Al solid solution, intermetallic phases containing these elements usually act as cathodic sites in the galvanic process [
30]. The formation of anodic Al-Mg, Al(Si,Mg), and Mg-Si phases, together with cathodic Al(Mn,Fe,Cr) phases, promotes sensitization [
31]. As a result, the alloy becomes susceptible to localized corrosion such as pitting, IGC, and SCC [
32]. When the Al
8Mg
5 (β), Al
3Mg
5 (γ), and Mg
2Si anodic phases are affected by galvanic activity, rapid localized attack and pitting occur, resulting in dissolution of the secondary phase [
33]. However, further investigations have shown that the electrochemical behavior of Al
8Mg
5 (β) and Mg
2Si phases depends on the pH value of the degradation environment [
34,
35]. If the pH of the degradation environment is below 2, Al and Mg are dissolved. In the pH range between 3.5 and 12, selective dissolution of Mg takes place. Therefore, the Mg
2Si phase can become cathodic in a pH range of 3.5 to 12 due to selective dissolution of Mg, while the Al
8Mg
5 (β) phase becomes cathodic at a pH above 12 [
36]. Fe-bearing intermetallic phases promote cathodic activity, leading to dissolution of the surrounding α
Al matrix, a local increase in pH, and the formation of alkaline pits [
37,
38].
The negative effect of electrochemically active intermetallic phases on the sensitization and corrosion resistance of EN AW-5083 can be reduced by homogenization heat treatment [
39]. Homogenization is a high-temperature heat treatment process involving heating and cooling steps at temperatures between 450.0 °C and 600.0 °C [
40]. The redistribution of solute elements and microstructure development during homogenization are affected by the chemical composition of the alloy [
41]. Research on EN AW-5083 synthesized under laboratory conditions [
42] has shown that homogenization affects Mg and Mn segregations differently. While Mg segregations at the grain boundaries are easily redistributed, the influence of homogenization on Mn segregations is weaker and leads to preferential precipitation of Al
4Mn over Al
6Mn. When peritectic-forming elements such as Cr and Ti are present in the alloy, the formation of Al
11(Mn,Cr) (v) and Al
18Mg
3(Mn,Cr)
2 (τ) complex intermetallic dispersoids is expected [
42,
43]. Low-temperature homogenization at 430.0 °C does not lead to dissolution of the intermetallic phases but causes coarsening of the Mg
2Si phase. Increasing the homogenization temperature to 555.0 °C results in complete dissolution of the Mg
2Si phase and partial dissolution of the eutectic Al
8Mg
5 (β) and Al
11(Mn,Cr)
4 dispersoids. Partial dissolution of the Al
8Mg
5 (β) phase during homogenization affects its continuous morphology [
15,
44,
45]. Fe-bearing intermetallic phases generally remain stable during homogenization and may undergo compositional or morphological modification. Previous studies on Al-Mg alloys subjected to homogenization treatments at temperatures around 480–500 °C indicate that Al
6(Fe,Mn) can develop into more complex Fe-bearing phases, including the Al
13(Fe,Mn)
4 and Al(Fe,Mn)Si-type intermetallic phase [
41]. These microstructural changes are accompanied by the formation of precipitate-free zones (PFZ) and pores [
43].
This paper analyses the effect of microstructure development on the corrosion behavior of EN AW-5083 in both as-cast and homogenized conditions when exposed to a severe degradation environment. Based on previous research results, the following hypotheses can be proposed:
In the as-cast condition of the EN AW-5083 alloy, the microstructure is expected to contain both anodic and cathodic intermetallic phases.
Homogenization heat treatment will reduce the sensitization effect by altering the formation and distribution of anodic and cathodic phases.
To test the proposed hypotheses, samples were taken from an industrially produced EN AW-5083 ingot obtained by a semi-continuous vertical direct water-cooled (Direct Chill) casting process. The sampled material was homogenized in a salt bath at 520 °C for 10 h. Electrochemical testing, including time-dependent open circuit potential (OCP) measurements and Tafel polarization analyses, was performed to evaluate alloy stability, corrosion potential, and corrosion rate in a solution simulating material degradation under outdoor exposure conditions. Assessing the corrosion behavior of EN AW-5083 in marine, industrial, and transportation environments is essential due to its widespread use in shipbuilding, offshore structures, and transportation systems. Since the EXCO solution represents severe environmental conditions, it may also be relevant for evaluating the alloy’s performance in more aggressive service environments beyond its conventional applications, including pipelines, tanks, protective linings, and components used for transferring acidic media in metal leaching processes, the battery industry, mining, and chemical surface treatment systems.
These conditions promote sensitization and localized corrosion, which can significantly reduce the service life and structural integrity of aluminum components [
46,
47,
48,
49]. The relationship between microstructural development and corrosion resistance is investigated through metallographic characterization before and after accelerated degradation. By comparing both metallurgical conditions, the study evaluates how microstructural constituents affect the degradation behavior of EN AW-5083. Unlike previous studies conducted primarily in neutral environments, this work examines corrosion under more aggressive acidic conditions, where interactions between Al
8Mg
5 (β), Fe-bearing intermetallic phases, and the α
Al matrix are expected to have a more pronounced role.
2. Materials and Methods
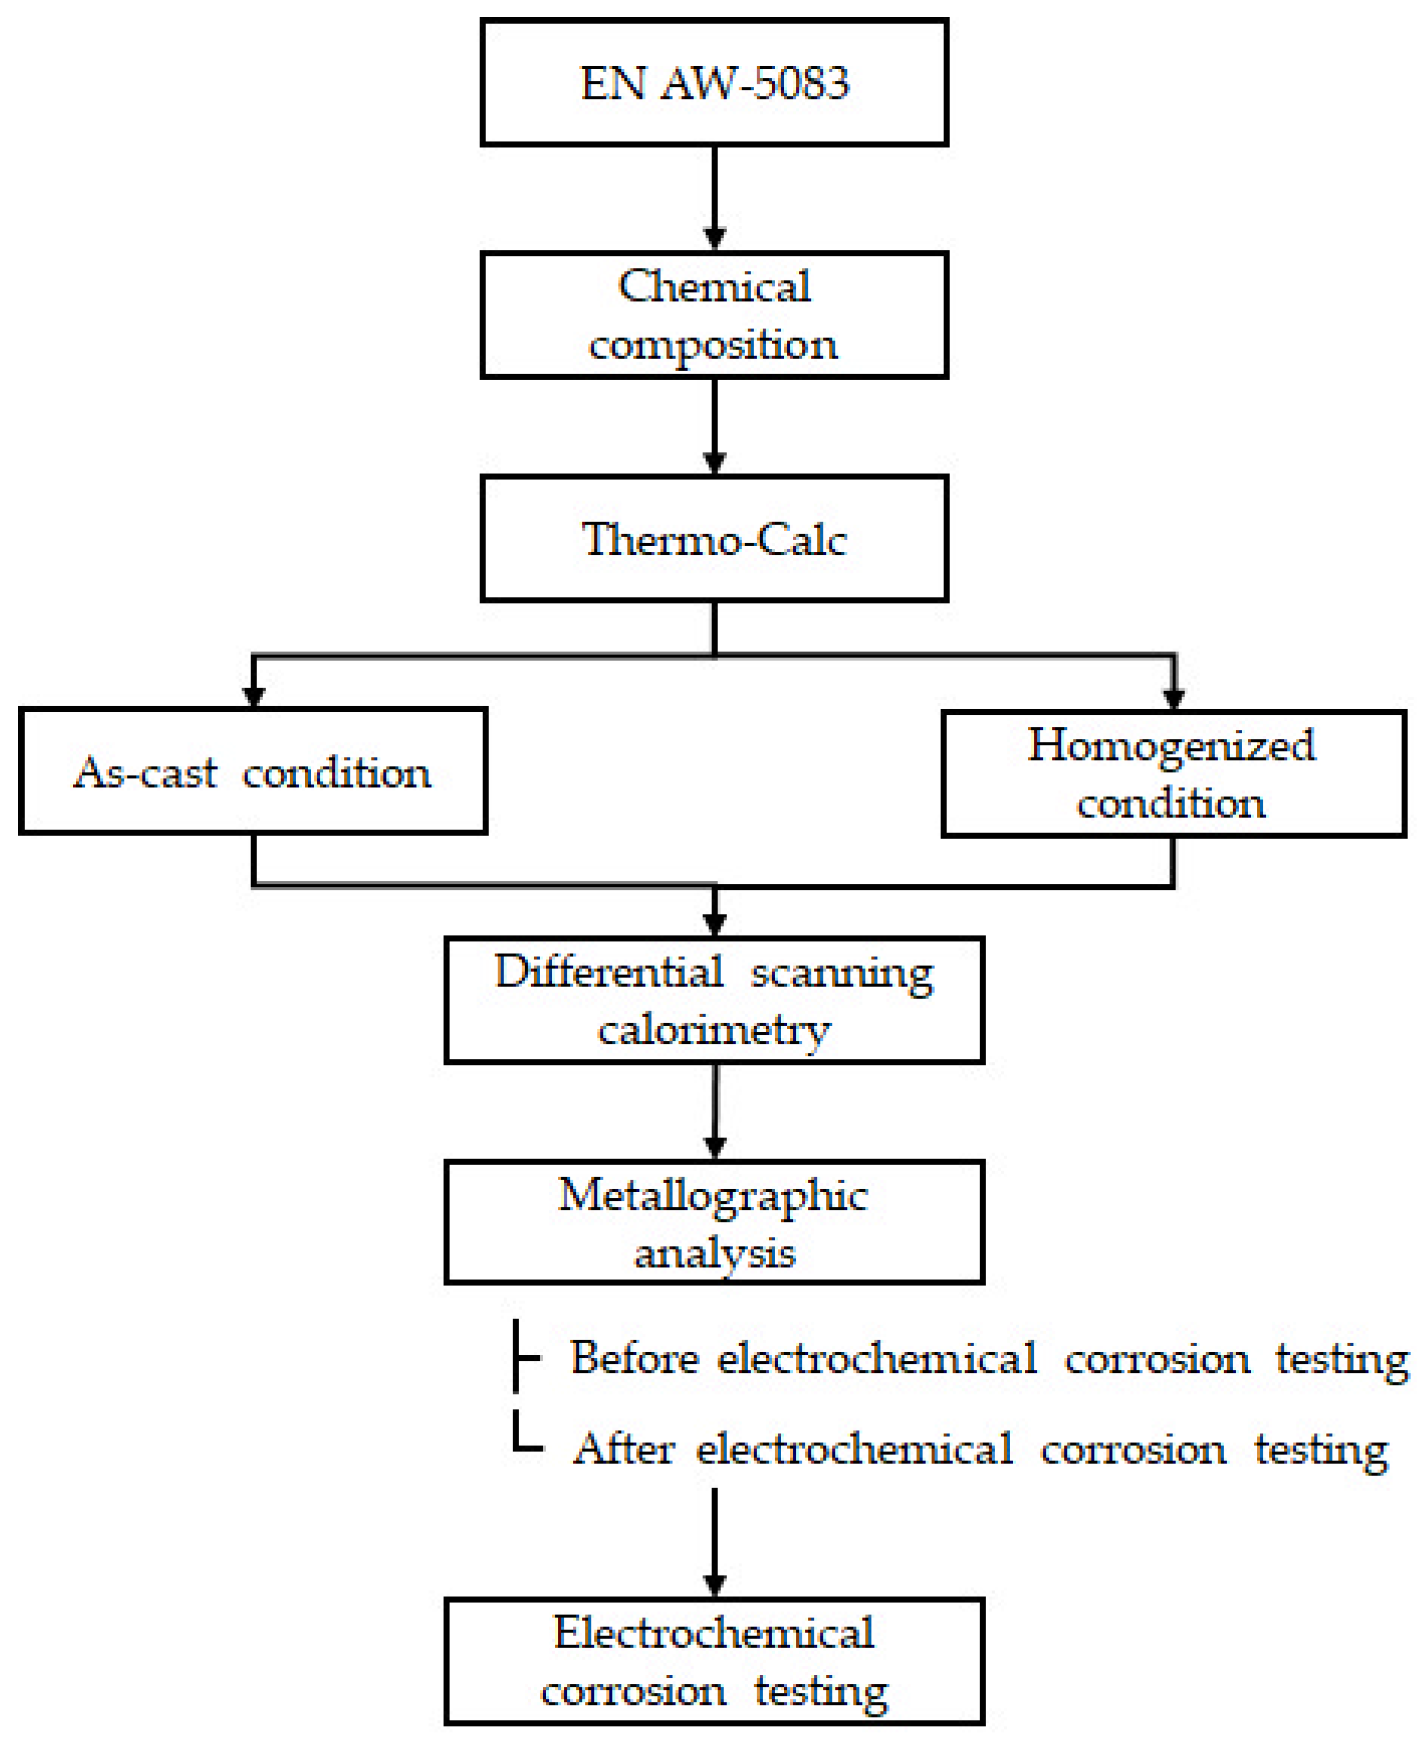
The experimental setup used to evaluate the corrosion resistance of the EN AW-5083 alloy in different metallurgical conditions is shown in
Figure 2.
To verify the proposed hypotheses, the experimental plan was designed to evaluate how microstructure development influences the corrosion behavior of the EN AW-5083 alloy in both as-cast and homogenized conditions. After sampling, the chemical composition was determined and the solidification sequence calculated to assess the expected formation of anodic and cathodic intermetallic phases. Homogenization was followed by differential scanning calorimetry (DSC) analysis to identify the characteristic temperatures and main solidification events. Metallographic characterization was performed before and after electrochemical testing for both metallurgical conditions, enabling verification of the proposed hypotheses.
The EN AW-5083 ingot was produced by the Direct Chill casting process. The charge material was melted and homogenized in a melting furnace, where the chemical composition was adjusted and the melt was degassed and purified from inclusions. After reaching the required chemical composition and casting temperature, the melt was transferred to the casting furnace for final purification and grain refinement using an AlTi5B master alloy. Final melt treatment included degassing and filtration prior to casting. The resulting ingot had dimensions of 520 mm × 1680 mm × 4809 mm [
48].
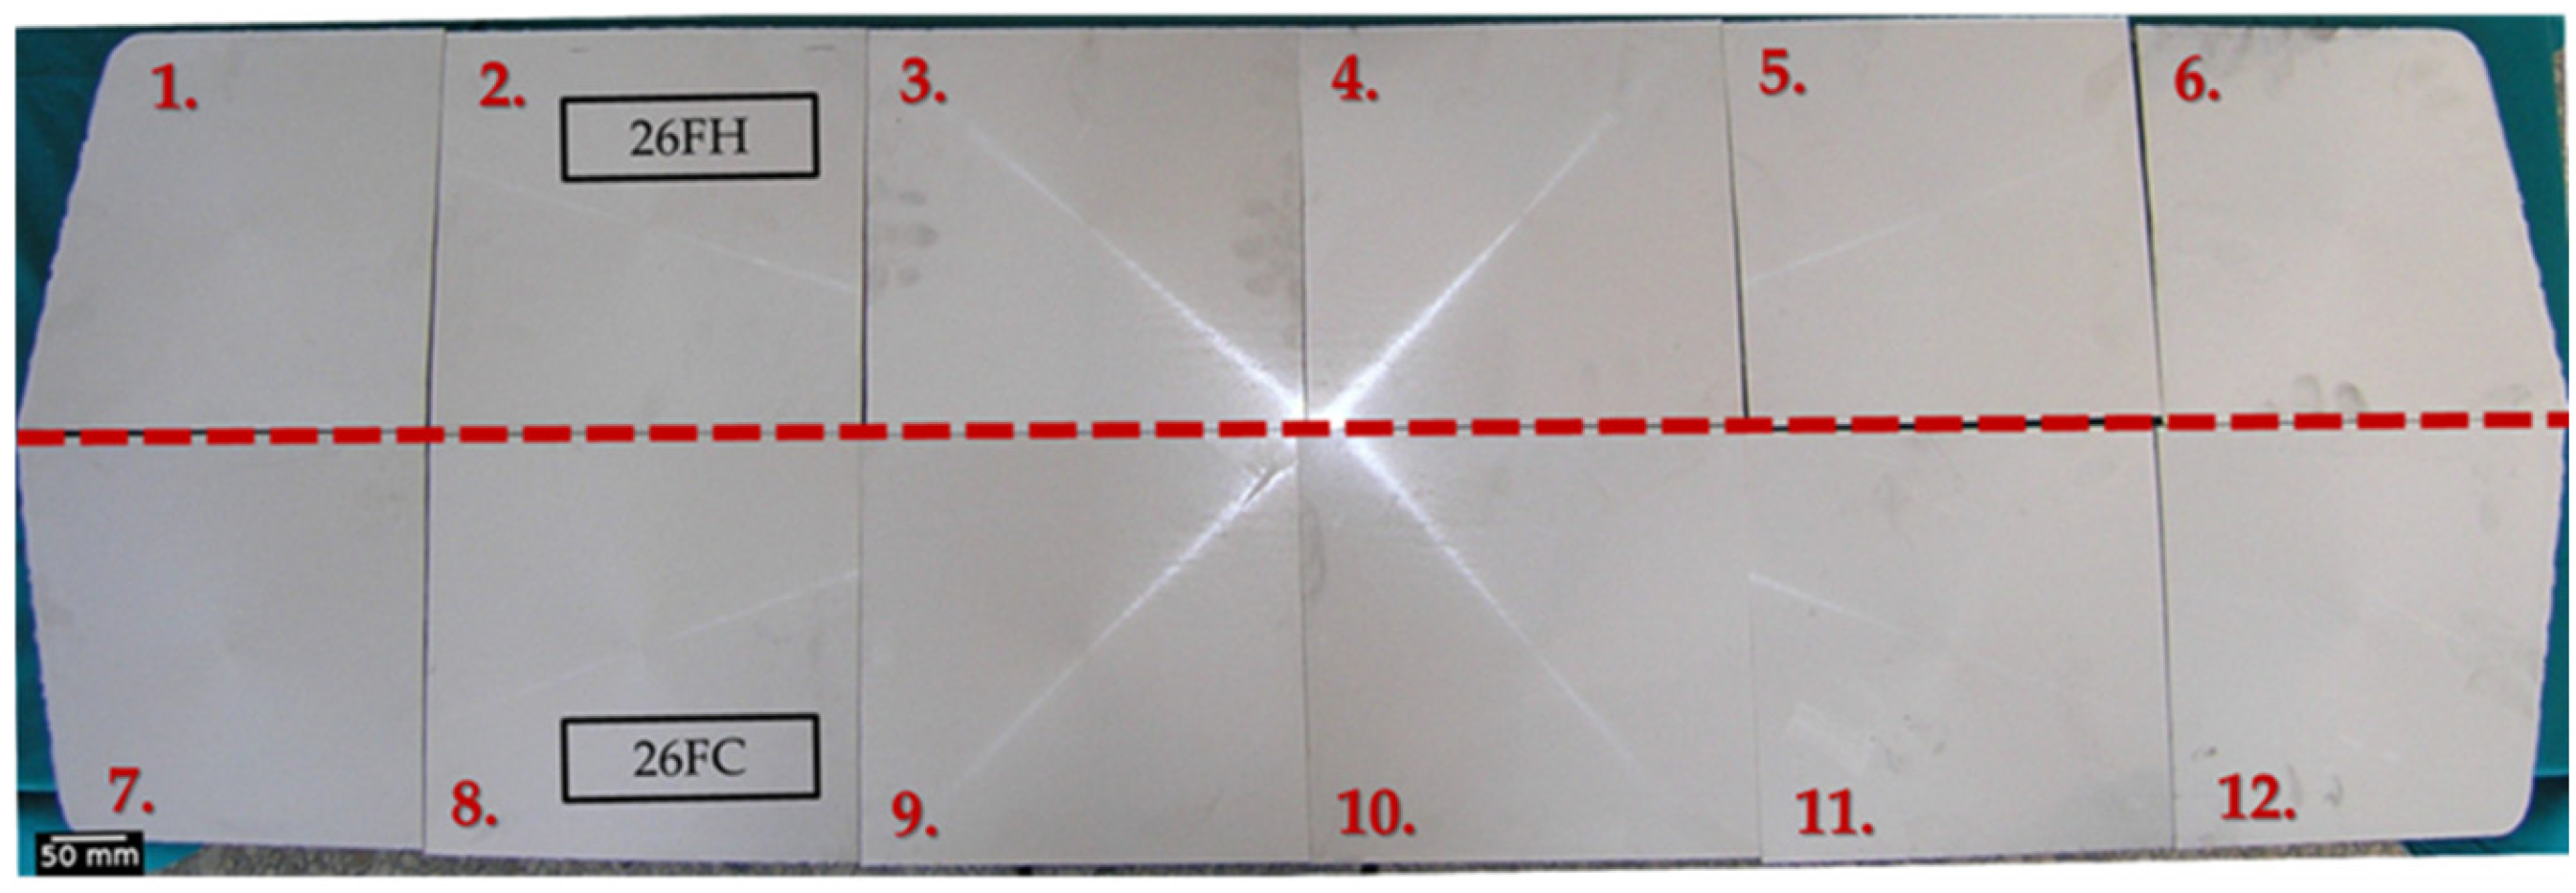
To obtain a representative sample, approximately 200.0 mm of the cast ingot was cut and discarded. A 30.0 mm thick cross-sectional plate was then cut and divided into 12 smaller segments (
Figure 3).
Sample 26FC was taken from the lower half of the ingot (
Figure 3, segment 8), while sample 26FH was taken from the corresponding location on the upper half of the ingot (
Figure 3, segment 2) [
48]. Sampling was performed under the assumption that the cooling and solidification conditions in the upper and lower halves of the ingot are the same due to mirror symmetry (
Figure 3, red dashed line) [
48]. Sample 26FC was tested in the as-cast condition. Sample 26FH was homogenized prior to corrosion testing. Homogenization was performed under semi-industrial conditions in an AVS250 Durferrite salt bath at 520.0 °C for 10 h. Immediately after homogenization, the sample was quenched in cold water to preserve the effect of heat treatment on microstructure development [
48].
The chemical composition of the cross-sectional plate was determined spectroscopically using an optical emission spectrometer, Spectro-lab S01, SPECTRO (manufacturer: SPECTRO Analytical Instruments GmbH, Kleve, Germany) [
48]. Measurements were performed on six samples taken from six different locations on the plate in the as-cast condition. The mean value and standard deviation were calculated.
The solidification sequence and microstructure development under equilibrium and non-equilibrium conditions were calculated using Thermo-Calc 2022a software AB, Solna, Sweden. The calculations were performed with the TCAL68: Al-Alloys v8.1 technical sheet for Al. The equilibrium and non-equilibrium calculations considered the weight percentages of Al, Mg, Si, Mn, Fe, and Cr in the temperature range from 0.0 °C to 800.0 °C at a pressure of 1.0 × 10⁵ Pa for a system size of 1.0 g. The equilibrium calculations were used to obtain an equilibrium phase diagram and to predict the formation of all thermodynamically stable phases as a function of the predefined parameters. The distribution of components (Al, Mg, Si, Fe, Mn, Cr) in all phases was calculated using a one-axis equilibrium calculation. The non-equilibrium calculations were performed based on the classical Scheil–Gulliver model. The Scheil calculations were used to determine the solidification range, the influence of chemical composition on the solidus temperature, and the composition of the last solidifying liquid.
Differential scanning calorimetry (DSC) of samples 26FC and 26FH was performed using a Netzsch STA 449C Jupiter instrument (manufacturer: Netzsch, Selb, Germany). Heating and cooling methods were used to determine the solidification interval, relevant phase formation temperatures, and the corresponding specific heats. The samples were heated to 720.0 °C with heating (r
h) and cooling (r
c) rates of 10.0 K/min (0.17 °C/min) [
48]. By analyzing and interpreting the cooling curves, the following parameters were determined: liquidus temperature (T
L, °C), solidus temperature (T
S, °C), intermetallic phase temperatures (T
E, °C), heat of fusion (Qₜ, J/g), and heat of solidification (Q
s, J/g). By correlating the identified specific temperatures with the results of non-equilibrium solidification sequence calculations, the solidification sequence was determined.
The samples for metallographic analysis were prepared using standard metallographic preparation techniques on a Struers Tegramin-30 grinding and polishing machine (manufacturer: Struers, Copenhagen, Denmark). The samples were prepared prior to corrosion testing and between individual corrosion measurements. To identify intermetallic phases, present in the as-cast and homogenized conditions, the samples were etched in a 0.5% aqueous solution of hydrofluoric acid (HF). The Barker anodizing method was used to identify and quantify the grain size. The samples were electrolytically etched in Barker’s reagent (5 mL of fluoroboric acid (HBF
4) (48.0%) + 200 mL distilled water (H
2O)) using direct current (U = 20–35 V) for 3–5 min [
48].
The metallographic analysis of the samples prior to the electrochemical tests included identification of the intermetallic phases present and measurement of the grain size. The intermetallic phases were interpreted based on the alloy’s chemical composition, thermodynamic calculations of equilibrium and non-equilibrium solidification, and the results of light and scanning electron microscopy (SEM) (TESCAN, Brno, Czech Republic). Because Fe-containing intermetallic phases in Al-Mg alloys often exhibit similar morphology and overlapping chemical composition [
37,
48], they are referred to collectively as Fe-bearing intermetallic phases in microstructural analysis. The grain size was determined using the intercept method. The number of grains per unit area (Na) was measured and the grain size number (G-number) was calculated by linear approximation from the mean grain section length (
) for the number of measurements (n). Grain size values are reported as mean values obtained from a large number of intercept counts (n = 500), ensuring statistical reliability in accordance with ASTM E112-13(2021) [
49].
The metallographic analysis of the samples after corrosion, using light and scanning electron microscopy, was performed without prior metallographic preparation. In this way, the behavior of the alloy in the degradation environment and the influence of the intermetallic phases on corrosion behavior was determined.
Optical microscopy of the samples was performed using an Olympus GX51 light microscope (manufacturer: Olympus, Tokyo, Japan) with a digital camera and an automatic image-processing system, “AnalySIS® Materials Research Lab”. Scanning electron microscopy (SEM) and energy-dispersive X-ray spectroscopy (EDS) were performed using a TESCAN VEGA TS5136LS scanning electron microscope (manufacturer: TESCAN, Brno, Czech Republic) equipped with an Oxford Instruments EDS detector (manufacturer: Oxford Instruments, Abingdon, UK).
To determine the corrosion resistance of EN AW-5083 in as-cast and homogenized conditions, the samples were subjected to electrochemical tests, primarily corrosion potential measurements and the Tafel extrapolation method. At the beginning of the electrochemical measurements, the sample potential was first stabilized for 600.0 s at open circuit potential (E
ocp). Potentiodynamic polarization was then performed in the potential range from −250.0 mV to +250.0 mV vs. corrosion potential (E
corr) with a scan rate of 0.5 mV/s. The measurements were performed at room temperature (19 ± 2 °C) using a computer-controlled potentiostat/galvanostat Parstat 2273 (manufacturer: Ametek, Leicester, UK). The measuring apparatus consisted of a three-electrode glass cell in which the test sample was immersed in the exfoliation corrosion solution (EXCO) (volume = 200.0 mL) and served as the working electrode with an area of 3.14 cm
2. The solution for the electrochemical tests was prepared by dissolving 234.0 g of sodium chloride (NaCl) and 50.0 g of potassium nitrate (KNO
3) in water. Subsequently, 6.3 mL nitric acid (HNO
3) was added, and the solution was diluted to 1.0 L with distilled water. The resulting solution had a pH of 0.4 [
46]. As a solution for accelerated degradation testing, the EXCO solution is used to assess susceptibility to exfoliation and intergranular corrosion in Al-Mg alloys. A saturated calomel electrode (SCE) was used as the reference electrode and a platinum electrode as the counter electrode. The corrosion potential (E
corr), corrosion current density (i
corr), anode slope (b
a), cathode slope (b
c), and corrosion rate (v
corr) were determined using PowerCorrTM 2009 software. To improve the reliability of the results, experimental measurements are generally repeated multiple times. In this study, each electrochemical test was carried out twice. The obtained electrochemical parameters were statistically evaluated, and the average corrosion rate (
) together with the standard deviation (SD) was calculated based on the repeated measurements for each metallurgical condition [
50].
3. Results
The chemical composition of the EN AW-5083 ingot measured on the cross-sectional plate is given in
Table 1.
The chemical composition of the EN AW-5083 ingot complies with the standard [
28] (
Table 1). Given the hypoeutectic Mg content (
Table 1), solidification and microstructure development will occur in the Al-rich corner of both the binary Al-Mg and ternary Al-Mg-Si alloy systems. In the binary system, microstructure development will begin with the solidification of a primary α
Al dendritic network, followed by the eutectic reaction and solidification of the Al
8Mg
5 (β) phase [
11,
12]. In the Al-Mg-Si system, when microstructure development occurs with excess Mg at a Mg:Si ratio greater than 1.73 (Mg:Si = 33.0,
Table 1), the solid solubility of Mg
2Si in the α
Al solid solution is reduced. Consequently, microstructure development will involve the solidification of a primary α
Al dendritic network, followed by the solidification of Mg
2Si and Al
8Mg
5 (β) eutectic phases [
51]. The Mn content of 0.45 wt.% is sufficient to compensate for the negative effect of Fe-bearing intermetallic phases, particularly the needle-like Al
3Fe phase by promoting the preferential solidification of the Al
6(Fe,Mn) phase with a compact “Chinese script” morphology [
51,
52].
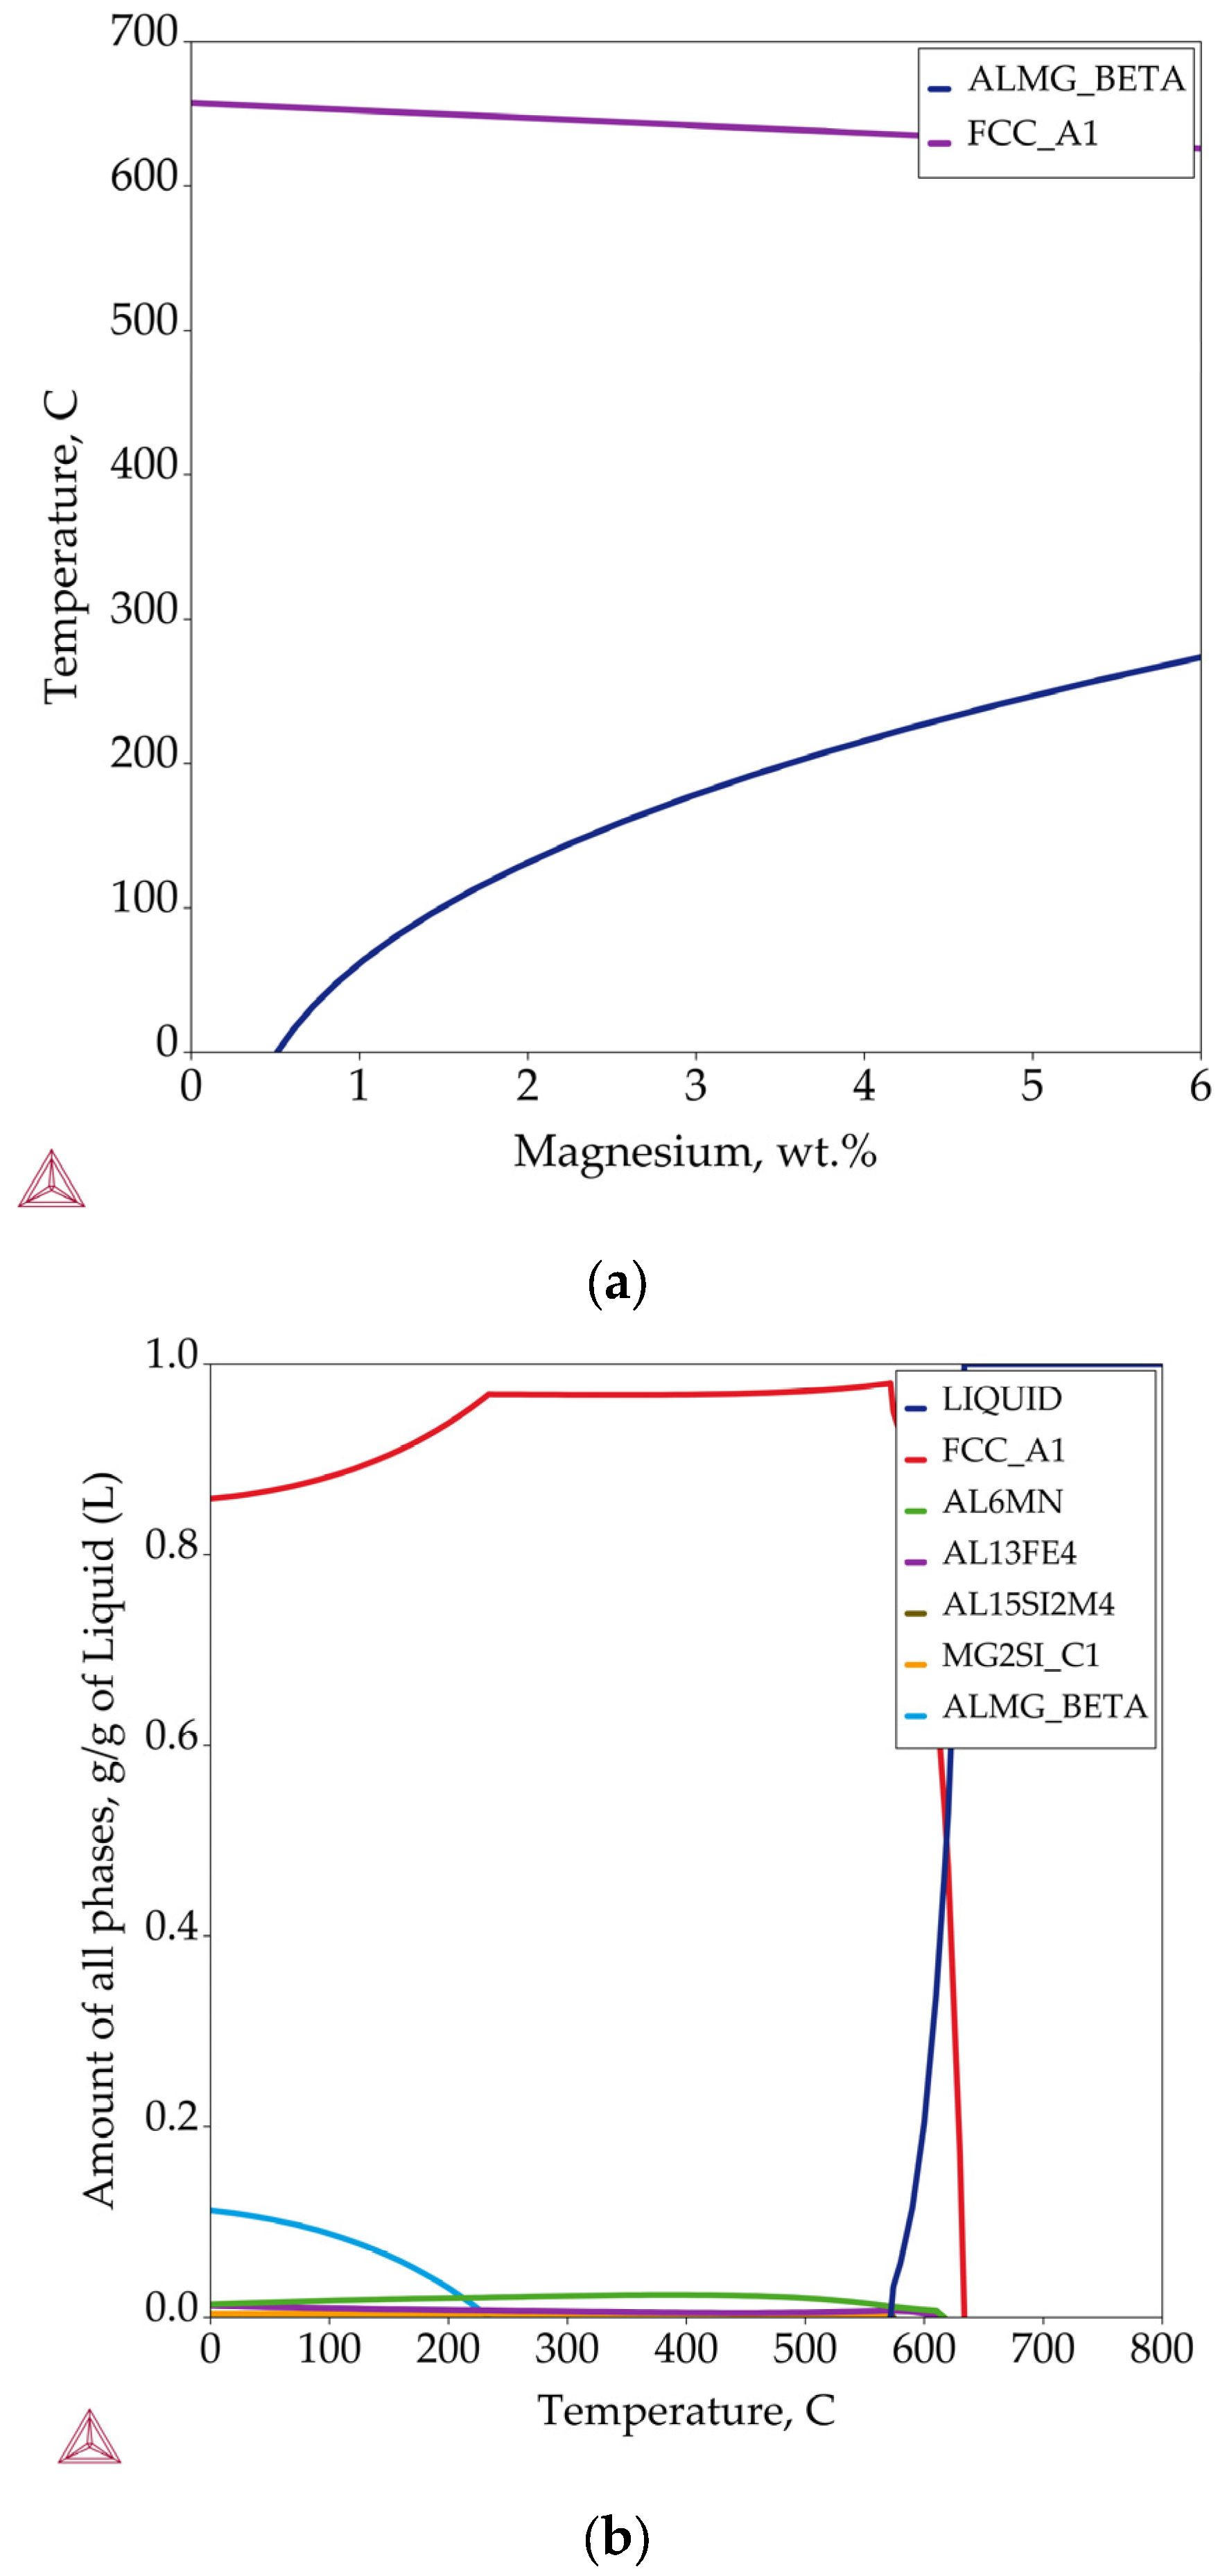
The Al-rich corner of the equilibrium phase diagram for EN AW-5083 is shown in
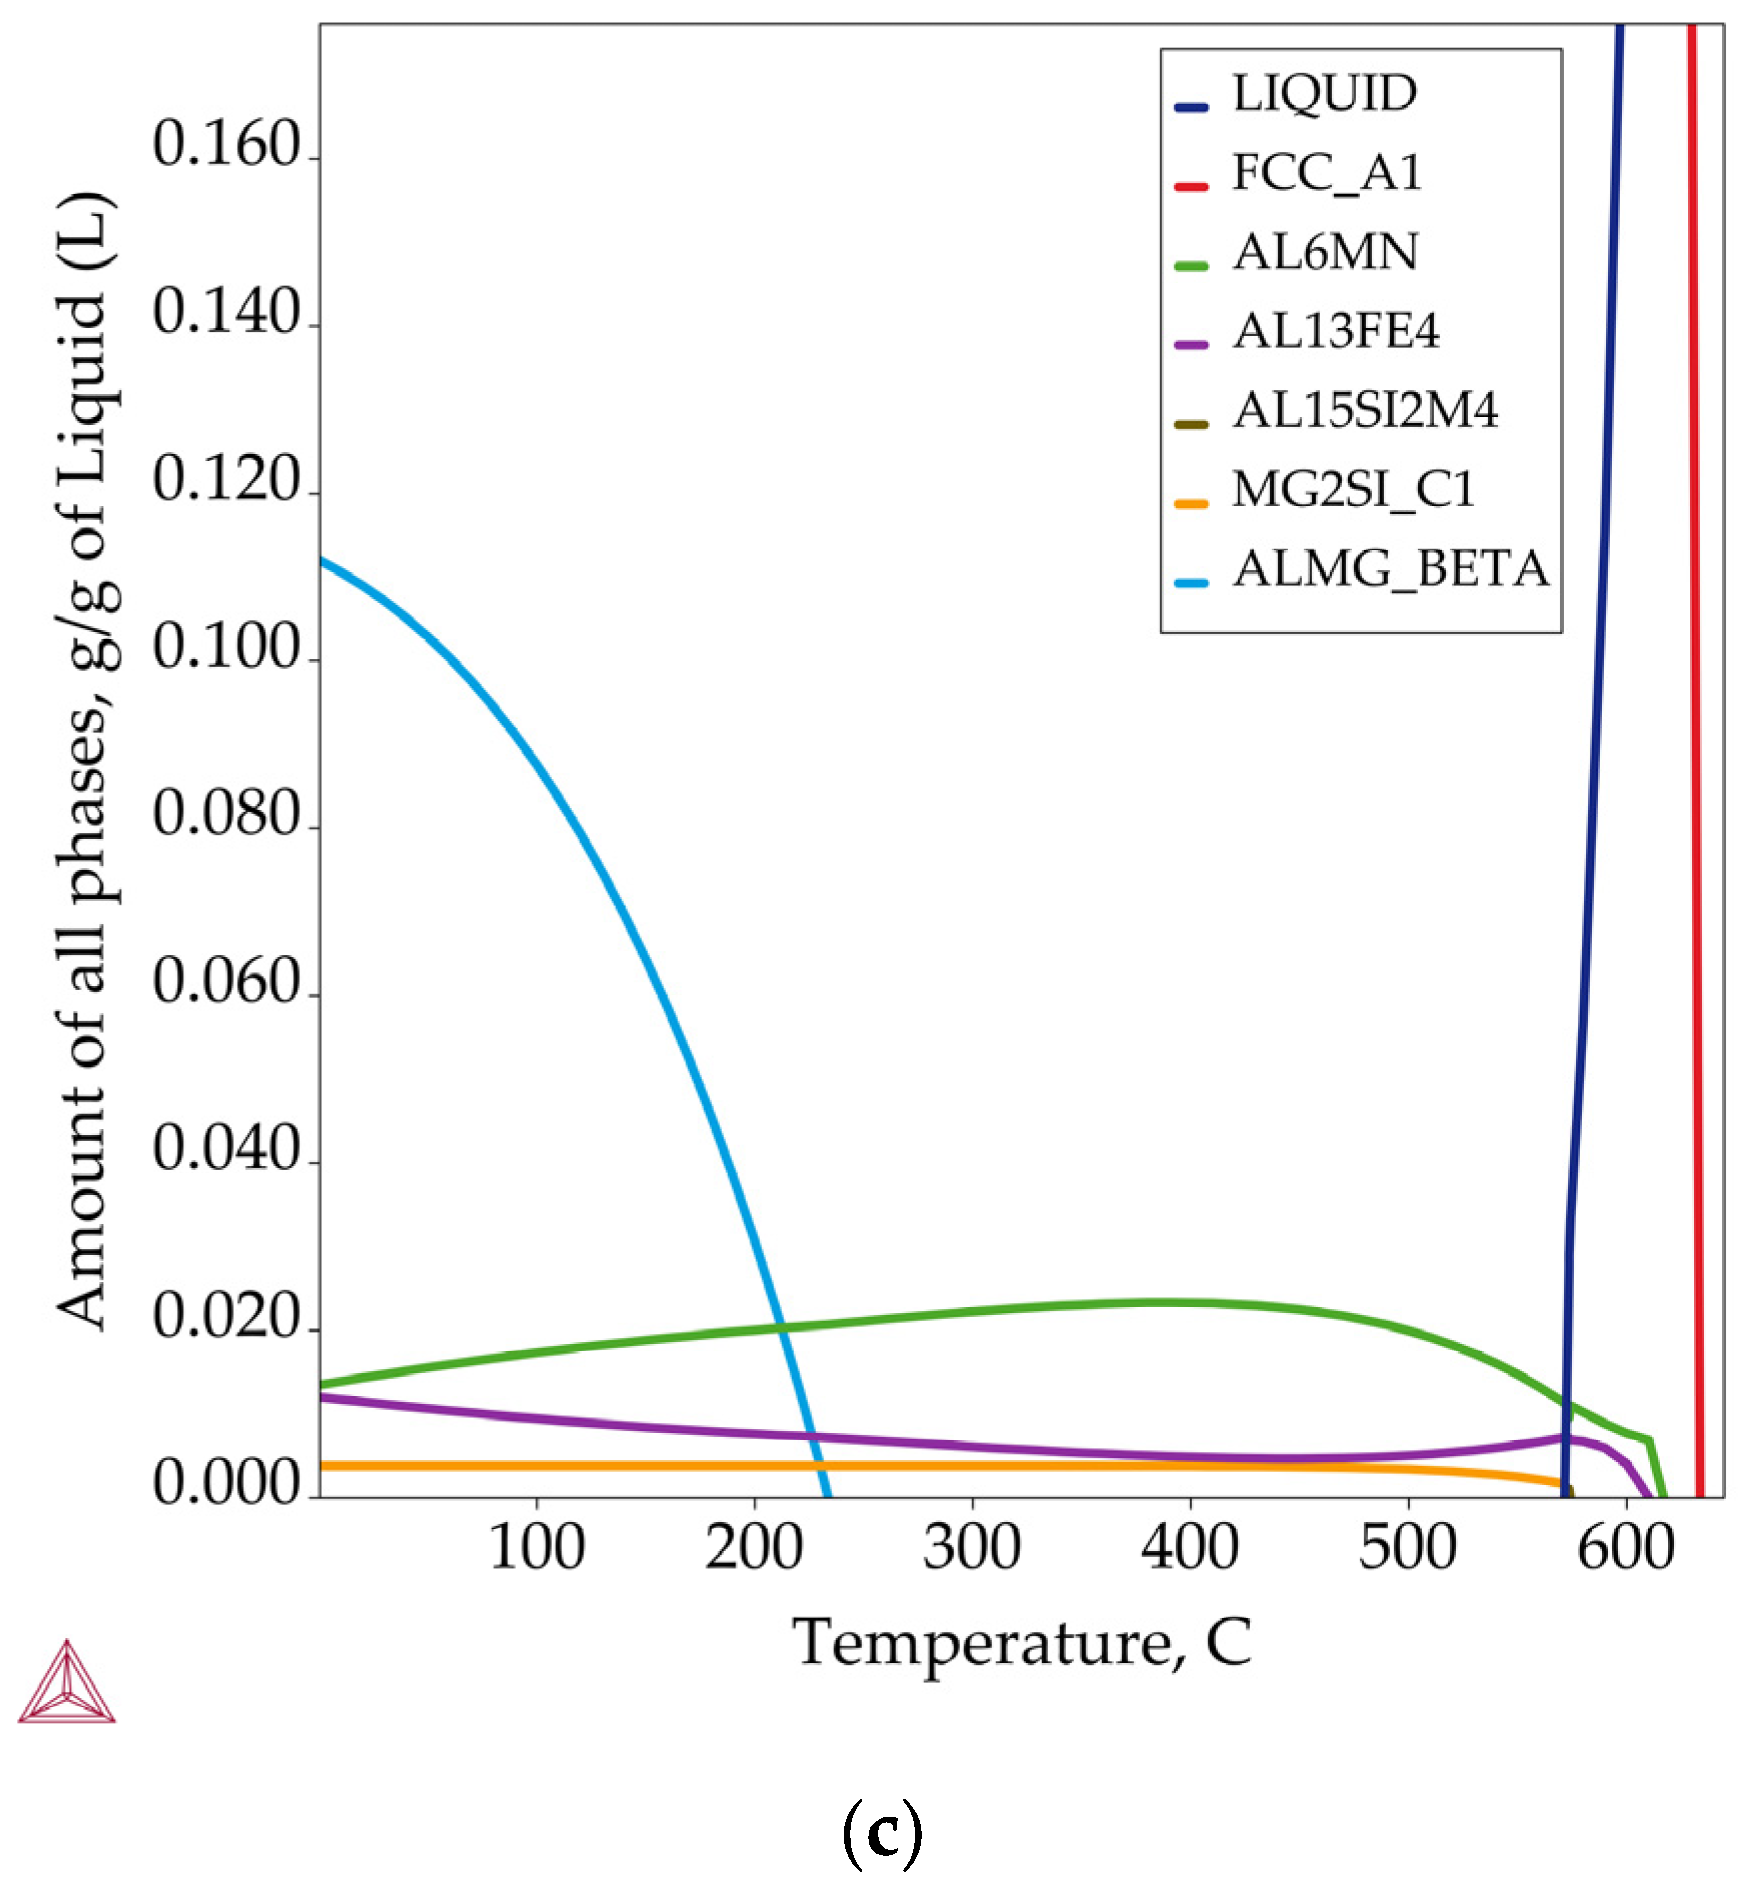
Figure 4a, while the phase solidification and precipitation are presented in
Figure 4b,c. The invariant reactions and corresponding temperatures are listed in
Table 2.
The results of the equilibrium solidification sequence obtained using Thermo Calc 2022a (
Figure 4) differ from the microstructural development assumed based on the chemical composition. Additionally, the equilibrium solidification sequence calculated for the Al-rich corner of the phase diagram differs from the results of one-axis equilibrium calculations (
Figure 4). The equilibrium solidification in the Al-rich corner of the phase diagram involves solidification of the FCC_A1 (α
Al dendritic network) at approximately 639.0 °C and the formation of the ALMG_BETA (Al
8Mg
5 (β)) phase at 224.0 °C. The results of one-axis equilibrium calculations indicate complex microstructure development, comprehending solidification of the α
Al solid solution, AL15SI2M4 (Al
15(Fe,Mn)
3Si
2 (α)), AL6MN (Al
6(Fe,Mn)), and AL13FE4 (Al
3Fe) phases (
Figure 4b,
Table 2), as well as precipitation of MG2SI_C1 (Mg
2Si), AL18MG3TM2 (Al
18Mg
3(Mn,Cr)
2), and ALMG_BETA (Al
8Mg
5) phases (
Figure 4c,
Table 2). According to the invariant reactions shown in
Table 2, microstructure development begins with the solidification of the primary α
Al dendritic network at 632.0 °C. In the temperature range between 620.0 °C and the solidus temperature of approximately 580.0 °C (
Figure 4c), the Fe-bearing intermetallic phases Al
15(Fe,Mn)
3Si
2 (α), Al
6Mn, and Al
3Fe solidify (
Table 2). The preferential solidification of these intermetallic phases is attributed to the lower solid solubility of Fe, Si and Mn in the α
Al solid solution [
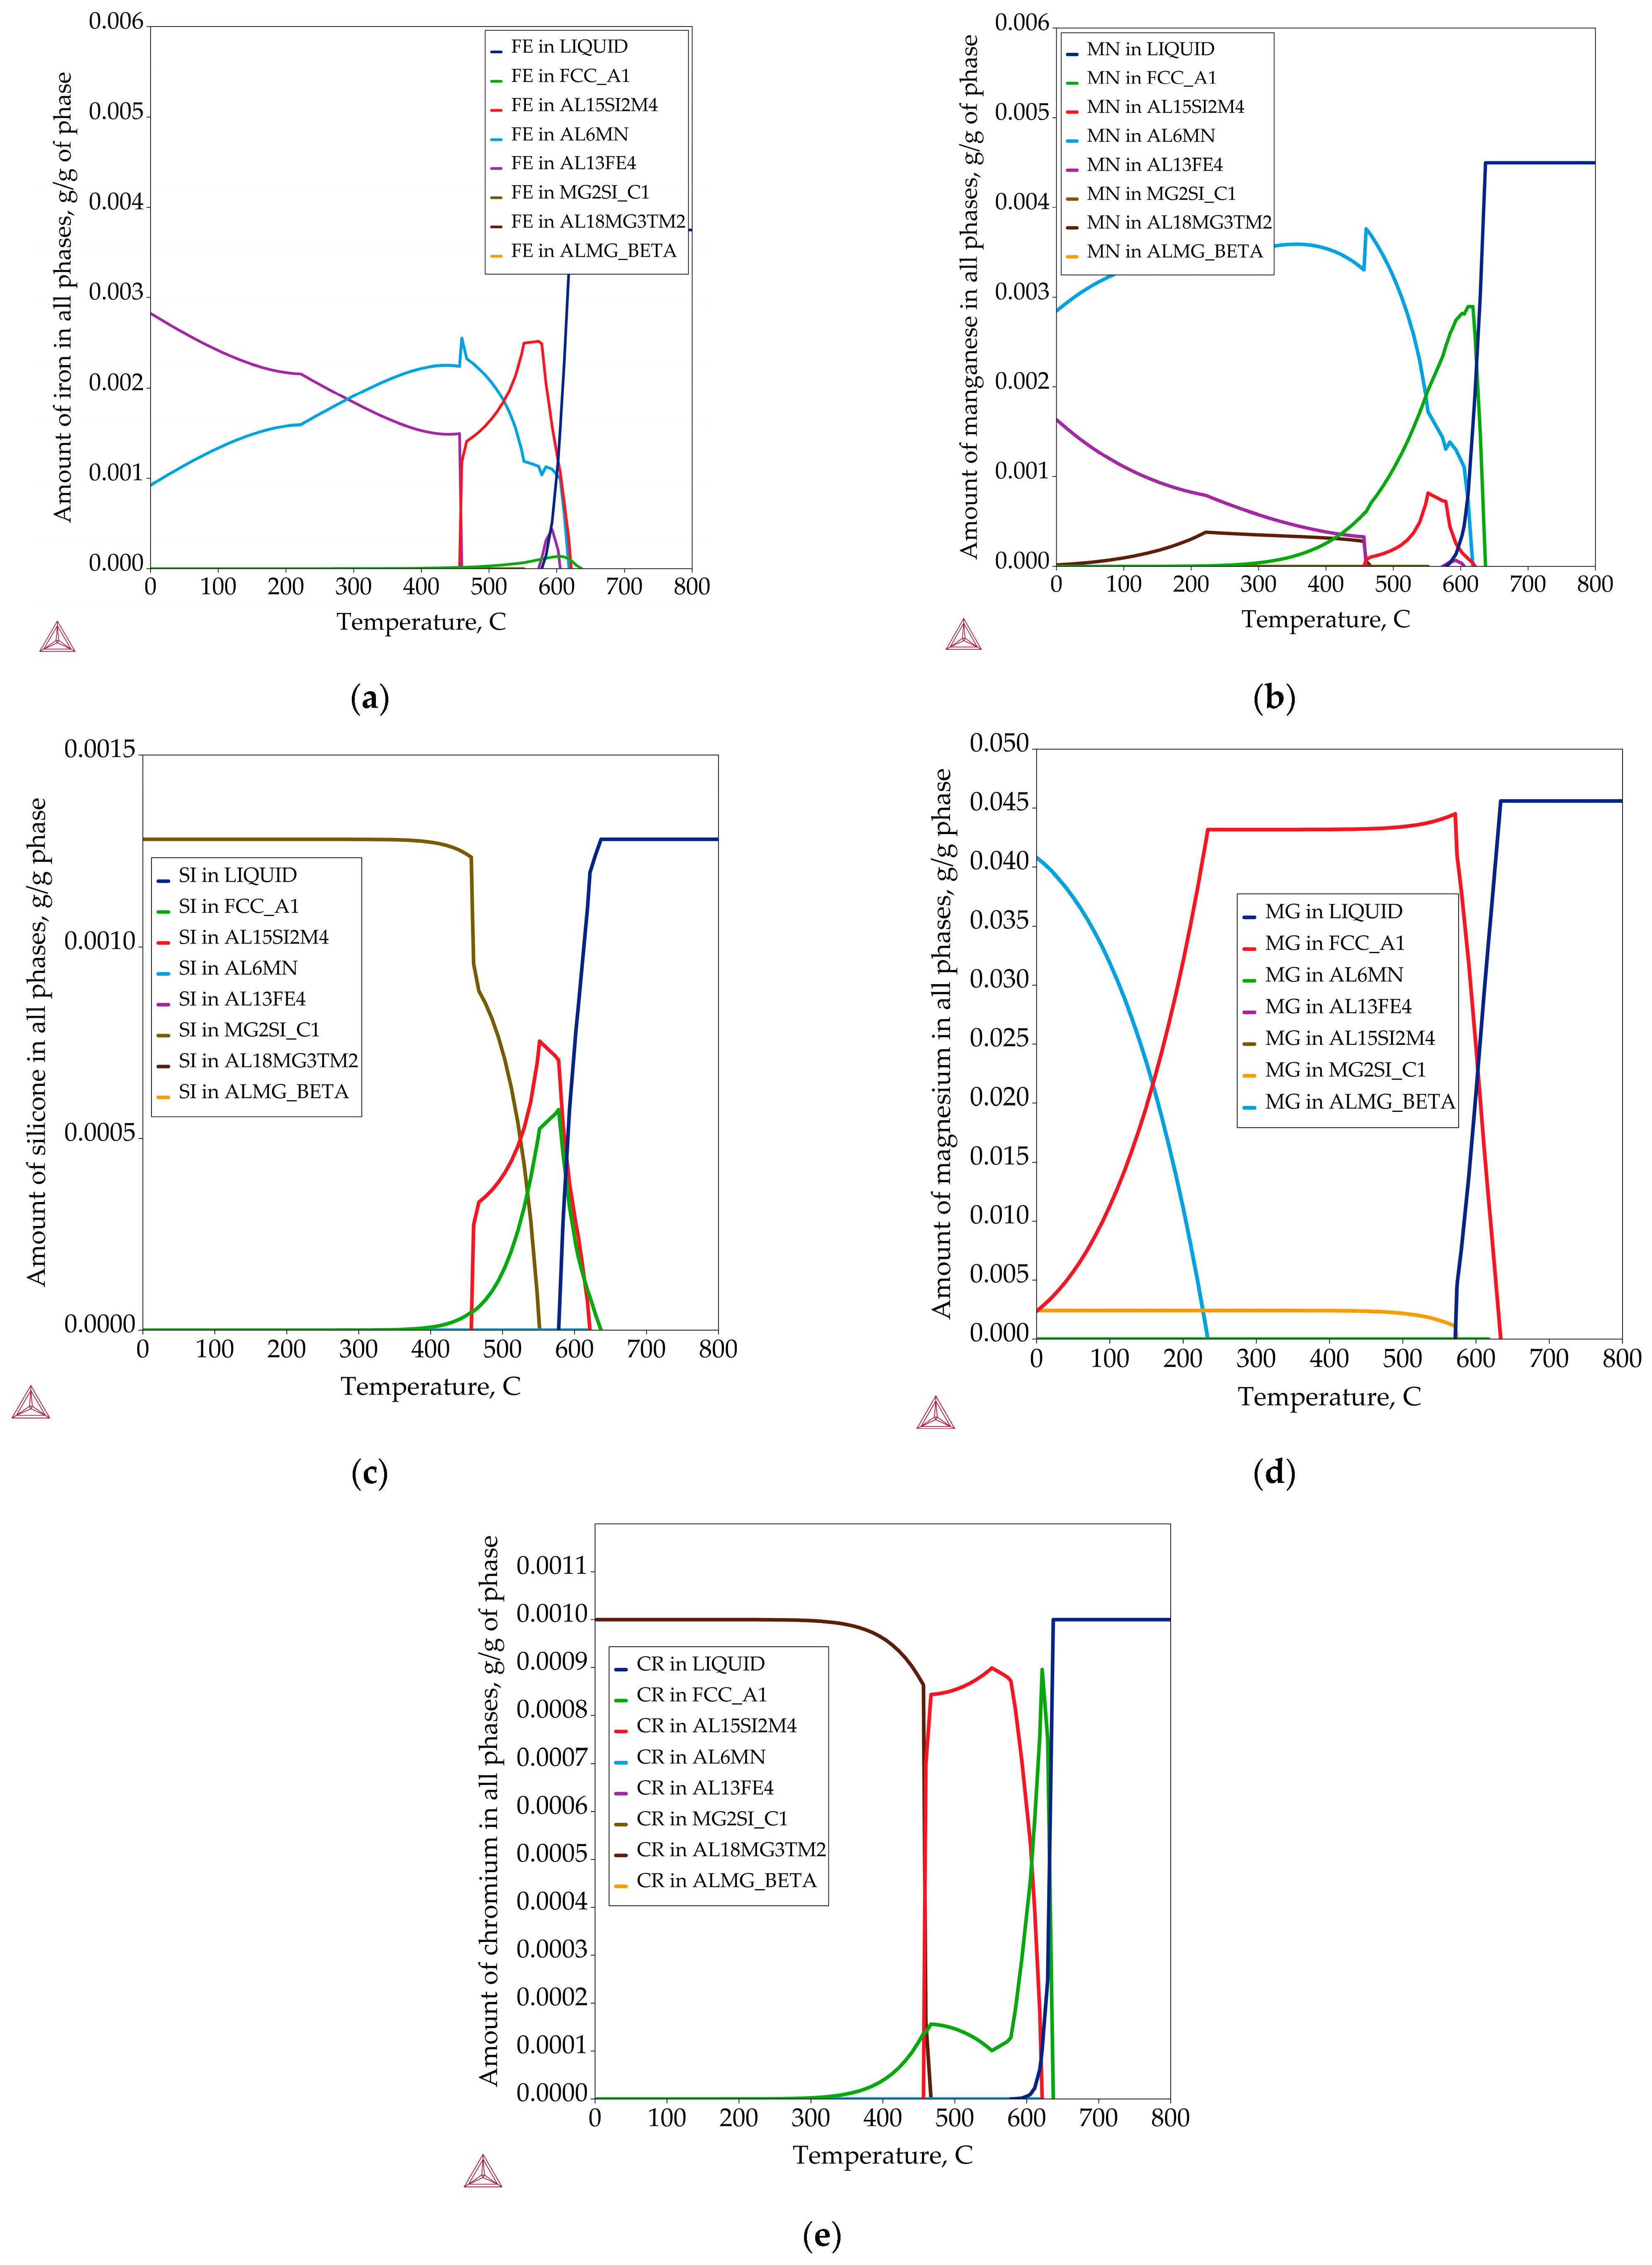
50]. Calculation of the component distribution in the phases indicates that the amount of Fe in the α
Al solid solution increases to 0.0037 g/g of phase at 600.0 °C (
Figure 5a). The decrease in the amount of Fe in the α
Al solid solution leads to the Al
3Fe phase solidification (
Figure 5a). The reprecipitation of the Al
3Fe phase at 464.0 °C coincides with the end of Al
15(Fe,Mn)
3Si
2 (α) phase solidification and the decrease in Fe content in the Al
3Fe phase (
Table 2,
Figure 5a).
According to thermodynamic calculations, the maximum solid solubility of Mn in the α
Al solid solution is 0.077 g/g of phase at 616.0 °C. The decrease in solid solubility of Mn in the α
Al solid solution results in the solidification of the Al
15(Fe,Mn)
3Si
2 (α) and Al
6(Fe,Mn) phases (
Table 2). Further microstructural development and the precipitation of Al
18Mg
3(Mn,Cr)
2 and Al
3Fe phases lead to a decrease in the Mn content of the Al
6(Fe
,Mn) phase (
Table 2,
Figure 5b). After reaching the maximum solid solubility of 0.01 g/g of phase in the α
Al solid solution at 544.0 °C, the decrease in the solid solubility of Si causes the solidification of Al
15(Fe,Mn)
3Si
2 (α) and precipitation of Mg
2Si (
Figure 5c). The decrease in the maximum solid solubility of Mg in the α
Al solid solution (1.14 g/g of phase at 540.2 °C) leads to the precipitation of Mg
2Si, Al
18Mg
3(Mn,Cr)
2 and Al
8Mg
5 (β) phases (
Figure 5d). The calculation of Cr distribution in all phases (
Figure 5e) indicates the possible replacement of Fe and Mn in the Al
15(Fe,Mn)
3Si
2 (α) and Al
18Mg
3(Mn,Cr)
2 phase lattices [
42].
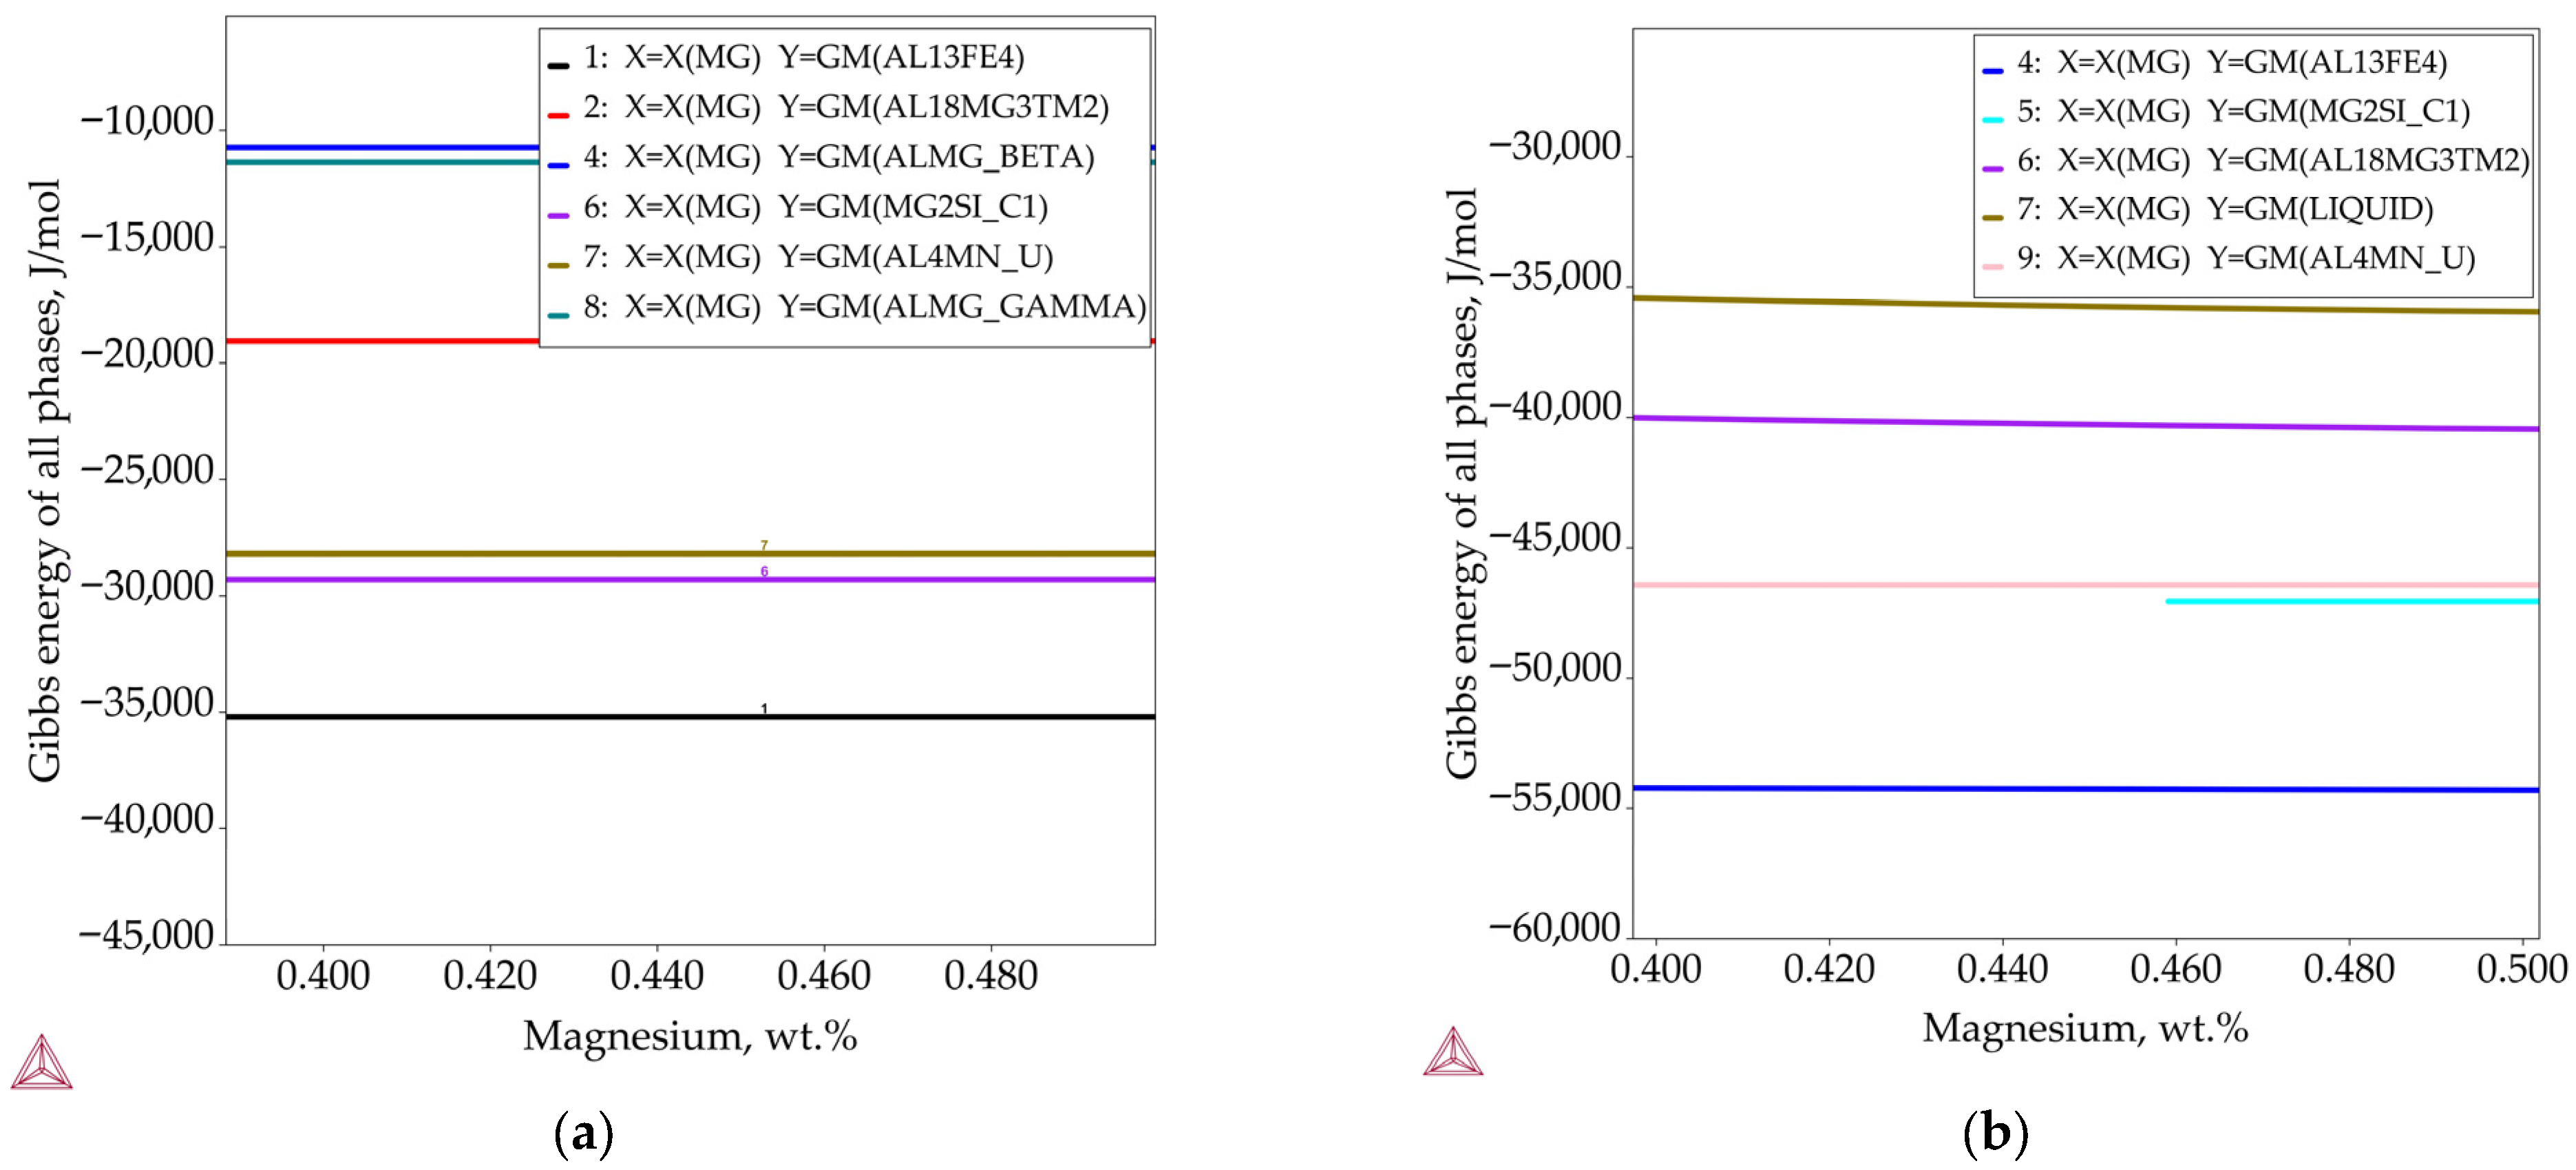
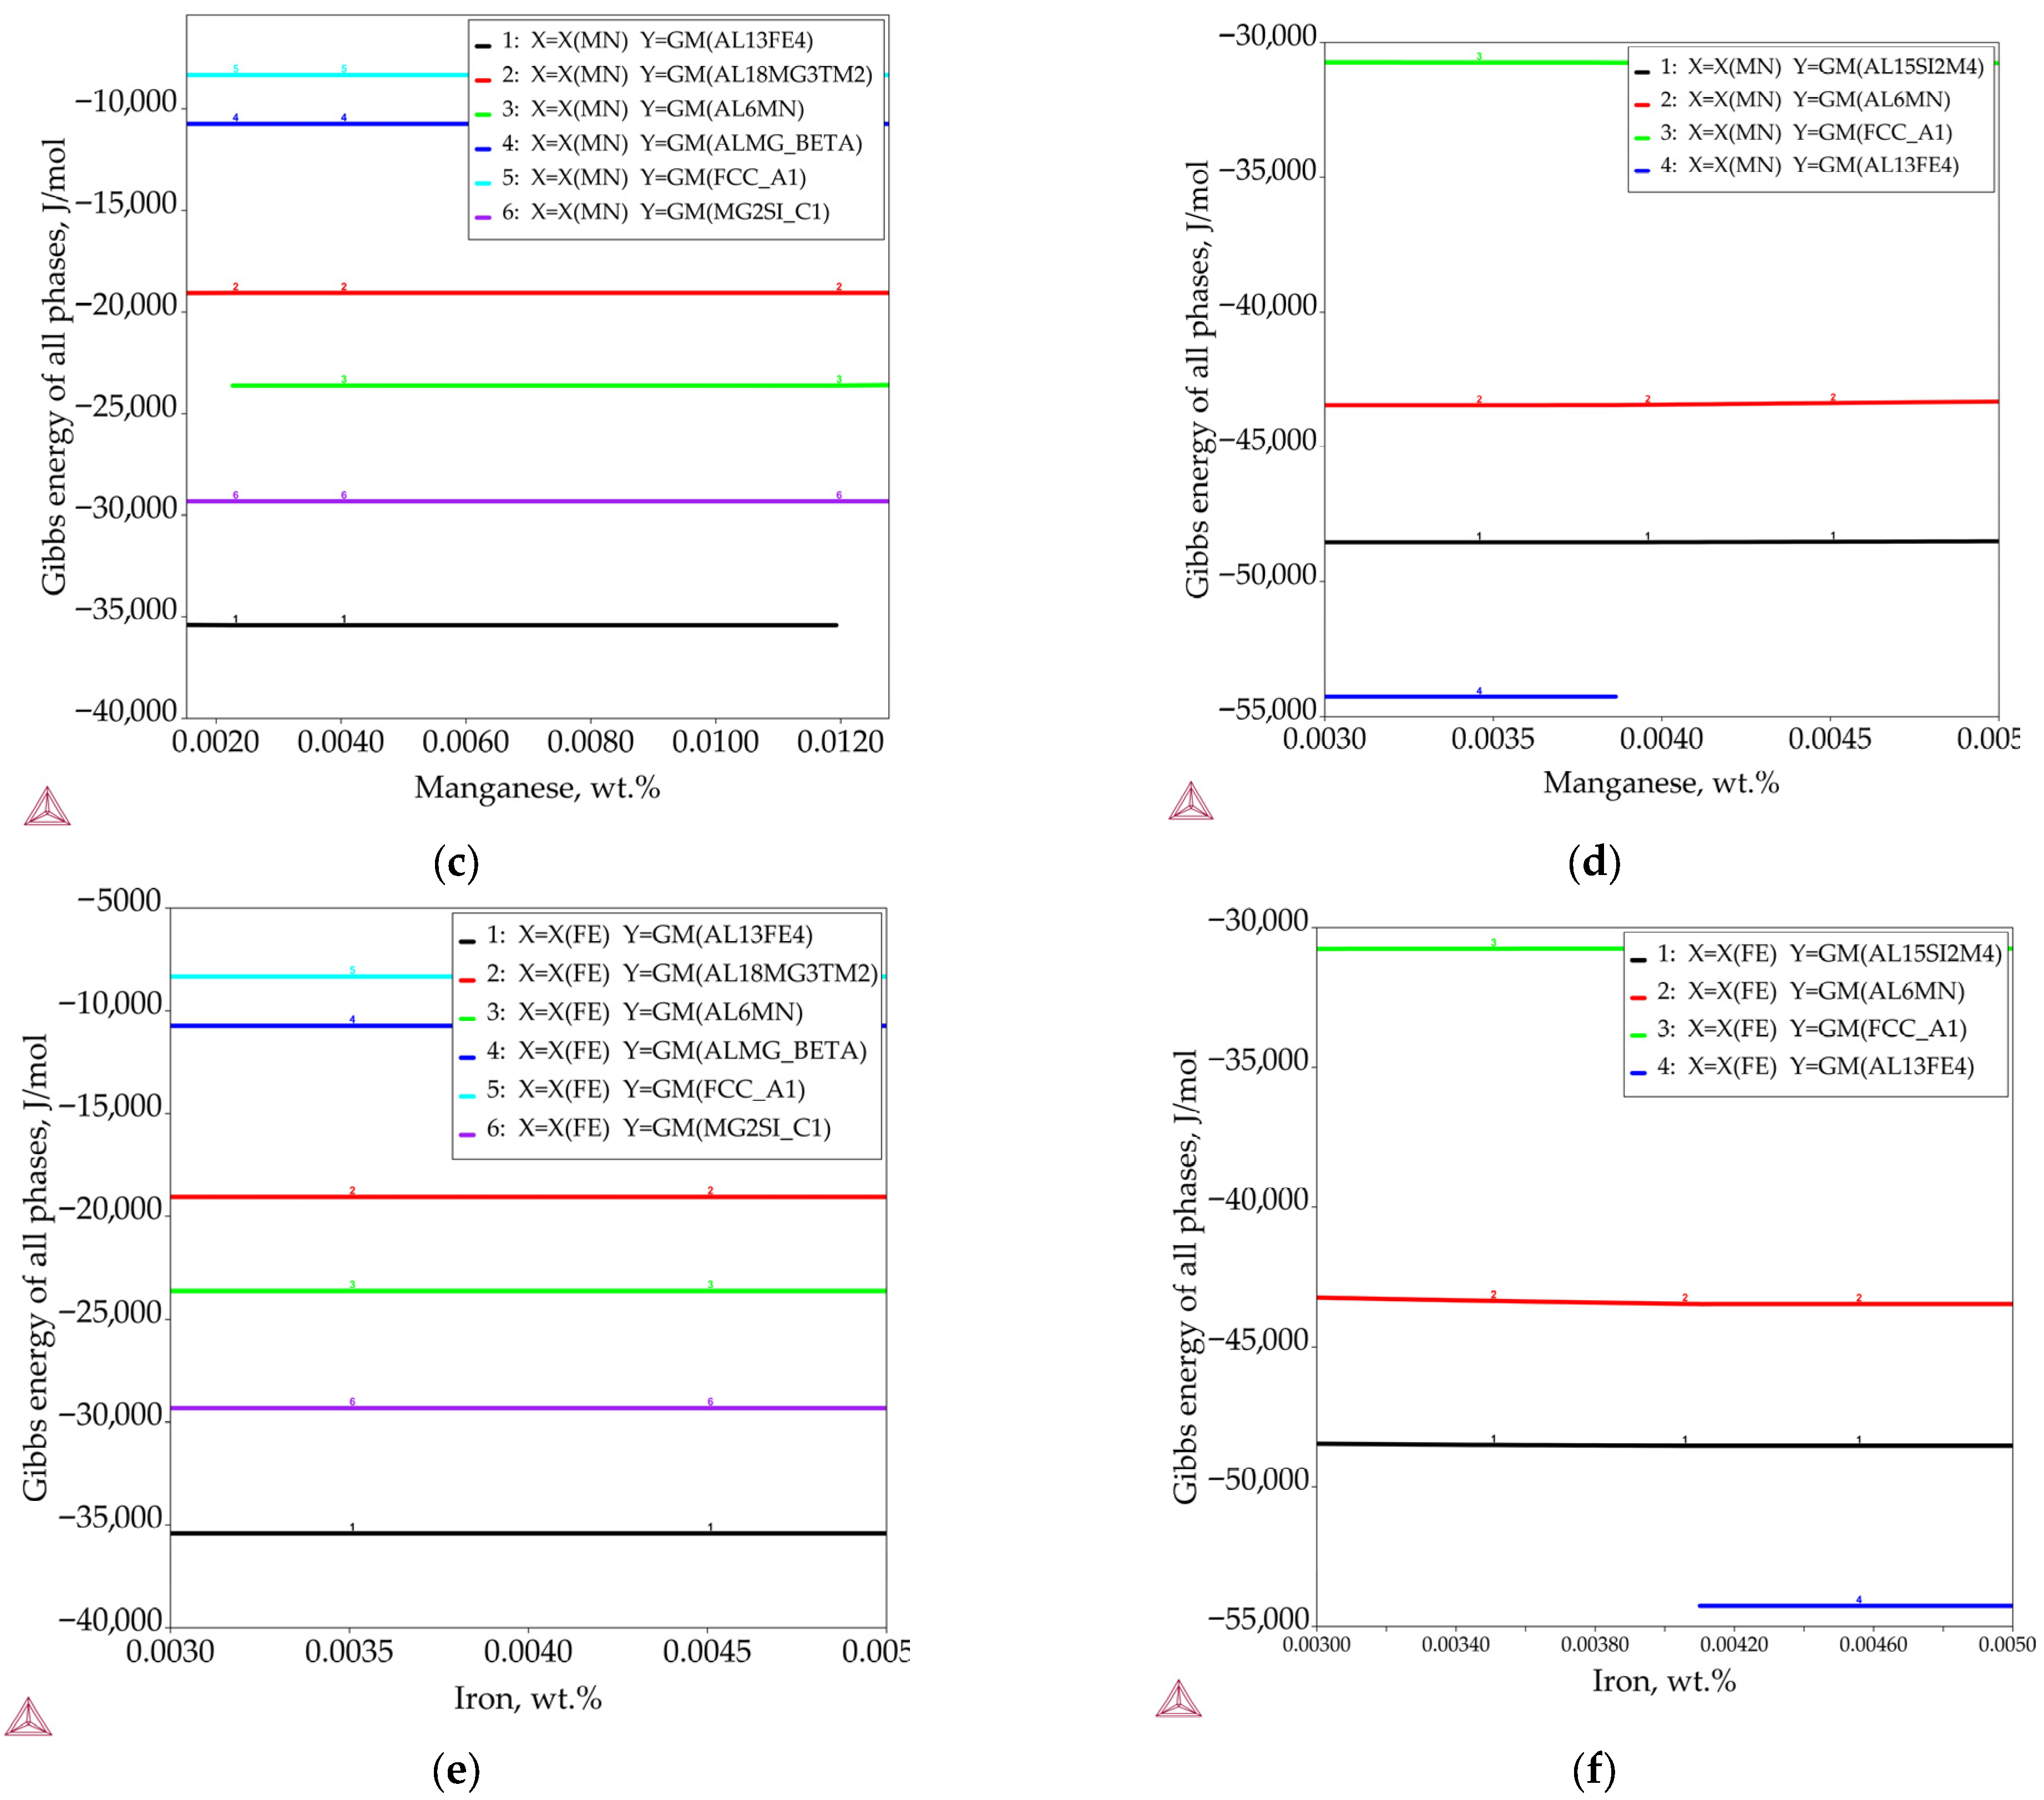
The results of Gibbs energy calculations as a function of the mass fractions of Mg, Mn, and Fe at 25.0 and 520.0 °C (
Figure 6) show good agreement with the results of the equilibrium and one-axis equilibrium calculations, with the possibility of forming two additional phases: AL4MN_U (Al
4Mn) and ALMG_GAMMA (Al
12Mg
5). The Fe-bearing intermetallic phases such as Al
3Fe, Al
6Mn, Al
4Mn, and Mg
2Si have lower Gibbs energy values and a greater tendency to form and be retained until the end of the solidification sequence. In contrast, the Mg-based Al
8Mg
5 and Al
12Mg
5 phases have higher Gibbs energy values and a lower probability of forming during solidification. The dependence of Gibbs energy on the mass fractions of Mn and Fe indicates that the intermetallic phase Al
18Mg
3(Mn,Cr)
2 is stable at 25.0 °C, while Al
15(Fe,Mn)
3Si
2 (α) is stable at the homogenization temperature. These results are consistent with one-axis equilibrium calculations, which predict the formation of Al
15(Fe,Mn)
3Si
2 (α) in the temperature range from 620.0 to 544.0 °C and the formation of Al
18Mg
3(Mn,Cr)
2 from 464.0 °C until the end of the solidification sequence (
Table 2).
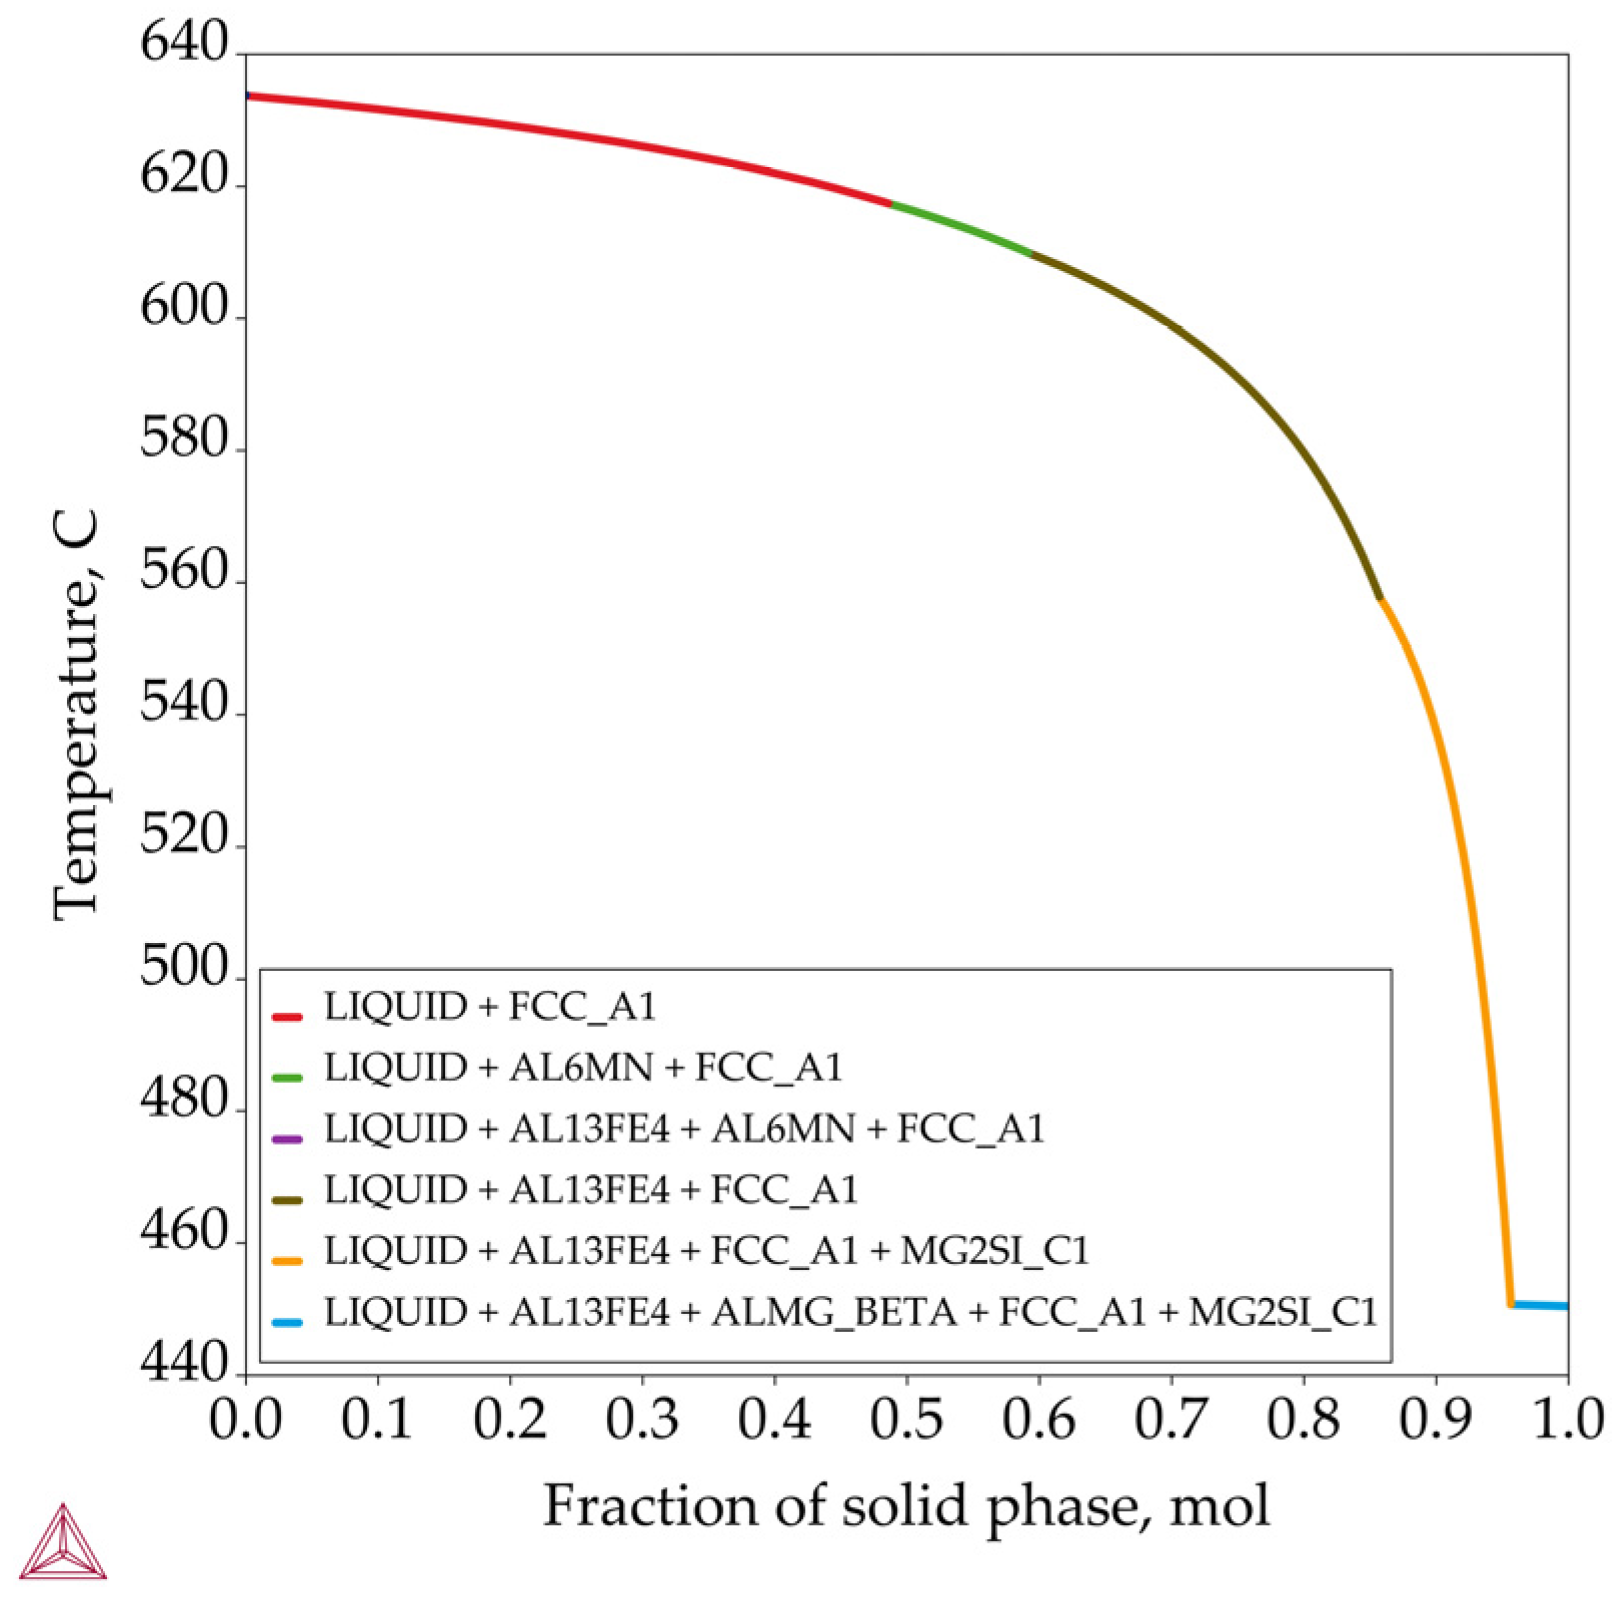
The non-equilibrium solidification sequence of EN AW-5083, based on the classical Scheil–Gulliver model, is shown in
Figure 7, with the invariant reactions and corresponding temperatures listed in
Table 3.
Compared to previous thermodynamic calculations, the non-equilibrium solidification sequence occurs over a wider solidification temperature range (
Table 2 and
Table 3) and at higher temperatures, with the most significant difference in the solidification temperature of the Al
8Mg
5 (β) phase (
Table 2 and
Table 3). Additionally, the non-equilibrium solidification does not recognize the formation of the complex multicomponent Al
15(Fe,Mn)
3Si
2 (α) and Al
18Mg
3(Mn,Cr)
2 phases (
Figure 4,
Table 2).
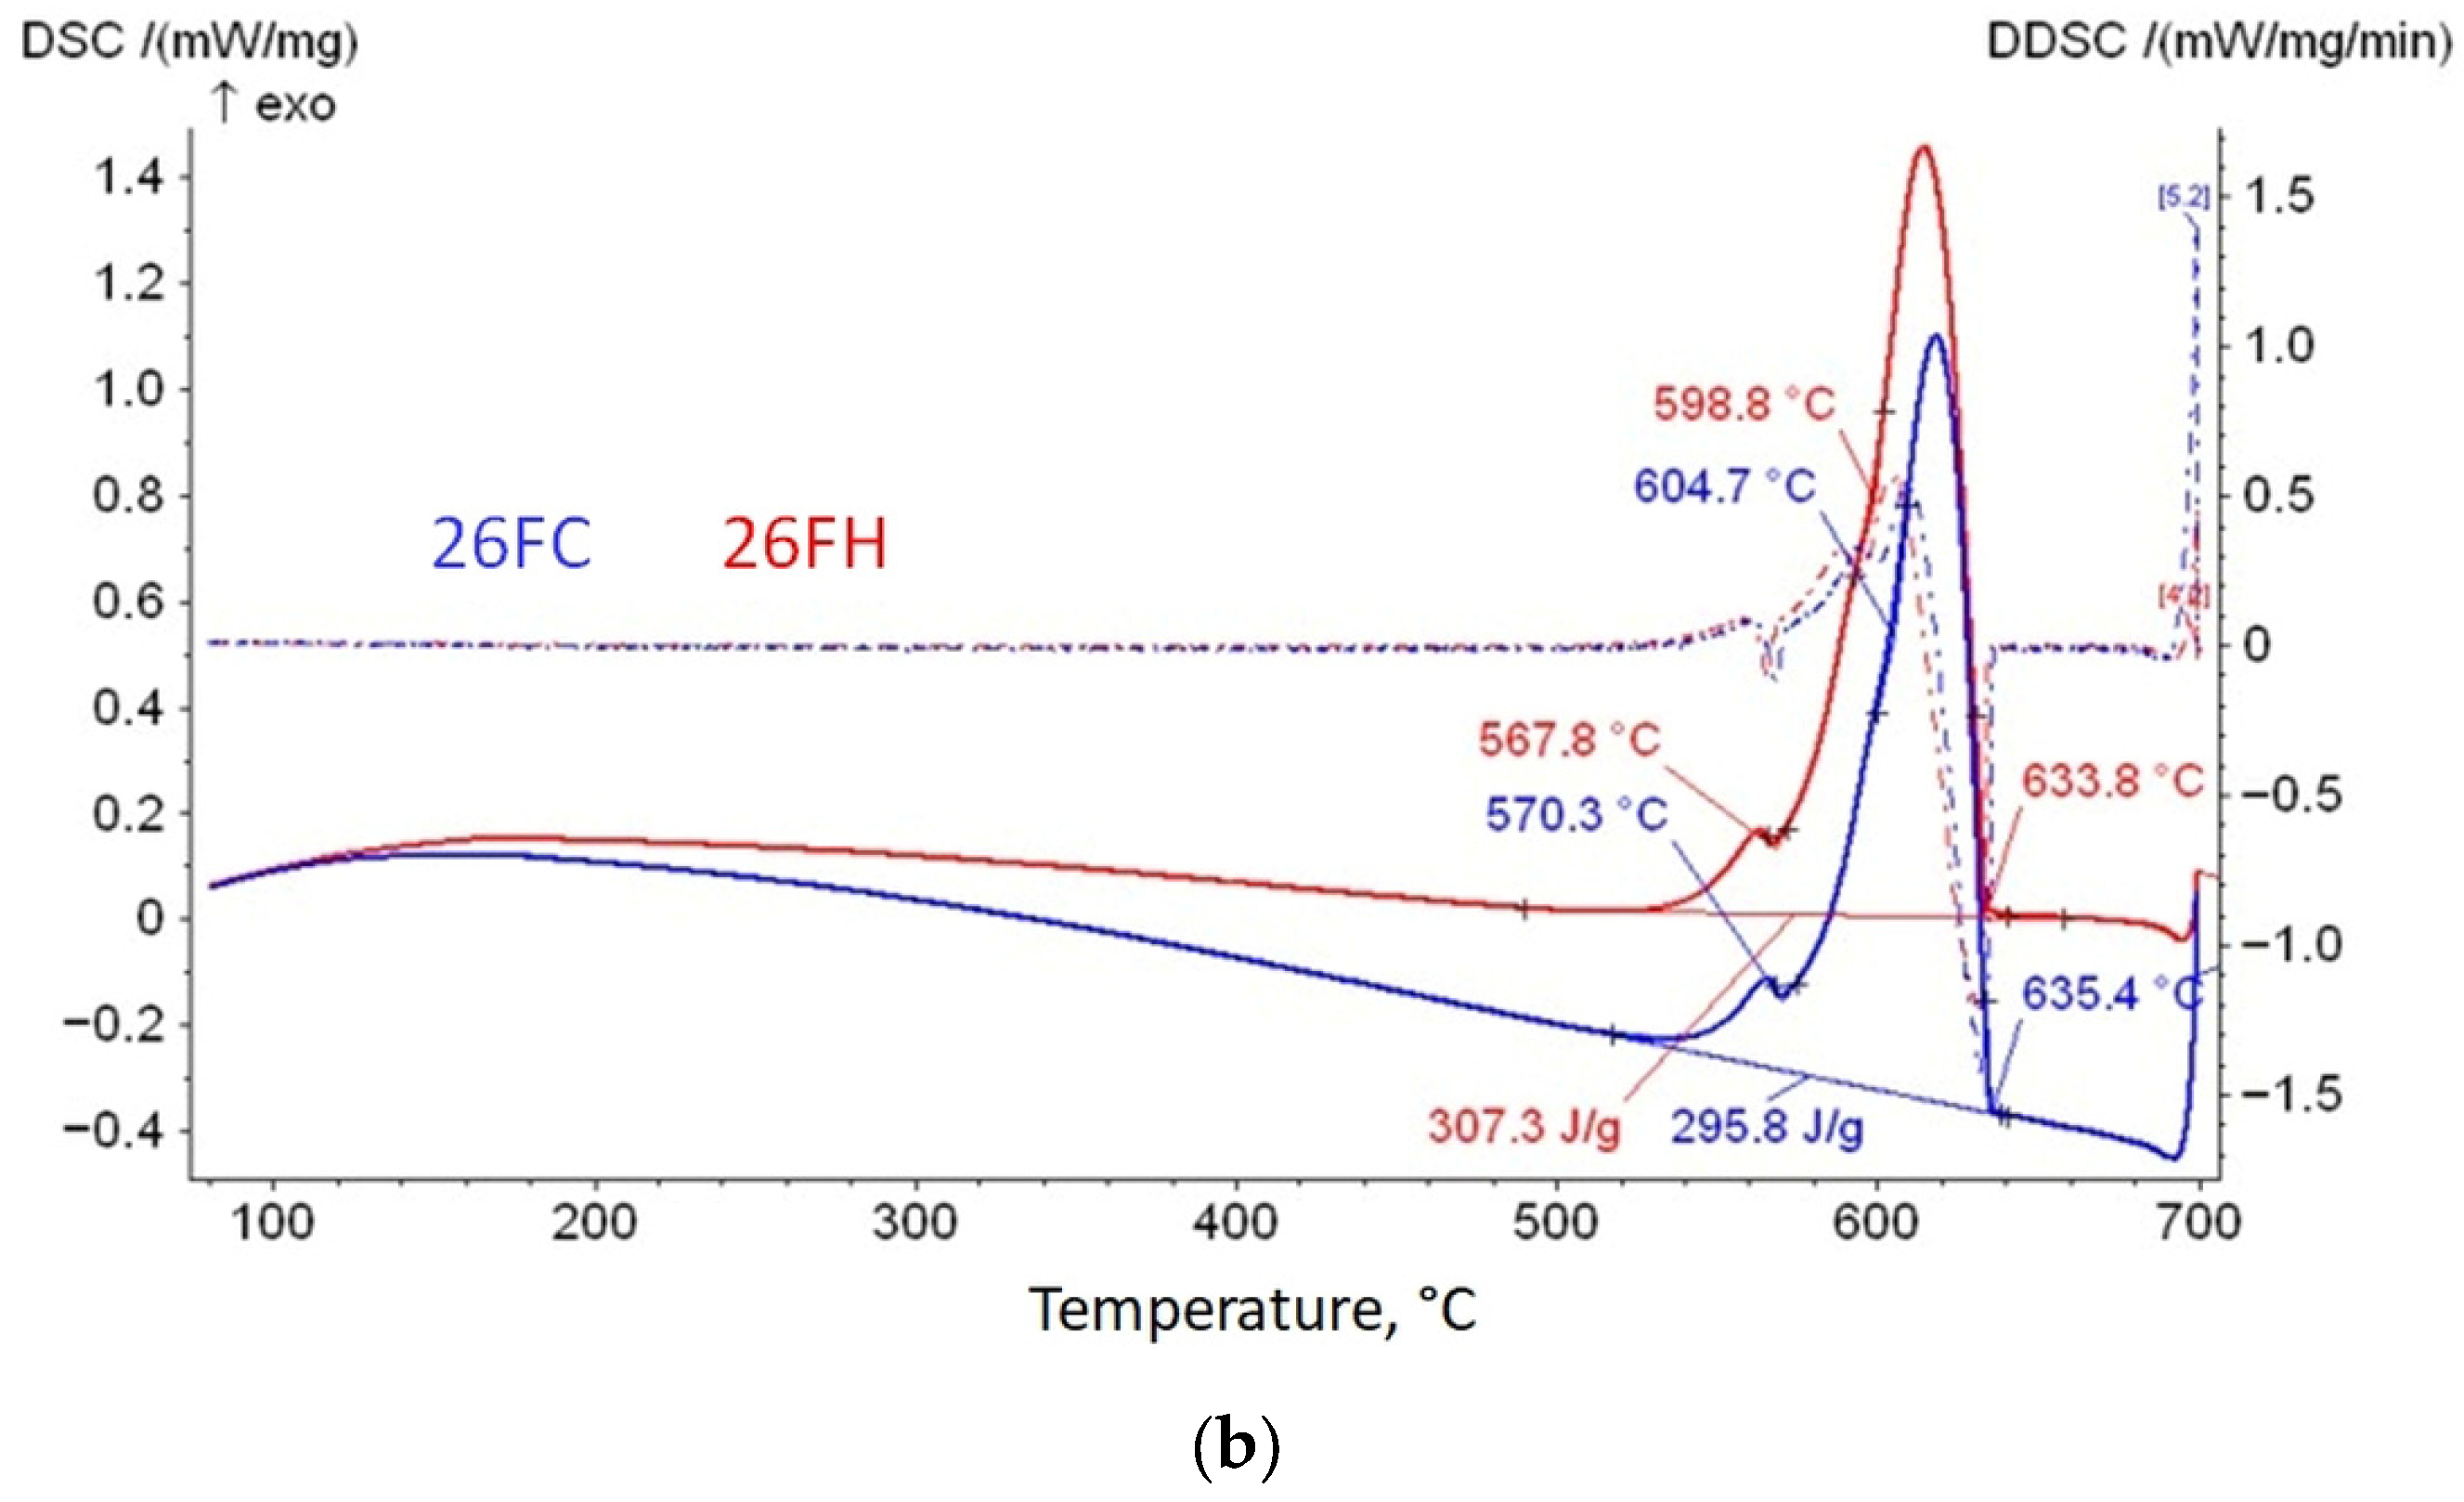
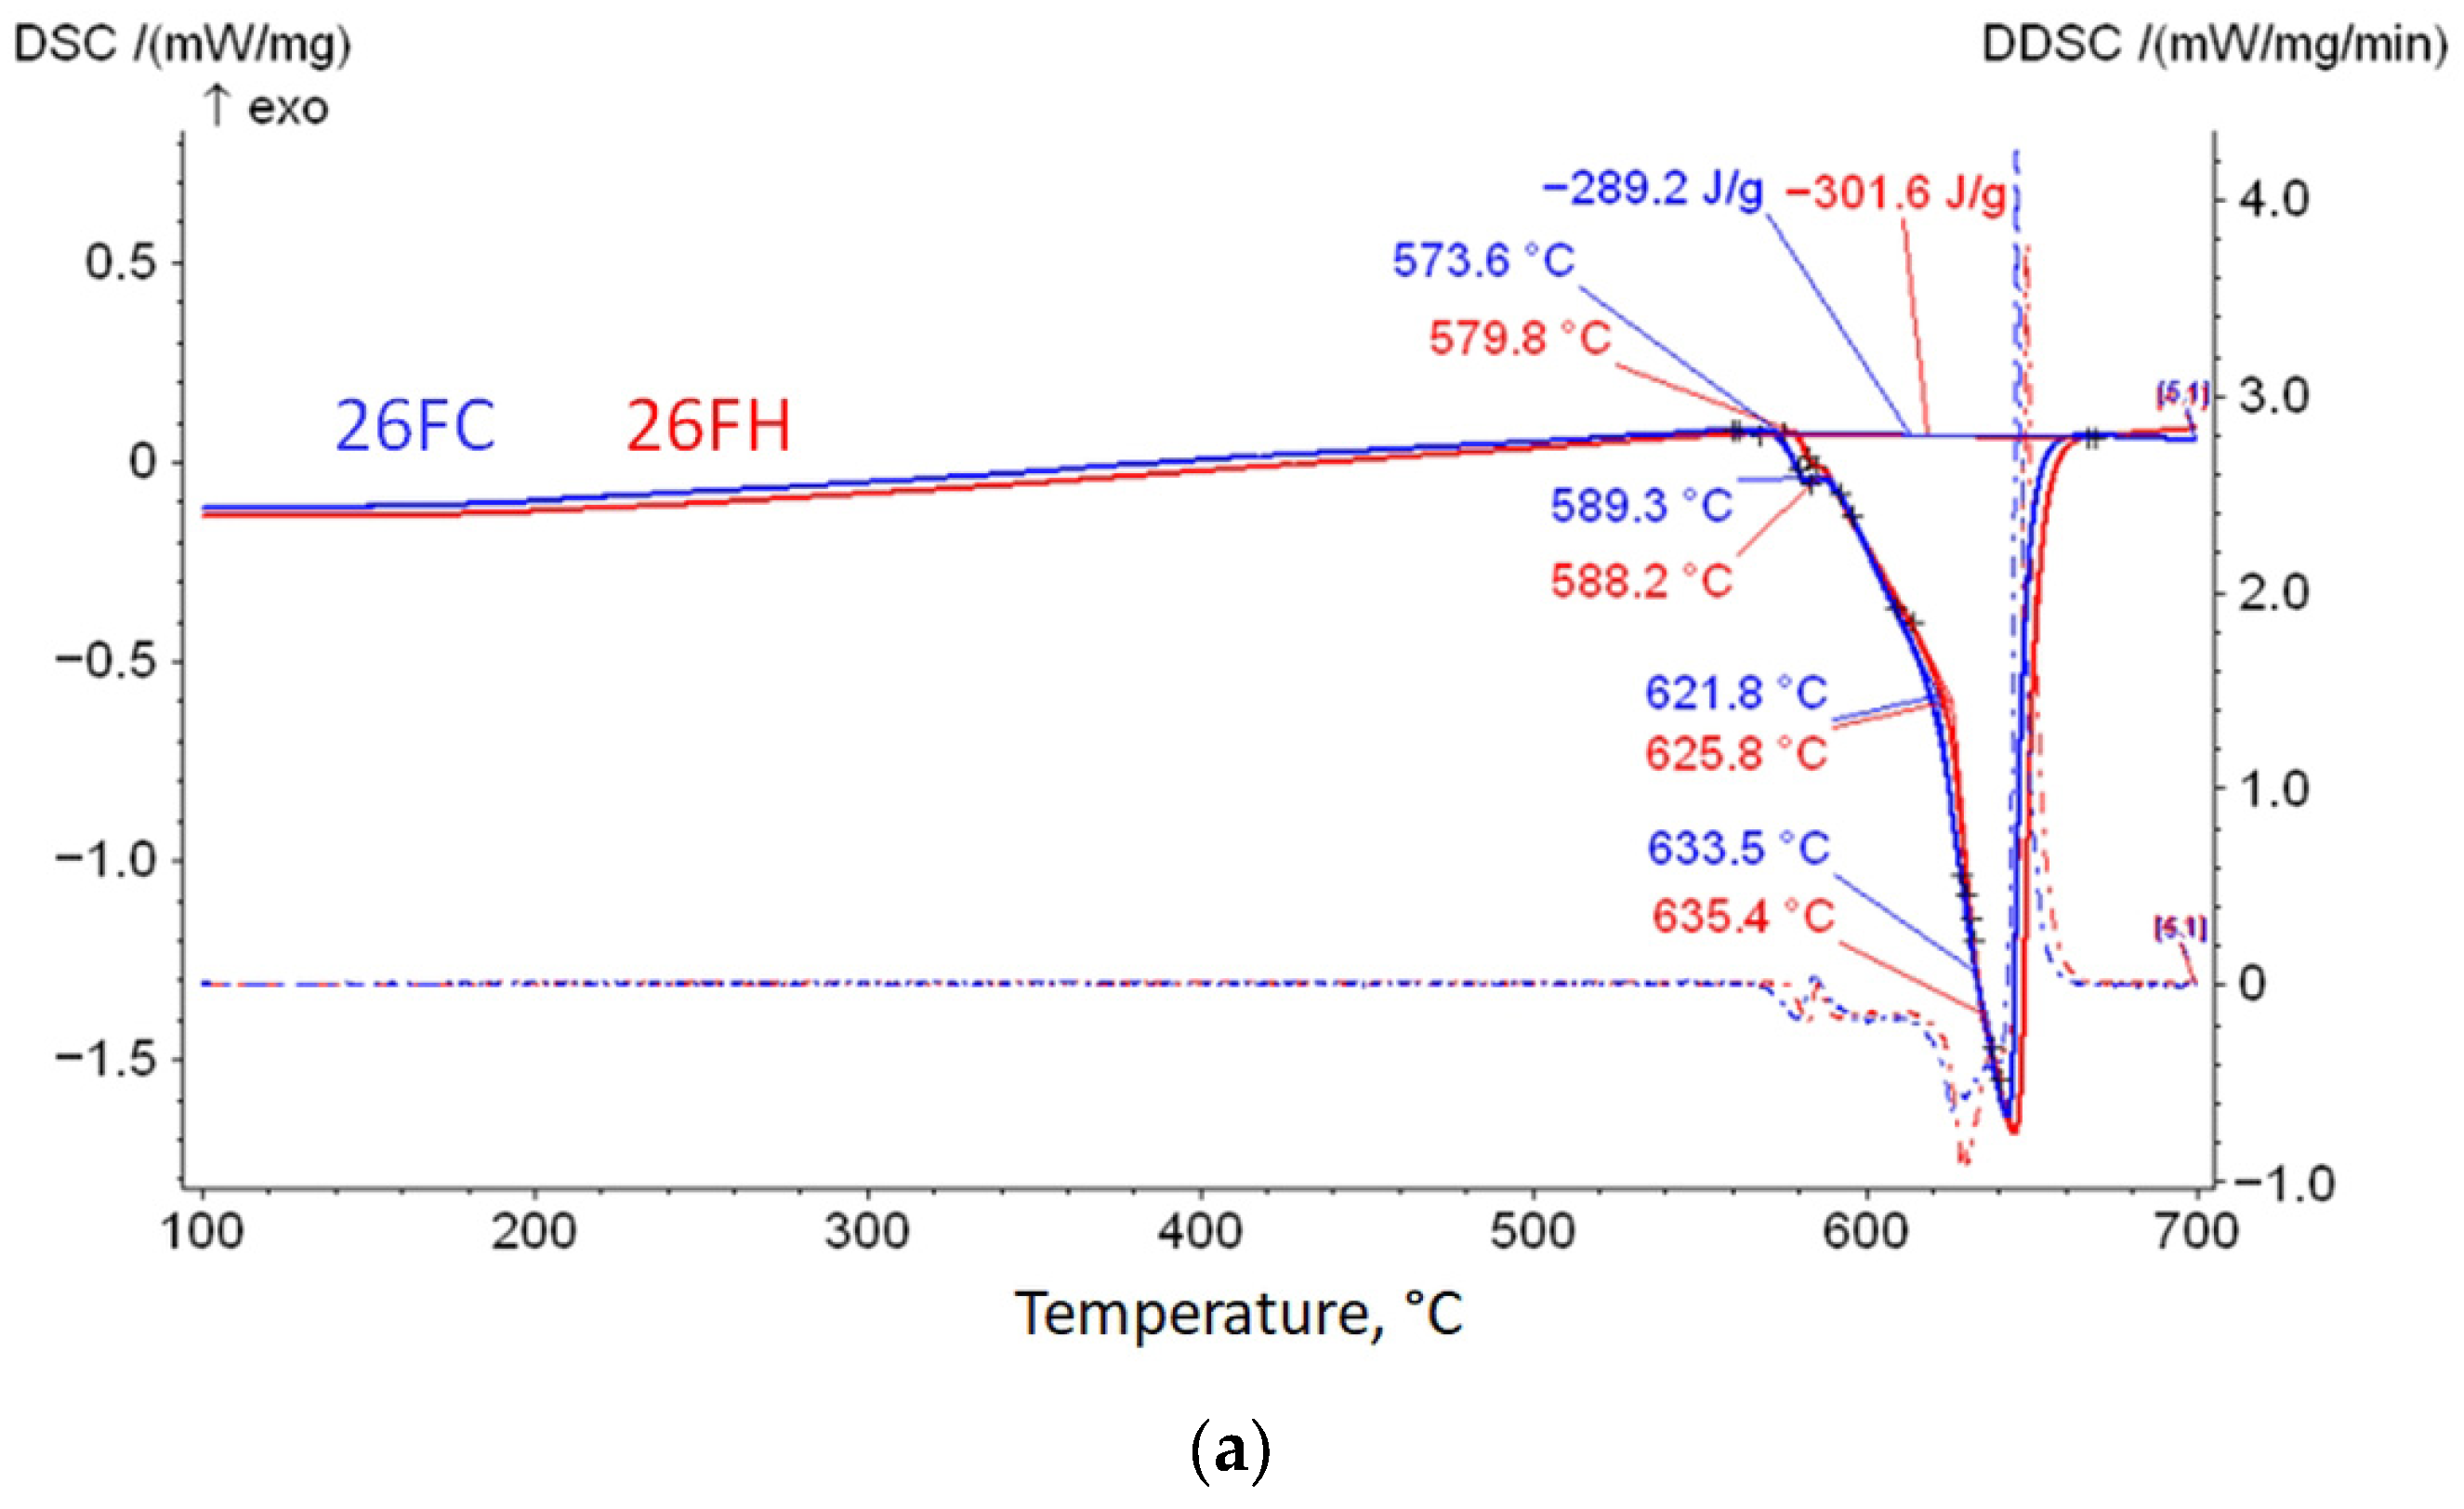
Figure 8 shows the heating and cooling curves, along with their first derivatives, obtained by DSC at a rate of 0.17 °C/s. The characteristic temperatures, heat of fusion, and heat of solidification are summarized in
Table 4.
According to the heating curve of sample 26FC, melting begins at 573.6 °C. The first intermetallic phase (E1) melts at T
E1 = 589.3 °C, while melting of the second intermetallic phase (E2) starts at T
E2 = 621.8 °C. The melting of primary α
Al crystals occurs at 633.5 °C, with a total heat of fusion Q
t = −289.2 J/g. The cooling curve of sample 26FC shows that solidification occurs within the temperature range between 635.4 °C (T
L) and 519.0 °C (T
S). The first intermetallic (E1) solidifies at T
E1 = 604.7 °C, and the second intermetallic (E2) at T
E2 = 570.3 °C. The total heat of solidification is Q
s = 295.8 J/g. The as-cast sample shows higher melting and solidification temperatures. It also exhibits higher intermetallic formation temperatures and a narrower solidification interval (116.4 °C) compared to the homogenized sample (
Table 4, sample 26FC). In contrast, the sample in the homogenized condition displays a slightly wider solidification temperature interval (118.8 °C) with higher specific heats of fusion and solidification (
Table 4, sample 26FH). This behavior may result from partial or complete dissolution of intermetallic phases. It is also associated with redistribution of alloying elements [
27,
43,
48,
53]. In correlation with the results of the one-axis equilibrium calculation, homogenization at 520 °C leads to the dissolution of the Al
18Mg
3(Mn,Cr)
2 and Al
8Mg
5 (β) phases, with the bulking of the α
Al solid solution with Mg (1.12 g/g phase). The non-equilibrium solidification sequence calculations indicate dissolution of the Al
8Mg
5 (β) phase at the homogenization temperature (
Figure 7).
Table 5 summarizes the principal solidification events identified from the DSC curves and correlated with the non-equilibrium calculation results. Because the DSC curves show only the dominant thermal effects,
Table 5 can be considered a simplified interpretation of the melting and solidification sequence. In both metallurgical conditions, microstructure development begins with the solidification of the primary α
Al dendritic network, followed by the solidification of the Fe-bearing Al
6(Fe,Mn) phase (E1). The simplified solidification sequence concludes with the solidification of Mg
2Si (E2). In the homogenized condition, both reactions (E1 and E2) occur over a wider temperature interval.
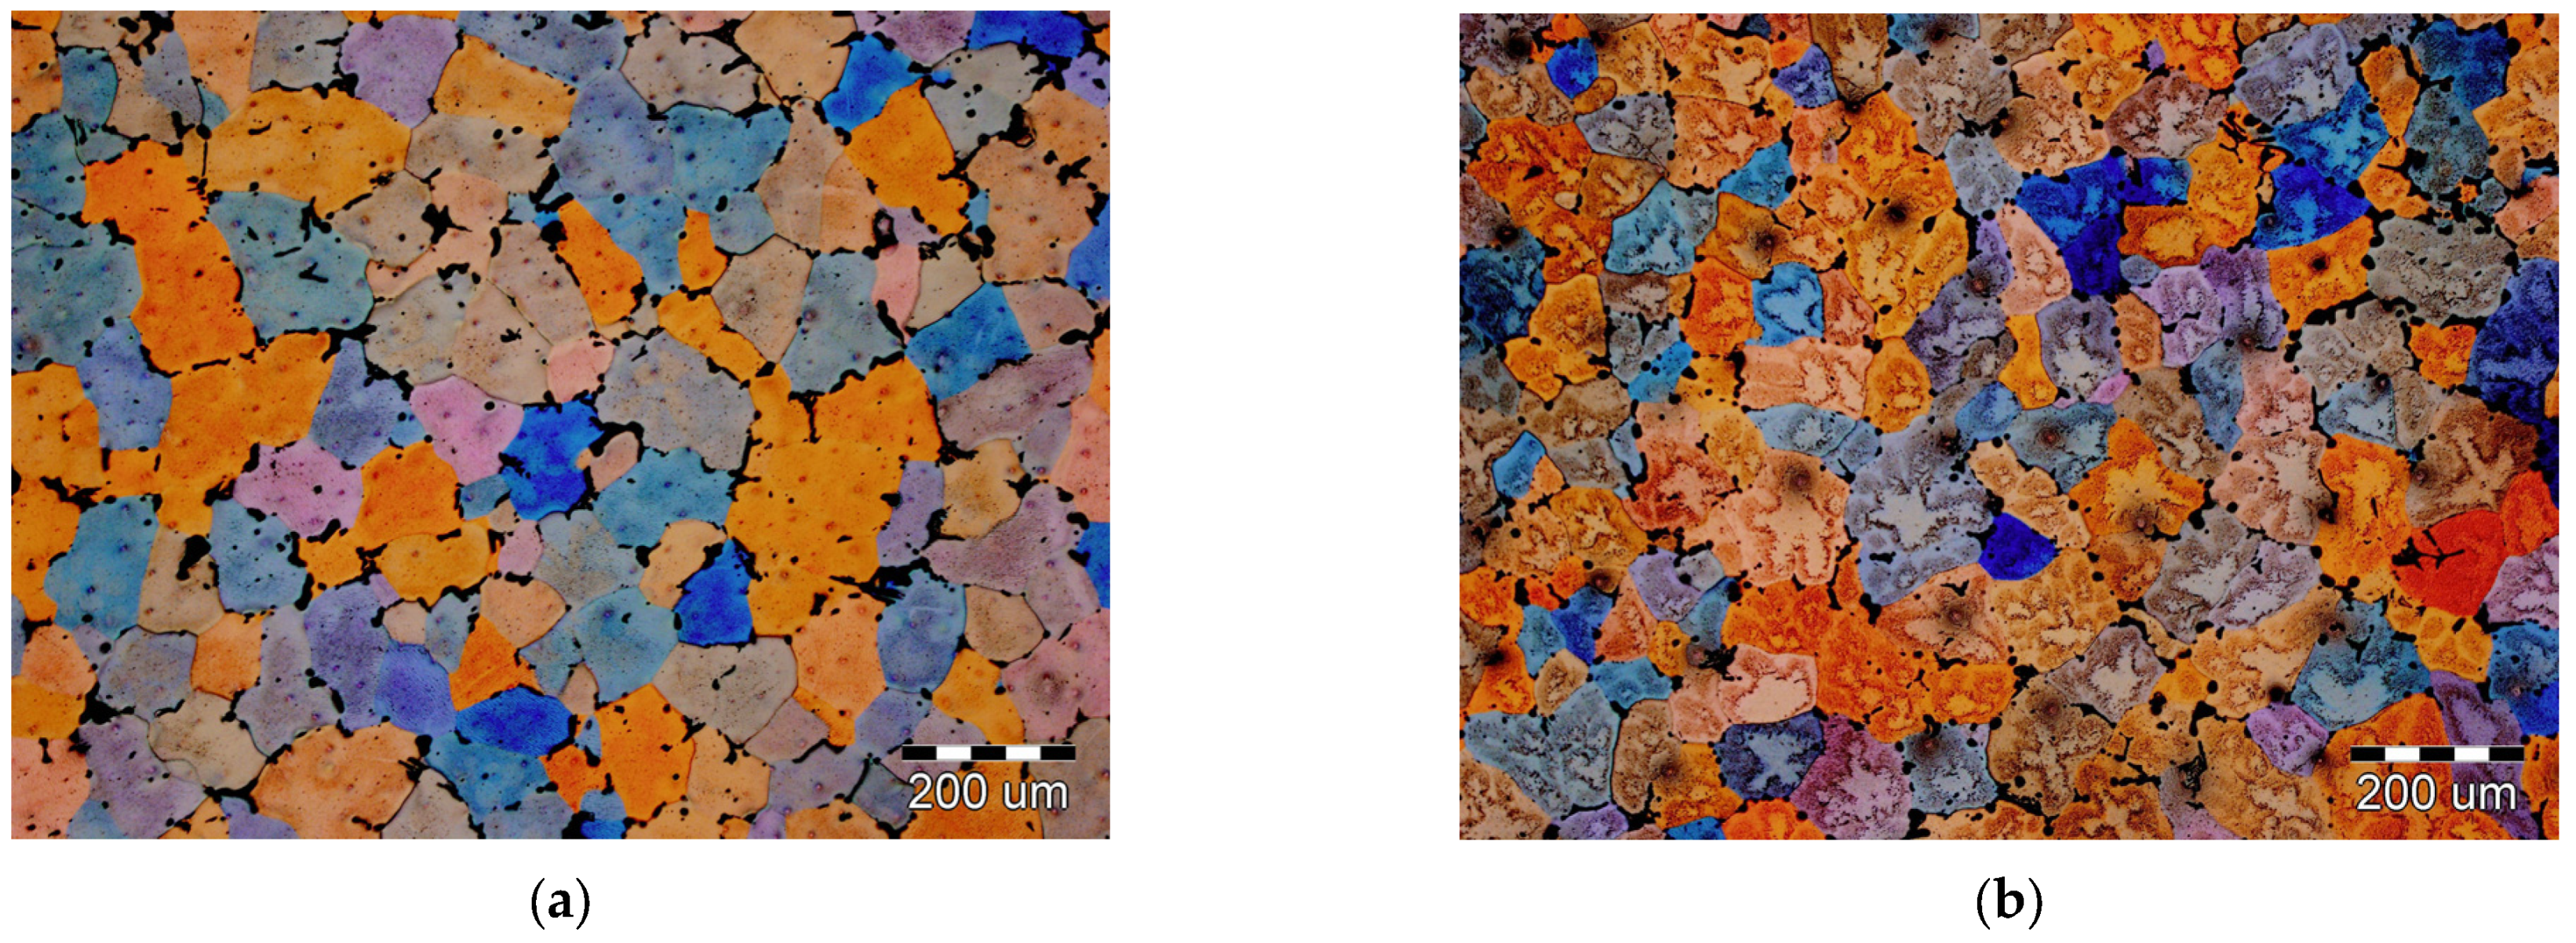
The microstructures of the 26FC and 26FH samples used to determine the average grain size are shown in
Figure 9. The results of the intercept grain size measurements are presented in
Table 6.
The microstructure of the samples in both metallurgical conditions consists of equiaxed α
Al grains. Quantitative analysis show higher grain size number (G) values and an increased number of grains per unit area (N
A) in the homogenized sample. Grain size refinement results from dissolution of intermetallic phases, followed by solute redistribution and recrystallisation. In the binary Al-Mg system, a homogenization temperature of 520.0 °C is sufficient to achieve a monophase α
Al region, while in the Al-Mg-Si system, the microstructure at this temperature consists of a multiphase (α
Al + Mg
2Si) region [
51]. Although thermodynamic calculations suggest that homogenization could have an influence on several intermetallic phases (
Table 2 and
Table 3), the applied temperature is not sufficient enough to affect principal solidification events identified in
Table 5.
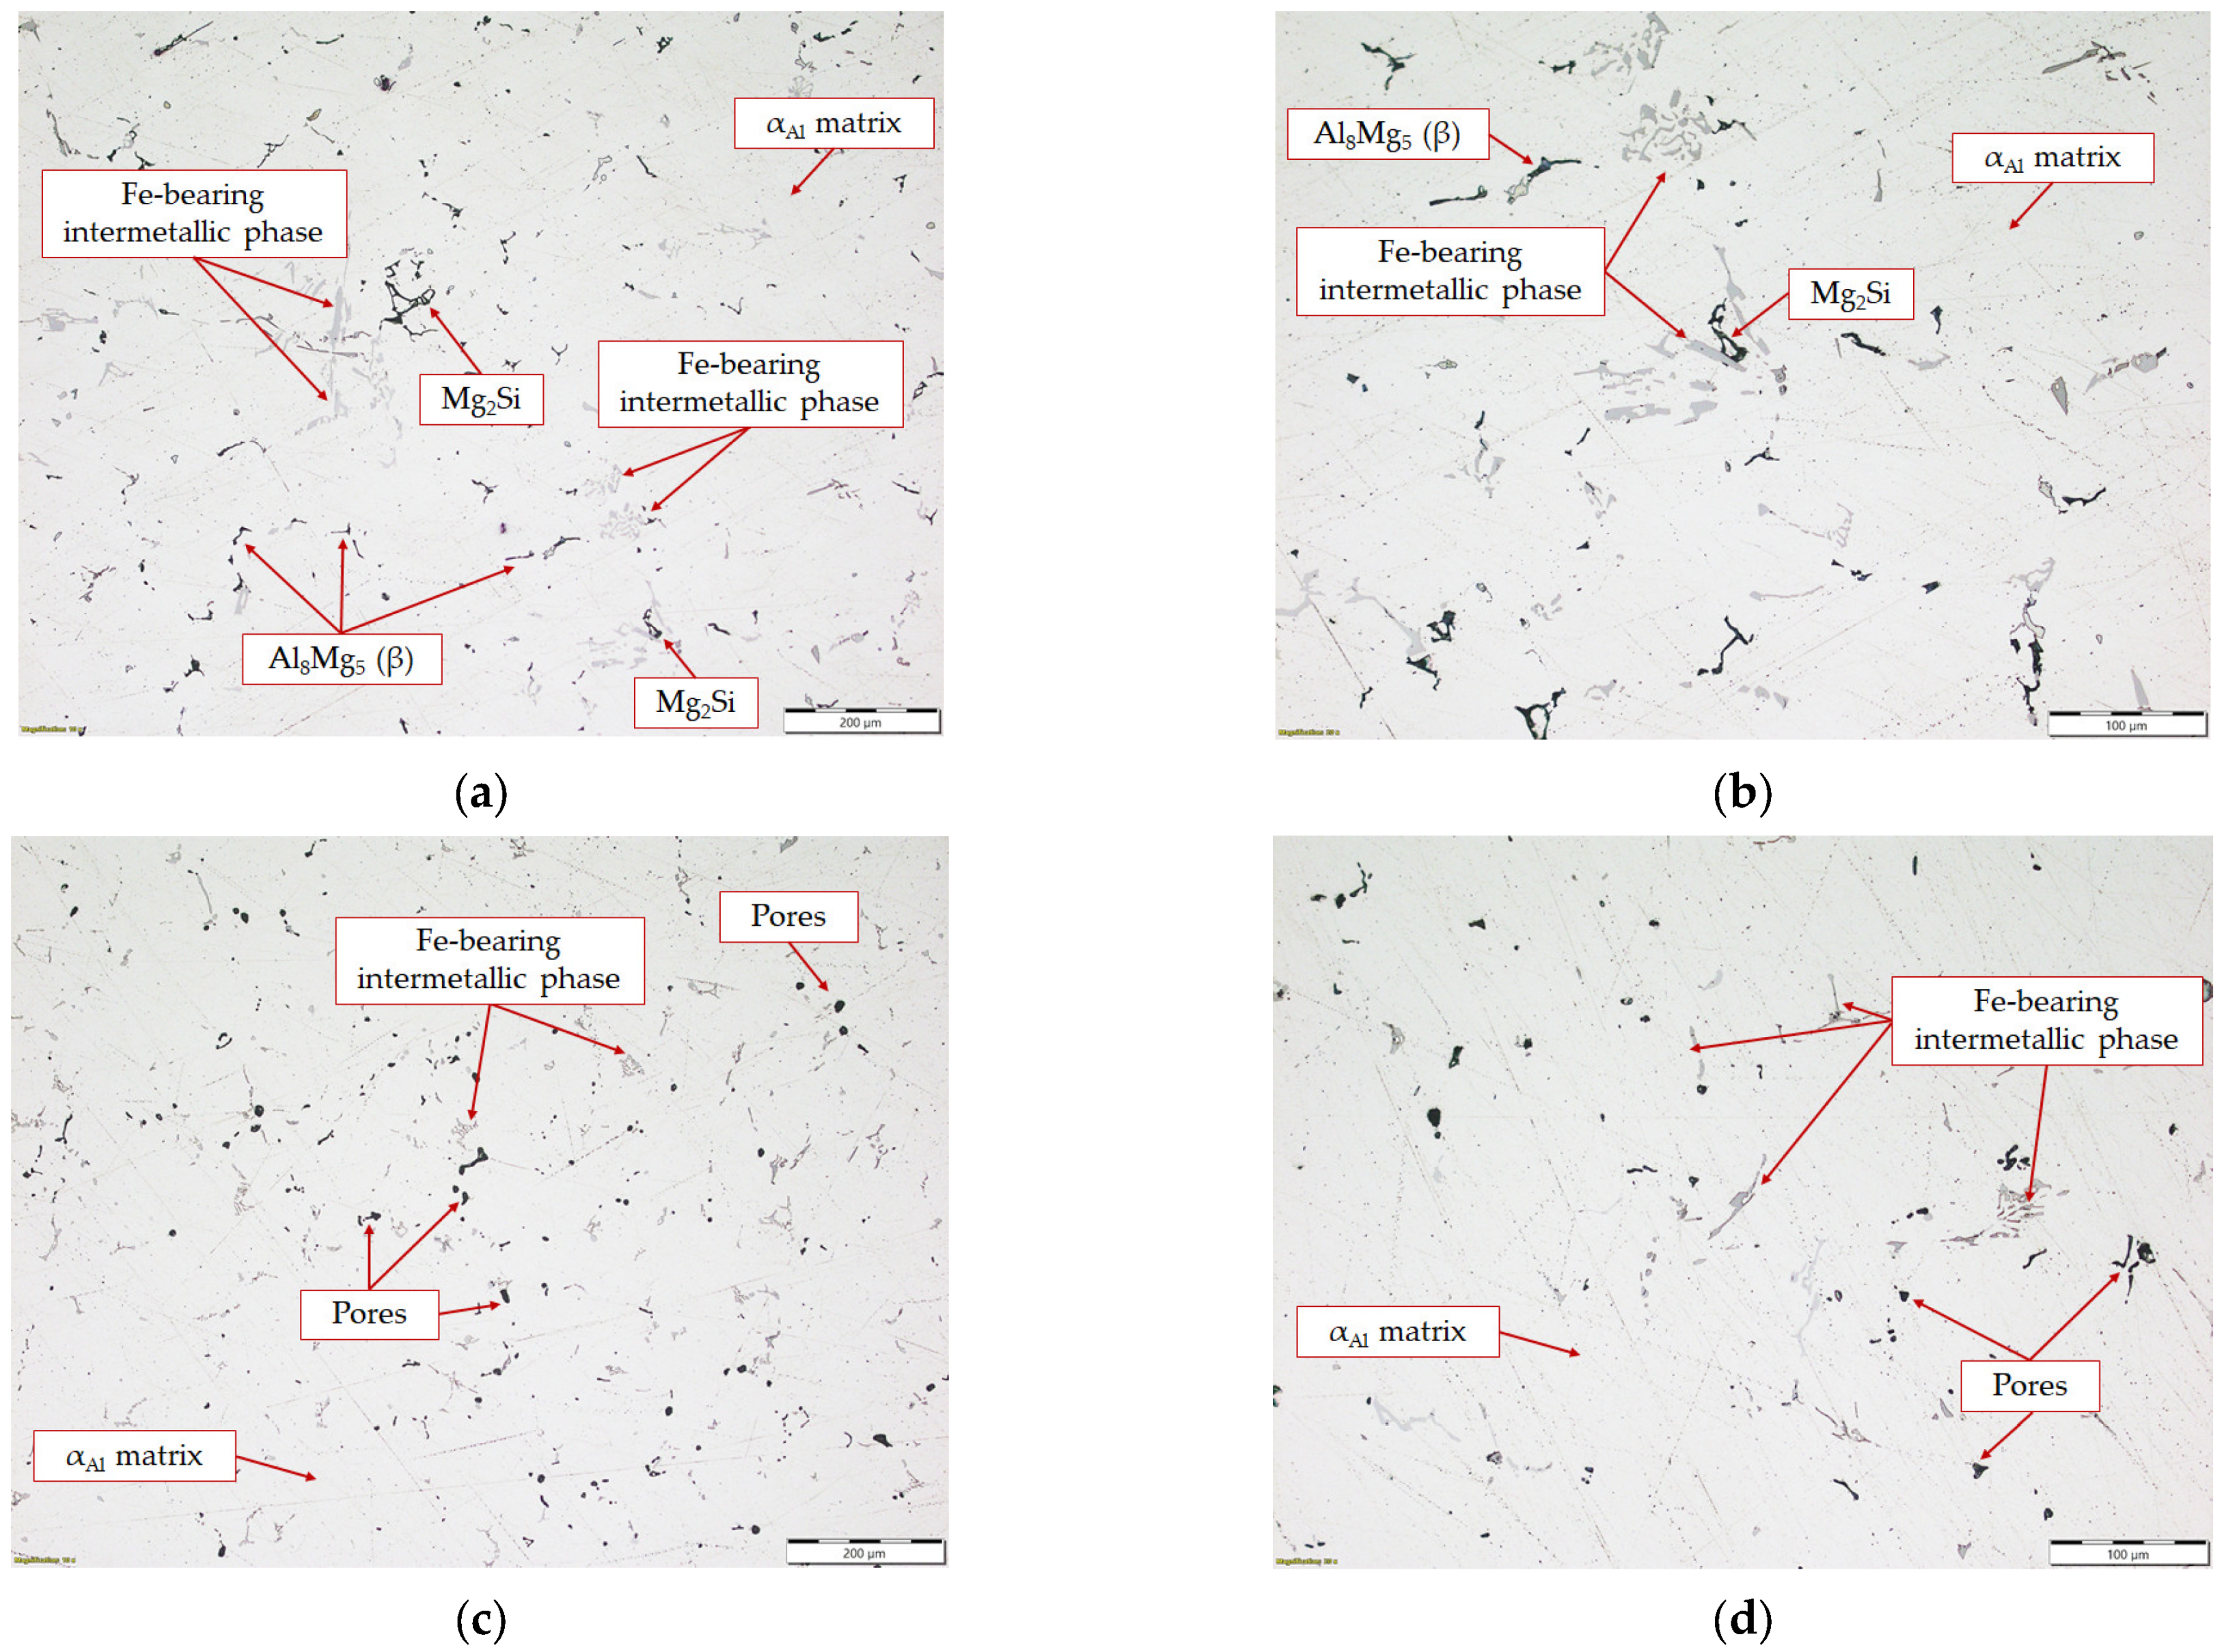
The microstructure of the 26FC and 26FH samples with indicated intermetallic phases is given in
Figure 10.
The microstructure of the 26FC sample in the as-cast condition consists of an α
Al matrix and intermetallic phases. Based on their morphology, these intermetallic phases were interpreted as Fe-bearing intermetallic phases with needle-like and “Chinese script” morphologies, Mg
2Si with coarse, irregular morphology, and the Al
8Mg
5 (β) phase, exhibiting a semi-continuous distribution at the last solidifying areas in the microstructure (
Figure 10a,b). In the α
Al matrix of the homogenized sample, Fe-bearing intermetallic phases and porosities are present (
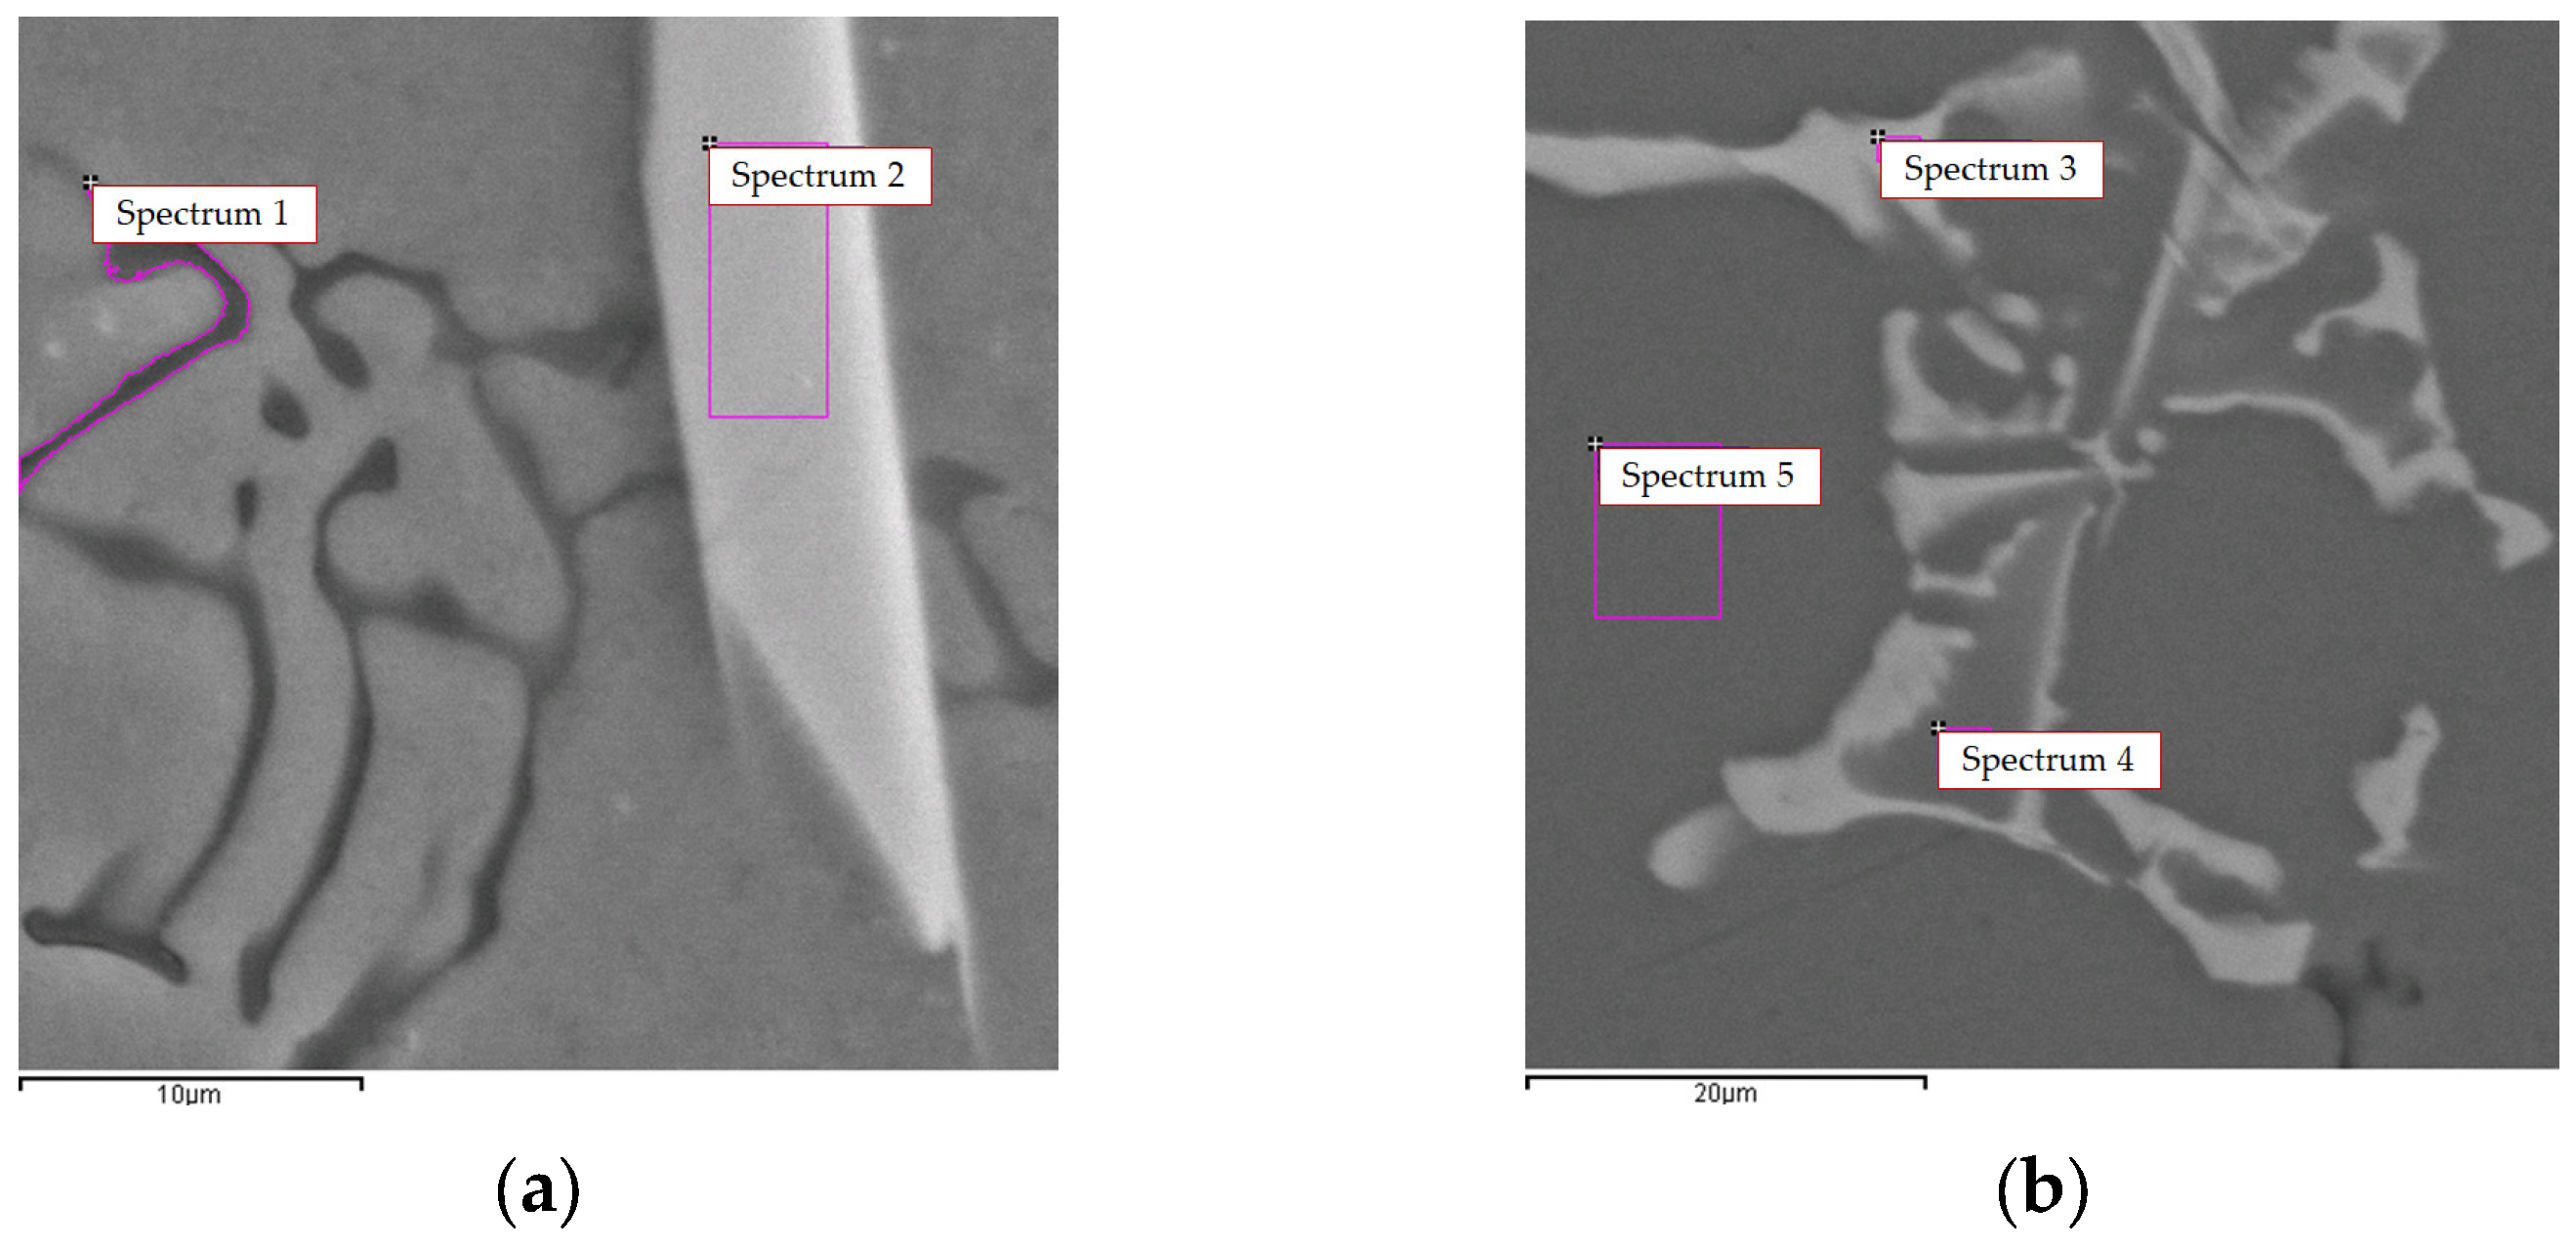
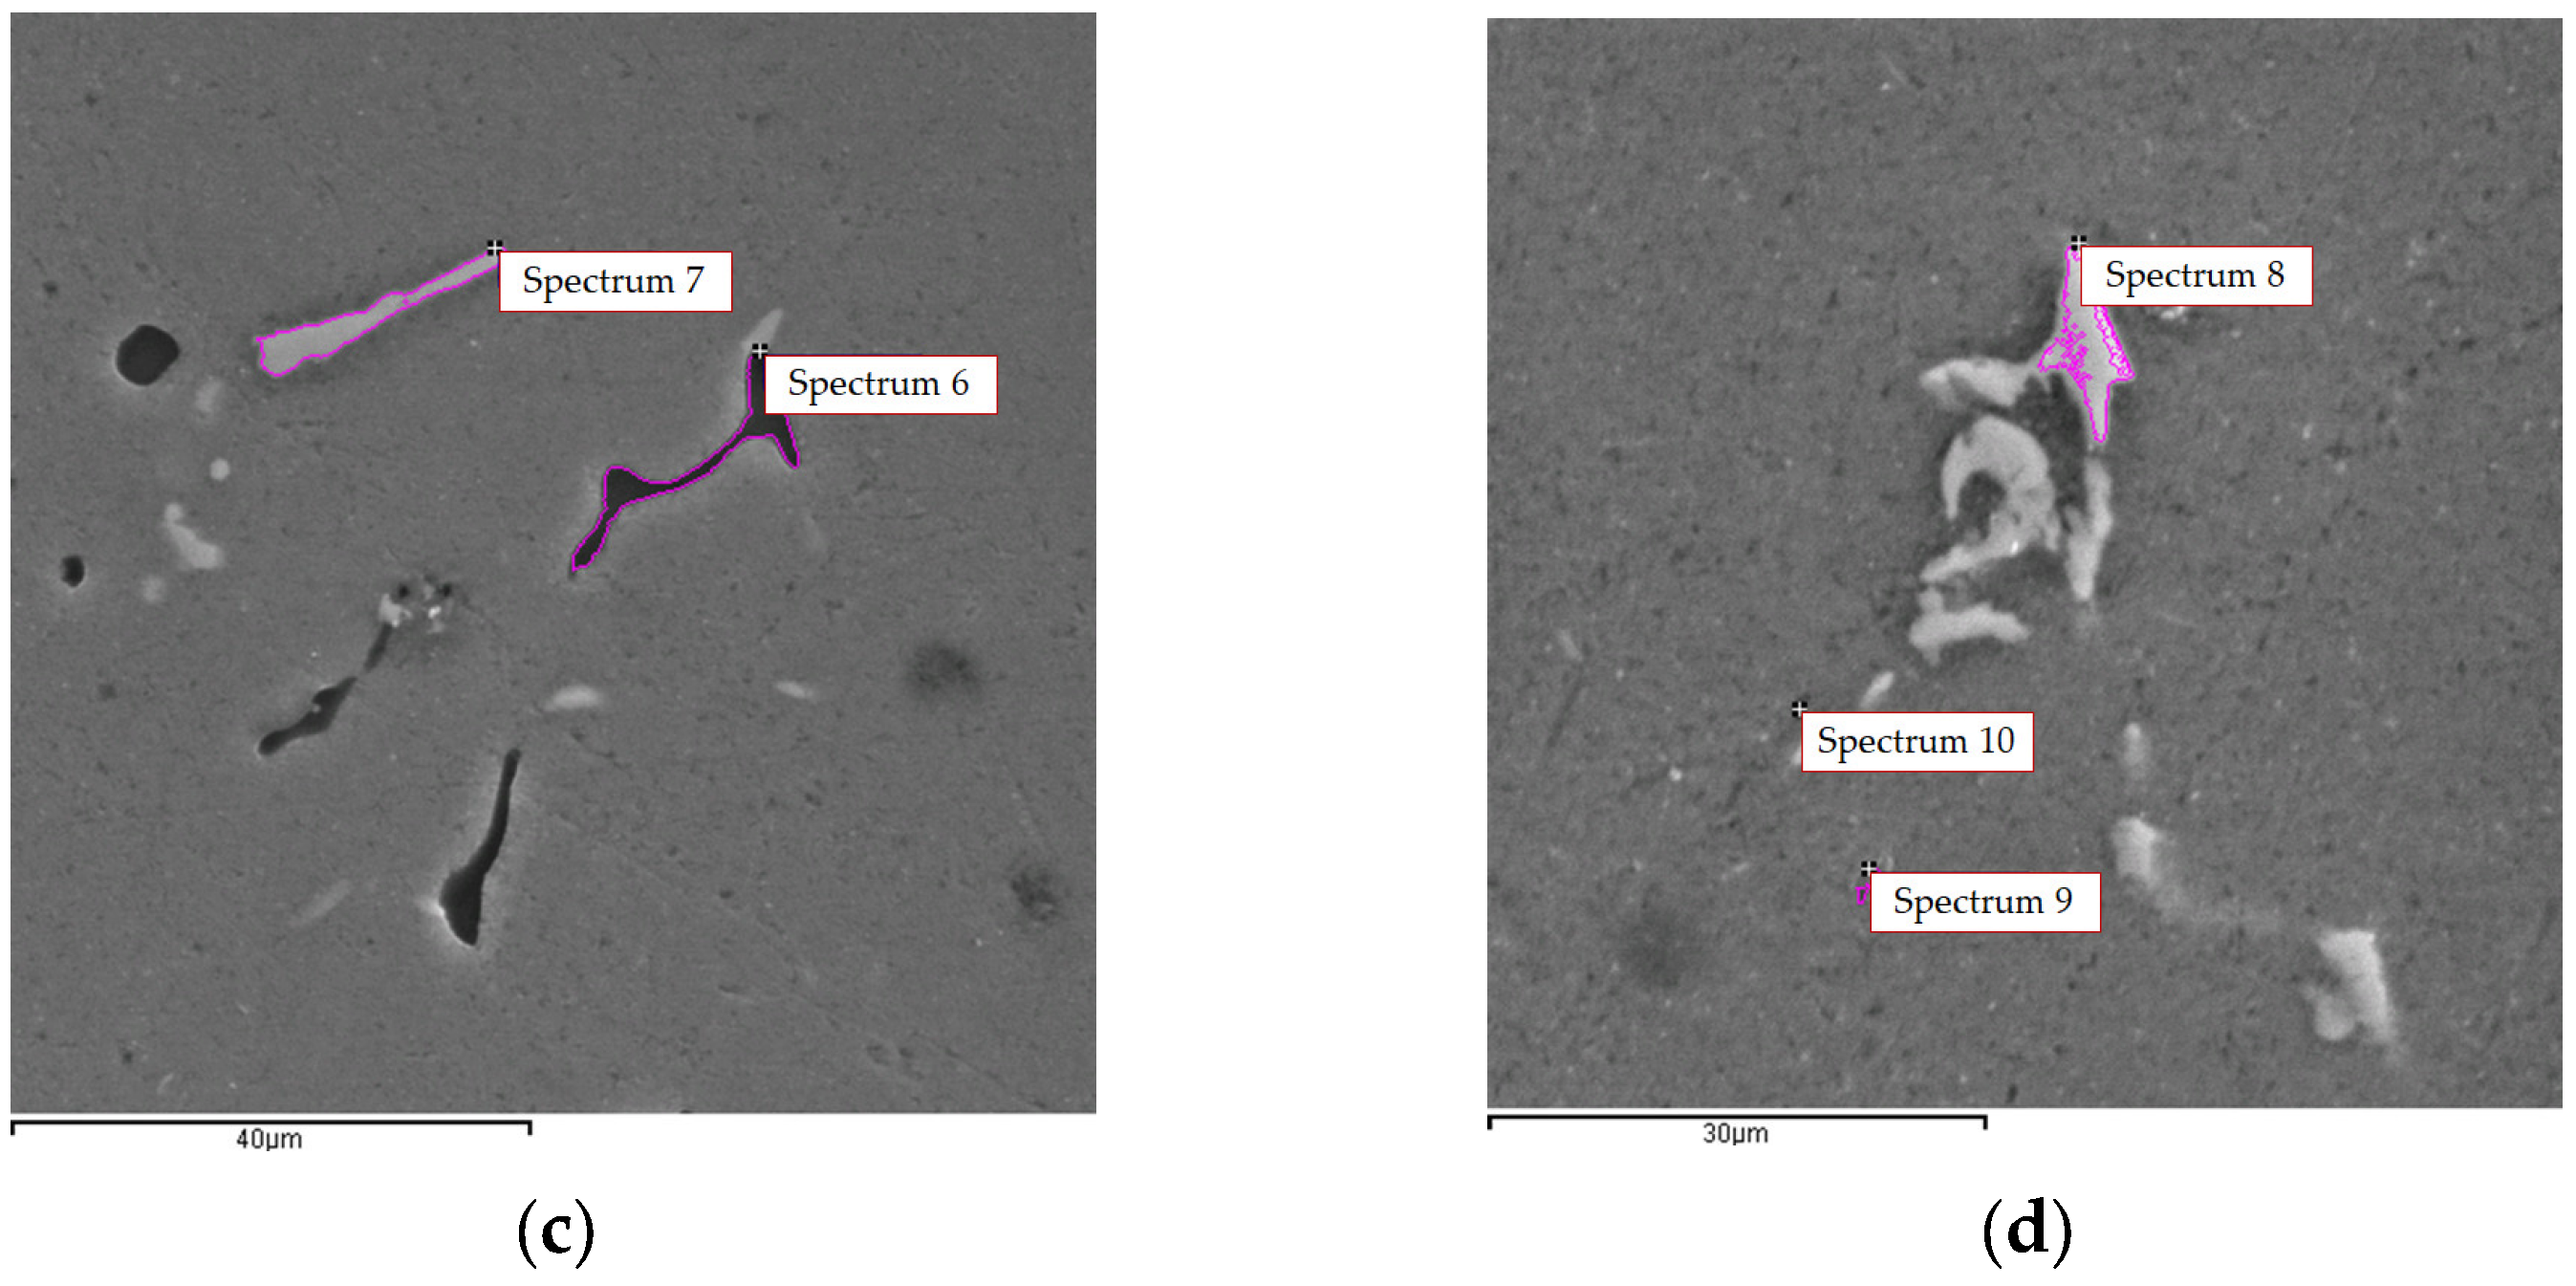
Figure 10c,d). The combined results of SEM and EDS analysis shown in
Figure 11 and
Table 7 confirm the presence of Mg
2Si and Fe-bearing intermetallic phases with needle-like and “Chinese script” morphologies in the microstructure of sample 26FC.
Quantitative analysis of the Fe-containing intermetallic particles indicates that both morphologies contain Fe and Mn in similar proportions. The main compositional difference between the observed morphologies is the presence of Mg in the Fe-bearing intermetallic phases with “Chinese script” morphology. Previous investigations have shown that Mg can influence the morphology of Fe-containing intermetallic phases by altering the local solute distribution during solidification and subsequent heat treatment [
27,
53,
54]. Homogenization led to the dissolution of the Al
8Mg
5 (β) intermetallic phase and the formation of irregularly shaped pores (
Figure 11c). Quantitative analysis also showed no significant enrichment of the α
Al matrix with Mg during homogenization (
Table 7). In addition, minor compositional differences between the Fe-bearing intermetallic phases with needle-like and “Chinese script” morphologies were observed (
Table 7). Similar observations have been reported in previous studies, which indicate that Fe-bearing intermetallic phases in Al-Mg alloys generally remain stable during homogenization, although minor compositional or morphological modifications may occur depending on the alloy composition and heat treatment conditions [
27,
53,
54].
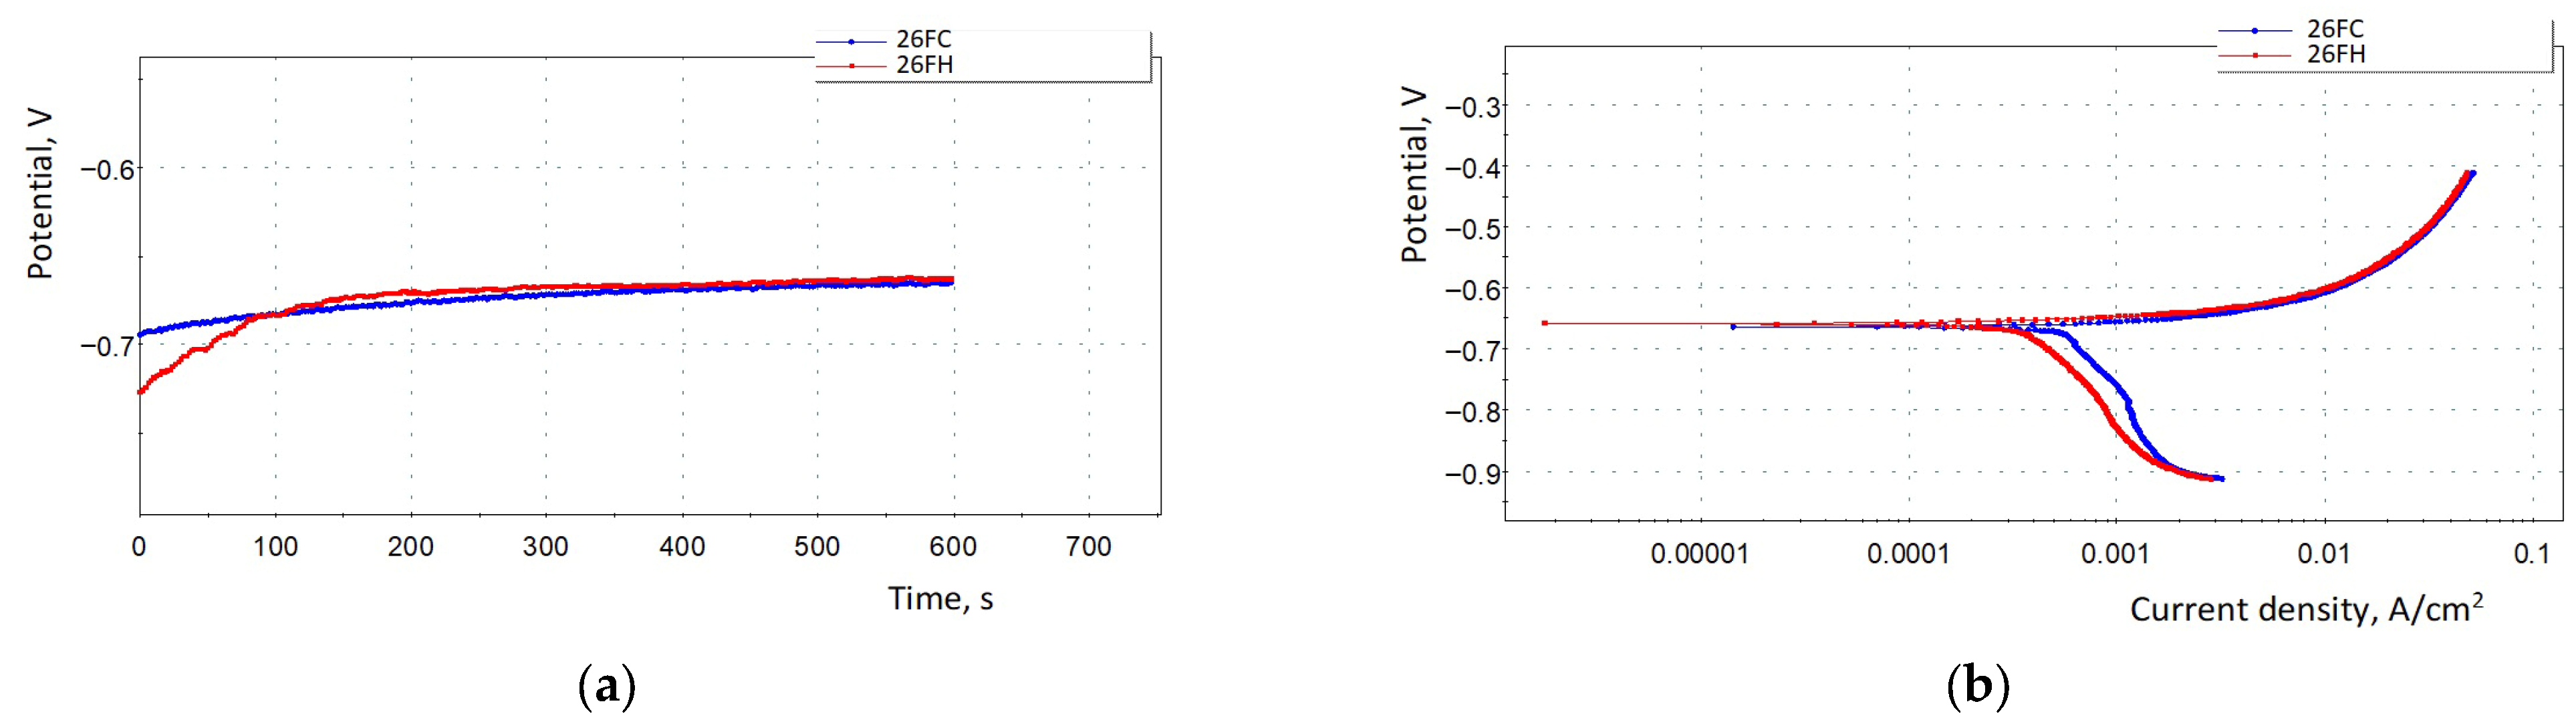
The results of electrochemical testing are shown in
Figure 12, with the corresponding corrosion parameters listed in
Table 8.
The samples in both metallurgical conditions rapidly reach the open circuit potential, which stabilizes within approximately 600 s (
Figure 12a). The negative corrosion potentials of both samples reflect their instability and ongoing dissolution in the EXCO solution. The homogenized sample 26FH shows slightly improved stability and corrosion resistance, as indicated by a marginally more positive corrosion potential (approximately 3 mV) compared to the as-cast sample 26FC (
Figure 12a). In contrast, the as-cast sample 26FC shows a higher corrosion potential (E
corr) along with a higher corrosion current density (i
corr), suggesting increased electrochemical activity in the EXCO solution (
Table 8). Analysis of the Tafel polarization curves (
Figure 12b) reveals steeper cathodic slopes for samples in both metallurgical conditions (
Table 8). Cathodic reactions are governed by the presence of Fe-bearing intermetallic phases, which promote dissolution of the surrounding α
Al matrix under simulated degradation conditions. However, based on thermodynamic and microstructural analyses, the higher cathodic slope observed for the 26FC sample cannot be attributed to a single factor. The homogenization temperature did not significantly affect the cathodic intermetallic phases, suggesting that other microstructural features may also influence this behavior (
Table 5). The higher anodic slope observed (bₐ) for the 26FC sample (
Table 8) points to more complex anodic dissolution kinetics, which, together with the increased current density, can be attributed to dealloying processes. This behavior is consistent with the presence of the anodic Al
8Mg
5 (β) phase in the as-cast microstructure, whose dissolution during homogenization reduces alloy sensitization and the extent of localized anodic activity. Although homogenization may be accompanied by grain refinement, which can increase the number of active sites, the observed reduction in corrosion rate is primarily associated with the dissolution of the Al
8Mg
5 (β) phase and the corresponding decrease in anodic activity. These electrochemical observations are consistent with metallographic findings, which confirm the presence of anodic Al
8Mg
5 (β) and Mg
2Si phases in the microstructure of the as-cast sample (
Figure 10a,b). After homogenization, the Al
8Mg
5 (β) anodic phases are dissolved, accompanied by pore formation (
Figure 10c,d). The sample in the as-cast condition exhibits a higher average corrosion rate (
Table 8, 7.185 ± 0.163 mm yr
−1) compared to the homogenized sample (
Table 8, 4.040 ± 0.382 mm yr
−1). This difference in corrosion rate is consistent across repeated measurements, as confirmed by the calculated average values and relatively low standard deviation (
Table 8). The corrosion rate of both samples is higher than the results of other investigations simulating similar types of severe degradation environments.
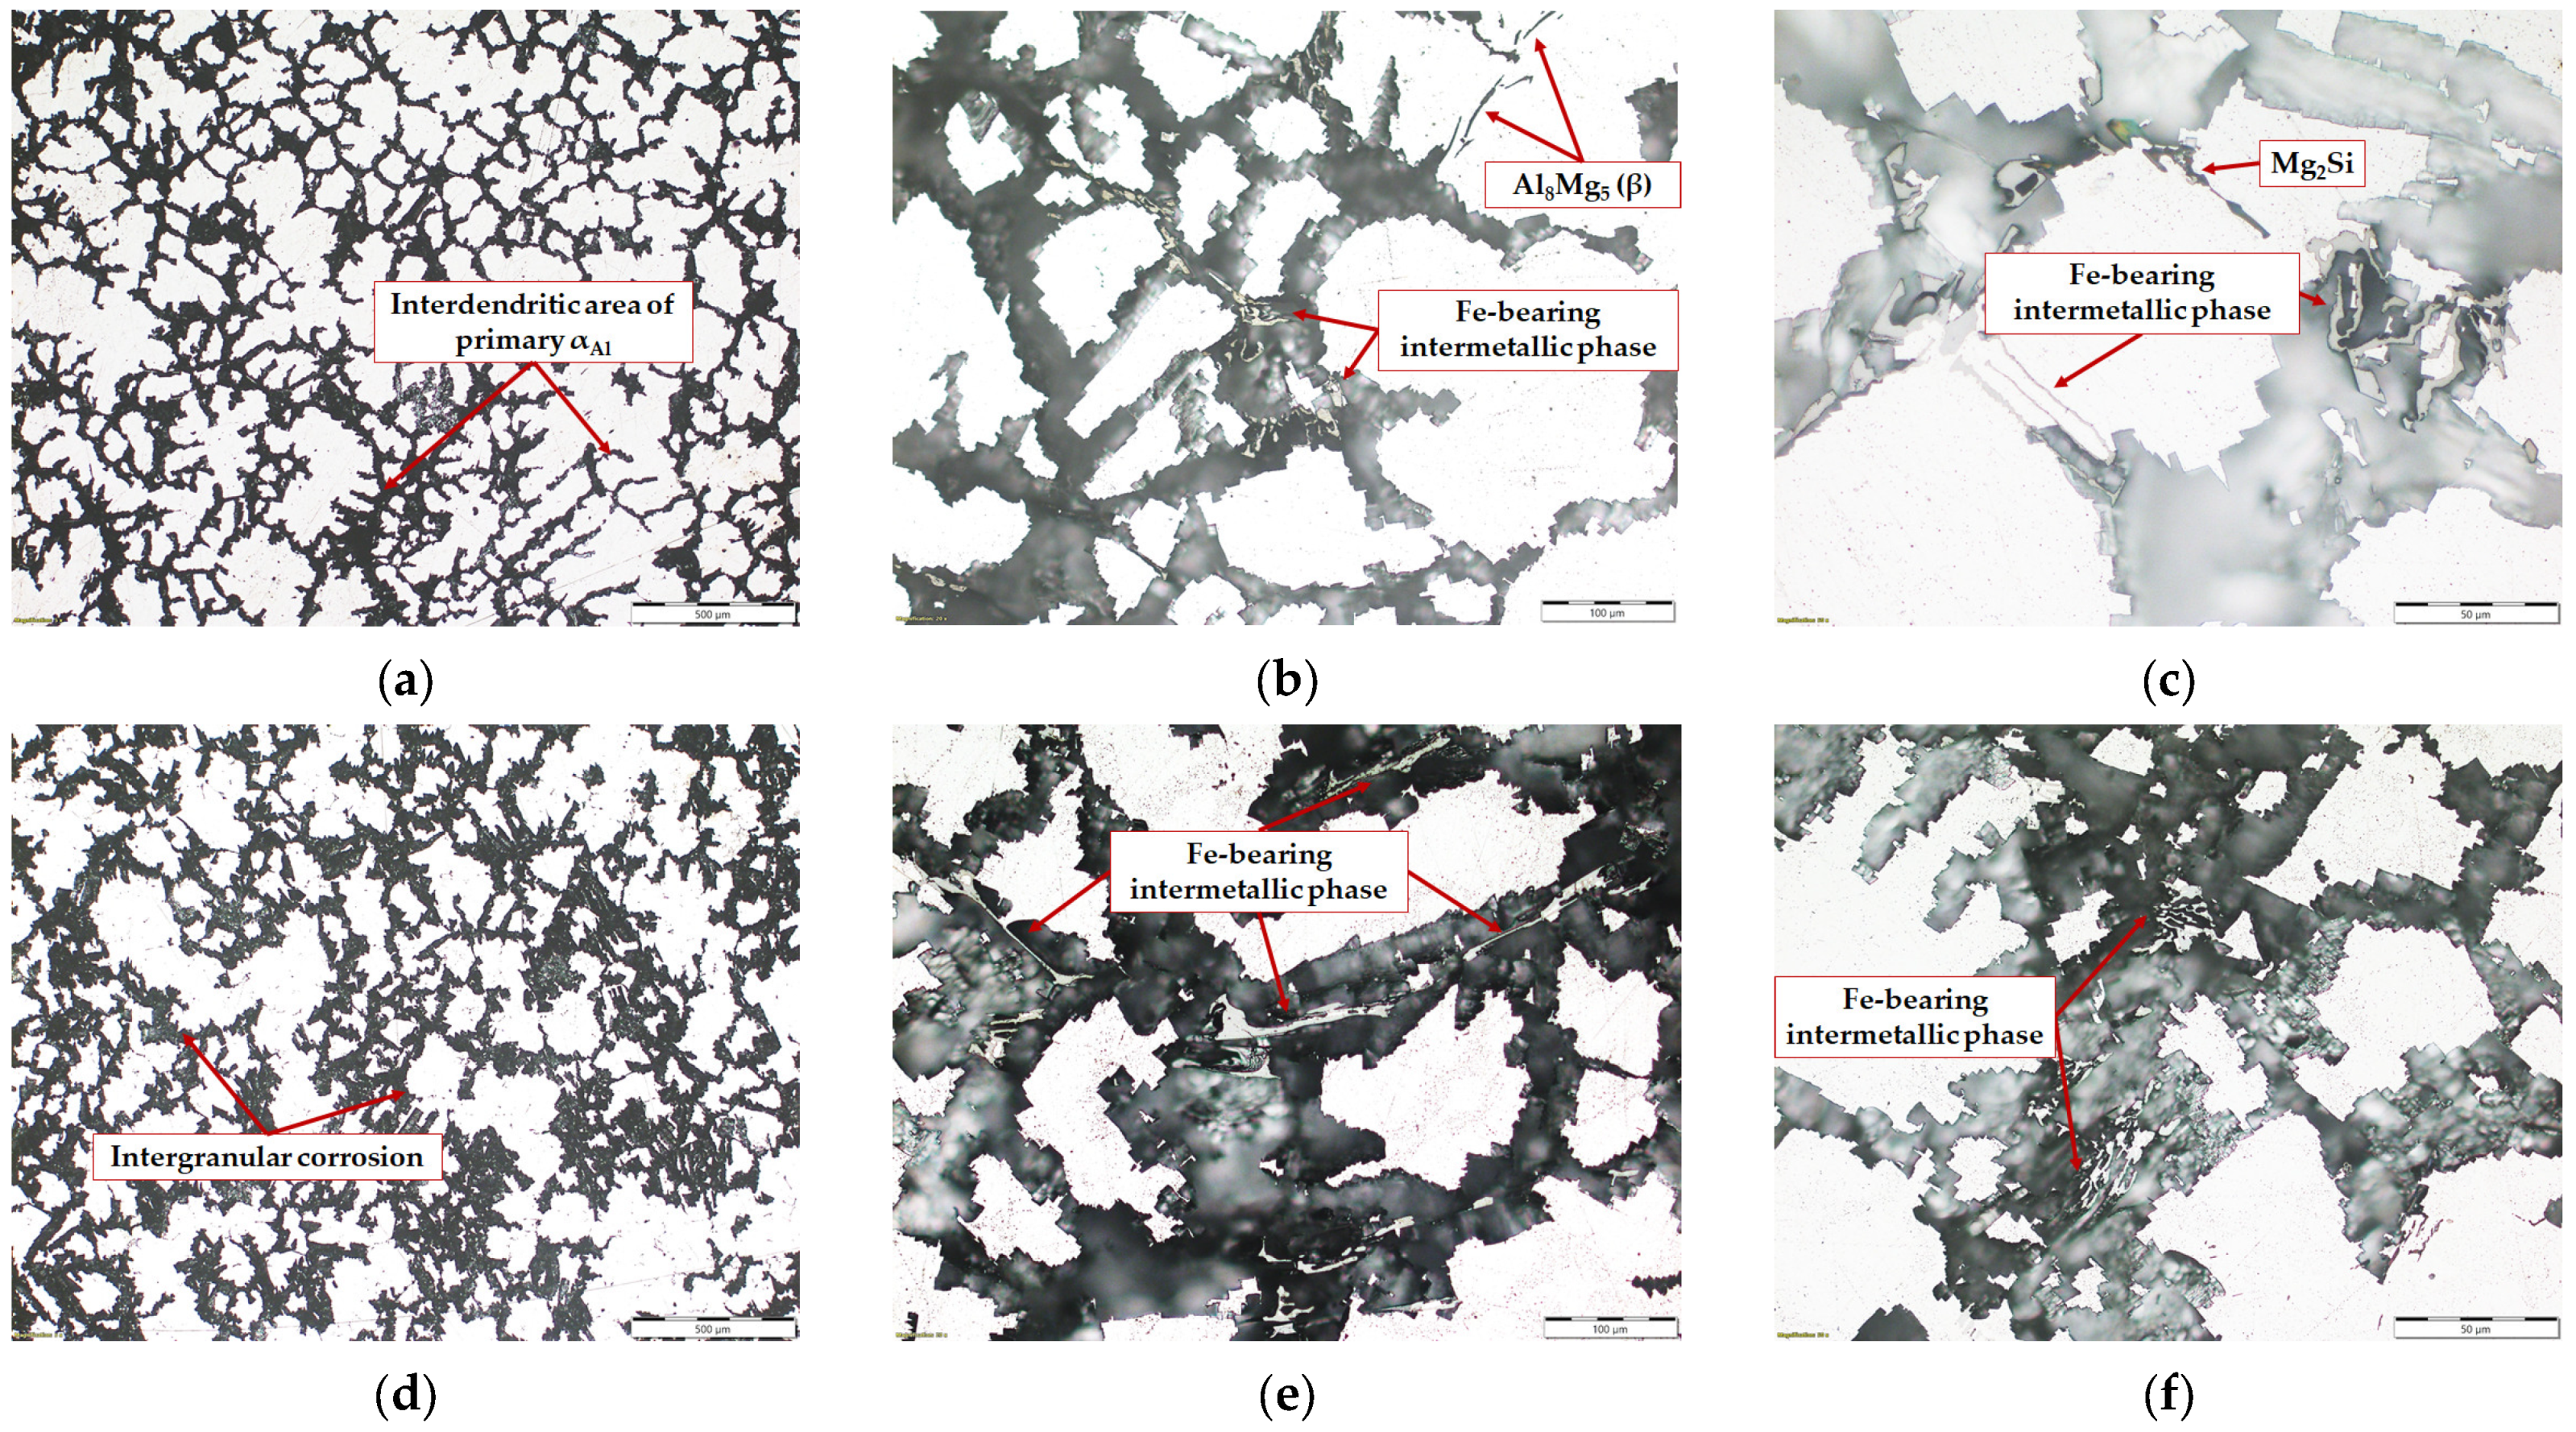
The microstructure of the samples after electrochemical corrosion testing is shown in
Figure 13.
In the as-cast condition, corrosion occurs between the dendritic branches of primary α
Al dendrites (
Figure 13a), with the formation of anodic and cathodic sites. In the anodic region, dissolution of the Al
8Mg
5 and Mg
2Si phases occurs (
Figure 13b). This behavior is consistent with the presence of the Al
8Mg
5 (β) phase in the as-cast microstructure, which contributes to increased alloy sensitization and promotes localized anodic dissolution. In the region containing the cathodic Fe-bearing intermetallic phases, corrosion progresses by dissolution of the α
Al matrix (
Figure 13b,c). After homogenization, corrosion advances along the grain boundaries of the α
Al matrix (
Figure 13d) through cathodic dissolution of the α
Al matrix around the cathodic Fe-bearing intermetallic phases (
Figure 13f). The change in corrosion after homogenization is associated with the dissolution of the Al
8Mg
5 (β) phase and the formation of pores, which modifies the distribution of anodic sites within the microstructure.
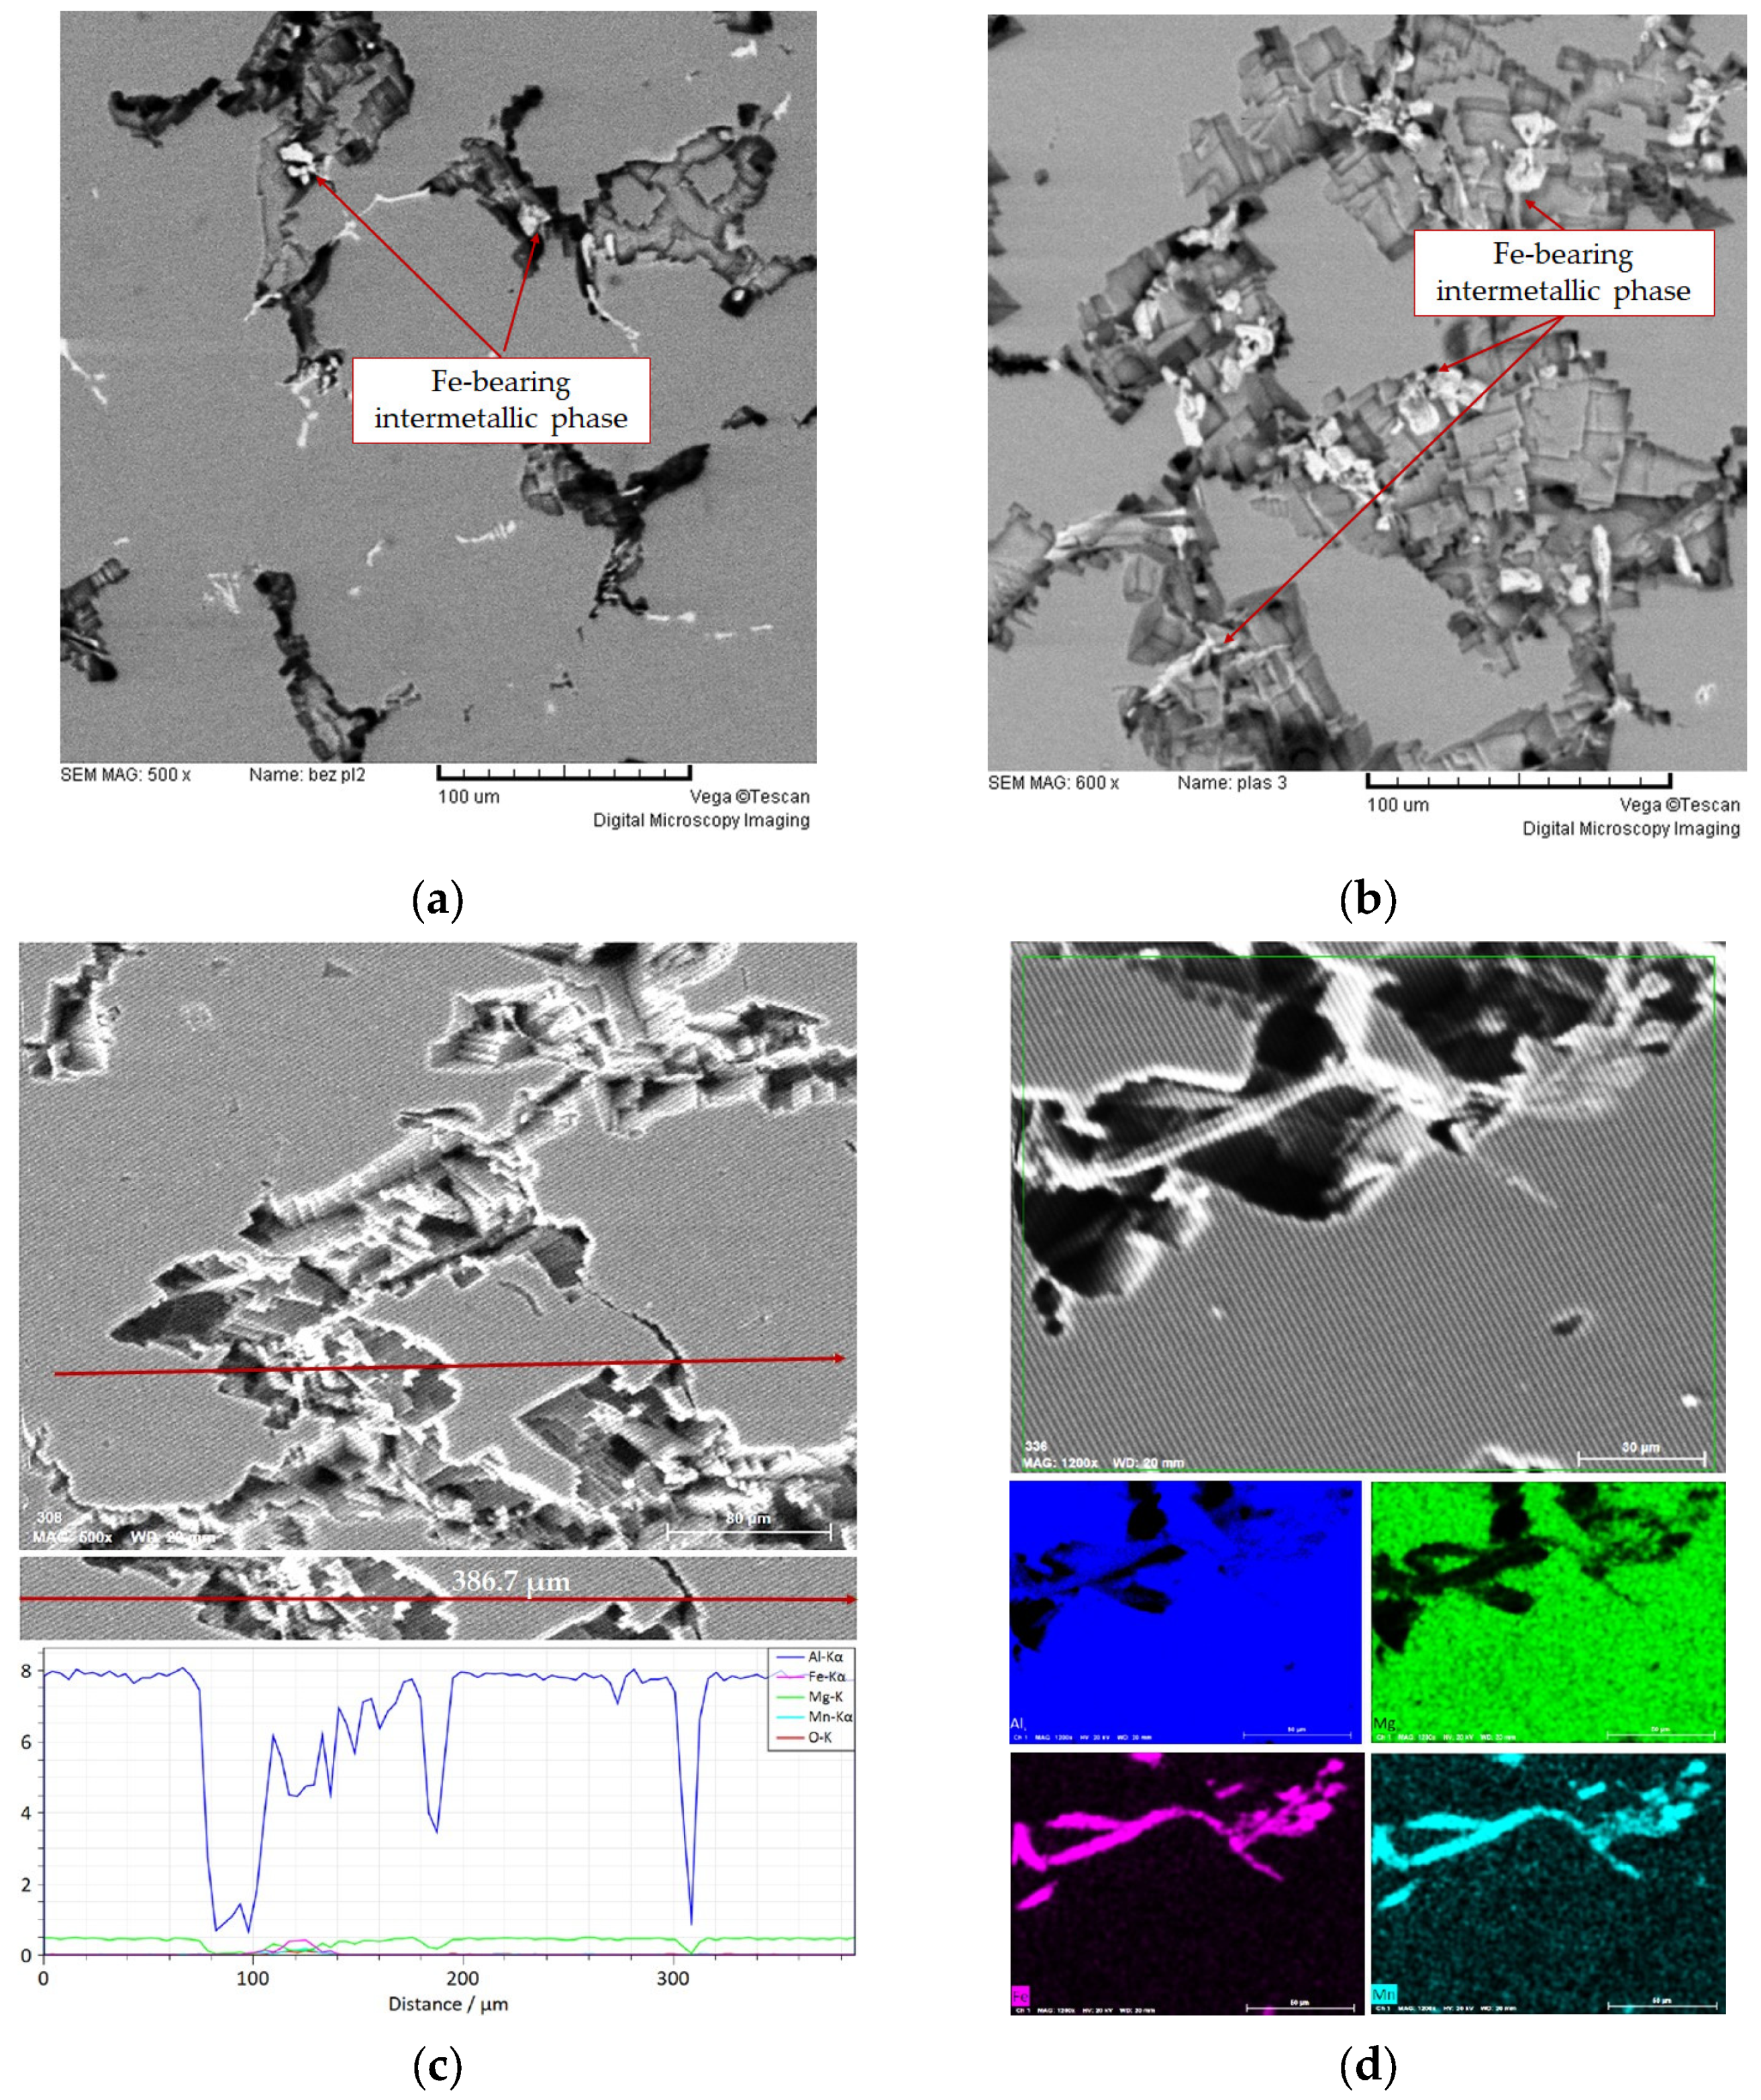
The formation of anodic and cathodic sites during corrosion in sample 26FC is confirmed by qualitative and quantitative electron microscopy results (
Figure 14a,c).
The scanning electron image (SEI) shows dissolution of the α
Al matrix around the cathodic Fe-bearing intermetallic phases (
Figure 14a). Mapping analysis indicates that pore formation during corrosion results from Al and Mg dissolution (
Figure 14c). Line analysis performed across the degraded region confirms a decrease in Al and Mg content, indicating their preferential dissolution during corrosion. These observations are consistent with the presence of an anodic Al
8Mg
5 (β) phase in the as-cast microstructure, which promotes localized dissolution and contributes to alloy sensitization. Quantitative analysis of sample 26FH also shows dissolution of the α
Al matrix around the cathodic Fe-bearing intermetallic phases (
Figure 14d). After homogenization, the absence of the Al
8Mg
5 (β) phase and the presence of pores indicate a modified distribution of anodic sites, while corrosion remains localized around cathodic Fe-bearing intermetallic phases.
4. Discussion
Previous studies on EN AW-5083 and related Al–Mg alloys show that corrosion behavior is governed by microstructural development and the presence of electrochemically active intermetallic phases [
41,
43]. In the as-cast condition, anodic phases such as Al
8Mg
5 (β) and Mg
2Si, together with cathodic Fe-bearing phases, promote localized corrosion through galvanic interactions. Under the applied acidic conditions, anodic phases are preferentially dissolved, while Fe-bearing phases remain electrochemically stable and sustain cathodic activity [
34,
35,
37].
Based on the chemical composition of EN AW-5083, solidification proceeds through the formation of a primary α
Al dendritic matrix, followed by eutectic phases such as Al
8Mg
5 (β) in the Al–Mg system and Al
8Mg
5 (β) together with Mg
2Si in the Al–Mg–Si system [
41,
43]. Equilibrium calculations indicate a more complex microstructure with Fe- and Mn-containing intermetallic phases. Under non-equilibrium conditions, solidification is dominated by Al
8Mg
5 (β), Mg
2Si, and Fe-bearing phases, consistent with metallographic observations in the as-cast condition [
41,
54,
55]. Based on the solidification sequence, homogenization primarily affects low-temperature eutectic phases such as Al
8Mg
5 (β) and Mg
2Si. Dissolution of the Al
8Mg
5 (β) phase and associated pore formation were confirmed by microstructural analysis, while Mg
2Si and Fe-bearing intermetallic phases showed no significant change. These observations are consistent with literature data reporting a preferential dissolution of Al-Mg eutectic phases, particularly Al
8Mg
5 (β), whereas Fe-bearing phases remain stable at comparable homogenization temperatures [
41,
43]. Similar behavior has been reported for Mg
2Si, which exhibits only limited dissolution in Al-Mg alloys with a low Si content [
31,
56]. Results from previous qualitative and quantitative microstructural investigations on the same alloy show that homogenization reduces the area fraction of the Mg
2Si phase from 0.36% to 0.12%, while the area fraction of pores increases from 0.28% to 0.57%. In contrast, the area fraction of Fe-bearing intermetallic phases remains relatively unchanged (1.40% in the as-cast condition and 1.54% after homogenization). The predominant intermetallic particle size ranges from 1.0 to 30.8 μm, whereas pores exhibit a broader size distribution from 1.0 to 300.8 μm. These results support the observed microstructural trends and confirm the influence of homogenization on phase redistribution [
48].
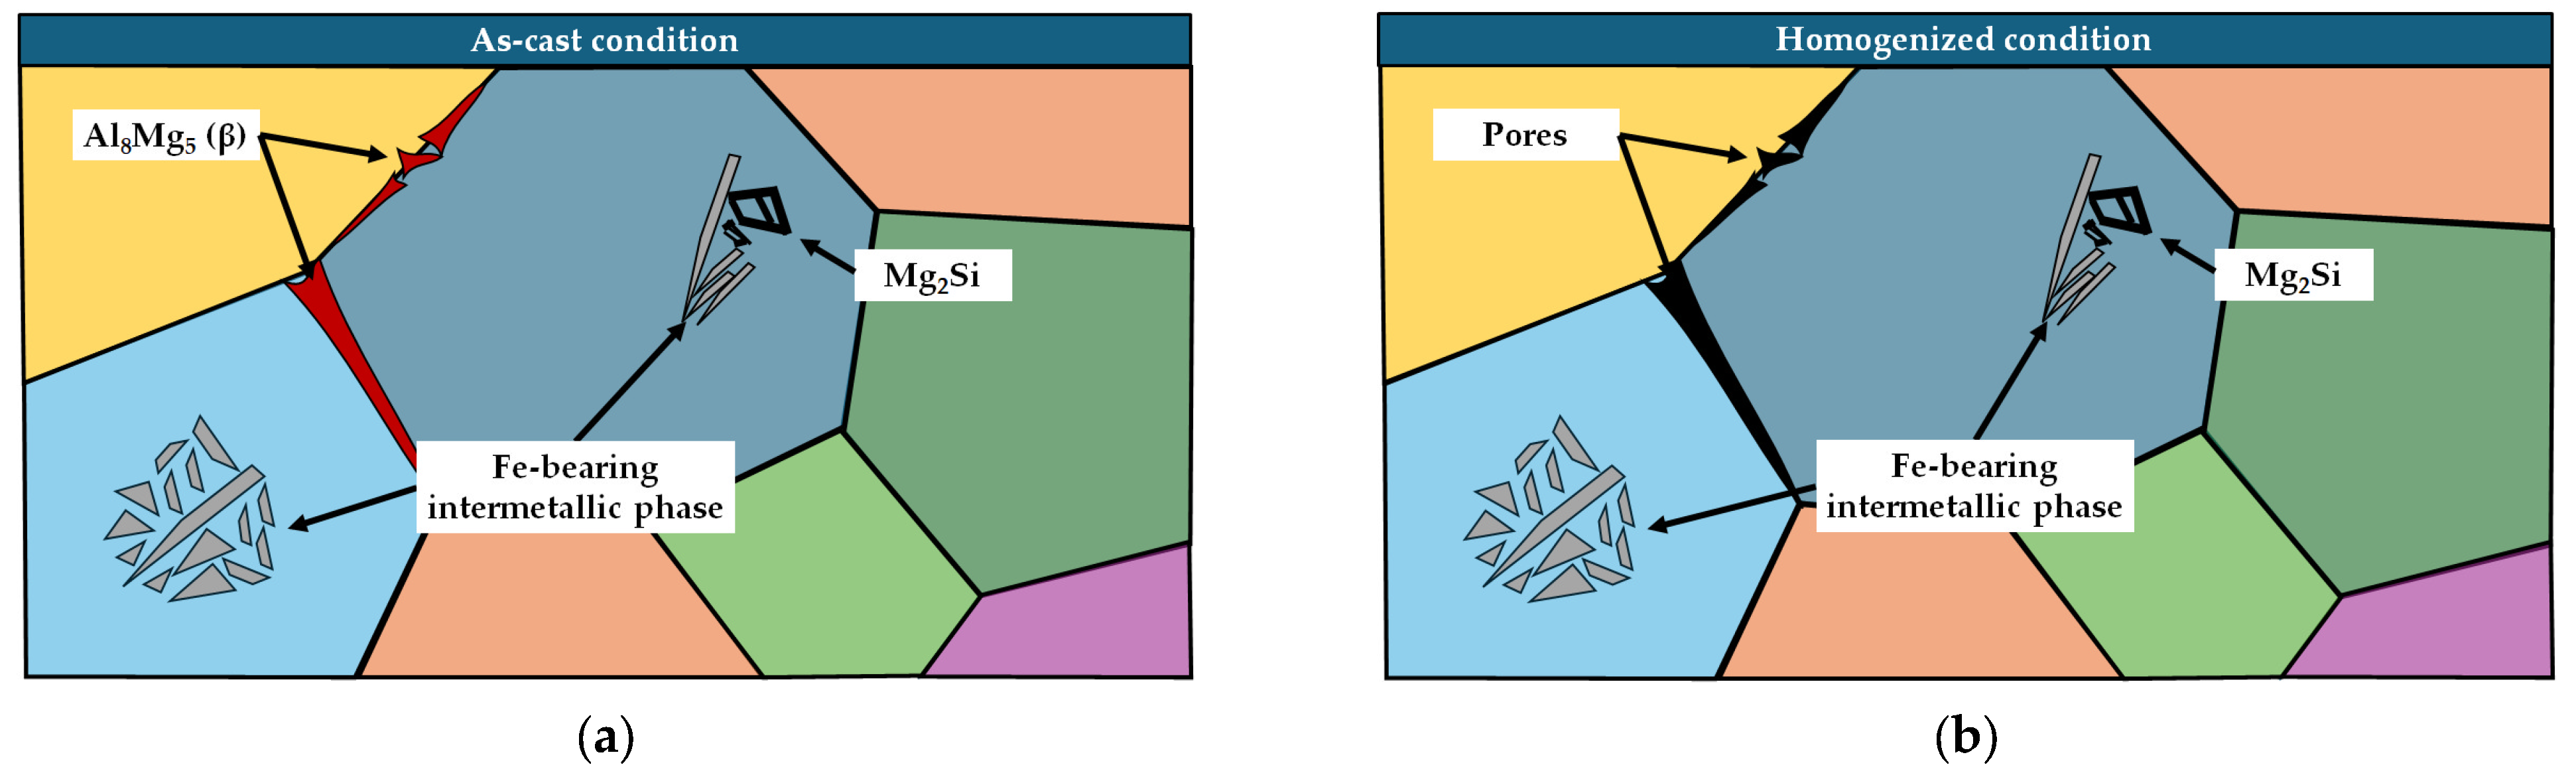
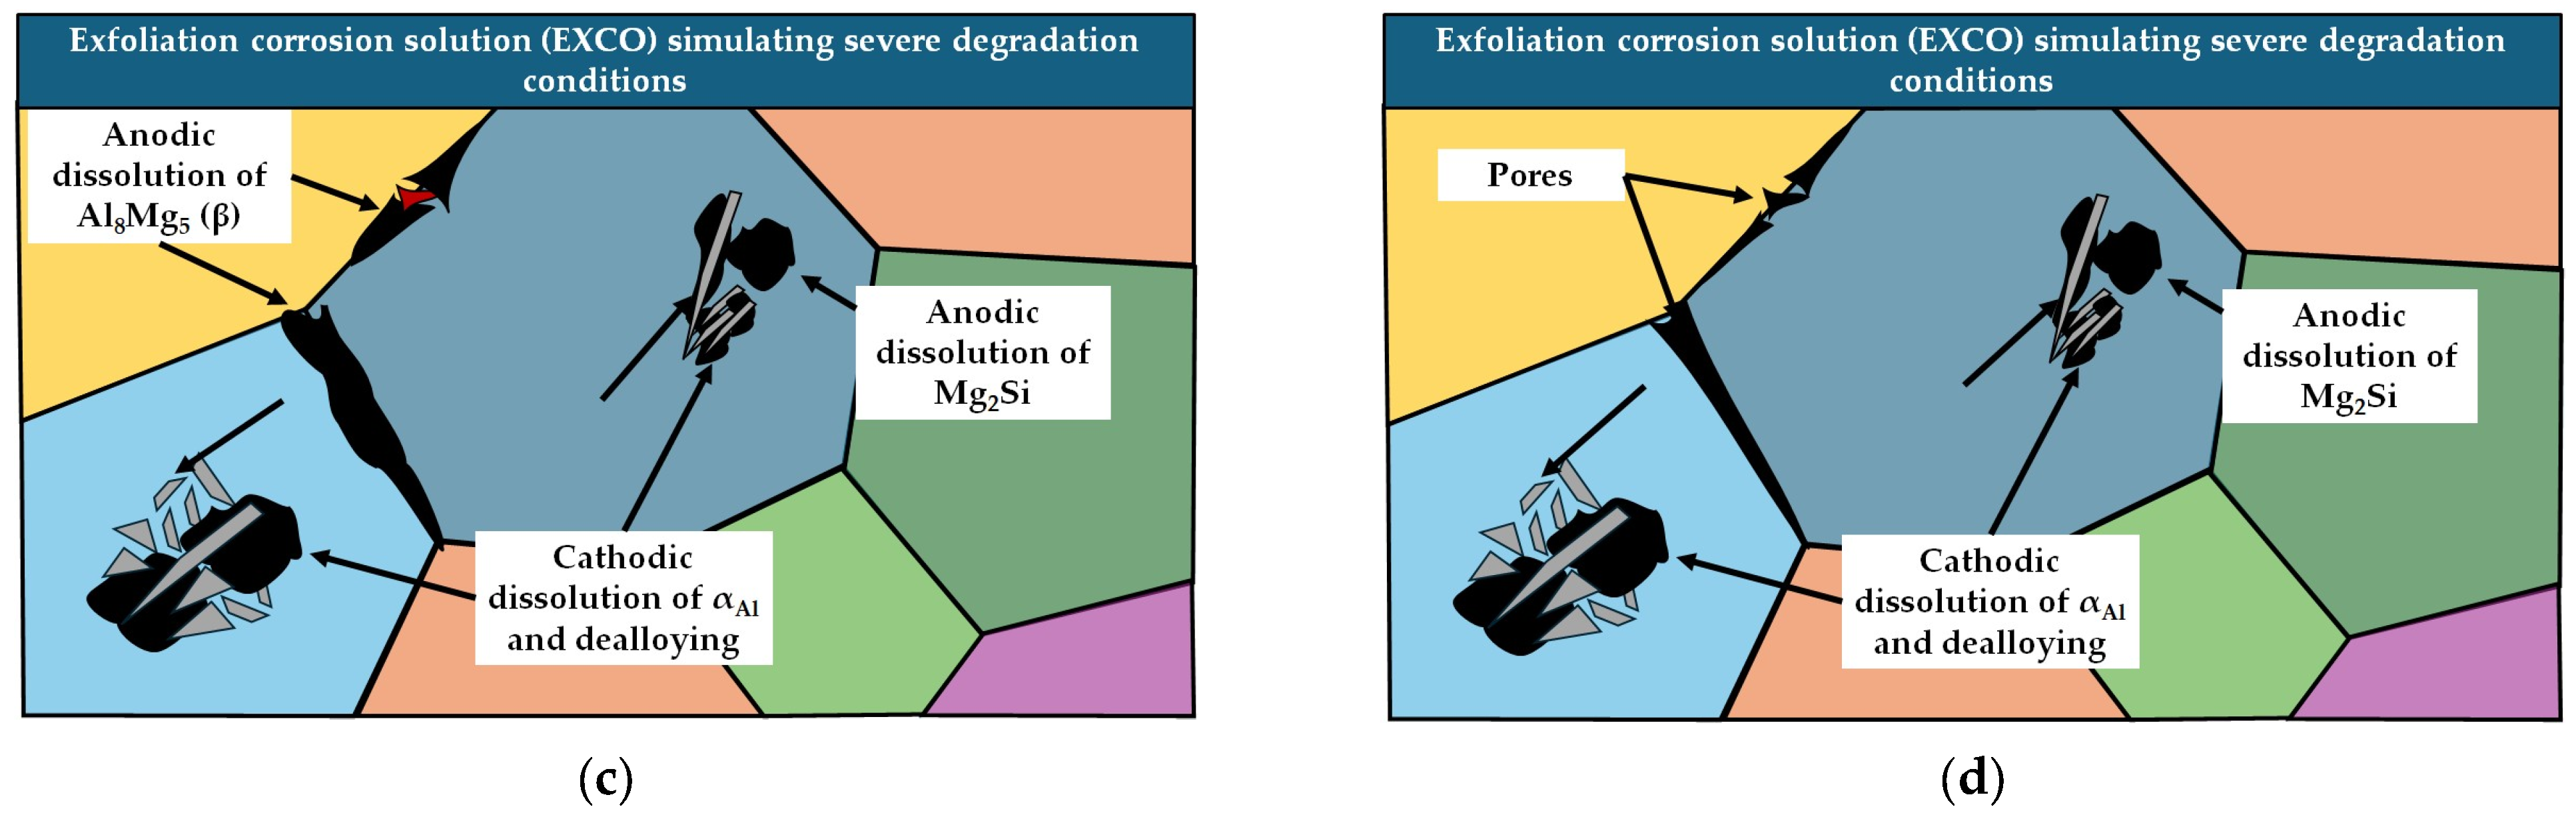
Electrochemical testing and post-corrosion microstructural analysis show that corrosion behavior is governed by interactions between anodic and cathodic intermetallic phases. This applies to both metallurgical conditions. This behavior is observed under the applied testing conditions in EXCO solution, where localized degradation processes develop in relation to specific microstructural constituents. A schematic representation of the microstructure before and after corrosion testing is shown in
Figure 15.
In the as-cast condition, this interaction results in a mixed corrosion mechanism, reflected by a higher corrosion current density and a pronounced cathodic polarization. Elevated cathodic slopes suggest that corrosion is predominantly controlled by cathodic reactions occurring on Fe-bearing intermetallic phases (
Figure 15c), while the higher anodic slope observed for the as-cast sample reflects complex anodic dissolution kinetics associated with Al
8Mg
5 (β), Mg
2Si, and dealloying processes (
Figure 15c). This behavior is consistent with the sensitization mechanism in Al-Mg alloys, where precipitation of the Al
8Mg
5 (β) promotes localized anodic dissolution. Following homogenization, dissolution of the Al
8Mg
5 (β) phase reduces the number of active anodic sites and decreases corrosion current density. This reduction in anodic activity is further associated with decreased sensitization of the alloy and redistribution or lack of galvanic regions. However, the persistence of Fe-bearing phases sustains cathodic activity, limiting the improvement in overall corrosion resistance, which is consistent with literature reports on Al-Mg alloys exposed to aggressive degradation environments (
Figure 15d) [
57,
58].
Within this framework, the proposed hypotheses can be evaluated. The first hypothesis was confirmed by both microstructural observations and electrochemical measurements. The second hypothesis was also supported. Homogenization altered the corrosion mechanism and reduced sensitization through the dissolution of Al
8Mg
5 (β). Homogenization leads to grain refinement, which may increase the number of active sites. However, the improved corrosion resistance is mainly due to reduced sensitization caused by dissolution of the Al
8Mg
5 (β) phase. These findings contribute to a clearer understanding of how microstructural modification influences the corrosion mechanism of EN AW-5083 under severe degradation conditions. Although the EXCO solution is widely used to assess exfoliation and intergranular corrosion susceptibility of Al-Mg alloys [
46,
59,
60], detailed electrochemical investigations in this medium remain limited. Most studies focus on post-exposure damage assessment, while electrochemical testing is usually performed in neutral or mildly acidic chloride-containing solutions [
30,
61,
62,
63]. Studies involving AA5083 in EXCO conditions are predominantly based on post-exposure evaluation, such as visual inspection, mass loss, or mechanical property degradation. Experimental investigations of AA5083 under EXCO conditions report pronounced surface degradation, intergranular attack, and a reduction in mechanical properties. These observations indicate high susceptibility to exfoliation corrosion under severe conditions. However, the interpretation is primarily based on macroscopic damage observation. Direct electrochemical characterization of the degradation mechanism is generally not included. Similar observations are reported in EXCO-based studies on aluminum alloys, where corrosion assessment focuses on morphology and damage severity [
64,
65]. The results obtained in the present study are consistent with these observations. Severe localized degradation and phase-dependent corrosion behavior were also observed under EXCO conditions. The microstructural degradation is associated with the presence of Al
8Mg
5 (β) which forms during the last stages of solidification and precipitates at the grain boundaries.
The corrosion behavior observed in this study differs markedly from that reported in the literature for Al–Mg alloys tested in neutral chloride environments. Studies conducted in 3.5% NaCl solution generally report lower corrosion current densities and slower corrosion rates for AA5083 and related alloys [
30,
61]. For example, it has been demonstrated that corrosion behavior is highly dependent on alloy composition but remains governed by the localized dissolution processes under relatively mild conditions [
30]. Similarly, stable electrochemical behavior with lower corrosion rates in NaCl solution has been reported, often influenced by the formation of surface films [
61]. In contrast, the results obtained in this study show significantly higher corrosion rates, attributable to the severity of the EXCO test conditions. The highly acidic environment promotes rapid dissolution of anodic phases and inhibits the formation of protective surface films, leading to accelerated degradation. Further studies [
62,
63] indicate that corrosion of Al–Mg alloys in aqueous environments is strongly influenced by the development of surface films and early-stage electrochemical processes. Long-term exposure in marine environments can result in the formation of protective layers that reduce corrosion rates [
63], which is not observed under the aggressive conditions applied in this study. Therefore, the differences in corrosion behavior can be attributed to both the testing environment and the microstructure of the alloy. While literature studies typically reflect service-like or moderately aggressive conditions, the EXCO solution used in this work represents severe degradation conditions, resulting in more pronounced microstructure degradation and higher corrosion rates.
Consequently, systematic electrochemical characterization of EN AW-5083 in an EXCO solution combined with microstructural analysis, as performed in the present study, remains scarce. Further studies could therefore focus on the effect of different homogenization temperatures and exposure conditions, as well as on comparative electrochemical testing in degradation media simulating similarly aggressive environments.