Article

A Numerical Assessment on the Textural Stability of {112}<111> After Asymmetric Accumulative Roll-Bonding (AARB)


1
School of Mechanical Engineering, Nantong University, Nantong 226019, China
2
School of Mechanical, Materials, Mechatronic and Biomedical Engineering, University of Wollongong, Wollongong, NSW 2522, Australia
*
Authors to whom correspondence should be addressed.
Metals 2026, 16(6), 576; https://doi.org/10.3390/met16060576
Submission received: 19 April 2026 / Revised: 15 May 2026 / Accepted: 18 May 2026 / Published: 25 May 2026

Abstract

In this study, the stability of the {112}<111> rolling texture component during asymmetric accumulative roll-bonding (AARB) was systematically investigated using a crystal plasticity finite element method (CPFEM) model. The CPFEM predictions showed that the plastic deformation was inhomogeneous along the thickness for all five asymmetric ratios (1.0, 1.2, 1.5, 0.83, and 0.66). To characterize the plastic deformation and texture evolution, through-thickness shear strain, slip-system shear strain, crystal rotation behaviour, pole figures, and the retained area fraction of the {1 1 2}<1 1 1> texture component were analyzed. It was found that the asymmetric ratio, surface friction, and cutting-stacking pattern in AARB played a critical role in the preservation of initial {1 1 2}<1 1 1>.

1. Introduction

Texture plays a critical role in the plastic deformation, since it influences the plastic anisotropy of the processed metals [1,2,3]. Characteristic textures develop in different processes due to the imposed strain [4,5]. The texture intensity is enhanced when the same process is further applied, while the already developed texture is destroyed and transformed into other textures when varied processes are introduced [6,7]. Conversely, the previously developed texture also affects the subsequent plastic deformation [2,4]. This is to say the texture evolution and plastic deformation are mutually influenced [8]. Texture stability under similar or varying processing conditions has long been a subject of research [9,10,11].
Rolling is a widely used processing technique, and rolling texture develops within the rolled metallic sheets [12]. The rolling texture usually consists of {1 1 2}<1 1 1>, {1 2 3}<6 3 4>, and {1 1 0}<1 1 2> [13]. The {1 1 2}<1 1 1>, also called C orientation, usually takes the highest portion among these three texture components, where the texture component {1 1 2}<1 1 1> sometimes is also taken as {4 4 11}<11 11 8> [14]. The rolling texture, mainly represented by {1 1 2}<1 1 1>, induces plastic anisotropy in rolled sheets, and this anisotropy results in poor mechanical behaviour during further metal forming [15]. Techniques have been proposed to reduce the {1 1 2}<1 1 1> texture during rolling, such as asymmetric rolling [14], accumulative roll-bonding (ARB) [16], and conventional rolling with high friction between the rolls and metallic sheets [17]. In Ref. [18], the initially C-oriented aluminum single crystal was processed by ARB. The area fraction of C decreased with increasing ARB cycles, and then stabilized at 20% after seven cycles. The texture stability of C {1 1 2}<1 1 1> during further rolling has not been systematically investigated, and this is the thrust of this study.
Compared to the experimental techniques, numerical methods have been widely used to model the plastic deformation and texture evolution due to their ability to accommodate customized process conditions [19,20]. The texture stability of ARB-processed C {1 1 2}<1 1 1> single crystals was evaluated using the crystal plasticity finite element method (CPFEM) [21]. It was found that the initial {1 1 2}<1 1 1> rotated into {0 0 1}<1 1 0> and {4 4 11}<11 11 8>, and a textural transition between {0 0 1}<1 1 0> and {4 4 11}<11 11 8> was observed in the following ARB cycles. The CPFEM predictions agreed well with the experimental observations even up to nine ARB cycles, demonstrating the strong predictive capability of CPFEM. Besides ARB-processed {1 1 2}<1 1 1> single crystals, CPFEM has been used to study the deformation behaviour and texture evolution in rolled S {1 2 3}<6 3 4> single crystals [22] under different strain paths. Additionally, the texture in polycrystalline aluminum after asymmetric ARB (AARB) was also successfully captured by CPFEM [23].
By combining ARB and asymmetric rolling, AARB is of great potential to control the location and fraction of rolling texture [23]. Texture transition between shear texture and rolling texture has been widely experimentally observed [24] and numerically predicted [20] during the ARB process, due to the involved cutting and stacking in each ARB cycle. Asymmetric rolling has been used to tailor through-thickness texture by adjusting the asymmetric ratio, where asymmetric shear strain was introduced during asymmetric rolling [25]. The space of processing parameters is greatly enlarged by combining the parameters of ARB and asymmetric rolling. Before using AARB to tailor texture, evaluating the texture stability and understanding the mechanisms for texture evolution are the first steps. The texture stability of C {1 1 2}<1 1 1> after AARB has not been well studied, and this is the purpose of the present report.
In this study, CPFEM was employed to evaluate the texture evolution of AARB-processed C {1 1 2}<1 1 1> single crystals for the first time. Five rolling speed asymmetric ratios were considered. The macroscopic plastic deformation, slip system activity, crystallographic rotation, and area fraction of C orientation were investigated. Finally, the influences of the asymmetric ratio and friction condition on the stability of the {1 1 2}<1 1 1> texture component were analyzed.

2. Texture Modelling

The CPFEM was used to predict the texture stability of {1 1 2}<1 1 1> during ARB. The CPFEM enabled the full coupling between plastic deformation and texture evolution, which promises the successful application to texture modelling during the asymmetric ARB process. Additionally, this CPFEM model has accurately captured the texture evolution in ARB-processed aluminum single crystals up to 9 ARB cycles [22].
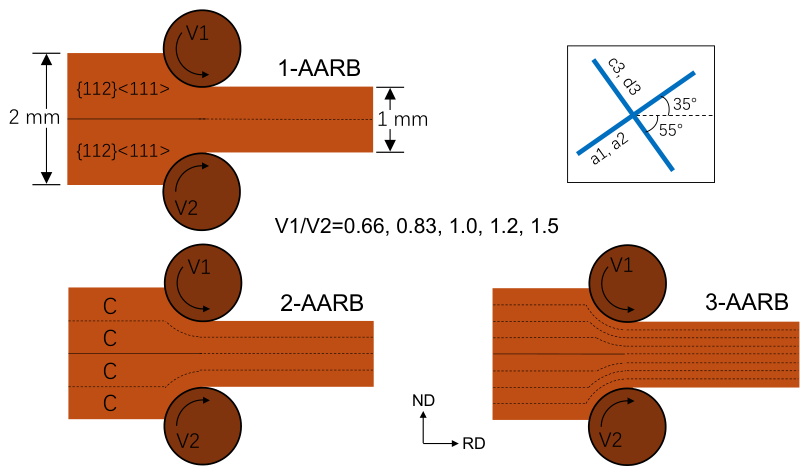
Figure 1 presents the ARB model, which was two-dimensional under the assumption of plane-strain conditions. The 12 slip systems in FCC-structured aluminum were oriented in three dimensions, and thus all of them could potentially be activated under this two-dimensional plane-strain condition. The initial thickness of the aluminum sheets was 1 mm. Two sheets were stacked before 1ARB, and they were roll-bonded to 1 mm after 1ARB. Two 1ARB-processed sheets were stacked in preparation for 2ARB and then roll-bonded again. The two stacked sheets were considered as an integrated one, i.e., the bonded interface was omitted, since the interaction between the two stacked sheets is negligible [11]. The nominal reduction was kept at 50% in each ARB cycle, which ensured that the sheet thickness remained unchanged, and thus the ARB process could be repeated for a large number of ARB cycles. The upper and lower rolls had identical diameters of 310 mm, whereas their rotational velocities were controlled independently. The applied asymmetric ratios were 0.66, 0.83, 1.0, 1.2, and 1.5. A constant friction coefficient of 0.15 was assigned at both roll–sheet interfaces. Two additional friction coefficients, 0.12 and 0.2, were also used for comparison purposes. The choice of these five asymmetric ratios was considered based on the capacity of the rolling mill and realistic industrial conditions, and the friction coefficients were based on different lubrication conditions.
After mesh calibration (given in the Supplementary Materials), the sheet thickness was meshed into 16 CPFEM elements in 1ARB, and the number of elements along the normal direction (ND) was doubled after each subsequent cycle to approximate the stacking pattern in ARB. The starting crystallographic orientation was C {112}<111>, where the use of single crystals avoided the effect of grain interaction and pre-existing grain boundaries. Figure 1 shows the crystallographic coordinates relative to the specimen coordinate. This C orientation was assigned to all CPFEM elements before 1ARB, which ensured that the whole sheet was a single crystal. During the ARB process, the crystallographic orientation rotated into the desired position, and the evolved orientation was reinput into the corresponding CPFEM elements prior to 2ARB. This procedure was also performed in 3ARB, where 3ARB is usually sufficient to achieve textural/microstructural saturation [26].
In CPFEM, the crystal plasticity (CP) constitutive formulation was incorporated into the finite element framework, with Abaqus/Standard 2018 employed as the numerical solver. The texture evolution and plastic deformation were fully coupled in this so-called full-field method [22,27,28], and thus CPFEM is an ideal texture predictor. The CP constitutive model used in this study followed the widely adopted kinematical scheme [29]. In this scheme, the spin tensor is divided into lattice rotation ( Ω * ) and plastic part ( Ω P ), namely
Ω = Ω * + Ω P
Ω * is the reason for crystallographic rotation and texture evolution. The plastic spin Ω P is caused by dislocation motion, which can be calculated by the shear strain on slip systems ( γ ), i.e.,
Ω P = α = 1 12 1 2 ( s ( α ) · m ( α ) m ( α ) · s ( α ) ) γ ˙ ( α )
where m ( α ) is the slip plane normal and s ( α ) slip direction.
The resolved shear stress τ ( α ) acting on the slip system governs the corresponding shear strain rate γ ˙ ( α ) (Equation (3)), where γ ˙ 0 ( α ) denotes the reference shear strain rate, and n represents the rate-sensitivity exponent.
γ ˙ ( α ) = γ ˙ 0 ( α ) s g n ( τ ( α ) ) | τ ( α ) τ c ( α ) | n for   τ ( α ) τ c ( α )
γ ˙ ( α ) = 0     for     τ ( α ) τ c ( α )
The   s g n ( x ) = { 1           f o r   x 1 1   f o r   x < 1
The critical resolved shear stress τ c ( α )   on a slip system α , represents the strength of the slip system, and its value was updated according to the hardening model, i.e., the Bassani-Wu hardening model [22,30] in this study. In FCC aluminum, the slip systems consist of {1 1 1} slip planes and <1 1 0> slip directions. As shown in Figure 1, the four potentially activated slip systems in the rolled C-oriented single crystal were a 1 (1 1 1) [0 1 ¯ 1], a 2 (1 1 1) [1 0 1 ¯ ], c 3 ( 1 ¯ 1 1) [1 1 0], d 3 (1 1 ¯ 1) [1 1 0], as experimentally observed in Ref. [31] and numerically predicted in this study. Slip systems a 1 and a 2 are coplanar, whereas c 3 and d 3 are codirectional. The CP kinematics, hardening model, Abaqus UMAT implementation, and material parameter calibration are provided in detail in the Supplementary Materials.

3. Numerical Predictions

3.1. Plastic Deformation

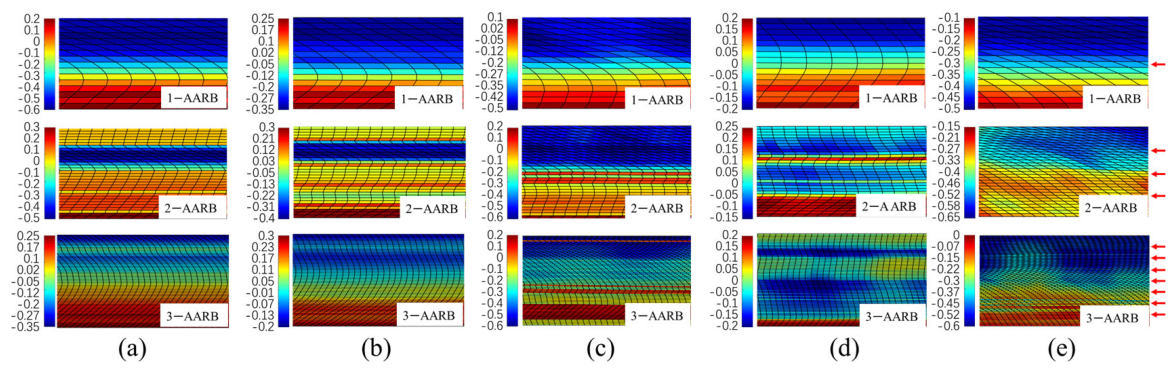
Figure 2 shows the shear strain and deformed FEM mesh configurations after 1-AARB, 2-AARB, and 3-AARB with five different asymmetric ratios, where the shear strain and FEM mesh distortion correspond to each individual AARB cycle rather than cumulative values. It is clear that although the rolling conditions remained unchanged, the distribution of shear strain was different between AARB cycles, which implies that the previously developed texture influenced the subsequent plastic deformation. Additionally, at an asymmetric ratio of 1.0 (Figure 2a), the shear strain still exhibited through-thickness asymmetry, which can be related to the non-symmetric distribution of the four potentially activated slip systems presented in Figure 1.
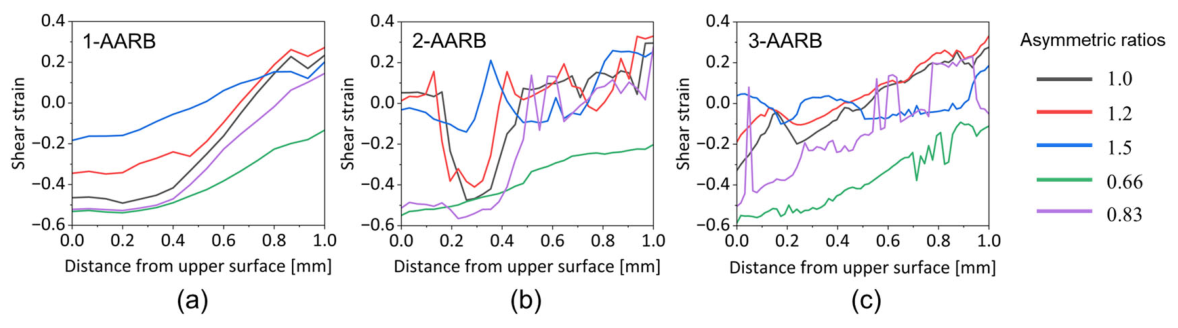
The through-thickness shear strain presented in Figure 3 was obtained from Figure 2. In the 1-AARB cycle, the FEM mesh configurations changed only slightly with changes in the asymmetric ratio (1.2 in Figure 2b and 0.83 in Figure 2c), compared to Figure 2a. In contrast, they were significantly altered when the asymmetric ratio increased to 1.5 (1.5 in Figure 2d and 0.66 in Figure 2e). In particular, the deformed mesh in Figure 2e was inclined in a single direction, i.e., constantly negative in Figure 3a. After 2-AARB, the FEM mesh configurations in Figure 2 and the shear strain distributions in Figure 3 varied significantly along the thickness direction, except at the asymmetric ratio of 0.66. This indicates that the relatively stable crystal orientations developed during 1-AARB became unstable after the through-thickness positions were altered by the cutting-stacking process prior to 2-AARB. A similar variation in shear strain was also observed after 3-AARB.

3.2. Texture Evolution

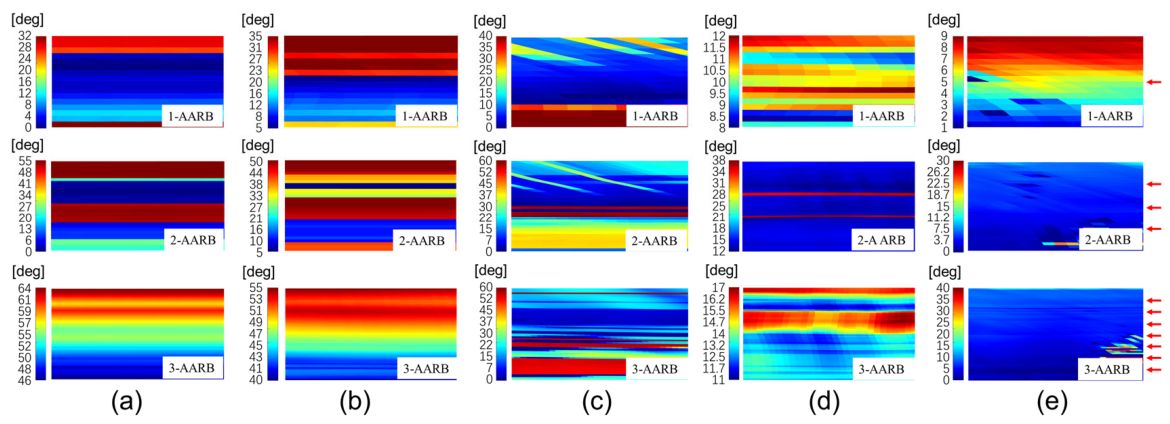
Figure 4 shows the distribution of crystal rotation angles, quantified by the misorientation between the initial {112}<111> orientation and the deformed orientation. After 1-AARB, the crystal rotation angles at the upper and lower surfaces were exceedingly larger than those at the inner region (Figure 4a). When the asymmetric ratio increased to 1.2 (Figure 4b), the area characterized by pronounced crystal rotation expanded in the upper region, whereas it became narrower in the lower region. The opposite was observed after lowering the asymmetric ratio to 0.83 (Figure 4c). The crystal rotation angles became larger after changing the asymmetric ratio in Figure 4b,c. A sharp change in the magnitude and distribution of crystal rotation angles was observed in Figure 4d,e. In the following 2-AARB and 3-AARB, the crystal rotation angle also varied greatly along the thickness, similar to the through-thickness shear strain. The regions with smaller or larger crystal rotation angles in 1-AARB became thinner due to the stacking-rolling pattern.
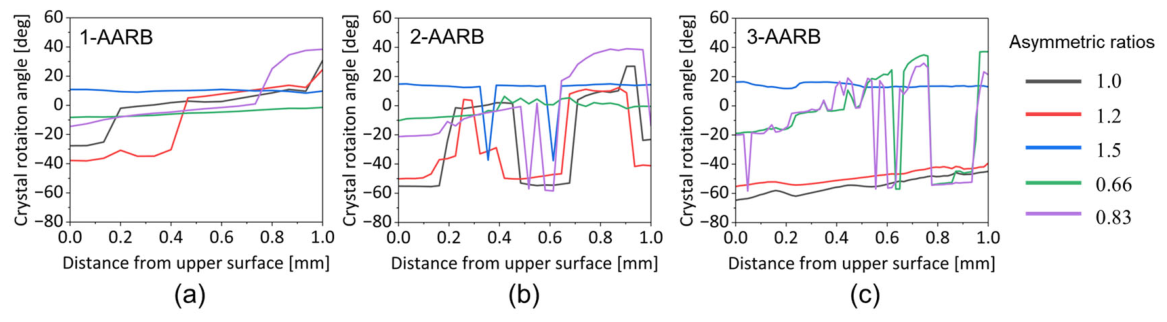
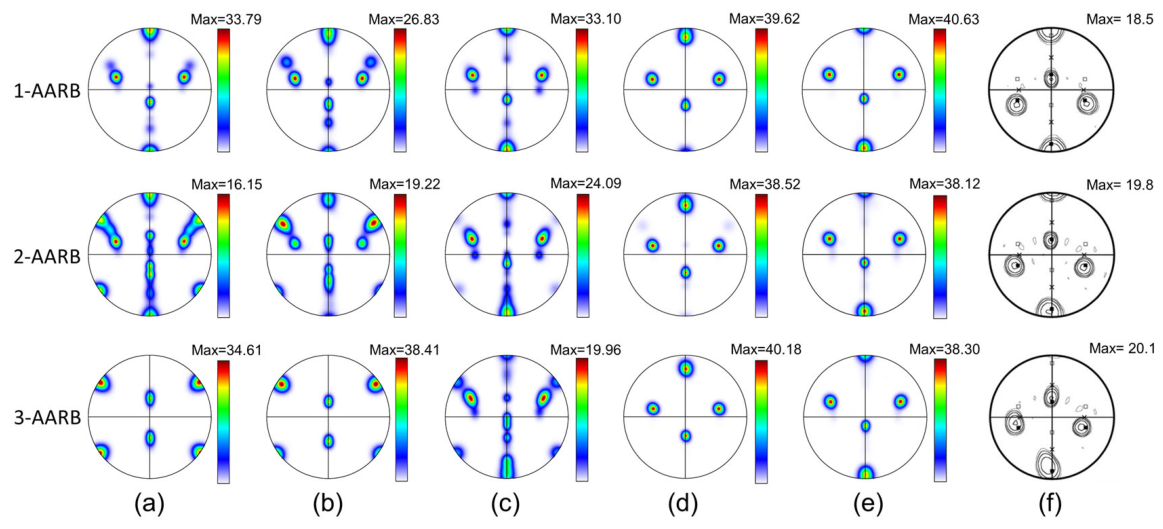
The crystal rotation angle in Figure 5 and {1 1 1} pole figures in Figure 6 were given to further show the rotation direction of the crystal orientations. The pole figures were calculated using the open-source programme: MTEX (version 2.0), a MATLAB-based toolbox [32]. According to the pole figures in Figure 6, the crystal rotation mainly occurred about the transverse direction (TD) axis. Clockwise rotation about the TD axis was defined as positive, whereas counterclockwise rotation was regarded as negative. The TD- rotation occurred in both clockwise and counterclockwise directions. The predicted textures agreed well with the experimental observations given in Figure 6f, where the main texture evolution was TD-rotation, and the crystal rotation angles were not high in both predictions and experiments. For the asymmetric ratio of 1.0 (Figure 5a), the initial orientation {1 1 2}<1 1 1> was unstable after 1-AARB at the upper and lower surfaces due to the effect of surface friction. Additionally, it was reasonable that the crystal rotations at the upper and lower surfaces occurred in opposite directions because of the asymmetric distribution of the four activated slip systems (Figure 1). The stability of the initial {1 1 2}<1 1 1> deteriorated as the asymmetric ratio was slightly changed to 1.2 and 0.83, which can be seen from the larger TD-rotation angles in Figure 5 and pole figures in Figure 6. The crystal rotation angles at the surfaces are also larger than those at the inner region for 1.2 and 0.83, and the TD-rotation at the upper and lower surfaces was also in the opposite direction. It is unexpected that the TD-rotation angles were exceedingly small for asymmetric ratios of 1.5 and 0.66, and the TD-rotation was positive for 1.5 and negative for 0.66. This indicates that the initial {1 1 2}<1 1 1> orientation remained nearly stable under these rolling conditions.
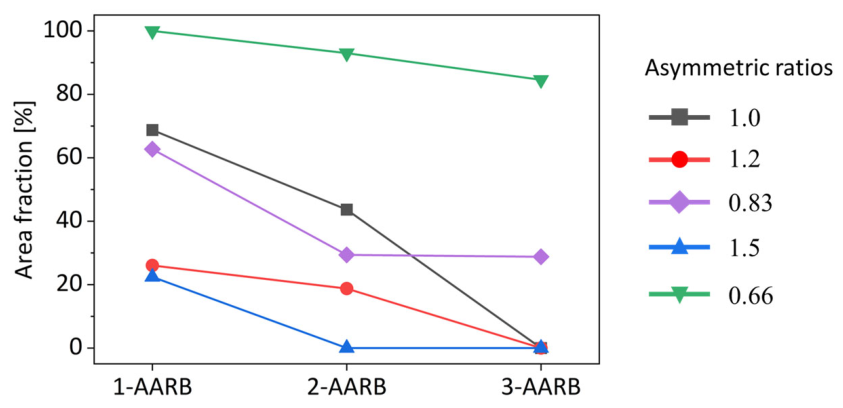
Crystal rotation led to the destabilization of the initial {1 1 2}<1 1 1> texture, and the area fraction of preserved {1 1 2}<1 1 1> was calculated and shown in Figure 7, where a tolerance of 10° was used as the threshold. It is clear that the area fraction of the starting orientation {1 1 2}<1 1 1> decreased with increasing AARB cycles for asymmetric ratios of 1.0, 1.2, 0.83, and 1.5, and the decrease was rapid. Unexpectedly, the area fraction of the initial {1 1 2}<1 1 1> was well preserved when the asymmetric ratio reached 0.66.
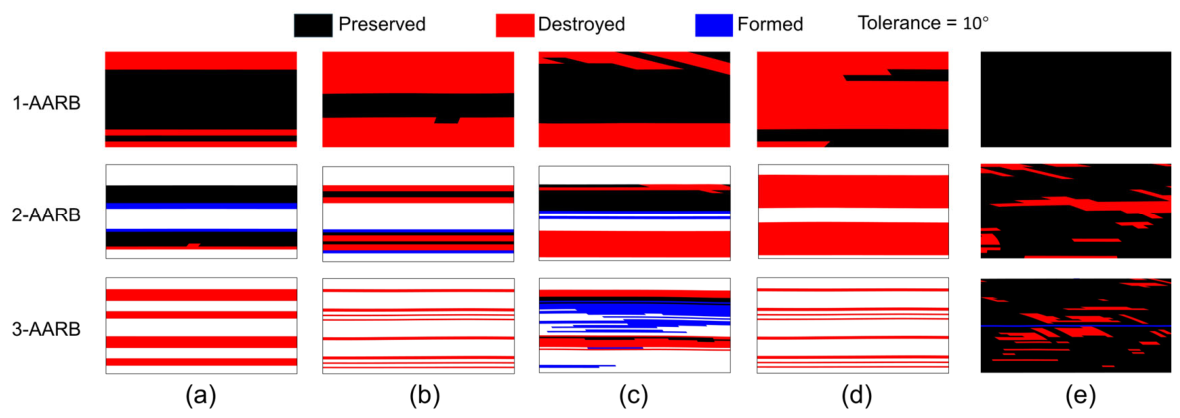
Figure 8 shows the distribution of preserved, destroyed, and formed C {1 1 2}<1 1 1> during AARB. It is clear that the initial orientation {1 1 2}<1 1 1> was continuously destroyed with increasing AARB cycles in Figure 8a,b,d. When the asymmetric ratio was 0.83 (Figure 8c), the formation of {1 1 2}<1 1 1> during 3-AARB resulted in an almost unchanged area fraction compared to that after 2-AARB. In contrast, the initial {1 1 2}<1 1 1> was almost preserved in Figure 8e, and it can be seen that the {1 1 2}<1 1 1> formed in a small area fraction.

3.3. Slip Activities

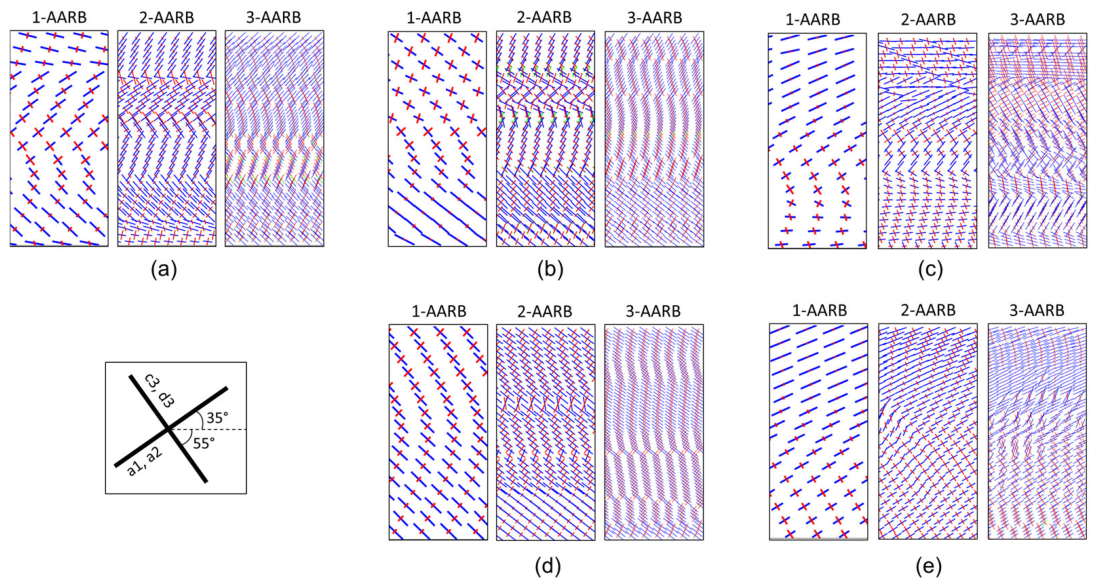
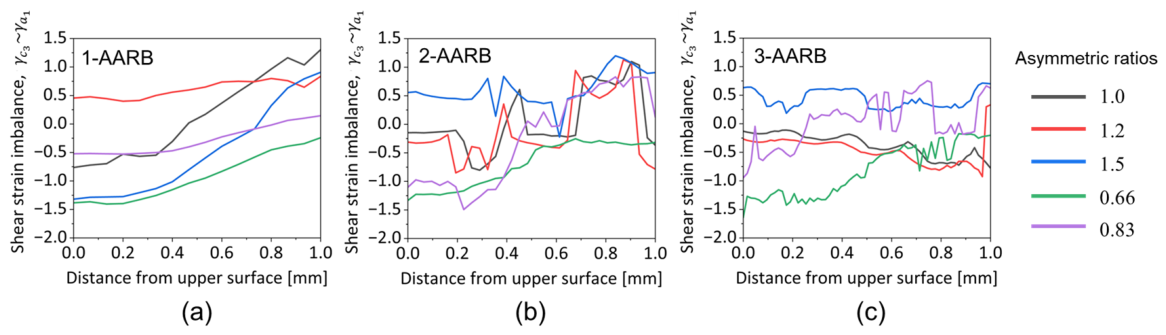
In this study, deformation was mainly accommodated by the activation of four slip systems: a 1 (1 1 1)[0 1 ¯ 1], a 2 (1 1 1)[1 0 1 ¯ ], c 3 ( 1 ¯ 1 1)[1 1 0], and d 3 (1 1 ¯ 1)[1 1 0]. This agreed with the experimental observations [9,18]. As illustrated in Figure 9, slip systems a 1 and a 2 are located on the same slip plane. Owing to the negligible non-TD crystal rotation (Figure 6), the shear strain on a 1 ( γ a 1 ) is nearly identical to that on a 2 ( γ a 2 ), since the non-TD-rotation is negligible (Figure 6). It is the same for the co-directional slip system c 3 and d 3 . Therefore, only a 1 and c 3 are used as representatives of the two sets of slip systems in the following text. Figure 9 shows the simulated slip trace, which represents the activity of the slip system a 1 and c 3 . The slip traces were represented by lines, which were centred at the integration points of elements, and the length of these lines was related to the relative magnitudes of cumulative shear strain on the slip systems. The blue and red colours denote the slip systems exhibiting the largest and second-largest cumulative shear strains, respectively. The difference in shear strain on slip systems between a 1 and c 3 , i.e., γ c 3 γ a 1 , was calculated and given in Figure 10.
Unexpectedly, the initial {1 1 2}<1 1 1> was well maintained when the asymmetric ratio was 0.66. This phenomenon can be understood as follows. In the CPFEM constitutive law (Supplementary Materials), the imposed plastic deformation was decomposed into the crystallographic slip and crystallographic rotation, where they are the two mechanisms for accomplishing the imposed plastic deformation. The four potentially activated slip systems are asymmetrically distributed in the rolling direction-normal direction (RD-ND) plane, and the activation would lead to asymmetric shear strain through the thickness during symmetrical rolling, according to Equation (S5) in the Supplementary Materials. During the crystallographic slip, the crystal orientations were maintained. Therefore, the crystallographic rotation needed to be developed to accommodate the imposed strain by symmetrical rolling (Equation (S4) in the Supplementary Materials). The large asymmetric shear strain due to the activation of the four slip systems is enough to accommodate the imposed asymmetric shear strain during asymmetric rolling (asymmetric ratio = 0.66), and thus, crystallographic rotation was not required. The texture was thus stable under these rolling conditions.

4. Discussion

In this study, the textural stability of single crystal {1 1 2}<1 1 1> during AARB was numerically investigated for the first time. The CPFEM predictions of texture evolution matched well with the experimental observations. The use of a single crystal was intended to avoid the effects of grain interactions and pre-existing grain boundaries, since grain interaction plays an important role in polycrystalline microstructure during rolling [33]. This investigation of {1 1 2}<1 1 1> stability was mainly based on the CPFEM theory, i.e., crystallographic orientations and slip activities. In the next research, the texture {1 1 2}<1 1 1> stability within a polycrystalline microstructure is to be studied from a statistical viewpoint, due to the different grain interaction. Practical aluminum sheets possess polycrystalline microstructures, and the revealed mechanisms for the texture evolution in this study would be beneficial to the understanding of texture stability in polycrystalline microstructures.
Though the starting material was single crystals, in-grain subdivision occurred during plastic deformation, and thus grain boundaries developed. The grain boundaries were not explicitly modelled. This discrepancy between realistic experiments and CPFEM modelling is reasonably negligible and acceptable, since the misorientation angles at the grain boundaries are very small, and the area fraction of grain boundaries is also very low. A non-negligible ‘grain boundary’ is the textural discontinuity at interfaces in 2ARB and 3ARB. As demonstrated by experimental observation in Ref. [34] and molecular dynamics studies [35], the effect of the interface on the plastic deformation and texture evolution is negligible, since its influence is only limited to a surficial layer.
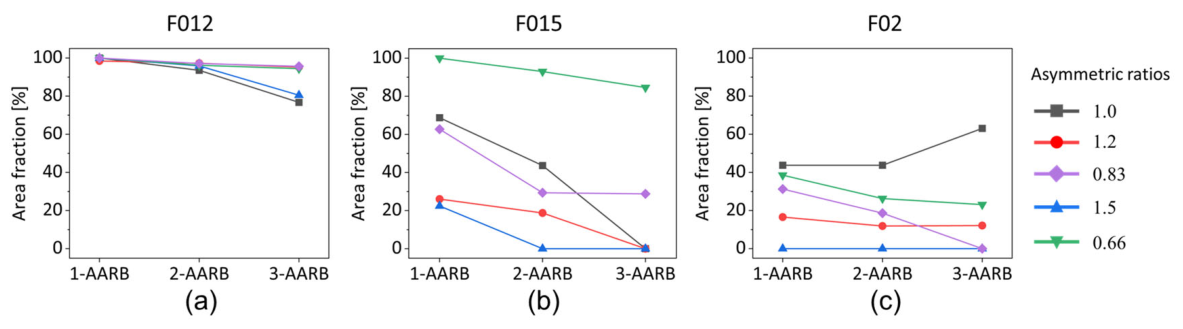
It is clear that the area fraction of the starting orientation {1 1 2}<1 1 1> decreased with increasing AARB cycles for almost all asymmetric ratios (Figure 7), which means the so-called rolling texture became unstable under the current AARB processing conditions. At least two reasons can account for this phenomenon. First, the surface shear cannot be neglected. Second, the cutting-stacking in the AARB process resulted in a change in through-thickness position, which altered the stress state. To further investigate the effect of the surface shear, two additional friction coefficients (0.12 and 0.2) were considered, and the predicted results are shown in Figure 11. The {1 1 1} pole figures with these three different friction coefficients (0.12, 0.15, and 0.2) are presented in the Supplementary Materials.
The initial {1 1 2}<1 1 1> was well preserved after 2-AARB and 3-AARB when slightly reducing the friction coefficient to 0.12 (Figure 11a), and it is thought-provoking that only the asymmetric ratio of 1.0 led to a slight drop in {1 1 2}<1 1 1> area fraction after 3-AARB. This means that under this surface friction, both increasing and decreasing the asymmetric ratios are beneficial to the preservation of the initial {1 1 2}<1 1 1>. With the friction coefficient increasing to 0.2 (Figure 11c), the area fraction of {1 1 2}<1 1 1> dropped rapidly in 1-AARB and 2-AARB, and the change was very slow in 3-AARB. In Figure 10c, the {1 1 2}<1 1 1> area fraction continuously dropped in all three AARB cycles, except for the asymmetric ratio of 0.66. Unexpectedly, the initial {1 1 2}<1 1 1> was well preserved for an asymmetric ratio of 0.66 in all three AARB cycles. Figure 11 clearly demonstrates that the {1 1 2}<1 1 1> was mainly preserved for all asymmetric ratios when the friction coefficient was low (0.12), while the {1 1 2}<1 1 1> is unstable for all asymmetric ratios when increasing the friction coefficient to 0.2. For the medium friction coefficient (0.15), the asymmetric ratio significantly influences the textural stability of {1 1 2}<1 1 1>. It can be concluded that the friction coefficient plays a primary role in the textural stability of {1 1 2}<1 1 1>, whereas the asymmetric ratio acts as a secondary factor during the AARB process.
For the crystal orientation, the previously attained relatively stable orientation became unstable when it was moved to another through-thickness position by the cutting-stacking, since the through-thickness stress state varied along the thickness direction. This can be manifested by the alternation of the main activated slip systems for a particular position (Figure 9). When the surface friction was very small (Figure 11a), the through-thickness stress state varied slightly, and thus, the previously stable orientation was still stable. In conventional rolling, the undesired {1 1 2}<1 1 1> texture developed, which results in plastic anisotropy, and this would hinder the plastic deformation during further processing. In the current study, the texture stability of {1 1 2}<1 1 1> after AARB was evaluated, where the AARB combines the conventional ARB and asymmetric rolling. It can be seen from the current study that the area fraction of the so-called stable {1 1 2}<1 1 1> orientation can be tailored by combining the surface friction, asymmetric ratio, and cutting-stacking pattern in ARB.

5. Conclusions

  • For the first time, the textural stability of the {1 1 2}<1 1 1> after AARB was assessed using CPFEM, and the inhomogeneous through-thickness deformation was successfully captured.
  • For the friction coefficient of 0.15, the area fraction of {1 1 2}<1 1 1> dropped gradually in all three AARB cycles for asymmetric ratios of 1.0, 1.2, 0.83, and 1.5, but was well preserved for the asymmetric ratio of 0.66.
  • The {1 1 2}<1 1 1> orientation remained stable when the friction coefficient was 0.12, whereas it became highly unstable when the friction coefficient increased to 0.2.
  • The numerical predictions showed that the surface friction, asymmetric ratio, and cutting-stacking pattern in AARB influence the textural stability of {1 1 2}<1 1 1>. These findings are beneficial for texture tailoring through simple adjustments of the rolling conditions.

Supplementary Materials

The following supporting information can be downloaded at: https://www.mdpi.com/article/10.3390/met16060576/s1, Figure S1: Decomposition of the deformation gradient F; Figure S2: (a) CPFEM model of plane strain compression, and (b) experimental and predicted stress-strain curves; Figure S3: A schematic of asymmetric ARB and distribution of four activated slip systems; Figure S4: Predicted through-thickness shear strain with different number of elements; Figure S5: {1 1 1} pole figures after 1-AARB, 2-AARB, and 3-AARB for the asymmetric ratios of (a) 1.0, (b) 1.2, (c) 0.83, (d) 1.5, and (e) 0.66. The friction coefficient was 0.12; Figure S6: {1 1 1} pole figures after 1-AARB, 2-AARB, and 3-AARB for the asymmetric ratios of (a) 1.0, (b) 1.2, (c) 0.83, (d) 1.5, and (e) 0.66. The friction coefficient was 0.15; Figure S7: {1 1 1} pole figures after 1-AARB, 2-AARB, and 3-AARB for the asymmetric ratios of (a) 1.0, (b) 1.2, (c) 0.83, (d) 1.5, and (e) 0.66. The friction coefficient was 0.2. Table S1: Notation of 12 slip systems. Table S2. Model parameters of AARB model and material parameters in the hardening model. References [36,37,38,39,40,41,42,43,44] are cited in Supplementary Materials.

Author Contributions

Conceptualization, R.W., X.H. and X.B.; software, R.W. and X.B.; validation, G.J., Y.S., X.H. and Y.L.; formal analysis, R.W. and G.J.; writing—original draft preparation, R.W., G.J. and Y.Z.; writing—review and editing, R.W., X.B., L.S., X.H. and Y.L.; visualization, R.W., L.S., Y.S., Y.Z. and X.B.; supervision, L.S., X.H. and Y.Z.; project administration, L.S. and X.H.; funding acquisition, L.S. and X.H. All authors have read and agreed to the published version of the manuscript.

Funding

This research received no external funding.

Data Availability Statement

The original contributions presented in this study are included in the article/Supplementary Materials. Further inquiries can be directed to the corresponding authors.

Conflicts of Interest

The authors declare no conflicts of interest.

References

  1. Song, K.; Miao, L.; Luo, Y.; Zhang, C.; Zhang, L.; Deng, G. Crystal Plasticity Analysis of the Orientation-Dependent Grain Rotation and Fragmentation Behaviors in Ferritic Stainless Steel During Cold Rolling. Met. Mater. Int. 2024, 30, 3202–3221. [Google Scholar] [CrossRef]
  2. Li, Z.; Kang, Q.; Sui, X.; Xu, X.; Zhan, L.; Wang, G. Analysis of the Mechanism of Orientations Evolution during Hot Rolling and Mechanical Properties of TiBw/TA15 Composites Based on Crystal Plasticity Finite Element Model. J. Mater. Sci. Technol. 2023, 167, 137–151. [Google Scholar] [CrossRef]
  3. Yousefi Mehr, V.; Toroghinejad, M.R. Complementary Research on the Al–Cu Nanostructured Composite Processed by ARB: Finite Element, Crystal Plasticity, Intermetallic, and Failure Analysis. J. Mater. Res. Technol. 2023, 24, 5934–5946. [Google Scholar] [CrossRef]
  4. Kim, J.H.; Kang, J.-H.; Oh, C.-S. Micromechanical Analysis of Anisotropy and Asymmetry in Pure Titanium Using Electron Backscatter Diffraction and Crystal Plasticity Finite Element Modeling. J. Mater. Res. Technol. 2023, 27, 4088–4108. [Google Scholar] [CrossRef]
  5. Zhu, B.; Li, K.; Xi, K.; Zhang, C.; Chen, J.; Tang, B.; Li, J. The Effect of Grain Morphology on the Property Anisotropy of IN625 Alloy Sheets: A Crystal Plasticity Study. Mater. Today Commun. 2025, 46, 112539. [Google Scholar] [CrossRef]
  6. Agrawal, S.; Panigrahi, A.; Avadhani, G.S.; Suwas, S. Evolution of Microstructure and Texture during Severe Plastic Deformation of the Aluminium Alloy AA2099. J. Mater. Sci. 2025, 60, 1361–1380. [Google Scholar] [CrossRef]
  7. Engler, O. Correlating Crystallographic Texture with Anisotropic Properties and Sheet Metal Forming of Aluminium Alloys. J. Mater. Res. Technol. 2025, 35, 514–522. [Google Scholar] [CrossRef]
  8. Feather, W.G.; Savage, D.J.; Knezevic, M. A Crystal Plasticity Finite Element Model Embedding Strain-Rate Sensitivities Inherent to Deformation Mechanisms: Application to Alloy AZ31. Int. J. Plast. 2021, 143, 103031. [Google Scholar] [CrossRef]
  9. Cantergiani, E.; Falkinger, G.; Mitsche, S.; Theissing, M.; Klitschke, S.; Roters, F. Influence of Strain Rate Sensitivity on Cube Texture Evolution in Aluminium Alloys. Metall. Mater. Trans. A 2022, 53, 2832–2860. [Google Scholar] [CrossRef]
  10. Byrska-Wójcik, D.; Ostachowska, M.; Gibek, J.; Wierzbanowski, K.; Wróbel, M.; Błoniarz, R.; Baczmański, A.; Kopyściański, M.; Kalemba-Rec, I. Effects of Asymmetric Rolling with Tilted Material Entry on Texture and Mechanical Properties of Aluminium. J. Mater. Process. Technol. 2025, 338, 118796. [Google Scholar] [CrossRef]
  11. Han, Y.; Lv, K.; Lin, C.; Dai, Y.; Li, X.; Wang, E. Sheet-Based Friction Stir Additive Manufactured 6061 Aluminium Alloy: Microstructure, Texture Evolution and Mechanical Properties. Mater. Sci. Eng. A 2024, 915, 147295. [Google Scholar] [CrossRef]
  12. Sarvi, Z.; Sadeghi, A.; Mosavi Mashhadi, M.; Guo, B. Effect of Accumulative Roll Bonding (ARB) Strain Path on Microstructural Evolution and Crystallographic Texture Development in Aluminium. J. Mater. Res. Technol. 2022, 21, 1061–1071. [Google Scholar] [CrossRef]
  13. Rao, G.N.M.; Kumar, V.R.M. A Review on Recent Advances in Accumulative Roll Bonding of Similar, Dissimilar and Metal Matrix Composites. Mater. Today Proc. 2022, 56, A13–A18. [Google Scholar] [CrossRef]
  14. Li, F.; Chen, X.; Ding, L.; Wang, C.; Zhang, K.; Weng, Y.; Jia, Z. Influence of Different Rolling Processes on Microstructure, Texture and Anisotropy of the Al–Cu–Li Alloy. J. Mater. Res. Technol. 2025, 34, 2580–2592. [Google Scholar] [CrossRef]
  15. Li, S.; Yang, L.; Qin, N. Development of Through-Thickness Texture Gradient and Persistence of Shear-Type Textures during Annealing of Commercial Purity Aluminium Sheet Processed by Accumulative Roll-Bonding. J. Mater. Sci. Technol. 2018, 34, 821–831. [Google Scholar] [CrossRef]
  16. Roghani, H.; Borhani, E.; Shams, S.A.A.; Lee, C.S.; Jafarian, H.R. Effect of Concurrent Accumulative Roll Bonding (ARB) Process and Various Heat Treatment on the Microstructure, Texture and Mechanical Properties of AA1050 Sheets. J. Mater. Res. Technol. 2022, 18, 1295–1306. [Google Scholar] [CrossRef]
  17. Kamikawa, N.; Sakai, T.; Tsuji, N. Effect of Redundant Shear Strain on Microstructure and Texture Evolution during Accumulative Roll-Bonding in Ultralow Carbon IF Steel. Acta Mater. 2007, 55, 5873–5888. [Google Scholar] [CrossRef]
  18. Kashihara, K.; Tsujimoto, Y.; Terada, D.; Tsuji, N. Texture Evolution in {112} Aluminum Single Crystals Processed by Severe Plastic Deformation. Mater. Charact. 2013, 75, 129–137. [Google Scholar] [CrossRef]
  19. Cappola, J.; Wang, J.; Li, L. A Dislocation-Density-Based Crystal Plasticity Model for FCC Nanocrystalline Metals Incorporating Thermally-Activated Depinning from Grain Boundaries. Int. J. Plast. 2024, 172, 103863. [Google Scholar] [CrossRef]
  20. Li, S.; Sun, F.; Li, H. Observation and Modeling of the Through-Thickness Texture Gradient in Commercial-Purity Aluminum Sheets Processed by Accumulative Roll-Bonding. Acta Mater. 2010, 58, 1317–1331. [Google Scholar] [CrossRef]
  21. Wang, H.; Lu, C.; Tieu, K.; Wei, P.; Yu, H. Texture Stability and Transition in an Accumulative Roll-Bonding-Processed Aluminum Single Crystal. Metall. Mater. Trans. A 2019, 50, 1611–1615. [Google Scholar] [CrossRef]
  22. Wang, H.; Lu, C.; Tieu, K.; Wei, P.; Yu, H. Texture Modeling of Accumulative Roll-Bonding Processed Aluminum Single Crystal {1 2 3}<6 3 4> by Crystal Plasticity FE. Adv. Eng. Mater. 2019, 21, 1800827. [Google Scholar] [CrossRef]
  23. Tu, H.; Wu, S.; Zhang, H.; Wang, H. Numerical Investigating the Behaviors of Texture Transition in Polycrystalline Pure Aluminum during Asymmetric Accumulative Roll-Bonding (AARB). J. Mater. Res. 2025, 40, 3093–3105. [Google Scholar] [CrossRef]
  24. Verstraete, K.; Azzedine, H.; Helbert, A.; Brisset, F.; Bradai, D.; Baudin, T. Accumulative Roll Bonding at Room Temperature of a Bi-Metallic AA5754/AA6061 Composite: Impact of Strain Path on Microstructure, Texture, and Mechanical Properties. Adv. Eng. Mater. 2018, 20, 1700285. [Google Scholar] [CrossRef]
  25. De Godoi, R.P.; Camilo Magalhães, D.C.; Avalos, M.; Bolmaro, R.E.; Sordi, V.L.; Kliauga, A.M. Microstructure, Texture and Interface Integrity in Sheets Processed by Asymmetric Accumulative Roll-Bonding. Mater. Sci. Eng. A 2020, 771, 138634. [Google Scholar] [CrossRef]
  26. Feng, B.; Yang, H.; Li, X.; Feng, X.; Chen, T.; Li, G. Development of Accumulative Roll Bonding for Metallic Composite Material Preparation and Mechanical/Functional Applications. J. Iron Steel Res. Int. 2024, 31, 2611–2621. [Google Scholar] [CrossRef]
  27. Zaefferer, S.; Kuo, J.-C.; Zhao, Z.; Winning, M.; Raabe, D. On the Influence of the Grain Boundary Misorientation on the Plastic Deformation of Aluminum Bicrystals. Acta Mater. 2003, 51, 4719–4735. [Google Scholar] [CrossRef]
  28. Luan, Q.; Xing, H.; Zhang, J.; Jiang, J. Experimental and Crystal Plasticity Study on Deformation Bands in Single Crystal and Multi-Crystal Pure Aluminium. Acta Mater. 2020, 183, 78–92. [Google Scholar] [CrossRef]
  29. Peirce, D.; Asaro, R.J.; Needleman, A. Material Rate Dependence and Localized Deformation in Crystalline Solids. Acta Metall. 1983, 31, 1951–1976. [Google Scholar] [CrossRef]
  30. Wu, T.; Bassani, J.L.; Laird, C. Latent Hardening in Single Crystals—I. Theory and Experiments. Proc. R. Soc. Lond. Ser. A Math. Phys. Sci. 1991, 435, 1–19. [Google Scholar] [CrossRef]
  31. Godfrey, A.; Jensen, D.J.; Hansen, N. Slip Pattern, Microstructure and Local Crystallography in an Aluminium Single Crystal of Copper Orientation {112}<111>. Acta Mater. 1998, 46, 835–848. [Google Scholar] [CrossRef]
  32. Savage, D.J.; McCabe, R.J.; Knezevic, M. An Automated Procedure Built on MTEX for Reconstructing Deformation Twin Hierarchies from Electron Backscattered Diffraction Datasets of Heavily Twinned Microstructures. Mater. Charact. 2021, 171, 110808. [Google Scholar] [CrossRef]
  33. Raabe, D.; Zhao, Z.; Mao, W. On the Dependence of In-Grain Subdivision and Deformation Texture of Aluminum on Grain Interaction. Acta Mater. 2002, 50, 4379–4394. [Google Scholar] [CrossRef]
  34. Sato, M.; Tsuji, N.; Minamino, Y.; Koizumi, Y. Formation of Nanocrystalline Surface Layers in Various Metallic Materials by near Surface Severe Plastic Deformation. Sci. Technol. Adv. Mater. 2004, 5, 145–152. [Google Scholar] [CrossRef]
  35. Li, Z.; Shen, T.; Li, J.; Xia, S.; Yu, L.; Zhang, C. Developing a Dual-Mode Confined Layer Slip Model for Al/Mg Composites with Incoherent FCC/HCP Interfaces: Insights from Molecular Dynamics Studies. Next Mater. 2025, 6, 100433. [Google Scholar] [CrossRef]
  36. Asaro, R.J. Crystal Plasticity. J. Appl. Mech. 1983, 50, 921–934. [Google Scholar] [CrossRef]
  37. Peirce, D.; Asaro, R.J.; Needleman, A. An Analysis of Nonuniform and Localized Deformation in Ductile Single Crystals. Acta Metall. 1982, 30, 1087–1119. [Google Scholar] [CrossRef]
  38. Bassani, J.L.; Wu, T. Latent Hardening in Single Crystals. II. Analytical Characterization and Predictions. Proc. R. Soc. Lond. A Math. Phys. Sci. 1991, 435, 21–41. [Google Scholar] [CrossRef]
  39. Lin, G.; Havner, K.S. A Comparative Study of Hardening Theories in Torsion Using the Taylor Polycrystal Model. Int. J. Plast. 1996, 12, 695–718. [Google Scholar] [CrossRef]
  40. Franciosi, P.; Berveiller, M.; Zaoui, A. Latent Hardening in Copper and Aluminium Single Crystals. Acta Metall. 1980, 28, 273–283. [Google Scholar] [CrossRef]
  41. Liu, Q.; Hansen, N.; Maurice, C.; Driver, J. Heterogeneous Microstructures and Microtextures in Cube-Oriented al Crystals after Channel Die Compression. Metall. Mater. Trans. A 1998, 29, 2333–2344. [Google Scholar] [CrossRef]
  42. Deng, G.Y.; Tieu, A.K.; Si, L.Y.; Su, L.H.; Lu, C.; Wang, H.; Liu, M.; Zhu, H.T.; Liu, X.H. Influence of Cold Rolling Reduction on the Deformation Behaviour and Crystallographic Orientation Development. Comput. Mater. Sci. 2014, 81, 2–9. [Google Scholar] [CrossRef]
  43. Lu, C.; Deng, G.Y.; Tieu, A.K.; Su, L.H.; Zhu, H.T.; Liu, X.H. Crystal Plasticity Modeling of Texture Evolution and Heterogeneity in Equal Channel Angular Pressing of Aluminum Single Crystal. Acta Mater. 2011, 59, 3581–3592. [Google Scholar] [CrossRef]
  44. Jabłońska, M.B. Effect of the Conversion of the Plastic Deformation Work to Heat on the Behaviour of TWIP Steels: A Review. Arch. Civ. Mech. Eng. 2023, 23, 135. [Google Scholar] [CrossRef]
Figure 1. A schematic of asymmetric ARB and the distribution of four activated slip systems.
Metals 16 00576 g001
Figure 2. Distribution of shear strain and distorted FEM meshes for the asymmetric ratios of (a) 1.0, (b) 1.2, (c) 0.83, (d) 1.5, and (e) 0.66. The red arrows indicate the bonded interfaces.
Metals 16 00576 g002
Figure 3. Distribution of shear strain with different asymmetric ratios after (a) 1-AARB, (b) 2-AARB, and (c) 3-AARB, where the shear strain was that evolved in each single AARB cycle, not cumulative values.
Metals 16 00576 g003
Figure 4. Distribution of crystal rotation angles (between initial and final crystallographic orientations) for the asymmetric ratios of (a) 1.0, (b) 1.2, (c) 0.83, (d) 1.5, and (e) 0.66. The red arrows indicate the bonded interfaces.
Metals 16 00576 g004
Figure 5. Distribution of TD-rotation angles with different asymmetric ratios after (a) 1-AARB, (b) 2-AARB, and (c) 3-AARB.
Metals 16 00576 g005
Figure 6. {1 1 1} Pole figures after 1-AARB, 2-AARB, and 3-AARB for the asymmetric ratios of (a) 1.0, (b) 1.2, (c) 0.83, (d) 1.5, and (e) 0.66. (f) Experimental results of {1 1 2}<1 1 1> after ARB at the upper surface, centre, and lower surface, which were revealed by the electron backscatter diffraction (EBSD).
Metals 16 00576 g006
Figure 7. Area fraction of the preserved initial orientation C {1 1 2}<1 1 1> after 1-AARB, 2-AARB, and 3-AARB.
Metals 16 00576 g007
Figure 8. The distribution of preserved, destroyed, and formed C {1 1 2}<1 1 1> with asymmetric ratios of (a) 1.0, (b) 1.2, (c) 0.83, (d) 1.5, and (e) 0.66.
Metals 16 00576 g008
Figure 9. Distribution of slip traces after 1-AARB, 2-AARB, and 3-AARB for the asymmetric ratios of (a) 1.0, (b) 1.2, (c) 0.83, (d) 1.5, and (e) 0.66. The blue and red slip traces represent the slip systems exhibiting the largest and second-largest cumulative shear strains, respectively.
Metals 16 00576 g009
Figure 10. Imbalance of shear strain on the slip systems between c 3 and a 1 slip systems ( γ c 3 γ a 1 ) after (a) 1-AARB, (b) 2-AARB, and (c) 3-AARB.
Metals 16 00576 g010
Figure 11. Area fraction of the preserved initial orientation {1 1 2}<1 1 1> for friction coefficients of (a) 0.12, (b) 0.15, and (c) 0.2.
Metals 16 00576 g011
Disclaimer/Publisher’s Note: The statements, opinions and data contained in all publications are solely those of the individual author(s) and contributor(s) and not of MDPI and/or the editor(s). MDPI and/or the editor(s) disclaim responsibility for any injury to people or property resulting from any ideas, methods, instructions or products referred to in the content.