Article

Investigation of Welded Joints of Pipelines from an Existing Gas Transmission Network Exposed to Hydrogen—Part II: Some Aspects of the Microstructural Mechanisms of Hydrogen-Assisted Damage and Fracture


1
Institute of Metal Science, Equipment, and Technologies with Center of Hydro- and Aerodynamics “Acad. A. Balevski” at the Bulgarian Academy of Sciences, 67 “Shipchenski Prohod” Str., 1574 Sofia, Bulgaria
2
National Center for Mechatronics and Clean Technologies, 8 Kliment Ohridski Blvd., Building 8, 1756 Sofia, Bulgaria
3
Institute of Mechanics at the Bulgarian Academy of Sciences, Acad. Georgi Bonchev Str., Bl. 4, 1113 Sofia, Bulgaria
4
Faculty of Physics, Sofia University “St. Kliment Ohridski”, 5 James Bourchier Blvd., 1164 Sofia, Bulgaria
*
Author to whom correspondence should be addressed.
Metals 2026, 16(6), 573; https://doi.org/10.3390/met16060573
Submission received: 29 April 2026 / Revised: 19 May 2026 / Accepted: 22 May 2026 / Published: 24 May 2026
(This article belongs to the Special Issue Advances in the Fatigue and Fracture Behaviour of Metallic Materials)

Abstract

This study investigates hydrogen embrittlement in welded joints of X52 (L360) pipeline steel obtained from an operating natural gas transmission network after 31 years of service, with particular emphasis on production (longitudinal) and girth (circumferential) welds. The aim is to elucidate the influence of microstructural heterogeneity across the pipe wall and within different welded joint types on hydrogen transport, trapping behavior, and fracture mechanisms. The investigation combines X-ray diffraction, electrochemical hydrogen permeation testing, fractographic analysis, and transmission electron microscopy. X-ray diffraction results show that the base metal and girth weld consist predominantly of body-centered cubic ferrite, whereas the production weld additionally contains retained austenite associated with an elevated manganese content. These phase-related differences are consistent with transmission electron microscopy observations of martensite–austenite constituents within the weld microstructure. Electrochemical hydrogen permeation measurements reveal pronounced microstructure-dependent hydrogen transport behavior. The production weld exhibits a significantly lower apparent diffusion coefficient and a markedly higher hydrogen trap density, approximately five times greater than those of the base metal and girth weld, providing a mechanistic explanation for the observed differences in hydrogen uptake behavior. Fractographic analysis demonstrates a transition from ductile microvoid coalescence in the uncharged condition to predominantly brittle fracture following hydrogen charging. This transition is accompanied by a substantial increase in the fraction of brittle fracture zones, reaching approximately 53% in hydrogen-charged specimens. A pronounced gradient in hydrogen embrittlement susceptibility is observed across the pipe wall thickness, with outer-wall specimens consistently exhibiting greater susceptibility than inner-wall specimens. This behavior reflects the combined influence of long-term soil corrosion and hydrogen-assisted degradation. Transmission electron microscopy reveals that plastic deformation governs dislocation generation, while hydrogen significantly modifies dislocation behavior by promoting dislocation pile-ups near martensite–austenite constituents and non-metallic inclusions. These observations indicate strong interactions between hydrogen, dislocations, and microstructural heterogeneities. A clear size-dependent role of non-metallic inclusions is identified. Sub-micron inclusions act primarily as irreversible hydrogen trapping sites that contribute to hydrogen redistribution within the microstructure, whereas larger inclusions serve as preferential crack initiation sites under hydrogen charging conditions. Overall, the results demonstrate that hydrogen embrittlement behavior is governed by the combined effects of microstructural state, welded joint type, and long-term service-induced degradation, resulting in distinct hydrogen transport characteristics and fracture responses across the pipe wall.

1. Introduction

The transition toward hydrogen-based energy systems is placing increasing demands on the structural integrity of infrastructure originally designed for natural gas service. The repurposing of existing pipelines for hydrogen transport is economically attractive; however, it requires rigorous assessment of hydrogen-related degradation phenomena, particularly in structurally heterogeneous regions such as welded joints [1,2,3,4].
Carbon and low-alloy steels, which constitute the majority of existing transmission pipeline networks, exhibit varying susceptibility to hydrogen embrittlement (HE) depending on their chemical composition, phase constitution, manufacturing history, and service conditions [5]. Welded joints represent the most complex and mechanically critical regions of a pipeline because they combine zones with distinct microstructures—namely the base metal (BM), heat-affected zone (HAZ), and weld zone (WZ)—each characterized by different hydrogen trapping capacities, diffusivities, and fracture resistances [2,6,7,8].
In the BM, hydrogen trapping is governed primarily by three classes of microstructural features. High-density dislocations introduced by cold working act as reversible hydrogen traps in X52 steel [9], while grain boundaries and ferrite–pearlite interfaces promote hydrogen-assisted degradation, with a particularly pronounced effect in banded ferrite–pearlite microstructures [10]. Non-metallic inclusions, including oxide and sulfide particles and their complexes, constitute the dominant population of irreversible hydrogen traps [11]. Khalili Tabas et al. [11] demonstrated that the type, morphology, distribution, and chemical composition of inclusions strongly influence hydrogen-induced cracking (HIC) resistance in electric-resistance-welded X52 pipeline steel, identifying aluminosilicate compounds and MnS inclusions as the most critical crack initiation sites.
Production weld (PW) metal typically exhibits a complex as-cast microstructure comprising acicular ferrite [12], bainite with elevated dislocation density, and martensite–austenite (M/A) constituents [13]. The relative fractions of these phases depend strongly on the welding process and cooling conditions. Despite this microstructural complexity, weld metal generally exhibits lower hydrogen permeation than the BM because of its higher effective hydrogen trap density [13]. Within PW joints, the HAZ represents the most critical region with respect to hydrogen trapping and embrittlement. Regions near the fusion line experience high peak temperatures during welding, resulting in grain coarsening and promoting the formation of M/A constituents in low-carbon steels [13]. The resulting heterogeneous microstructure—consisting of coarse-grained ferrite, acicular ferrite, discontinuous pearlite colonies, bainitic regions, and M/A islands [13]—provides a high density of trapping sites and renders the HAZ the most susceptible region to hydrogen-induced cracking [12,14]. Accordingly, hydrogen susceptibility in PW joints generally decreases in the order: HAZ > BM > weld metal [12]. Khalili Tabas et al. [11] further demonstrated that post-weld heat treatment by normalizing refines the grain structure and homogenizes the distribution of trapping sites, thereby reducing the density of irreversible traps and improving HIC resistance.
Girth welds (GW), produced by multi-pass circumferential welding of adjacent pipe sections, develop particularly complex microstructures as a result of repeated thermal cycling. Four distinct sub-zones are typically identified: the weld metal, coarse-grained HAZ (CGHAZ), fine-grained HAZ, and intercritical HAZ (ICHAZ), each exhibiting different hydrogen trapping characteristics [15,16]. The base material adjacent to the GW consists mainly of ferrite and pearlite, whereas the weld metal is composed predominantly of acicular ferrite and grain-boundary ferrite [16]. Vega et al. [15] demonstrated through slow strain rate testing that the ICHAZ is the most susceptible sub-zone to sulphide stress corrosion cracking in API X52 GWs. This behavior was attributed to heating between the A c 1 and A c 3 transformation temperatures during successive weld passes, which promotes the formation of M/A microconstituents acting as strong irreversible hydrogen traps. Among the microstructures encountered in GWs, ferrite–pearlite and ferrite containing M/A constituents exhibit the highest susceptibility to hydrogen embrittlement and sulphide stress cracking, whereas acicular ferrite, ferrite–bainite, ultrafine grain-boundary ferrite, and lower bainite exhibit the lowest susceptibility [16]. The comparatively low hydrogen trapping capacity of acicular ferrite and bainite is attributed to the fine carbide distribution within these microstructures, which reduces the ferrite–carbide interfacial area available for hydrogen accumulation [16].
The dominant hydrogen trap types in each region of a welded pipeline joint can therefore be summarized as follows: in the BM, dislocations, grain boundaries, ferrite–pearlite interfaces, and non-metallic inclusions; in the PW, acicular ferrite boundaries, dislocations, bainitic laths, and M/A constituents; and in the GW, M/A constituents within the ICHAZ, prior-austenite grain boundaries in the CGHAZ, and complex inclusion networks distributed throughout the weld metal. The principal irreversible traps are MnS and oxide inclusions in the BM, inclusion strings and M/A islands in the PW, and M/A constituents together with complex oxide–sulfide inclusions in the GW. Consequently, the highest hydrogen diffusivity is generally expected in the BM [13], the highest hydrogen absorption capacity in the HAZ [12], and the greatest overall hydrogen susceptibility in the ICHAZ [15].
The studies reviewed above address important individual aspects of hydrogen behavior in pipeline welds, including the influence of welding procedures on mechanical properties, the role of cold working and multi-pass thermal cycling on microstructure evolution, and the susceptibility of individual weld sub-zones to hydrogen embrittlement and stress corrosion cracking. However, a gap remains between these isolated observations and a unified mechanistic understanding of hydrogen-assisted embrittlement and cracking, particularly regarding the variation of hydrogen trapping behavior through the pipe wall thickness and the interplay among structural heterogeneity, non-metallic inclusions, and local stress state in controlling the zone-specific response. The present work is directed toward addressing this gap.

2. Methodology

2.1. Materials

The investigated material was obtained from X52 pipeline steel taken from an existing natural gas transmission system in Bulgaria after 31 years of service. The chemical compositions of the BM, PW, and GW were determined using an optical emission spectrometer (Q4 TASMAN Q101750-C130, Bruker AXS, Berlin, Germany). The measured compositions are summarized in Table 1 [5].
The PW is approximately 35 mm wide and 16.5 mm thick, whereas the GW is approximately 13.5 mm wide and 12.7 mm thick. Minor dimensional variations were observed along the weld length (or circumference in the case of the GW).

2.2. Test Methods

2.2.1. Electrochemical Hydrogen Charging and Tensile Testing

Detailed descriptions of the pipeline geometry, specimen geometry, electrochemical hydrogen charging procedure, and in situ tensile testing under hydrogen charging conditions are provided in Ref. [5].

2.2.2. Hydrogen Permeation Testing

Electrochemical hydrogen permeation measurements were performed to evaluate the hydrogen diffusion characteristics of the investigated pipeline steel. The experimental procedure followed ISO 17081:2014 [17].
Disc specimens with a diameter of 28 mm, thickness L = 1.05 mm, and exposed area A = 3.14 cm2 were used for the permeation measurements. Prior to testing, all specimen surfaces were ground using SiC 600 abrasive paper with randomly oriented scratches. The same surface preparation procedure was applied to all specimens to ensure experimental consistency.
Hydrogen permeation measurements were carried out using a Devanathan–Stachurski-type electrochemical cell [18], in which the metallic specimen acts as a hydrogen-permeable membrane separating two electrochemical half-cells. Electrochemical measurements were performed using a Corrtest CS2350M bipotentiostat (Corrtest Instruments, Wuhan, China), which enabled independent potential control of the anodic and cathodic half-cells.
After mounting and sealing the specimen between the two cells, the exit (anodic) side was filled with deaerated 0.1 M NaOH solution. A passive surface film was then formed by applying a potential of + 0.454 V versus the Hg/HgO (1 M KOH) reference electrode. Passivation was considered complete when the anodic current density in the exit cell decreased below 100 nA/cm2. All permeation transients were recorded at 25 °C under galvanostatic hydrogen charging at a current density of 3 mA/cm2.

2.3. Characterization Methods

2.3.1. X-Ray Diffraction Analysis (XRD)

XRD analysis was performed using a TDM-10 diffractometer (Dandong Tongda Science and Technology Co., Ltd., Dandong, China) equipped with Cu-K α radiation and a Ni K β filter. The X-ray tube was operated at 40 kV and 35 mA. Diffraction patterns were collected using a step size of 0.02° and a scanning speed of 0.4°/min. Phase identification was carried out using Match! 4 software.
Specimens for XRD analysis were extracted from the BM, PW, and GW regions. Peak broadening analysis was conducted using the modified Williamson–Hall method [19]. The analysis assumed an average dislocation contrast factor ( C ¯ = 0.30 ) corresponding to mixed dislocations containing both edge and screw components [20]. Instrumental broadening was corrected using a silicon standard reference material, and linear fitting was performed by least-squares regression.

2.3.2. Microstructural and Fractographic Analyses

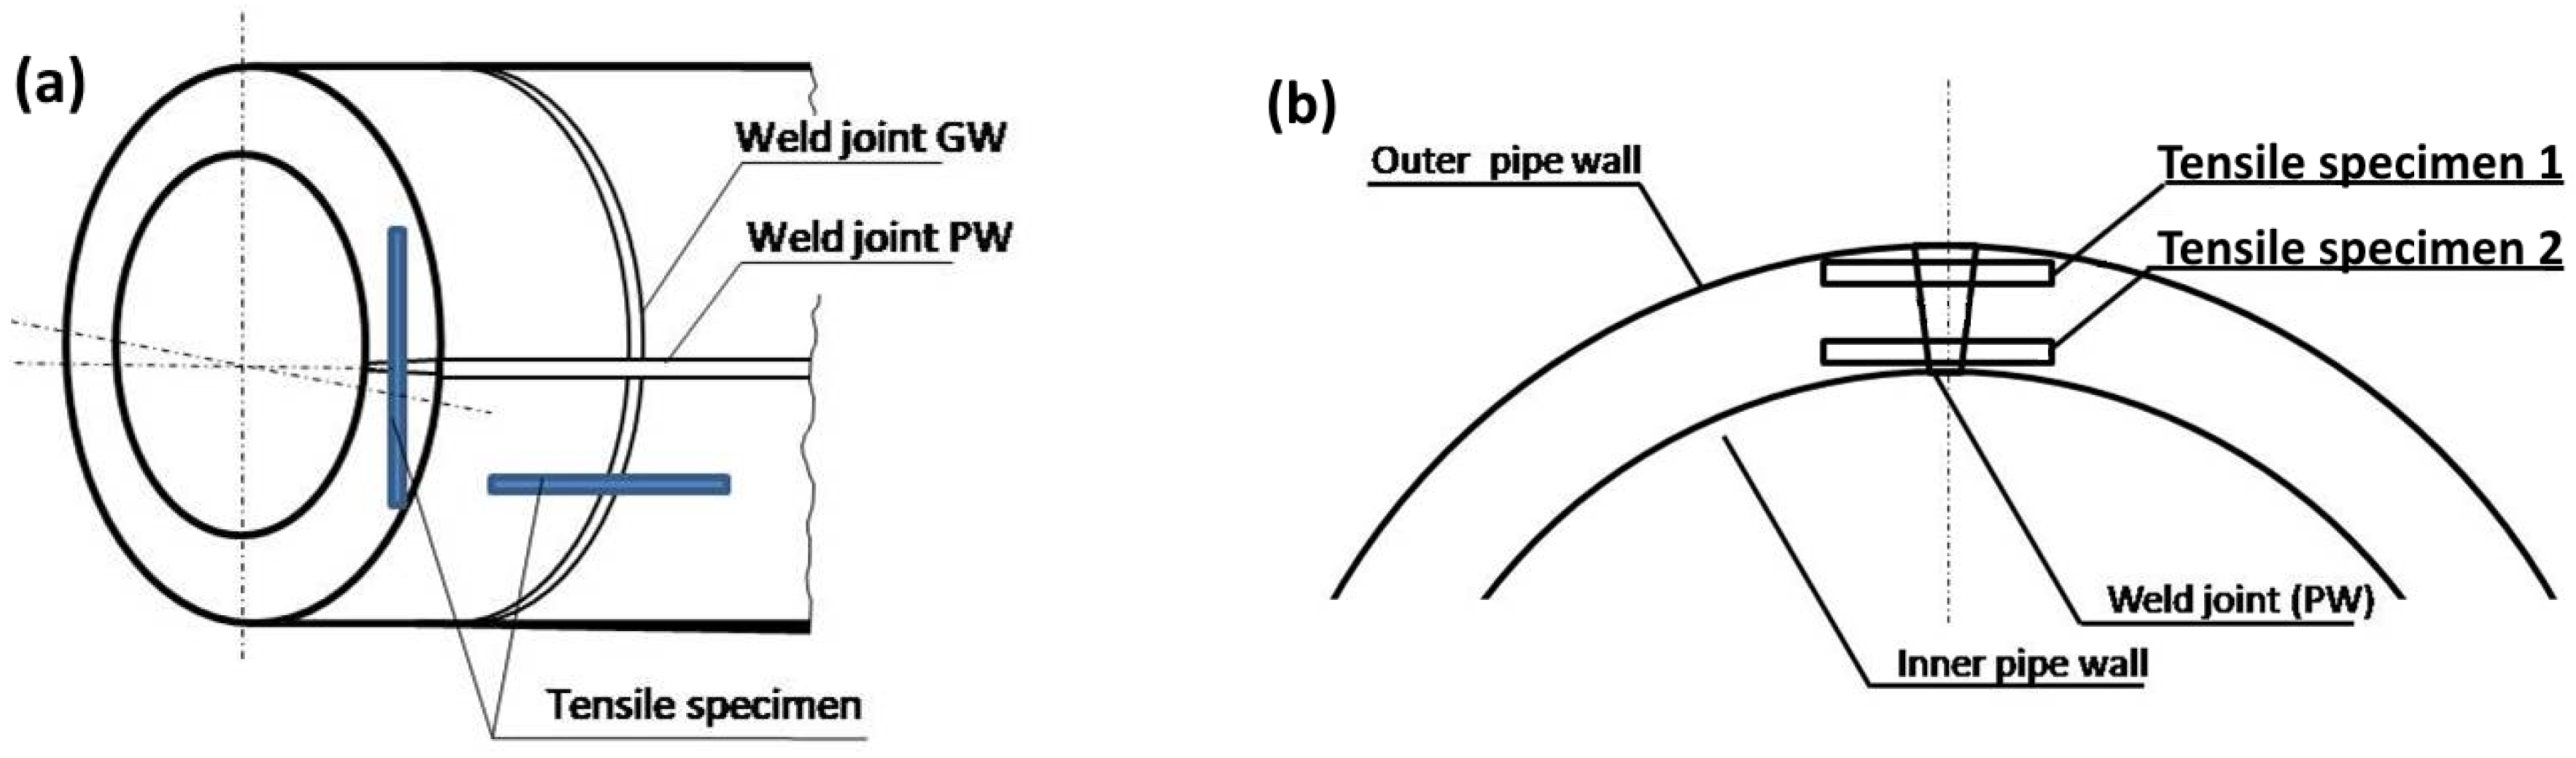
To evaluate the through-thickness gradient of hydrogen embrittlement susceptibility, six tensile specimens were extracted from two positions across the pipe wall thickness (three from each position): position 1 (outer wall, furthest from the gas flow path) and position 2 (inner wall, closest to the pipe bore exposed to the transported gas). Specimens were designated as follows: PW-1 and PW-2 (PW, uncharged), PW-1H and PW-2H (PW, hydrogen charged), GW-1 and GW-2 (GW, uncharged), and GW-1H and GW-2H (GW, hydrogen charged).
A schematic representation of the sampling locations through the pipe wall thickness is shown in Figure 1, while the orientations of the PW and GW tensile specimens with respect to the rolling direction (RD) and loading direction (LD) are presented in Figure 2.
Fractographic and microstructural analyses were performed on all fractured tensile specimens using a HIROX 5500 scanning electron microscope (HIROX Europe, Limonest, France) equipped with a Bruker EDXS system (Bruker Co., Berlin, Germany). Composite images of the complete fracture surfaces were obtained by sequential stitching of individual SEM micrographs acquired along the loading direction.
The relative fraction of the brittle fracture zone (BFZ), expressed as a percentage of the total fracture surface area, was determined by image analysis.
Microstructural characterization of the area beneath the fracture surface (ABFS) was carried out on polished and etched cross-sections of fractured specimens. The specimens were prepared by grinding, polishing, and etching with 2% nital. The investigated region extended to a depth of approximately 400 μm below the fracture surface, following the methodology described in Part I [5].

2.3.3. TEM Analysis

TEM analysis was performed using a JEM 1011 transmission electron microscope (JEOL Ltd., Tokyo, Japan) operated at an accelerating voltage of 100 kV. Thin foils were prepared using a TENUPOL 5 electropolishing system (STRUERS Ltd., Copenhagen, Denmark) at 45 V and 5 °C, with a flow rate setting of 20 and STRUERS-A2 electrolyte.

3. Results and Discussion

3.1. Microstructural Analysis of the ABFS of Specimens at Position 1 (Figure 1)

3.1.1. Uncharged Specimen Containing GW

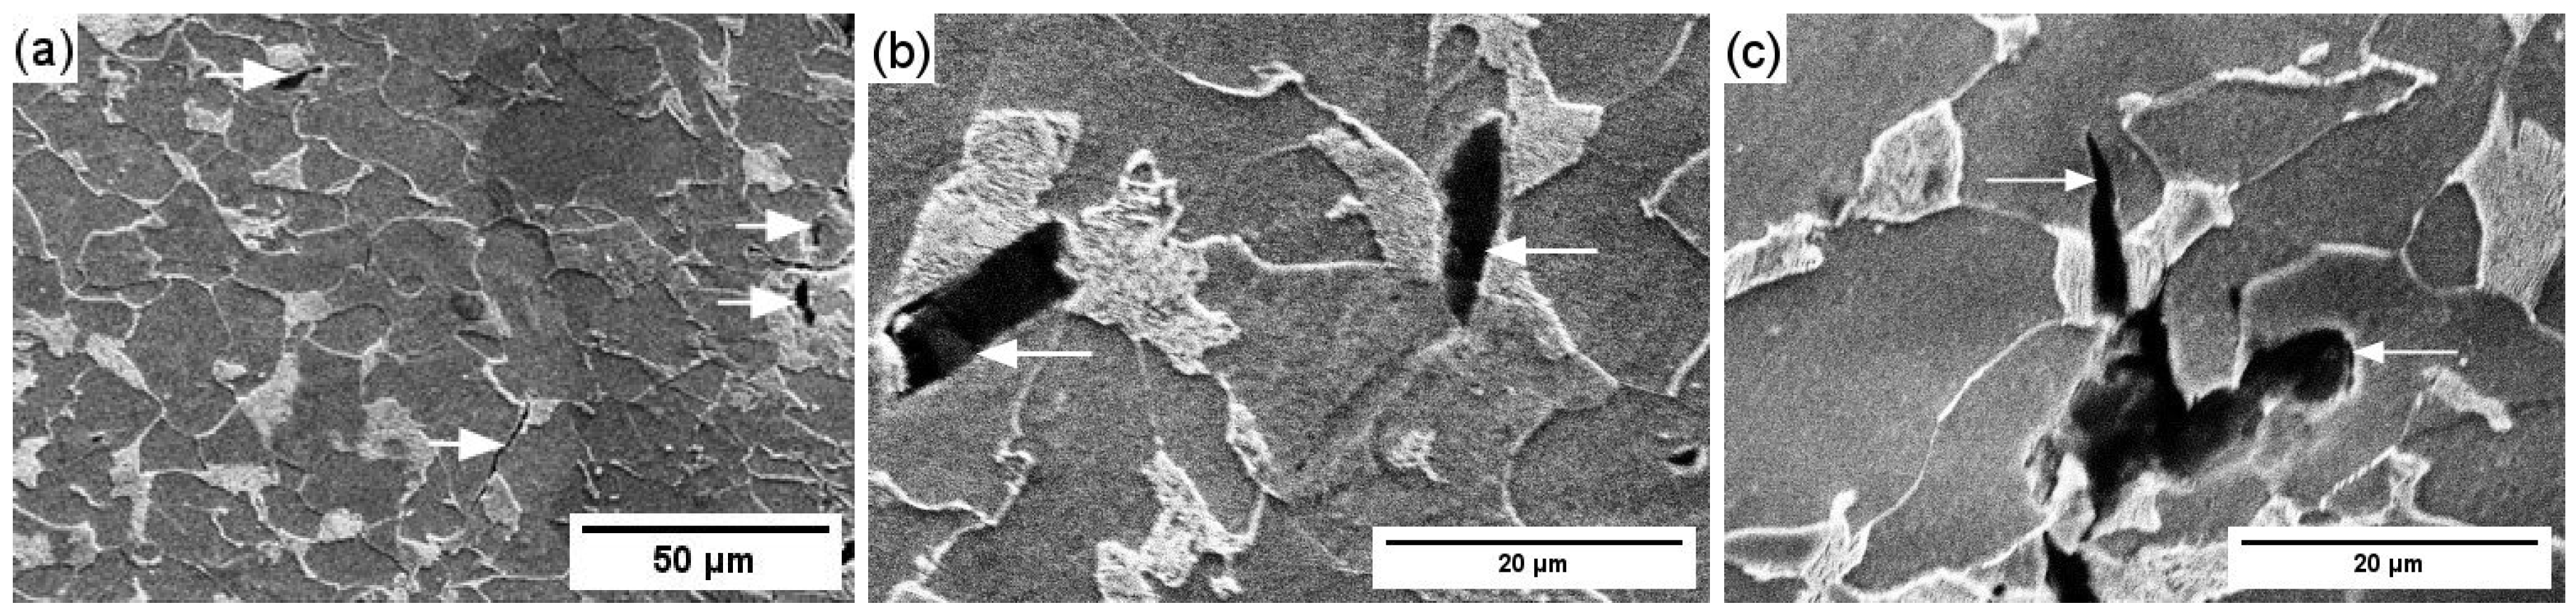
Figure 3a–c show the microstructure in the ABFS of an uncharged specimen containing a GW. Fracture occurred within the HAZ, whose microstructure is characterized by a higher fraction of non-equiaxed ferrite grains and pearlite colonies compared with the BM, together with a small amount of structurally free cementite inclusions. These features indicate non-equilibrium solidification in this region (Figure 3a).
Damage is manifested by the formation of cracks and microvoids (Figure 3b,c). Crack propagation occurs both within the ferritic phase, where it proceeds transgranularly and along pearlite colonies (Figure 3b), and inside pearlite colonies, where cracks propagate both perpendicular (Figure 3b) and parallel (Figure 3c) to the cementite lamellae.
These observations indicate that the fracture mechanisms in specimens extracted near the pipe surface, which had been exposed to soil for more than 31 years, differ from those observed in corresponding mid-thickness specimens, where fracture occurred predominantly within the ferritic phase (see Figure 5a,b in Part I [5]). This difference is likely associated with long-term corrosion processes affecting the surface layers of the pipe.

3.1.2. Uncharged Specimen Containing PW

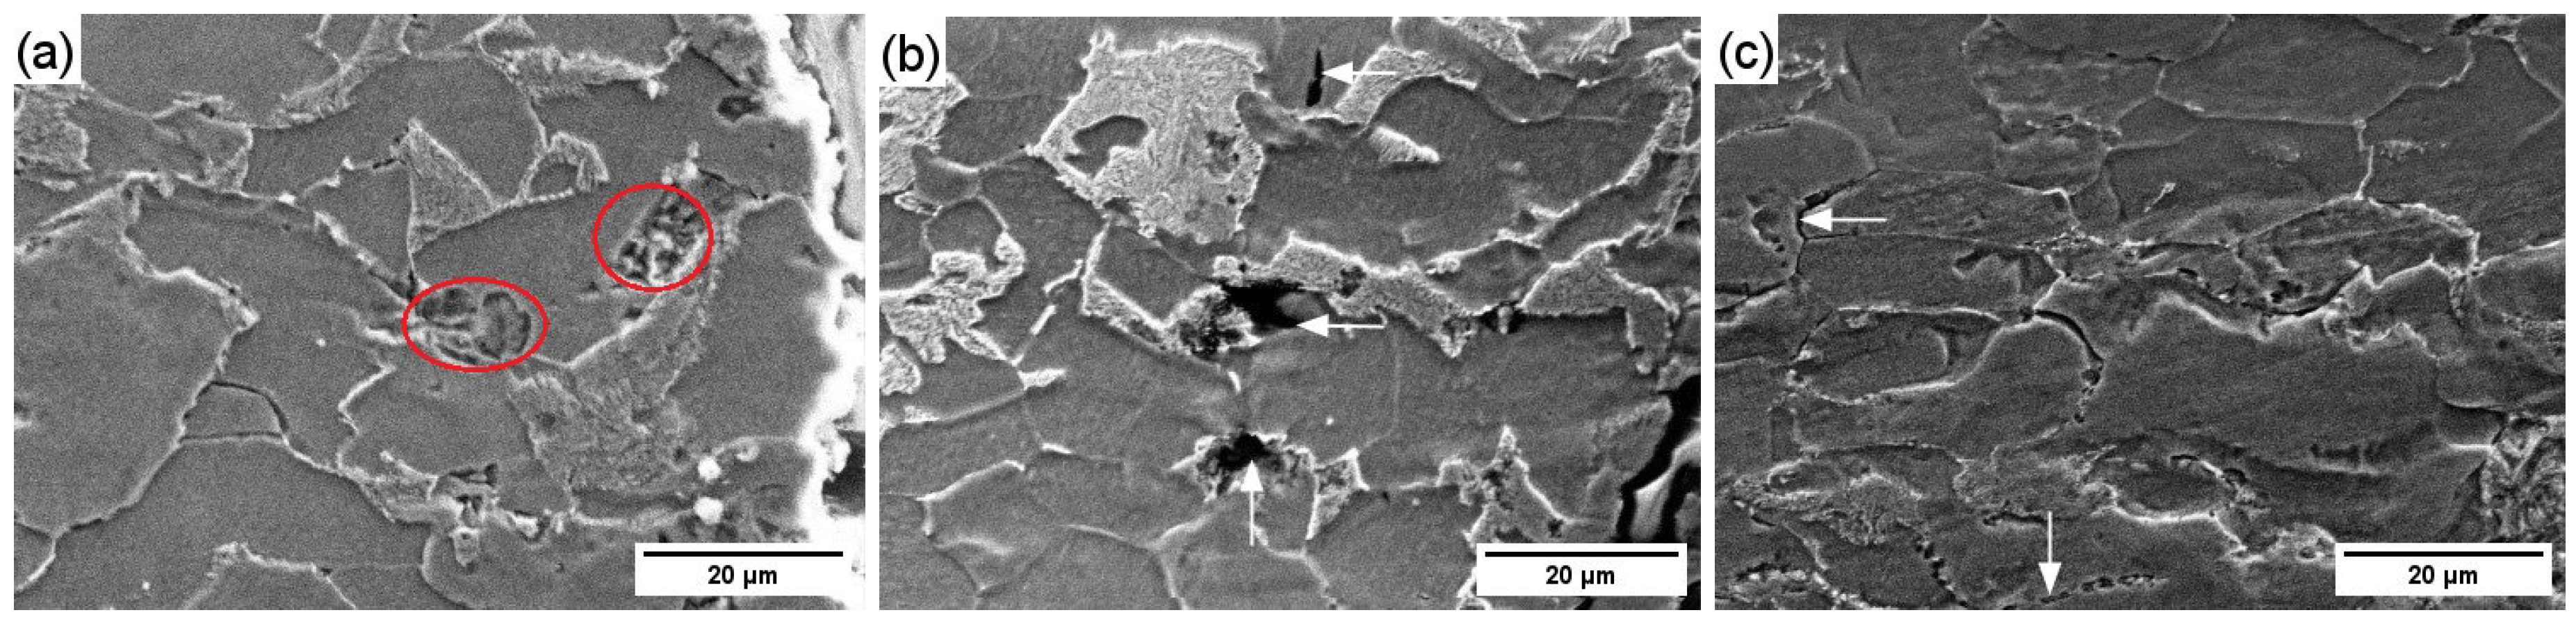
Figure 4a–c present the microstructure in the ABFS of an uncharged specimen containing a PW. Fracture during tensile testing also occurred within the HAZ.
Certain microstructural defects appear to be pre-existing, such as the depressions with smooth and rounded walls shown in Figure 4a. These defects are unlikely to have formed due to hydrogen or corrosion effects, particularly considering the relatively low initial hydrogen concentration (1.57 ppm; see Table 2 in Part I [5]).
Additional damage features include cracks within ferrite grains, as well as microvoids located both inside the ferritic phase and along ferrite–pearlite interfaces (Figure 4b). Smooth and continuous intergranular cracks suggest a decohesion mechanism, whereas cracks containing chains of pores are indicative of pore coalescence (Figure 4c).

3.1.3. Hydrogen-Charged Specimen Containing GW

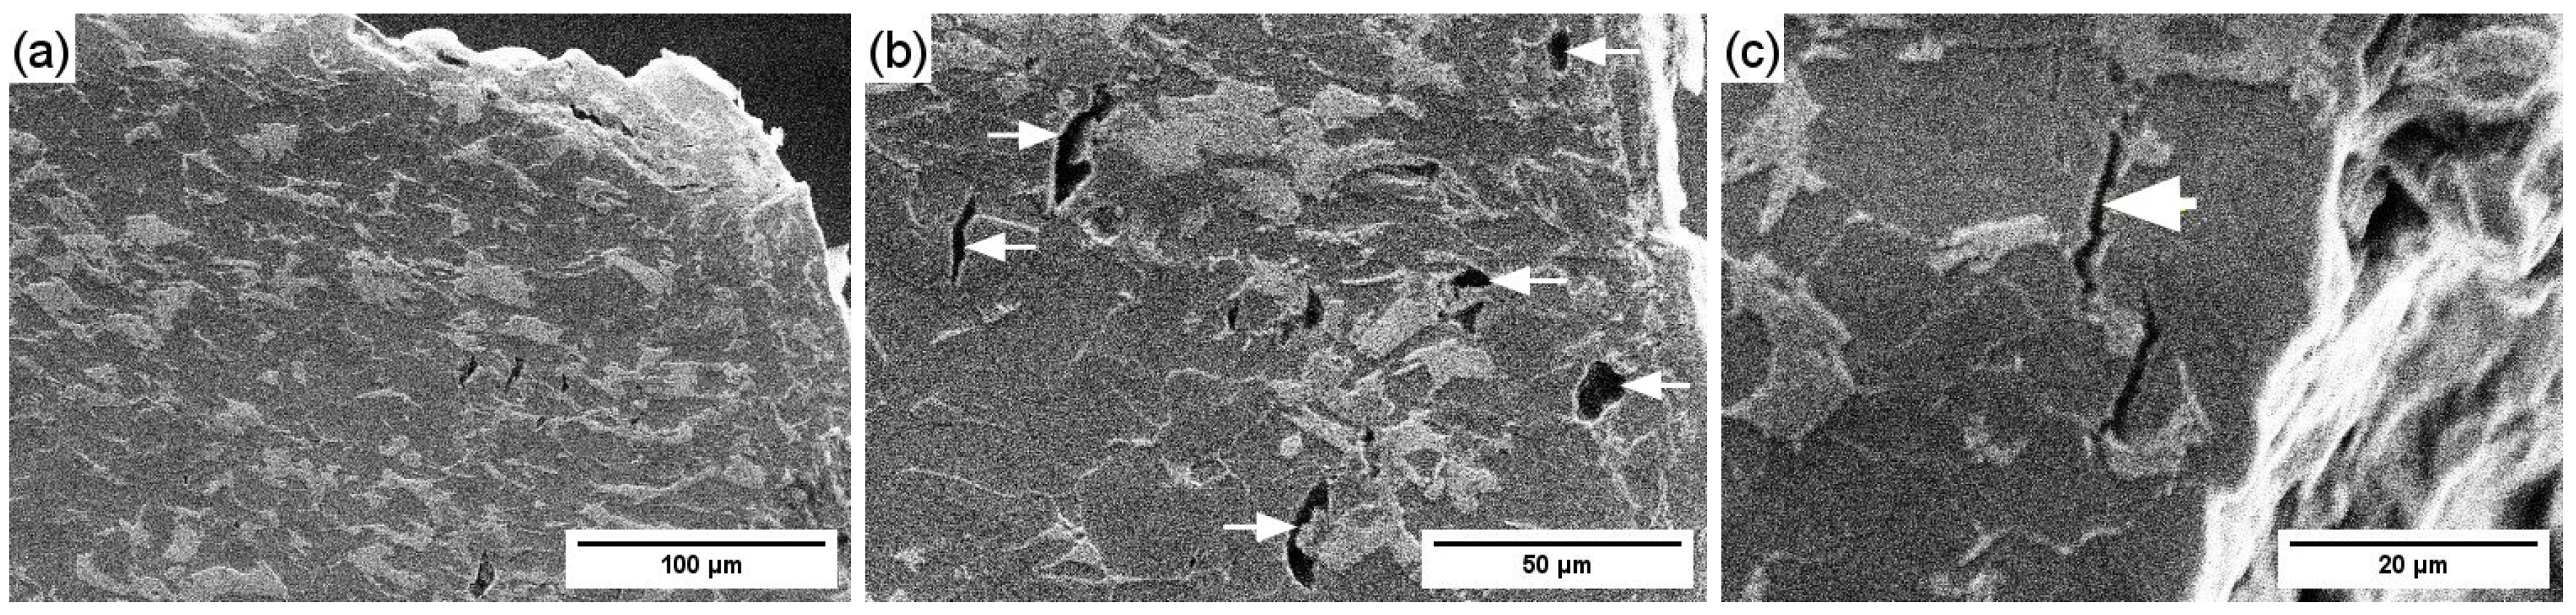
Figure 5a–c show the microstructure in the ABFS of a hydrogen-charged specimen containing a GW. The observed non-equiaxed grain morphology confirms that fracture occurred within the HAZ (Figure 5a,b). In Figure 5b, a transition in microstructural orientation from horizontal to vertical is visible, indicating proximity to the weld seam.
The ABFS is characterized by a dense population of closely spaced microvoids and cracks. Crack propagation occurs predominantly within the ferritic phase, but also inside pearlite colonies (Figure 5b), which may reflect hydrogen-assisted damage [21]. Since hydrogen-enhanced localized plasticity (HELP) operates preferentially within ferrite [22], where hydrogen increases dislocation mobility and lowers the activation barrier for slip, the observed secondary cracks are likely associated with HELP-controlled localized deformation.
Figure 5c shows a crack propagating along a ferrite grain boundary, indicating decohesion arising from the combined influence of hydrogen and, potentially, intergranular corrosion. Such features are absent in analogous mid-thickness specimens reported in Part I [5]. Hydrogen accumulation at ferrite–cementite interfaces, ferrite grain boundaries, and inclusion–matrix interfaces reduces local cohesive strength below a critical threshold, indicating the operation of the hydrogen-enhanced decohesion (HEDE) mechanism [23].

3.1.4. Hydrogen-Charged Specimen Containing PW

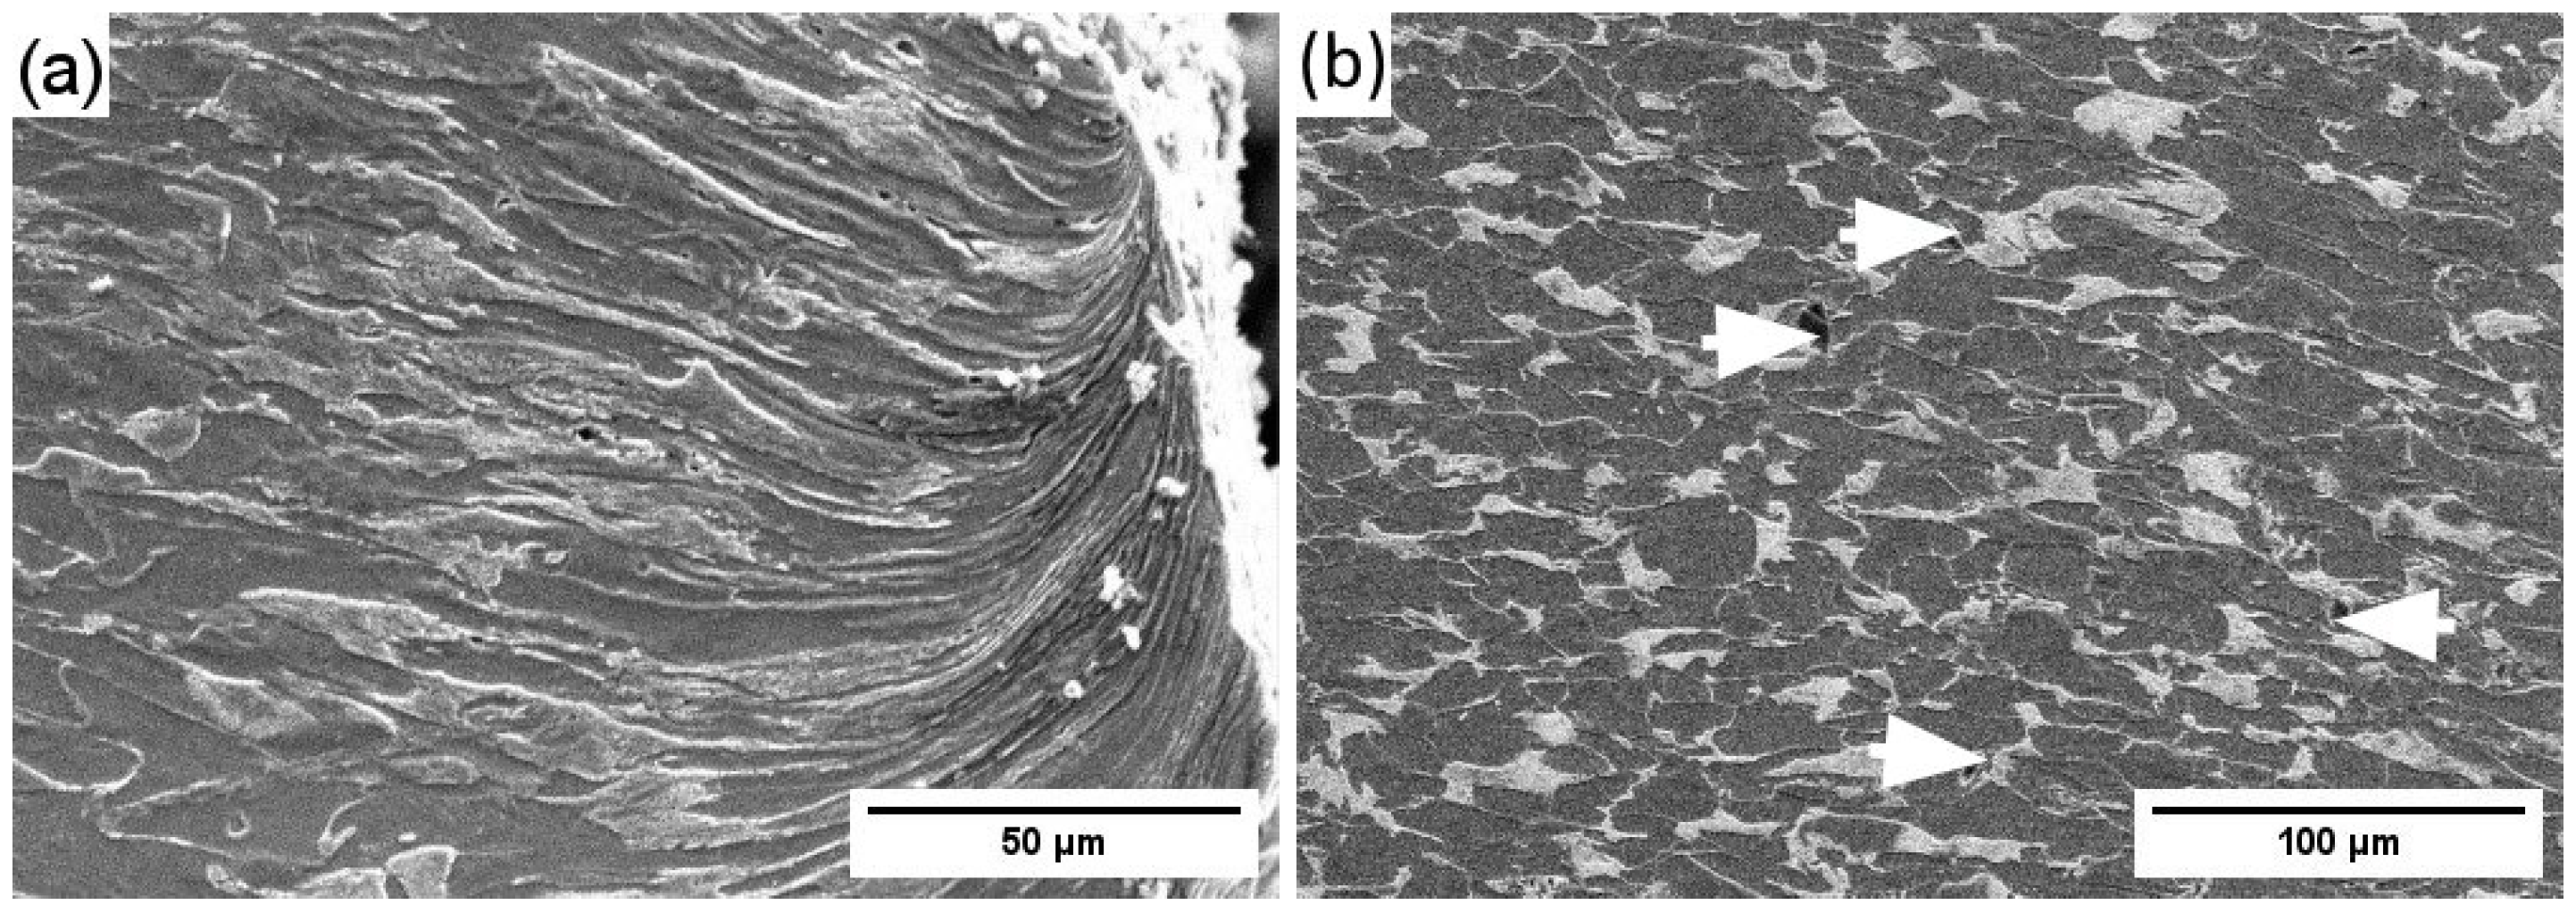
Figure 6a,b present the microstructure in the ABFS of a hydrogen-charged specimen containing a PW. Figure 6a reveals an elongated microstructure associated primarily with directional solidification during welding rather than with plastic deformation during tensile testing. This indicates that fracture occurred near the interface between the weld metal and the HAZ.
Figure 6b shows a comparatively low density of damage features, characterized by small and sparsely distributed microvoids. This behavior may also reflect the influence of corrosion processes affecting the surface layers of the pipe.

3.2. Fractographic Analysis

3.2.1. Fractographic Analysis of Tensile-Tested Specimens Before Hydrogen Charging

Fracture in all uncharged specimens (PW-1, PW-2, GW-1, and GW-2) proceeded predominantly through a ductile mechanism. Well-defined necking is observed in all specimen types, confirming substantial plastic deformation prior to failure.
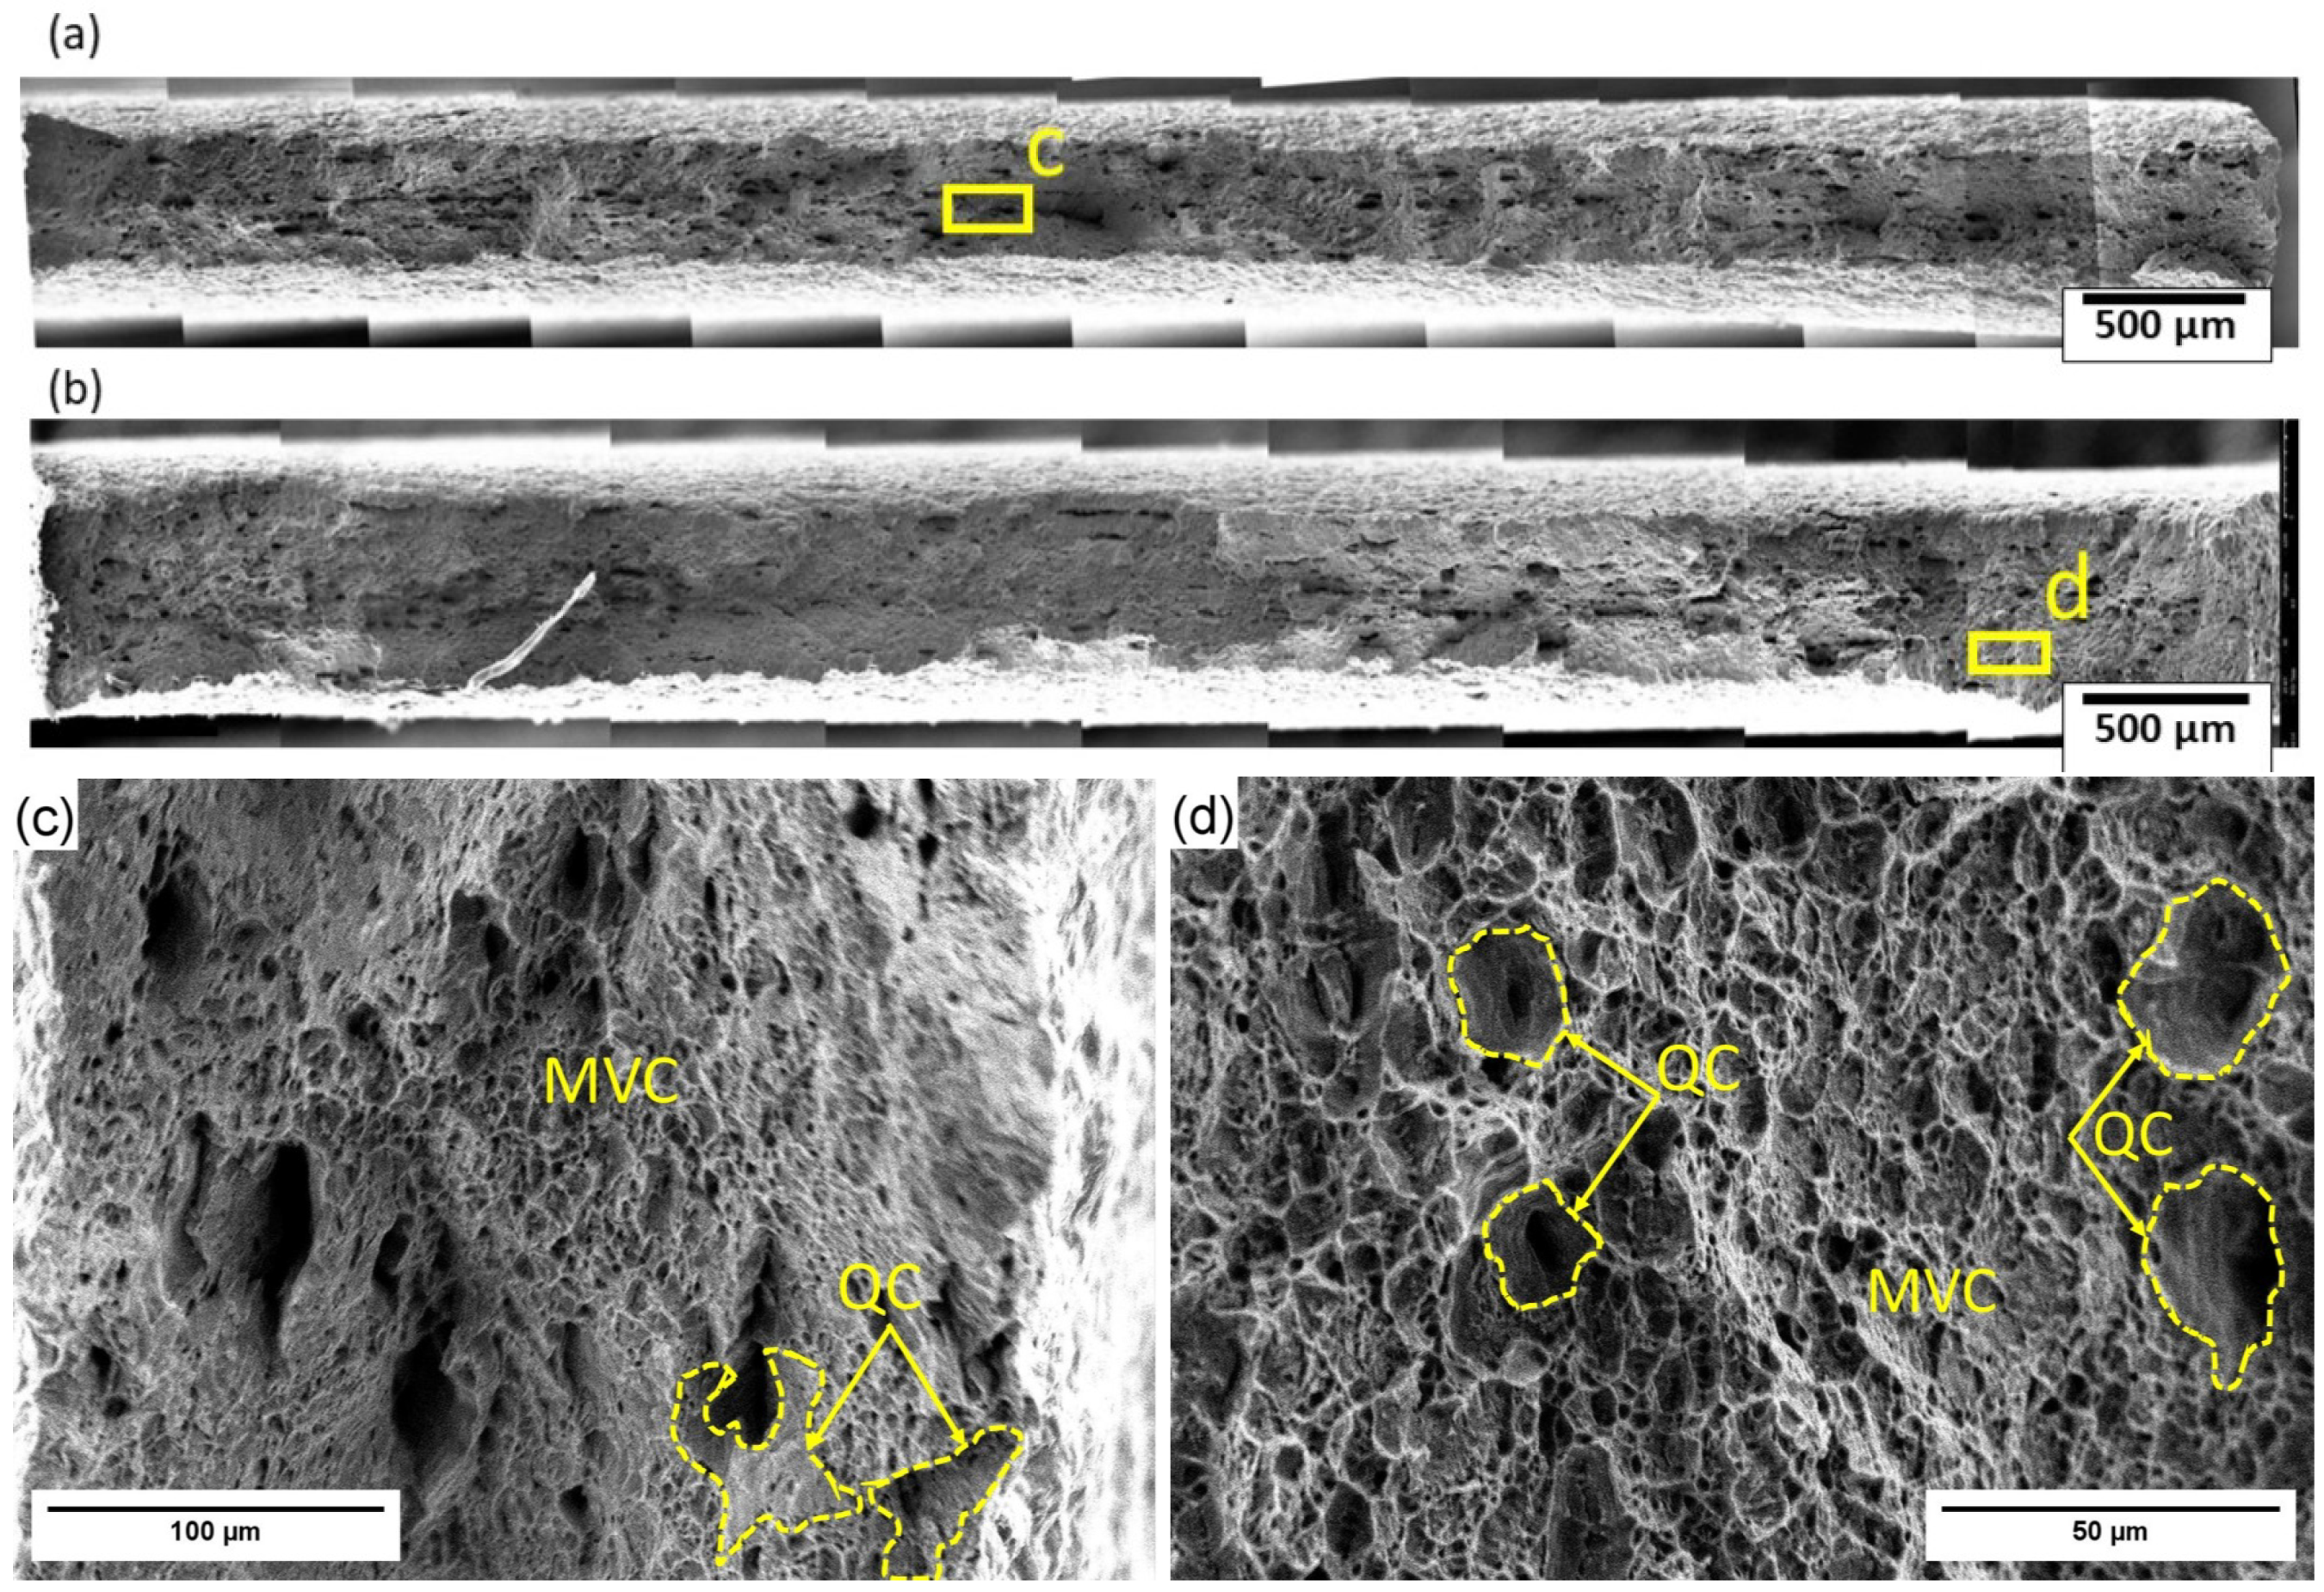
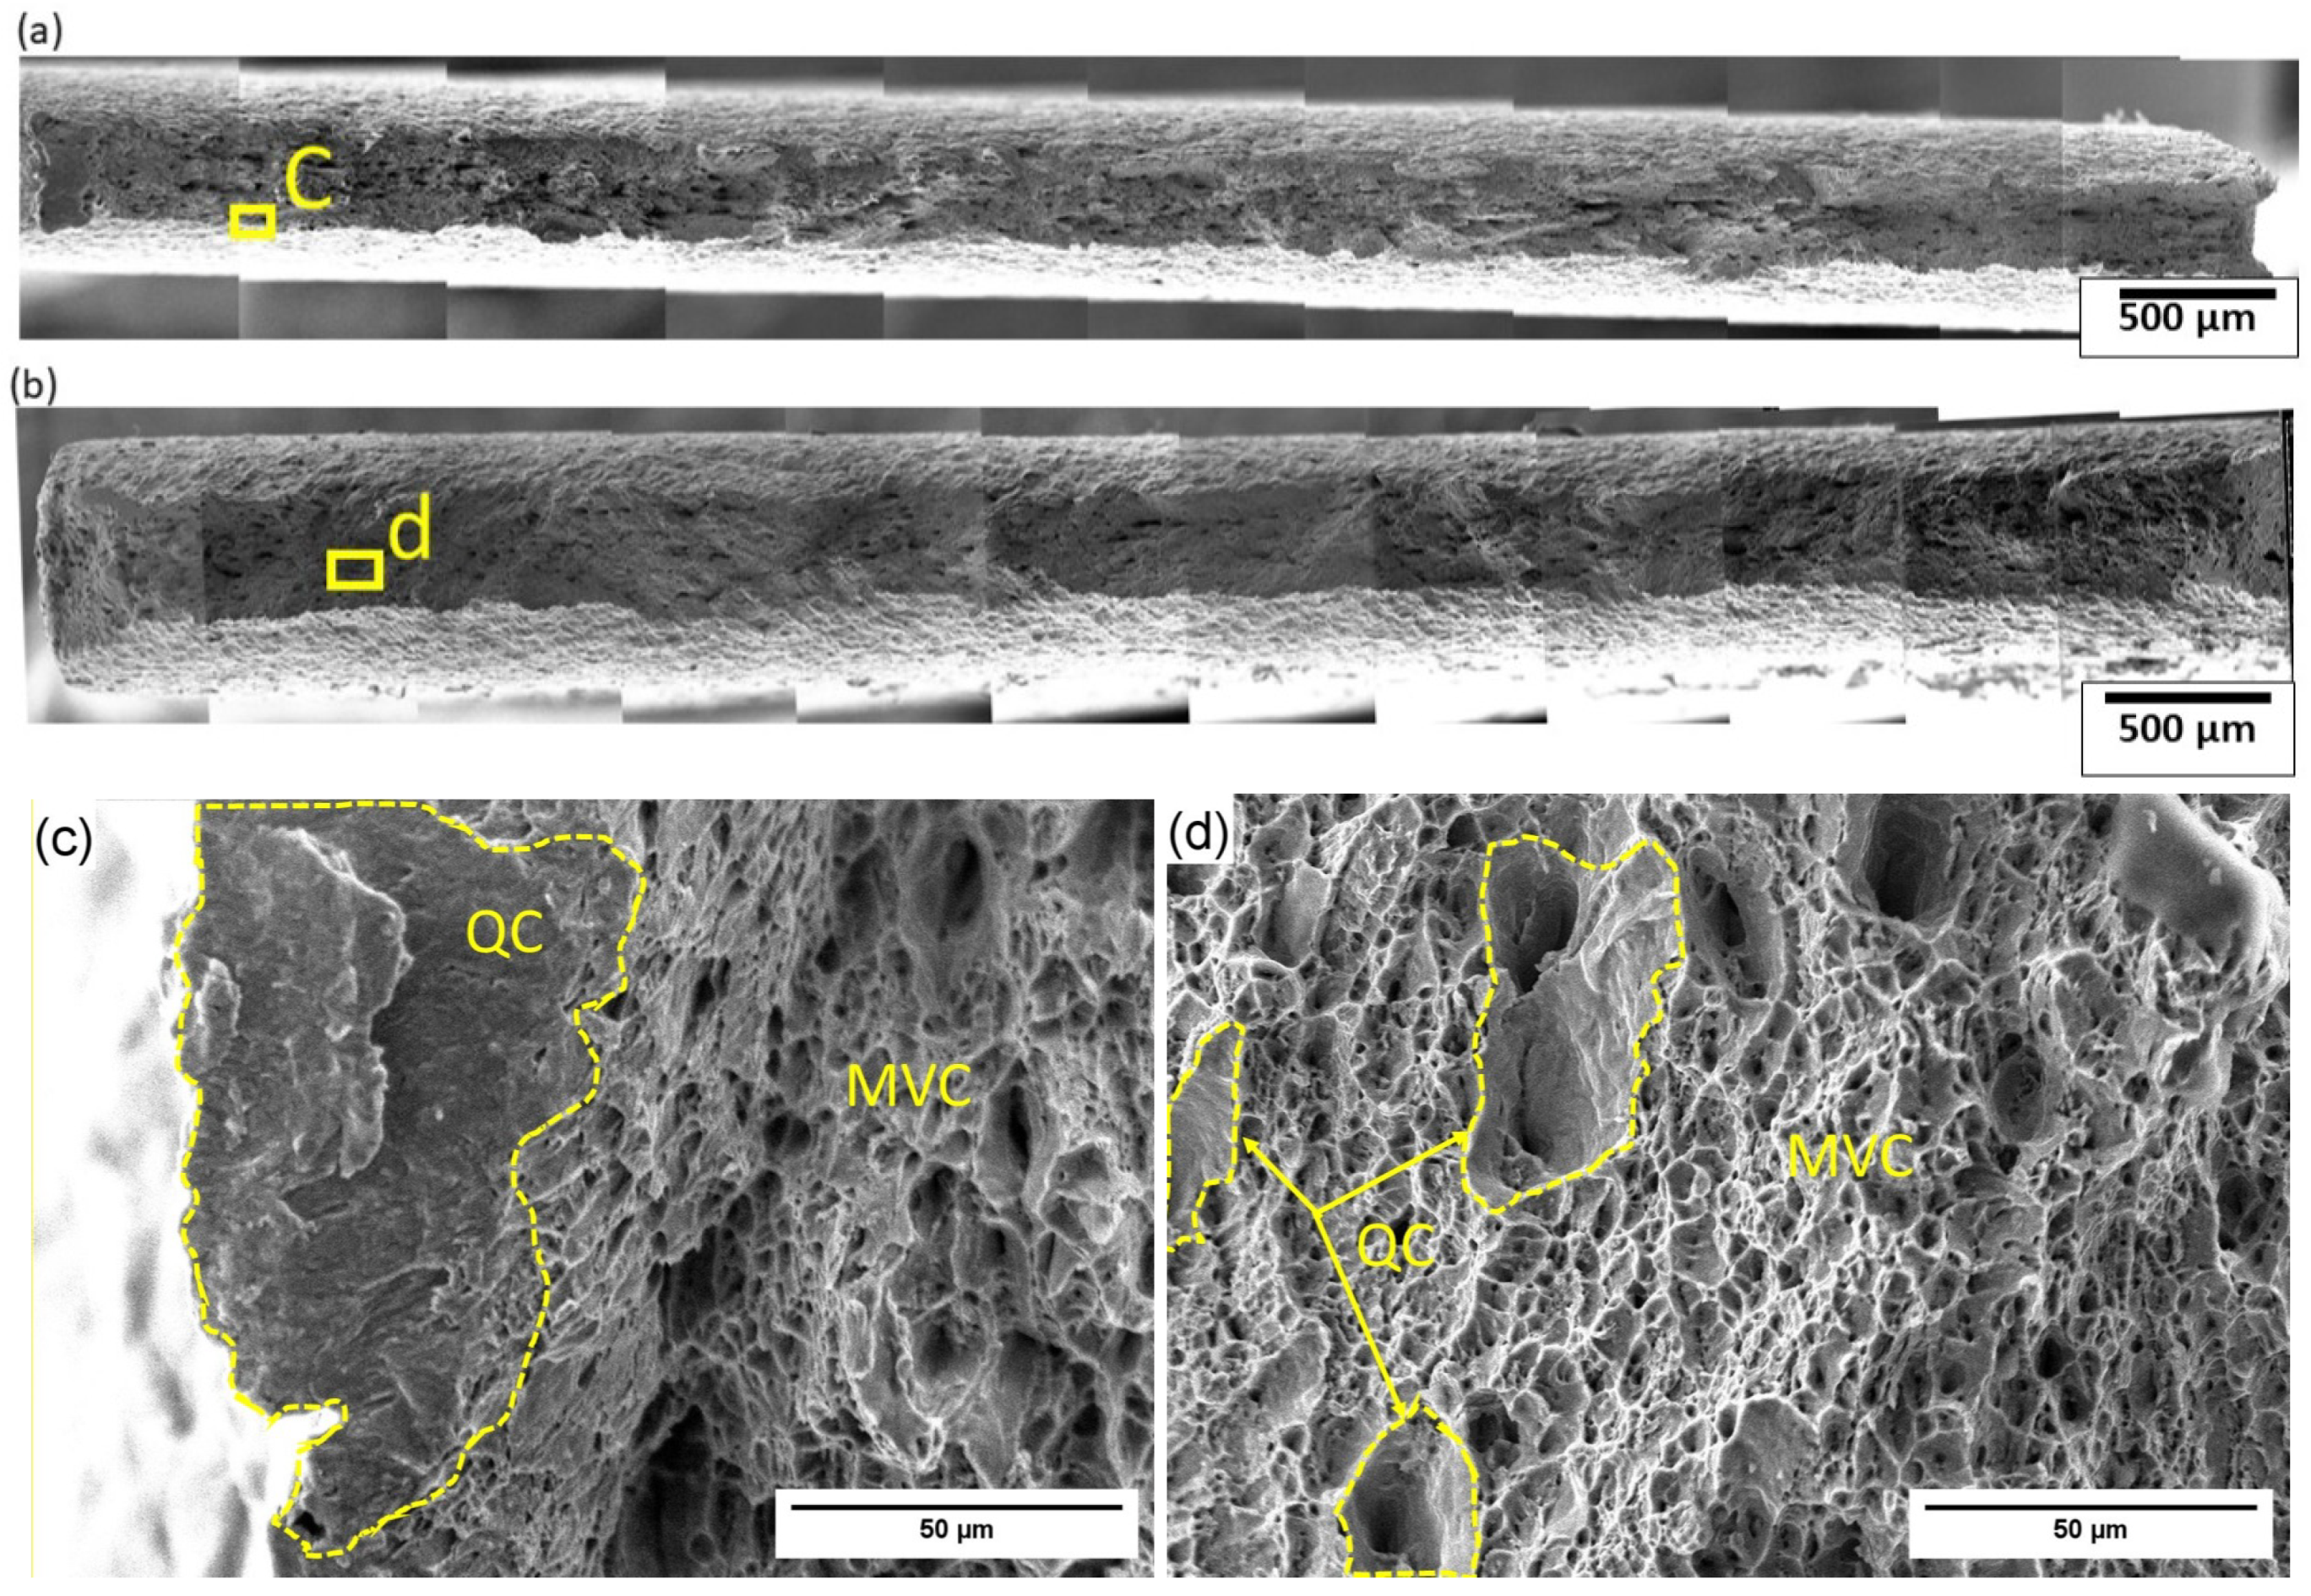
Following tensile testing, fracture of PW-1 and PW-2 occurred in the BM immediately adjacent to the HAZ (Figure 7a,b). Fracture is predominantly ductile, with isolated BFZs. Ductile fracture proceeds through microvoid coalescence (MVC) (Figure 7c,d).
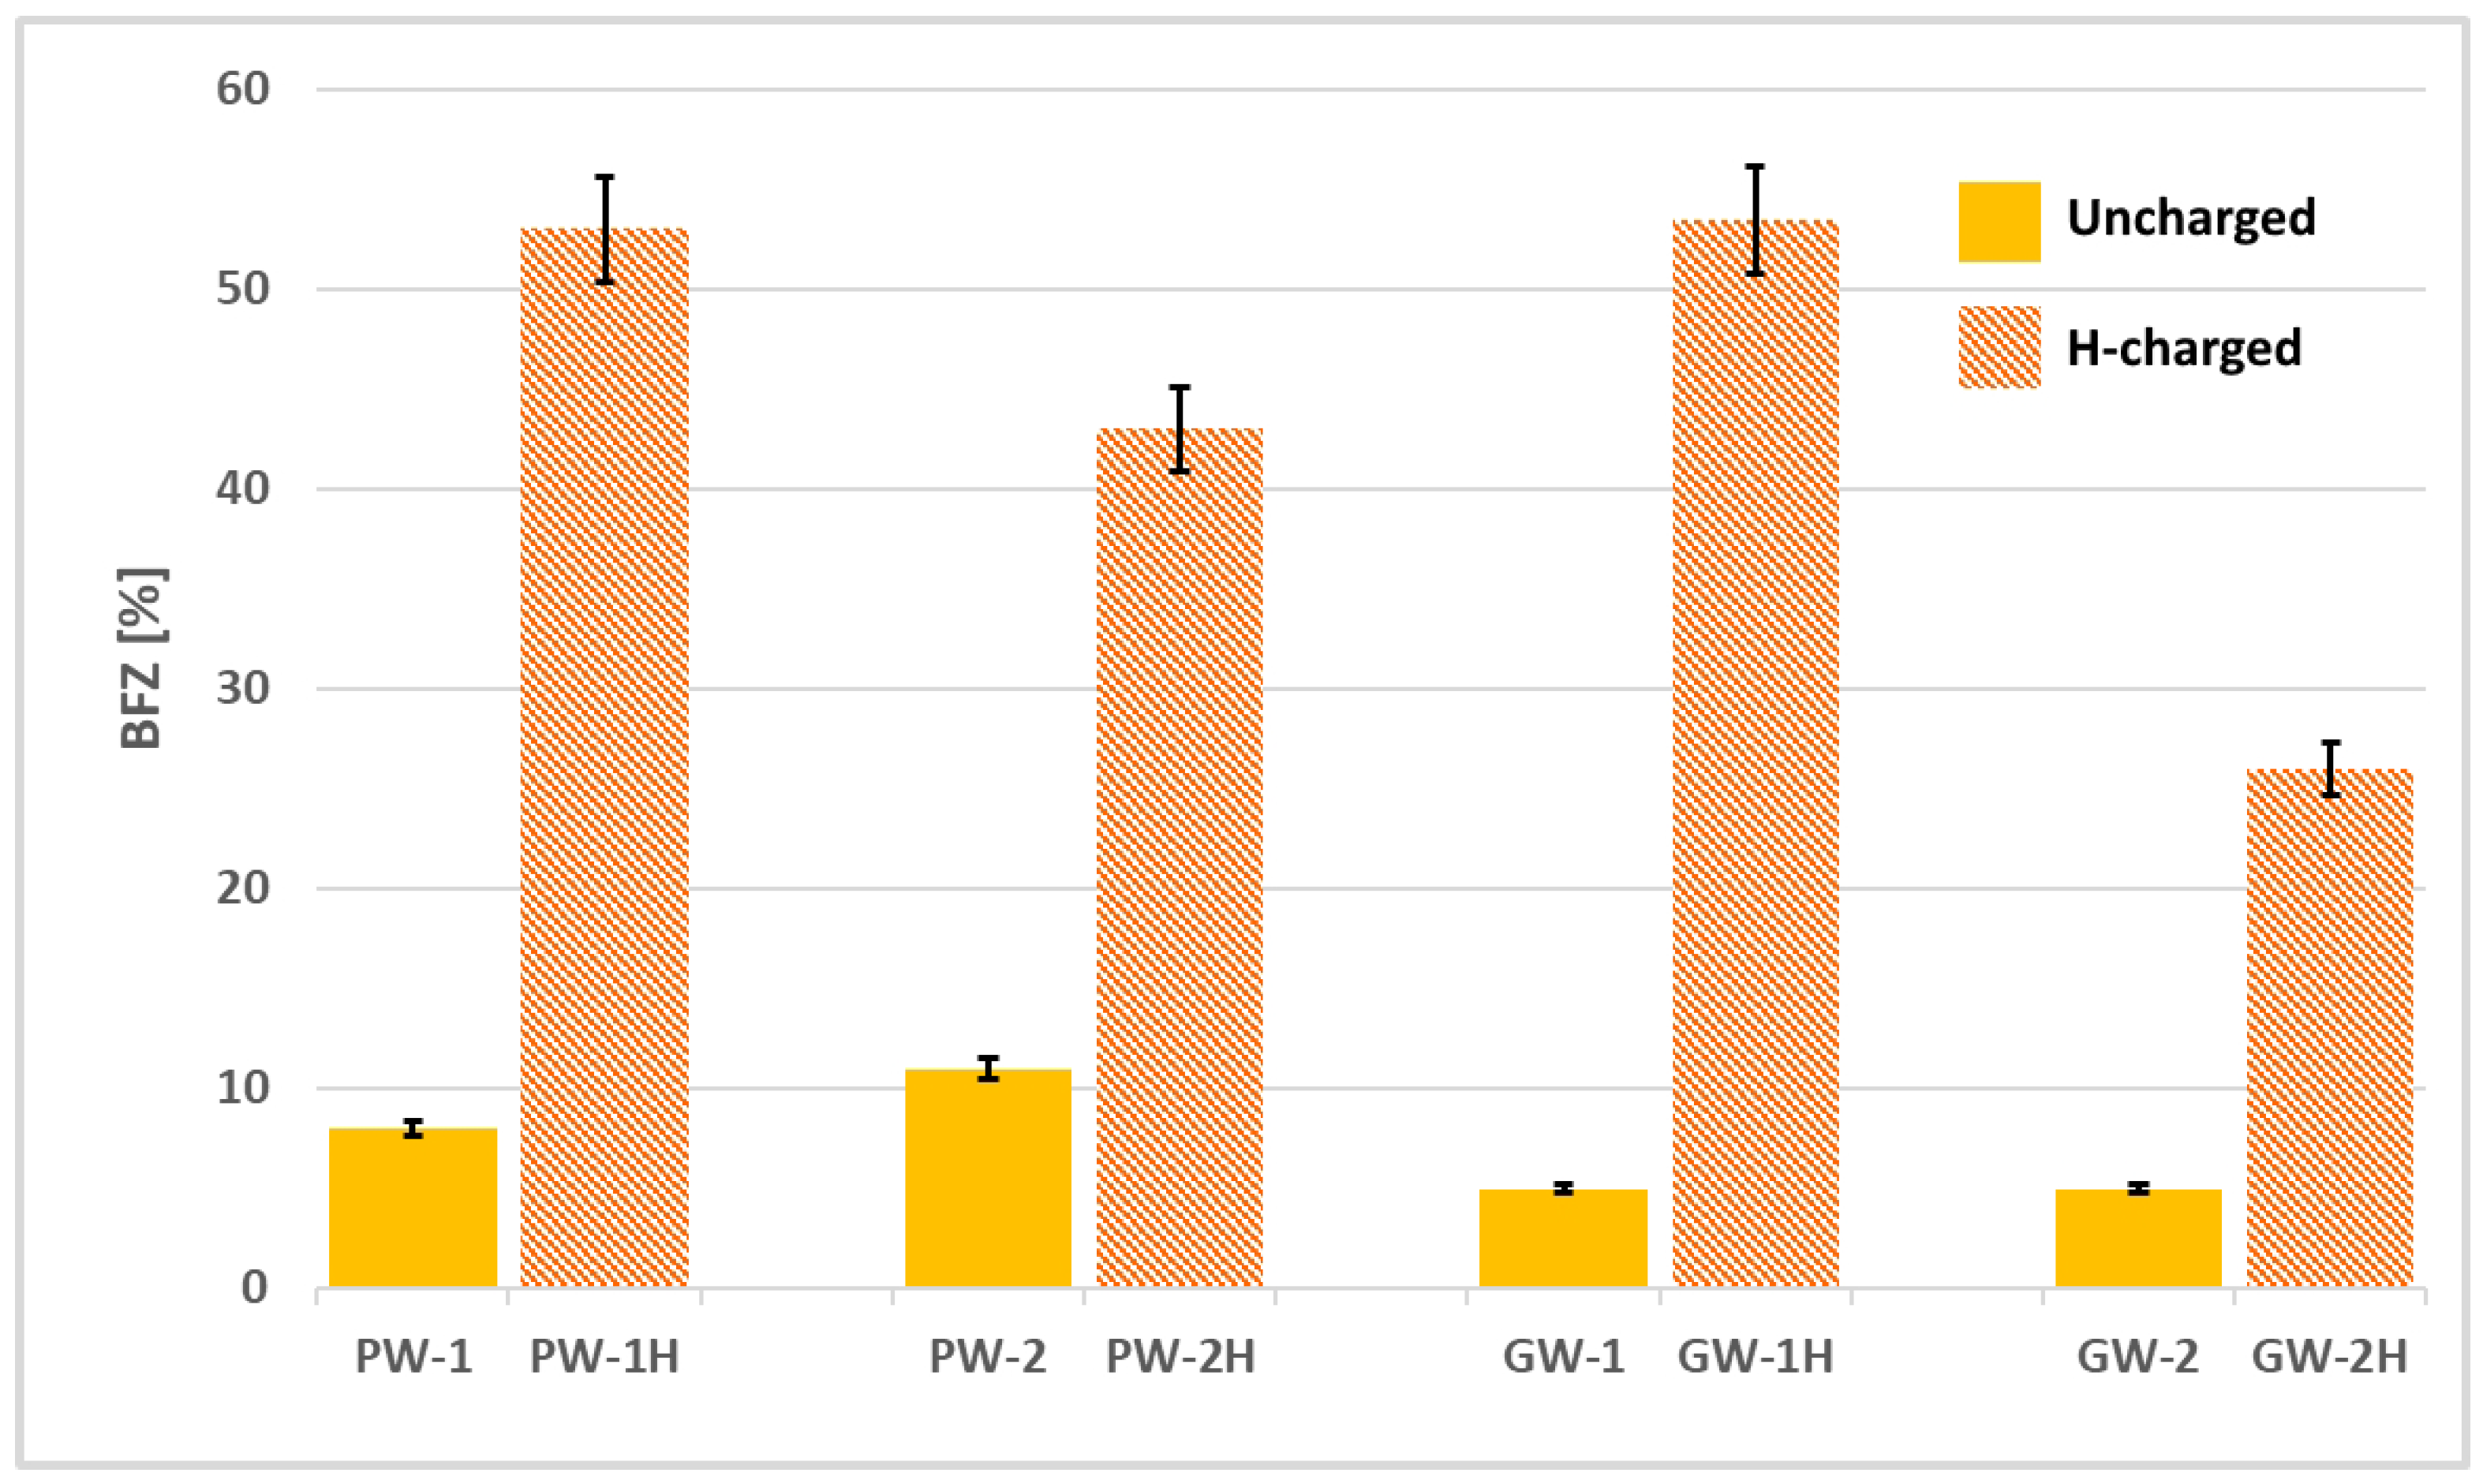
Two types of dimples are observed in the ductile regions: (i) small and shallow dimples up to 5–10 μm in size and (ii) larger dimples exceeding 15–20 μm in diameter, with smooth walls characteristic of quasi-cleavage (QC) fracture (Figure 7d). The BFZ fraction is approximately 8% in PW-1 and 11% in PW-2.
Fracture of GW-1 and GW-2 occurred within the HAZ (Figure 8a,b). Cracks are visible on the smooth walls of larger voids (Figure 8d). The BFZ fraction in both GW specimens is approximately 5%, with negligible variation across the pipe wall thickness.
The presence of isolated BFZs in all uncharged specimens is attributed to a combination of manufacturing-related microstructural heterogeneity, long-term service degradation, and possible corrosion-related effects at the pipe–soil interface, particularly in outer-wall specimens.

3.2.2. Fractographic Analysis of Tensile-Tested Specimens After Hydrogen Charging

Electrochemical hydrogen charging substantially increases the brittleness of all specimens. The disappearance of macroscopic necking, present in all uncharged specimens, provides immediate evidence of hydrogen-assisted embrittlement.
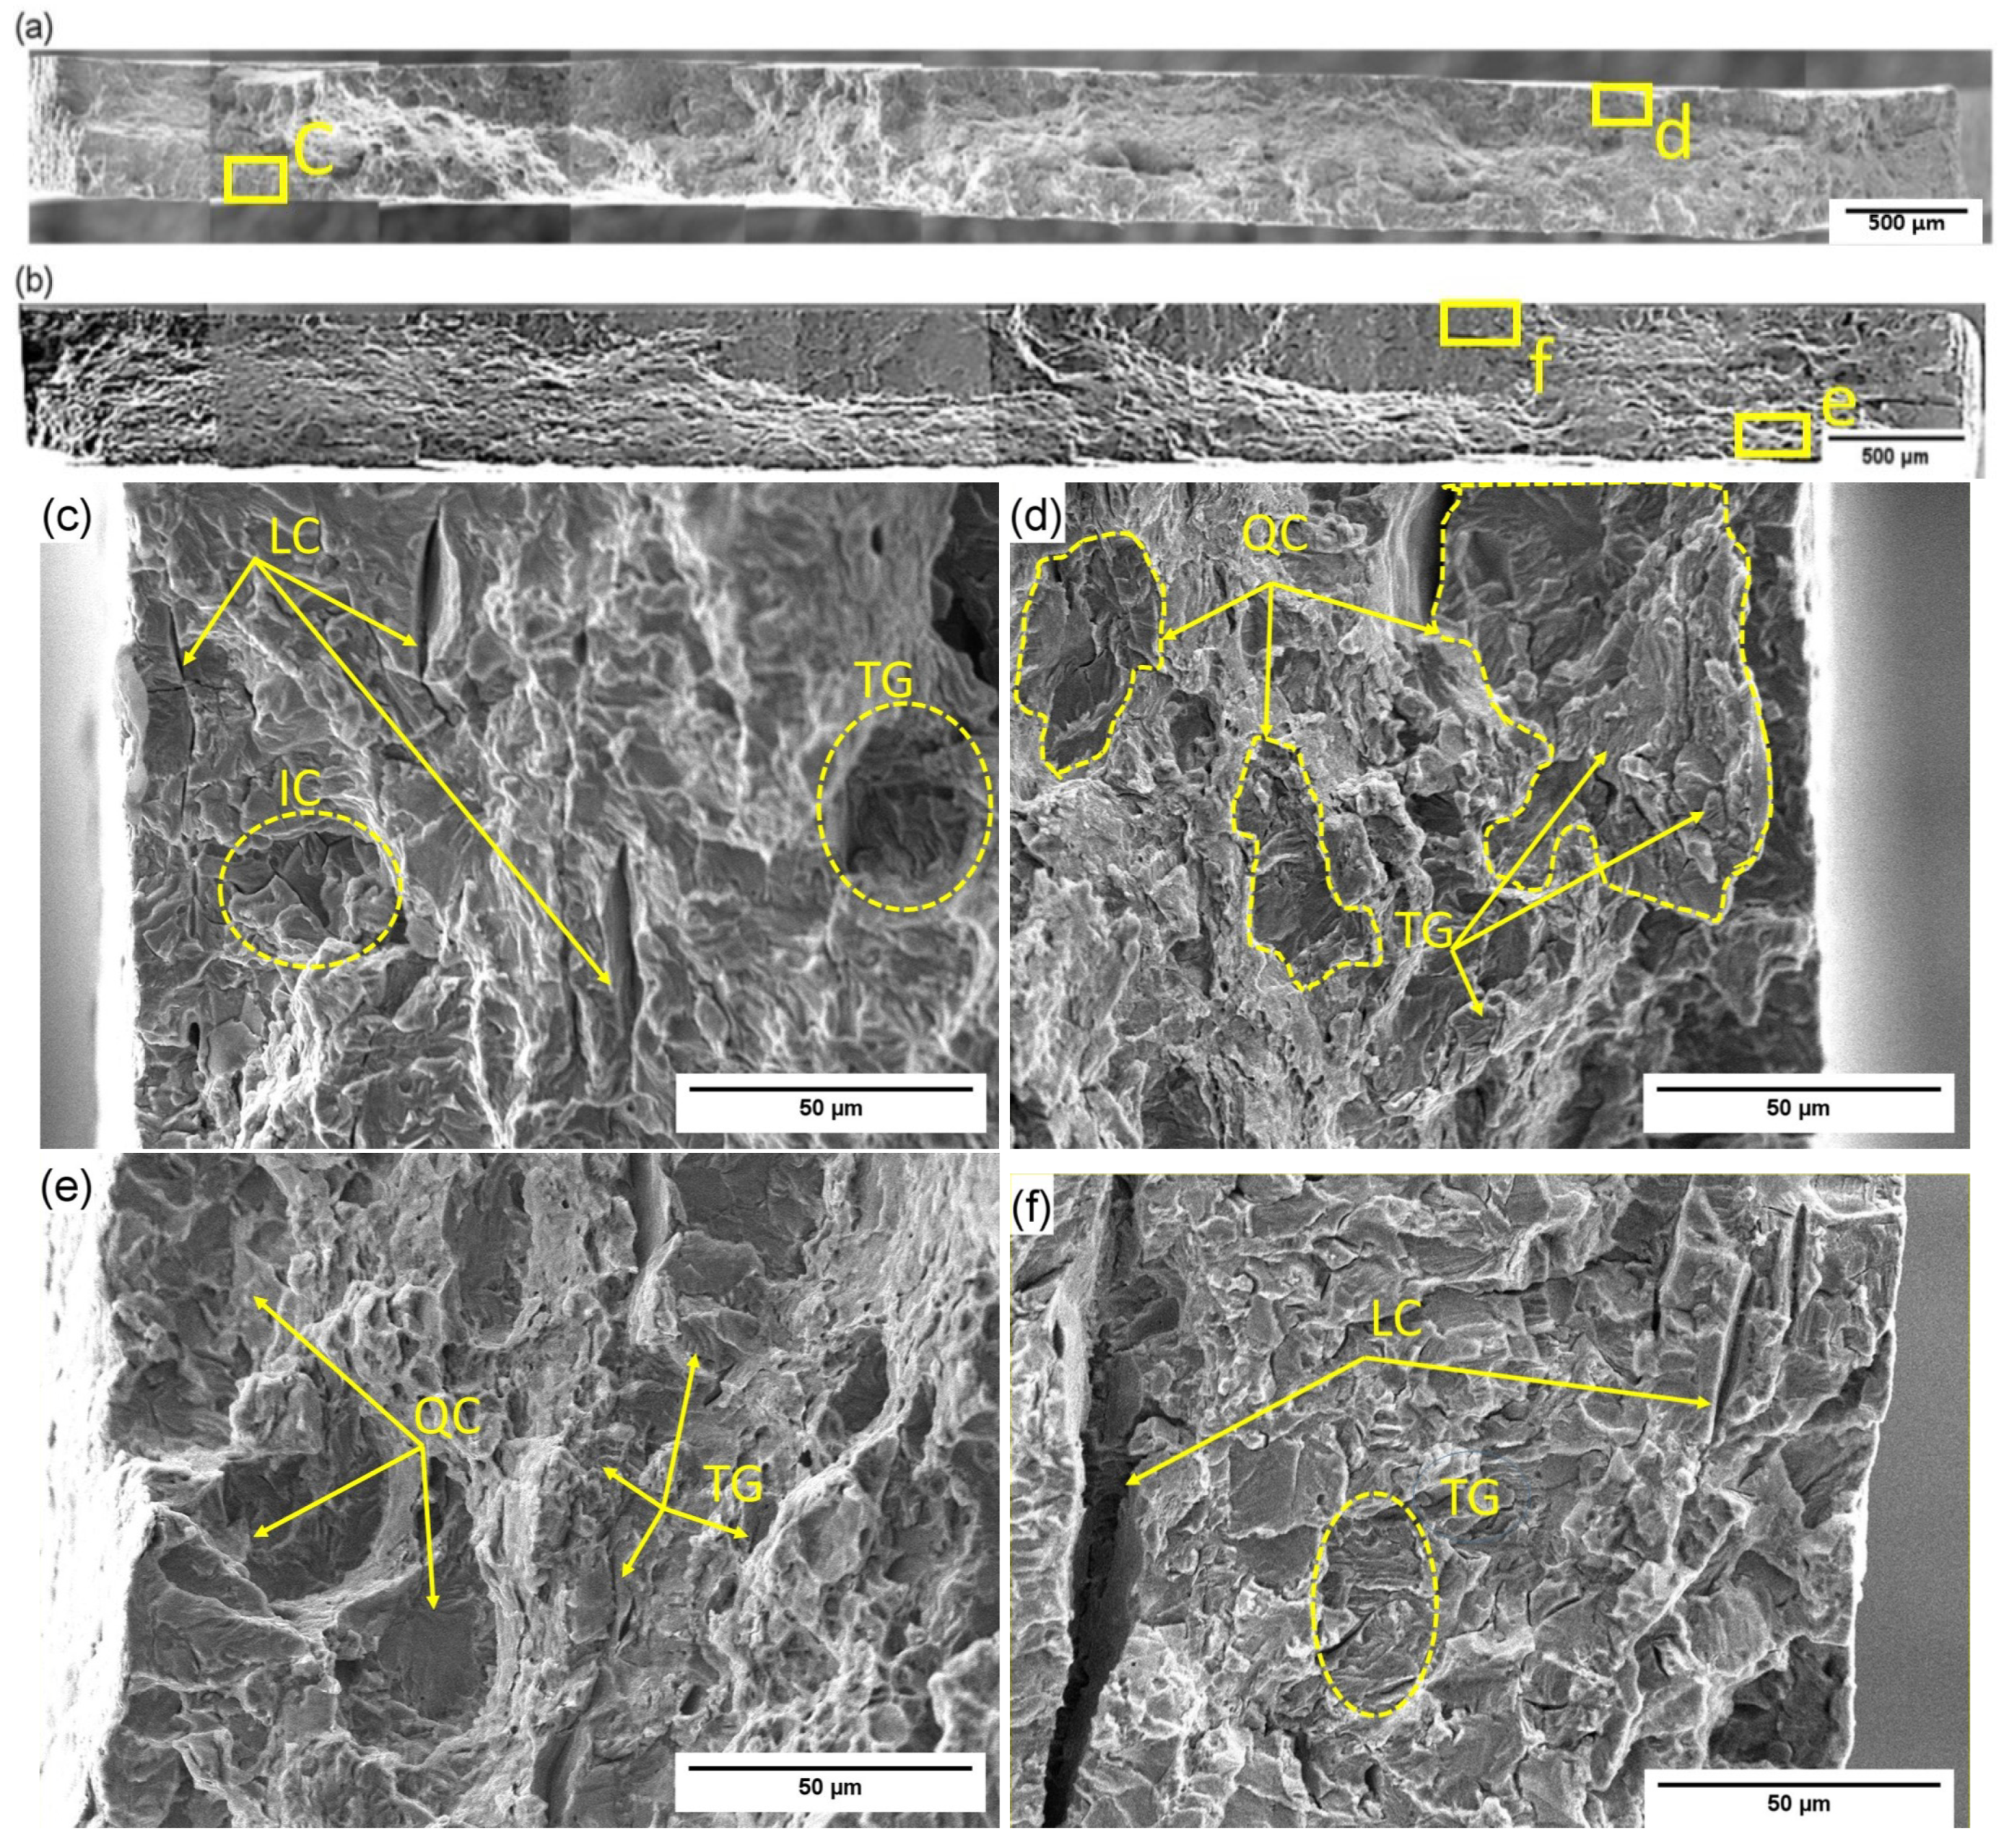
Fracture of the hydrogen-charged PW specimens occurred in the BM adjacent to the HAZ (Figure 9a,b). The BFZ fraction in PW-1H increased more than sixfold relative to PW-1, reaching approximately 53%, whereas PW-2H exhibited a fourfold increase, reaching approximately 43%.
The fracture mechanism is consistent with and extends observations reported previously [5,24]. Fracture initiates through the formation of intergranular (IC) and transgranular (TG) cracks (Figure 9c,d), which subsequently coalesce into longitudinal cracks (LCs) up to 20 μm wide and oriented close to the rolling direction (RD).
Transgranular cracks propagating along ferrite–cementite interfaces within pearlite colonies are clearly visible (Figure 9d), confirming that ferrite–cementite interfaces and pearlite–ferrite boundaries are preferential sites for hydrogen trapping and crack initiation [24]. Near the specimen edges, well-defined cleavage and QC facets are observed (Figure 9e,f), indicating HEDE-controlled fracture under conditions where hydrogen reduces local cohesive strength below the critical threshold [23,25].
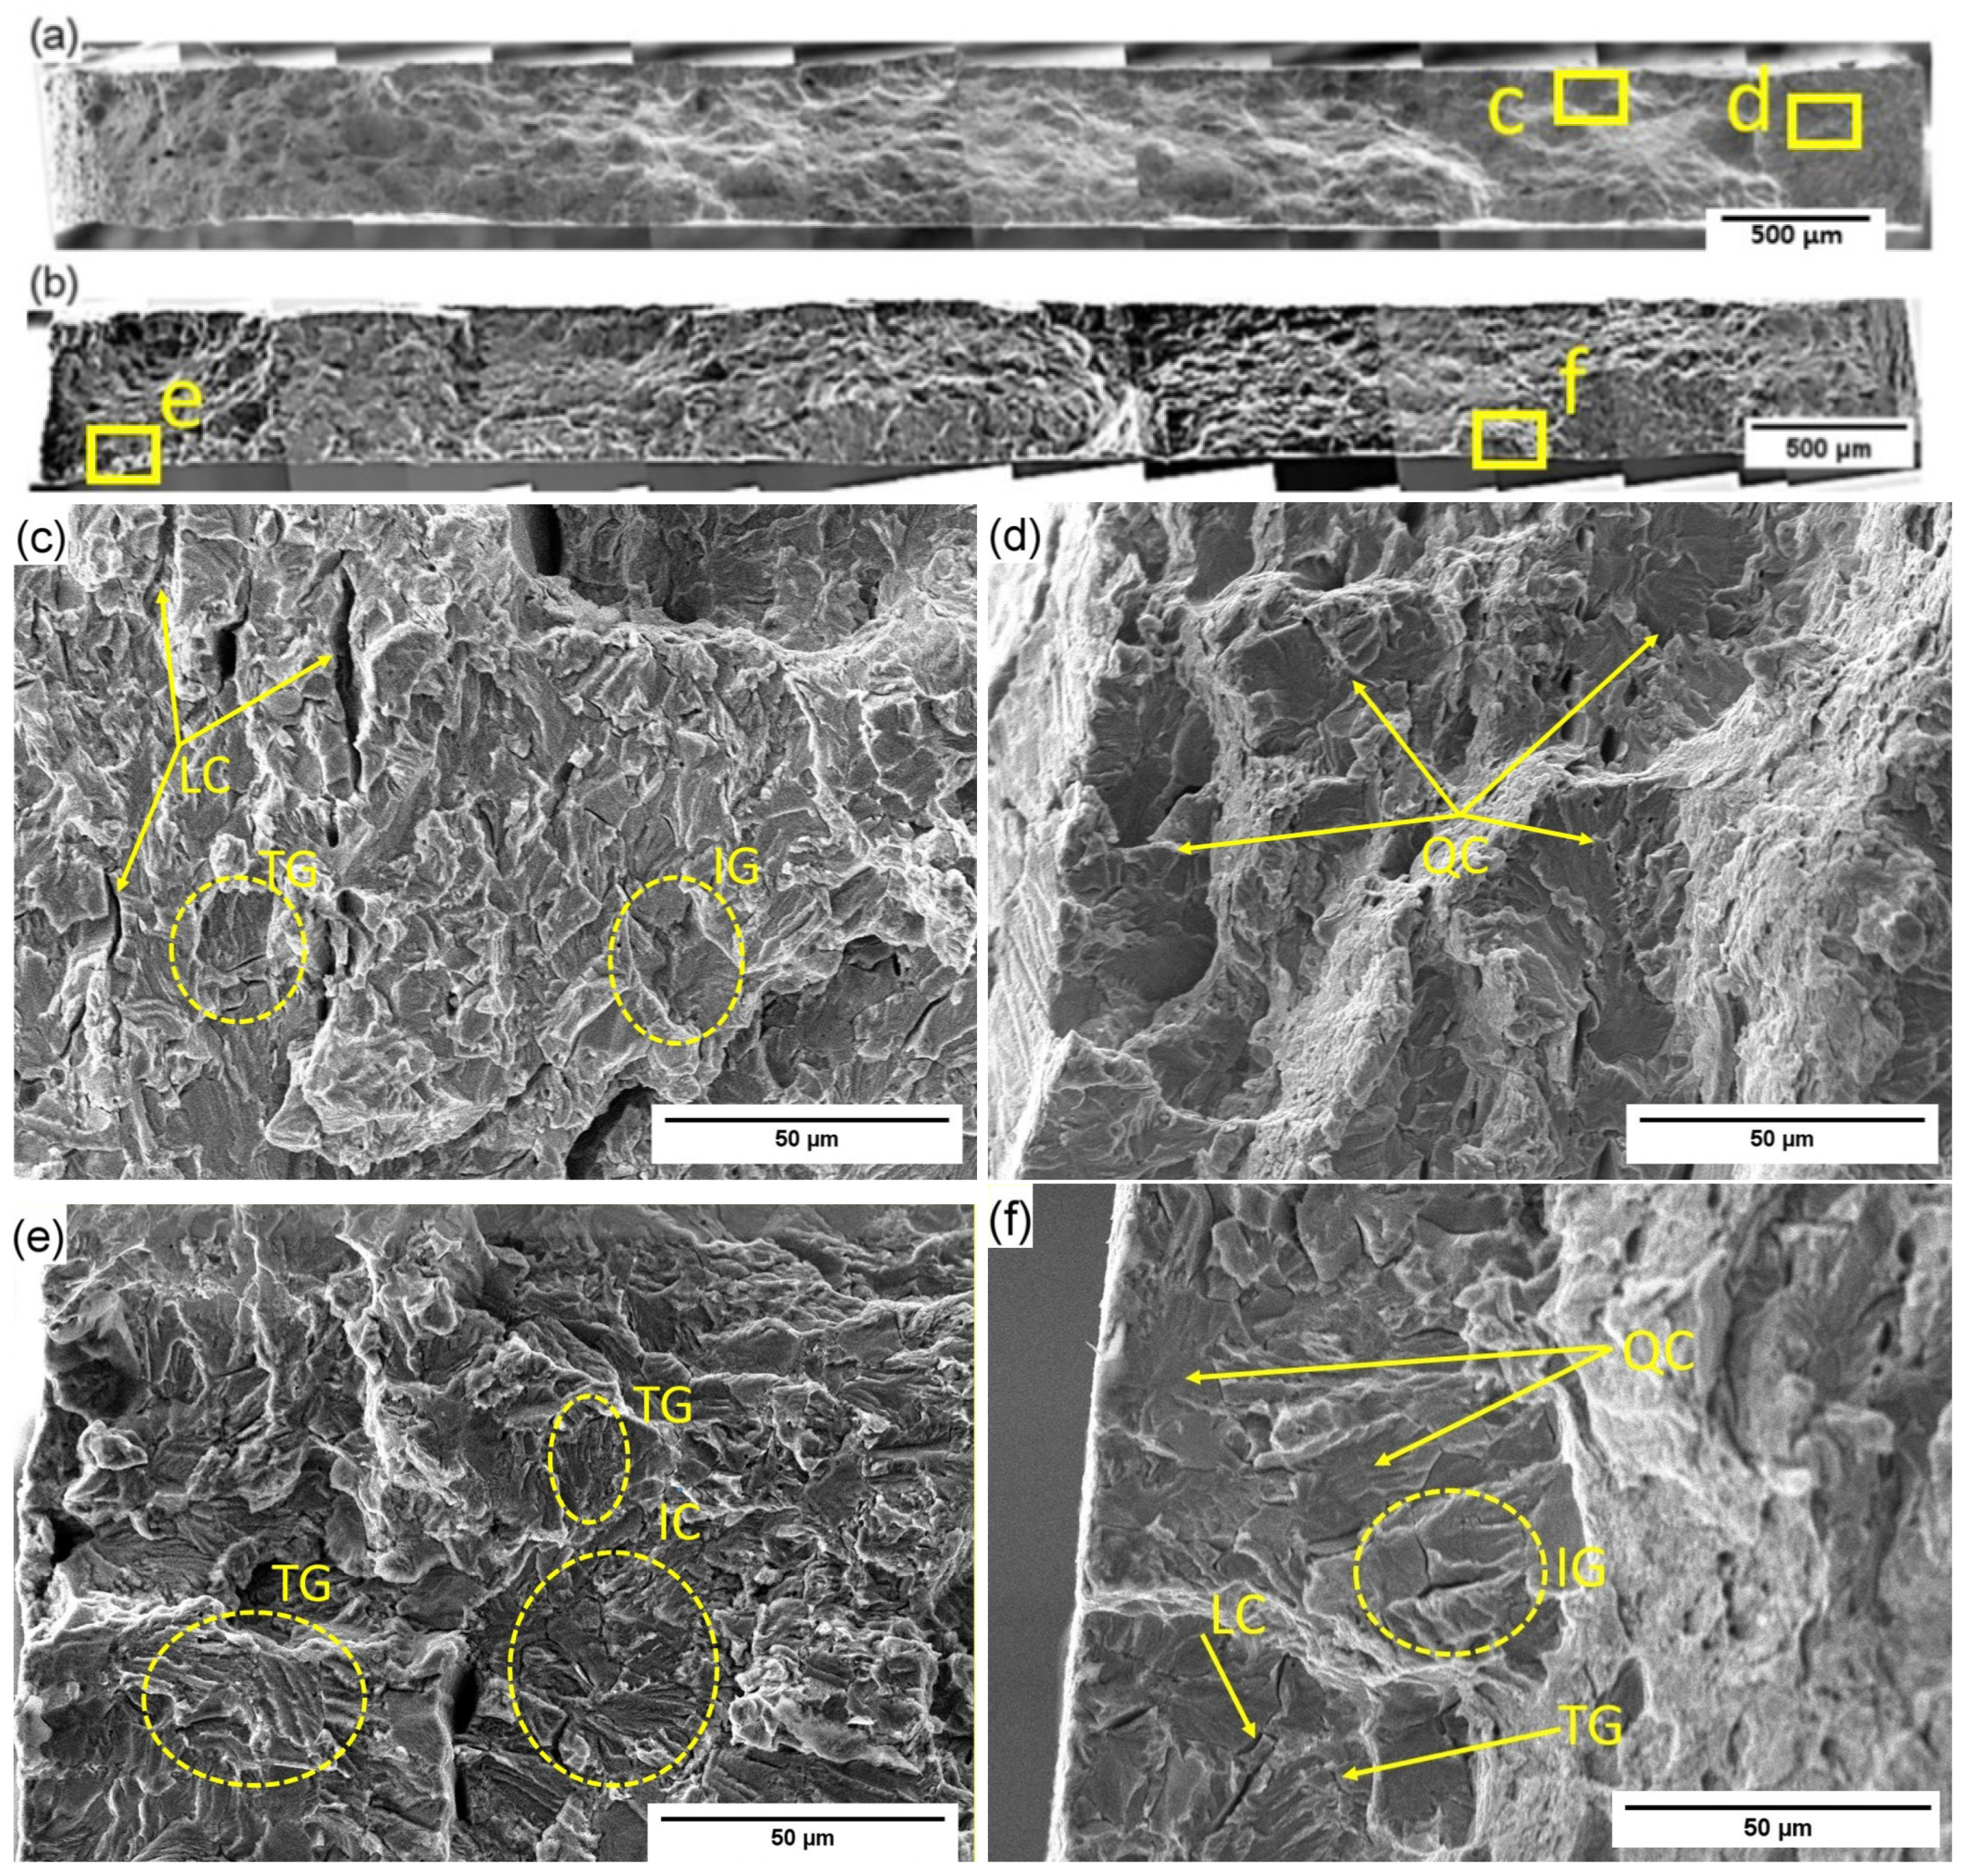
Failure in GW-1H occurred at the interface between the BM and the HAZ, with a BFZ fraction of approximately 53%, representing more than a tenfold increase relative to GW-1. Fracture in GW-2H occurred entirely within the HAZ, with a BFZ fraction of approximately 26%, corresponding to an approximately fivefold increase relative to GW-2.
Both hydrogen-charged GW specimens exhibit IC and TG cracking, together with features corresponding to crack propagation perpendicular to the observation plane (Figure 10c,d). The fracture behavior reflects the heterogeneous HAZ microstructure, which contains ferrite, bainitic constituents, and lamellar pearlite. The high density of interfaces in pearlite and bainite promotes hydrogen trapping and localization, thereby reducing fracture resistance. These observations are consistent with previous findings reporting crack propagation both parallel and perpendicular to cementite lamellae under hydrogen charging [26].
The BFZ fractions measured before and after hydrogen charging are summarized in Figure 11. The results clearly demonstrate a systematic increase in brittle fracture after hydrogen charging, together with a pronounced gradient between outer-wall (position 1) and inner-wall (position 2) specimens.

3.3. Hydrogen Embrittlement Susceptibility Index

The hydrogen embrittlement susceptibility (HES) index was calculated using:
HES = 1 f H f × 100 % ,
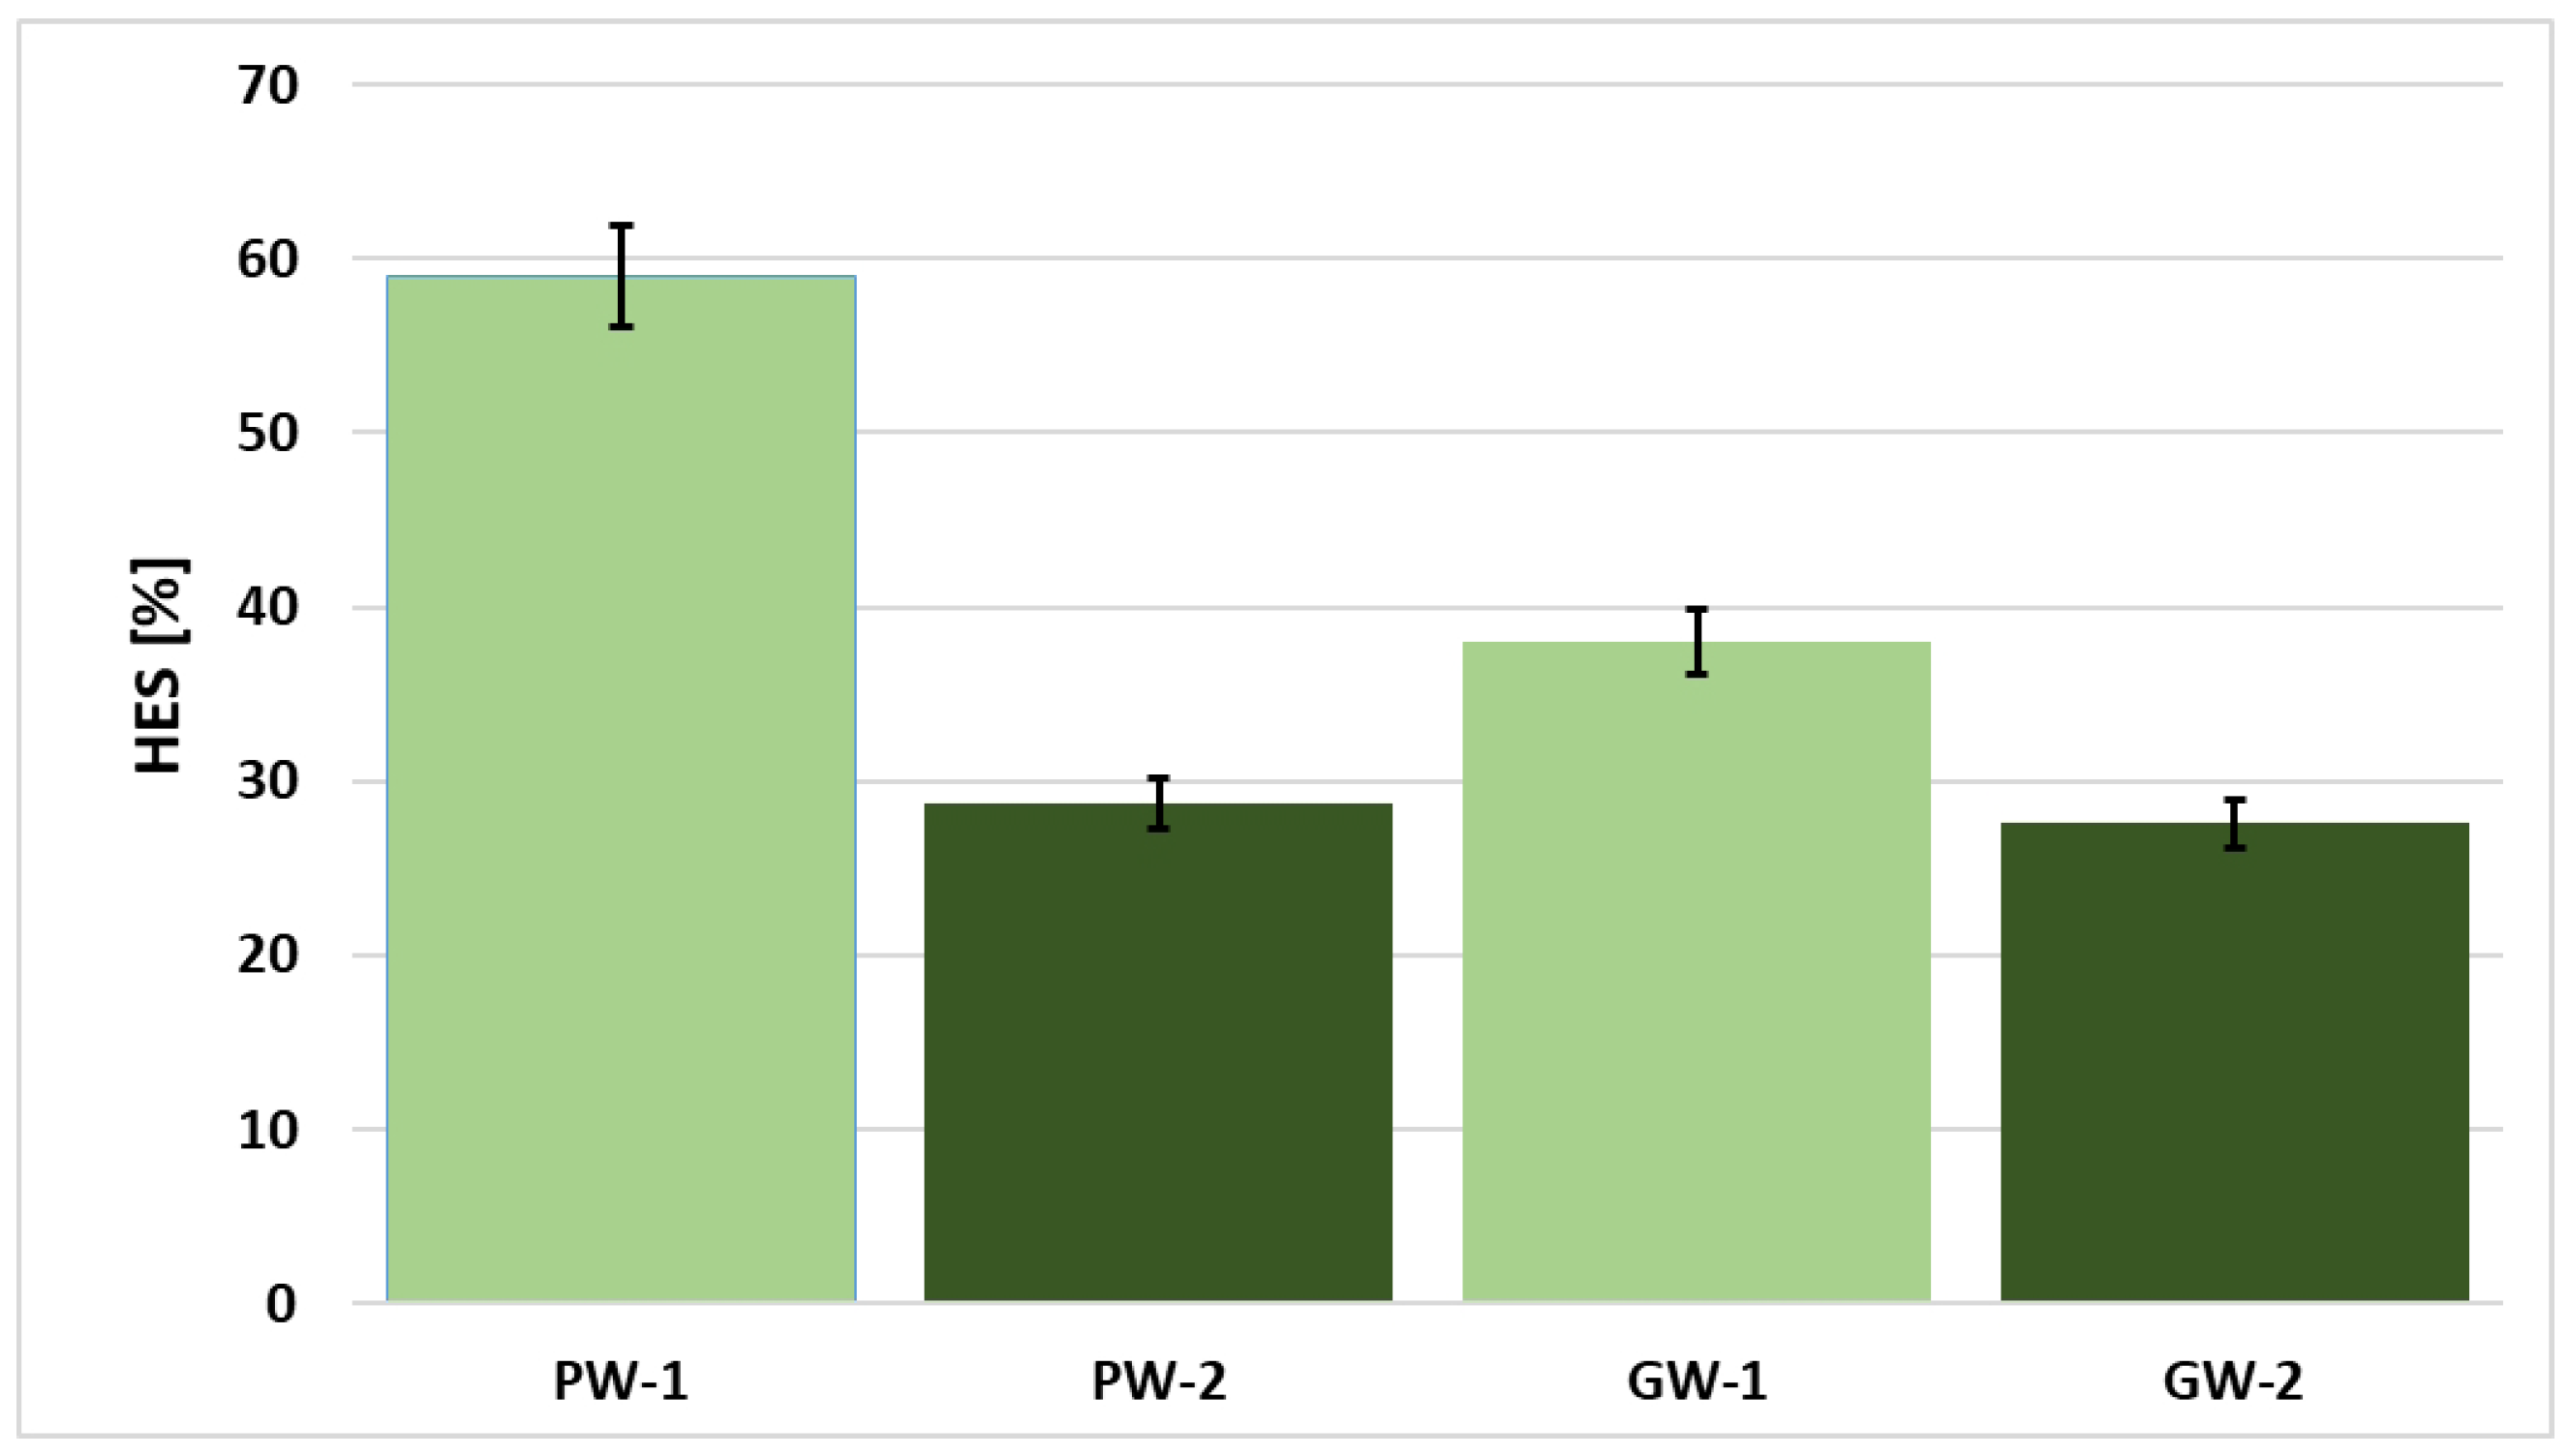
where f H and f are the elongation ductility parameters measured after and before hydrogen charging, respectively [27,28]. The calculated HES values (Figure 12) show substantial variation between specimen positions, reflecting the combined influence of distance from the pipe bore, local microstructure, non-metallic inclusion distribution, and welding-related factors.
Inner-wall specimens exhibit lower hydrogen sensitivity, with HES values of approximately 28% for both PW and GW configurations. In contrast, outer-wall specimens show significantly higher susceptibility, reaching approximately 59% for PW-1 and 38% for GW-1.
The greater embrittlement observed in outer-wall specimens is unlikely to result solely from electrochemically introduced hydrogen. Long-term exposure to soil corrosion may enhance hydrogen uptake through cathodic reactions, thereby promoting hydrogen ingress and synergistic degradation processes [29,30,31,32]. However, these corrosion processes are beyond the scope of the present investigation.
The fractographic results are fully consistent with the HES trends, supporting the existence of a pronounced through-thickness gradient in hydrogen embrittlement susceptibility.

3.4. X-Ray Diffraction Phase Analysis (XRD)
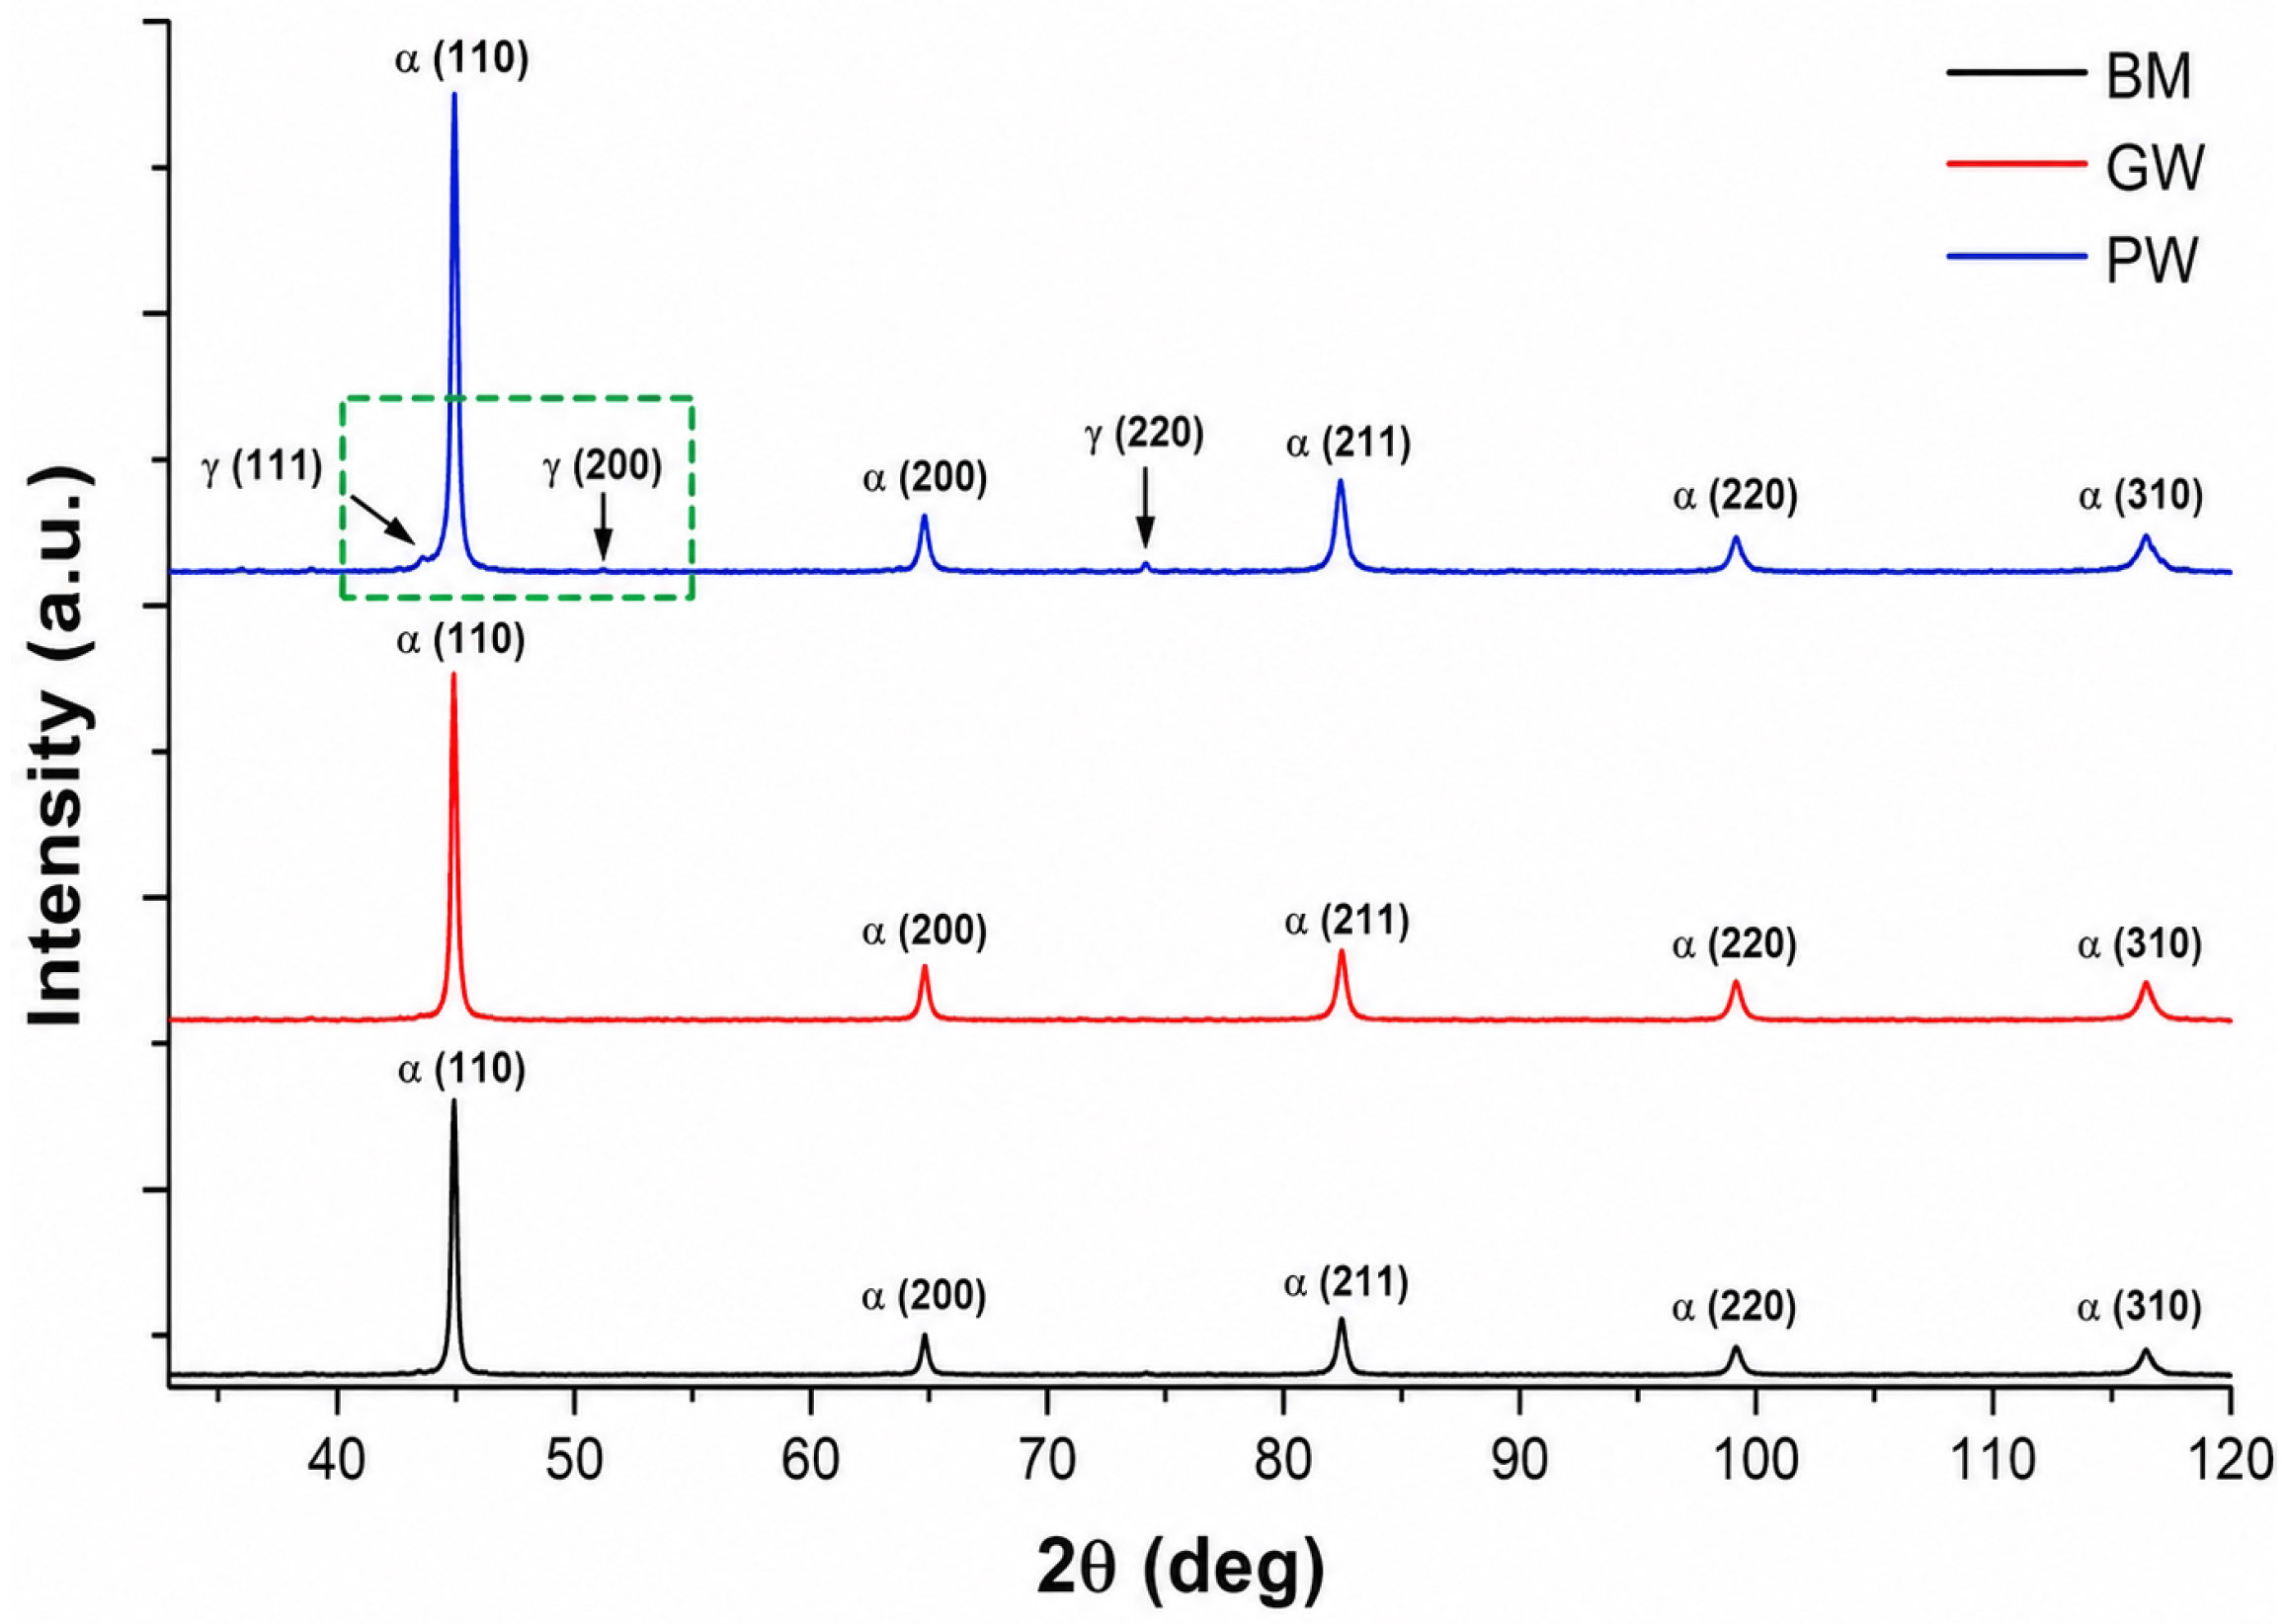
XRD analysis was performed to determine the phase composition in the BM, GW, and PW regions. Representative diffraction patterns are shown in Figure 13.
Figure 13. Representative X-ray diffraction patterns of the investigated pipeline steel in the BM, GW, and PW. The green box corresponds to the angular range shown in Figure 14.
Metals 16 00573 g013
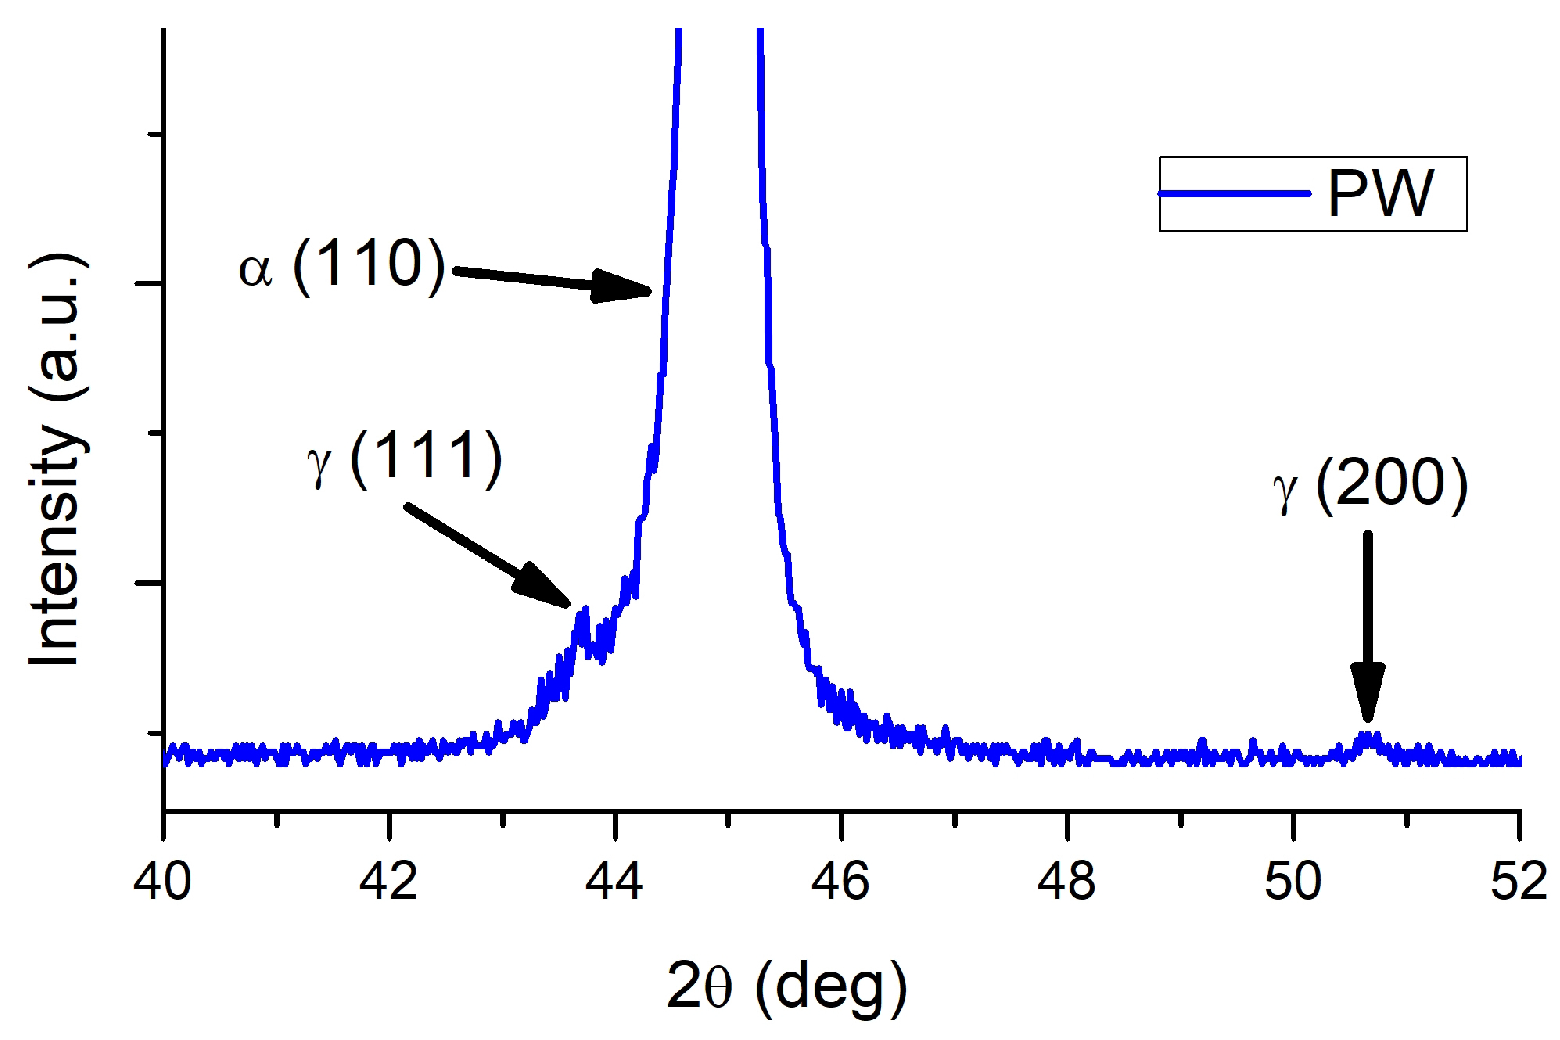
Figure 14. X-ray diffraction pattern of the PW sample in the angular range of the FCC γ -Fe reflections, showing clearly resolved (111)γ and (200)γ peaks confirming the presence of retained austenite in the production weld seam.
Metals 16 00573 g014
The diffraction patterns of BM and GW contain only reflections corresponding to the body-centered cubic (BCC) ferritic phase. Owing to the relatively low detection limit of the measurements (approximately 5%), no additional reflections associated with secondary phases were identified.
In contrast, the PW diffraction pattern contains, in addition to ferritic BCC reflections, low-intensity peaks corresponding to face-centered cubic (FCC) γ -Fe at positions associated with the (111) and (200) reflections of retained austenite [33,34]. The enlarged angular range shown in Figure 14 clearly resolves these peaks, confirming the presence of retained austenite in the PW.
The absence of comparable FCC reflections in BM and GW indicates that retained austenite is either absent or below the detection limit in these regions. The FCC austenitic phase exhibits significantly higher hydrogen solubility and lower hydrogen diffusivity than the ferritic BCC matrix [35,36]. Consequently, retained austenite in the PW promotes reversible hydrogen trapping and localized hydrogen accumulation at austenite–ferrite interfaces [37]. This behavior reduces effective hydrogen diffusivity and limits hydrogen penetration during short-term charging.
To further evaluate the microstructural state of the investigated regions, peak broadening analysis was performed using the modified Williamson–Hall method to estimate lattice microstrain ε . The calculated microstrain values are summarized in Table 2.
The calculated values increase progressively from BM to GW and reach the highest level in PW.
This trend indicates increasing crystallographic defect density and lattice distortion in the welded regions, particularly in PW, consistent with the complex thermal history and mixed-phase microstructure associated with welding. Elevated microstrain in PW may additionally enhance hydrogen trapping through strain-induced lattice distortions and defect-associated trapping sites.

3.5. Hydrogen Permeation Study

3.5.1. Comparative Overview of Hydrogen Transport Properties

Electrochemical hydrogen permeation experiments revealed substantial differences in hydrogen transport behavior among the BM, PW, and GW regions, reflecting their distinct microstructural characteristics.
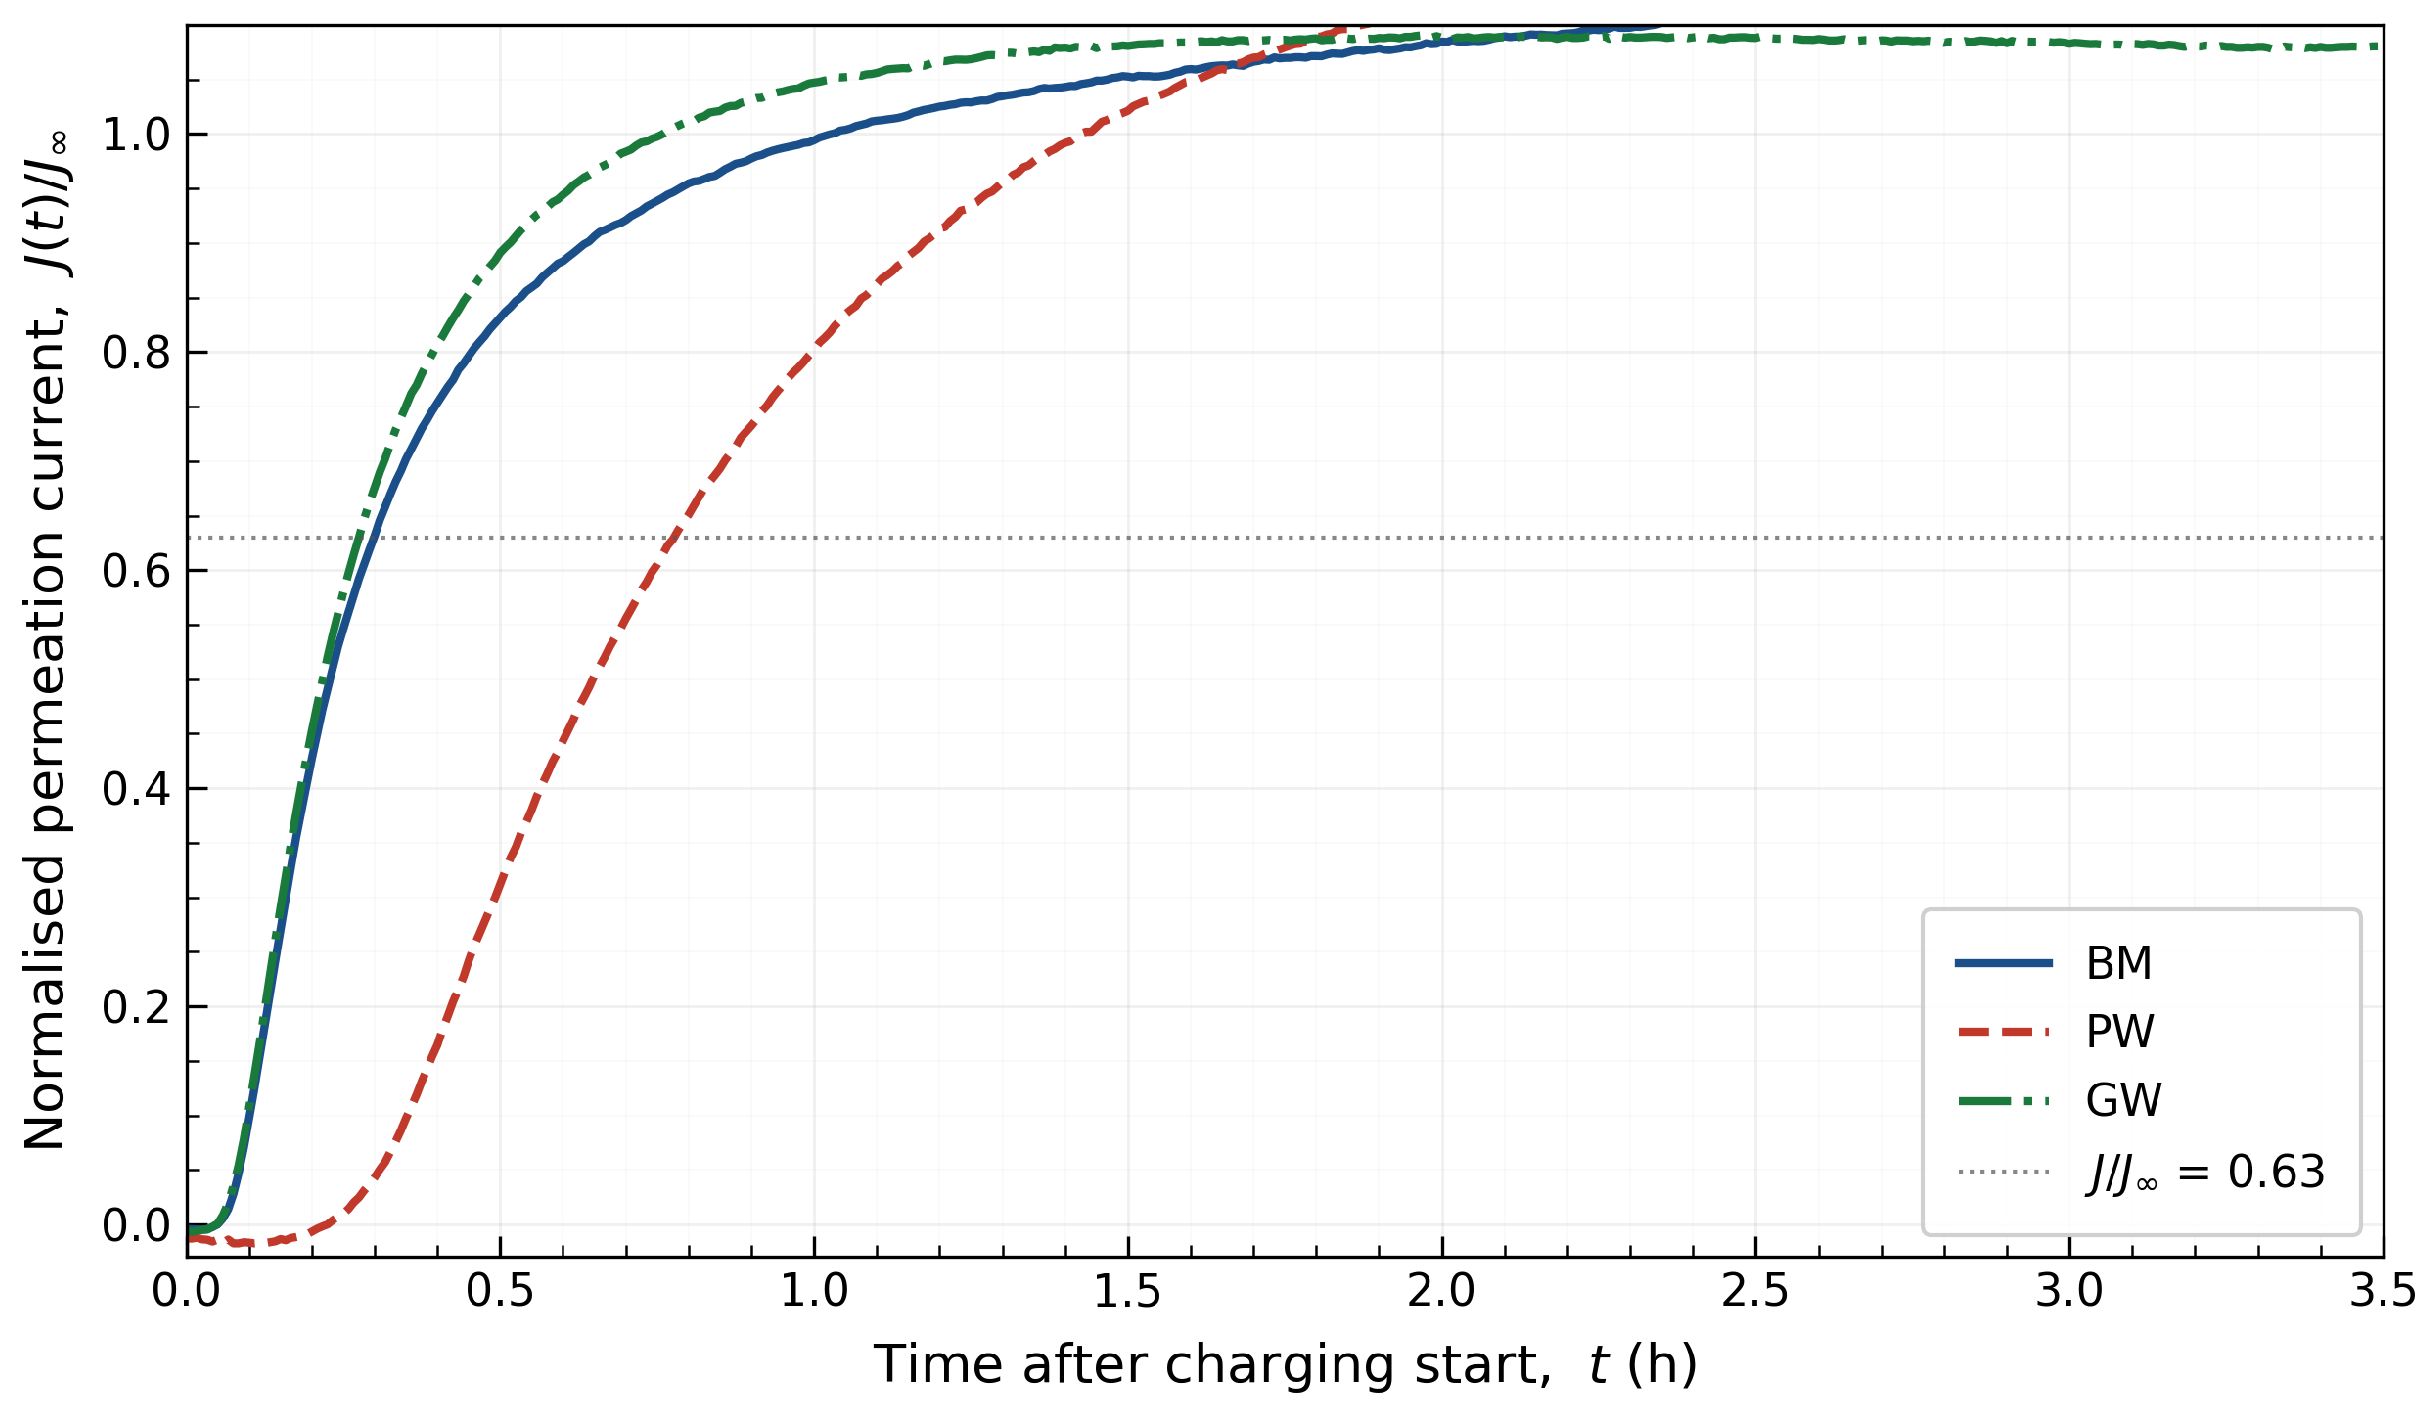
The analysis is based on the first permeation transient (T1), representing the only measurement obtained from a fully hydrogen-free specimen and therefore providing the most physically meaningful basis for comparison. The normalized permeation transients are presented in Figure 15.

3.5.2. Apparent Diffusion Coefficient

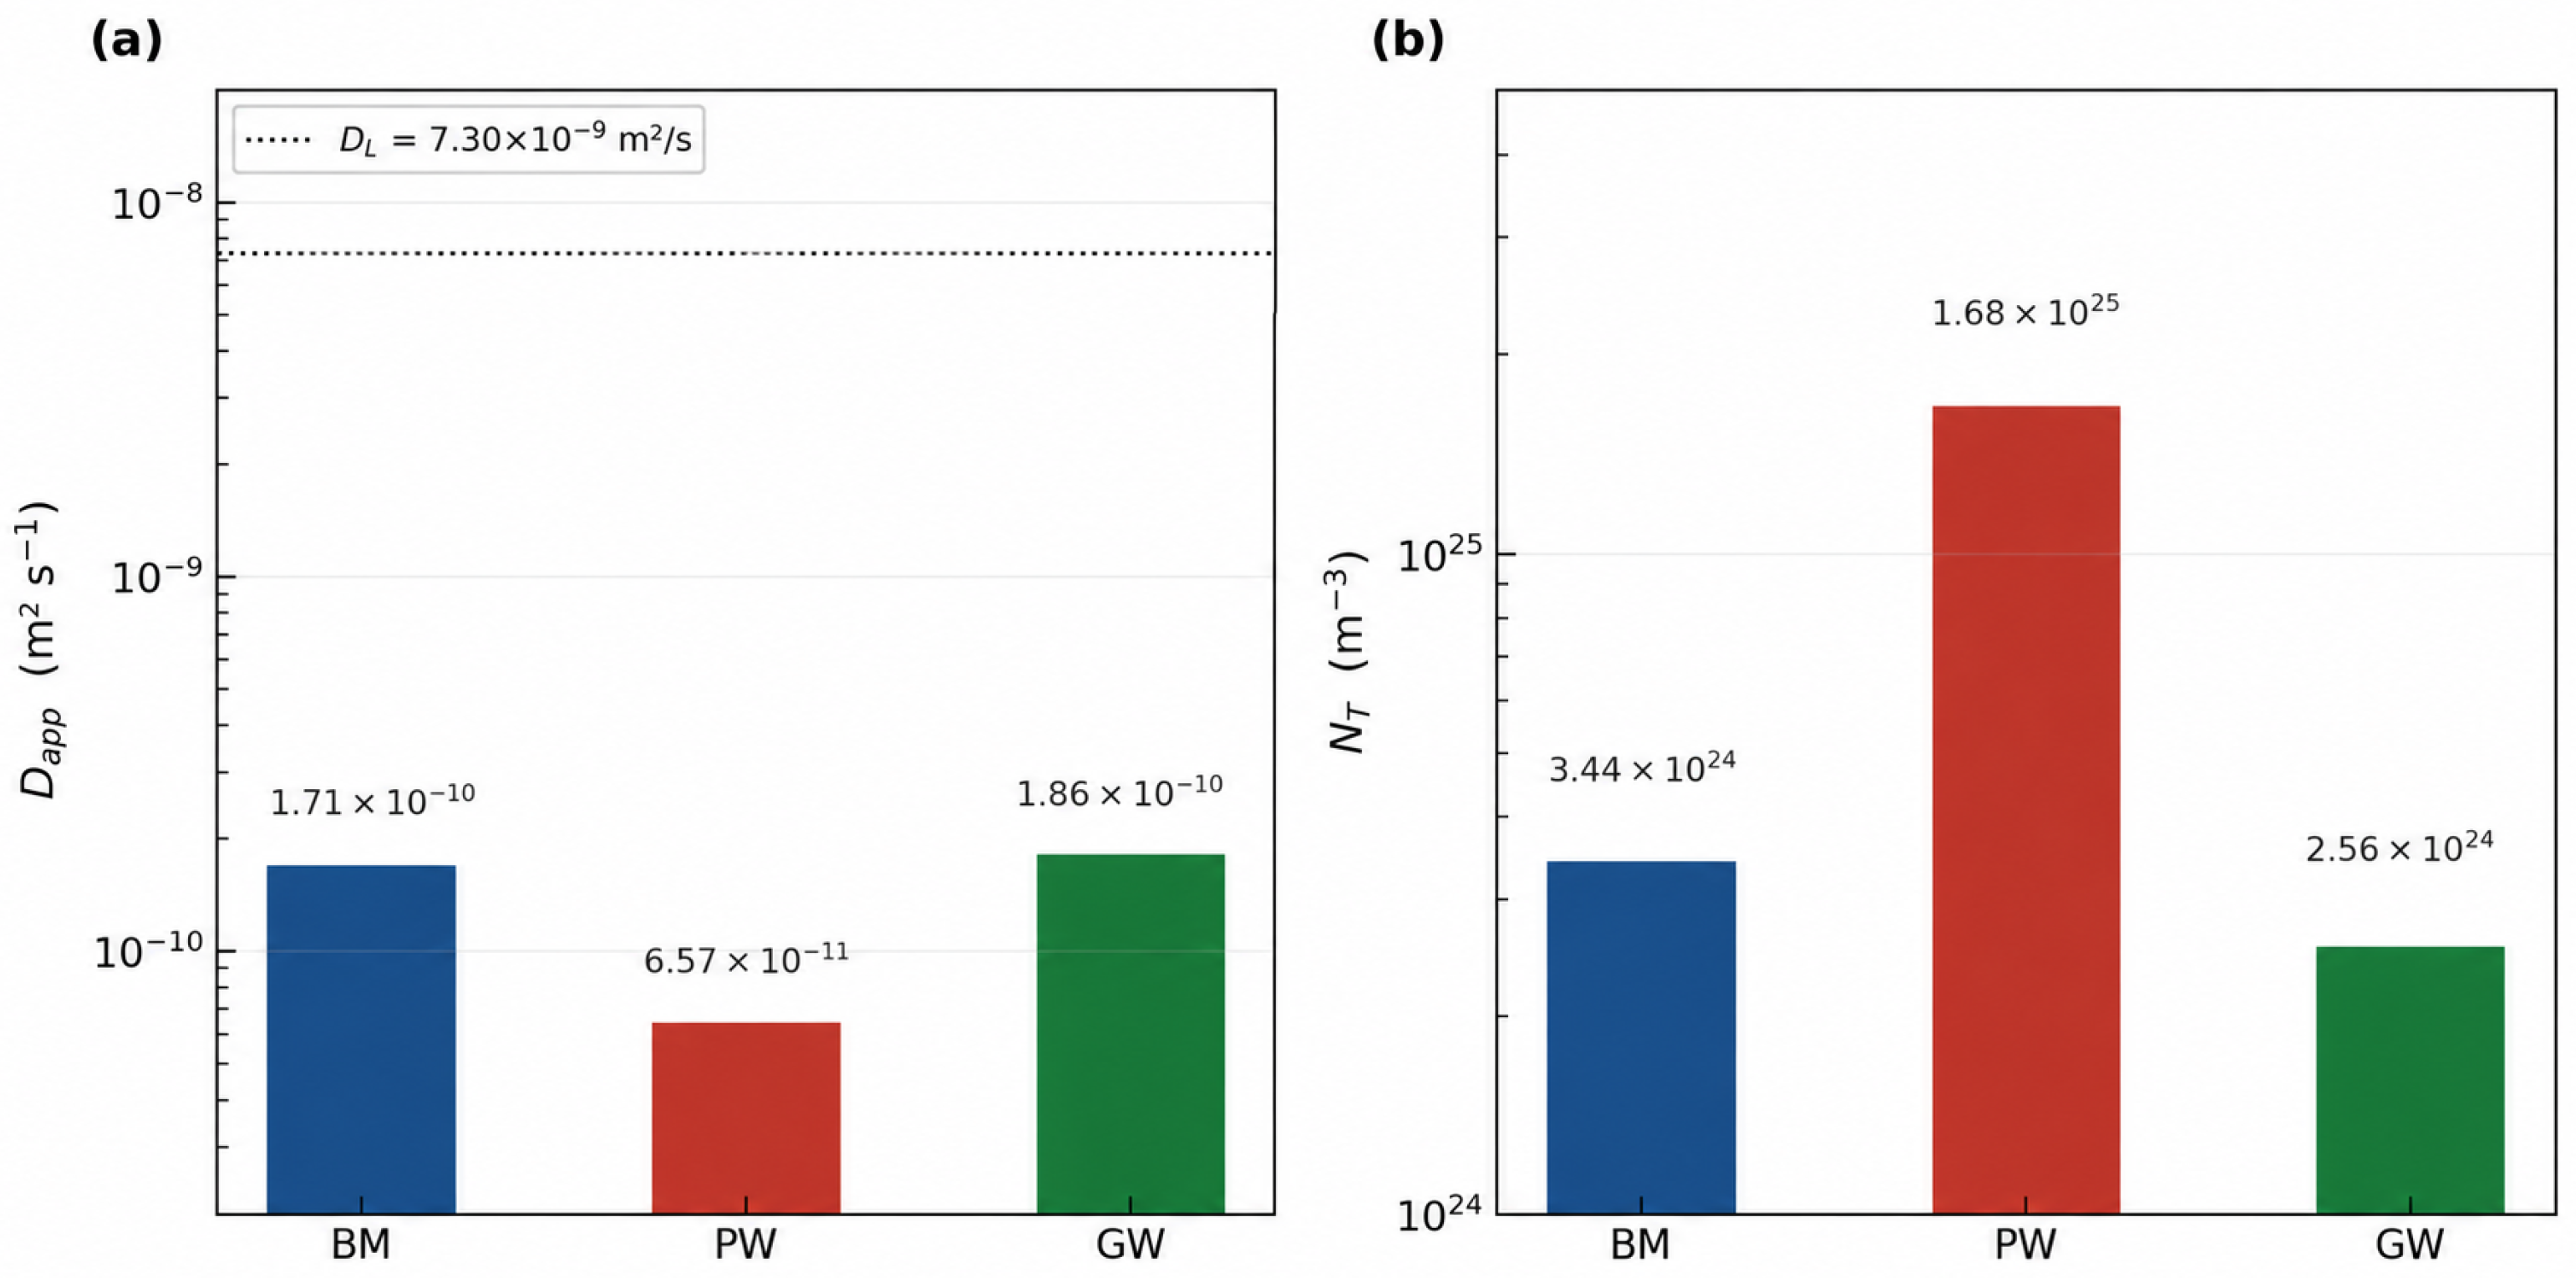
The apparent hydrogen diffusion coefficient D app varied significantly among the investigated regions (Figure 16). GW exhibited the highest value, followed closely by BM, whereas PW showed a markedly lower value approximately 2.6–2.8 times lower than the other regions.
All measured diffusion coefficients are substantially lower than the lattice diffusion coefficient for BCC iron at 25 °C ( D L = 7.3 × 10 9 m2/s), confirming the presence of extensive hydrogen trapping microstructures.
The near-equivalence of BM and GW in terms of D app is noteworthy. Despite originating from different regions of the pipeline system, both permit hydrogen transport at comparable rates. In contrast, the significantly lower diffusion coefficient in PW indicates the presence of a much denser and more effective population of hydrogen trapping sites [38]. This behavior is consistent with the expected microstructural complexity of weld regions, which contain elevated dislocation density, carbide redistribution, residual stress gradients, and mixed-phase microstructures [2,26].

3.5.3. Trap Density

The total hydrogen trap density N T exhibits the most pronounced differences among the investigated regions. PW shows the highest trap density, approximately five times greater than BM and more than six times greater than GW.
The elevated trap density in PW confirms the presence of a highly developed population of hydrogen trapping sites. These traps repeatedly capture and release hydrogen during diffusion, thereby increasing the time lag and reducing D app .
This interpretation is fully consistent with the hydrogen concentration anomaly reported in Part I [5], where PW absorbed less hydrogen during electrochemical charging despite containing more hydrogen in the as-received state. The high density of partially saturated irreversible traps in PW limits its effective hydrogen uptake capacity during short-term charging.

3.5.4. Sub-Surface Hydrogen Concentration

The sub-surface hydrogen concentration C 0 is related to the steady-state permeation flux and apparent diffusion coefficient through:
C 0 = J SS · L D app ,
where J SS is the steady-state permeation flux and L is the specimen thickness.
PW exhibits the highest C 0 , whereas GW exhibits the lowest. Since all specimens were charged under identical cathodic current density conditions and displayed comparable steady-state permeation fluxes, the differences in C 0 are governed primarily by the inverse dependence on D app .
The elevated C 0 in PW (Table 3) indicates a higher local hydrogen chemical potential at the entry surface and a greater driving force for hydrogen transport into stressed regions [39]. Consequently, PW represents the most severe hydrogen uptake condition among the investigated regions.

3.6. Mechanistic Interpretation of the Hydrogen Concentration Anomaly in the Production Weld

The BM, PW, and GW regions differ not only in phase composition but also in the type, density, binding energy, and saturation state of their hydrogen traps. These differences fundamentally control their hydrogen-assisted fracture behavior.
The anomalous hydrogen concentration behavior observed in PW, namely lower hydrogen uptake after electrochemical charging despite higher initial hydrogen content, reflects competition between reversible and irreversible trapping sites. During 31 years of service, irreversible traps associated with inclusions, voids, and high-energy interfaces likely became progressively saturated with hydrogen.
Consequently, fewer trapping sites remained available during subsequent short-term electrochemical charging. In contrast, the GW contains a larger population of unsaturated trapping sites generated by the heterogeneous thermal cycles associated with multi-pass field welding [5], enabling greater additional hydrogen uptake.
Differences in welding conditions also contribute significantly. PW was produced under controlled factory conditions using mechanized welding and relatively stable thermal cycles, favoring the stabilization of retained austenite and dense trapping microstructures. In contrast, GW was produced by manual multi-pass field welding, resulting in greater local heterogeneity within the HAZ.

3.7. TEM Investigation- Features in Welded Joints

Because TEM is inherently a local characterization technique and the BM, PW, and GW regions are microstructurally heterogeneous, the present analysis is focused on identifying representative microstructural features associated with hydrogen-induced damage rather than providing a statistically representative characterization across the entire wall thickness. Figure 17, Figure 18, Figure 19, Figure 20 and Figure 21 show representative areas, found both in specimens from position 1 and position 2 (based on Figure 1 designations).

3.7.1. Effect of Non-Metallic Inclusions

Non-metallic inclusions containing Si, Mn, Ti, Al, and O are observed in both PW and GW specimens and act as crack initiation sites [5]. In the present study, particular attention is given to the influence of inclusion morphology and distribution on dislocation behavior.
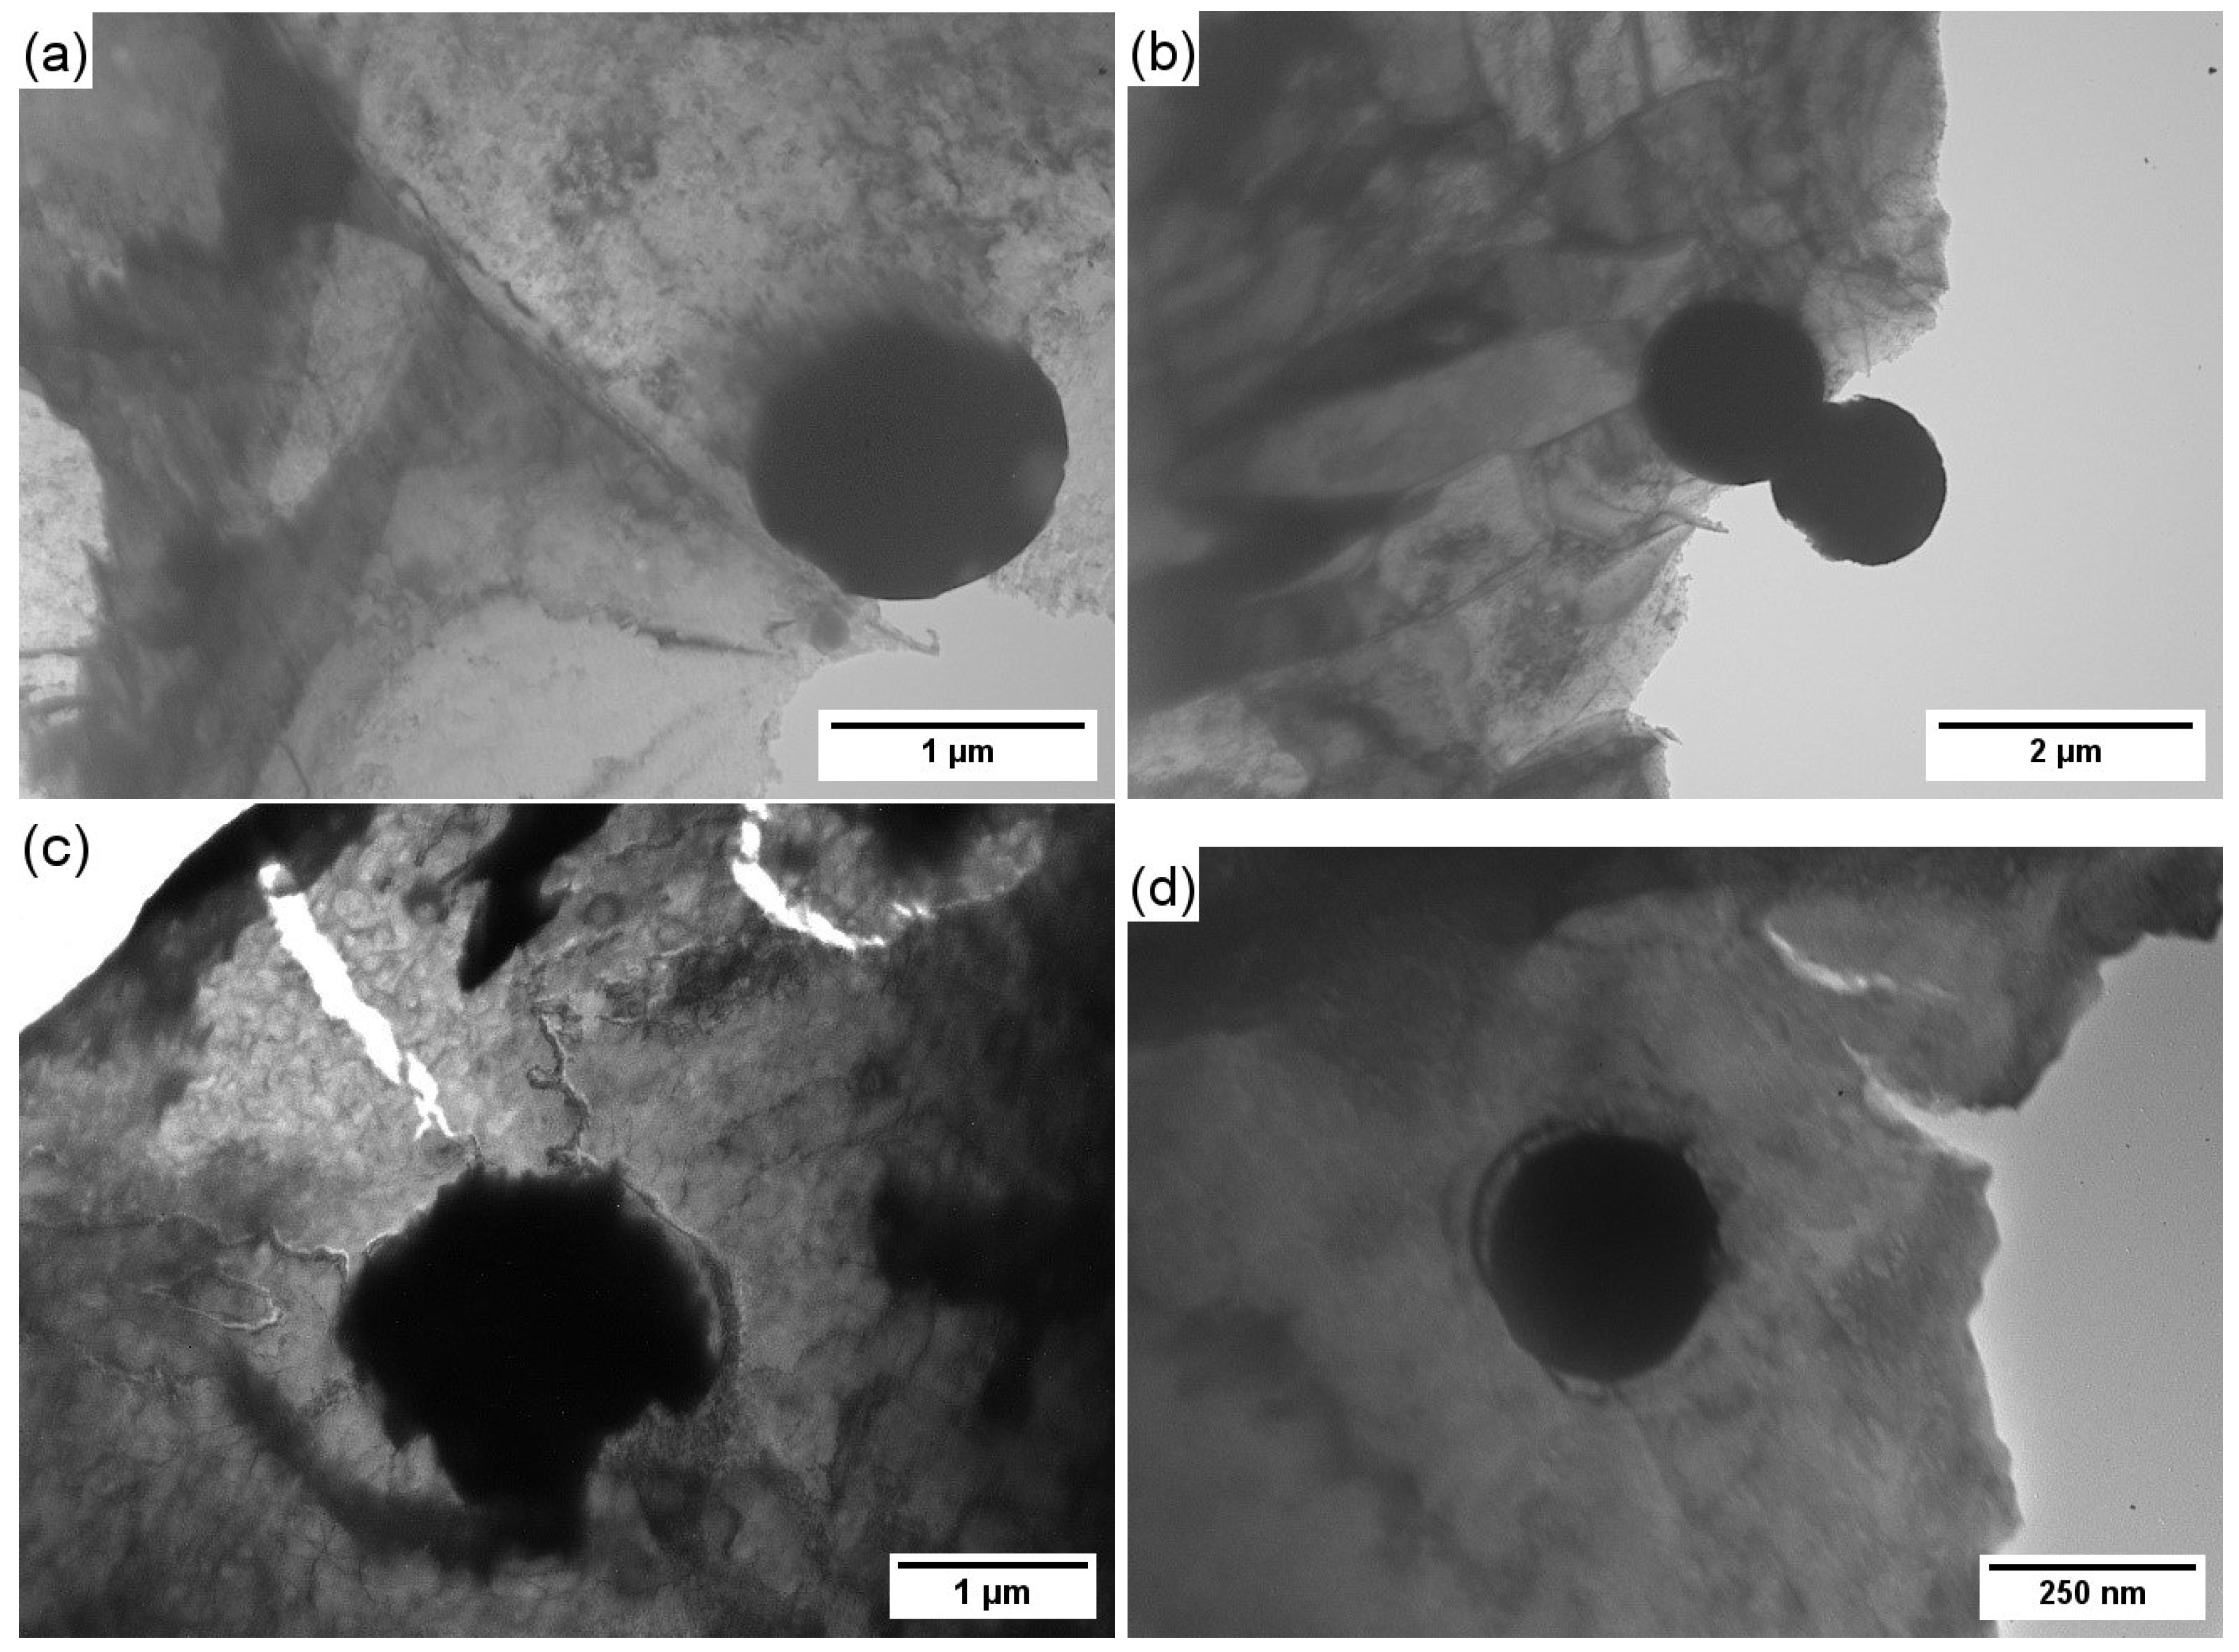
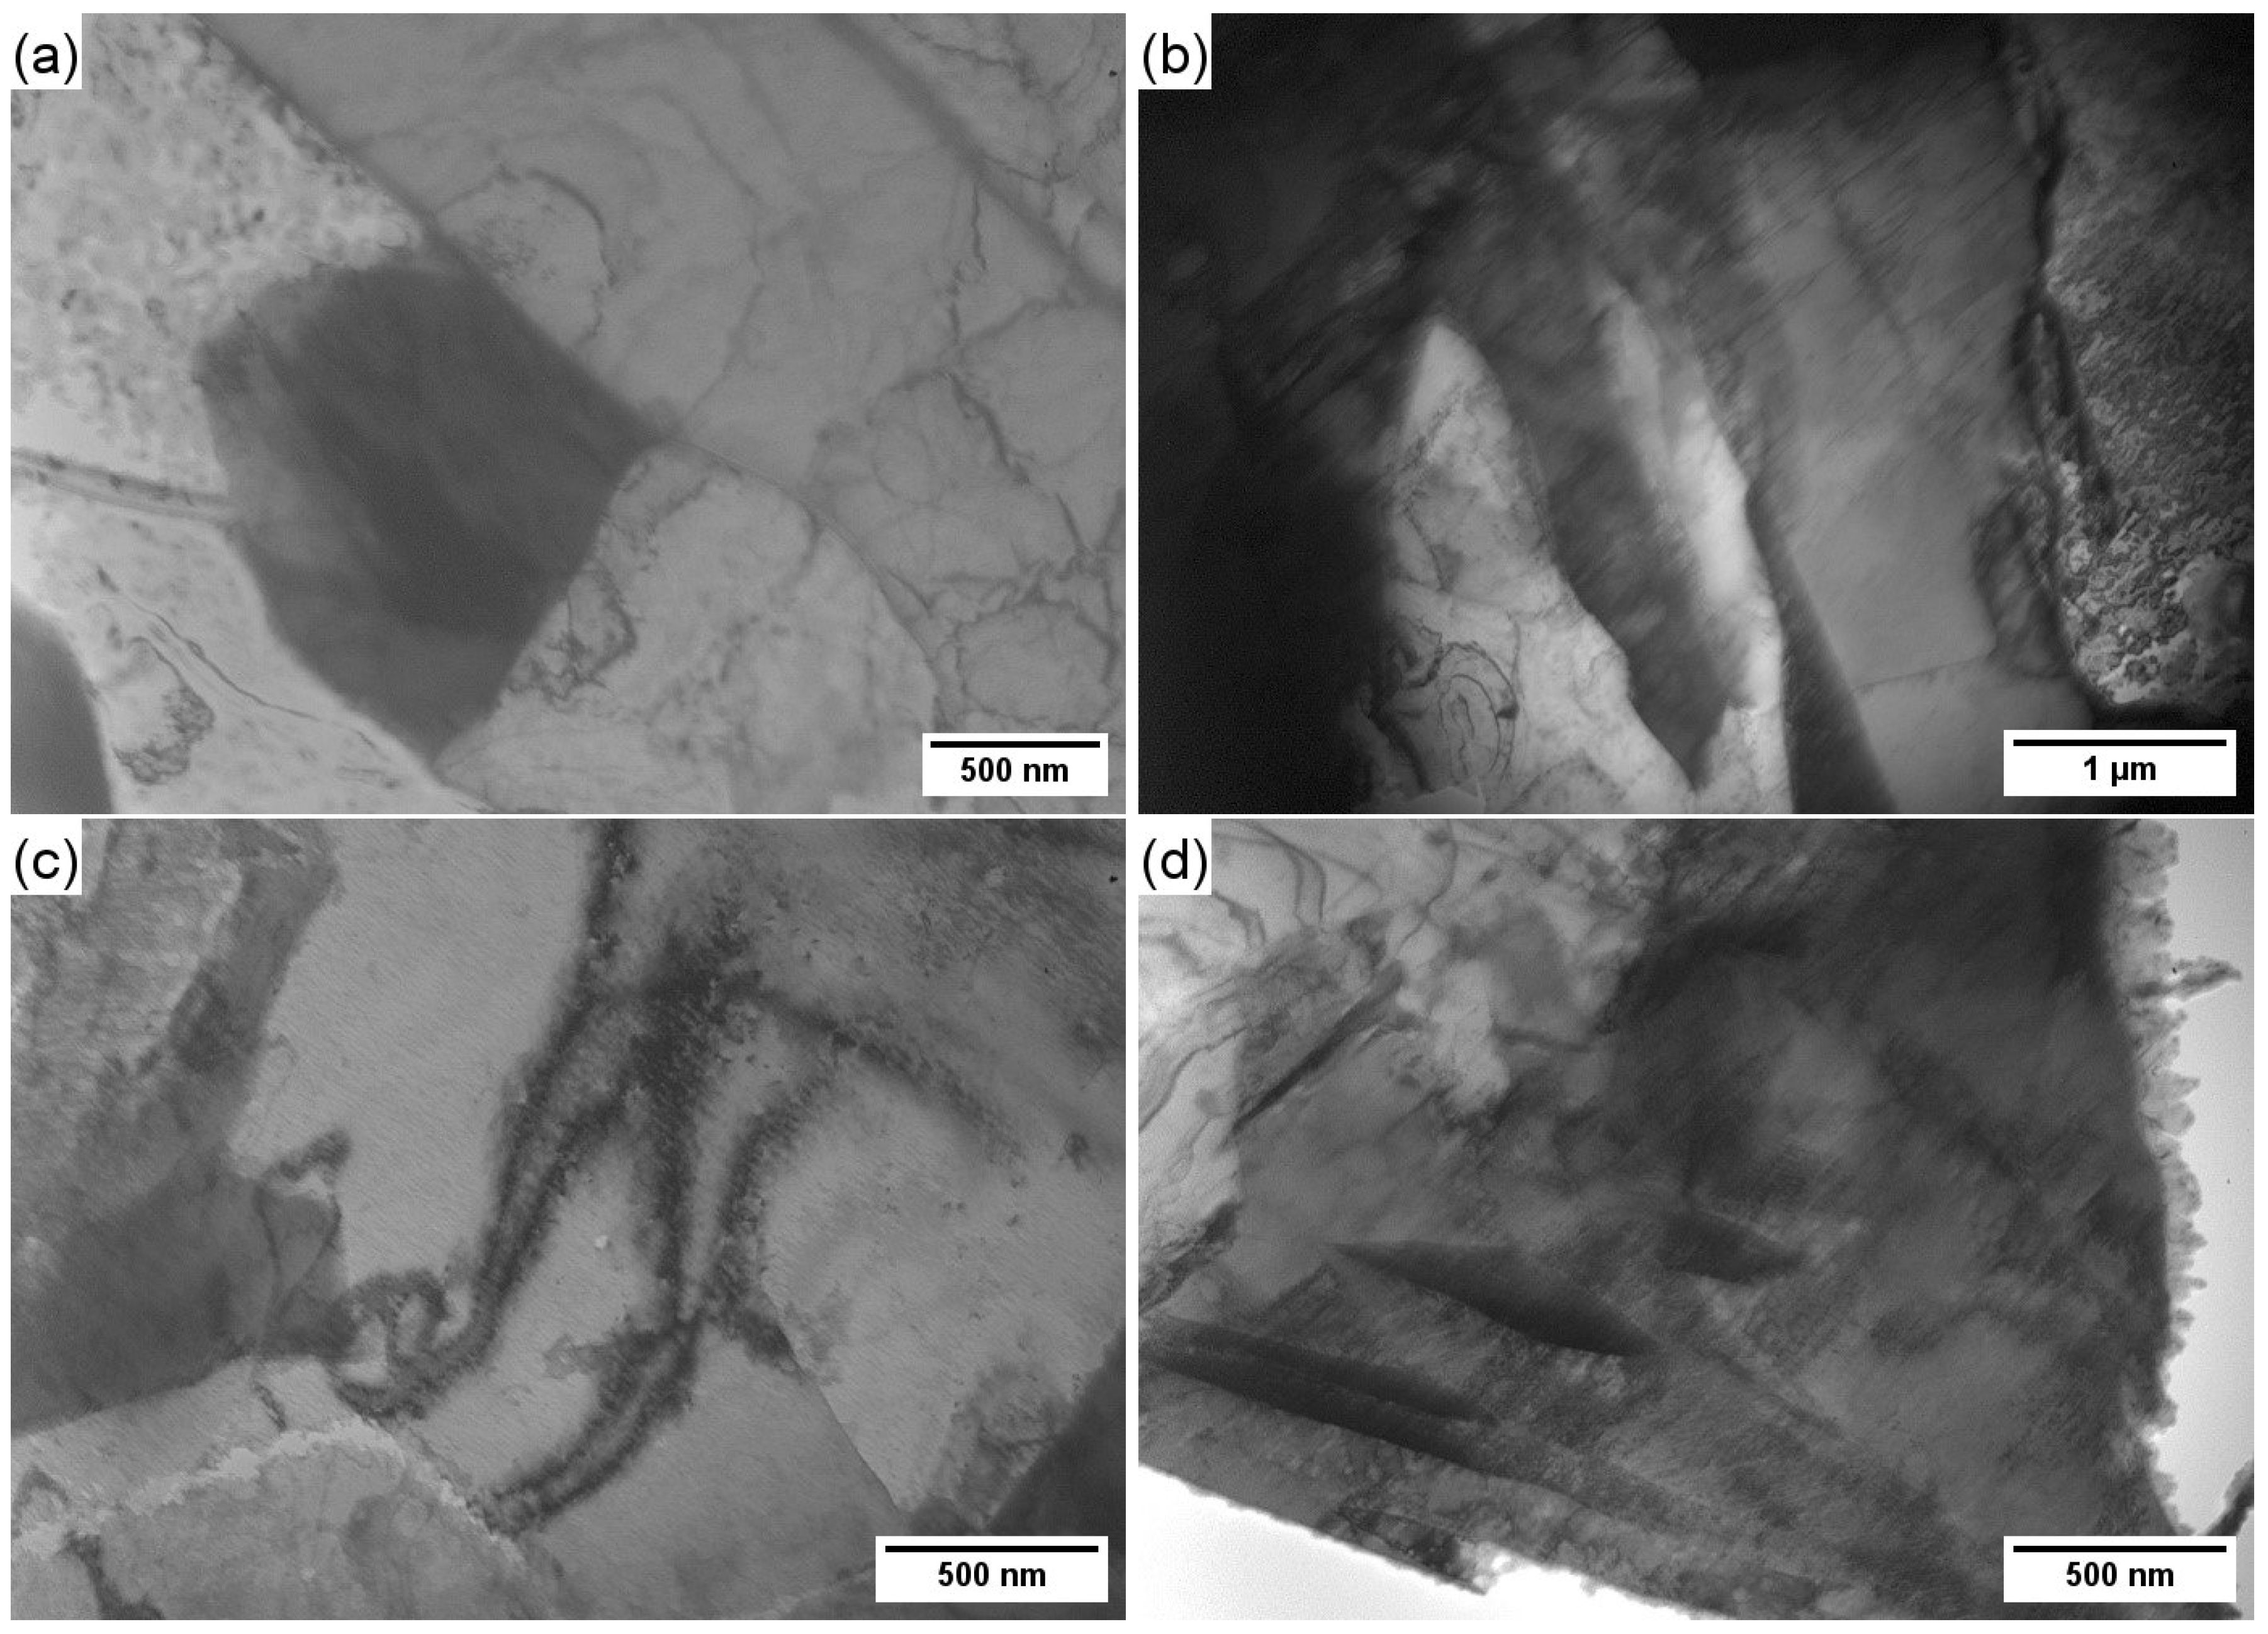
TEM observations reveal inclusions both inside ferrite grains and along grain boundaries (Figure 17). Most inclusions are spherical with smooth edges, although some exhibit irregular or serrated morphologies. Irregular inclusion edges act as local stress concentrators and promote dislocation generation, whereas inclusions with smooth edges are associated mainly with isolated dislocations.
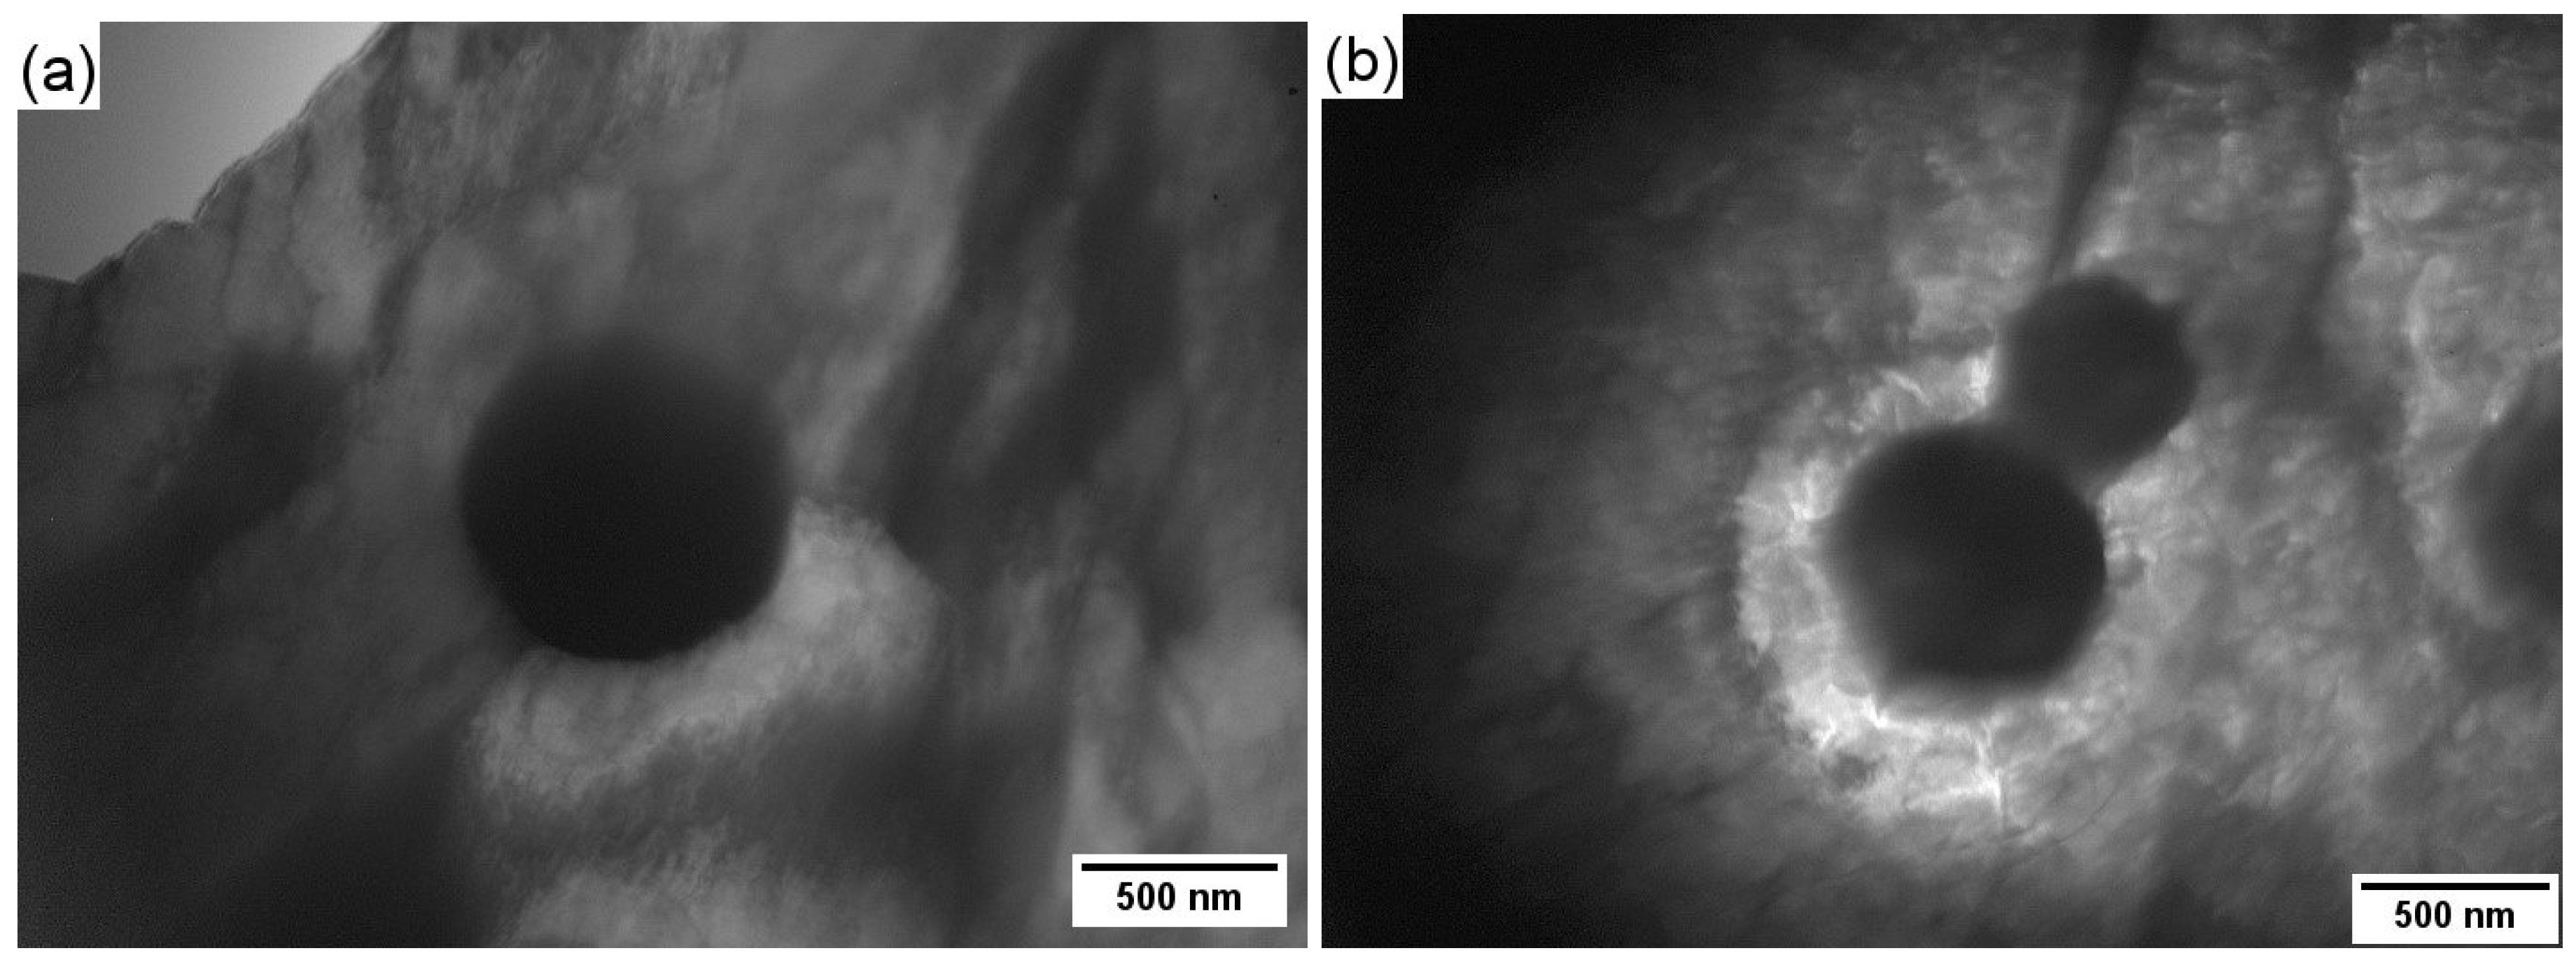
Additional hydrogen charging substantially increases dislocation density around inclusions, confirming that non-metallic inclusions act as effective hydrogen trapping sites (Figure 18).
The observations additionally reveal a clear size-dependent role of inclusions. TEM-detected inclusions generally exhibit equivalent diameters below 1 μm, whereas inclusions identified as crack initiation sites on fracture surfaces are considerably larger, approximately 5–7 μm.
This size separation is consistent with the critical inclusion size framework proposed previously [40,41]. Sub-micron inclusions act primarily as irreversible hydrogen traps that homogenize hydrogen distribution and suppress local pressure buildup, whereas larger inclusions generate sufficient stress concentration and local hydrogen accumulation to nucleate interfacial cracks.
The larger average size of crack-initiating inclusions in PW-H relative to GW-H is consistent with the greater inclusion population and larger inclusion size previously reported for PW [5].

3.7.2. Effect of Martensite–Austenite (M/A) Zones in Welded Joints

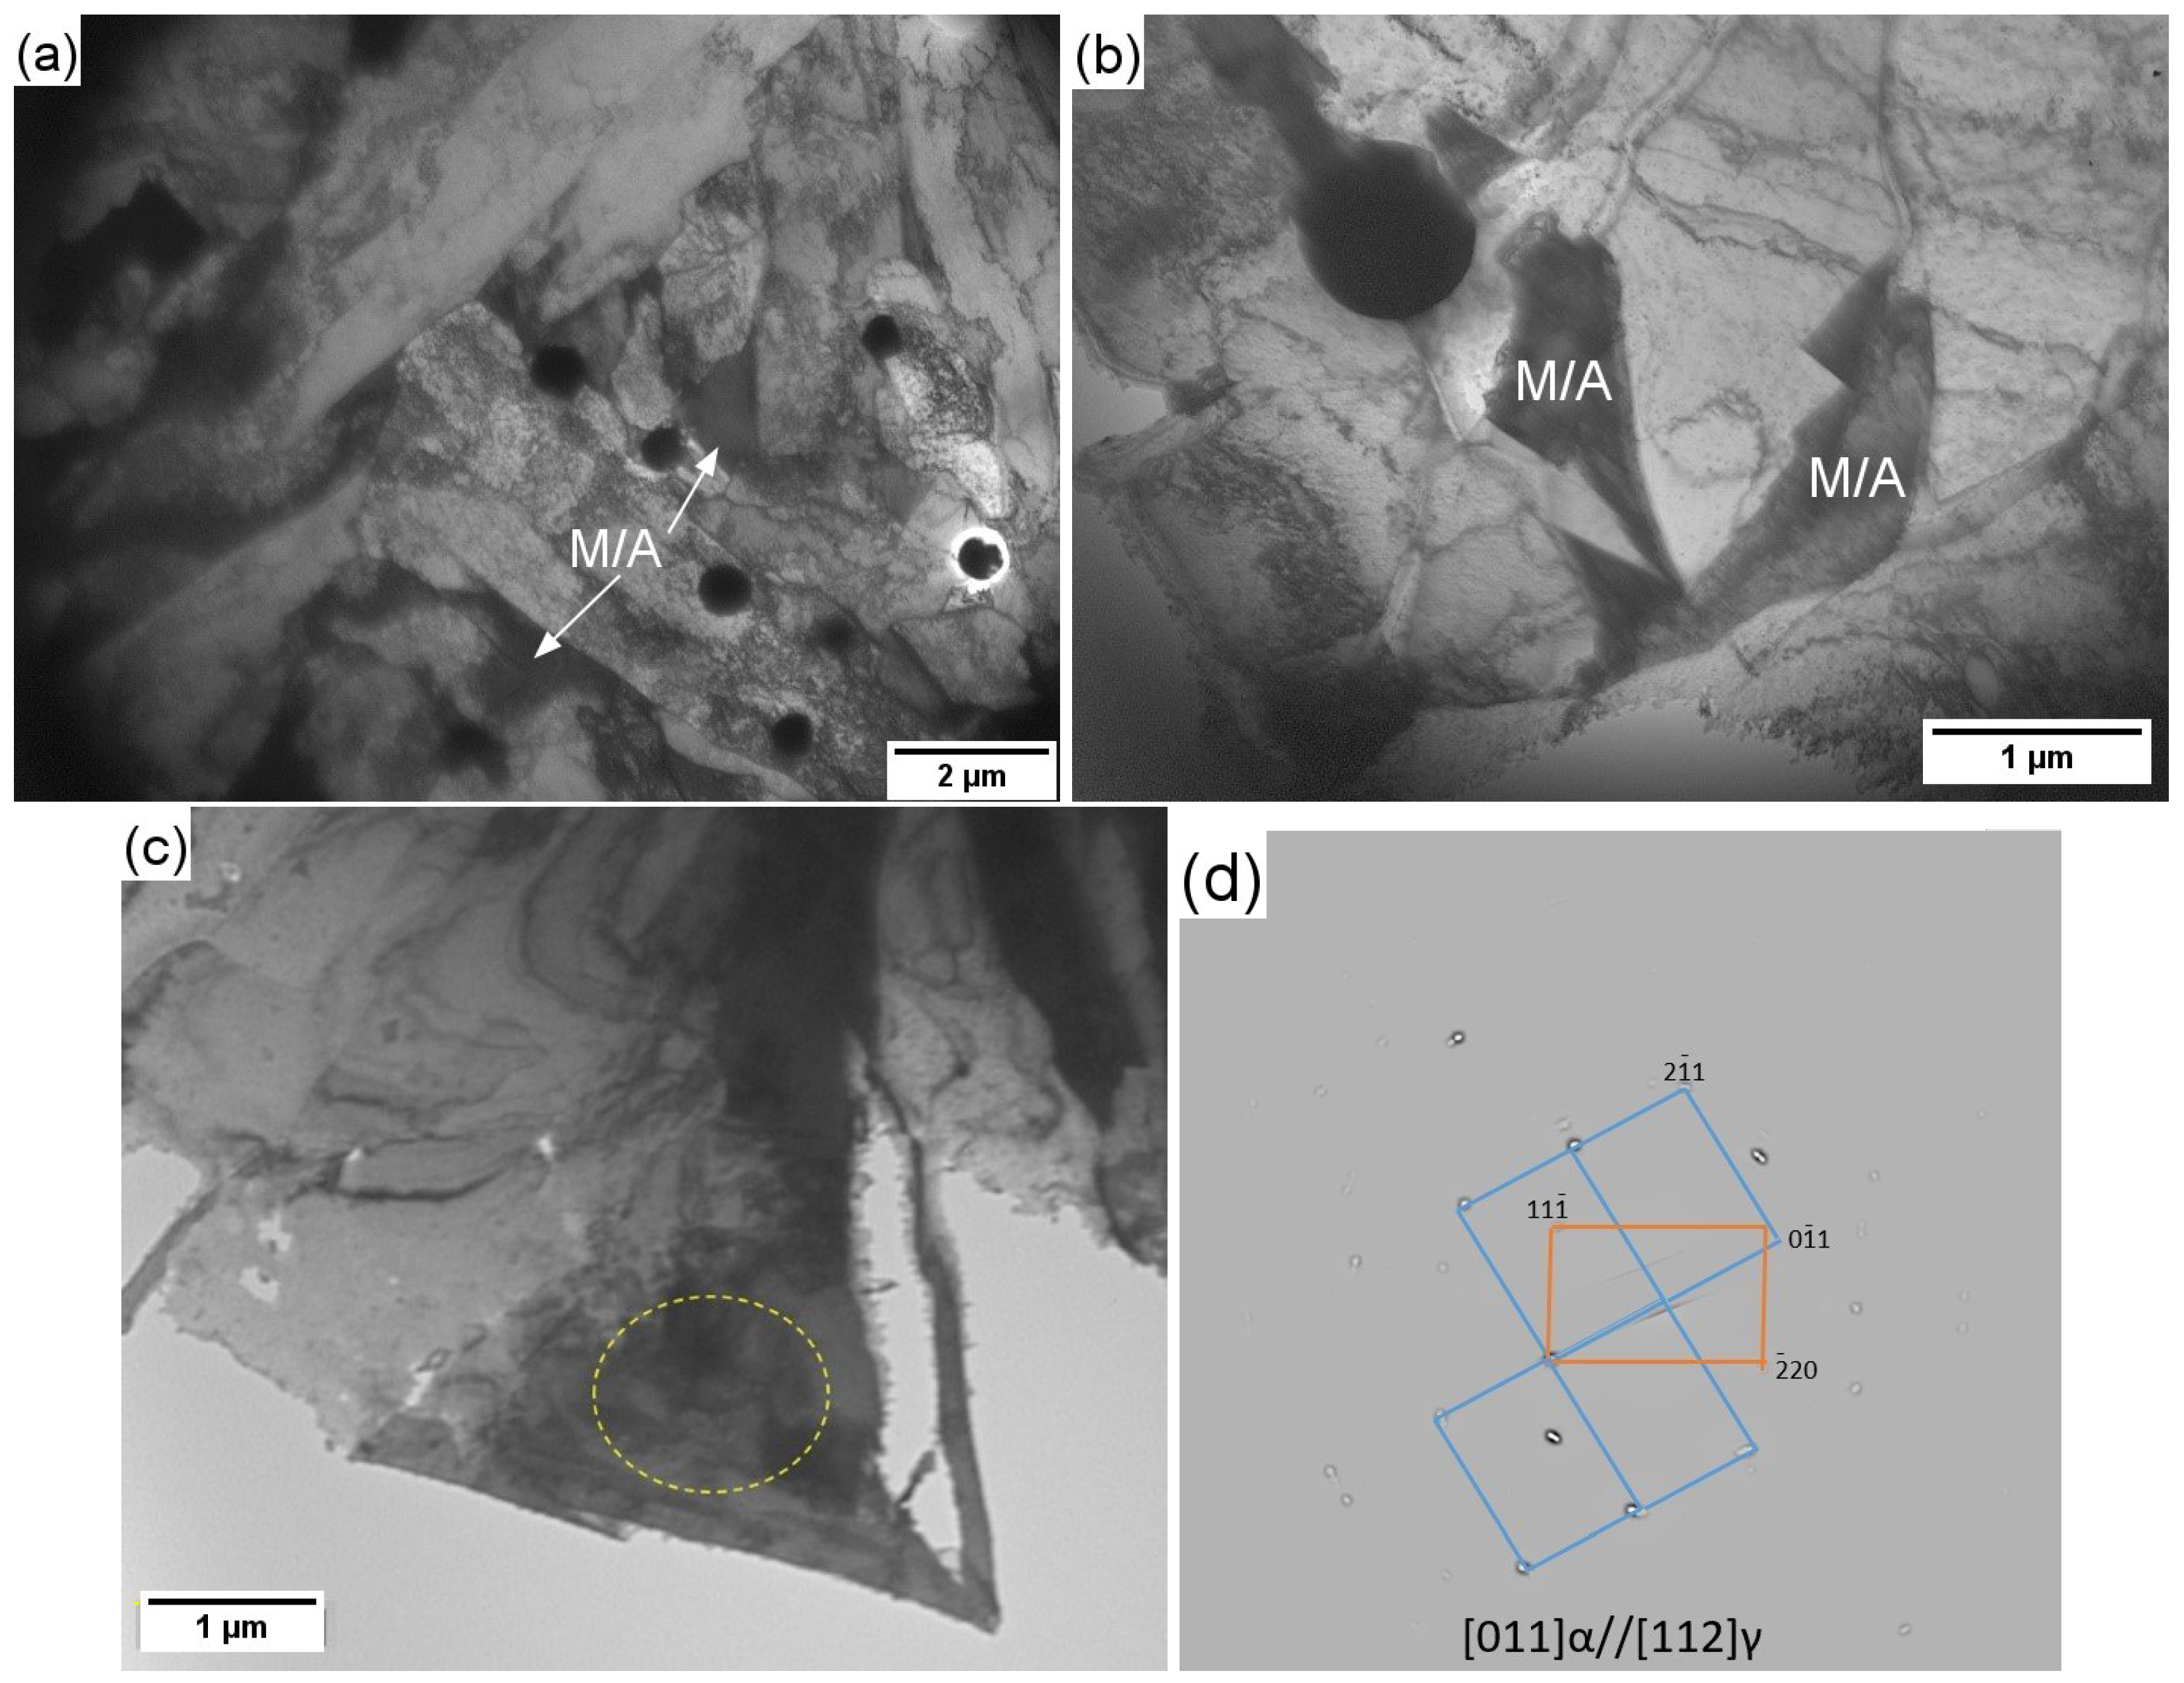
The welded joints contain acicular ferrite together with martensite–austenite (M/A) constituents distributed primarily along ferrite grain boundaries. TEM and SAED analyses confirm the coexistence of ferritic and retained austenitic phases (Figure 17a and Figure 19).
PW contains a greater number of M/A constituents than GW, which is consistent with its higher Mn content and with the XRD evidence for retained austenite. Mn stabilizes austenite, suppresses pearlite formation, and promotes ferrite stability [42]. Consequently, the weld microstructure resembles that of transformation-induced plasticity steels, containing ferrite, bainite, retained austenite, martensite, and carbides.

3.7.3. Dislocation Behavior in Welded Joints

The dislocation structure in both PW and GW specimens after 31 years of service is well developed within ferrite grains (Figure 20). Both edge and screw dislocations are observed, with many dislocations arrested at grain boundaries.
TEM observations additionally reveal M/A zones containing coherent twin boundaries. During tensile deformation, retained austenite grains may form deformation twins [43,44], reflecting the high plasticity of the welded regions.
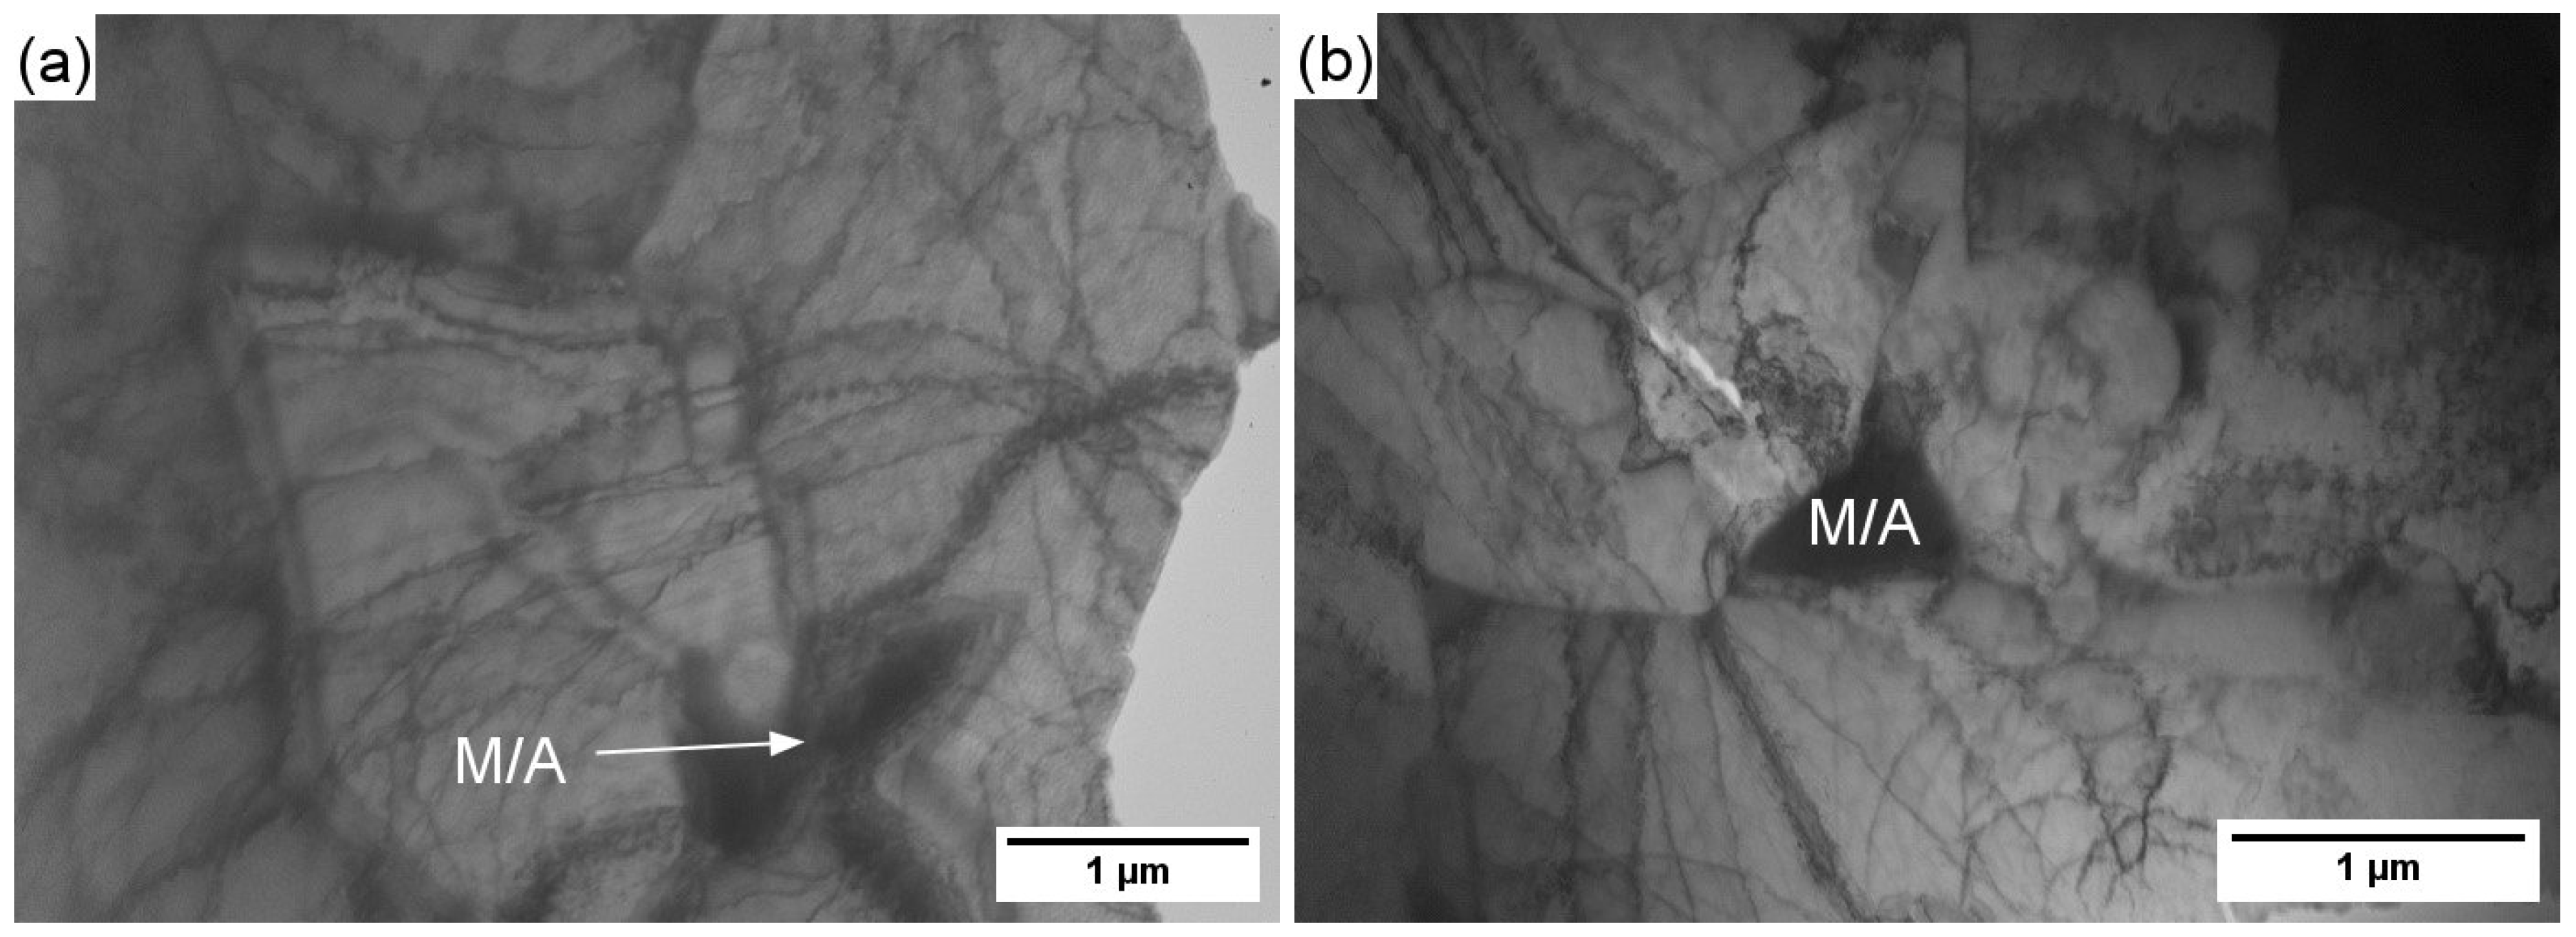
After additional hydrogen charging (Figure 21), the dislocation structure becomes significantly more intense. Dislocation lines are observed looping around M/A zones or accumulating as pile-ups at M/A interfaces, indicating strong hydrogen-dislocation interactions.

3.7.4. Plastically Deformed Zone (PDZ) Adjacent to the HAZ

Our studies showed that the fine structure of welded joints is a prerequisite for their good quality. This is also confirmed by the fact that 90% of the samples with both types of weld seams, after tensile testing, failed not in the weld metal but in the HAZ or in BM regions near the HAZ.
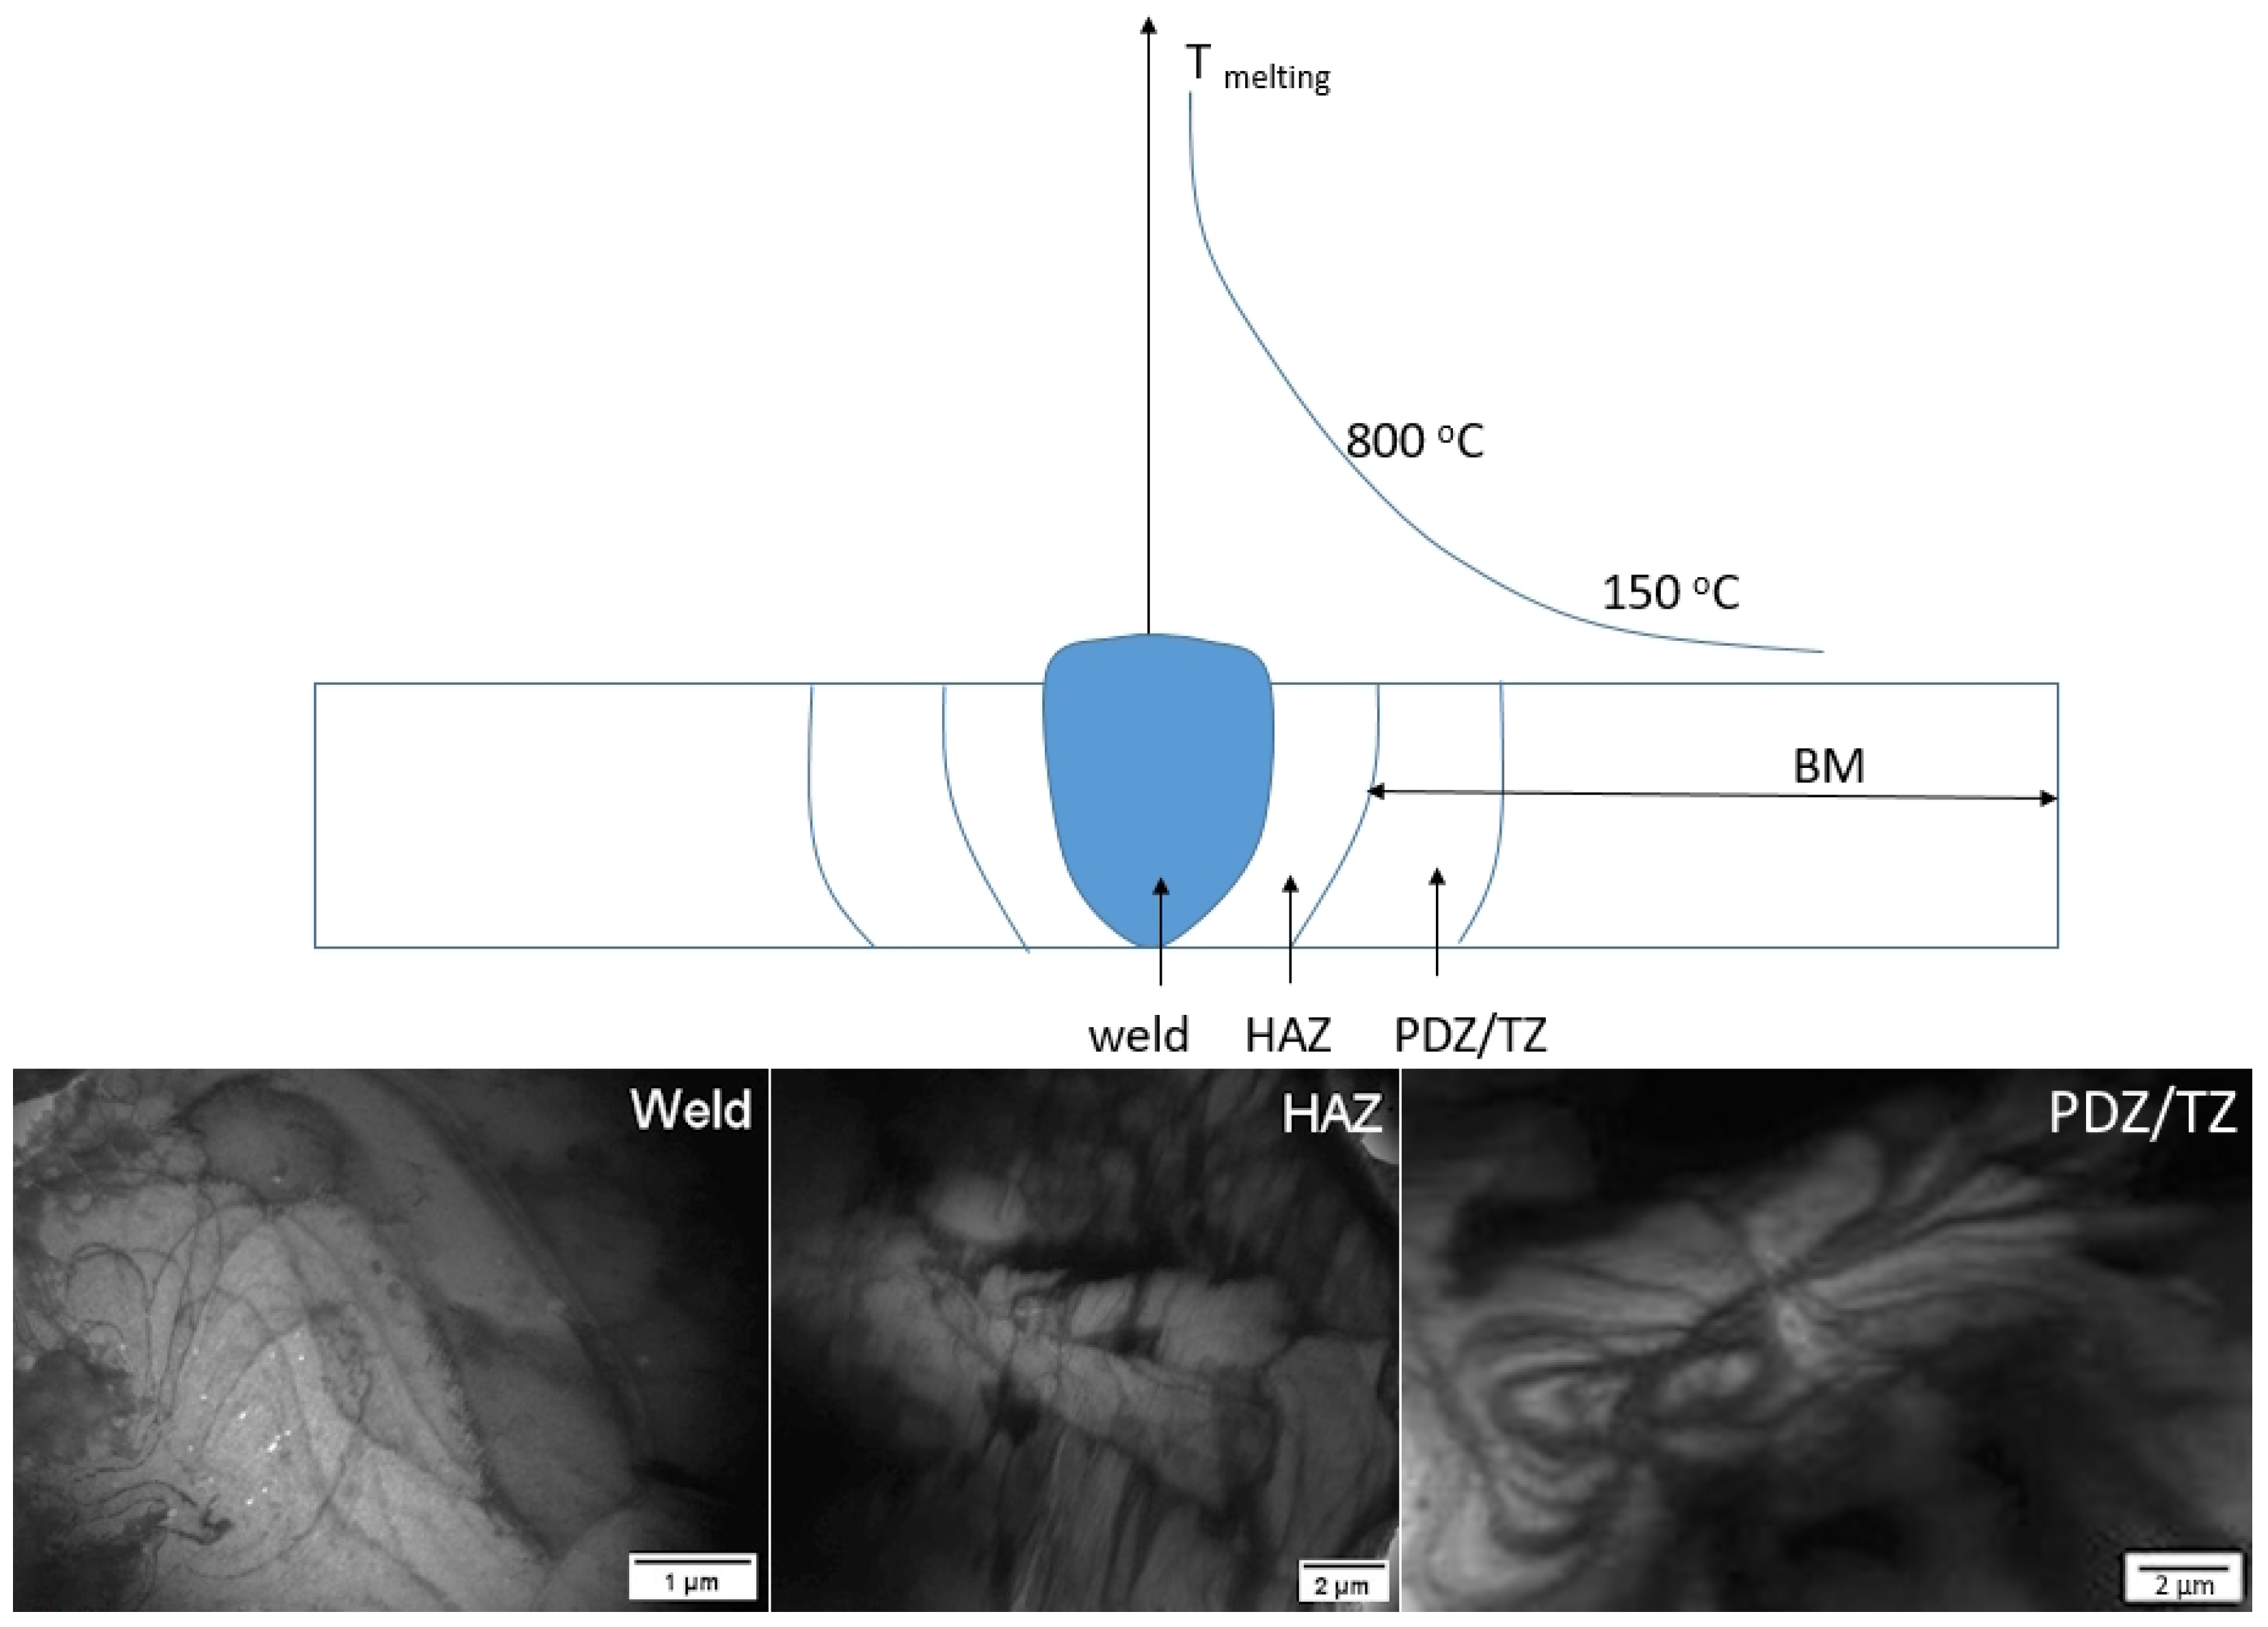
We defined the boundaries of the HAZ after etching as the zone in which structural changes occur. However, the BM located directly adjacent to the HAZ, where no structural changes have occurred, has also undergone thermal effects during and after welding. Therefore, some researchers include this narrow BM zone as part of the HAZ [45]. This BM zone is defined as a plastic deformation zone formed during welding (PDZ) [46] and/or as a tempered zone (TZ) [45]. In this zone, deformation effects from rolling, welding, and tensile testing processes are observed. Figure 22 schematically shows the location of this zone.
TEM images of investigated samples from weld metal, HAZ, and PDZ are presented in Figure 22. In the microstructure of the metal from HAZ and PDZ, a well-developed dislocation structure is observed. The samples were prepared from the original pipe material, which eliminates the presence of dislocations from tensile testing. The accumulation of dislocations in HAZ and PDZ indicates the presence of residual stresses, making these zones more susceptible to failure and explaining material fracture in these regions.
The observed increase in dislocation activity and pile-up formation near M/A constituents and inclusions supports the operation of the HELP mechanism [47]. Conversely, intergranular cracking, planar cleavage facets, and crack propagation along ferrite grain boundaries and ferrite–cementite interfaces indicate the concurrent operation of HEDE-controlled decohesion.
The results therefore demonstrate that HELP and HEDE operate synergistically rather than independently. HELP dominates during the early stages of localized plastic deformation and crack nucleation, whereas HEDE becomes increasingly important during crack propagation under conditions of elevated local hydrogen concentration and stress triaxiality.
Overall, the combined XRD, permeation, fractographic, and TEM results provide a consistent multiscale interpretation of hydrogen-assisted degradation in long-term operated pipeline welded joints. In contrast to previous studies that typically address these aspects separately, the present work demonstrates how weld-specific microstructural heterogeneity, residual-stress-related dislocation structures, non-metallic inclusions, and retained austenite collectively govern hydrogen trapping, diffusion, and crack initiation in different welded regions of the pipeline.

4. Conclusions

The combined X-ray diffraction, electrochemical hydrogen permeation, fractographic, and transmission electron microscopy investigations lead to the following conclusions:
  • The phase composition differs between the investigated regions. The BM and GW consist predominantly of body-centered cubic ferrite ( α -Fe), whereas the PW additionally contains retained austenite ( γ -Fe), as confirmed by both X-ray diffraction and transmission electron microscopy. The presence of retained austenite is associated with the higher manganese content in the PW.
  • Hydrogen transport behavior is strongly governed by the local microstructure. The PW exhibits the lowest apparent hydrogen diffusion coefficient and the highest hydrogen trap density, approximately five to six times greater than those measured in the BM and GW, indicating a much higher density of effective trapping sites in the production weld region.
  • Electrochemical hydrogen charging causes a pronounced increase in brittle fracture behavior. The relative fraction of BFZs increases from approximately 8–11% to 43–53% in PW specimens and from approximately 5% to 26–53% in GW specimens, demonstrating the strong effect of hydrogen on fracture mode transition.
  • A distinct gradient in hydrogen embrittlement susceptibility is observed across the pipe wall thickness. Outer-wall specimens consistently exhibit significantly higher susceptibility than inner-wall specimens, indicating the combined influence of service-induced degradation and hydrogen-assisted damage accumulation.
  • Fracture morphology changes from predominantly ductile MVC in uncharged specimens to QC and crack-dominated fracture after hydrogen charging. The observed differences between PW and GW specimens are related to differences in microstructural heterogeneity, weld geometry, and loading orientation relative to the rolling direction.
  • Transmission electron microscopy reveals a substantial increase in dislocation density after hydrogen charging, particularly in the vicinity of martensite–austenite (M/A) constituents and non-metallic inclusions. These observations confirm strong interactions between hydrogen, dislocations, and local microstructural heterogeneities.
  • A clear size-dependent role of non-metallic inclusions was identified. Sub-micron inclusions (up to approximately 1.1 μm) act predominantly as irreversible hydrogen trapping sites, whereas larger inclusions (above approximately 5.17 μm) serve as preferential crack initiation sites under hydrogen charging conditions. The results indicate that the critical inclusion size for the investigated material system lies within this interval, although its precise value was not quantitatively determined in the present study.

Author Contributions

Conceptualization, B.Y., V.D., R.L., K.V., Y.M.; methodology, B.Y., V.D., K.V., Y.M., R.K., S.V.; software, K.K.; validation, B.Y.; formal analysis, Y.M., K.V., V.D., R.L., R.K., T.S., K.K., S.V.; investigation, B.Y., K.V., Y.M., V.D., R.L., R.K., T.S., K.K., S.V.; resources, K.K., T.S.; data curation, R.L., K.V.; writing—original draft preparation, B.Y., K.K.; writing—review and editing, B.Y., V.D.; visualization, R.K.; supervision, R.L., V.D., K.V., T.S.; project administration, R.L., T.S.; funding acquisition, T.S., R.L. All authors have read and agreed to the published version of the manuscript.

Funding

This research was financially supported by the National Recovery and Resilience Fund (RRF) of Bulgaria (Project PVU-51/BG-RRP-2.017-0022-C02).

Data Availability Statement

The original contributions presented in the study are included in the article, further inquiries can be directed to the corresponding author.

Acknowledgments

The work in this publication was performed using equipment funded by project BG16RFPR002-1.014-0006 “National Center for Mechatronics and Clean Technologies”. We acknowledge Ivaylo Katzarov, Lyudmil Drenchev and Lyudmil Lyutov for the theoretical discussions that contributed to the improvement of this study.

Conflicts of Interest

The authors declare no conflicts of interest.

References

  1. Laureys, A.; Depraetere, R.; Cauwels, M.; Depover, T.; Hertelé, S.; Verbeken, K. Use of existing steel pipeline infrastructure for gaseous hydrogen storage and transport: A review of factors affecting hydrogen induced degradation. J. Nat. Gas Sci. Eng. 2022, 101, 104534. [Google Scholar] [CrossRef]
  2. Bai, J.; Zhang, M.; Ma, H.; Li, Z.; Mao, W.; Li, J.; Zhang, J. Investigation of hydrogen embrittlement in welded joints of the L360MH pipeline steel for hydrogen transportation. Corros. Sci. 2025, 251, 112940. [Google Scholar] [CrossRef]
  3. Li, H.; Niu, R.; Li, W.; Lu, H.; Cairney, J.; Chen, Y.S. Hydrogen in pipeline steels: Recent advances in characterization and embrittlement mitigation. J. Nat. Gas Sci. Eng. 2022, 105, 104709. [Google Scholar] [CrossRef]
  4. Kovács, J.; Lukács, J. Systematic review of factors influencing the integrity of pipeline girth welds exposed to hydrogen. Weld. World 2026, 70, 53–74. [Google Scholar] [CrossRef]
  5. Yanachkov, B.; Valuiska, K.; Mourdjeva, Y.; Krastev, R.; Dyakova, V.; Simeonova, T.; Petrov, R.H.; Kolev, K.; Cauwels, M.; Depover, T.; et al. Investigation of Welded Joints of Pipelines from an Existing Gas Transmission Network Exposed to Hydrogen—Part I: Structure, Mechanical Properties and Susceptibility to Hydrogen Embrittlement. Metals 2026, 16, 388. [Google Scholar] [CrossRef]
  6. Zhang, P.; Laleh, M.; Hughes, A.E.; Marceau, R.K.; Hilditch, T.; Tan, M.Y. A study on hydrogen embrittlement of a high-strength pipeline steel weldment after microstructure manipulation by targeted heat treatments. Int. J. Hydrogen Energy 2025, 97, 1199–1211. [Google Scholar] [CrossRef]
  7. Wang, Y.; Liu, Z.; Zhao, Q.; Zhang, H.; Zhen, Y.; Wu, G.; Cao, Y. The correlation between hydrogen permeation behavior and microstructure in L360QS pipeline steel welded joints. J. Nat. Gas Sci. Eng. 2025, 20, 100925. [Google Scholar]
  8. Yang, Z.; Yang, Z.; Yuan, H.; Zhang, Y.; Xu, K. Hydrogen embrittlement in welded joints of high-strength pipeline steels: A review of mechanisms, characterization, and mitigation strategies. Int. J. Press. Vessel. Pip. 2025, 218, 105615. [Google Scholar] [CrossRef]
  9. Szklarska-Smialowska, Z.; Xia, Z. Hydrogen trapping by cold-worked X-52 steel. Corros. Sci. 1997, 39, 2171–2180. [Google Scholar] [CrossRef]
  10. Chatzidouros, E.V.; Papazoglou, V.J.; Tsiourva, T.E.; Pantelis, D.I. Hydrogen effect on fracture toughness of pipeline steel welds, with in situ hydrogen charging. Int. J. Hydrogen Energy 2011, 36, 12626–12643. [Google Scholar] [CrossRef]
  11. Khalili Tabas, A.A.; Beidokhti, B.; Kiani-Rashid, A.R. Comprehensive study on hydrogen induced cracking of electrical resistance welded API X52 pipeline steel. Int. J. Hydrogen Energy 2021, 46, 1012–1022. [Google Scholar] [CrossRef]
  12. Capelle, J.; Dmytrakh, I.; Azari, Z.; Pluvinage, G. Evaluation of electrochemical hydrogen absorption in welded pipe with steel API X52. Int. J. Hydrogen Energy 2013, 38, 14356–14363. [Google Scholar] [CrossRef]
  13. Souza, R.C.; Pereira, L.R.; Starling, L.M.; Pereira, J.N.; Simões, T.A.; Gomes, J.A.C.P.; Bueno, A.H.S. Effect of Microstructure on Hydrogen Diffusion in Weld and API X52 Pipeline Steel Base Metals under Cathodic Protection. Int. J. Corros. 2017, 2017, 4927210. [Google Scholar] [CrossRef]
  14. Buck, Z.; Moser, N.; Derimow, N.; Martin, M.L.; Lauria, D.; Lucon, E.; Stalheim, D.; Bradley, P.; Connolly, M. Assessing girth weld quality of pipeline steels and their susceptibility to hydrogen embrittlement. Presented at the 34th International Ocean and Polar Engineering Conference, Rhodes, Greece, 16–21 June 2024. [Google Scholar]
  15. Vega, O.E.; Villagómez, A.; Hallen, J.M.; Contreras, A. Sulphide stress corrosion cracking of multiple welding repairs of girth welds in line pipe. Corros. Eng. Sci. Technol. 2009, 44, 55–62. [Google Scholar] [CrossRef]
  16. Forero, A.B.; Ponciano, J.A.C.; Bott, I.S. Susceptibility of pipeline girth welds to hydrogen embrittlement and sulphide stress cracking. Mater. Corros. 2012, 65, 531–541. [Google Scholar] [CrossRef]
  17. ISO 17081:2014; Method of Measurement of Hydrogen Permeation and Determination of Hydrogen Uptake and Transport in Metals by an Electrochemical Technique. ISO: Geneva, Switzerland, 2014.
  18. Devanathan, M.A.V.; Stachurski, Z. The adsorption and diffusion of electrolytic hydrogen in palladium. Proc. R. Soc. Lond. A 1962, 270, 90–102. [Google Scholar] [CrossRef]
  19. Ungár, T.; Borbély, A. The effect of dislocation contrast on x-ray line broadening: A new approach to line profile analysis. Appl. Phys. Lett. 1996, 69, 3173–3175. [Google Scholar] [CrossRef]
  20. Takaki, S.; Kawasaki, K.; Kimura, Y.; Masumura, T.; Tsuchiyama, T. Dislocation Characterization by the Direct-fitting/modified Williamson–Hall (DF/mWH) Method in Cold Worked Ferritic Steel. ISIJ Int. 2019, 59, 567–574. [Google Scholar] [CrossRef]
  21. Sun, Y.; Zhao, M.; Liu, Q. Hydrogen-assisted cracking behavior of pearlitic regions in ferritic pipeline steels. Corros. Sci. 2022, 205, 110451. [Google Scholar] [CrossRef]
  22. Birnbaum, H.K.; Sofronis, P. Hydrogen-enhanced localized plasticity—A mechanism for hydrogen-related fracture. Mater. Sci. Eng. A 1994, 176, 191–202. [Google Scholar] [CrossRef]
  23. Troiano, A.R. The role of hydrogen and other interstitials in the mechanical behavior of metals. Trans. ASM 1960, 52, 54–80. [Google Scholar] [CrossRef]
  24. Dyakova, V.; Yanachkov, B.; Valuiska, K.; Mourdjeva, Y.; Krastev, R.; Simeonova, T.; Kolev, K.; Lazarova, R.; Katzarov, I. The Impact of Hydrogen Charging Time on Microstructural Alterations in Pipeline Low-Carbon Ferrite–Pearlite Steel. Metals 2025, 15, 1079. [Google Scholar] [CrossRef]
  25. Robertson, I.M.; Sofronis, P.; Nagao, A.; Martin, M.L.; Wang, S.; Gross, D.W.; Nygren, K.E. Hydrogen embrittlement understood. Metall. Mater. Trans. B 2015, 46, 1085–1103. [Google Scholar] [CrossRef]
  26. Mohtadi-Bonab, M.; Masoumi, M. Different aspects of hydrogen diffusion behavior in pipeline steel. J. Mater. Res. Technol. 2023, 24, 4762–4783. [Google Scholar] [CrossRef]
  27. Zvirko, O.; Nykyforchyn, H.; Krechkovska, H.; Tsyrulnyk, O.; Hredil, M.; Venhryniuk, O.; Tsybailo, I. Evaluating hydrogen embrittlement susceptibility of operated natural gas pipeline steel intended for hydrogen service. Eng. Fail. Anal. 2024, 163, 108472. [Google Scholar] [CrossRef]
  28. Konert, F.; Campari, A.; Nietzke, J.; Sobol, O.; Paltrinieri, N.; Alvaro, A. Evaluation of the tensile properties of X65 pipeline steel in compressed gaseous hydrogen using hollow specimens. Procedia Struct. Integr. 2024, 54, 204–211. [Google Scholar] [CrossRef]
  29. Fu, A.; Zhang, Z.; Wang, C.; Wang, Y.; Qin, G. Failure analysis of pipelines containing a crack-in-corrosion defect considering hydrogen-induced degradation. Int. J. Hydrogen Energy 2025, 154, 150302. [Google Scholar] [CrossRef]
  30. Gong, K.; Sun, D.; Liu, X.; Li, J.; Wu, M.; Hu, M. Effects of hydrogen and strain rate on stress corrosion cracking mechanism of high strength pipeline steel. Mater. Today Commun. 2025, 44, 112172. [Google Scholar] [CrossRef]
  31. Kryzhanivs’kyi, E.I.; Nykyforchyn, H.M. Specific features of hydrogen-induced corrosion degradation of steels of gas and oil pipelines and oil storage reservoirs. Mater. Sci. 2011, 47, 127–136. [Google Scholar] [CrossRef]
  32. Liu, H.; Cheng, Y.F. Corrosion of initial pits on abandoned X52 pipeline steel in a simulated soil solution containing sulfate-reducing bacteria. J. Mater. Res. Technol. 2020, 9, 7180–7189. [Google Scholar] [CrossRef]
  33. Peng, F.; Feng, Z.; Zhao, Y.; Long, J. A novel reticular retained austenite on the weld fusion line of low carbon martensitic stainless steel 06Cr13Ni4Mo and the influence on the mechanical properties. Metals 2022, 12, 432. [Google Scholar] [CrossRef]
  34. Abbasi, E.; Rainforth, W.M. Effect of NbMo addition on the precipitation behaviour of V microalloyed steel during intercritical annealing. Mater. Sci. Technol. 2018, 34, 955–965. [Google Scholar]
  35. Chan, S.L.I.; Lee, H.L.; Yang, J.R. Effect of retained austenite on the hydrogen content and effective diffusivity of martensitic structure. Metall. Trans. A 1991, 22, 2579–2586. [Google Scholar] [CrossRef]
  36. Kim, S.; Park, J.; Lee, C. Role of retained austenite in hydrogen trapping and diffusion in advanced steels. Acta Mater. 2022, 223, 117465. [Google Scholar] [CrossRef]
  37. Moreno, D.; Ruiz, E.; Calderon, J. Hydrogen partitioning and trapping at retained austenite in welded low-alloy steels. Mater. Charact. 2024, 208, 113521. [Google Scholar]
  38. Zhang, J.; Wu, X.; Li, P. Hydrogen trapping and permeation behavior in welded regions of X70 pipeline steel. Mater. Sci. Eng. A 2023, 878, 145287. [Google Scholar] [CrossRef]
  39. Oriani, R.A. The diffusion and trapping of hydrogen in steel. Acta Metall. 1970, 18, 147–157. [Google Scholar] [CrossRef]
  40. Peng, Z.; Liu, J.; Huang, F.; Hu, Q.; Cao, C.; Hou, S. Comparative study of non-metallic inclusions on the critical size for HIC initiation and its influence on hydrogen trapping. Int. J. Hydrogen Energy 2020, 45, 12616–12628. [Google Scholar] [CrossRef]
  41. Qin, W.; Szpunar, J.A. Uncovering the origin of critical hydrogen concentration for initiation of hydrogen-induced cracking and its relation to inclusion type and size. J. Mater. Res. Technol. 2023, 27, 3797–3802. [Google Scholar] [CrossRef]
  42. Alcántara Alza, V.; Pelaez Chavez, V. TRIP Steels: Factors influencing their formation, mechanical properties and microstructure—A review. IOSR J. Mech. Civ. Eng. 2022, 19, 37–60. [Google Scholar]
  43. He, B.; Huang, M.X. Martensite enables the formation of complex nanotwins in a medium Mn steel. Metall. Mater. Trans. A 2020, 51, 1960–1966. [Google Scholar] [CrossRef]
  44. Allain, S.; Chateau, J.P.; Bouaziz, O.; Migot, S.; Guelton, N. Correlations between the calculated stacking fault energy and the plasticity mechanisms in Fe–Mn–C alloys. Mater. Sci. Eng. A 2004, 387–389, 158–162. [Google Scholar] [CrossRef]
  45. Martin, J.W. Materials for Engineering, 3rd ed.; Woodhead Publishing: Cambridge, UK, 2006. [Google Scholar] [CrossRef]
  46. Michailov, V.; Karkhin, V.; Petrov, P. Principles of Welding; Polytechnic University Publishing: St. Petersburg, Russia, 2016. [Google Scholar]
  47. Chen, X.; Li, Y.; Wang, Z. Synergistic action of hydrogen-enhanced localized plasticity and decohesion in pipeline steels. Int. J. Hydrogen Energy 2023, 48, 15621–15637. [Google Scholar]
Figure 1. Schematic representation of the sampling locations and orientations of the PW and GW specimens relative to the gas pipeline (a) and through the pipe wall thickness (b). Position 1 corresponds to the outer wall, whereas position 2 corresponds to the inner wall (bore side).
Metals 16 00573 g001
Figure 2. Geometry and orientation of the tensile test specimens extracted from the PW (a) and GW (b), showing the rolling direction (RD), loading direction (LD), and transverse direction (TD).
Metals 16 00573 g002
Figure 3. ABFS of an uncharged specimen containing a GW: (a) cracks and microvoids; (b) crack propagation perpendicular to the cementite lamellae; (c) crack propagation parallel to the cementite lamellae. The fracture surface is on the right side of each picture. Cracks and microvoids are indicated by white arrows.
Metals 16 00573 g003
Figure 4. ABFS of an uncharged specimen containing a PW: (a) depressions with relatively smooth and rounded walls (pre-existing defects)—highlighted by red circles; (b) cracks within ferrite grains and microvoids in the ferrite phase and along ferrite–pearlite interfaces; (c) intergranular cracks. The fracture surface is on the right side of each picture. Cracks and microvoids are indicated by white arrows.
Metals 16 00573 g004
Figure 5. ABFS of a hydrogen-charged specimen containing a GW: (a) non-equiaxed grain structure in the HAZ; (b) densely distributed microvoids and cracks; (c) intergranular crack along a ferrite grain boundary, indicating decohesion. The fracture surface is on the right side of each picture. Cracks and microvoids are indicated by white arrows.
Metals 16 00573 g005
Figure 6. ABFS of a hydrogen-charged specimen containing a PW: (a) elongated microstructure associated with directional solidification during welding; (b) region with a low density of defects, characterized by small and sparsely distributed microvoids. The fracture surface is on the right side of each picture. Microvoids are indicated by white arrows.
Metals 16 00573 g006
Figure 7. Fractured surfaces of tensile-tested specimens with PW: (a) General view of the fractured surface of PW-1; (b) General view of the fractured surface of PW-2 (c) MVC ductile region and isolated QC zones in PW-1; (d) MVC ductile region and isolated QC zones in PW-2.
Metals 16 00573 g007
Figure 8. Fractured surfaces of tensile-tested specimens with GW. (a) General view of the fractured surface of GW-1; (b) General view of the fractured surface of GW-2; (c) MVC and QC zones in GW-1; (d) MVC and QC zones in GW-2, fracture showing cracks on the smooth void walls.
Metals 16 00573 g008
Figure 9. Fractured surfaces of hydrogen-charged tensile tested specimens with PW. (a) General view of the fractured surface of PW-1H; (b) General view of the fractured surface of PW-2H; (c) Transgranular cracks (TG), intergranular (IC) and longitudinal (LC) cracks oriented along the RD in PW-1H; (d) TG cracks in PW-1H; (e) QC facets and planar cleavage facets near the specimen edges in PW-2H; (f) longitudinal (LC) and transgranular cracks.
Metals 16 00573 g009
Figure 10. Fractured surfaces of hydrogen-charged tensile-tested specimens with GW: (a) General view of the fractured surface of GW-1H; (b) General view of the fractured surface of GW-2H; (c) IC, TG, and LC cracks in GW-1; (d) QC and planar cleavage facets near the edge of the specimen GW-1H; (e,f) GW-2H fracture details—intergranular (IC) and transgranular (TG) cracks.
Metals 16 00573 g010
Figure 11. Data for the average values of relative fractions of BFZ in the fracture surfaces of PW and GW specimens before and after hydrogen charging. Yellow solid fill: uncharged; hatched orange fill: hydrogen-charged specimens.
Metals 16 00573 g011
Figure 12. Data for the average values of hydrogen embrittlement susceptibility (HES) indices of PW and GW specimens from the outer (1) and inner (2) pipe wall positions, calculated using Equation (1).
Metals 16 00573 g012
Figure 15. Normalized hydrogen permeation transients J ( t ) / J as a function of time for the BM, PW, and GW specimens (first transient, T1).
Metals 16 00573 g015
Figure 16. Comparison of hydrogen transport parameters for the three specimen types (first transient, T1): (a) apparent diffusion coefficient D app ; (b) total hydrogen trap density N T . The dotted line in (a) indicates the lattice diffusion coefficient for BCC iron at 25 °C ( D L = 7.30 × 10 9 m2 s−1). All values were derived from the time-lag method (ISO 17081:2014 [17]).
Metals 16 00573 g016
Figure 17. TEM images of the microstructure of welded joints after long-term service of the pipe: (a,b) PW; (c,d) GW.
Metals 16 00573 g017
Figure 18. TEM images of the microstructure of welded joints after additional hydrogen charging: (a) PW-H; (b) GW-H.
Metals 16 00573 g018
Figure 19. TEM images of the microstructure of welded joints of the pipe: (a) PW; (b,c) GW; (d) corresponding SAED pattern of the marked area in (c).
Metals 16 00573 g019
Figure 20. TEM images of the microstructure of welded joints after long-term service of the pipe: (a,b) PW; (c,d) GW.
Metals 16 00573 g020
Figure 21. TEM images of the microstructure of welded joints (PW-H) after additional hydrogen charging. (a) Dislocation lines are observed looping around M/A zones, (b) Dislocation lines are observed accumulating as pile-ups at M/A interfaces.
Metals 16 00573 g021
Figure 22. Schematic representation of the thermal gradient and characteristic welding zones in pipeline welded joints (PW and GW), with representative TEM images of the corresponding structures.
Metals 16 00573 g022
Table 1. Chemical composition (wt.%) of the investigated pipeline steel in the BM, PW, and GW Reprinted from Ref. [5].
MaterialCSiMnSPCrCuNi
BM0.1330.481.300.0160.0140.020.070.03
PW0.1110.661.460.0160.0170.260.080.075
GW0.0920.431.030.0110.0190.040.060.04
Table 2. Calculated microstrain values for the three investigated regions of the pipeline steel.
RegionMicrostrain ε
BM0.0013
GW0.0028
PW0.0046
Table 3. Summary of hydrogen permeation parameters derived from the first transient (T1) for the BM, PW, and GW specimens. All values obtained by the time-lag method in accordance with ISO 17081:2014. Uncertainties are propagated from primary measurement errors: thickness δ L / L = 2 % , exposed area δ A / A = 1.5 % , time-lag δ t lag / t lag = 3 % , and current δ I / I = 1 % .
Specimen D app ± 5 %
(m2 s−1)
J SS ± 2 %
(mol m−2 s−1)
C 0 ± 6 %
( × 10 6 mol cm−3)
N T ± 8 %
(m−3)
BM 1.71 × 10 10 6.71 × 10 8 0.412 3.44 × 10 24
PW 6.57 × 10 11 4.76 × 10 8 0.761 1.68 × 10 25
GW 1.86 × 10 10 5.88 × 10 8 0.333 2.56 × 10 24
Disclaimer/Publisher’s Note: The statements, opinions and data contained in all publications are solely those of the individual author(s) and contributor(s) and not of MDPI and/or the editor(s). MDPI and/or the editor(s) disclaim responsibility for any injury to people or property resulting from any ideas, methods, instructions or products referred to in the content.