Article

Tailoring Thermal Conductivity and Strength of Al-Si-Fe Alloys via Cu Micro-Alloying: Mechanisms and Modeling

1
State Key Laboratory of Materials Processing and Die & Mould Technology, Huazhong University of Science and Technology, Wuhan 430074, China
2
Chinalco Materials Application Research Institute Co., Ltd., Suzhou Branch, Suzhou 215000, China
3
Sino-French Engineer School, Nanjing University of Science and Technology, Nanjing 210094, China
4
LERMAB, IUT H Poincaré de Longwy, University of Lorraine, 168 Rue de Lorraine, Cosnes et Romain, 54400 Longwy, France
5
LaBoMaP, Arts et Métiers Institute of Technology, Université Bourgogne Franche-Comté, HESAM Université, Rue Porte de Paris, 71250 Cluny, France
6
INRAE, LERMaB, Université de Lorraine, 88000 Epinal, France
7
Guangdong Hongtu (Nantong) Die-Casting Co., Ltd., Nantong 226300, China
*
Authors to whom correspondence should be addressed.
These authors contributed equally to this work.
Metals 2026, 16(5), 501; https://doi.org/10.3390/met16050501
Submission received: 24 March 2026 / Revised: 23 April 2026 / Accepted: 29 April 2026 / Published: 3 May 2026

Abstract

The influence of Cu content on the thermal conductivity and mechanical properties of Al-9Si-0.7Fe casting alloy were investigated in this paper. The results show that as the Cu content increases from 0.1 wt.% to 2.0 wt.%, the thermal conductivity of the alloy decreases from 173.6 W/(m·K) to 154.8 W/(m·K), while the yield strength increases from 72.2 MPa to 90.9 MPa. Metallographic, XRD, and EPMA analyses revealed that Cu has a relatively small impact on the secondary dendrite arm spacing of α-Al and the morphology of eutectic silicon. Its influence on the thermal conductivity and mechanical properties primarily stems from Cu atoms dissolving in the α-Al matrix, leading to a decreased lattice constant, increased lattice distortion, enhanced electron scattering, and improved solid solution strengthening effect. Based on the measured solubility of Cu, the Maxwell and Hashin–Shtrikman thermal conductivity models were modified. The correlation coefficients between the predicted values of the modified models and the experimental data were 92.77% and 93.11%, respectively, indicating a significant improvement in prediction accuracy.

1. Introduction

The rapid advancement of high-performance computing, 5G communication, and electric vehicle technologies has led to a dramatic increase in the power density of electronic devices and components. Consequently, efficient heat dissipation has become a critical bottleneck affecting device reliability, performance, and service life. Aluminum alloys are extensively employed in thermal management applications due to their excellent combination of high thermal conductivity, low density, good corrosion resistance, and favorable castability [1,2,3,4].
Al-Si-based casting alloys represent the most widely used family of aluminum alloys for manufacturing heat dissipation components, primarily owing to their superior fluidity, low shrinkage porosity, and high specific strength. Alloying and microstructural control are effective strategies for optimizing the trade-off between mechanical and thermal properties of Al-Si alloys. Various alloying elements, including Cu, Mg, Mn, and Sr, have been investigated to improve the strength of Al-Si alloys through solid-solution strengthening and precipitation strengthening. Nevertheless, most solute atoms and secondary phases inevitably degrade thermal conductivity by increasing electron scattering. Therefore, selecting appropriate alloying elements that maximize strengthening effects while minimizing thermal conductivity loss is crucial for designing high-performance heat sink materials. The addition of a small amount of copper (Cu) to Al-Si cast alloys can induce solid-solution strengthening and dispersion strengthening, thereby improving the yield strength, tensile strength, and machinability of the alloys without compromising their castability [5,6,7,8,9]. A comparative study on the influence of various alloying elements on the electrical conductivity of pure aluminum shows that the magnitude of Cu’s effect on the electrical conductivity of pure aluminum is significantly lower than that of other major alloying elements (e.g., Si, Fe, Mg) [10,11,12,13,14,15]. Given that both electrical and thermal conduction in metals are dominated by the motion of free electrons, it is reasonable to infer that Cu also has a limited impact on the thermal conductivity of aluminum alloys. Therefore, this study proposes to incorporate Cu, a strengthening element with a low impact on thermal conductivity, into the conventional Al-Si-Fe alloy system. The regularities and underlying mechanisms of how varying Cu contents affect the thermal conductivity and mechanical properties of the alloy were systematically investigated, aiming to provide technical support for the development of new high-strength and high-thermal conductivity die-cast aluminum alloys.
Based on the classic Maxwell and Hashin–Shtrikman (H-S) models, this study introduces the solid solubility of Cu in the Al matrix as a key influencing factor to achieve a more accurate prediction of the thermal conductivity of the alloy. By incorporating the effect of Cu solubility into the models and comparing the predicted results with experimental data, it is confirmed that taking the Cu solubility into account can effectively improve the prediction accuracy of the models, making them more applicable to practical cast Al–Si–Cu alloy systems.

2. Materials and Methods

Using high-purity aluminum (99.99 wt.%), an iron additive (75 wt.% Fe), and master alloys of Al-10Si, Al-50Cu, and Al-10Sr as raw materials, nine groups of Al-9Si-0.7Fe-xCu alloys (x = 0.1, 0.2, 0.3, 0.5, 0.7, 0.9, 1.2, 1.5, 2.0 wt.%) were prepared in a crucible melting furnace (Jinlitai Co., Ltd., Dongguan, China). The Al-10Sr master alloy was used as an eutectic silicon modifier, added at a temperature of 720–730 °C with an additional amount of 200–300 ppm. The molten alloy was degassed and refined with high-purity argon for 10–20 min, followed by slag removal and holding for 10–15 min. Finally, the molten alloy was poured into a preheated metal mold to cast ingots, with five parallel samples cast for each alloy group. The pouring temperature was controlled at 700–710 °C, and the mold preheating temperature was 150–180 °C. The average cooling rate during solidification was estimated to be approximately 1.5 °C/s. The sample preparation process is shown in Figure 1. The designed and measured chemical compositions of each alloy are presented in Table 1. The actual chemical compositions of the cast alloys were determined by optical emission spectrometry (OES) (Thermo Fisher Scientific, Basel, Switzerland).
For each alloy composition, three parallel samples were tested, and each sample was measured three times. Samples were taken from the same position in each ingot. The results are reported as the mean ± standard deviation (SD). The room temperature mechanical properties were tested using a WDW3200 universal testing machine (Guangjing Precision Instrument Co., Ltd., Guangzhou, China), and the room temperature thermal conductivity was measured with a Netzsch LFA467 laser flash apparatus (Netzsch, Selb, Germany). The typical measurement uncertainty of LFA467 was approximately ±5% for thermal conductivity values in the range of 100–200 W/(m·K). Standard metallographic samples were prepared, and the microstructure was observed and analyzed using an OLYMPUS GX51 metallographic microscope (Olympus Corporation, Tokyo, Japan) and a JEOL JSM6480 scanning electron microscope (SEM) (JEOL Ltd., Tokyo, Japan). The phase composition of the alloys was identified via an Empyream X-ray diffractometer (XRD) (Malvern Panalytical, Almelo, The Netherlands), and the lattice constant of the Al matrix in each sample was calculated using Fullprof software (Version 2025). The solid solubility of Cu in the α-Al matrix of each alloy was determined with a SHIMADZU EPMA-1720 electron probe microanalyzer (EPMA) (Shimadzu Corporation, Kyoto, Japan).

3. Results

3.1. Microstructural Analysis of Al-9Si-0.7Fe-xCu Alloys

  • Statistical results of secondary dendrite arm spacing (SDAS)
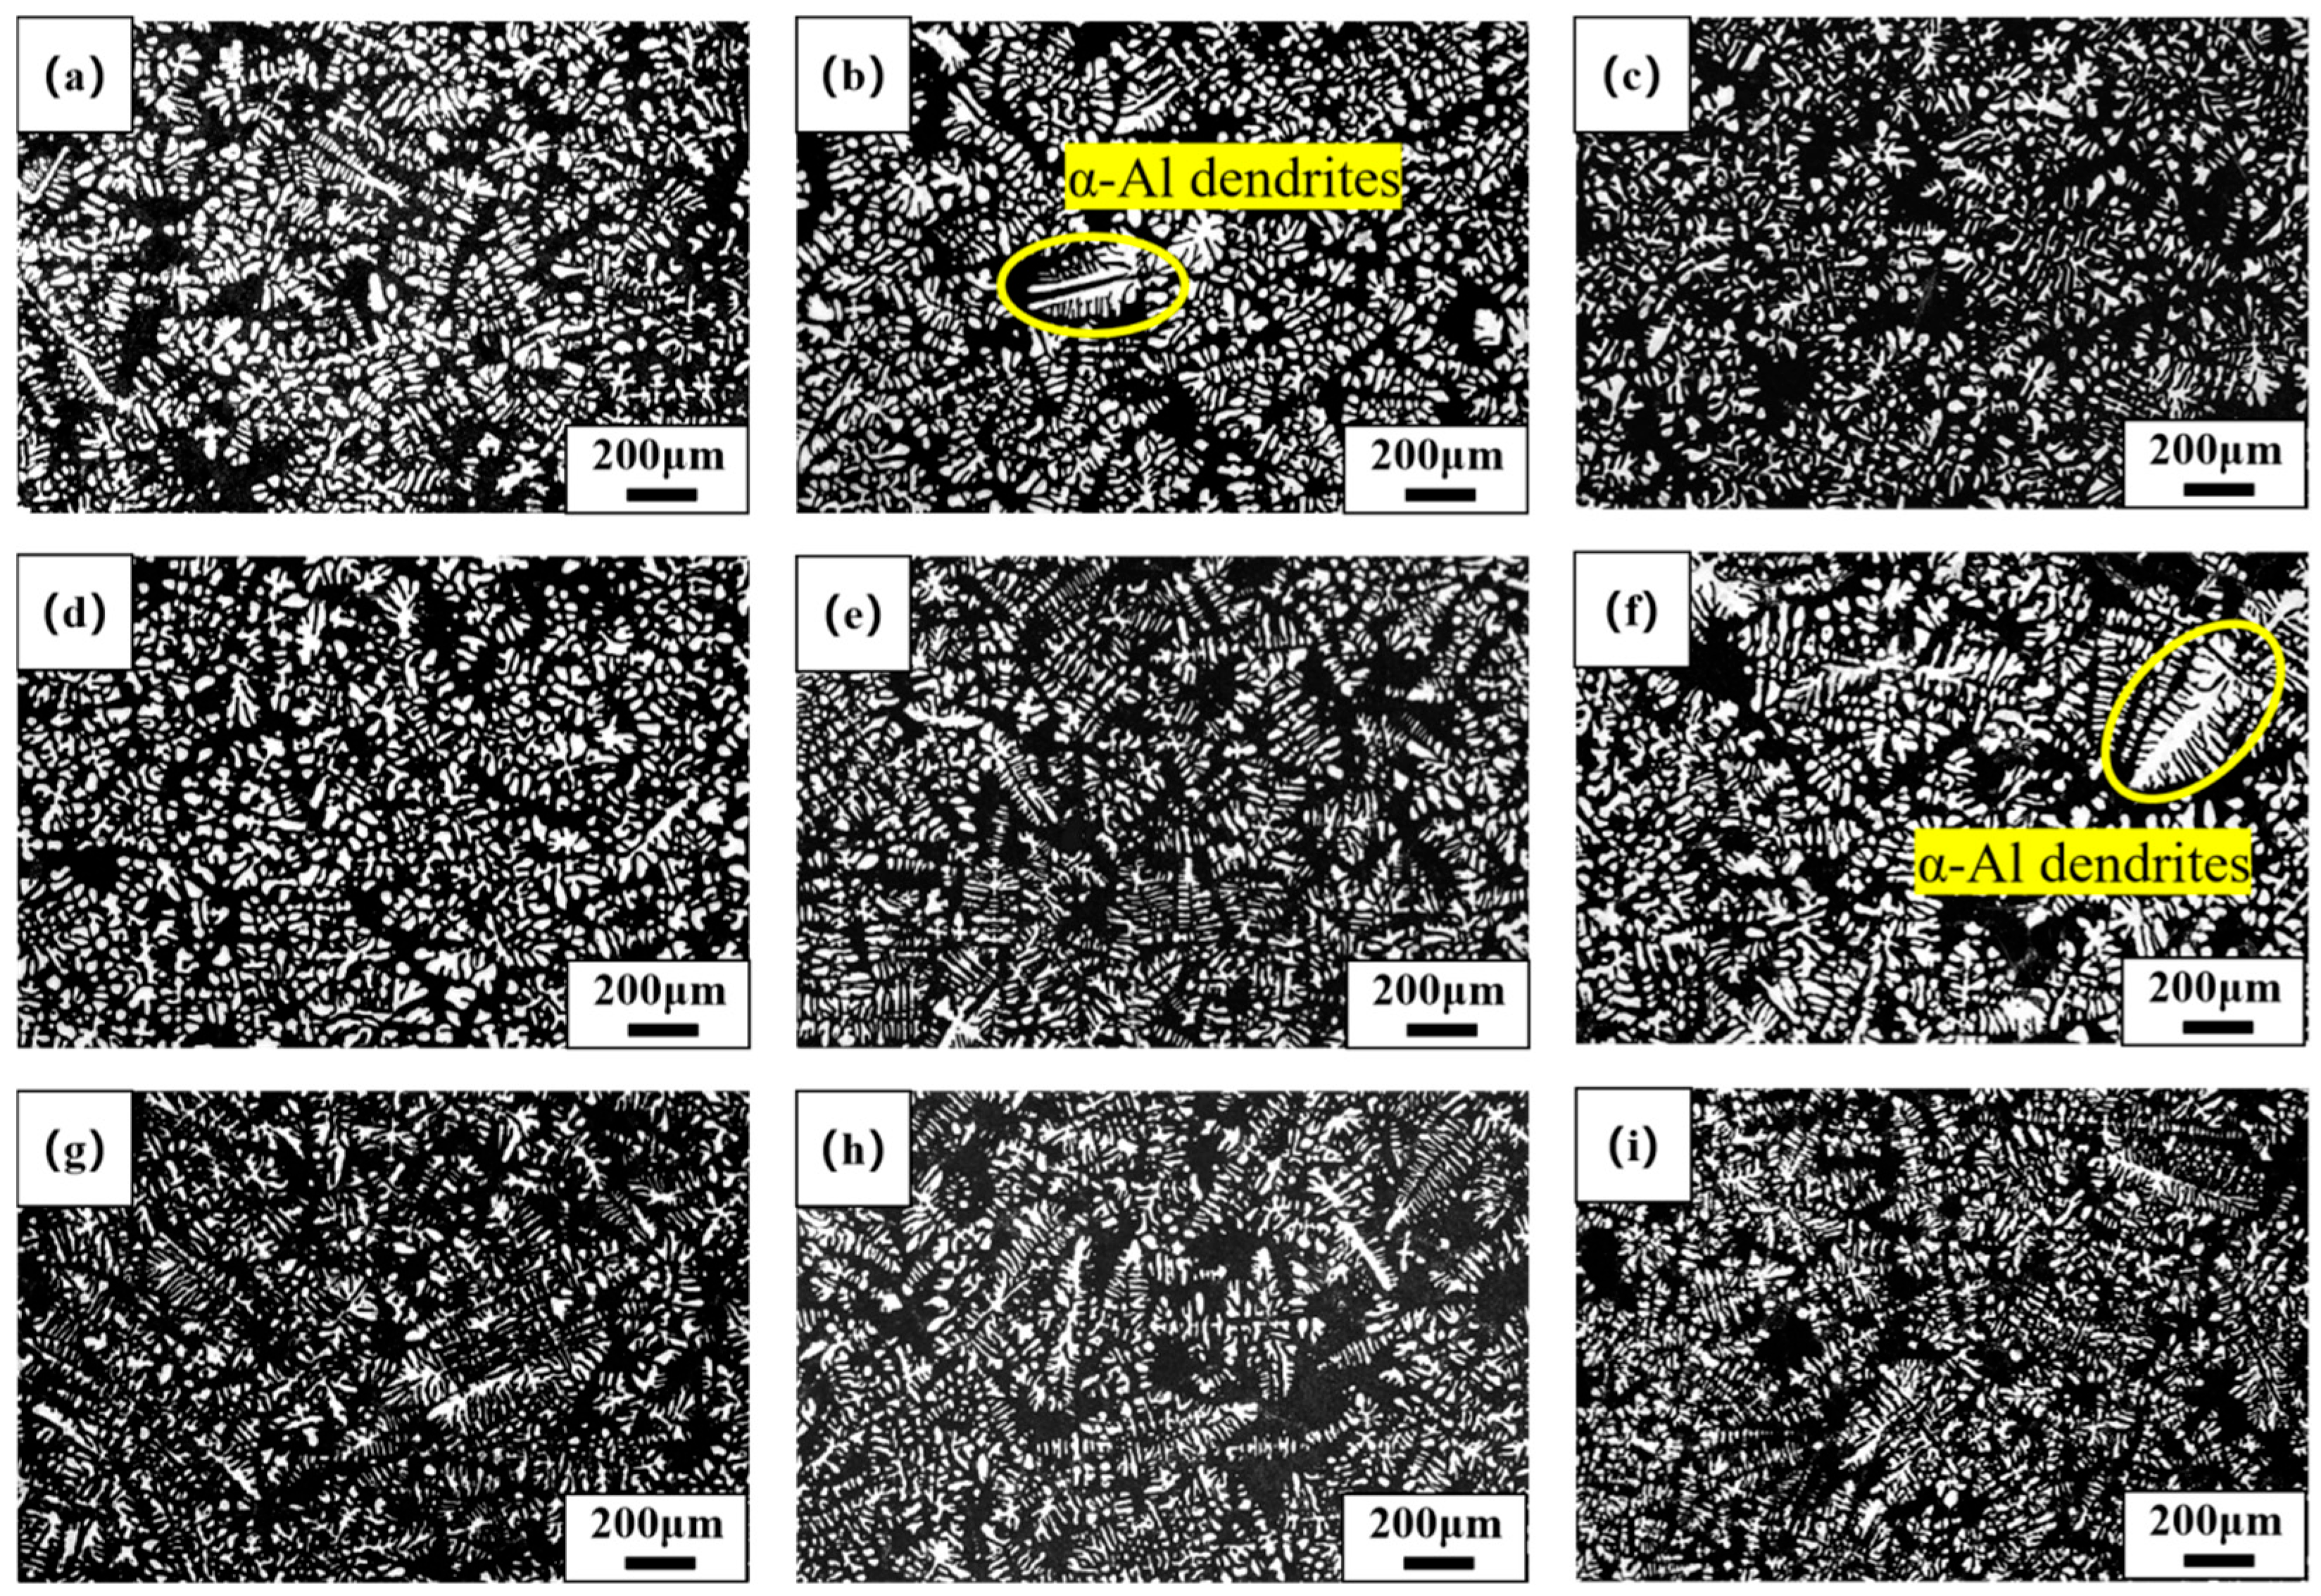
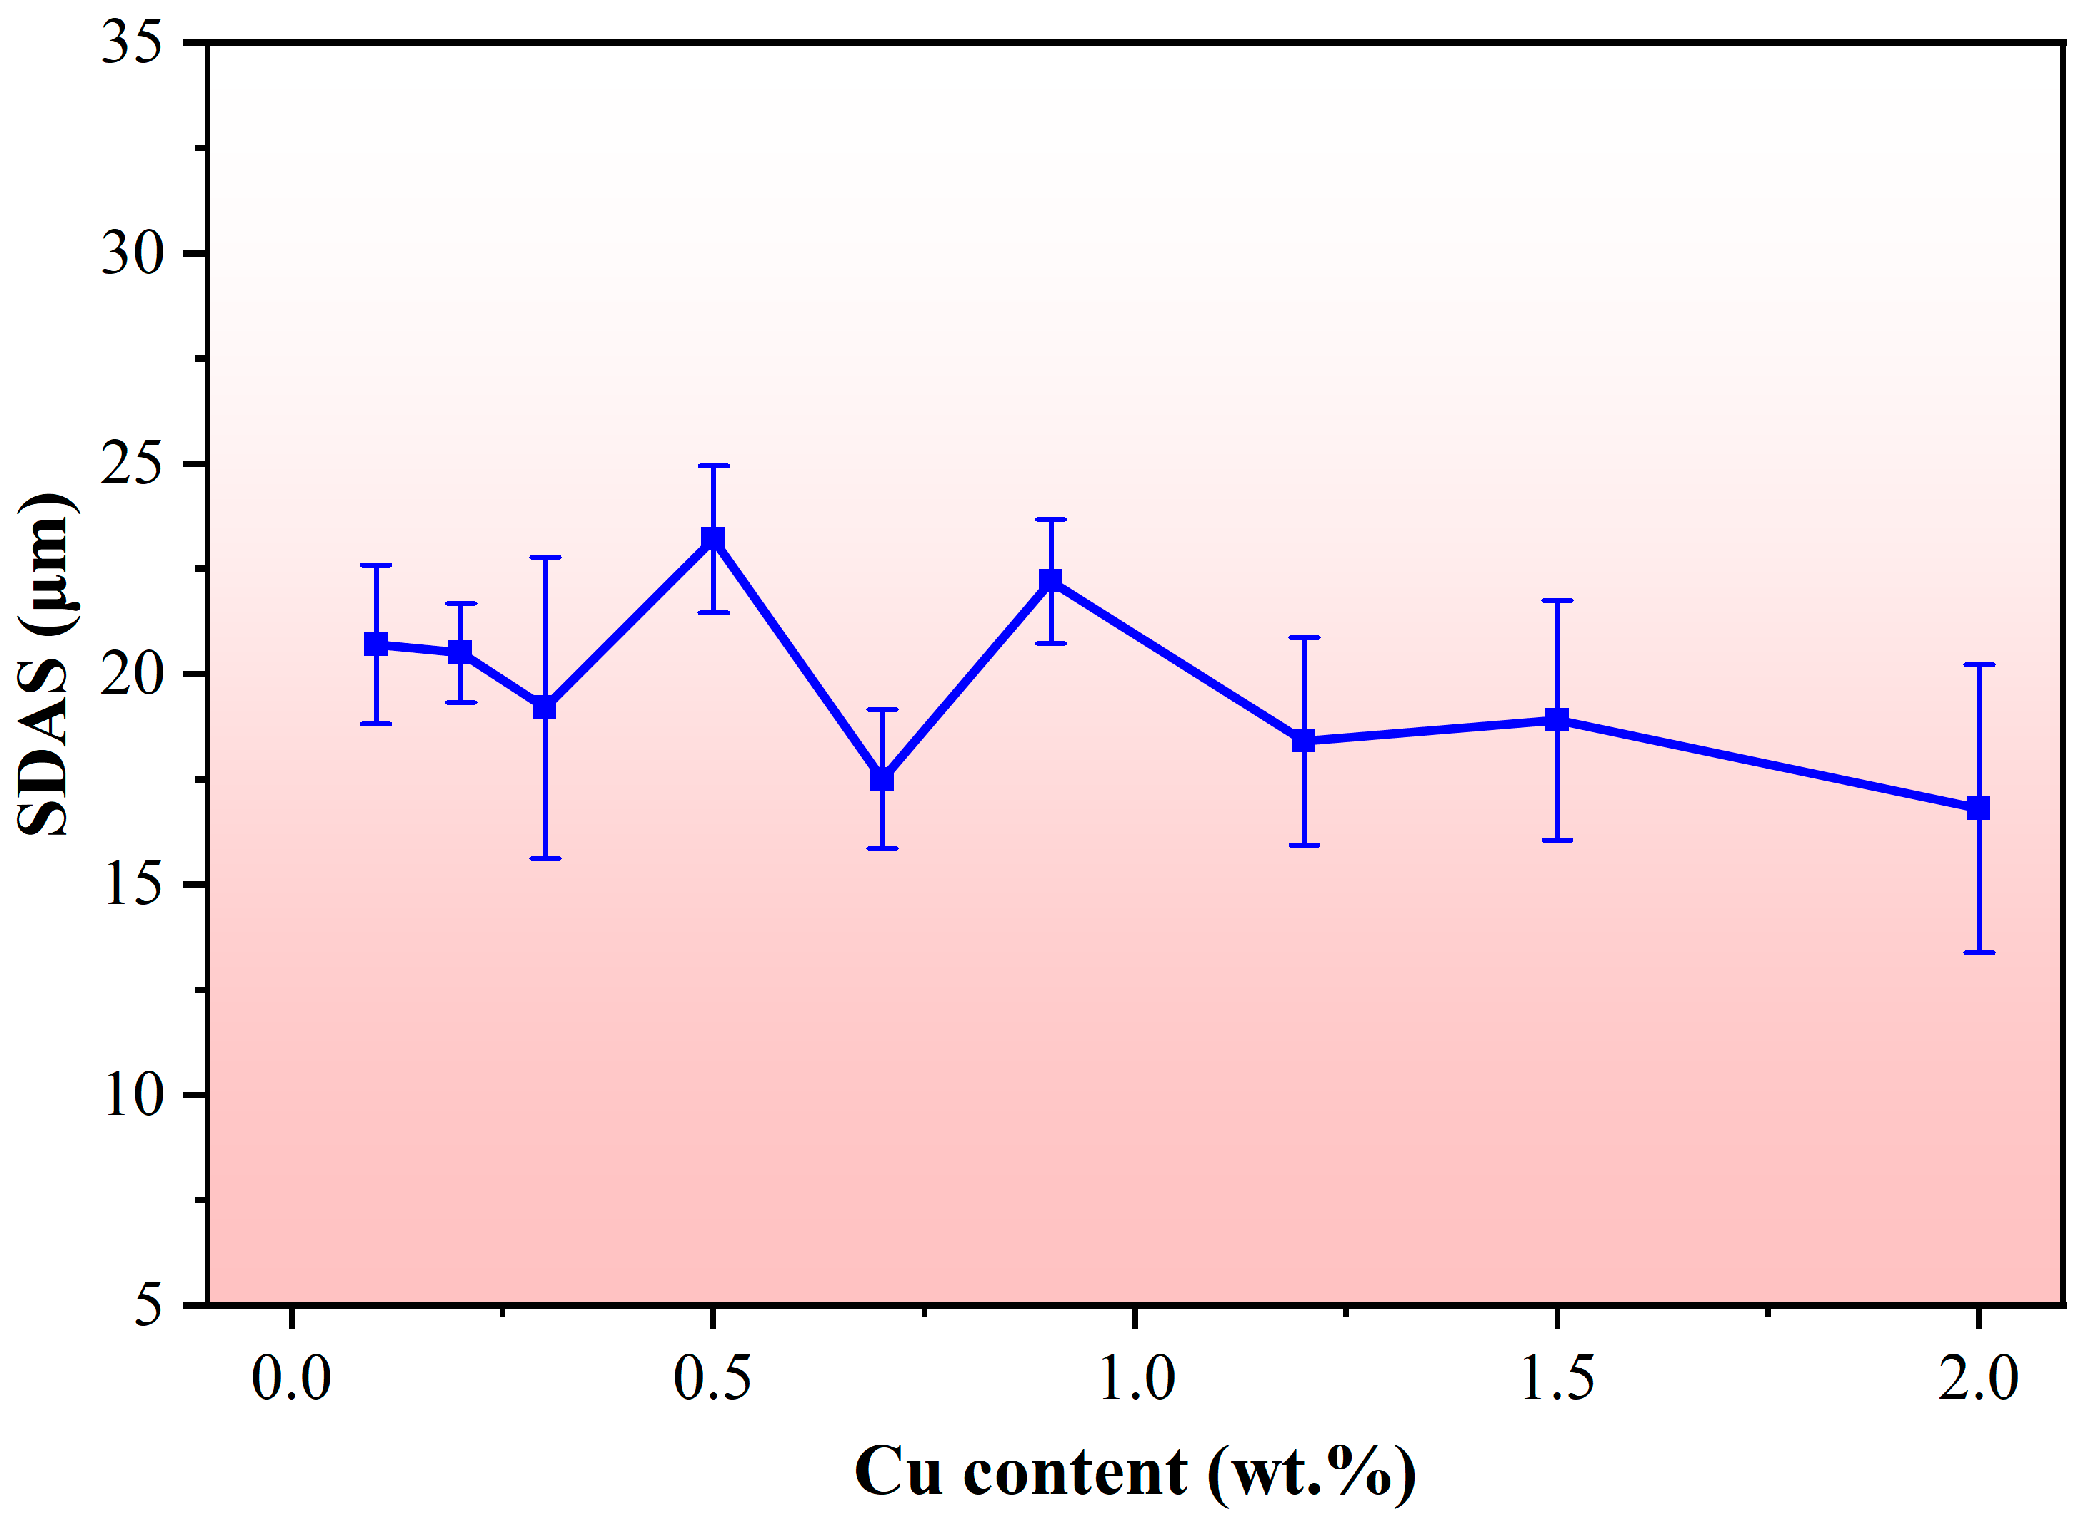
The metallographic micrographs of the Al-9Si-0.7Fe-xCu alloys (x = 0.1~2.0) are shown in Figure 2, exhibiting a typical as-cast dendritic structure with well-developed α-Al dendrites, interlaced dendrite arms, and a moderate secondary dendrite arm spacing (SDAS). The SDAS of each alloy was statistically analyzed using the intercept method with metallographic analysis software, with 10 sets of data collected for each alloy and the average value calculated (Figure 3). The results showed that the SDAS of all alloys fluctuated in the range of 20.7 μm to 16.8 μm as the Cu content increased from 0.1 wt.% to 2.0 wt.%, with an overall minor variation, suggesting that the change in Cu content has a negligible effect on the grain size of α-Al. The SDAS values showed no systematic dependence on Cu content across the range of 0.1–2.0 wt.%, with an overall variation between 16.8 μm and 20.7 μm. Although a slight deviation was observed at 0.7 wt.% Cu (approximately 18.5 μm), this value lay within the typical experimental scatter and overlapped with the error ranges of adjacent compositions (0.5 wt.% and 0.9 wt.% Cu). Therefore, the influence of Cu content on the SDAS of α-Al was considered negligible.
2.
Statistical results of eutectic structure
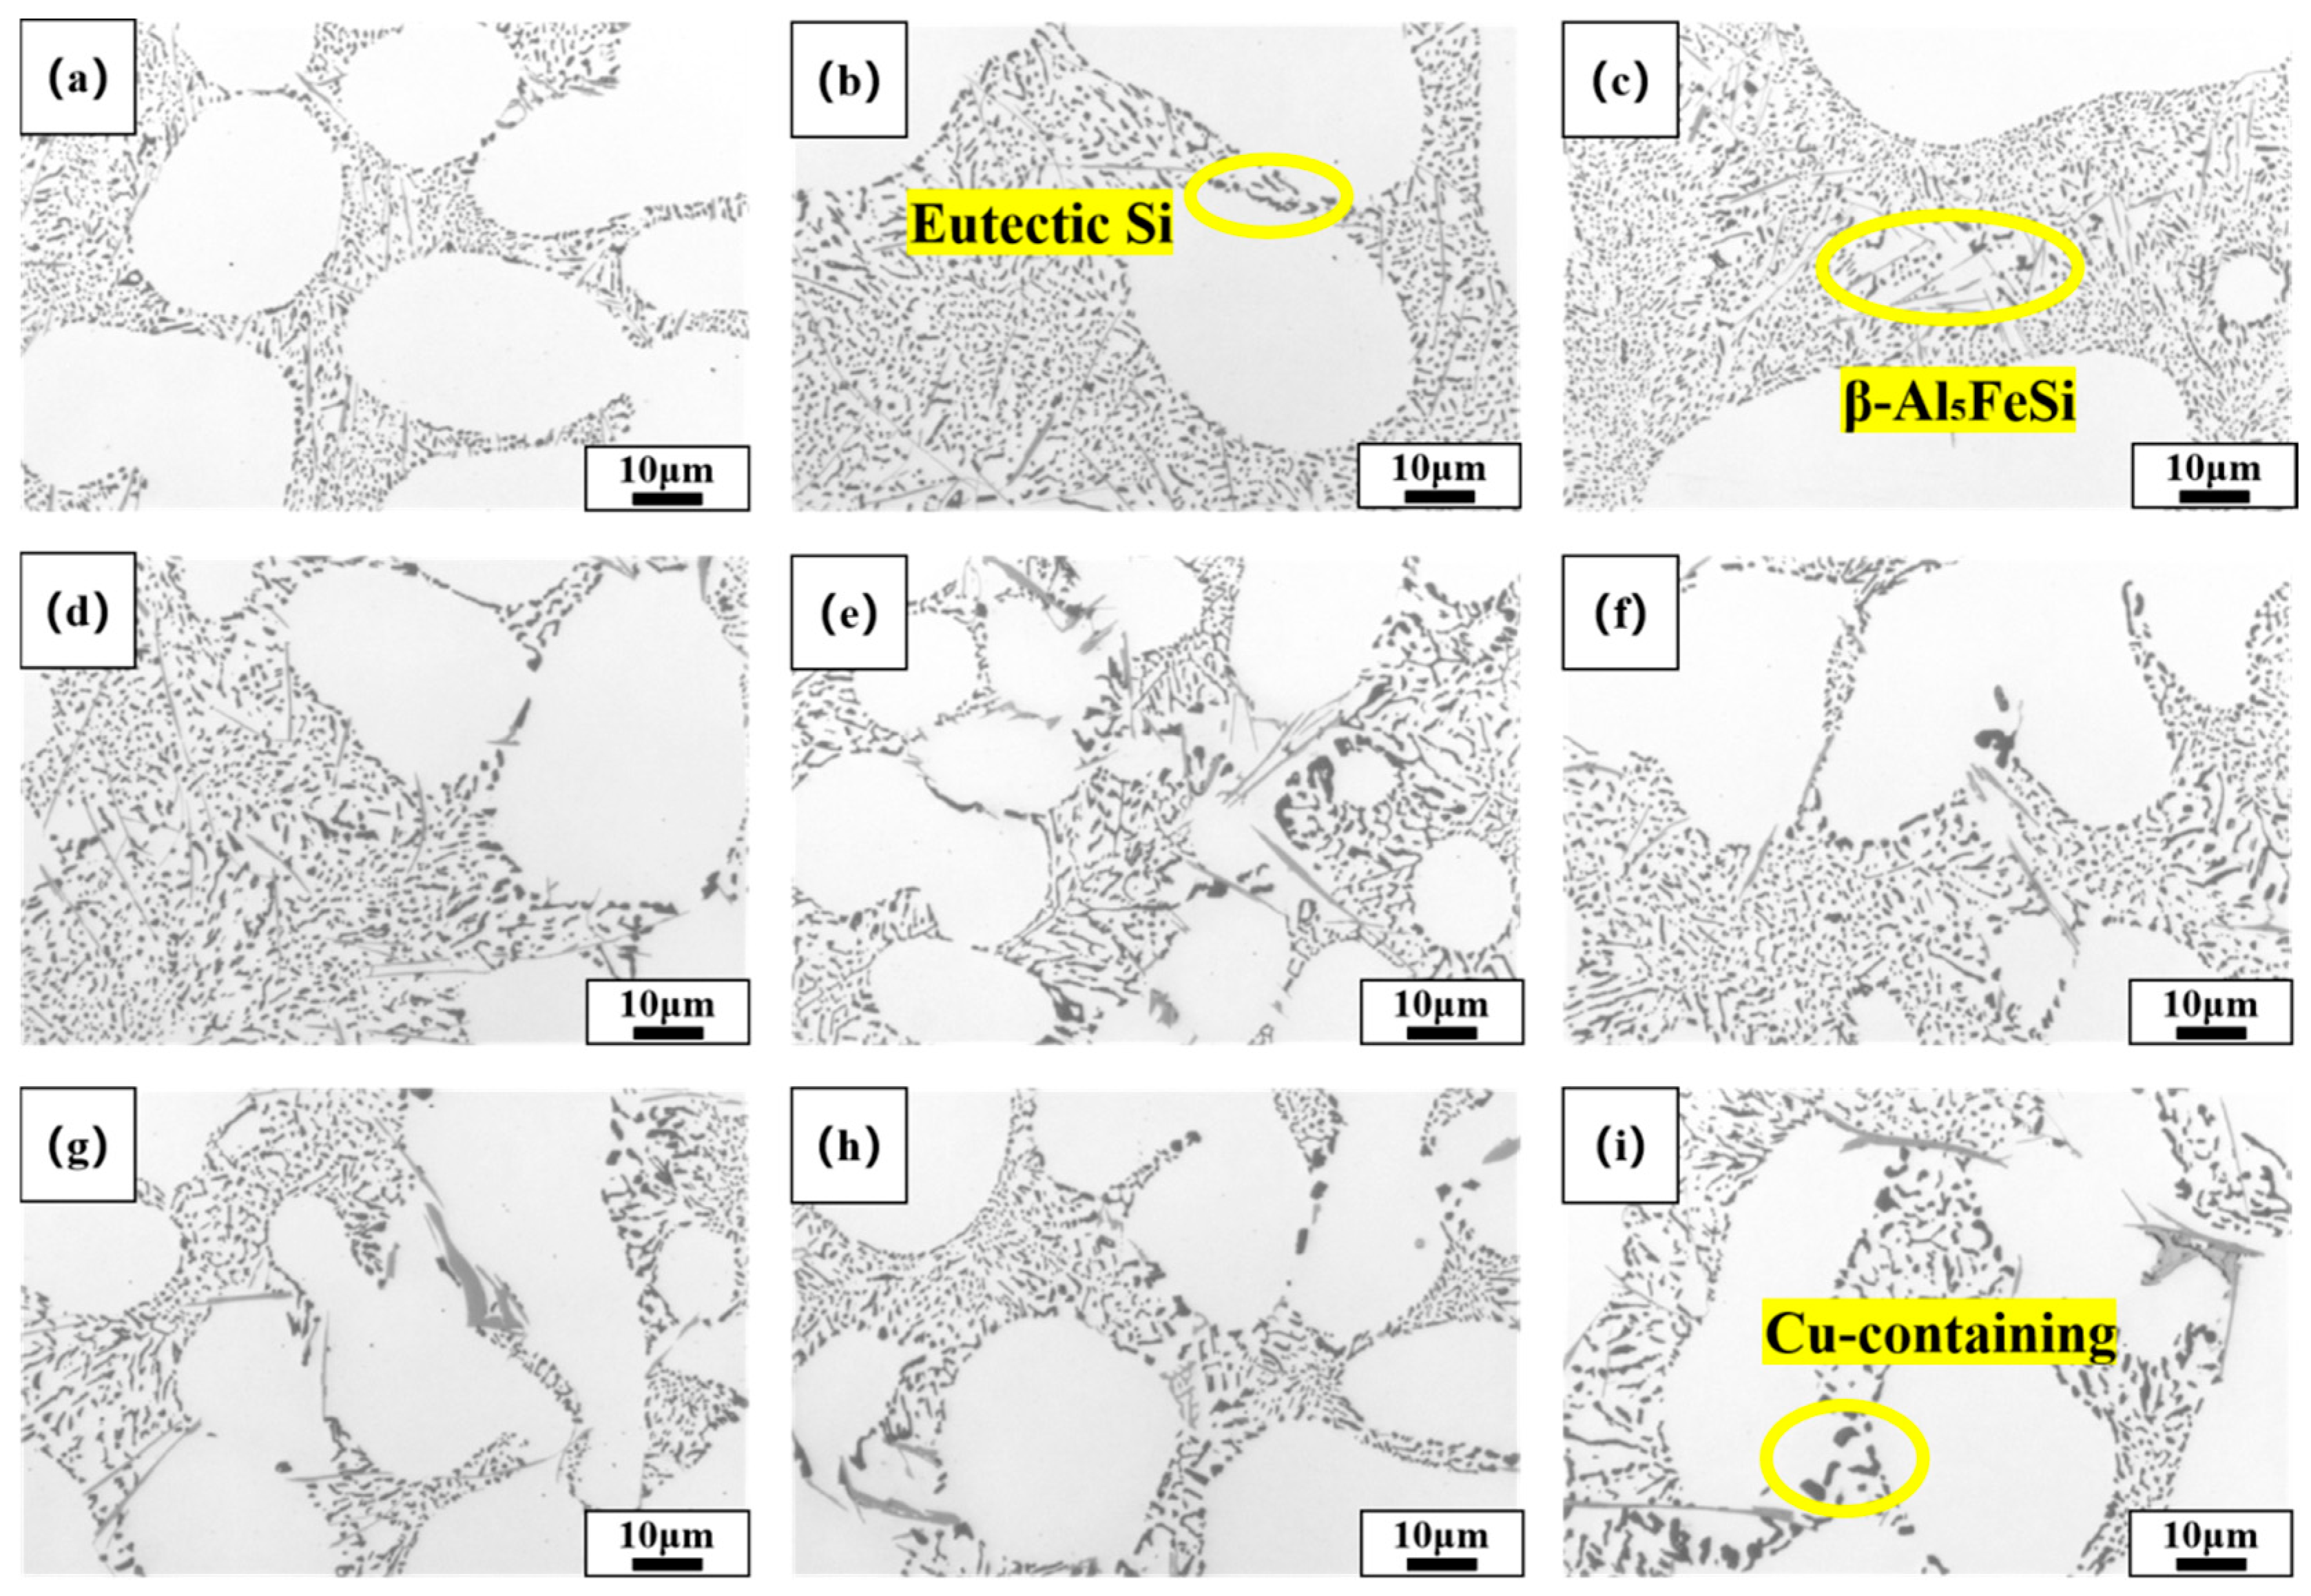
The eutectic structures of the Al-9Si-0.7Fe-xCu alloys (x = 0.1~2.0) are shown in Figure 4. The eutectic silicon in all alloys presented a fine short rod-like or fibrous morphology and was uniformly distributed along the grain boundaries, suggesting complete modification of the silicon phase. The blocky or acicular phases observed in the micrographs were likely iron-rich phases (possibly β-Al5FeSi), while the small granular features were presumably Cu-containing phases. It can be seen that the number of these granular Cu-containing phases increased notably with the rise in Cu content.
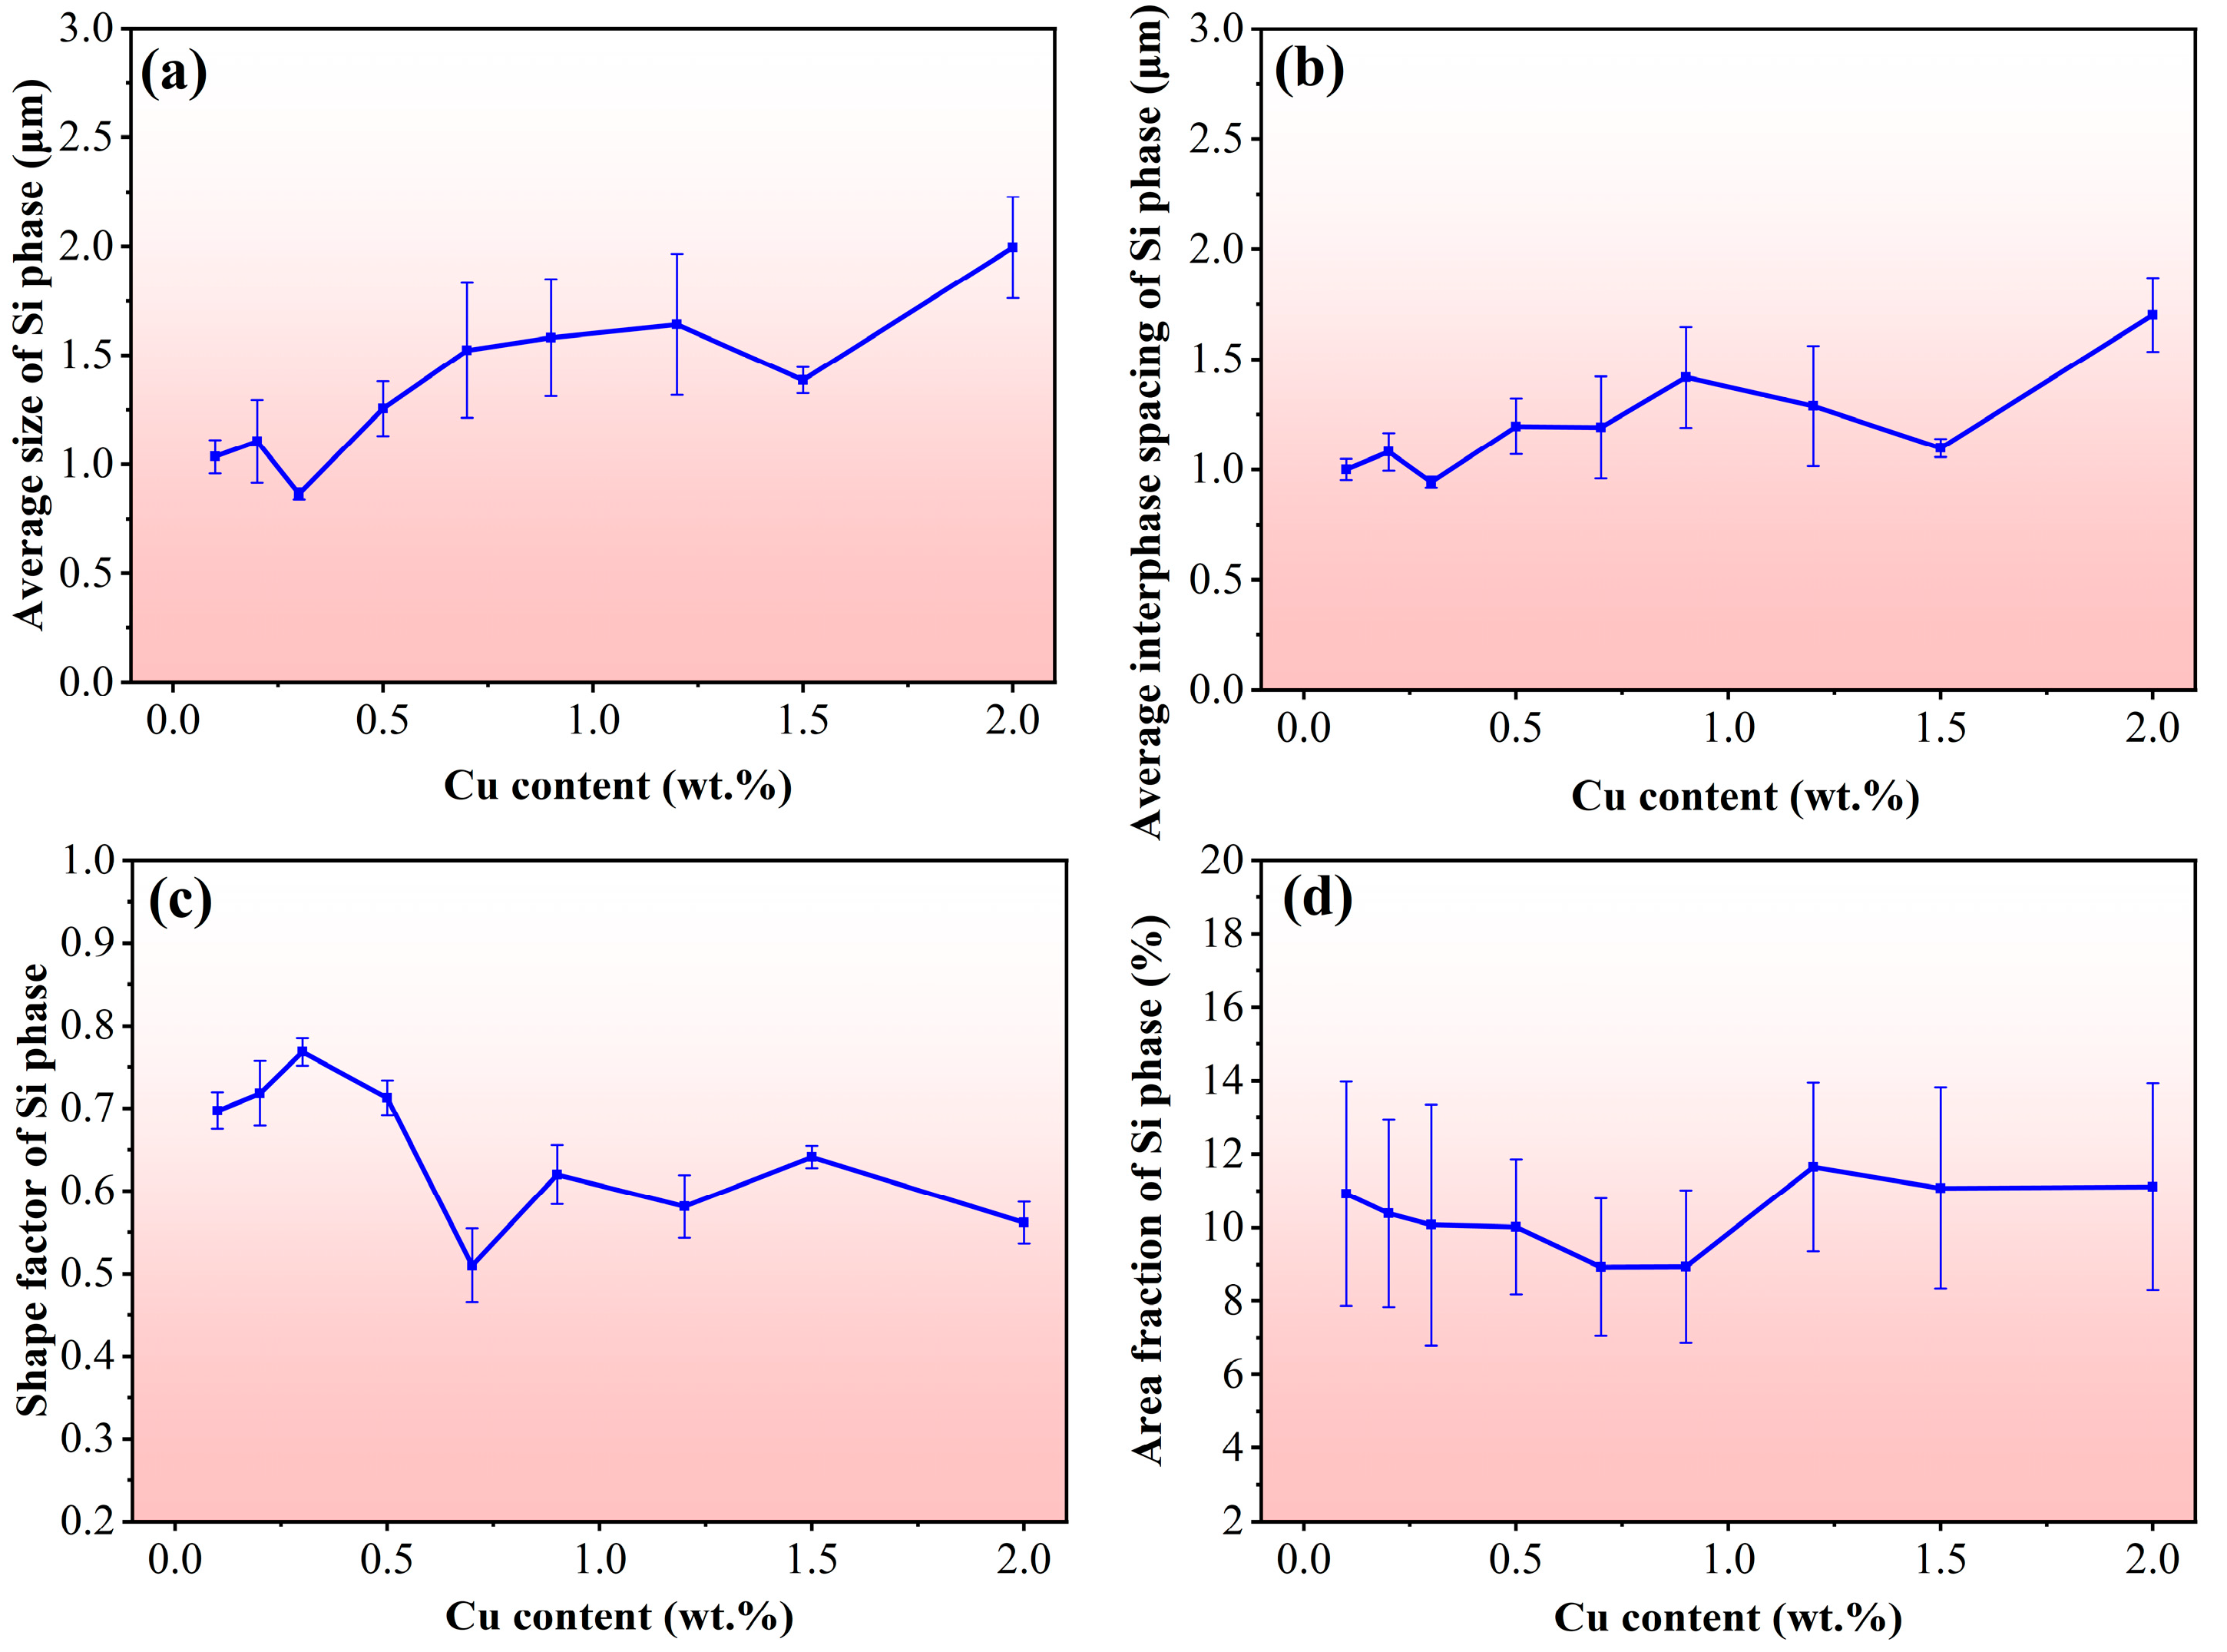
Further quantitative analysis was conducted on the eutectic structures, including the average particle size, interphase spacing, shape factor, and area fraction of eutectic silicon, with the results shown in Figure 5. The particle size and interphase spacing of the silicon phase showed a slight increasing trend, while the shape factor and area fraction changed marginally. As the Cu content increased from 0.1 wt.% to 2.0 wt.%, the average particle size of eutectic silicon increased slowly from 1.03 ± 0.08 μm to 1.99 ± 0.23 μm, the interphase spacing of the silicon phase rose from 1.00 ± 0.05 μm to 1.7 ± 0.16 μm, the shape factor of the silicon phase decreased from 0.69 ± 0.02 to 0.56 ± 0.03, and the area fraction of the silicon phase increased from 10.9 ± 3.06% to 11.1 ± 2.82%. Overall, the variation in Cu content exerted a minimal influence on the morphology of the eutectic structure in the Al-9Si-0.7Fe-xCu alloys (x = 0.1~2.0).
3.
XRD phase analysis
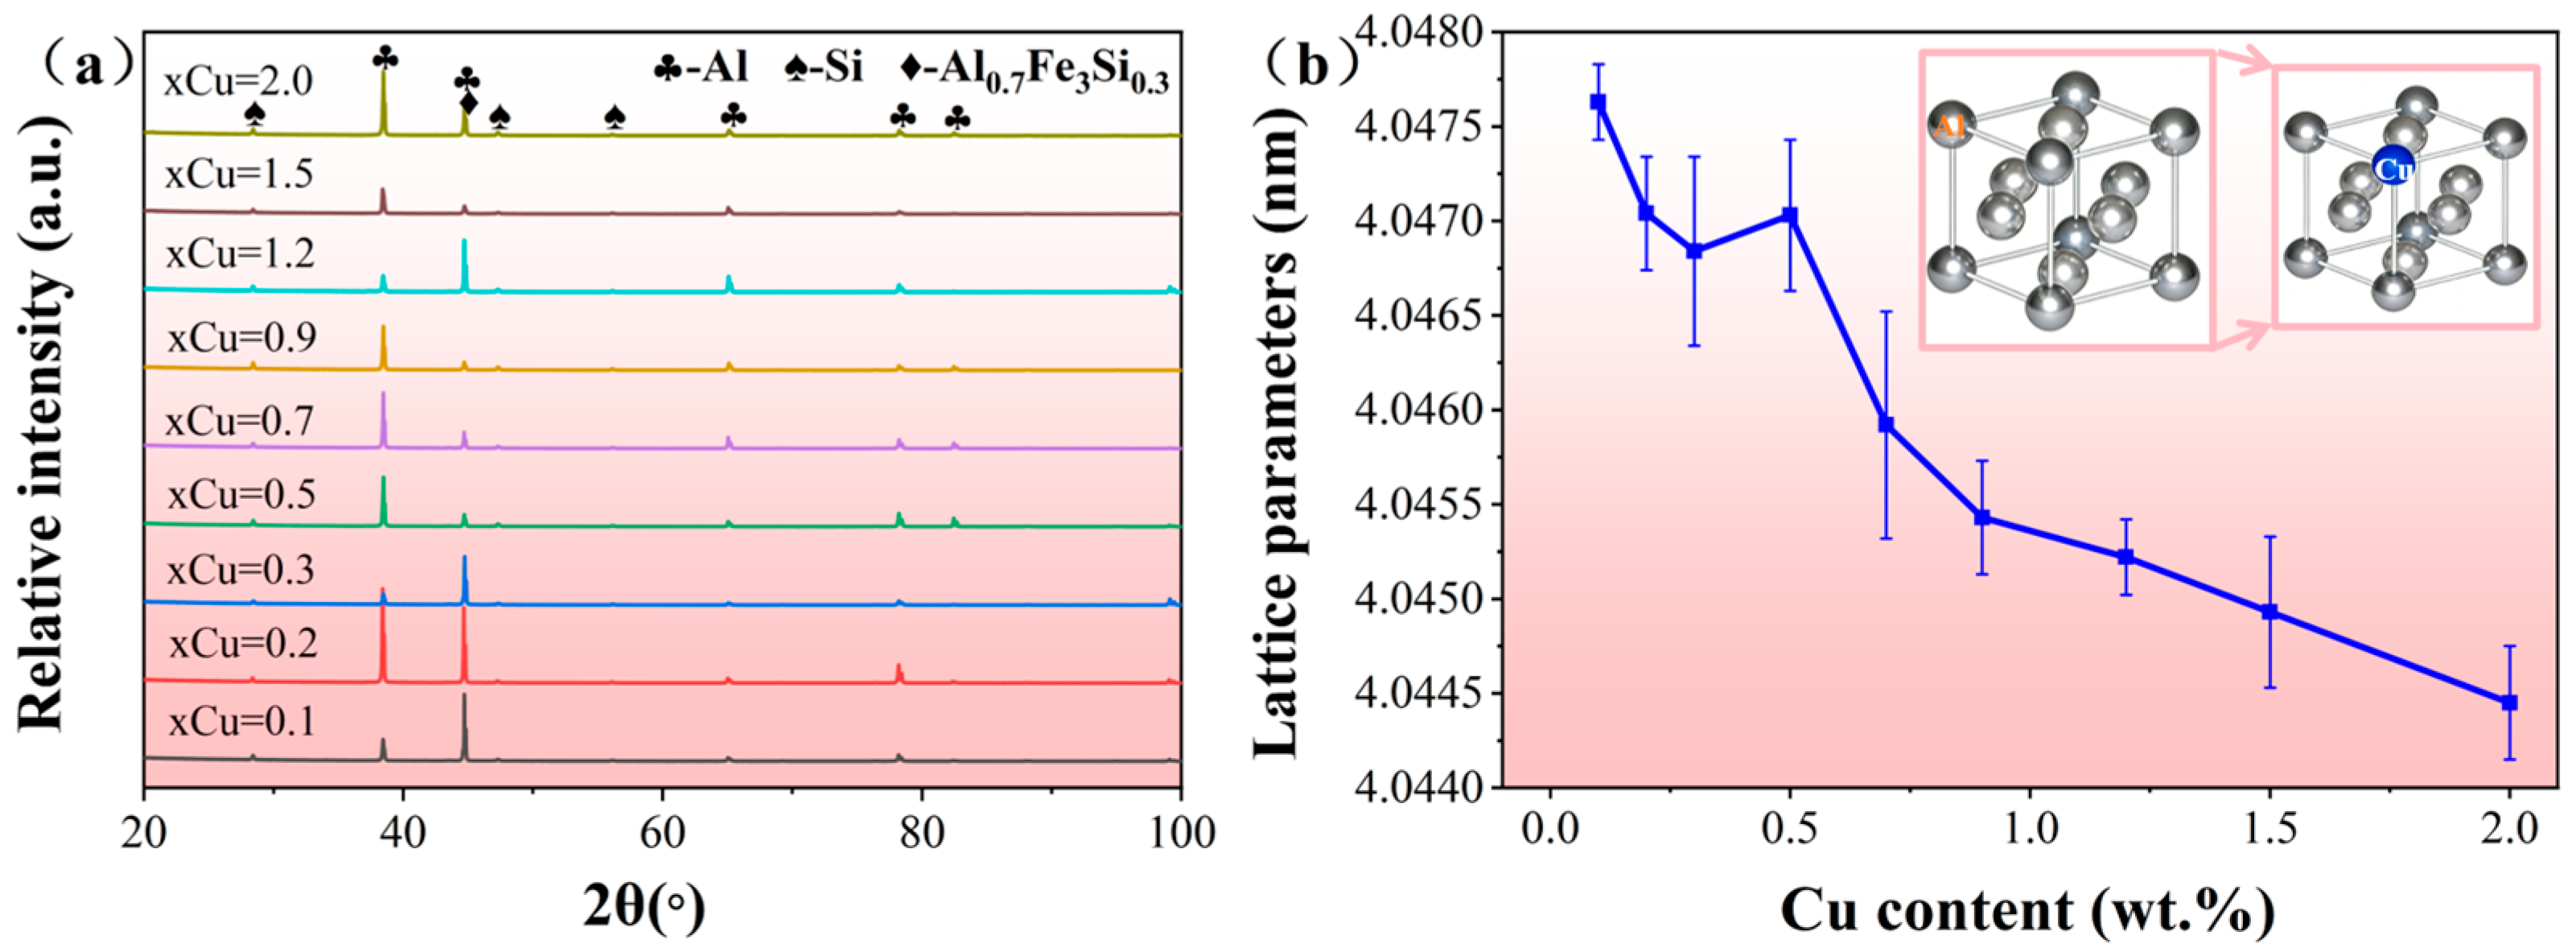
XRD phase analysis was performed on the Al-9Si-0.7Fe-xCu alloys (Figure 6a), which further confirmed that the main phases in the alloys were Al and Si, accompanied by a small amount of iron-rich phases. The strongest diffraction peak of the α-Al phase in all alloys was located at approximately 38.5°, and the position of this peak shifted gradually to a higher angle with increasing Cu content from 0.1 wt.% to 2.0 wt.%. The equilibrium solid solubility limit of Cu in aluminum alloys was 5.7 wt.%, and the atomic radius of Cu (0.128 nm) was smaller than that of Al (0.143 nm). Thus, the introduction of Cu into the Al-Si alloy led to the dissolution of Cu atoms into the Al unit cell, and the lattice parameter of the Al matrix decreased gradually with the increasing Cu content (Figure 6b), from 4.04763 nm to 4.04445 nm (a reduction of 0.08%), indicating a continuous intensification of lattice distortion in the Al matrix.
4.
EPMA analysis of Cu solid solubility
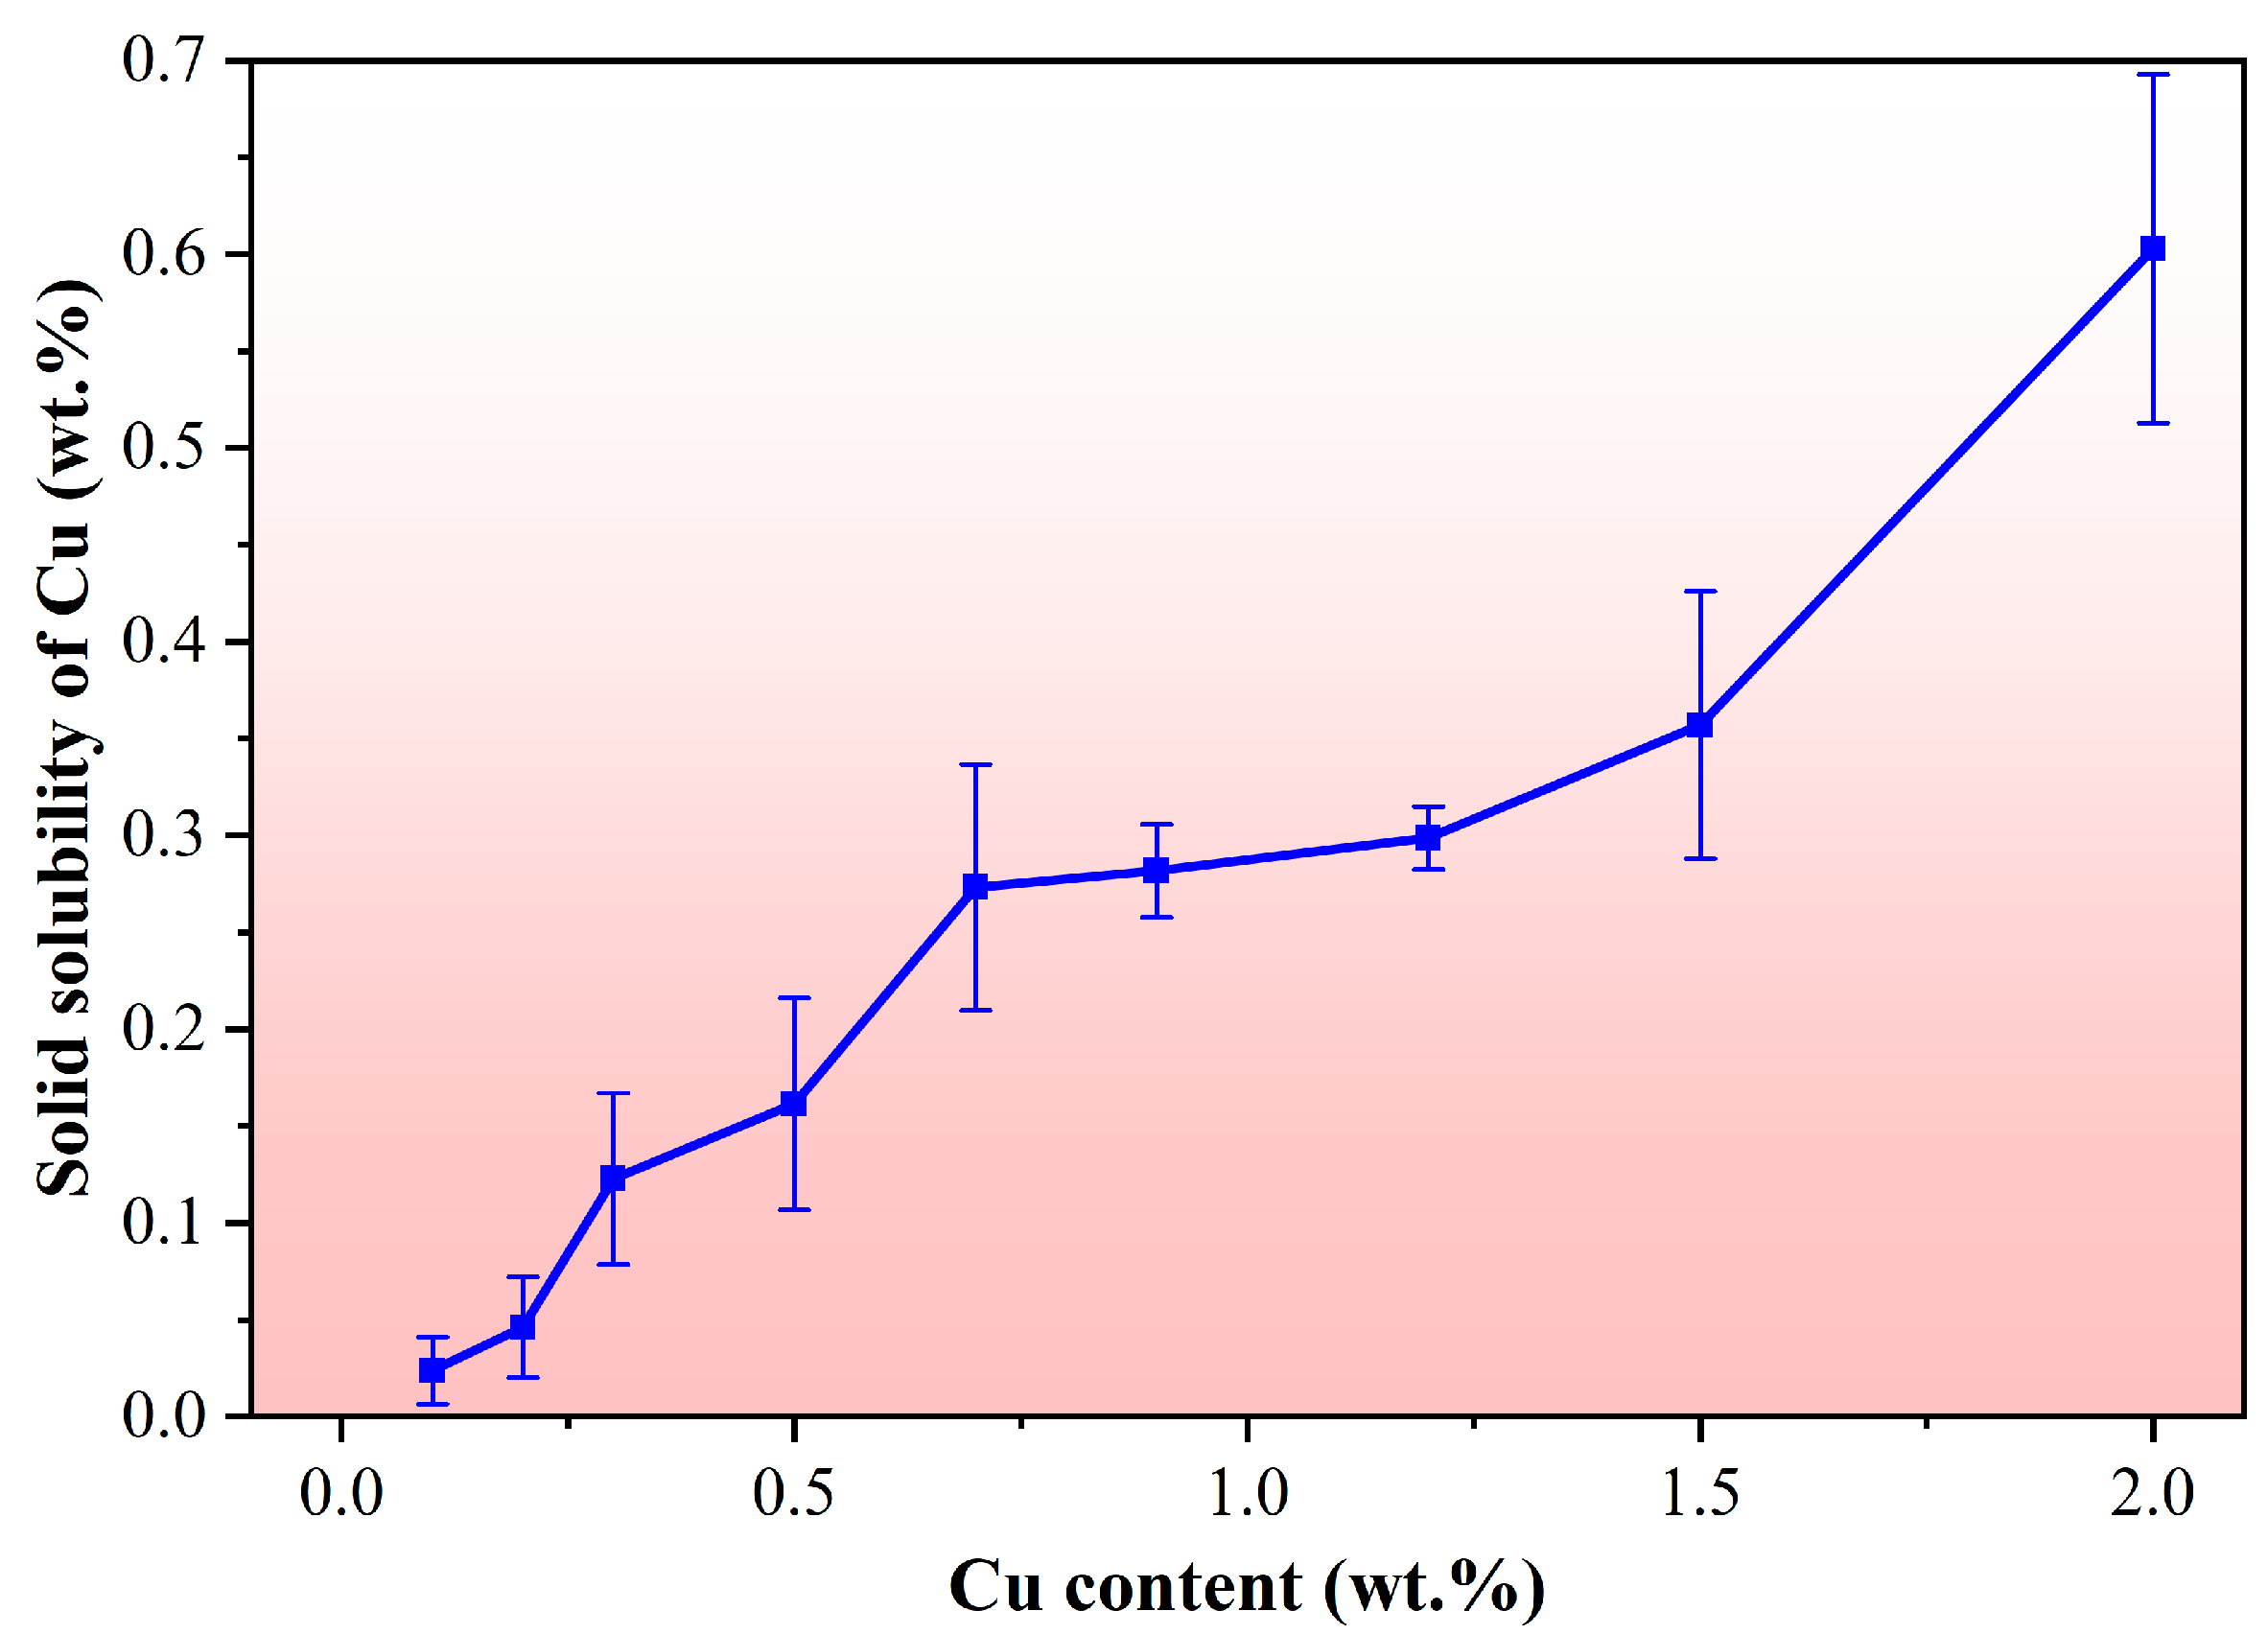
The solid solubility of Cu in the matrix of the Al-9Si-0.7Fe-xCu alloys was further analyzed via EPMA, with the results shown in Figure 7. It can be seen that the solid solubility of Cu in the matrix increased gradually from 0.024 wt.% to 0.603 wt.% (a 24-fold increase) as the Cu content rose from 0.1 wt.% to 2.0 wt.%.
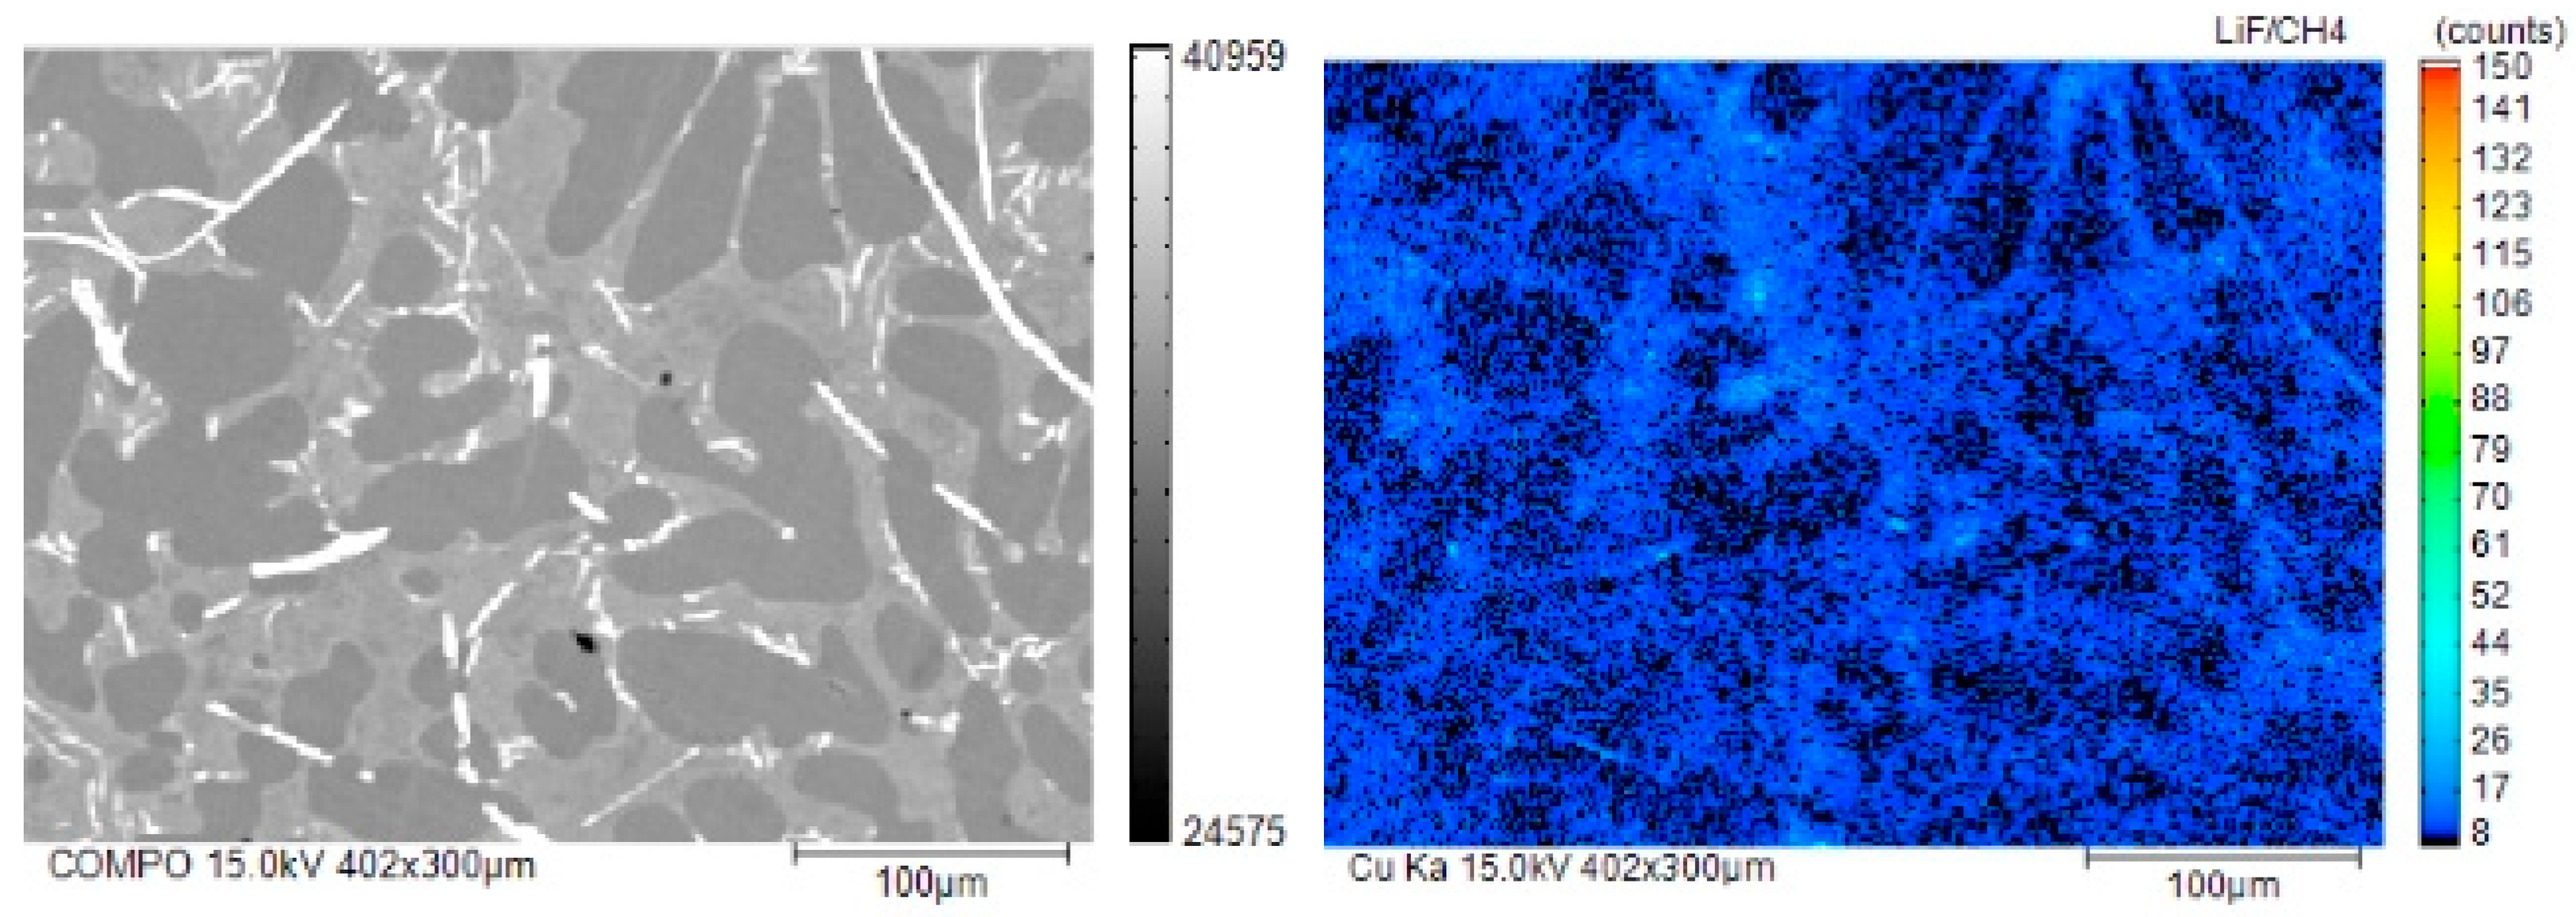
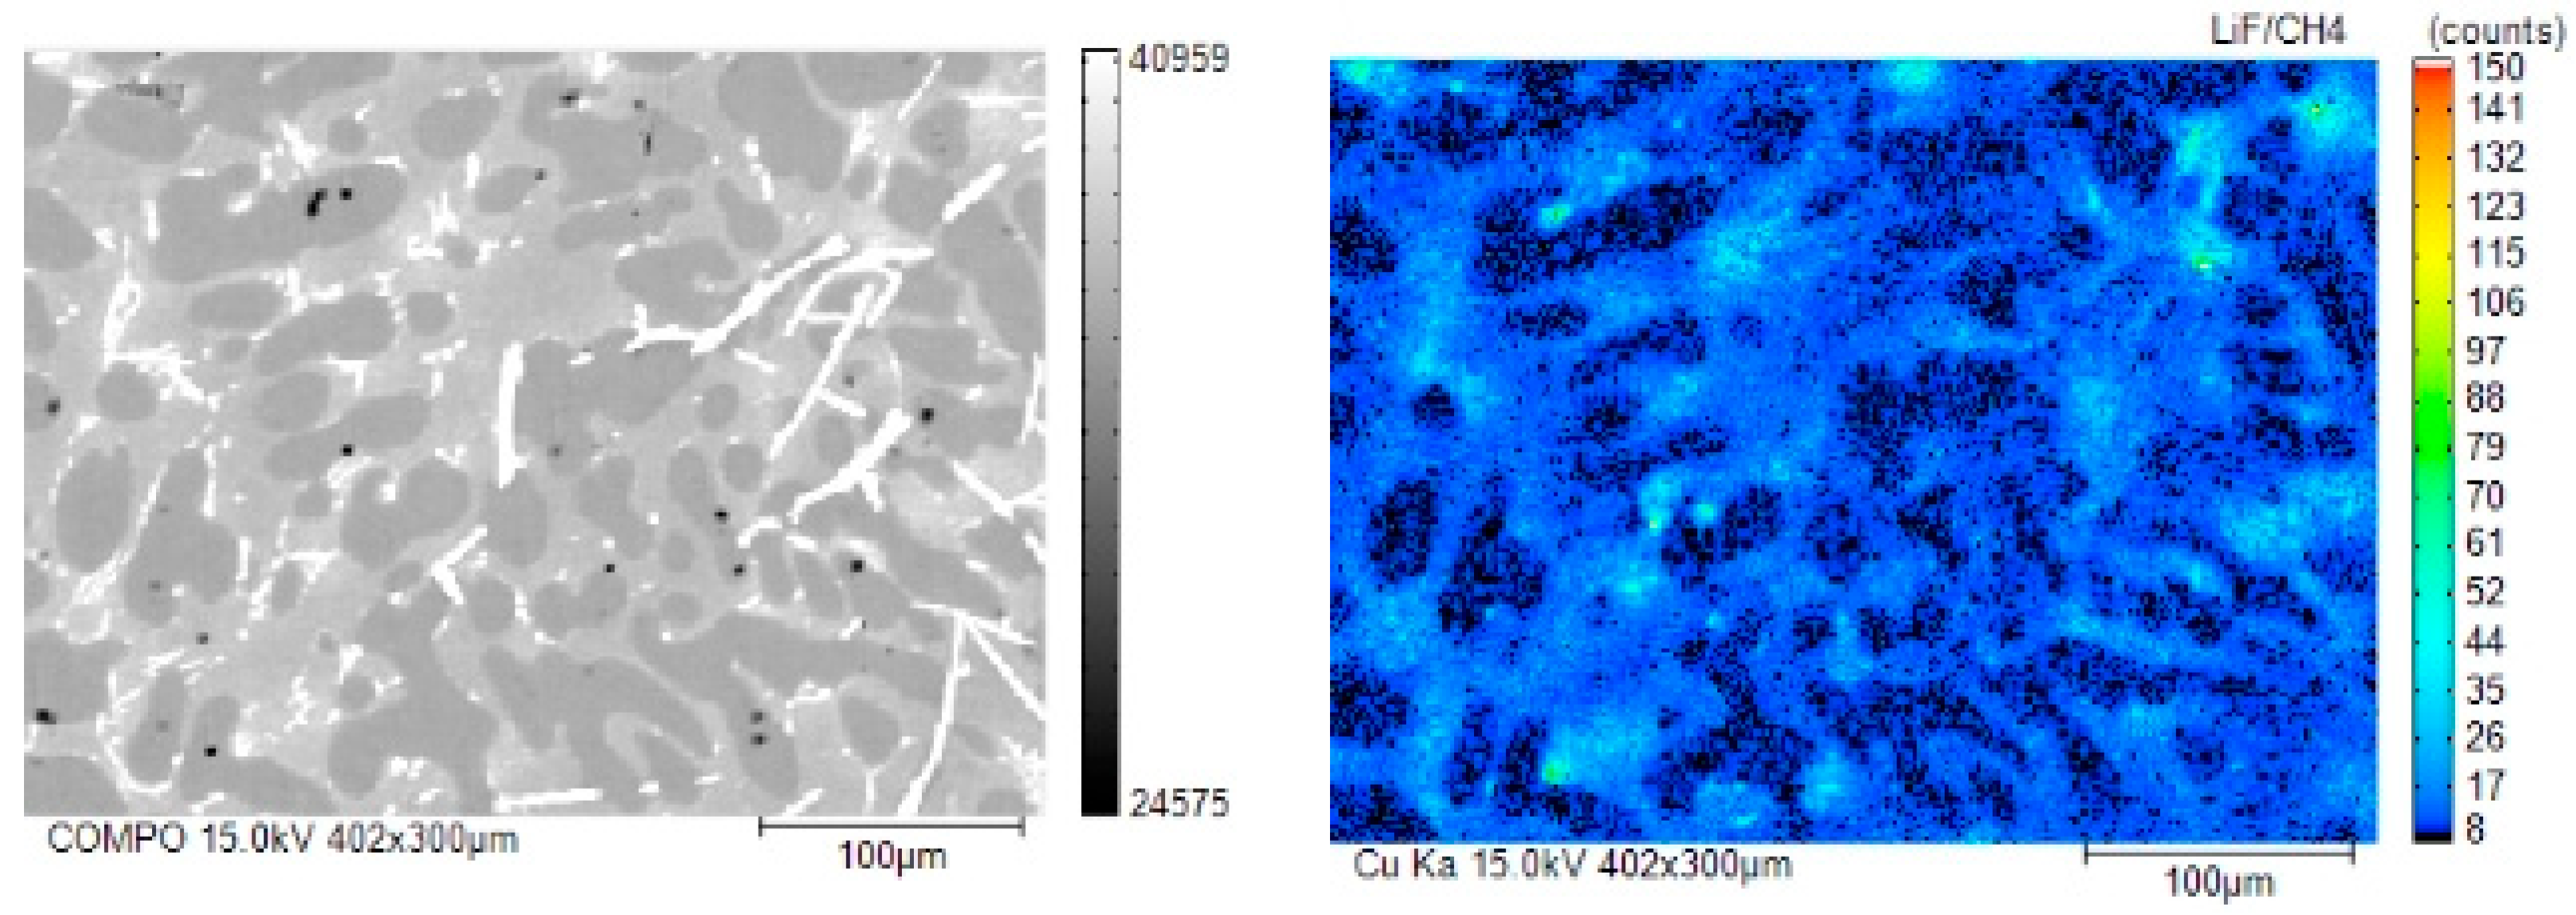
In addition, EPMA surface scanning was performed on samples with Cu contents of 0.1 wt.% and 0.5 wt.% (Figure 8 and Figure 9). The results showed that the precipitation of Cu-containing phases at the grain boundaries increased significantly with the increase in Cu content. The increase in precipitation phases, in addition to the elevated solid solubility in the matrix, further intensified electron scattering and thus reduced the thermal conductivity of the material.

3.2. Thermal Conductivity of Al-9Si-0.7Fe-xCu Alloys

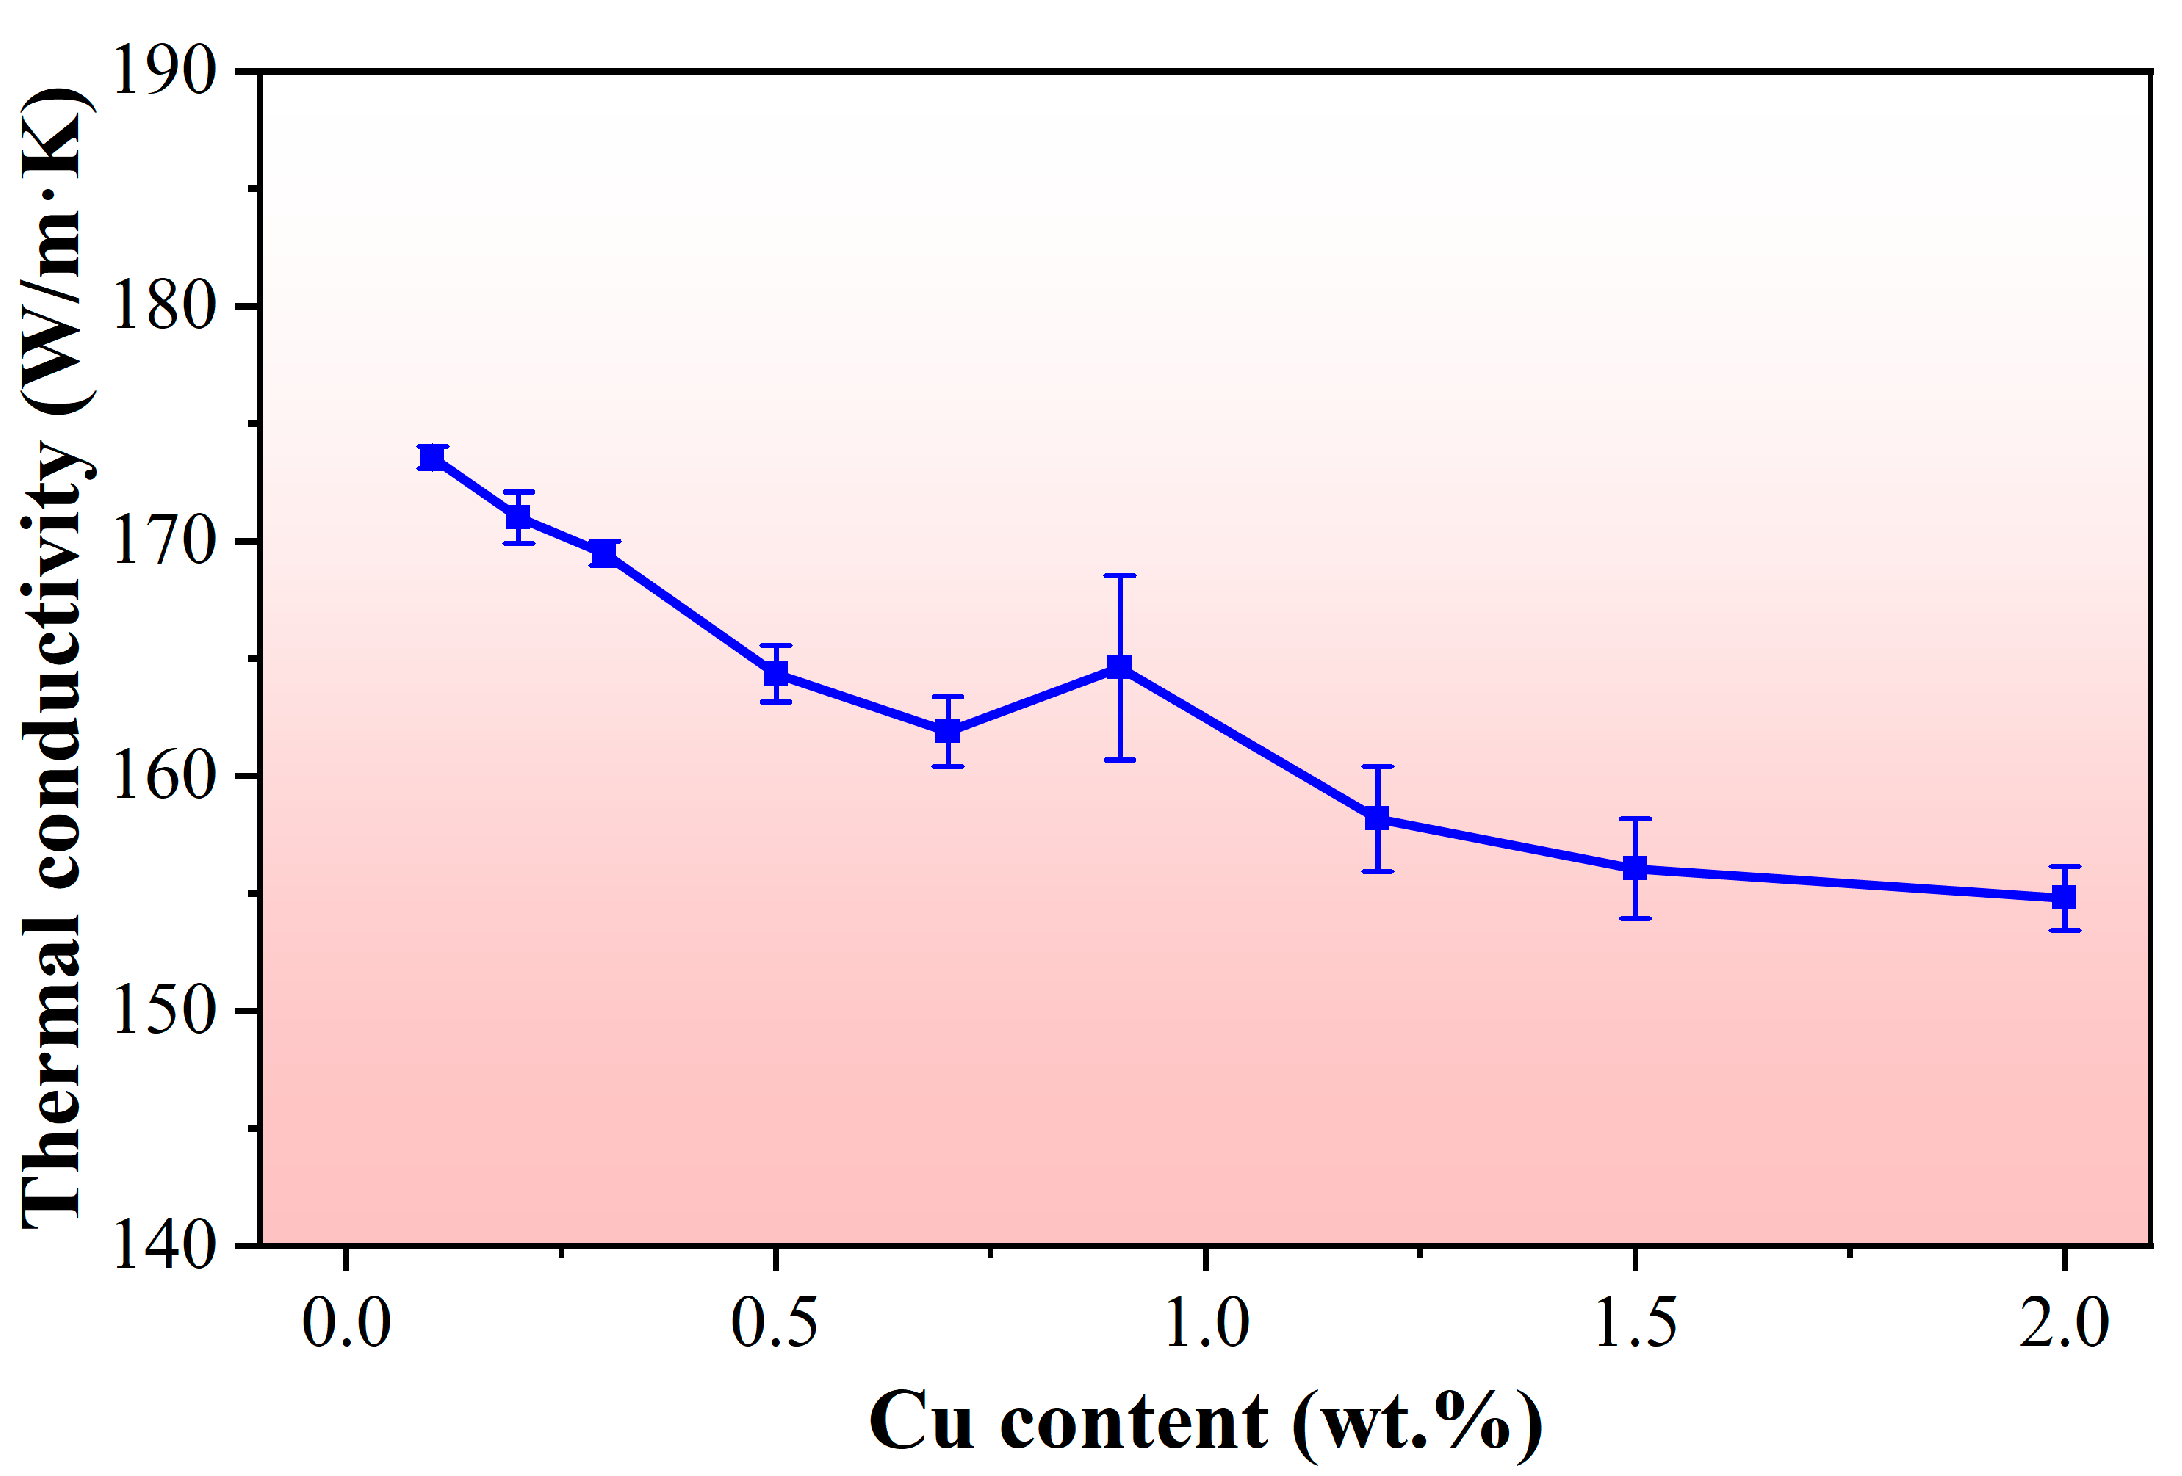
The thermal conductivity test results of the Al-9Si-0.7Fe-xCu alloys (x = 0.1~2.0 wt.%) are shown in Figure 10. For each alloy composition, three parallel samples were tested, and the average value was taken as the result. It can be seen that the thermal conductivity of the Al-9Si-0.7Fe-xCu alloy decreased gradually with the increase in Cu content [16]. As the Cu content increased from 0.1 wt.% to 2.0 wt.%, the thermal conductivity of the alloy dropped from 173.6 W/(m·K) to 154.8 W/(m·K), representing a reduction of 10.8%. The reduction in thermal conductivity was mainly attributed to Cu atoms dissolved in the α-Al matrix, which caused lattice distortion and enhanced electron scattering. EPMA results showed that the solid solubility of Cu increased from 0.024 wt.% to 0.603 wt.%, which was strongly correlated with the decrease in thermal conductivity. In contrast, although the number of Cu-containing precipitates at grain boundaries (black particles in Figure 4) increased with the Cu content, their direct contribution to electron scattering was relatively small because they were located at grain boundaries rather than within the Al lattice. Therefore, solid solution Cu was the dominant factor responsible for the reduction in thermal conductivity [17,18,19,20].

3.3. Mechanical Properties of Al-9Si-0.7Fe-xCu Alloys

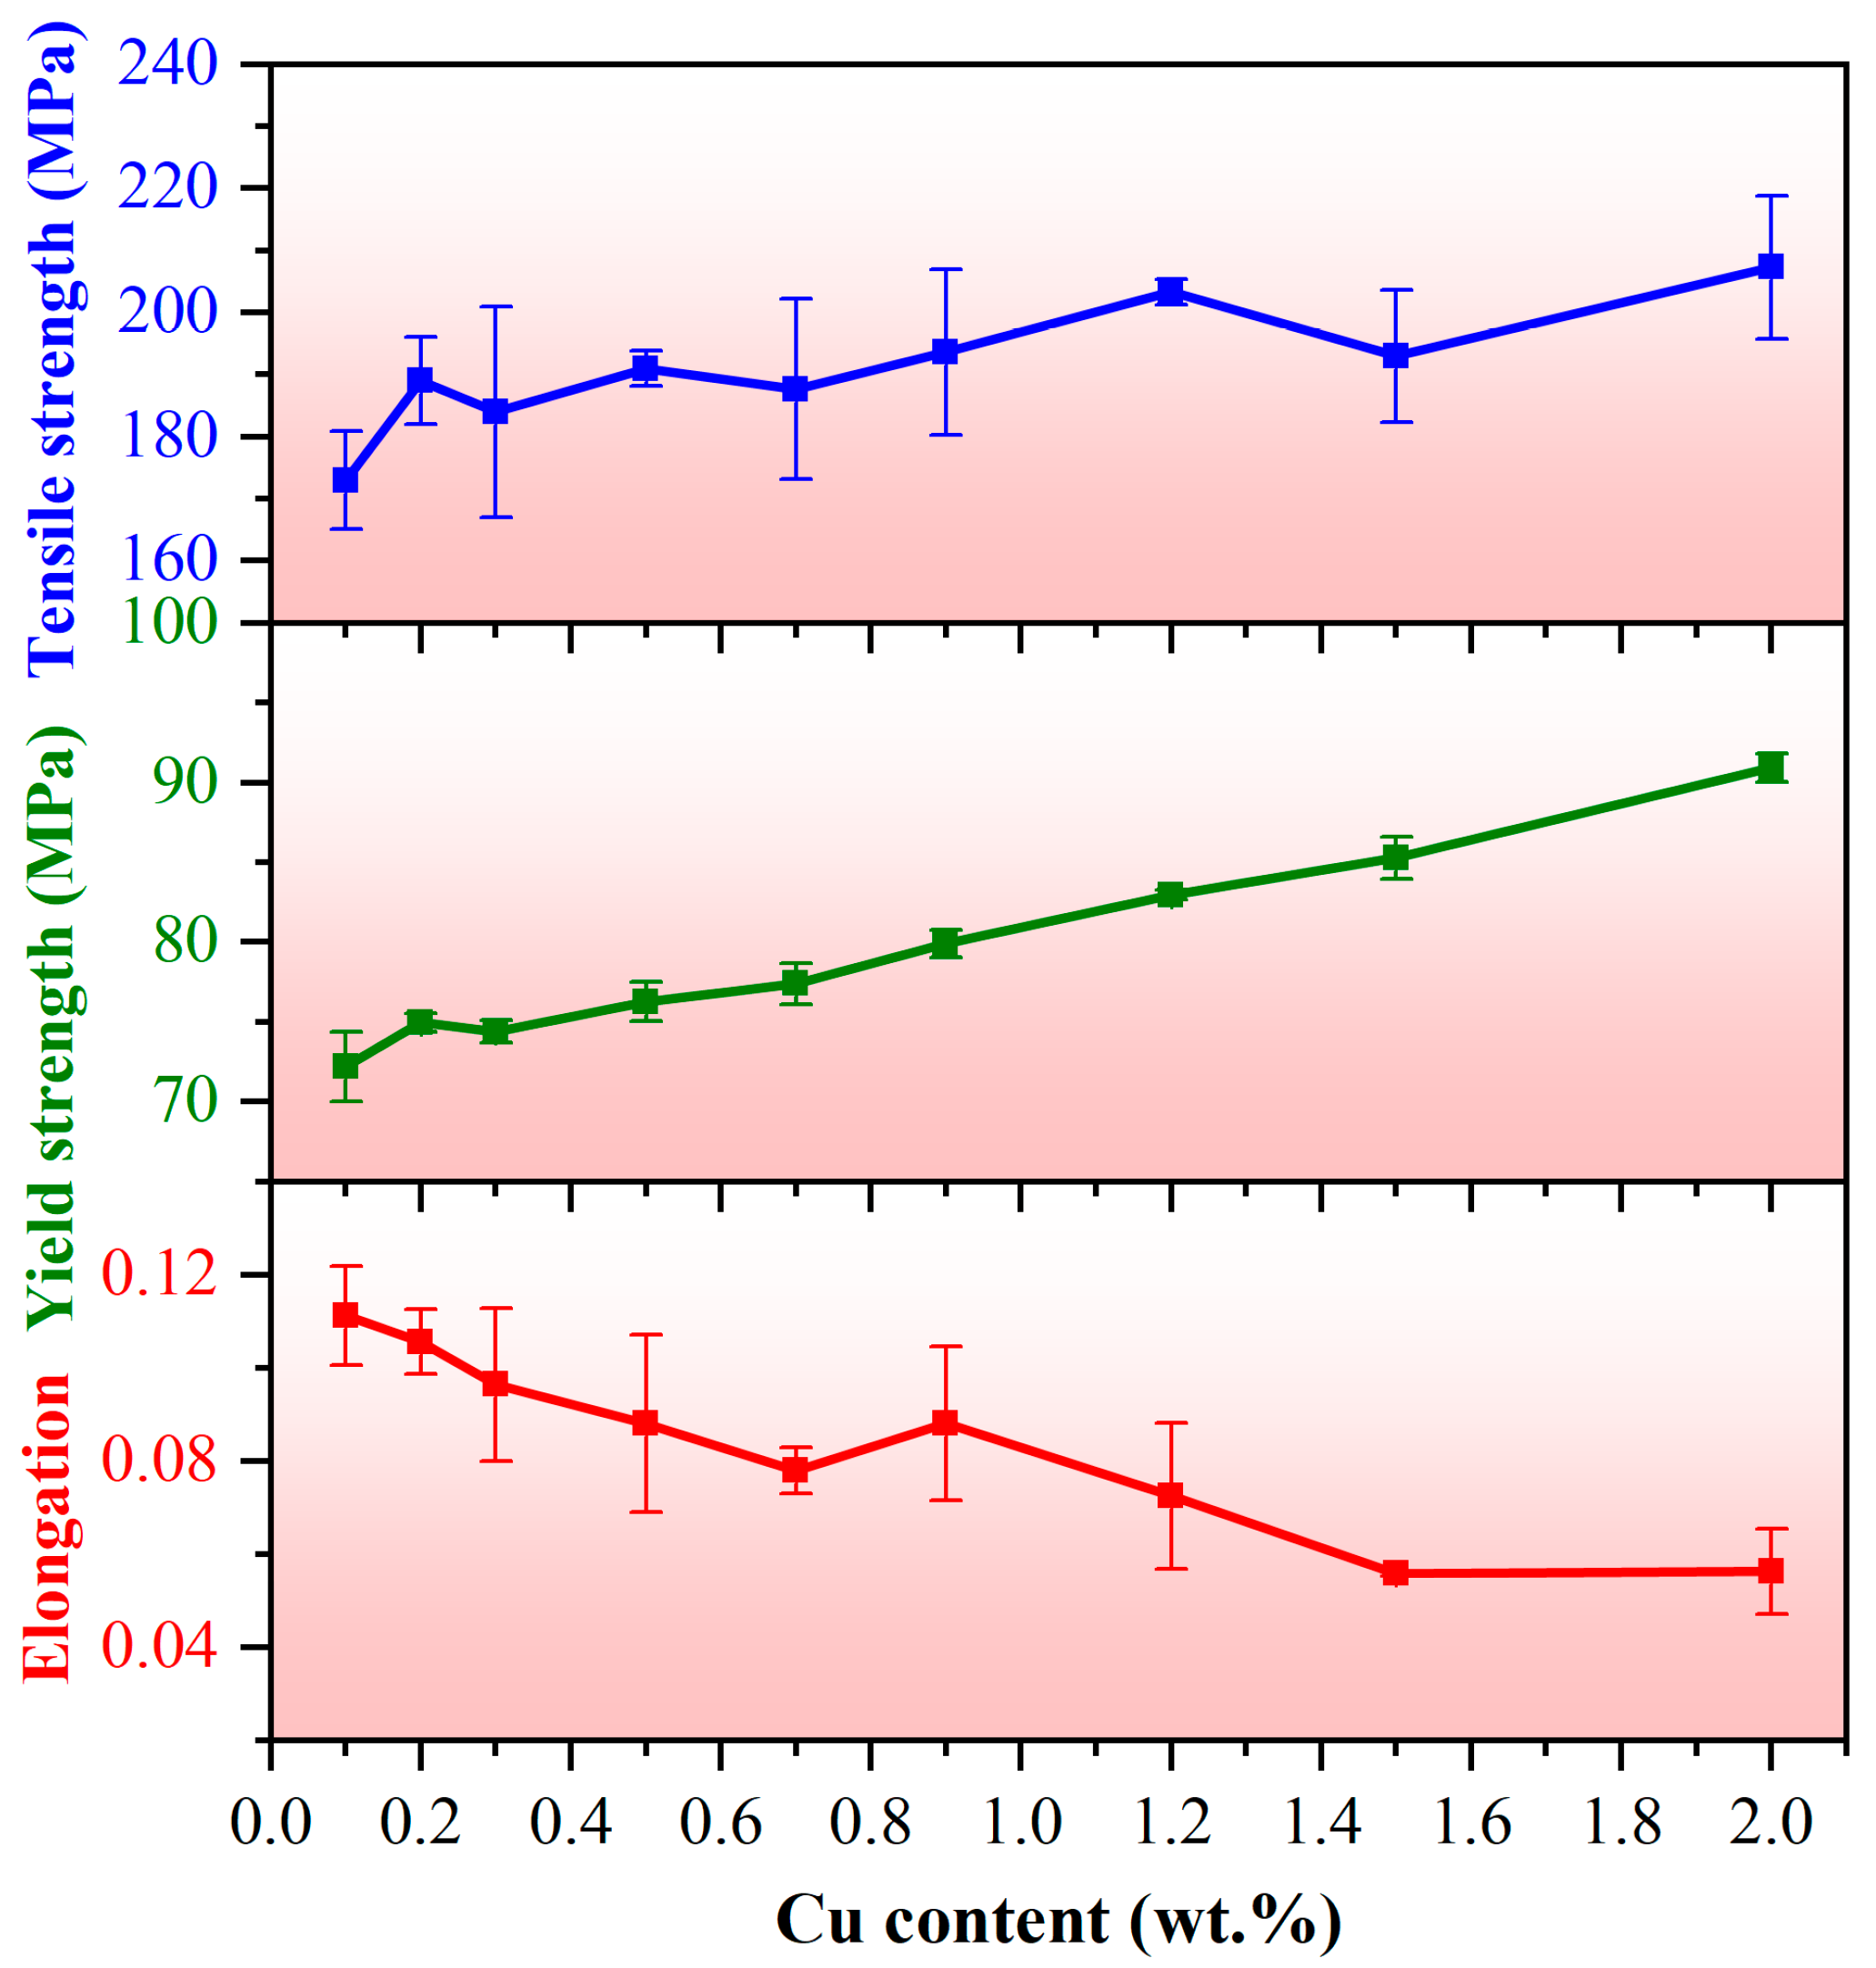
The room temperature tensile properties of the Al-9Si-0.7Fe-xCu alloys (x = 0.1~2.0 wt.%) are presented in Figure 11, with three parallel samples tested for each alloy and the average value adopted. The results showed that as the Cu content increased from 0.1 wt.% to 2.0 wt.%, the tensile strength of the Al-9Si alloy rose from 173 MPa to 207 MPa (an increase of 19.65%), the yield strength increased from 72.2 MPa to 90.9 MPa (an increase of 25.9%), and the elongation decreased from 11.1% to 5.6% (a reduction of 49%).
The solution strengthening effect of the alloy can be denoted as σss. According to investigations by Shercliff and Ashby, solution strengthening can be approximately expressed as follows [21,22]:
σ s s = k ( C ) 2 3
where ‘k’ is a constant and ‘c’ represents the average solute concentration in the matrix.
With an increasing solution time, the second phase in the alloy matrix gradually dissolves, and solute atoms keep diffusing into the matrix. This gives rise to an obvious solution strengthening effect in the alloy [23]. In addition, the strengthening effect becomes more pronounced when the atomic size mismatch between solute and solvent atoms is larger, since it causes more severe lattice distortion. The atomic radius difference between silicon and aluminum is small. Therefore, at the initial stage of solid solution formation, the lattice distortion induced by silicon atoms in the matrix is negligible, leading to a limited strengthening effect [24]. There is a significant difference in atomic radius between Cu and Al atoms. As shown in Figure 7, during solution treatment, the Cu-rich phases dissolved, allowing Cu atoms to disperse into the matrix. Such dispersion caused considerable lattice distortion, thereby producing a solution strengthening effect. However, according to the statistical results in Figure 5, once the dissolution of the second phase reached saturation, the eutectic Si phases tended to coarsen, which resulted in a decrease in elongation. Therefore, it can be concluded that the improvement in the strength of the alloy is mainly attributed to the solution strengthening effect and the spheroidization of eutectic silicon.

4. Discussion

4.1. Mechanism of Cu’s Influence on the Thermal and Mechanical Properties of Al-Si Alloys

Based on the above analyses, the Pearson correlation coefficients between Cu content and various parameters—including thermal conductivity, tensile strength, yield strength, elongation, SDAS, silicon phase particle size, silicon phase interphase spacing, silicon phase shape factor, silicon phase area fraction, lattice parameter, and Cu solid solubility in the matrix—were calculated to be −94.20%, 84.62%, 99.44%, −98.62%, −55.44%, 86.72%, 77.99%, −64.24%, 34.53%, −95.72%, and 97.34%, respectively. These coefficients indicate varying degrees of linear associations between Cu content and the measured properties. Specifically, the absolute values of the correlation coefficients between Cu content and thermal conductivity, yield strength, elongation, Cu solid solubility in the matrix, as well as lattice parameter, all exceeded 90%, suggesting strong linear relationships. The correlation coefficients between Cu content and tensile strength, as well as silicon phase particle size, were above 80%, indicating moderate linear associations, while those between the Cu content and SDAS, silicon phase interphase spacing, silicon phase shape factor, and silicon phase area fraction were below 80%, suggesting relatively weak linear dependencies. Furthermore, the Pearson correlation coefficients between thermal conductivity and lattice parameter, as well as between thermal conductivity and Cu solid solubility in the matrix, were calculated to be 92.37% and 91.57%, respectively. These results imply that the addition of Cu to the Al-Si alloy is associated with changes in the lattice parameter and Cu solid solubility of the Al matrix, which in turn show strong linear associations with the thermal conductivity and yield strength of the alloy. In contrast, no strong linear relationships were observed between the Cu content and the overall morphology or distribution of the silicon phase.

4.2. Quantitative Prediction Model for the Thermal Conductivity of Al-Si Alloys with Varying Cu Contents

Based on the XRD results, the Al-9Si-0.7Fe-xCu alloy can be simplified as a two-phase system consisting of the Al matrix and silicon phase, whose thermal conductivity can be predicted synchronously using two classic theoretical models: the Maxwell model and the Hashin–Shtrikman (H-S) model [25,26,27]. The Maxwell model is based on the assumption of sparse, spherical, and non-contact particles randomly distributed in a homogeneous continuous medium, with the specific formula as follows:
  λ = λ m [ 2 ( λ d λ m 1 ) V d + λ d λ m + 2 ] ( 1 λ d λ m ) V d + λ d λ m + 2
The H-S model can also be used to predict the thermal conductivity of isotropic heterogeneous materials, with its upper bound consistent with the Maxwell model and the lower bound calculated by the following formula
  λ = λ d [ 2 ( λ m λ d 1 ) V m + λ m λ d + 2 ] ( 1 λ m λ d ) V m + λ m λ d + 2
In the above formulas, λ denotes thermal conductivity, V represents volume fraction, and the subscripts m and d refer to the matrix and the dispersed phase respectively. The volume fractions of the Al matrix (Vm) and eutectic Si (Vd) can be calculated according to their theoretical densities and mass fractions in the alloy. According to the report by Stadler et al. [28], the thermal conductivities of pure Al and pure Si are taken as 213.5 W/(m·K) and 25 W/(m·K), respectively. Considering the effect of Cu solid solution on the α-Al matrix, the thermal conductivity of the Al matrix (λm) was modified in this study. Specifically, the dissolution of 1 wt.% Cu in pure aluminum leads to an increase in electrical resistivity of 0.344 μΩ·cm. Based on the measured Cu solid solubility in each alloy, the reduction in the electrical conductivity of the α-Al matrix induced by element solid solution was calculated, and the modified thermal conductivity of the α-Al matrix was thus obtained [2,10]. According to the Wiedemann–Franz law, the relationship between thermal conductivity and electrical conductivity in metallic materials is given by:
  λ σ = L T
λ is the thermal conductivity, σ is the electrical conductivity, L is the Lorentz constant, T is the absolute temperature, and ρ is the electrical resistivity.
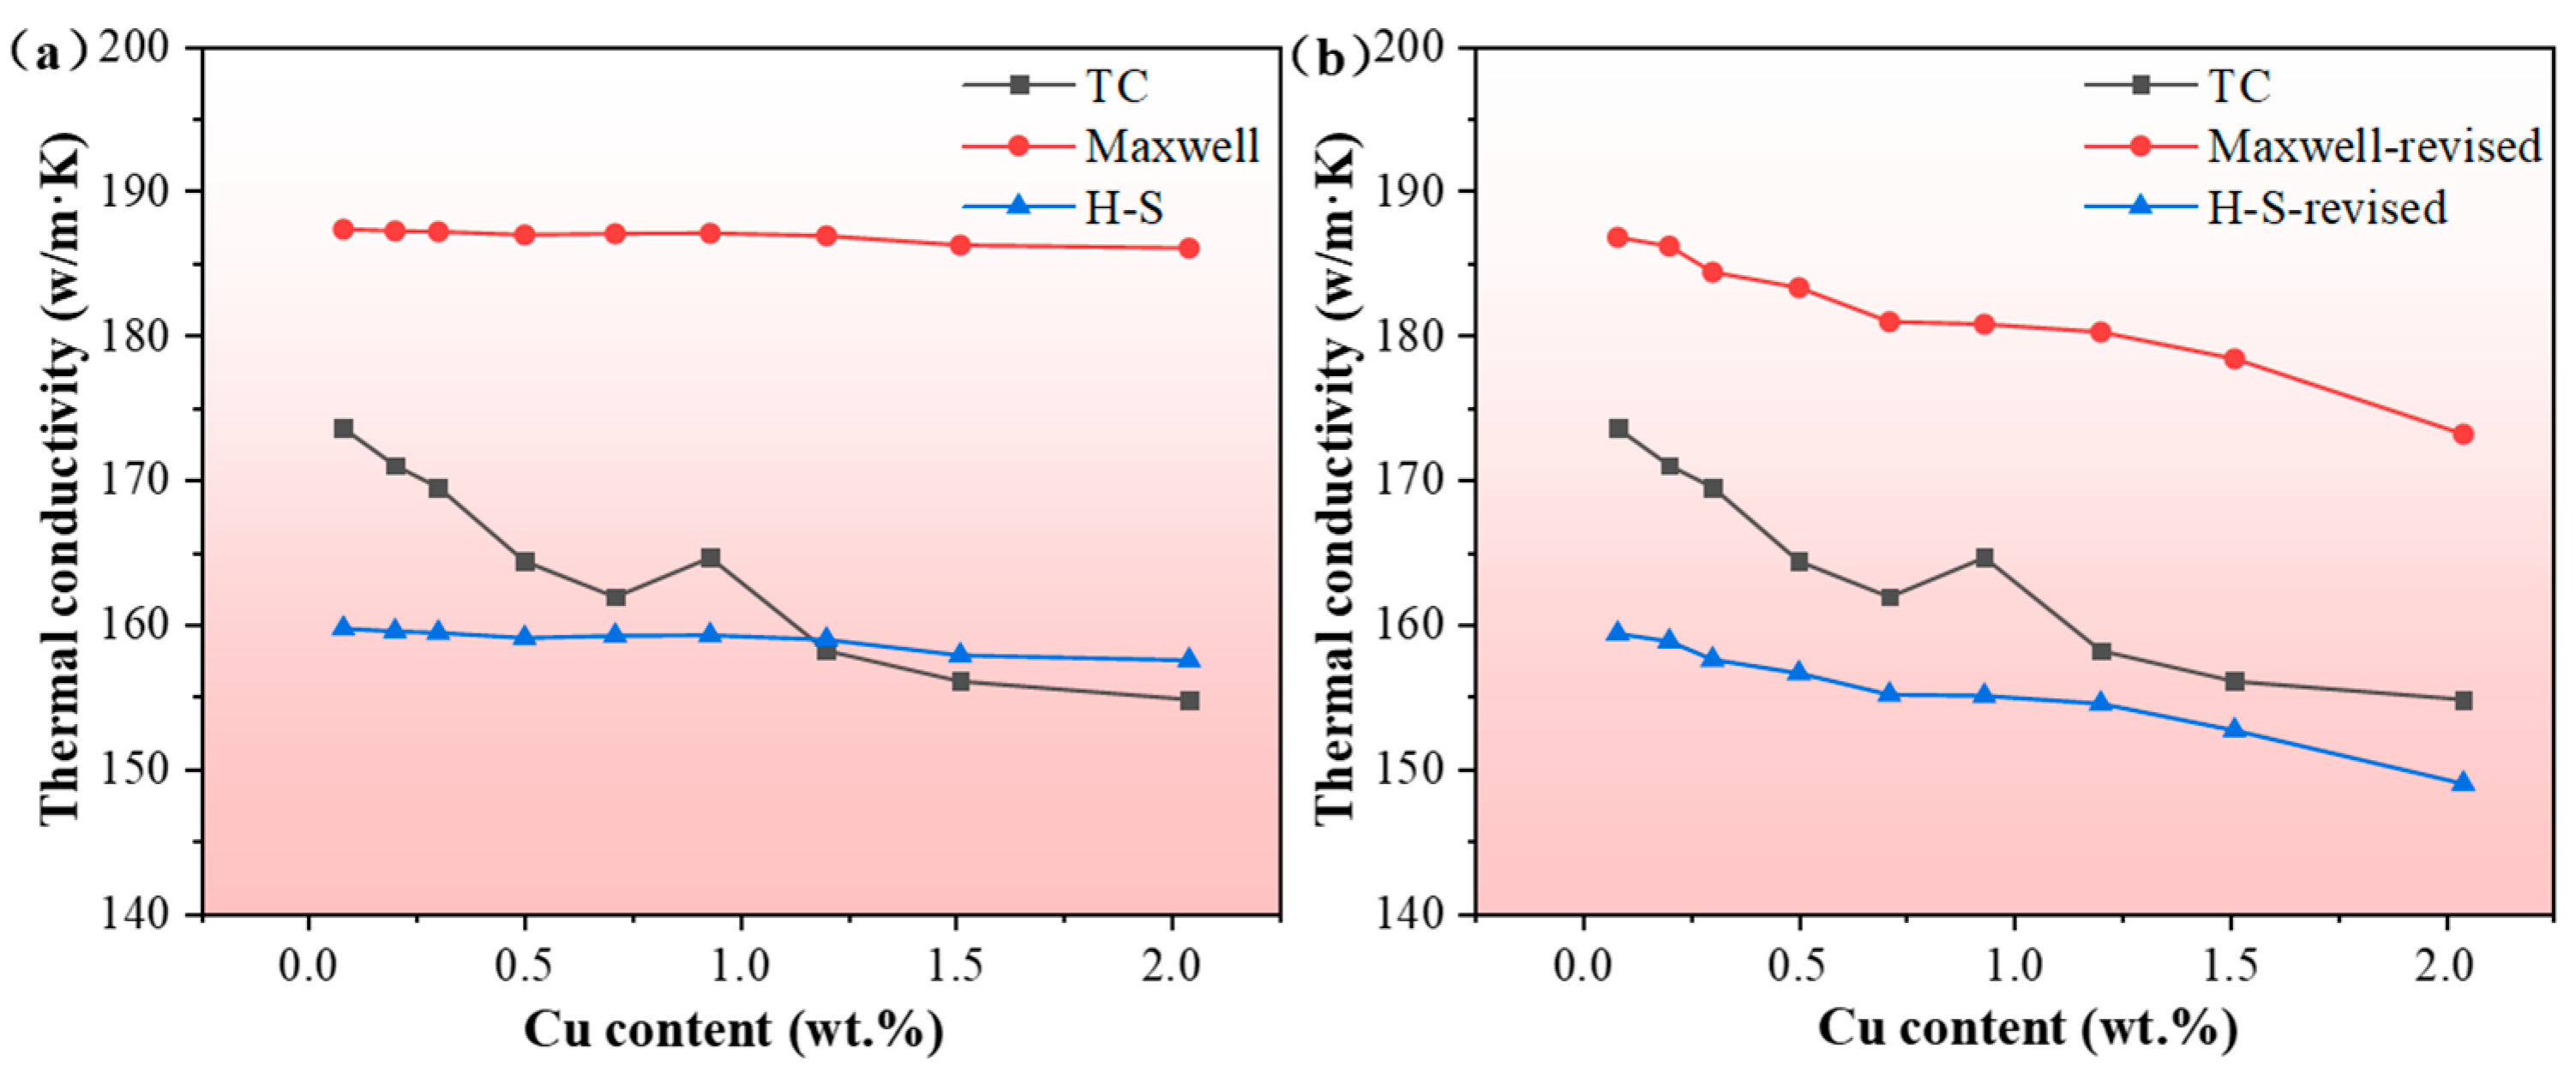
The experimental results of the Al-9Si-xCu alloys are compared with the predicted values of the original and modified Maxwell and H-S models in Figure 12.
As shown in the figure, after modifying the thermal conductivity of the Al matrix based on the measured Cu solid solubility, the correlation coefficient between the thermal conductivity predicted by the Maxwell model and the experimental data increased from 88.05% to 92.77%, and that of the H-S model rose from 88.13% to 93.11%, representing a remarkable improvement in the overall prediction accuracy of the two models.

5. Conclusions

This paper systematically investigated the influence of varying Cu contents (0.1~2.0 wt.%) on the thermal conductivity and mechanical properties of Al-9Si-0.7Fe-xCu alloys and quantitatively characterized the microstructural features of the alloys, including the secondary dendrite arm spacing (SDAS) of α-Al, average particle size, interphase spacing, shape factor and area fraction of eutectic silicon, lattice parameter of the Al matrix, and solid solubility of Cu in the Al matrix. The intrinsic mechanism of Cu’s impact on the thermal and mechanical properties of Al-Si alloys was thus elucidated. Finally, the Maxwell and Hashin–Shtrikman thermal conductivity models were modified based on the measured Cu solid solubility, establishing a high-precision prediction model for the thermal conductivity of Al-9Si-0.7Fe-xCu alloys. The main conclusions of this study are as follows:
  • For the Al-9Si-0.7Fe-xCu alloy, the thermal conductivity decreased from 173.6 W/(m·K) to 154.8 W/(m·K), and the yield strength increased from 72.2 MPa to 90.9 MPa as the Cu content rose from 0.1 wt.% to 2.0 wt.%.
  • The variation in the Cu content directly affected the Cu solid solubility in the Al matrix and the lattice parameter of the Al matrix in the Al-9Si-0.7Fe-xCu alloy, while exerting a negligible influence on the SDAS of α-Al, shape factor, and area fraction of the silicon phase.
  • The dominant mechanism of Cu’s influence on the thermal and mechanical properties of the Al-9Si-0.7Fe-xCu alloy was as follows: the increase in the Cu content led to the dissolution of more Cu atoms into the Al unit cell, resulting in a reduced lattice parameter of the matrix, intensified lattice distortion, enhanced electron scattering effect, and a strengthened solid solution hardening effect. These changes collectively caused a reduction in thermal conductivity and an increase in the strength of the alloy.
  • The Maxwell and Hashin–Shtrikman thermal conductivity models were modified based on the measured Cu solid solubility, with the correlation coefficients between the predicted thermal conductivity values of the modified models and the experimental data reaching 92.77% and 93.11%, respectively, indicating a significant improvement in prediction accuracy.

Author Contributions

Conceptualization, Y.Z., C.C., and D.L.; methodology, Y.Z., H.Z., C.C., M.E.G., H.E.-B., M.K., and D.L.; software, M.E.G., H.E.-B., and M.K.; validation, H.Z. and F.L.; formal analysis, H.Z., C.C., and S.Z.; investigation, Y.Z., Y.C., S.Z., and P.W.; resources, Y.Z., P.W., and D.L.; data curation, Y.Z., H.Z., F.L., C.C., and D.L.; writing—original draft preparation, Y.Z.; writing—review and editing, H.Z. and Y.C.; visualization, H.Z. and Y.C.; supervision, C.C., P.W., and D.L.; project administration, Y.Z. All authors have read and agreed to the published version of the manuscript.

Funding

The authors are grateful for the financial support provided by Advanced Materials-National Science and Technology Major Project (No. 2024ZD0601100) And The APC was funded by this project.

Data Availability Statement

The original contributions presented in this study are included in the article. Further inquiries can be directed to the corresponding authors.

Conflicts of Interest

Authors Yuli Zhou and Shuai Zhang are employed by Chinalco Materials Application Research Institute Co., Ltd. Author Peijian is employed by Wang Guangdong Hongtu (Nantong) Die-Casting Co., Ltd. The remaining authors declare that the research was conducted in the absence of any commercial or financial relationships that could be construed as a potential conflict of interest.

References

  1. Ahmadi, S.; Khormali, A. Petroleum Emulsion Stability and Separation Strategies: A Comprehensive Review. ChemEngineering 2025, 9, 113. [Google Scholar] [CrossRef]
  2. Yang, Z.; He, X.; Li, B.; Atrens, A.; Yang, X.; Cheng, H. Influence of Si, Cu, B, and Trace Alloying Elements on the Conductivity of the Al-Si-Cu Alloy. Materials 2022, 15, 426. [Google Scholar] [CrossRef]
  3. Ren, R.; Yao, Y.X.; Han, D.S.; Liao, Y.W.; Fang, J.; Chen, C. High-temperature oxidation behaviors of AlxCoCrFeNi high-entropy alloys prepared by selective laser melting. Mater. Today Commun. 2025, 49, 114107. [Google Scholar] [CrossRef]
  4. Toth, L.S.; Chen, C.; Pougis, A.; Arzaghi, M.; Fundenberger, J.J.; Massion, R.; Suwas, S. High pressure tube twisting for producing ultra fine grained materials: A review. Mater. Trans. 2019, 60, 1177–1191. [Google Scholar] [CrossRef]
  5. Zhou, P.; Wang, D.; Nagaumi, H.; Wang, R.; Zhang, X.; Li, X.; Zhang, H.; Zhang, B. Microstructural Evolution and Mechanical Properties of Al-Si-Mg-Cu Cast Alloys with Different Cu Contents. Metals 2023, 13, 98. [Google Scholar] [CrossRef]
  6. Zhang, M.; Tian, Y.; Zheng, X.; Zhang, Y.; Chen, L.; Wang, J. Research Progress on Multi-Component Alloying and Heat Treatment of High Strength and Toughness Al–Si–Cu–Mg Cast Aluminum Alloys. Materials 2023, 16, 1065. [Google Scholar] [CrossRef]
  7. Wu, W.; Meng, X.; Han, S.; Liu, J.; Lei, X.; Wang, N. Simultaneous Strength and Elongation Enhancement of Al-5Si Alloy and Welding Performance via Trace Cu/La Addition. Materials 2026, 19, 730. [Google Scholar] [CrossRef] [PubMed]
  8. Wang, E.R.; Hui, X.D.; Wang, S.S.; Zhao, Y.F.; Chen, G.L. Improved Mechanical Properties in Cast Al–Si Alloys by Combined Alloying of Fe and Cu. Mater. Sci. Eng. A 2010, 527, 7878–7884. [Google Scholar] [CrossRef]
  9. Outmani, I.; Fouilland-Paille, L.; Isselin, J.; El Mansori, M. Effect of Si, Cu and Processing Parameters on Al-Si-Cu HPDC Castings. J. Mater. Process. Technol. 2017, 249, 559–569. [Google Scholar] [CrossRef]
  10. Chen, J.K.; Hung, H.Y.; Wang, C.F.; Tang, N.K. Thermal and Electrical Conductivity in Al–Si/Cu/Fe/Mg Binary and Ternary Al Alloys. J. Mater. Sci. 2015, 50, 5630–5639. [Google Scholar] [CrossRef]
  11. Liu, H.J.; Li, L.J.; Niu, J.W.; Gao, J.X.; Ren, C.D. Effect of Mg and Cu Additions on Microstructure and Mechanical Properties of Squeeze Casting Al-Si-Cu-Mg Alloy. Mater. Sci. Forum 2016, 850, 511–518. [Google Scholar] [CrossRef]
  12. Parvizi, P.; Jalilian, M.; Mirazizi, P.S.; Zangeneh, M.R.; Amidi, A.M. Mechanical and Physical Properties of Aluminum and Its Alloys for Electrical Conductors: A Review. Next Mater. 2025, 9, 101090. [Google Scholar] [CrossRef]
  13. Abdo, H.S.; Seikh, A.H.; Mohammed, J.A.; Soliman, M.S. Alloying Elements Effects on Electrical Conductivity and Mechanical Properties of Newly Fabricated Al Based Alloys Produced by Conventional Casting Process. Materials 2021, 14, 3971. [Google Scholar] [CrossRef]
  14. Chen, C.; Beygelzimer, Y.; Toth, L.S.; Fundenberger, J.-J. Microstructure and Strain in Protrusions Formed during Severe Plastic Deformation of Aluminum. Mater. Lett. 2015, 159, 253–256. [Google Scholar] [CrossRef]
  15. Jiao, X.Y.; Liu, C.F.; Guo, Z.P.; Nishat, H.; Tong, G.D.; Ma, S.L.; Bi, Y.; Zhang, Y.F.; Wiesner, S.; Xiong, S.M. On the Characterization of Primary Iron-Rich Phase in a High-Pressure Die-Cast Hypoeutectic Al-Si Alloy. J. Alloys Compd. 2021, 862, 158580. [Google Scholar] [CrossRef]
  16. Dong, Z.-Q.; Wang, J.-G.; Guan, Z.-P.; Ma, P.-K.; Zhao, P.; Li, Z.-J.; Lu, T.-S.; Yan, R.-F. Effect of Short T6 Heat Treatment on the Thermal Conductivity and Mechanical Properties of Different Casting Processes Al-Si-Mg-Cu Alloys. Metals 2021, 11, 1450. [Google Scholar] [CrossRef]
  17. Manasijević, D.; Markovic, I.; Cimpoesu, N.; Chelariu, R.; Stamenković, U.; Balanović, L.; Gorgievski, M. Thermal Properties and Microstructure Evolution of the As-Cast and Annealed Al–Cu–Si Eutectic Alloy. Int. J. Thermophys. 2025, 46, 149. [Google Scholar] [CrossRef]
  18. Li, Y.; Wang, S.; Xiao, Z.; Du, M.; Zhang, Z.; Liu, M.; Li, P. The Effect of Si Content on the Microstructure and Thermal Conductivity of Al-XSi-3Cu-5Mg Alloys Produced by Laser Additive Manufacturing. J. Alloys Compd. 2025, 1034, 181341. [Google Scholar] [CrossRef]
  19. Li, C.; Hou, H.; Liu, L.; Huang, C.; Ren, Y.; Du, J.; Yin, C. Effect of Sr Modification on the Microstructures, Mechanical Properties, and Thermal Conductivity of Hypoeutectic Al-13.6Cu-6Si Alloys. J. Mater. Eng. Perform. 2025, 34, 7712–7723. [Google Scholar] [CrossRef]
  20. Liu, L.; Tang, C.; Feng, W.; Yu, H.; He, Z.; Chu, X.; Wang, P.; Yang, Z.; Guo, Y. Effect of Cu Addition on the Microstructure, Thermal Physical Properties and Cyclic Ablation of C/C-AlSi Composite. J. Alloys Compd. 2023, 969, 172378. [Google Scholar] [CrossRef]
  21. Zhu, Z.; Starink, M.J. Solution Strengthening and Age Hardening Capability of Al–Mg–Mn Alloys with Small Additions of Cu. Mater. Sci. Eng. A 2008, 488, 125–133. [Google Scholar] [CrossRef]
  22. Yao, J.Y.; Taylor, J.A. Characterisation of Intermetallic Particles Formed during Solution Treatment of an Al–7Si–0.4Mg–0.12Fe Alloy. J. Alloys Compd. 2012, 519, 60–66. [Google Scholar] [CrossRef]
  23. Hao, J.; Chen, B.; Xia, P.; Wang, Z.; Chen, Z.; Li, R. Effect of Solid Solution Treatment on Microstructure and Mechanical Properties of Al–Si–Cu–Mg Alloy Prepared by Semi-Solid Squeeze Casting. Int. J. Met. 2024, 18, 2313–2327. [Google Scholar] [CrossRef]
  24. Liu, M.; Zhang, C.; Meng, Z.; Zhao, G.; Chen, L. Atomic Diffusion Mechanism and Interface Nanomechanics in the Al/Ti Composite Structures. Compos. Part B Eng. 2022, 230, 109507. [Google Scholar] [CrossRef]
  25. Zhou, Y.; Zhang, X.; Zhong, G.; Zhang, J.; Yang, Y.; Kang, D.; Li, H.; Jie, W.; Schumacher, P.; Li, J. Elucidating Thermal Conductivity Mechanism of Al-9Si Based Alloys with Trace Transition Elements (Mn, Cr, V). J. Alloys Compd. 2022, 907, 164446. [Google Scholar] [CrossRef]
  26. Luo, G.; Zhou, X.; Li, C.; Huang, Z.; Du, J. A Quantitative Study on the Interaction Between Silicon Content and Heat Treatment on Thermal Conductivity of Al-Si Binary Alloys. Int. J. Met. 2022, 16, 1585–1594. [Google Scholar] [CrossRef]
  27. Zhang, X.; Zhou, Y.; Zhong, G.; Zhang, J.; Chen, Y.; Jie, W.; Schumacher, P.; Li, J. Effects of Si and Sr Elements on Solidification Microstructure and Thermal Conductivity of Al–Si-Based Alloys. J. Mater. Sci. 2022, 57, 6428–6444. [Google Scholar] [CrossRef]
  28. Stadler, F.; Antrekowitsch, H.; Fragner, W.; Kaufmann, H.; Pinatel, E.R.; Uggowitzer, P.J. The Effect of Main Alloying Elements on the Physical Properties of Al–Si Foundry Alloys. Mater. Sci. Eng. A 2013, 560, 481–491. [Google Scholar] [CrossRef]
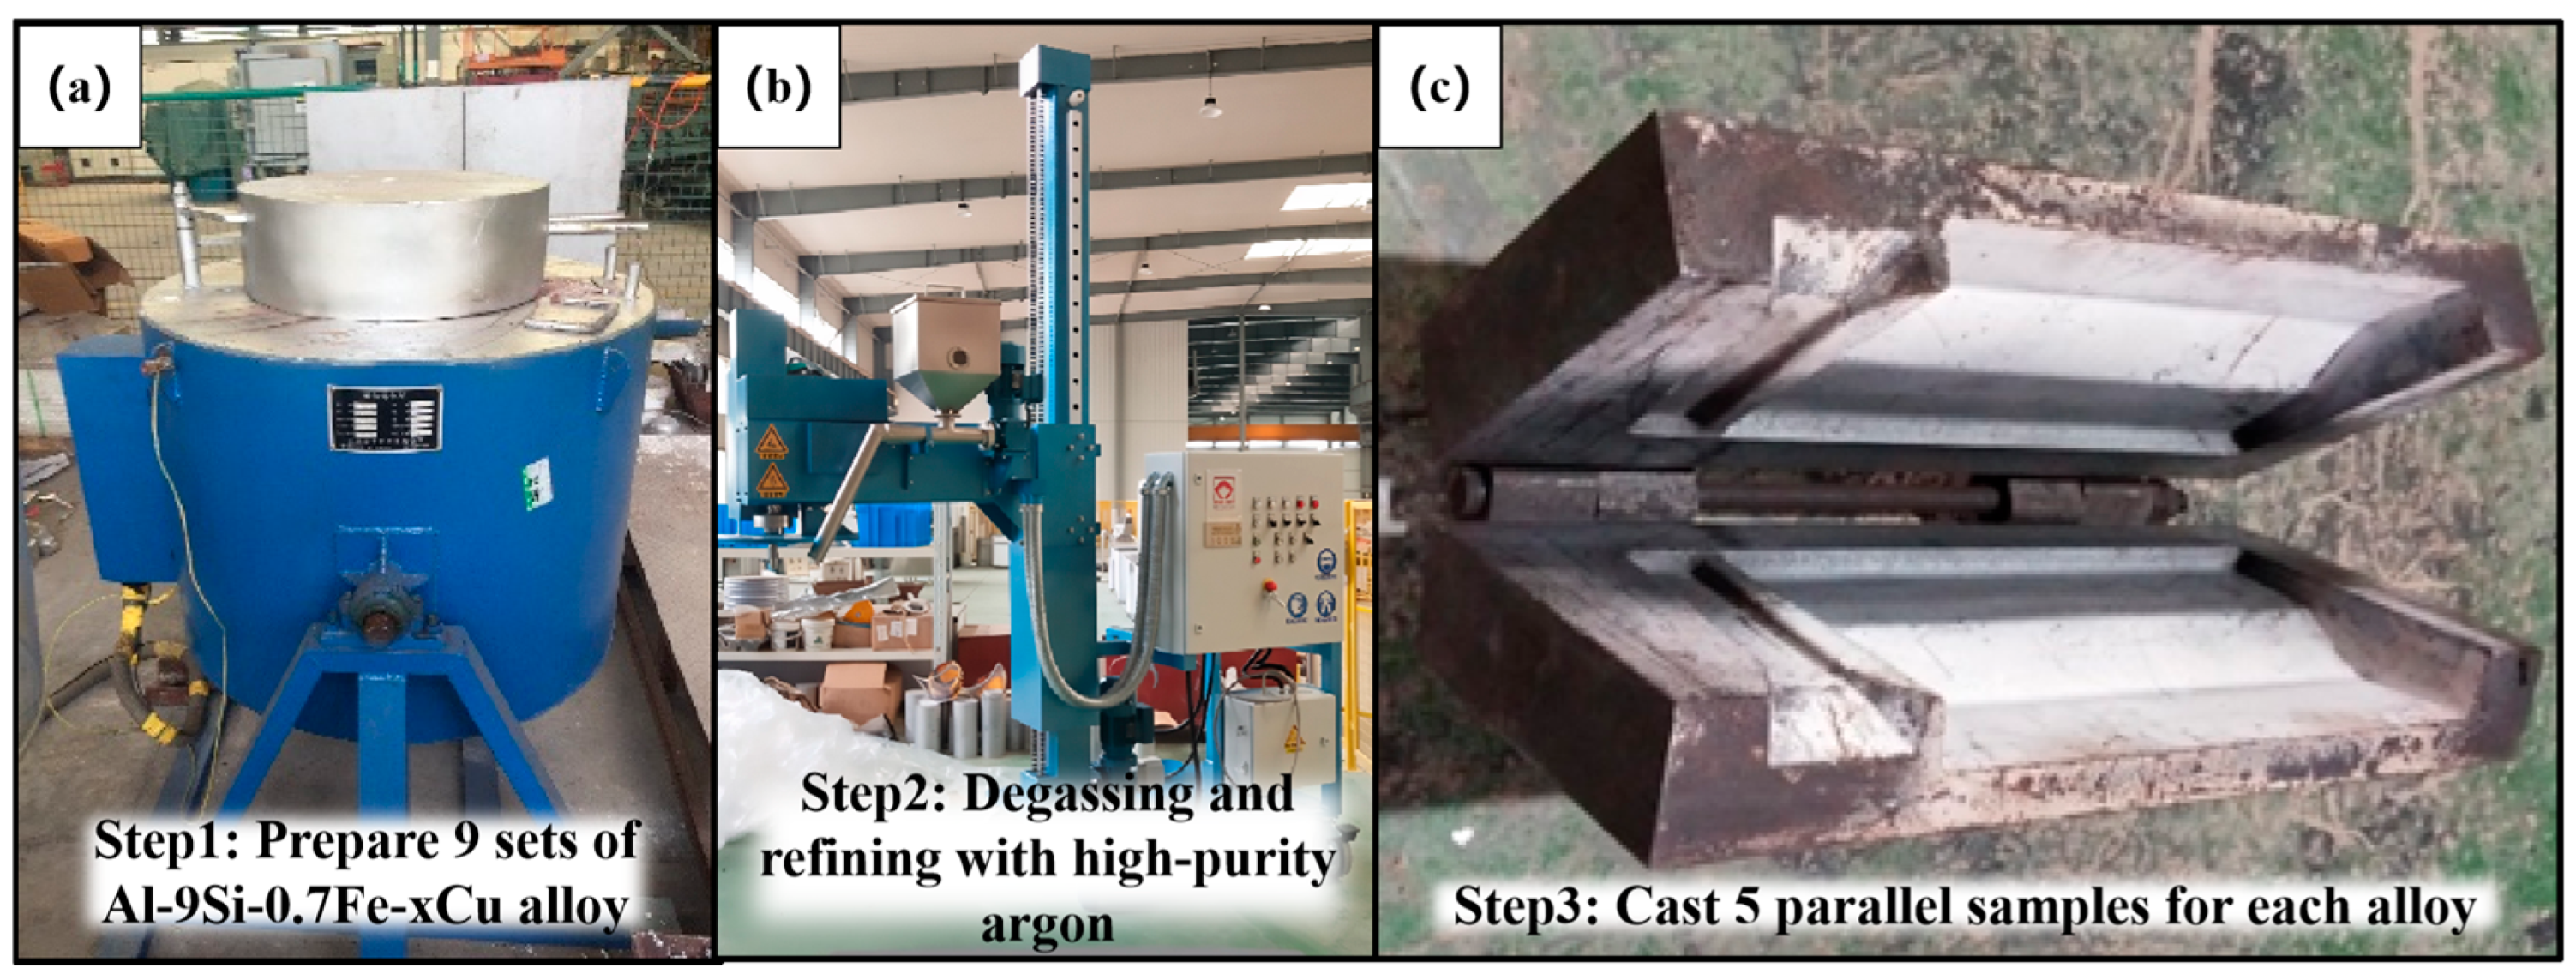
Figure 1. The sample preparation process: (a) melting furnace; (b) degasser; (c) permanent mold casting die.
Metals 16 00501 g001
Figure 2. Metallographic structure of Al-9Si-0.7Fe-xCu alloy: (a) 0.1 wt.% Cu; (b) 0.2 wt.% Cu; (c) 0.3 wt.% Cu; (d) 0.5 wt.% Cu; (e) 0.7 wt.% Cu; (f) 0.9 wt.% Cu; (g) 1.2 wt.% Cu; (h) 1.5 wt.% Cu; (i) 2.0 wt.% Cu.
Metals 16 00501 g002
Figure 3. SDAS statistical results of Al-9Si-0.7Fe-xCu alloy.
Metals 16 00501 g003
Figure 4. Eutectic structure morphology of Al-9Si-0.7Fe-xCu alloy: (a) 0.1 wt.% Cu; (b) 0.2 wt.% Cu; (c) 0.3 wt.% Cu; (d) 0.5 wt.% Cu; (e) 0.7 wt.% Cu; (f) 0.9 wt.% Cu; (g) 1.2 wt.% Cu; (h) 1.5 wt.% Cu; (i) 2.0 wt.% Cu.
Metals 16 00501 g004
Figure 5. Quantitative analysis results of eutectic structure of Al-9Si-0.7Fe-xCu alloy: (a) average grain size of eutectic Si; (b) spacing between Si particles; (c) shape factor of Si particles; (d) area ratio of the Si phase.
Metals 16 00501 g005
Figure 6. XRD pattern (a) and statistical results of cell parameters (b) of Al-9Si-0.7Fe-xCu alloy.
Metals 16 00501 g006
Figure 7. Cu solid solubility in Al-9Si-0.7Fe-xCu alloy.
Metals 16 00501 g007
Figure 8. EPMA surface scan of Al-9Si-0.7Fe-0.1Cu alloy.
Metals 16 00501 g008
Figure 9. EPMA surface scan of Al-9Si-0.7Fe-0.5Cu alloy.
Metals 16 00501 g009
Figure 10. Thermal conductivity of Al-9Si-0.7Fe-xCu alloys with different Cu contents.
Metals 16 00501 g010
Figure 11. Room temperature tensile properties of Al-9Si-0.7Fe-xCu alloys with different Cu contents.
Metals 16 00501 g011
Figure 12. Comparison of measured thermal conductivity data and model calculation values for Al-9Si-0.7Fe-xCu alloy: (a) original model; (b) modified model.
Metals 16 00501 g012
Table 1. The chemical composition of smelting alloys (wt.%).
Alloy No.Designed CompositionActual Alloy Composition
SiFeCuSrAl
1Al-9Si-0.7Fe-0.1Cu8.860.670.080.026Bal.
2Al-9Si-0.7Fe-0.2Cu8.890.650.200.027Bal.
3Al-9Si-0.7Fe-0.3Cu8.900.670.300.029Bal.
4Al-9Si-0.7Fe-0.5Cu8.960.670.500.032Bal.
5Al-9Si-0.7Fe-0.7Cu8.910.660.710.022Bal.
6Al-9Si-0.7Fe-0.9Cu8.880.670.930.022Bal.
7Al-9Si-0.7Fe-1.2Cu8.920.681.200.031Bal.
8Al-9Si-0.7Fe-1.5Cu9.120.671.510.025Bal.
9Al-9Si-0.7Fe-2.0Cu9.140.682.040.033Bal.
Disclaimer/Publisher’s Note: The statements, opinions and data contained in all publications are solely those of the individual author(s) and contributor(s) and not of MDPI and/or the editor(s). MDPI and/or the editor(s) disclaim responsibility for any injury to people or property resulting from any ideas, methods, instructions or products referred to in the content.