Article

Tensile and Low-Cycle Fatigue Properties of GH1059 Superalloy at RT and 550 °C

Department of Reactor Engineering Technology Research, China Institute of Atomic Energy, Beijing 102413, China
*
Author to whom correspondence should be addressed.
Metals 2026, 16(4), 416; https://doi.org/10.3390/met16040416
Submission received: 22 January 2026 / Revised: 12 February 2026 / Accepted: 14 February 2026 / Published: 10 April 2026
(This article belongs to the Section Metal Failure Analysis)

Abstract

The tensile and low-cycle fatigue properties of a Fe-Ni-based GH1059 superalloy were investigated at room temperature (RT, about 25 °C) in air and at 550 °C in high vacuum. The tensile curve at 550 °C indicated that dynamic strain aging in the material at high temperature. The fatigue life and stress-strain behavior were analyzed, and fatigue parameters were obtained. The fatigue life decreased with increasing temperature. The cyclic deformation behaviors were composed of three stages at RT: cyclic hardening, gradual cyclic softening, and final rapid rupture. The cyclic deformation behaviors at 550 °C were different: the second stage of specimen at 0.4% strain amplitude was cyclic hardening and the second stage of specimen at 0.9% strain amplitude was stress saturation. The difference is because of dynamic strain aging at high temperature. Based on the fatigue data, the changes of friction stress were analyzed, and the results reflected microstructural evolution associated with fatigue behavior. The microstructural evolution during fatigue process was observed using a scanning electron microscope and a transmission electron microscope. The changes in dislocation densities accounted for the effects of temperature and strain amplitude on the fatigue behavior of GH1059.

1. Introduction

Over the past 50 years, nuclear power has provided a significant amount of clean and economical energy for humanity and plays a crucial role in future energy systems. To further advance nuclear energy development, the Generation IV International Forum (GIF) was established in 2001, focusing on the research and testing of Generation IV nuclear reactor systems for performance and feasibility [1]. Among the Generation IV systems, the sodium-cooled fast reactor (SFR) is the most mature fast reactor technology, with extensive operational experience worldwide [2]. China has successfully constructed the China Experimental Fast Reactor (CEFR) and the China Demonstration Fast Reactor (CDFR). In the design of the demonstration reactor, a passive shutdown system (a liquid-suspended passive shutdown assembly) has been adopted to enhance inherent safety. This passive shutdown mechanism consists of a passive component and a passive rod drive mechanism. The guide tube, located at the outlet of the liquid sodium in the reactor core, provides both a movement channel and guidance for the passive rod drive mechanism [3]. Any failure of the guide tube, such as fracture during reactor operation, could lead to severe accident conditions. During service, the guide tube is subjected to significant impact forces caused by the rapid drop of control rods during reactor startup, shutdown, or emergency scrams, resulting in low-cycle fatigue damage. Therefore, studying the low-cycle fatigue properties of the guide tube material is of great importance for the design and service life assessment of guide tubes in reactors.
Nickel-based superalloys exhibit excellent high-temperature oxidation resistance, corrosion resistance, as well as high elevated-temperature strength, creep strength, and rupture strength, making them widely used as materials for high-temperature structural components in the aerospace sector [4,5,6,7]. Owing to these properties, GH1059 superalloy, a solution-strengthened iron-nickel-based superalloy, has been selected as the material for the guide tube in the CDFR.
Over the past few decades, the fatigue performance of nickel-based alloys has been extensively studied. Fournier et al. investigated low-cycle fatigue behavior of Inconel 718 at RT and 823 K [8]. They found that temperature effect on elastic strain was minimal while plastic strain decreased significantly with increasing temperature. Worthem et al. analyzed the microstructural evolution of Inconel 718 during low-cycle fatigue deformation and attributed the occurrence of cyclic softening to the dissolution of precipitates during the cycling process [9]. Zhang et al. carried out low-cycle fatigue experiments of GH4698 at 650 °C [10]. The fatigue life of GH4698 is significantly influenced by temperature, and the total strain amplitude also considerably affects its cyclic hardening and softening behavior. Kulig et al. demonstrated that pack aluminizing effectively reduced surface roughness and sealed surface pores in additively manufactured Ni-based alloy 699XA, leading to a significant improvement in fatigue life, especially at low stress amplitudes [11]. Rai analyzed the low-cycle fatigue behavior of polycrystalline CM 247 alloy [12]. This study elucidated that local crystallography, particularly grains with low Schmid factors and strain-induced recrystallized grains, played a critical role in deflecting and impeding fatigue crack propagation in the superalloy under high-temperature low-cycle fatigue. Li et al. studied the influence of oxidation behavior on the low-cycle fatigue behavior of Ni-based superalloy, and they found that while oxidation-induced brittle surface oxides accelerated crack initiation, the spallation of weak outer layers and oxidation-promoted dislocation recovery can conversely inhibit crack initiation and decelerate crack propagation [13]. Cao et al. demonstrated that slow near-threshold fatigue crack growth in a Ni-based superalloy induced significant microstructural evolution far beyond the classical macroscopic crack-tip plastic zone [14].
While extensive research has been conducted on nickel-based superalloys, the deformation mechanisms governing the low-cycle fatigue cyclic hardening and softening behaviors of iron-nickel-based superalloys, as well as the influence of microstructural evolution on fatigue performance and fracture mechanisms, remain inadequately understood. Furthermore, there is currently a lack of systematic studies on the low-cycle fatigue properties of GH1059 superalloy. The main purpose of the present study is to evaluate the fatigue behavior and analyze the failure mechanism of GH1059 superalloy. To achieve this goal, the tensile tests of GH1059 superalloy were conducted to help analyze its fatigue behavior. The influence of temperature and cyclic strain amplitude on fatigue behavior were obtained according to the fatigue tests performed under different conditions. To explore the failure mechanism of GH1059 superalloy, the microstructural evolution during the tests was observed.

2. Materials and Methods

2.1. Materials

The chemical composition of GH1059 superalloy used in this study is listed in Table 1. GH1059 superalloy features a fully austenitic grain structure with a grain size of about 80 μm. The superalloy is a high-temperature deformation alloy characterized by a high degree of alloying and strong deformation resistance, which complicates its smelting and manufacturing processes. In recent years, China has achieved mass production of GH1059 superalloy through vacuum induction remelting and protective atmosphere electric slag smelting. The alloy is subsequently processed into guide tubes with an outer diameter of 186 mm and an inner diameter of 104 mm via casting, hot extrusion, and cold rolling. High-temperature alloys typically contain significant amounts of elements such as tungsten (W) and molybdenum (Mo) Chromium (Cr) enhances oxidation and corrosion resistance. Molybdenum and tungsten, as solid solution strengthening elements, significantly improve the high-temperature strength and creep resistance of the matrix. Manganese (Mn) primarily plays an important role in stabilizing the austenitic structure and improving hot workability, while also providing a modest strength increase through solid solution strengthening. Aluminum (Al) contributes excellent high-temperature creep resistance. Nitrogen (N), acting as an interstitial solid solution strengthener, effectively enhances the short-term strength and stability of the alloy. Phosphorus (P) can notably improve creep rupture properties. Carbon (C) can form strengthening phases that significantly enhance alloy’s high-temperature strength, creep resistance, and rupture life. However, excessive carbon content can also lead to the formation of brittle phases, severely reducing the alloy’s ductility and fatigue performance. Thus, the carbon content must be controlled within a specified range. Lead (Pb) is a detrimental trace impurity element. Its physical and chemical properties are incompatible with nickel-based superalloy and can suppress the critical performance of the superalloy. As a result, its content must be stringently limited.

2.2. Specimens

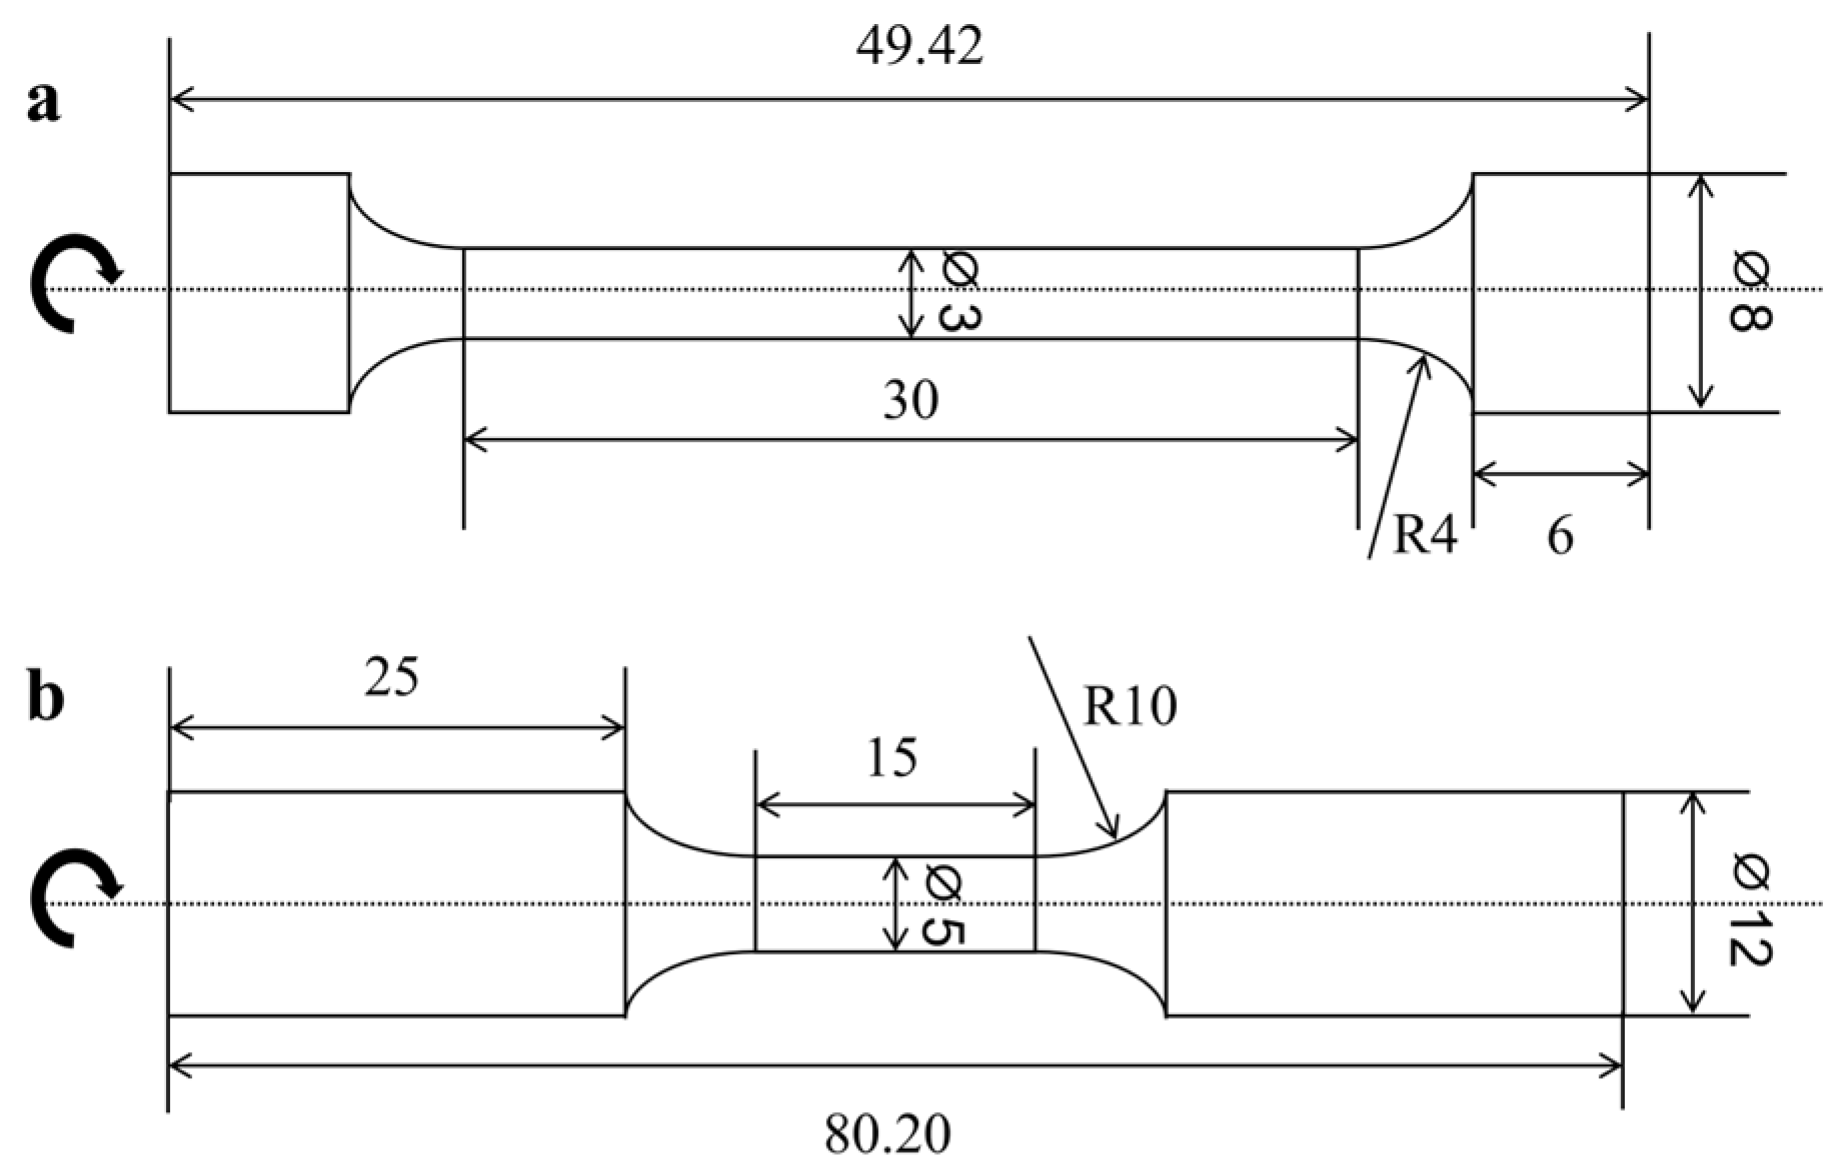
The tensile specimen and fatigue specimen used in this study are shown in Figure 1. They were sampled from a position at a depth of 1/4 of the thickness from the surface of the guide tube. The gauge length of the tensile specimen is 30 mm, and the gauge diameter is 3 mm. The gauge length of the fatigue specimen is 15 mm, and the gauge diameter is 5 mm. The specimens were polished along the longitudinal direction to reduce the surface roughness to less than 0.2 μm and eliminate all tool marks from radial turning.
The disc specimens with a diameter of 3 mm were used in the transmission electron microscopy (TEM, Thermo Fisher Scientific, Waltham, MA, USA) test. The disc specimens were punched out from thin slices which were cut from the gauge section of fatigue specimens. The discs were polished to 100 μm in thickness using SiC emery paper. Then they were electro-polished with a solution of 15% perchloric acid in ethanol at −20 °C and 10 V using an electropolishing unit [15].

2.3. Testing Equipment and Method

The tensile tests and the low-cycle fatigue tests were carried out on an electro-mechanical instrument equipped with a high vacuum and high temperature furnace. The fatigue instrument has a load range of 30,000 N and a measuring accuracy of ±0.01 N. The vacuum level below 0.01 Pa could be reached. The deformation of the specimens was measured using an extensometer with two ceramic arms contacting the gauge section of the specimens. The extensometer has a measuring range of 2.5 mm and a measuring accuracy of ±1 μm.
All fatigue tests were strain-controlled. During the test, the load was a fully reversed triangular waveform, where R was −1. The strain rate of all the tests was 0.001/s. Tests conducted at RT (about 25 °C) were carried out in air, while tests at 550 °C (the service temperature of GH1059 superalloy in CDFR) were conducted in vacuum. In the high temperature tests, the specimens were held for 1 h under stress-free condition after being heated to target temperature to homogenize the specimen temperature.
To investigate the microstructural evolution and failure mechanisms of GH1059 superalloy during low-cycle fatigue tests, TEM bright-field micrographs were analyzed to examine changes in precipitates and dislocations after testing. The dislocation density of free dislocations was quantified using the mean linear intercept method. This approach involved superimposing a series of equidistant parallel lines onto TEM images and calculating the dislocation density based on the number of intersections between these lines and the dislocations, in accordance with Equation (1):
ρ = 2 i n i t i l i
The dislocation density calculation incorporated the following parameters: t for local foil thickness, li for segment length, and ni for the number of intersections between dislocations and measurement segments. A standardized foil thickness of 0.1 μm was adopted with a tolerance of ±10% [16]. This empirical value was chosen due to two practical constraints: in regions thinner than 0.1 μm, dislocation visibility was often compromised by contrast loss resulting from specimen bending, whereas regions thicker than 0.1 μm exceeded the penetration depth limits of the 200 kV TEM setup, considering requirements for image transparency [17]. The TEM features the line resolution of 102 pm, the information resolution of 140 pm, and the STEM resolution of 190 pm.

3. Results and Discussion

3.1. Tensile Tests

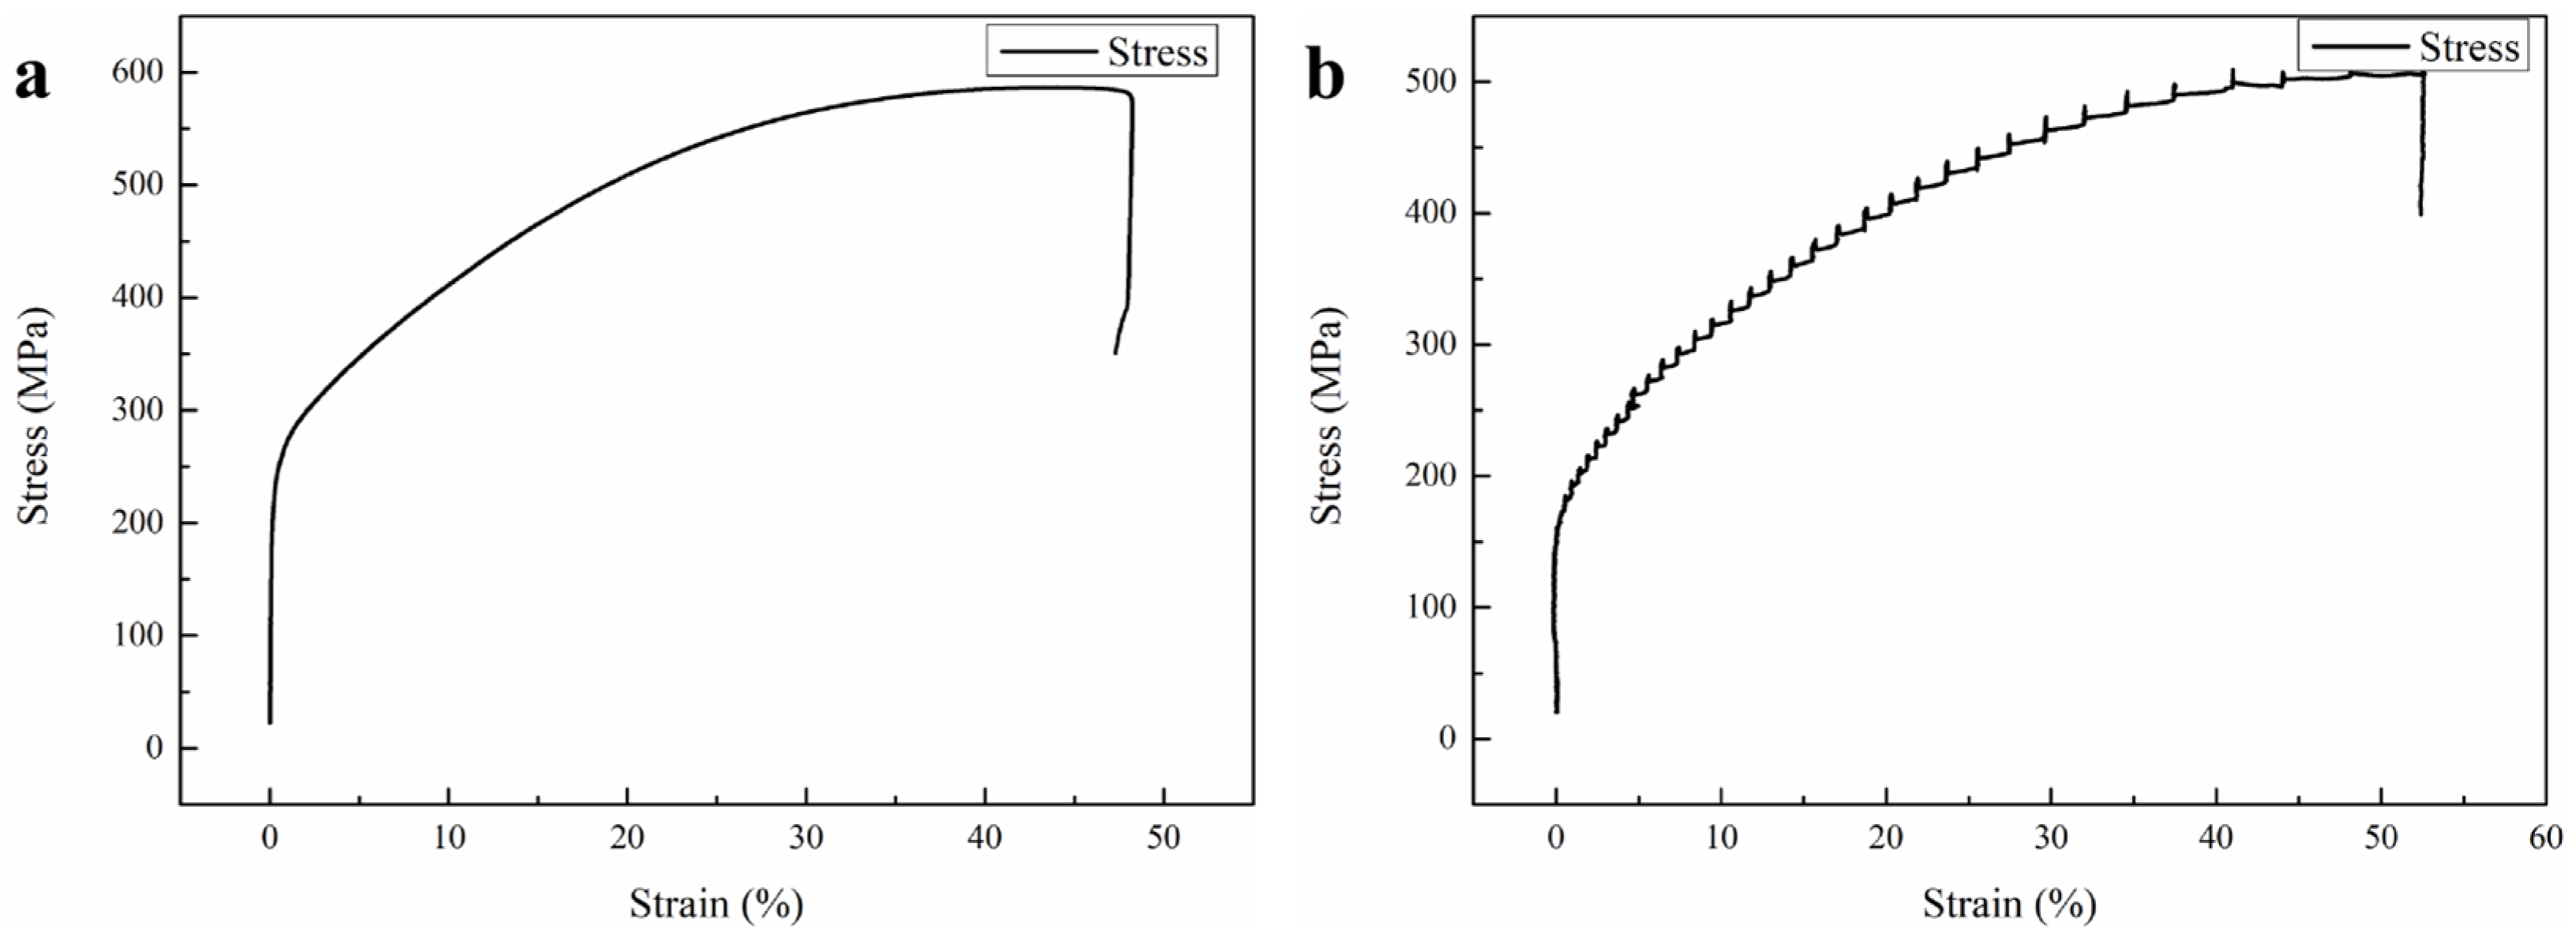
Tensile tests of GH1059 alloy were conducted at RT and 550 °C, respectively. Three specimens were exposed to tensile tests at each temperature. The obtained tensile curves are shown in Figure 2. As can be seen from the figure, the stress–strain curves of GH1059 alloy exhibit continuous yielding behavior. After the tensile specimens reach the yield point, they display significant strain hardening characteristics. Upon reaching the tensile strength, the stress value decreases rapidly with increasing strain due to necking, leading to fracture thereafter. The yield strength and tensile strength of GH1059 alloy at the two temperature points are listed in Table 2. When the temperature increases, both the yield strength and tensile strength show a significant decrease. However, the yield strength decreases by approximately 33%, while the tensile strength decreases by about 13%, indicating that the reduction in tensile strength is significantly smaller than that in yield strength.
At 550 °C, the stress–strain curve of the alloy is no longer smooth beyond a certain strain level but exhibits serrations, a phenomenon known as serrated yielding or serrated flow, which is one of the macroscopic characteristics of dynamic strain aging (DSA) [18]. According to Rodriguez’s research, the serrations observed in the GH1059 superalloy are classified as Type A [19]. Type A serrations feature peaks that are significantly higher than the normal tensile stress–strain curve. At lower temperatures, the diffusion capability of solute atoms is weak, preventing them from segregating to and pinning dislocations. It means that DSA does not occur and the tensile curve remains smooth. As the temperature increases, a certain amount of plastic deformation during tensile testing generates vacancies, providing effective pathways for solute atom diffusion. Through these vacancies, the diffusion rate of solute atoms accelerates. The pinning of dislocations by solute atoms causes the applied stress to exceed the normal level. Once the applied stress reaches a critical value, dislocations break free from pinning, leading to a sudden drop in stress. This process repeats cyclically, resulting in periodic serrations on the tensile curve [20,21].

3.2. Cyclic Stress and Fatigue Life

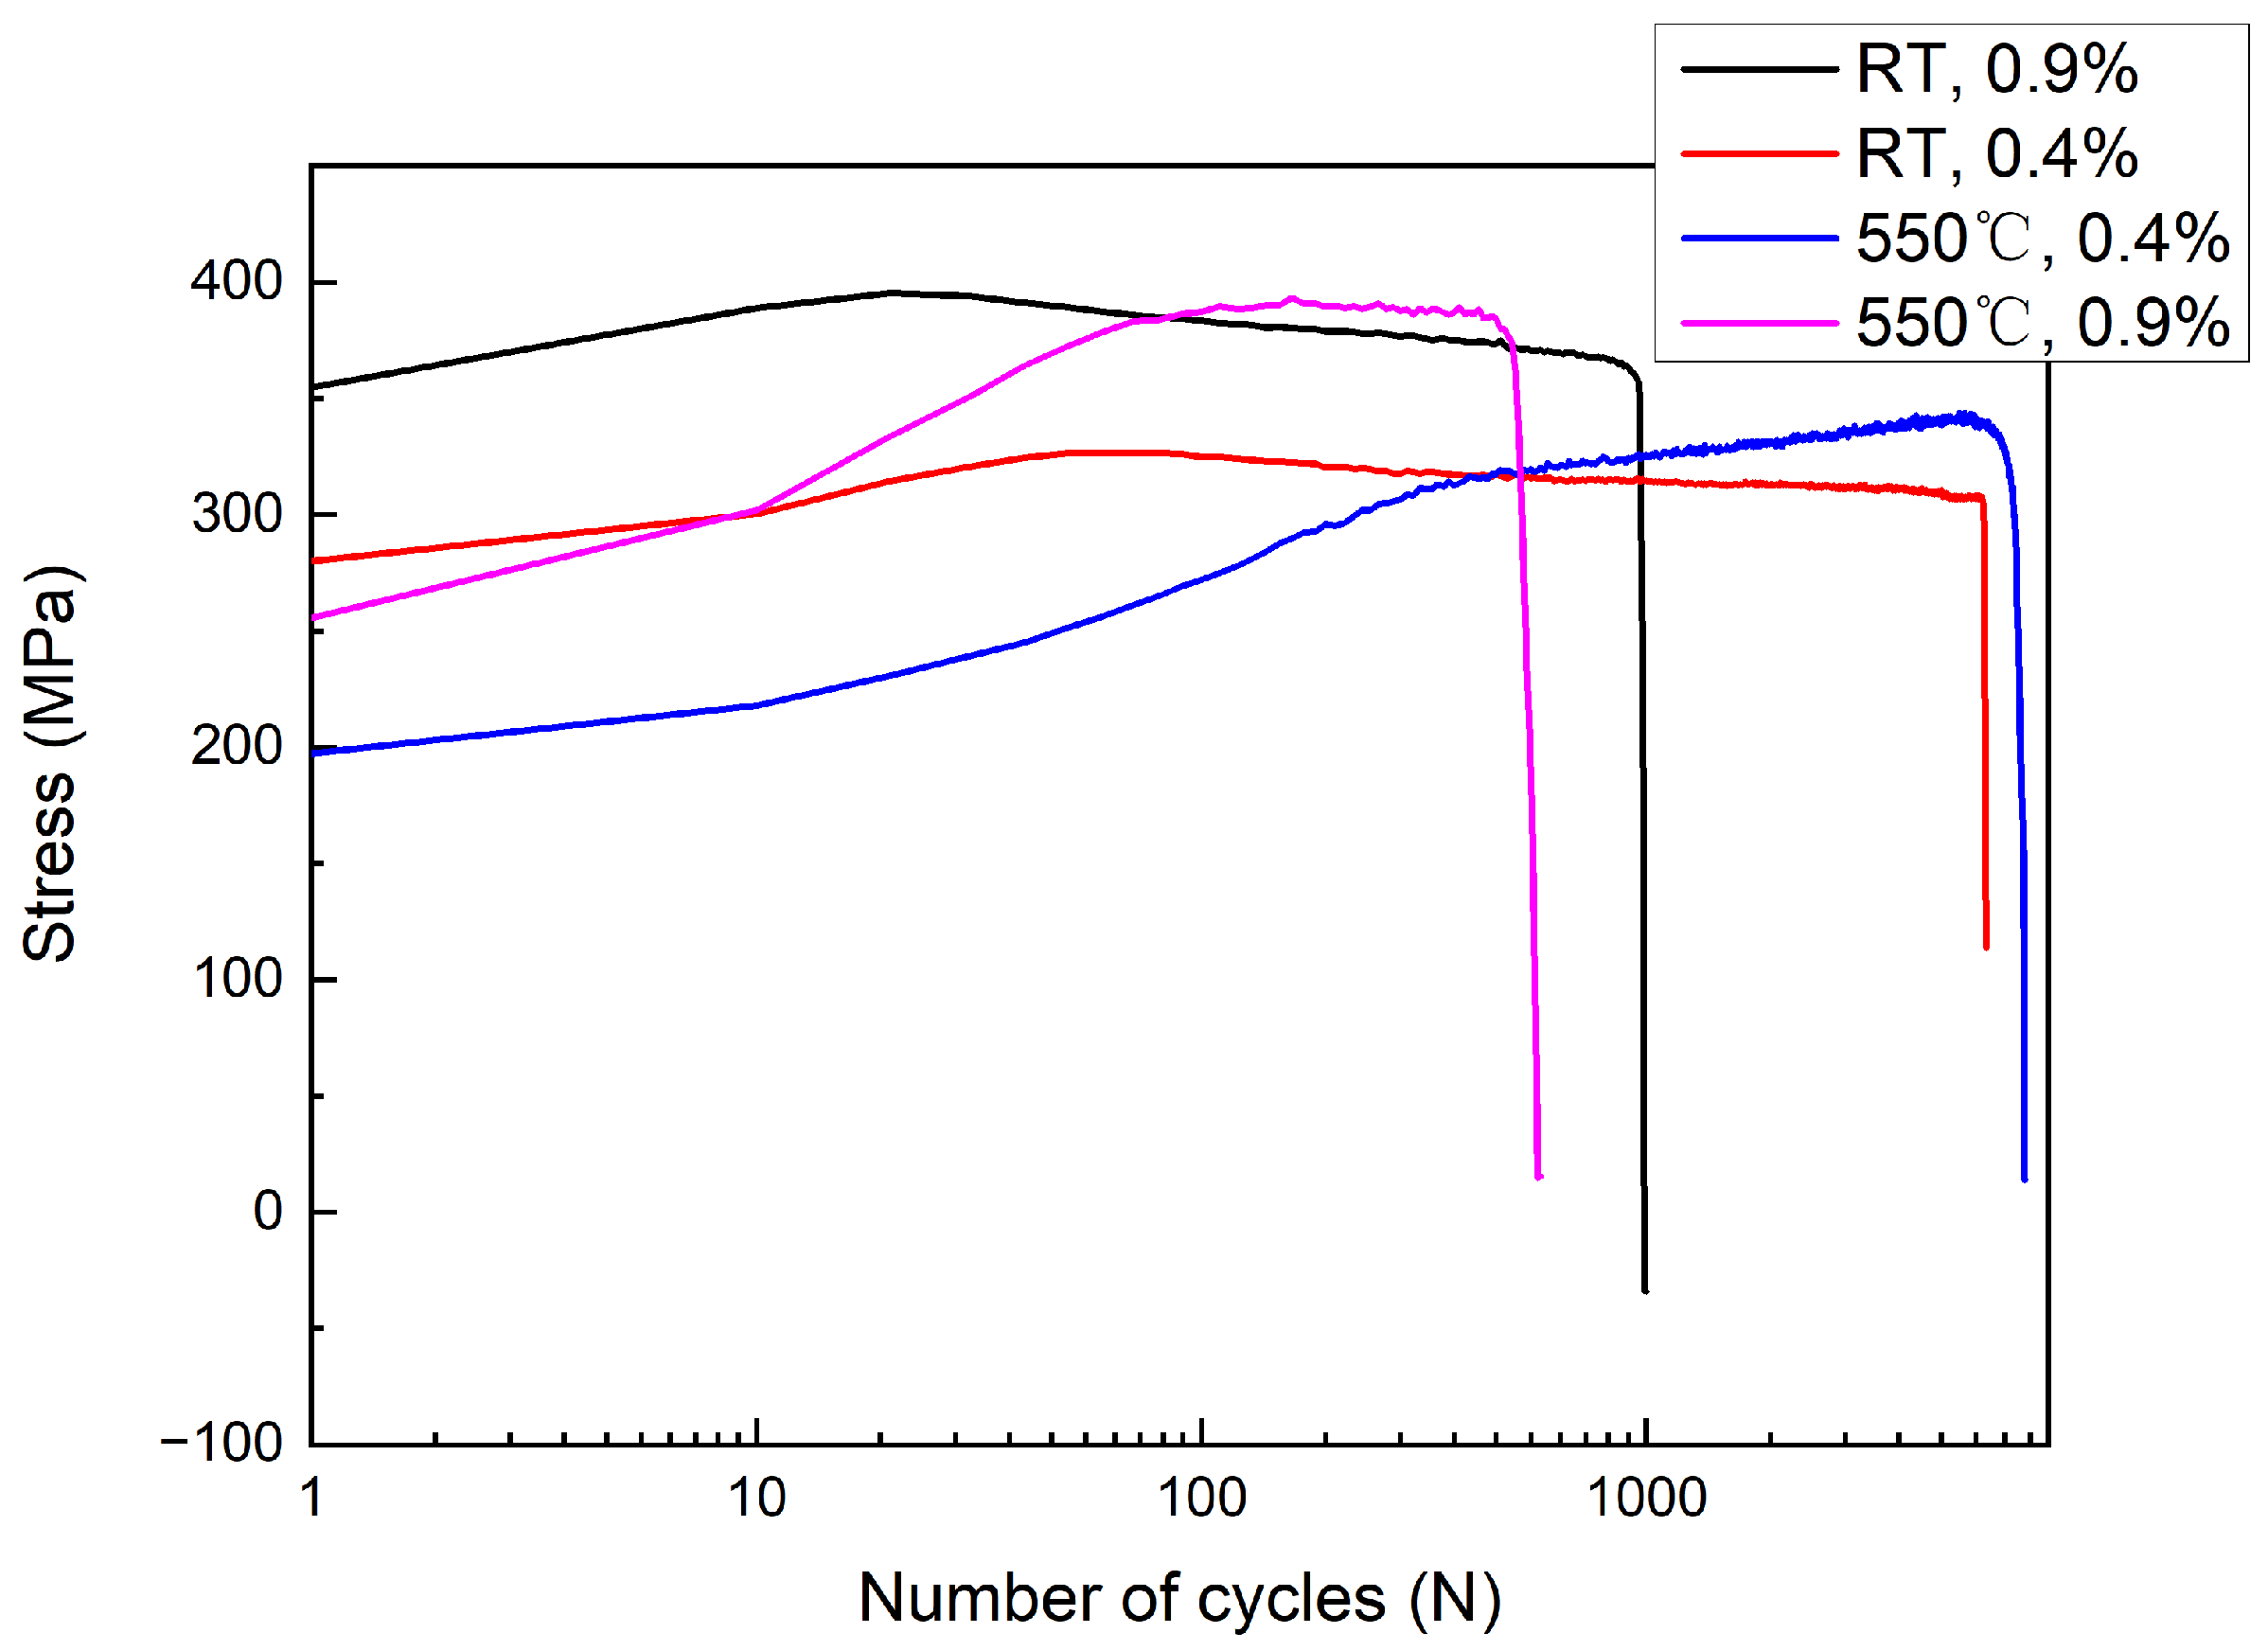
Figure 3 presents cyclic stress response curves from low-cycle fatigue tests conducted at 550 °C and RT. During low-cycle fatigue tests at RT, the GH1059 superalloy underwent three distinct stages: the initial cycles exhibited rapid cyclic hardening, reaching the peak load during the loading process; this was followed by a prolonged period of gradual cyclic softening, which accounted for the majority of the fatigue loading cycles; and finally, a sharp cyclic softening occurs in the last few cycles, leading to specimen fracture caused by fatigue crack propagation culminating in abrupt stress collapse. The cycle number of specimen fracture is defined as the fatigue life. However, in the 550 °C test with 0.9% strain amplitude, the specimen did not undergo cyclic softening after experiencing rapid cyclic hardening. Instead, it maintained a constant stress state, a phase referred to as stress saturation. In contrast, in the 550 °C test with 0.4% strain amplitude, the specimen entered a slow cyclic hardening period after initial rapid cyclic hardening, which persisted until the third stage. At elevated temperatures, the specimen exhibited fatigue behavior that differed from that observed at RT.
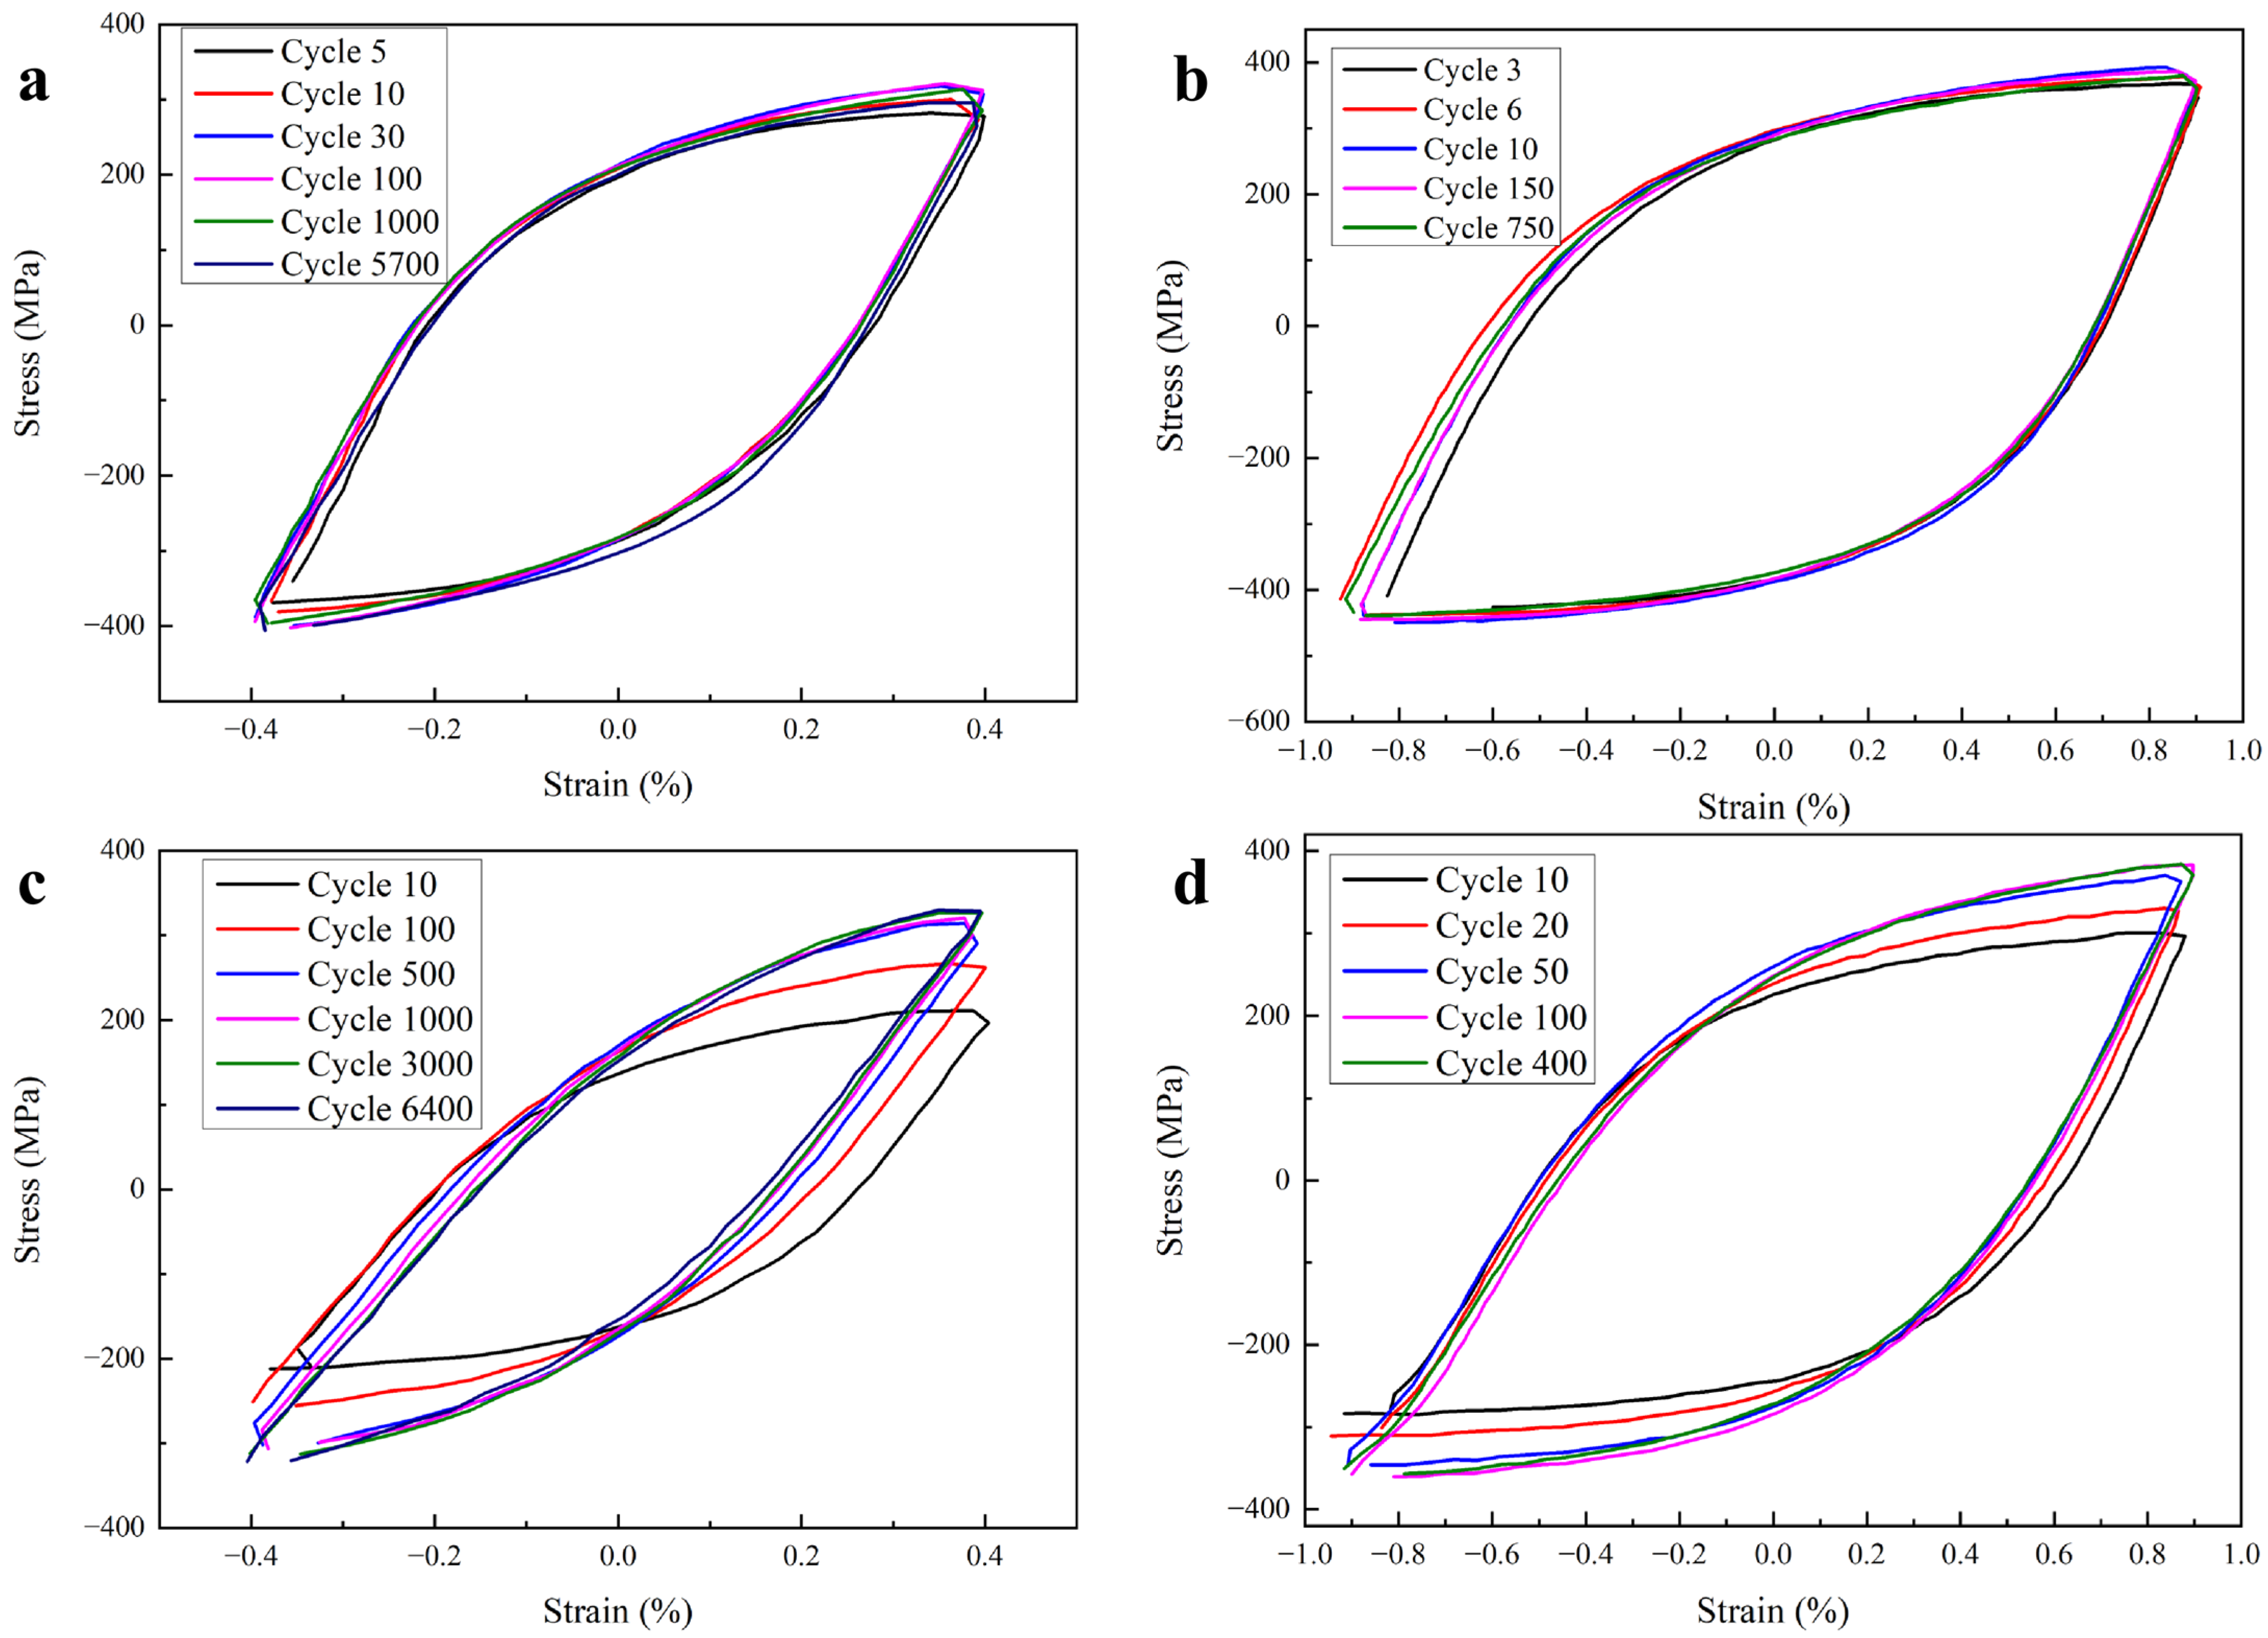
Figure 4 shows the stress–strain hysteresis loop of different cycles of tests at different conditions. At RT and 0.9% strain amplitude, the flow stress decreased from 381 MPa of cycle 150 to 368 MPa of cycle 750. At RT and 0.4% strain amplitude, the flow stress decreased from 325 MPa of cycle 100 to 300 MPa of cycle 5700. At 550 °C and 0.9% strain amplitude, the flow stress maintained constant from 404 MPa of cycle 100 to 403 MPa of cycle 400. At 550 °C and 0.4% strain amplitude, the flow stress increased from 317 MPa of cycle 500 to 330 MPa of cycle 6400. The changes of the hysteresis loops under different test conditions are in accordance with the cyclic stress response curves. The difference in cyclic stress evolution between high temperature and RT lies in the occurrence of DSA under high temperature conditions. DSA promotes dislocation multiplication while inhibiting dislocation annihilation, and the interaction among high-density dislocations enhances the material’s hardening effect.
The Coffin–Manson formula is widely used to characterize the low-cycle fatigue behavior of materials, establishing a relationship between strain amplitude and the number of cycles to failure under different deformation conditions [22], as in Equation (2):
ε t 2 = ε e 2 + ε p 2 = σ f E ( 2 N f ) b + ε f ( 2 N f ) c
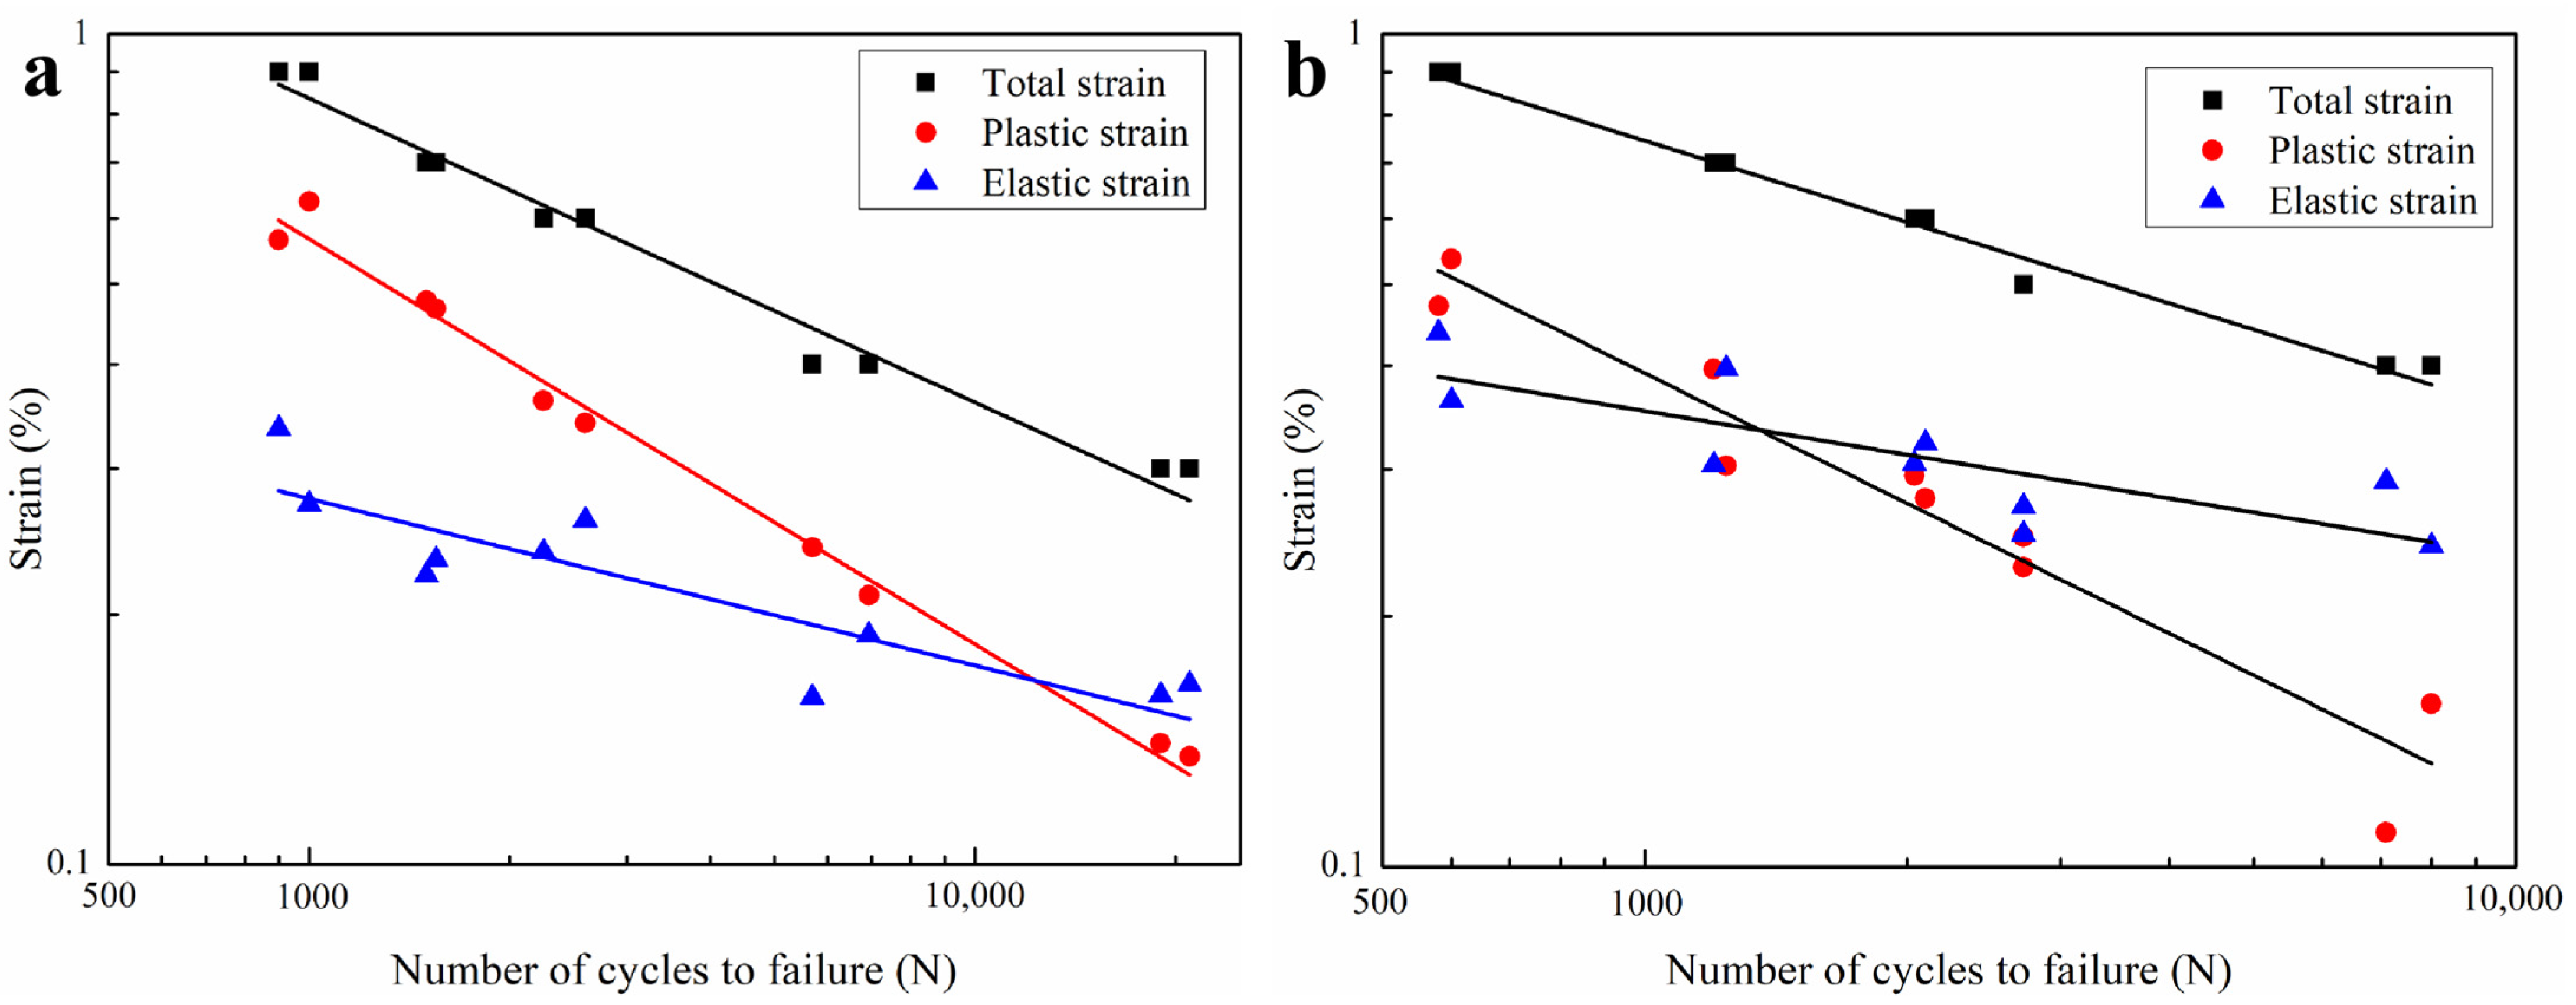
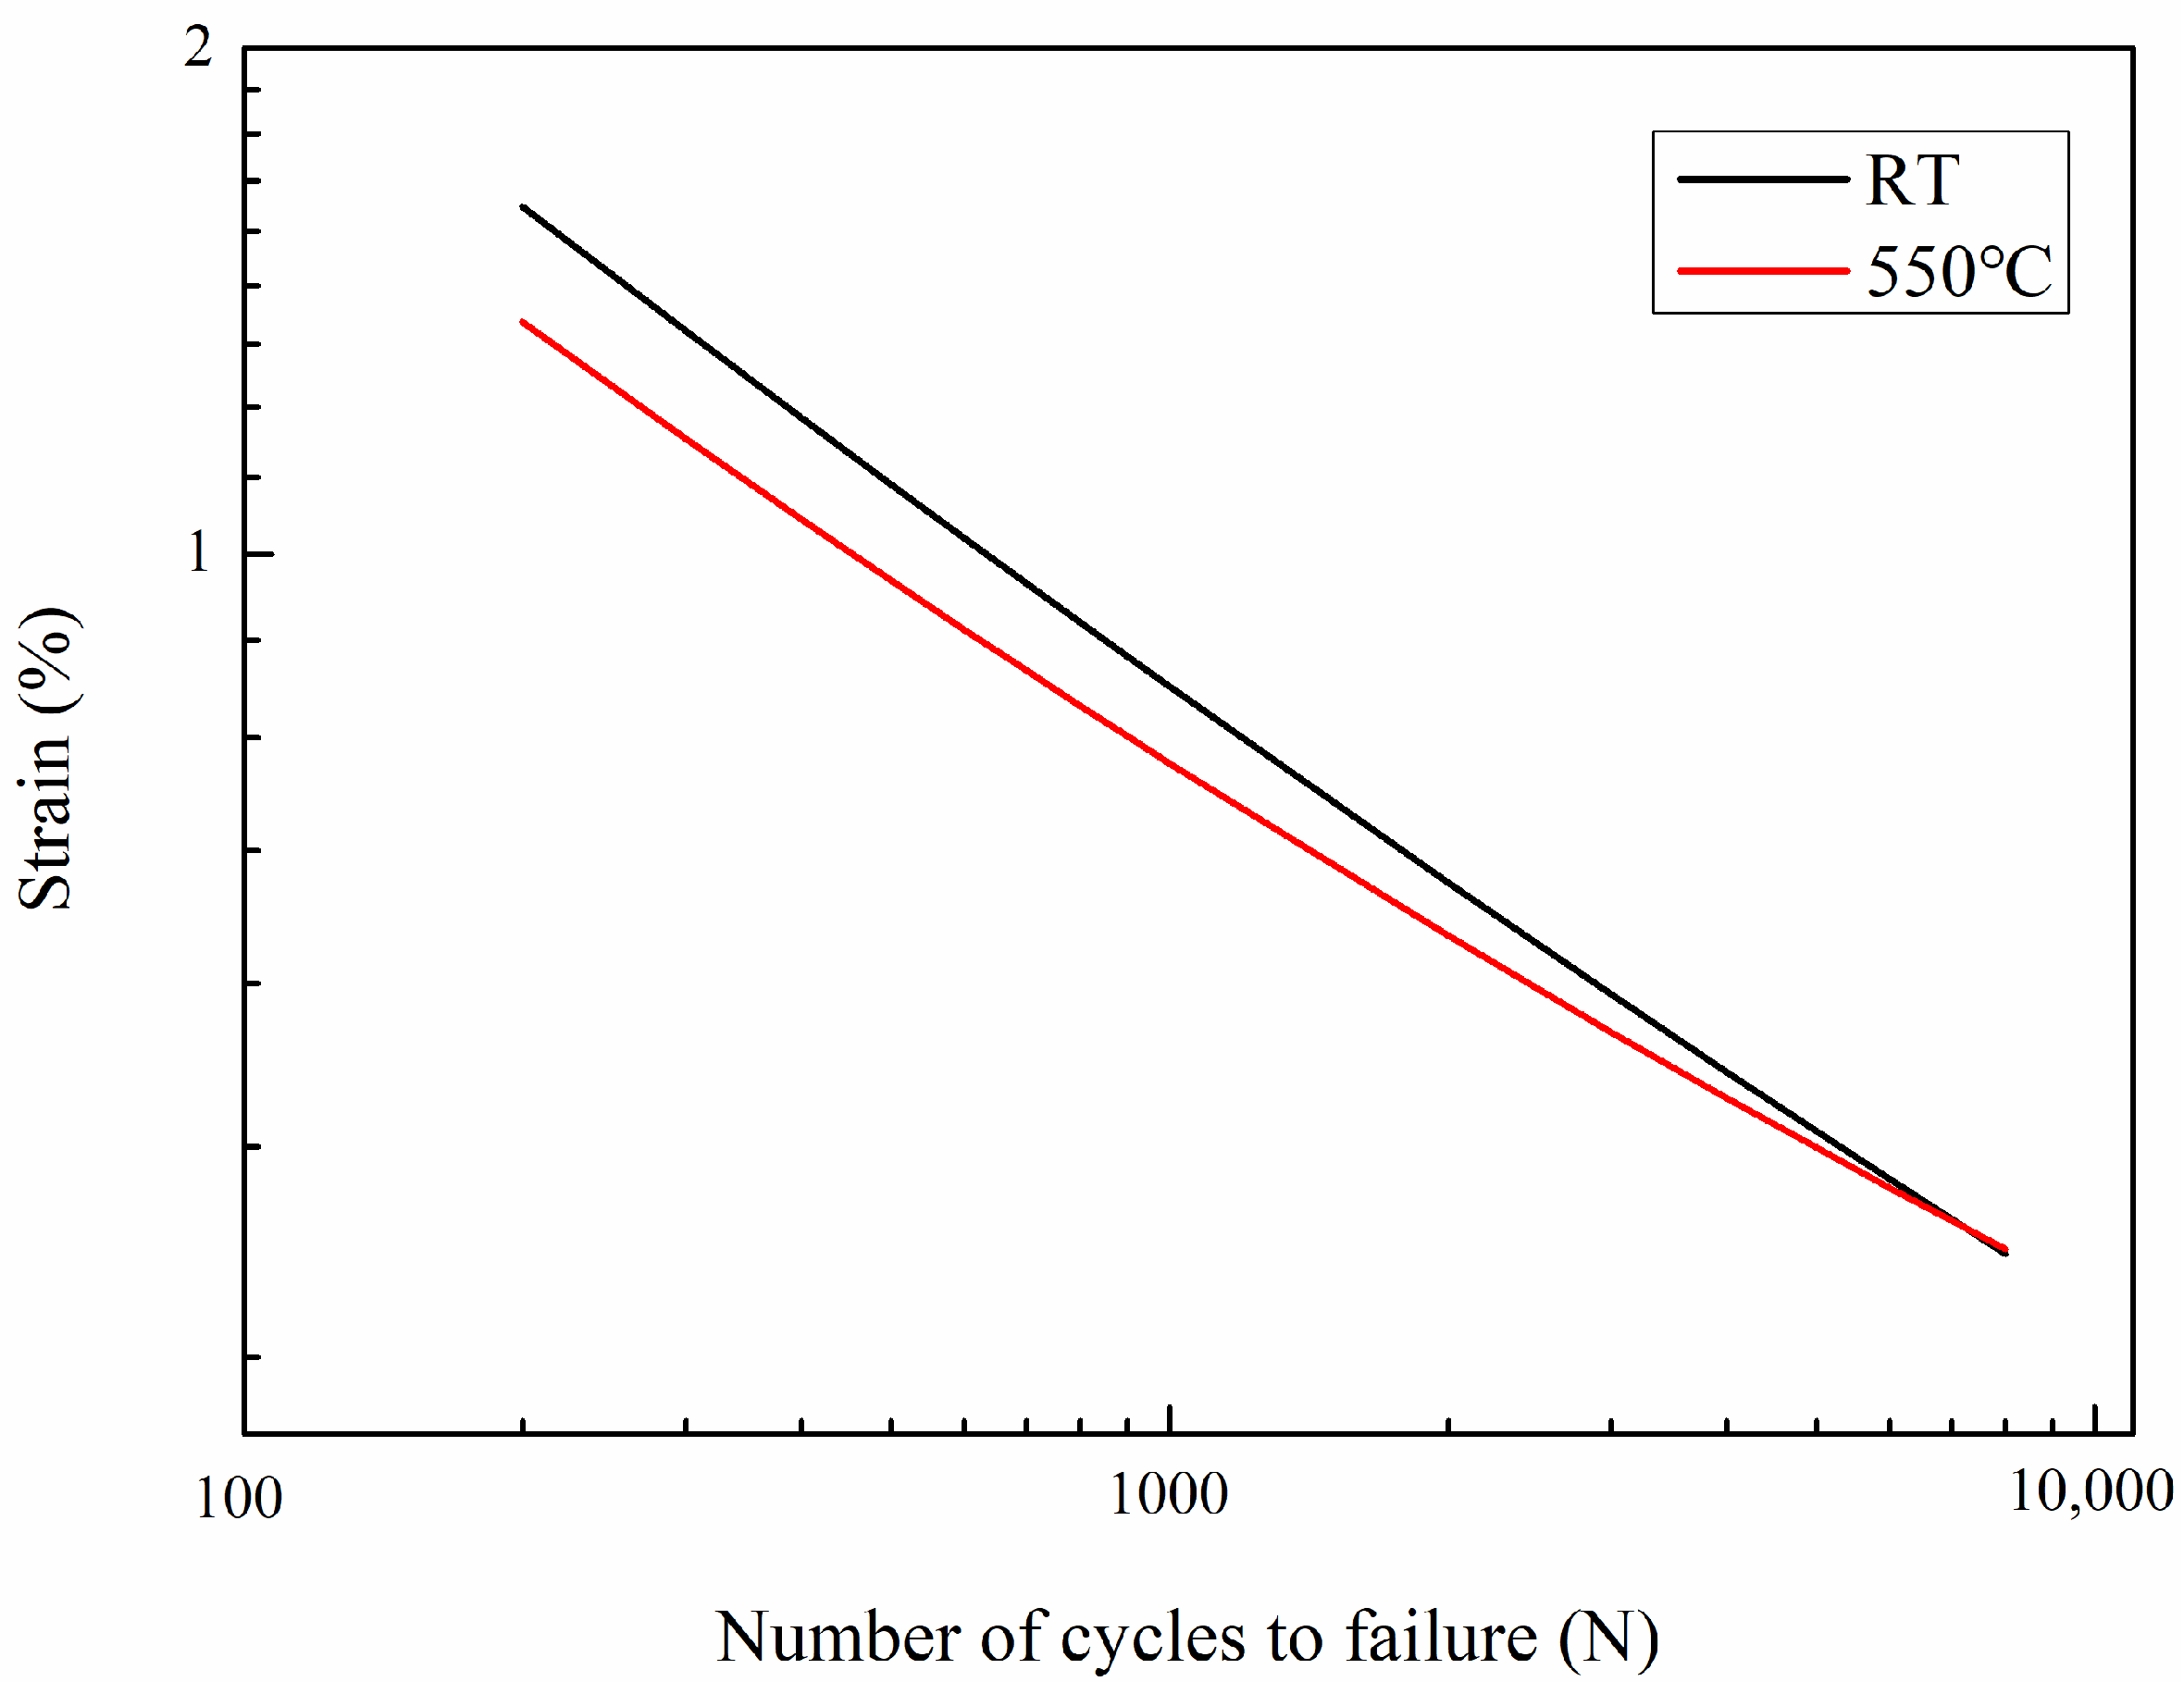
In the equation, Δεt/2 represents the total strain amplitude, Δεe/2 the elastic strain amplitude, and Δεp/2 the plastic strain amplitude; σf′ denotes the fatigue strength coefficient, b the fatigue strength exponent, εf′ the fatigue ductility coefficient, and c the fatigue ductility exponent. The elastic and plastic strain components are determined by analyzing the hysteresis loops at the mid-life point (Nf/2). The plastic strain amplitude (Δεp/2) is defined as half the span of the hysteresis loop intersecting the strain axis, while the elastic strain amplitude (Δεe/2) is calculated as the arithmetic difference between the total strain amplitude and the plastic strain amplitude. A linear fitting is performed on the elastic or plastic strain amplitude and fatigue life in logarithmic coordinates, and the corresponding parameters can be determined based on the slope and intercept of the fitted line. Fatigue behavior of GH1059 superalloy under varying temperature and strain amplitude conditions is presented in Figure 5, with corresponding parameters tabulated in Table 3. Two duplicate specimens were tested at every condition to avoid randomness. Figure 6 shows the comparison of fatigue life curves under different temperatures. Overall, the fatigue life of GH1059 superalloy at high temperatures is lower than that at room temperature, and this difference is more pronounced at higher strain amplitudes. The difference in macroscopic properties directly reflects the microstructure, and such performance variations can be explained through the microstructural evolution.

3.3. Friction Stress

During fatigue testing, the friction stress (τf) is the major part of the flow stress responsible for plastic strain. Friction stress originates from short-range obstacles that impede dislocation motion, such as lattice resistance, precipitate particles, dislocation networks, and foreign atoms. Its changes during cyclic loading can be attributed to the density variation of mobile dislocations within subgrains [23,24,25,26]. Friction stress can be calculated using Equation (3):
τ f = 1 2 ( τ m a x + τ y )
τmax denotes the maximum peak tensile stress, and τy represents the yield stress. The maximum peak tensile stress τmax is the max stress of the hysteresis loop of calculated τf. The yield stress τy is determined as the offset yield strength corresponding to a specified plastic strain, in accordance with Cottrell’s method [27].
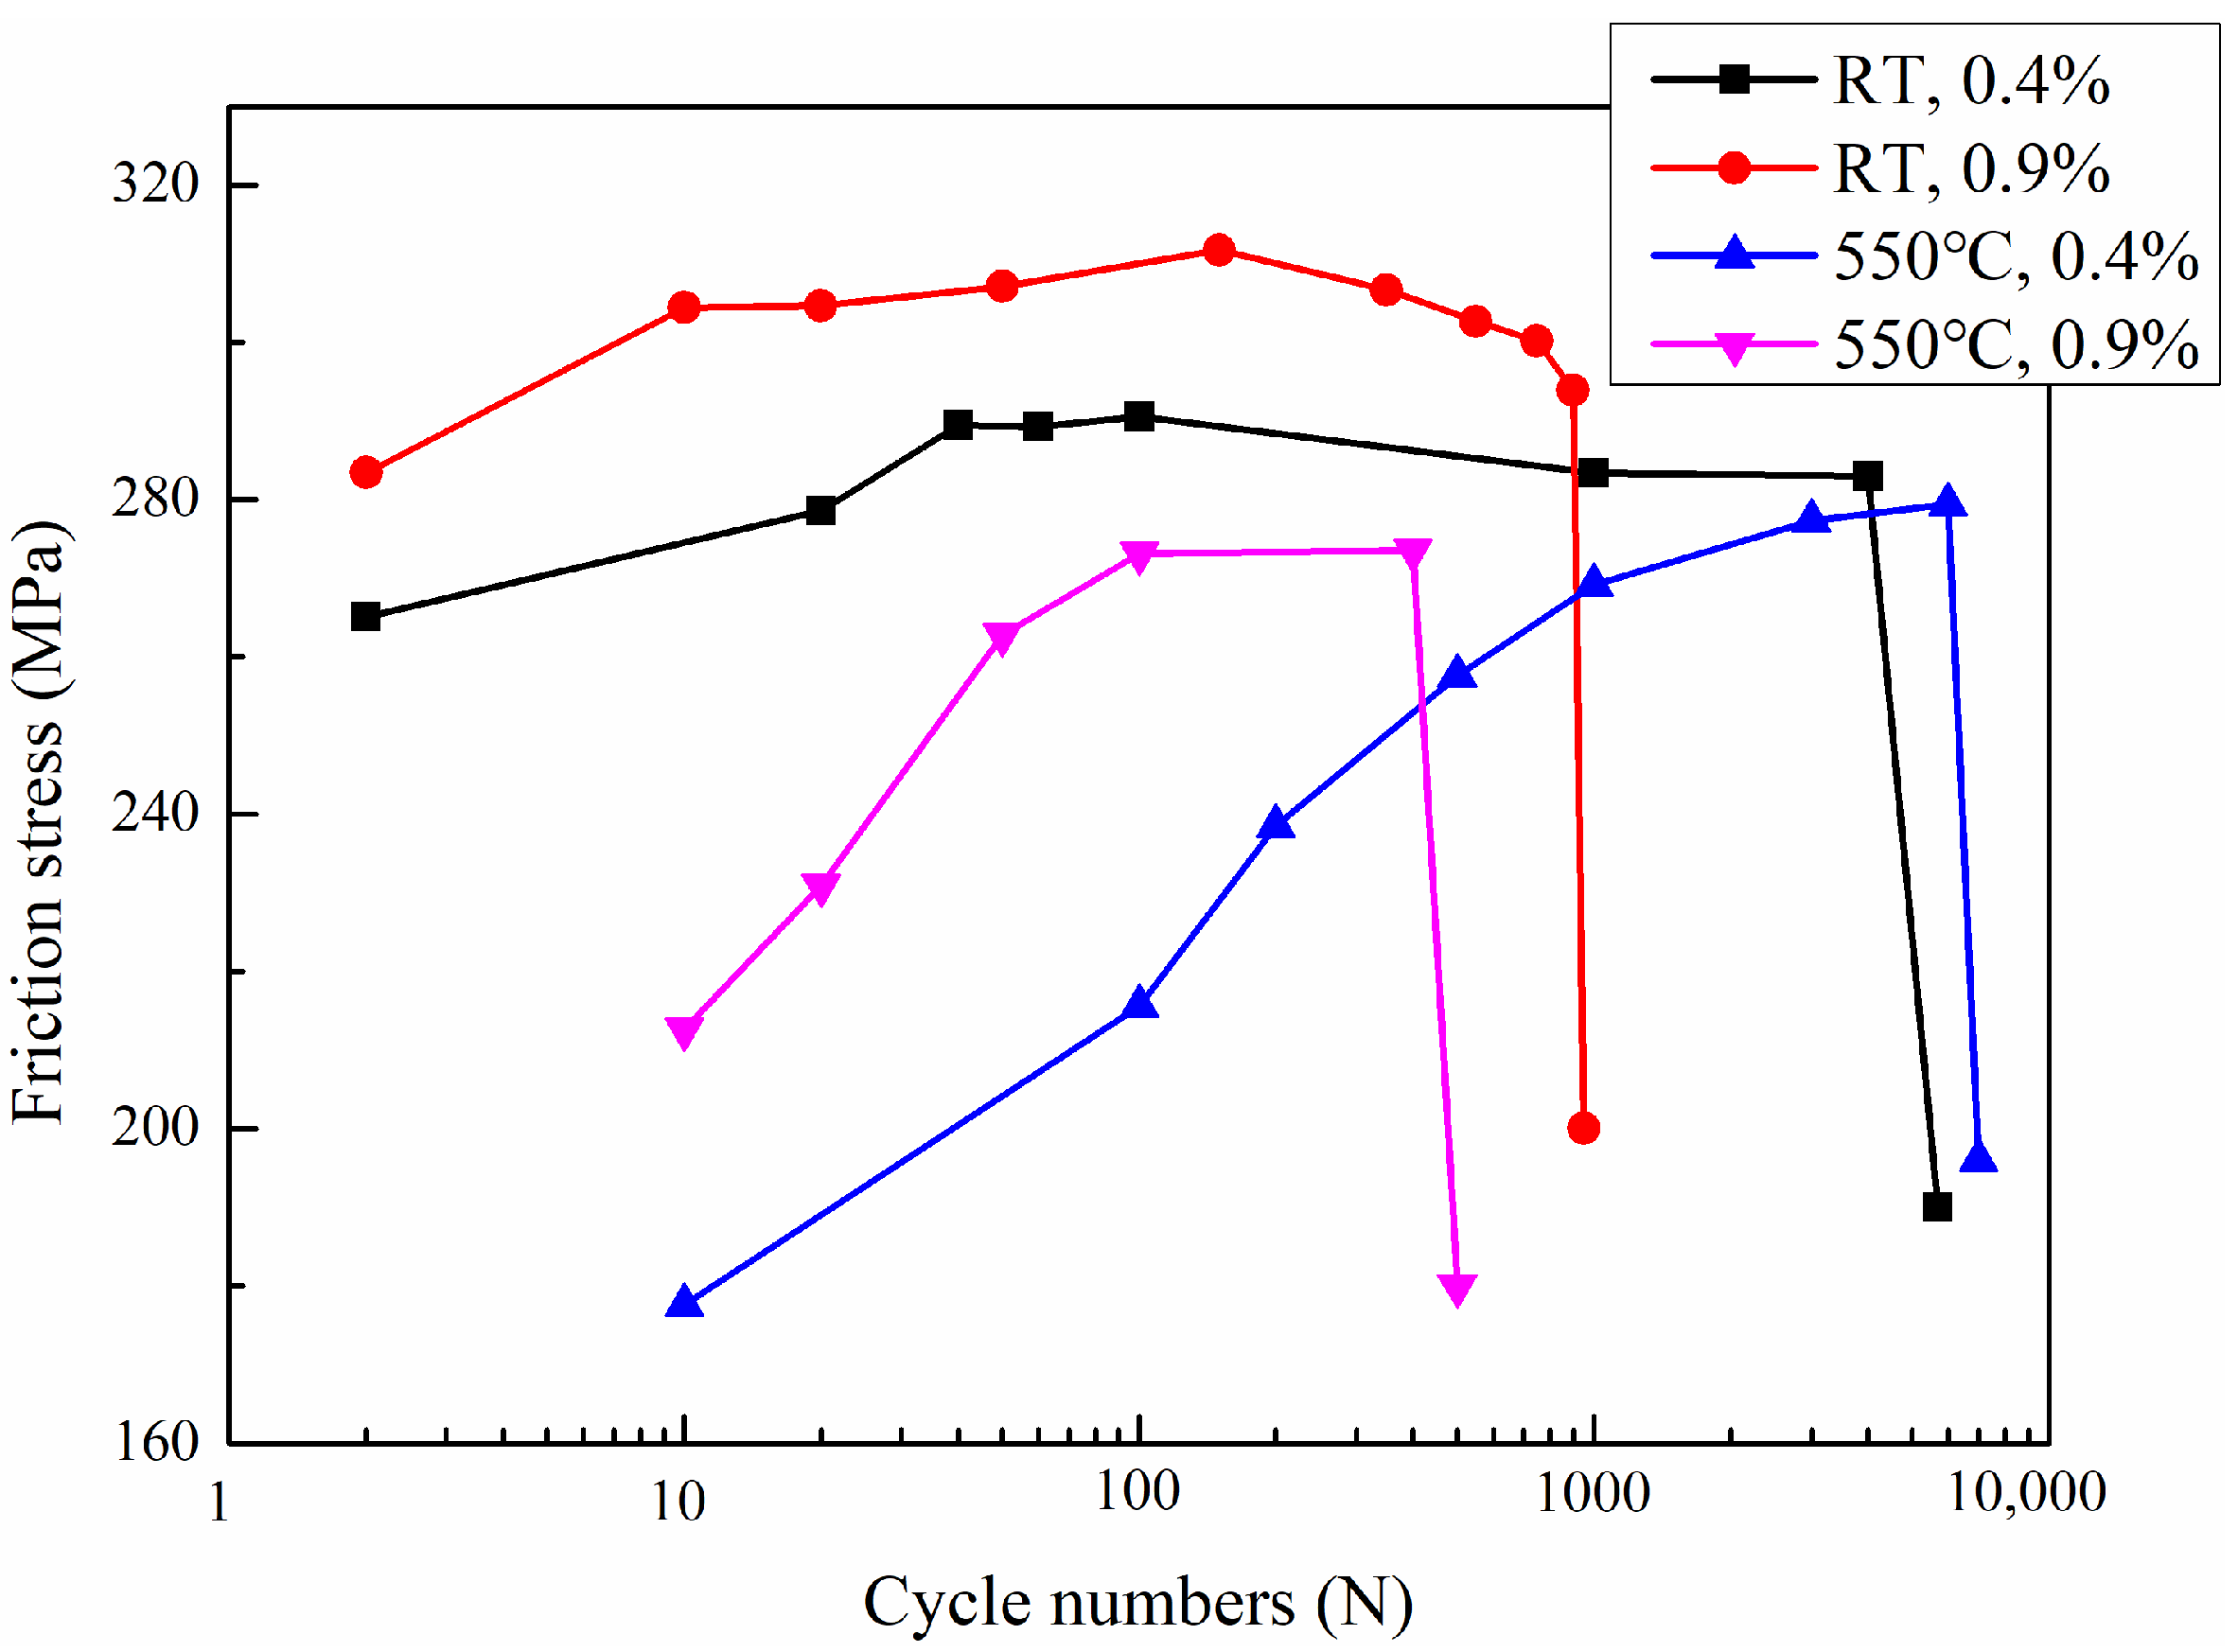
Figure 7 shows the variation of friction stress in GH1059 superalloy under different conditions. Under all test conditions, the friction stress curves exhibit a behavior similar to cyclic stress response curves, experiencing three stages. These results suggest that the change in friction stress is a key factor responsible for the fatigue behavior of GH1059 superalloy. Throughout the fatigue process, the evolution of short-range obstacles (such as dislocation density) plays a dominant role.

3.4. Fracture Behavior and Mechanisms

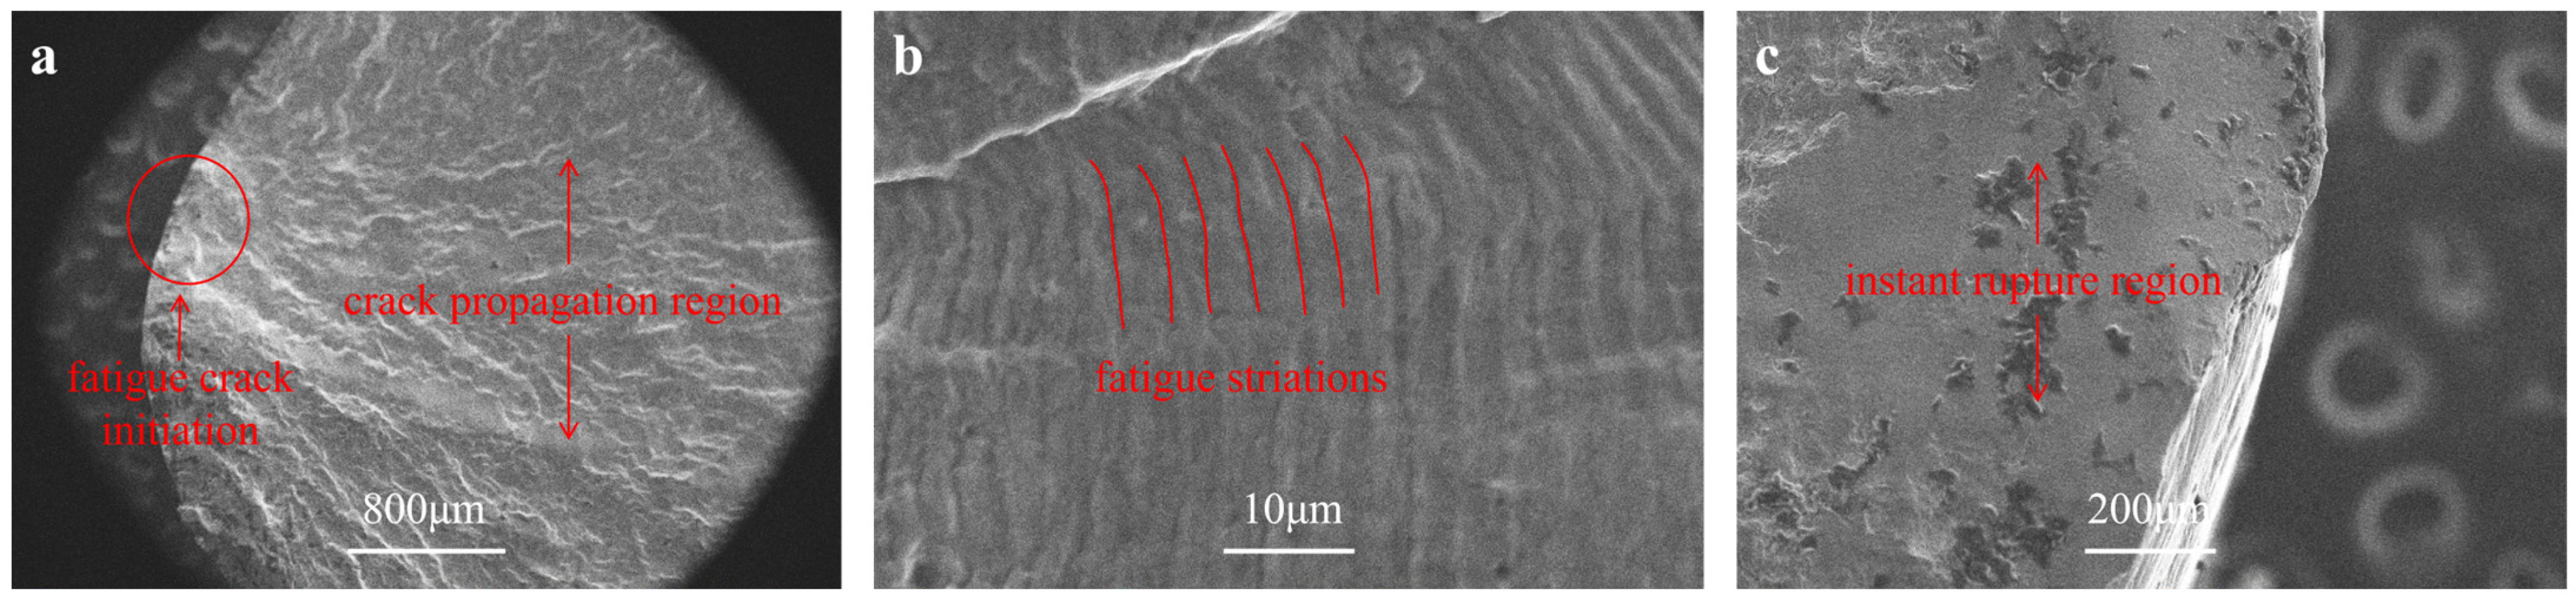
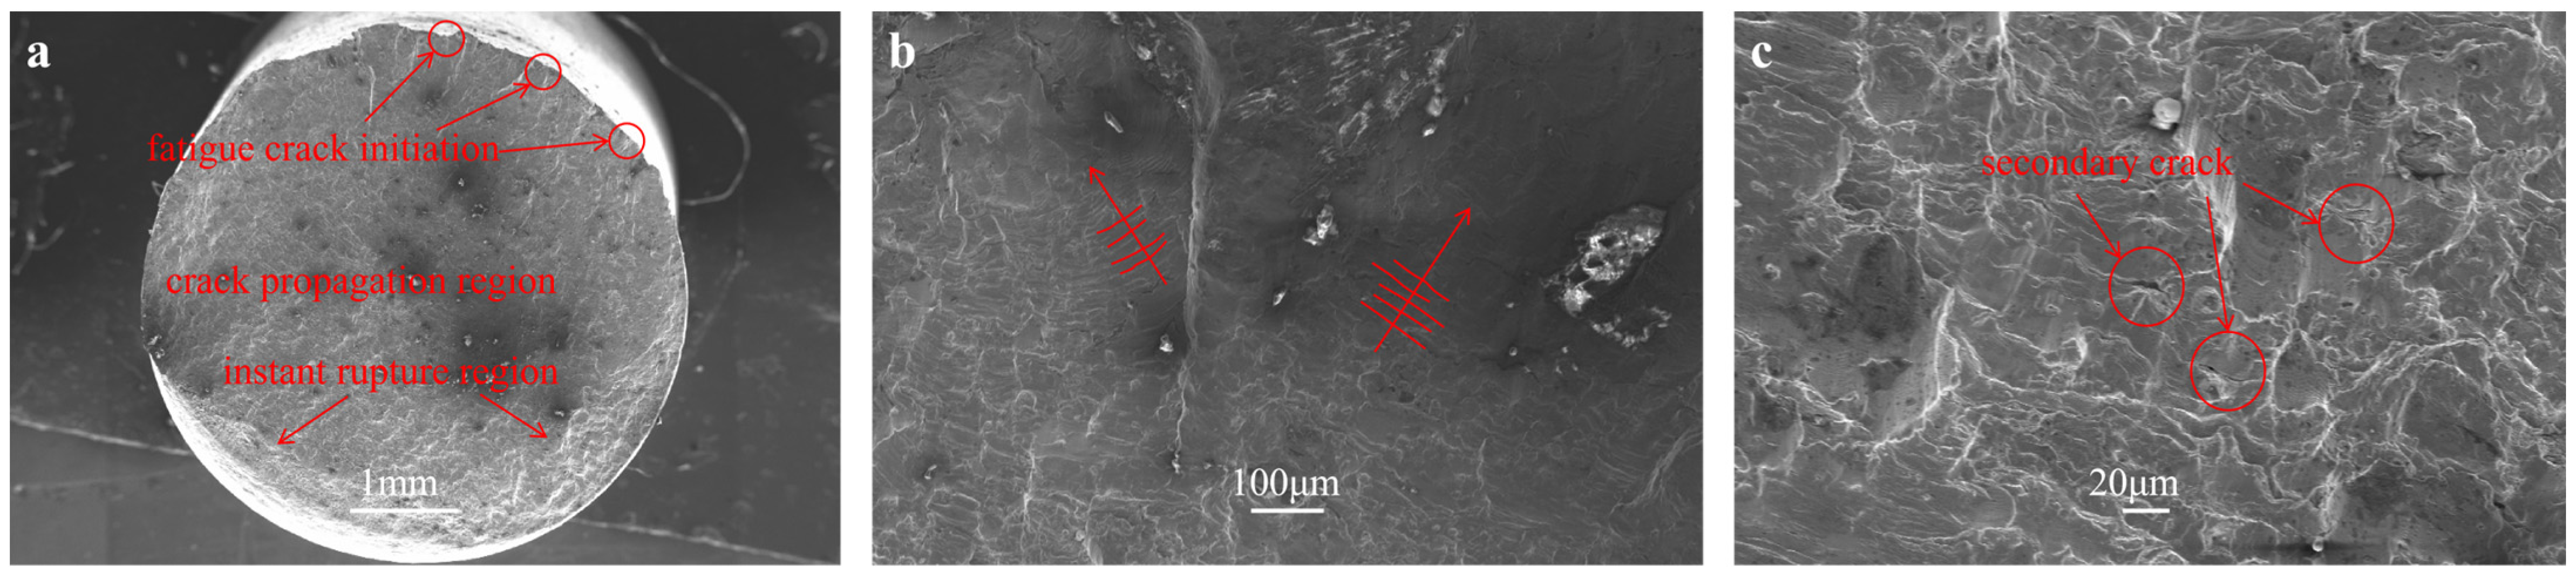
Figure 8 presents the fracture morphology of GH1059 superalloy observed via scanning electron microscopy (SEM, ZEISS, Oberkochen, German) after testing at RT and 0.4% strain amplitude. A typical fatigue fracture surface consists of three distinct regions: the fatigue crack initiation, the crack propagation region, and the final instant rupture region. As shown in Figure 8a, the fatigue crack initiation site is identified as the focal point where radiating patterns converge. The crack propagation region exhibits a relatively flat appearance, where fatigue striations are clearly visible, as illustrated in Figure 8b. These striations are characteristic microscopic features of fatigue fracture. Each striation generally corresponds to one stress cycle, and the spacing between them reflects the crack growth rate. The final instant rupture region showed in Figure 8c is typically located opposite to the fatigue crack initiation and consists of regions formed by unstable crack propagation [10]. Compared to the crack propagation region, this area exhibits a rougher morphology with lots of dimples, indicating that the fracture mechanism of this area is not purely brittle in nature.
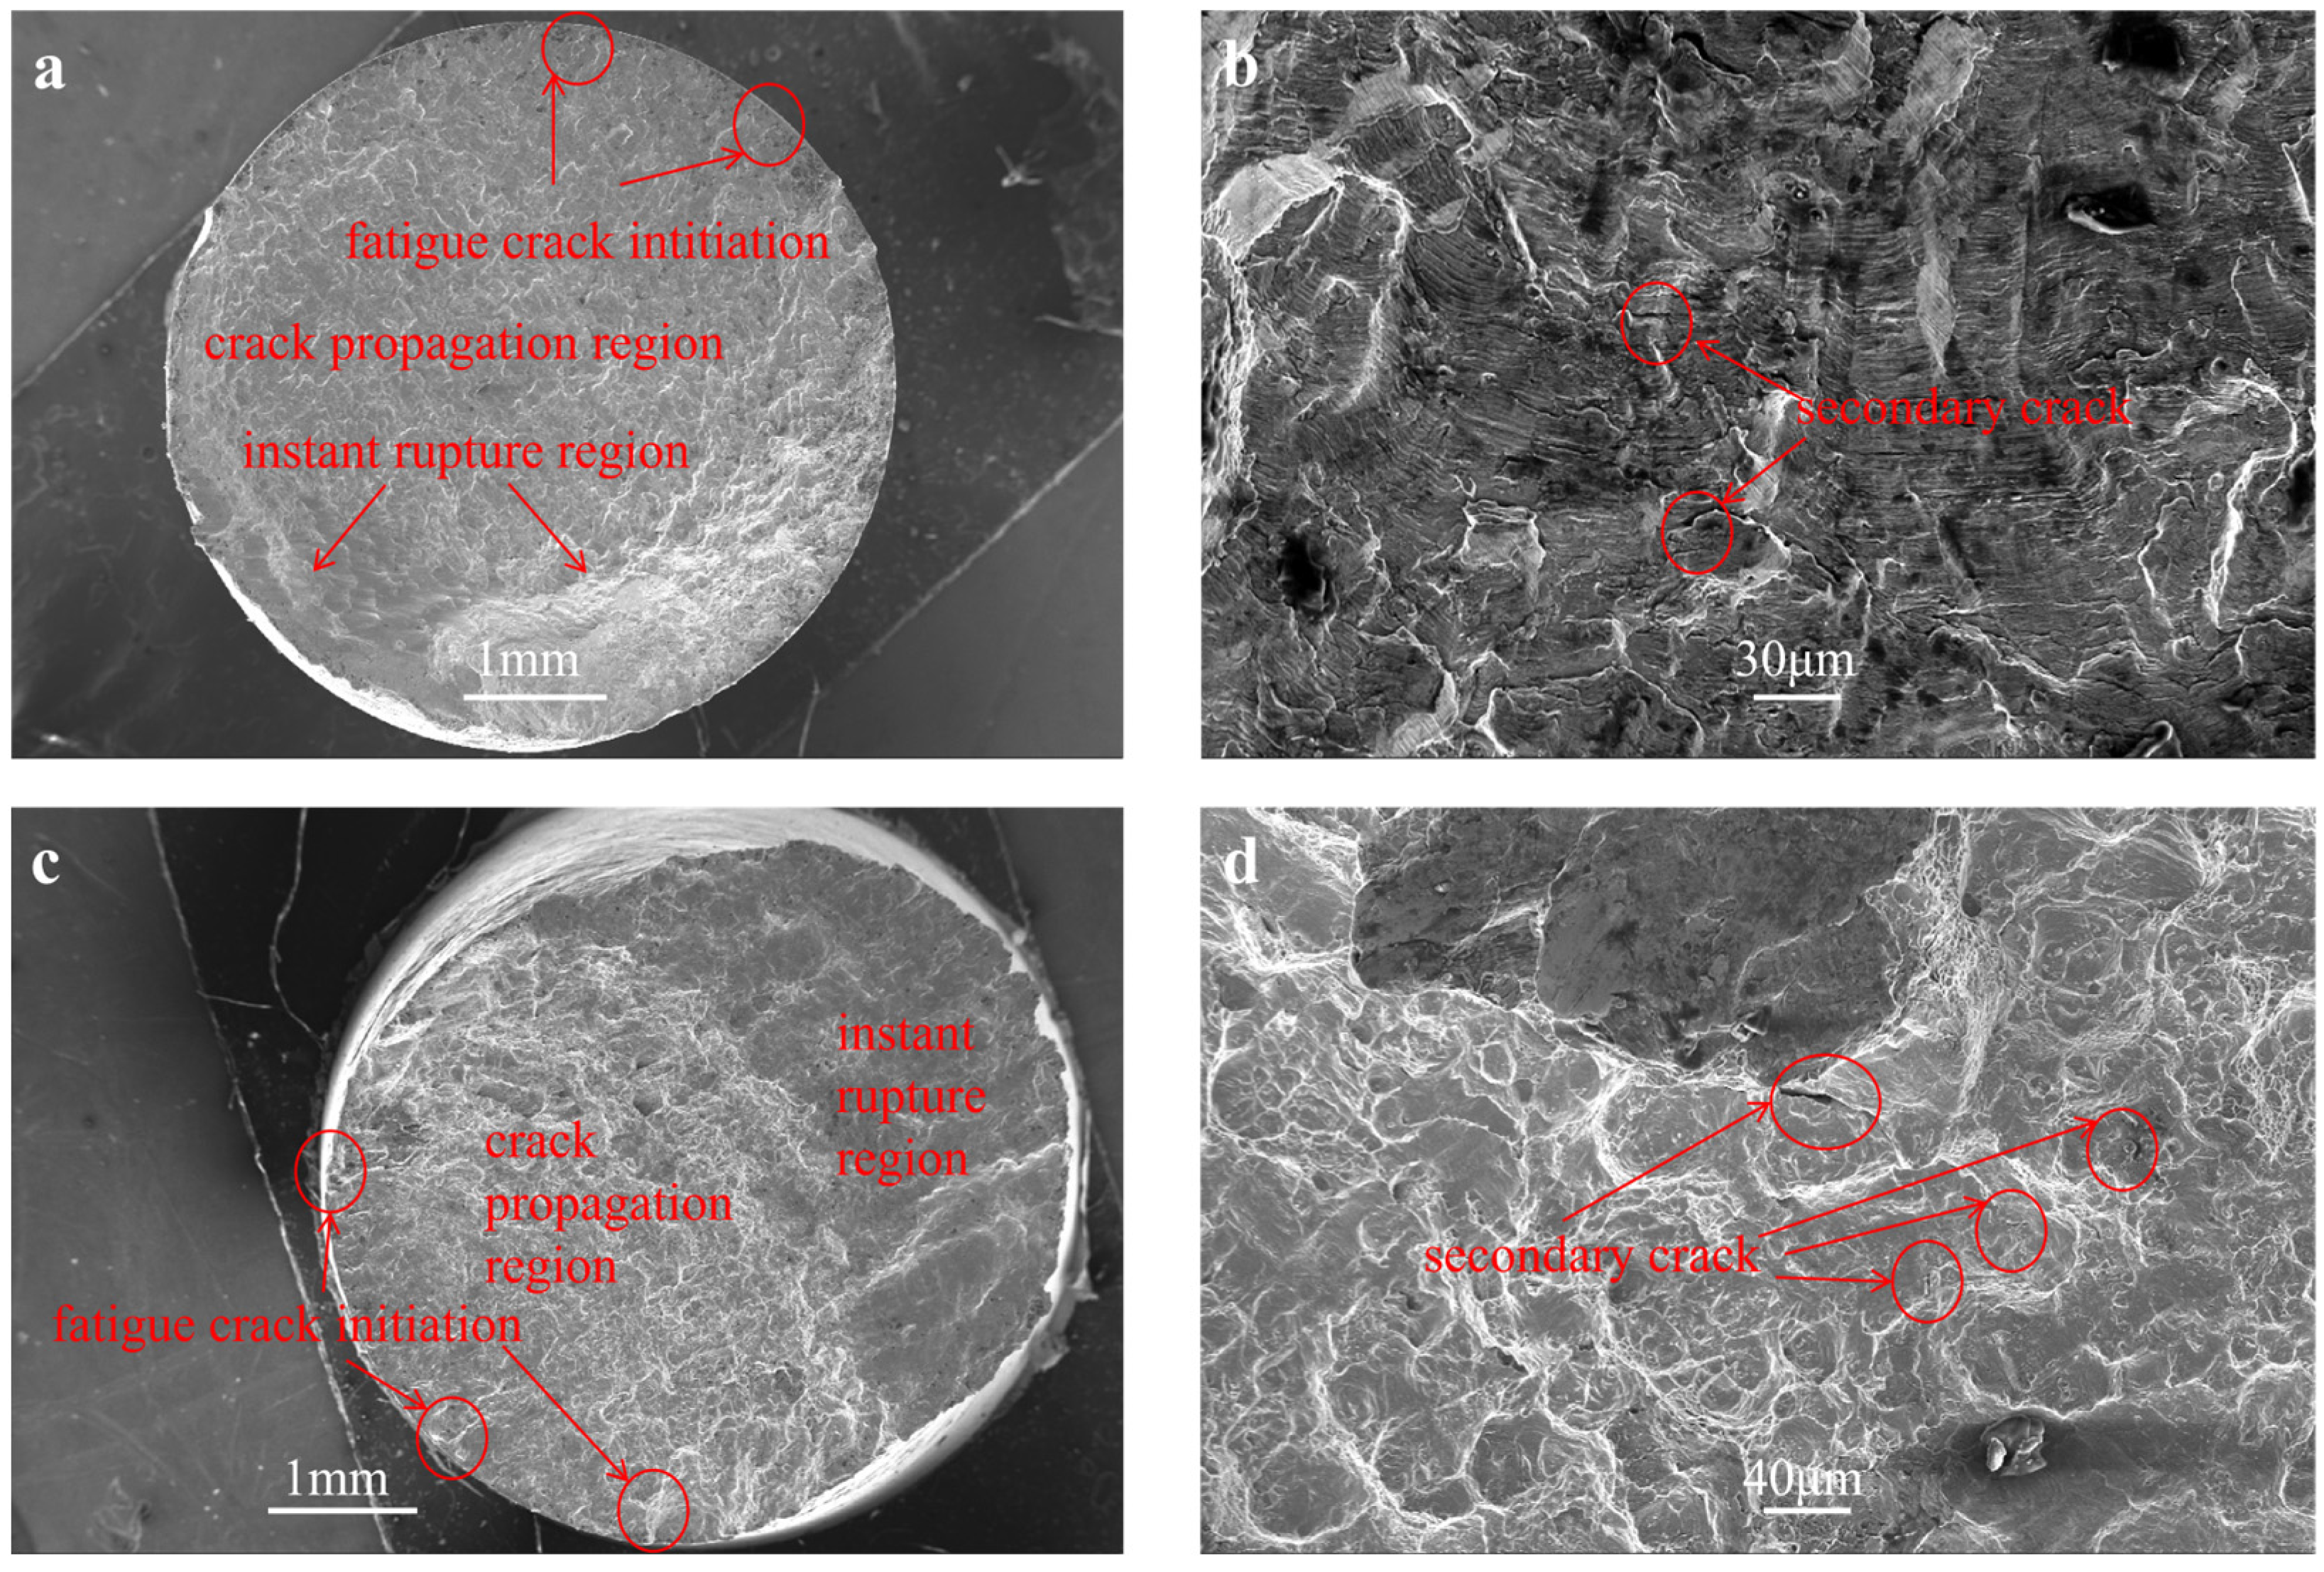
The fractograph of specimen at RT and 0.9% strain amplitude is different from that of RT and 0.4% strain amplitude as shown in Figure 9. Higher strain amplitude imposes greater stresses, leading to the formation of multiple fatigue crack initiation sties. By observing the fatigue striations near the fatigue crack initiations, directions pointing toward different fatigue crack initiation sites can be identified. Extending the convex side of the fatigue striations in reverse is also a method for locating fatigue crack initiation as the arrows showed in Figure 9b. In the crack propagation region, the presence of secondary cracks can be observed. These secondary cracks result from extremely high stress concentration at the crack tip during propagation. When the local stress exceeds the microscopic fracture strength of the material but is insufficient to drive the main crack forward linearly, the system disperses and releases energy by initiating new small cracks in adjacent regions. The fractographs of specimens at 550 °C are shown in Figure 10. They are similar to those at RT and 0.9% strain amplitude. Multiple fatigue crack initiation sites and secondary cracks can be observed in these specimens.
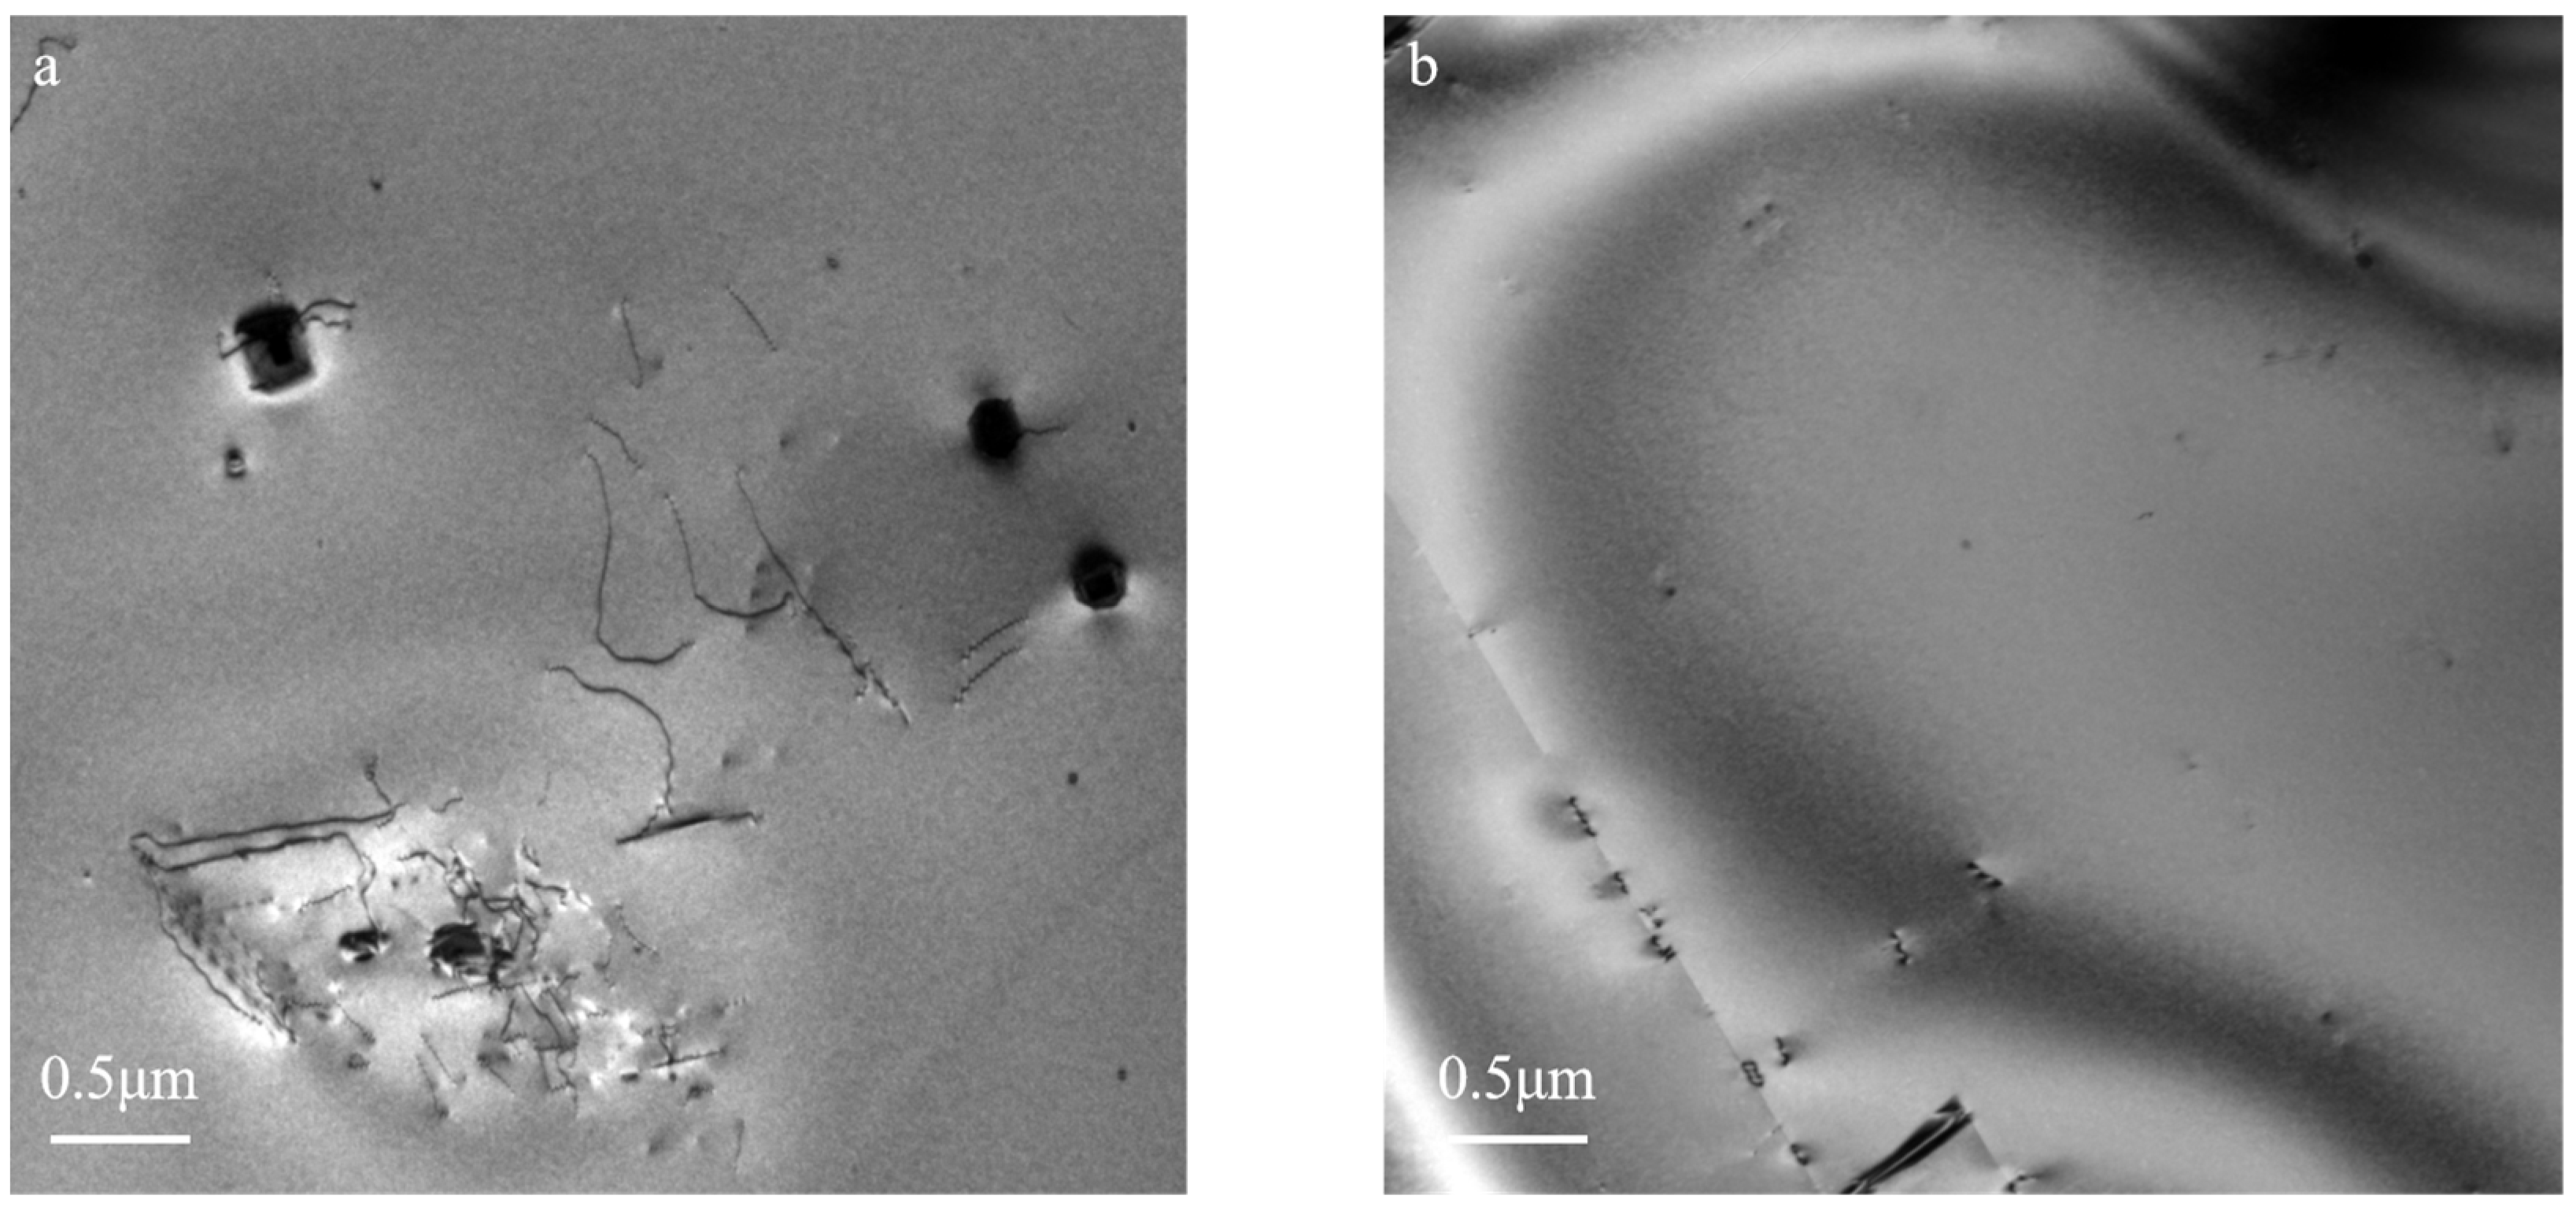
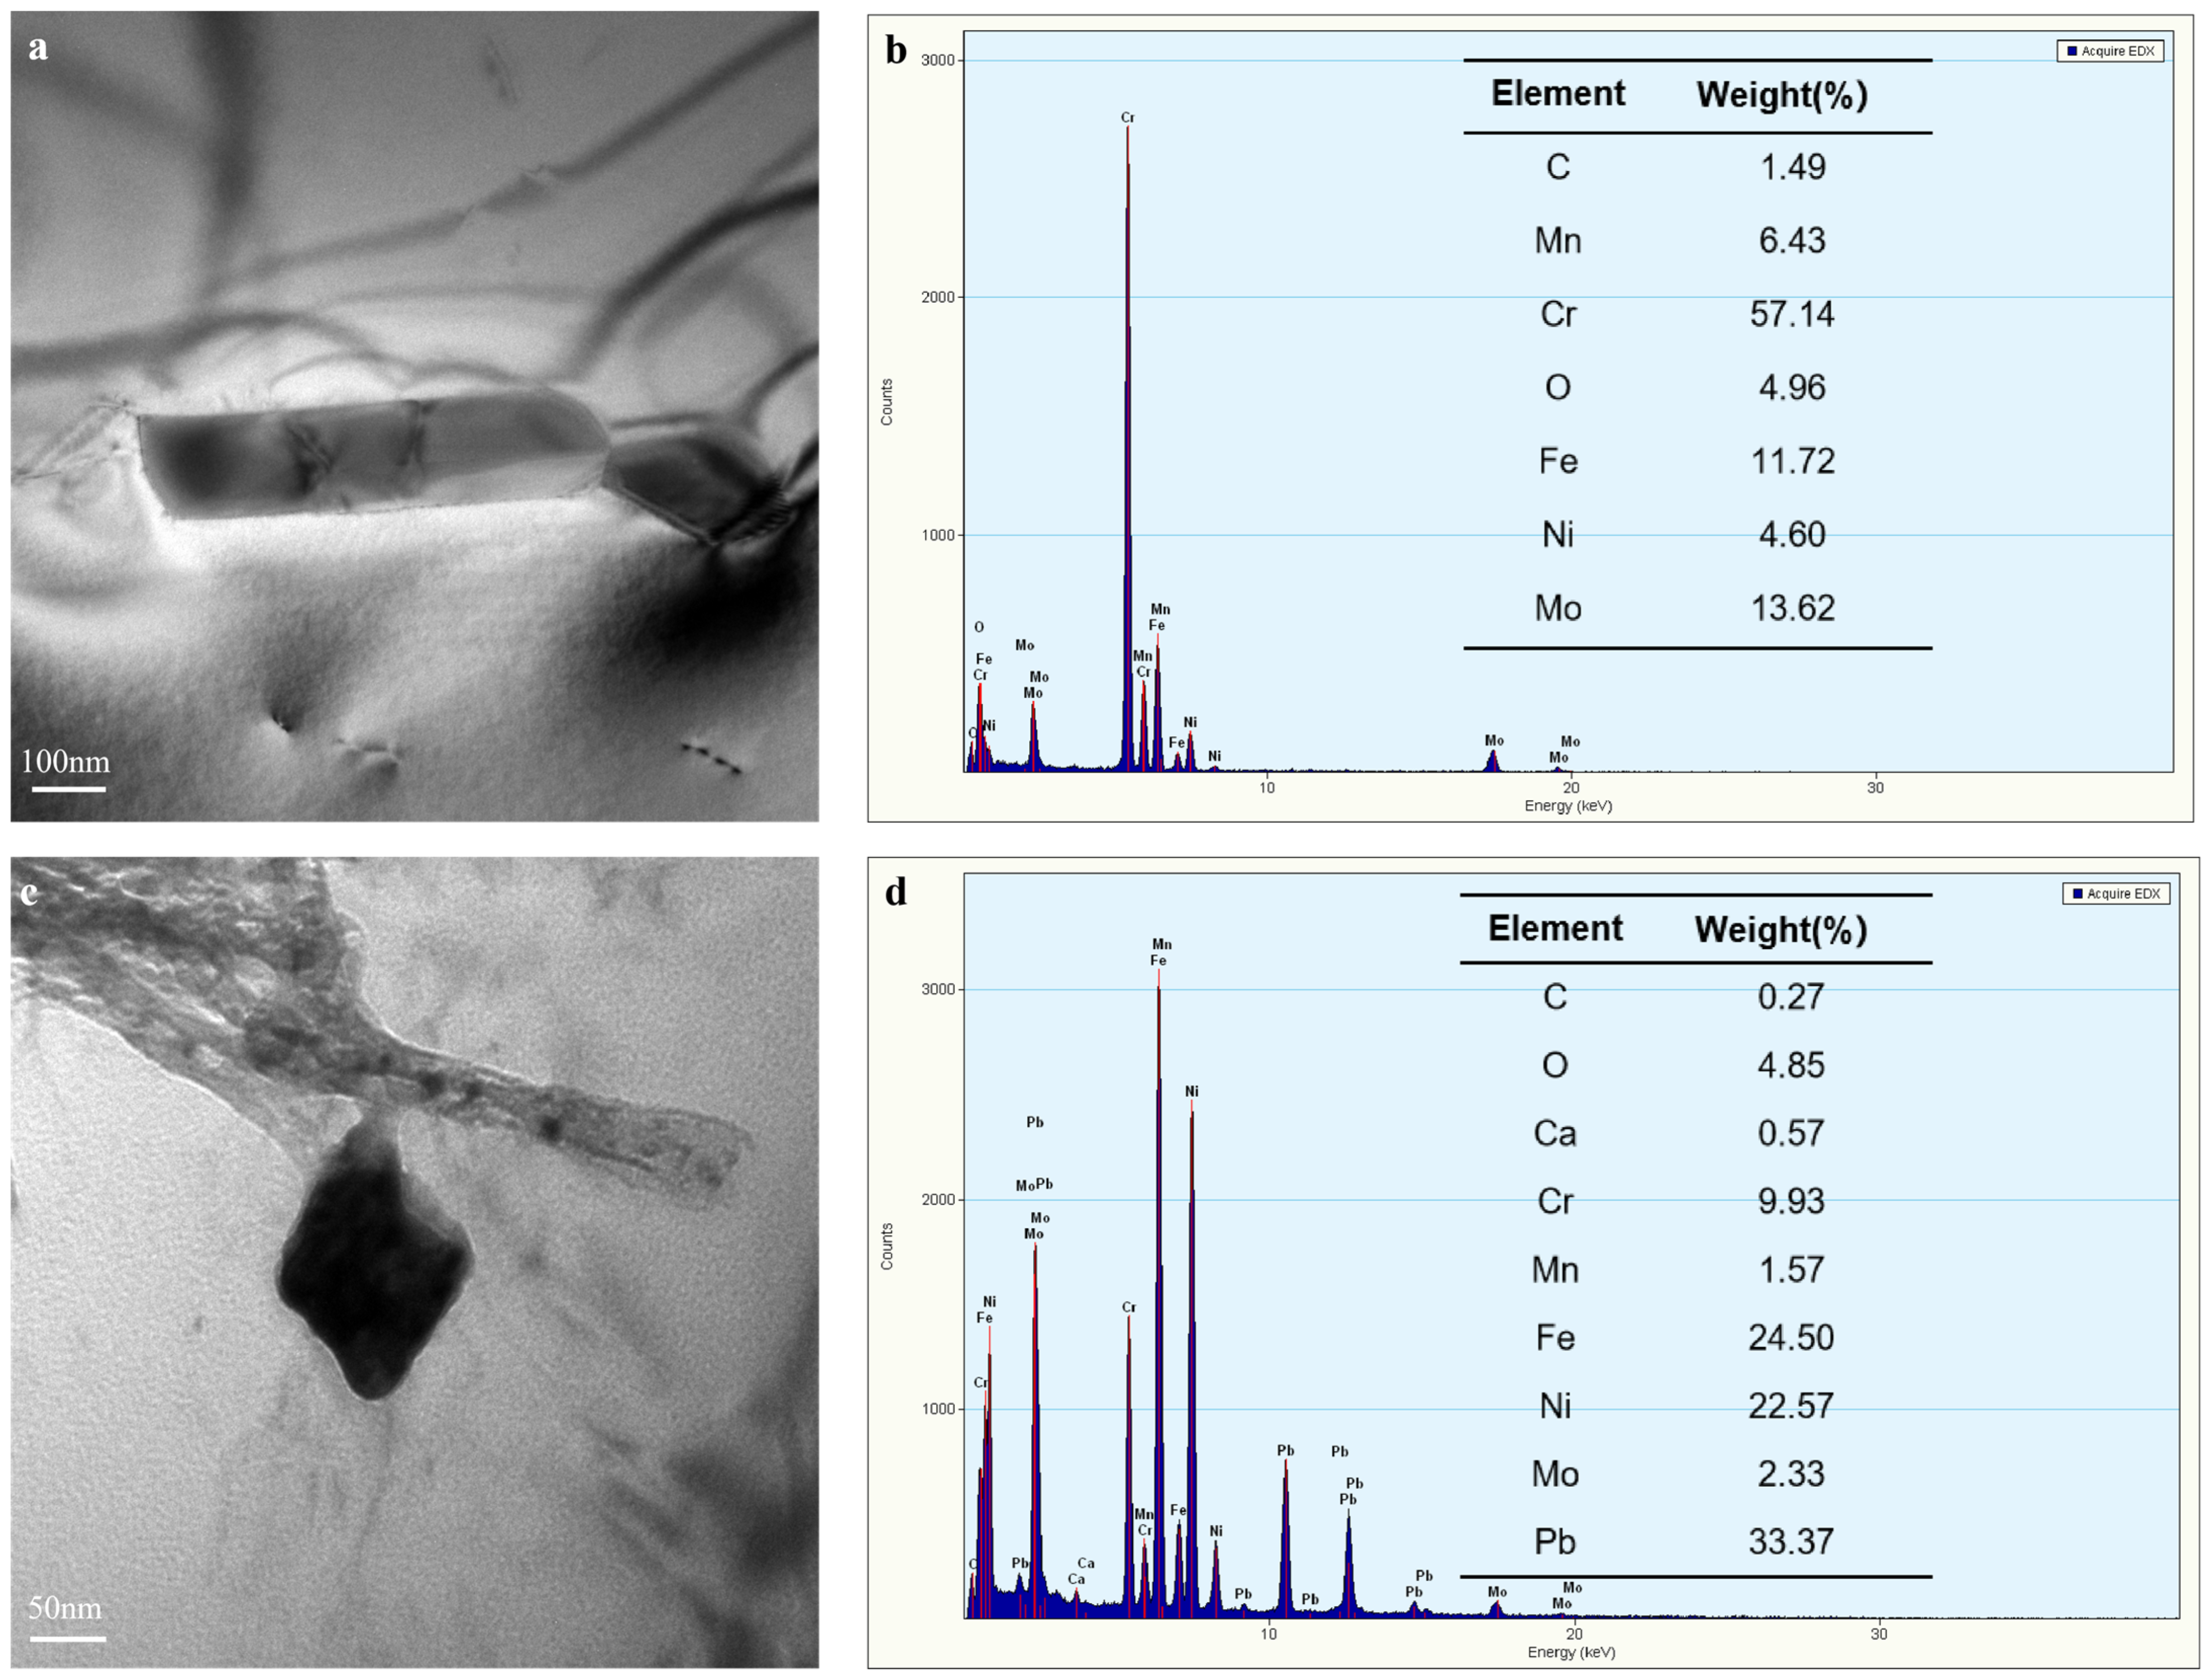
The microstructural image of the GH1059 superalloy base metal observed via TEM is shown in Figure 11. The GH1059 superalloy exhibits a grain size of approximately 80 μm, making it difficult to observe complete grains in TEM images. The dislocation density within the grains is relatively low. Some dislocations are pinned by precipitates inside the grains as Figure 11a, while others are located at grain boundaries where they contribute to boundary strengthening as Figure 11b. EDS analysis reveals two main types of precipitates in GH1059. The first type is rich in Cr with a size reaching up to 1 μm as shown in Figure 12a. The second type is rich in Fe, Ni, and Pb, with sizes ranging between 50 and 100 nm as shown in Figure 12c. Although the lead content in the GH1059 matrix is extremely low, its solubility in the Fe–Ni matrix is negligible, resulting in almost no solid solution and a strong tendency for segregation. This likely explains the formation of the Pb-rich precipitates.
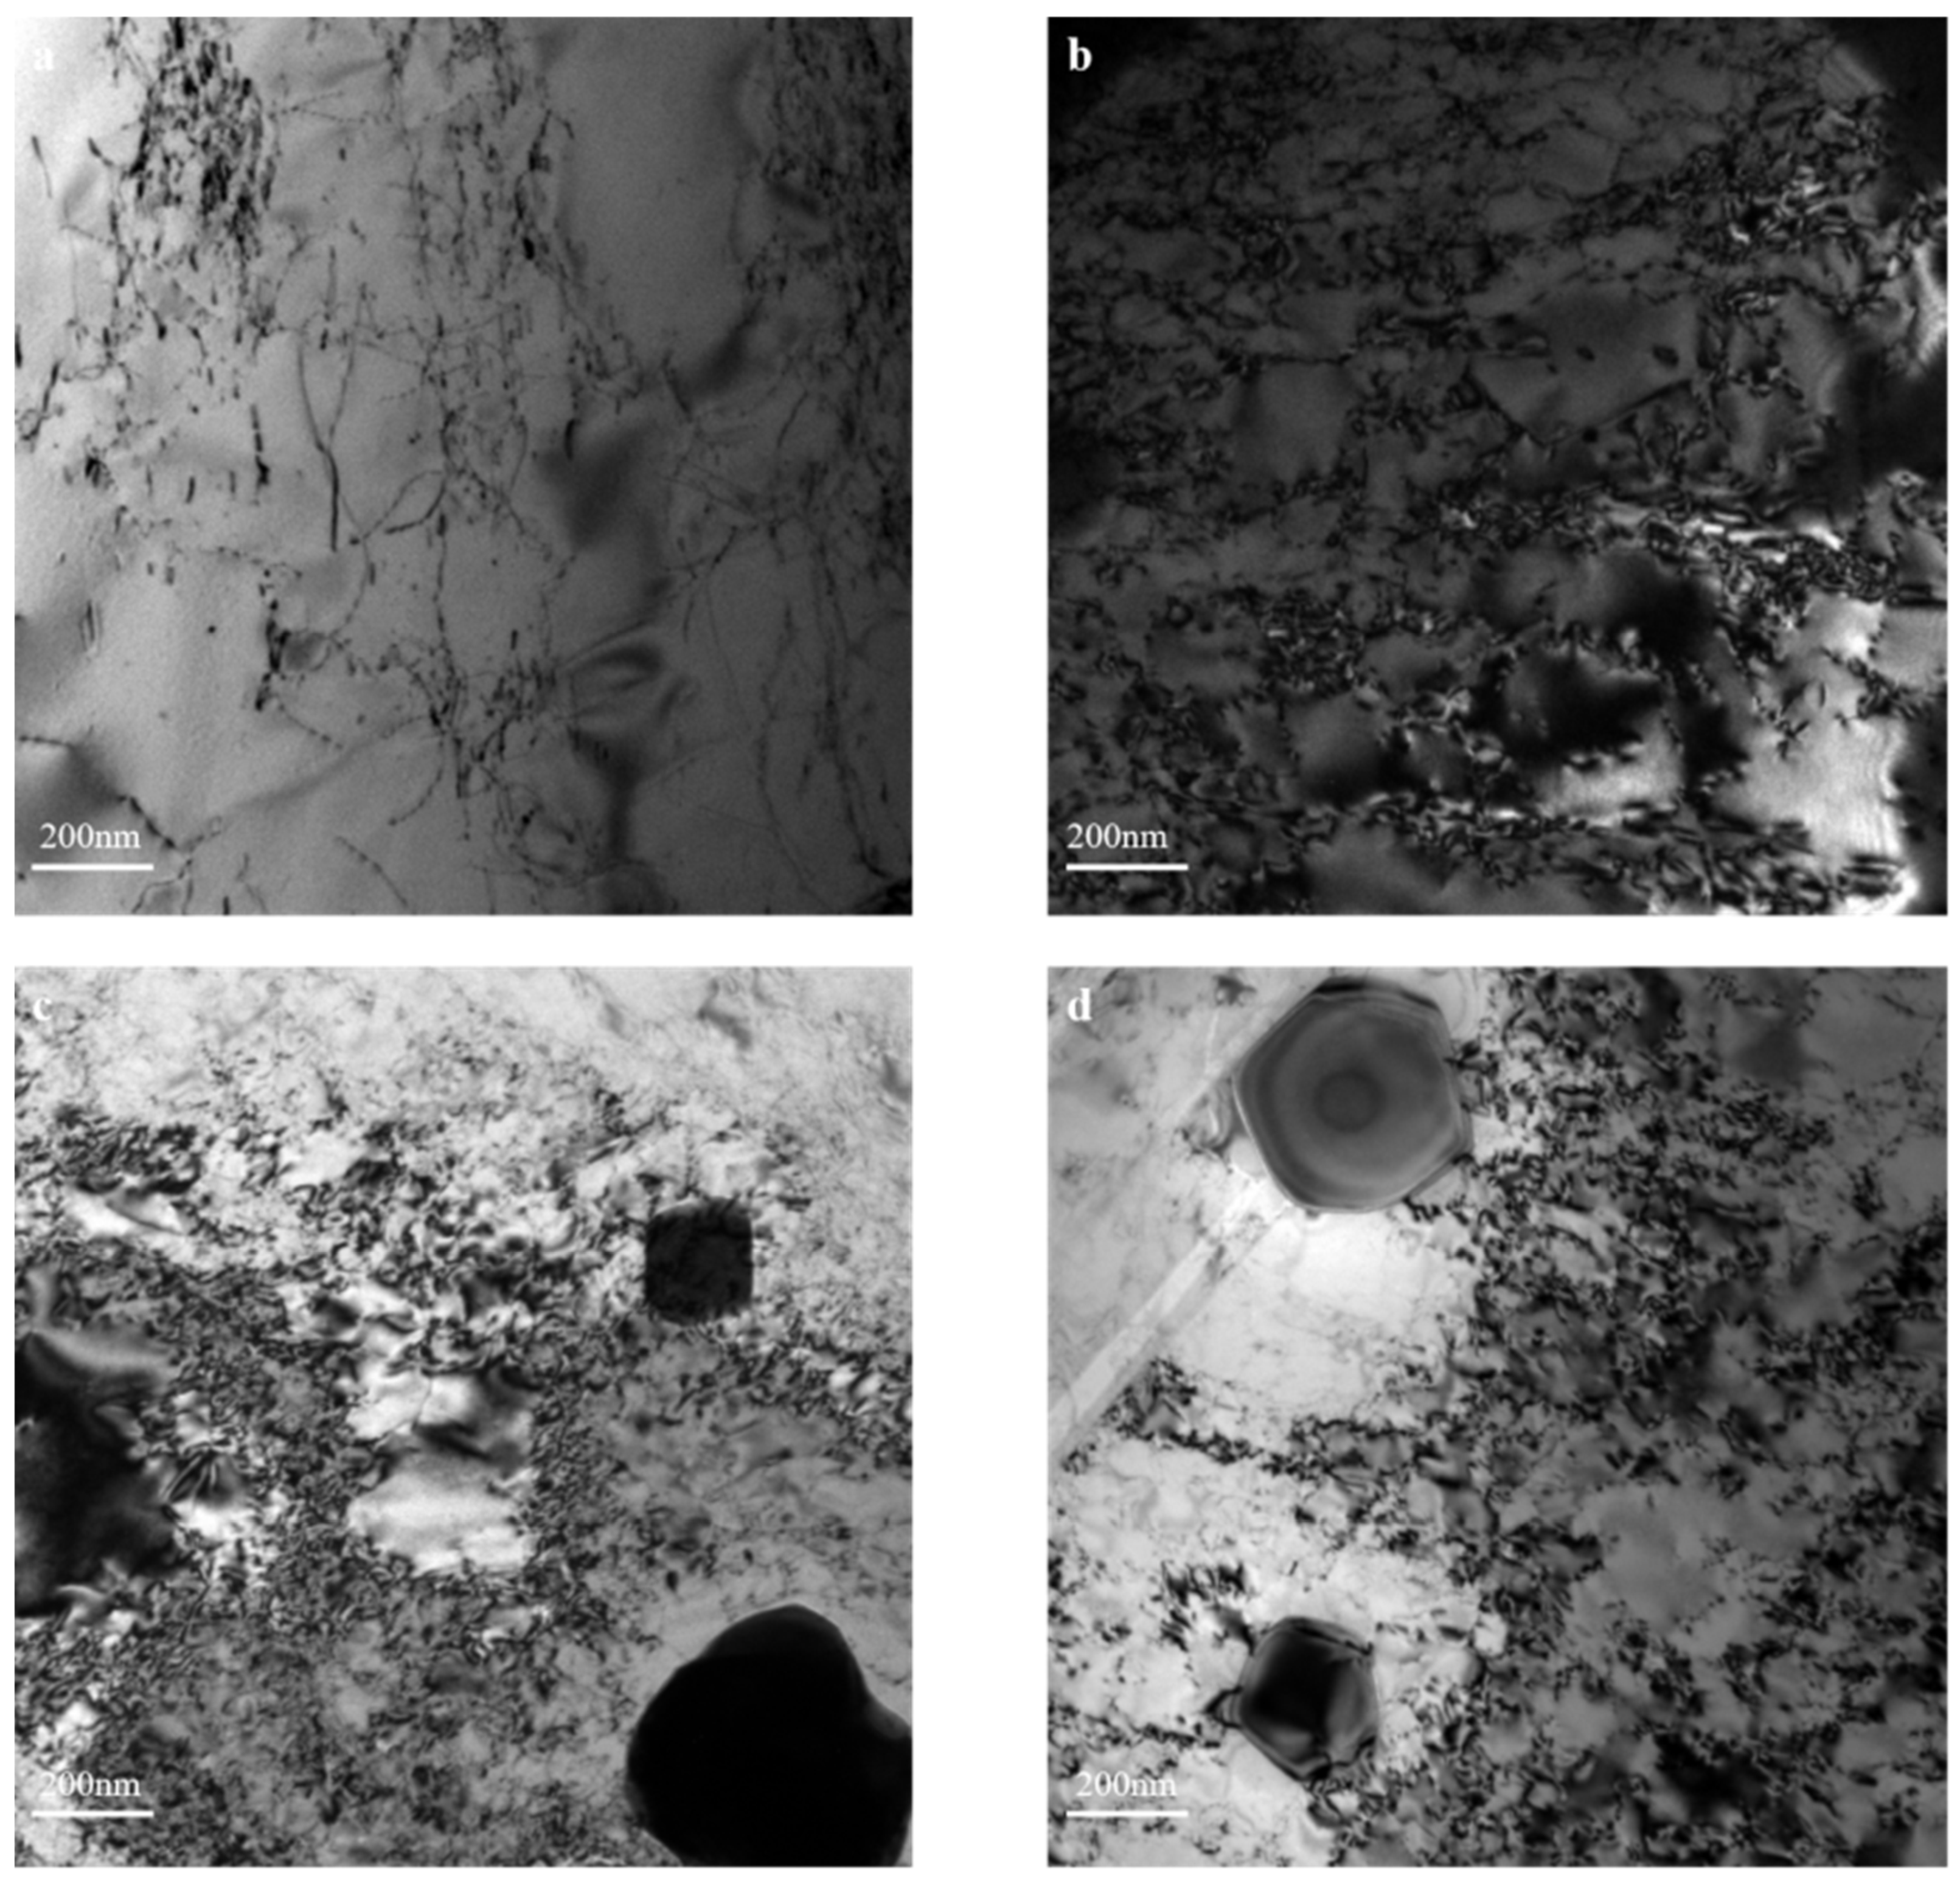
Figure 13 shows TEM images of the fracture samples under different test conditions. The measurement results of dislocation density via the mean linear intercept method are summarized in Table 4. It can be observed that the dislocation density increased significantly under all test conditions compared to base metal. This increase in dislocation density is consistent with the variation in friction stress discussed in Section 3.3.
At RT, the dislocation density of the specimen tested at 0.9% strain amplitude was lower than that at 0.4% strain amplitude. At the 0.9% strain amplitude, the specimen tested at high temperature exhibited a significantly higher dislocation density than that tested at RT. During fatigue loading, dislocations undergo a dynamic recovery process. On one hand, dislocation sources are continuously activated, leading to dislocation multiplication and an increase in dislocation density. On the other hand, the annihilation of dislocations with opposite signs during movement results in a reduction of dislocation density.
During fatigue loading, the dislocations of opposite signs undergoing reciprocating motion interact and annihilate when the distance between them decreases to a certain value. At higher strain amplitudes, dislocations travel longer average distances in the matrix, increasing the probability of encountering dislocations of opposite signs and thereby raising the likelihood of annihilation. The variation of friction stress in Section 3.3 also supports this observation. At RT, the friction stress rises rapidly during the initial few dozen cycles, a stage where substantial dislocation multiplication occurs. Subsequently, for the specimen with 0.4% strain amplitude, the friction stress stabilizes after declining, while for the specimen with 0.9% strain amplitude, it continues to decrease until final fracture. This indicates that at higher strain amplitudes, the reduction in dislocation density is more pronounced. As a result, the dislocation density of the specimen of RT and 0.9% strain amplitude is lower than that of RT and 0.4% strain amplitude.
DSA occurs in the material under high-temperature conditions. When the DSA effect takes place, dislocation motion becomes obstructed in front of obstacles. During the time when dislocations are held up before these obstacles, they interact with diffusing solute atoms and become pinned. On the one hand, the pinned dislocations can act as dislocation sources, continuously emitting new dislocations under external stress. On the other hand, for dislocations to break free from the pinning of solute atoms, a greater external force is required. This may activate dislocation sources that were not active previously under lower stress levels. Both mechanisms accelerate dislocation multiplication. At the same time, the pinning effect of solute atoms firmly anchors dislocations on specific slip planes, severely hinders dislocation motion, and reduces the likelihood of annihilation between dislocations of opposite signs. Thus, it suppresses the decrease in dislocation density. Consequently, the dislocation density in 550 °C and 0.4% strain amplitude specimen continues to rise, corresponding to the consistently increasing trend in friction stress in Section 3.3. This also explains the cyclic hardening observed in the second stage of the cyclic stress curve in Section 3.2. In the 0.9% strain amplitude specimen, dislocation annihilation is suppressed by DSA, preventing its dislocation density from decreasing significantly compared to that of the 0.4% strain amplitude specimen. According to the variation in friction stress, the dislocation density remains relatively stable after the initial rapid multiplication stage, corresponding to the stress saturation observed in the second stage of its cyclic stress curve.
During cyclic loading, alternating stresses induce dislocation glide, and interactions between adjacent dislocations increase the activation stress for dislocation slip. The increase in dislocation density enhances the material’s strength [28,29]. However, although the rise in dislocation density improves strength, a high density of dislocations also leads to significant localized stress concentration at dislocation fronts. This increases potential sites for microcrack nucleation and thereby reduces the fatigue life of the material. Consequently, the degradation in fatigue life is more pronounced under high strain amplitude conditions at elevated temperatures.

4. Conclusions

Tensile tests and fatigue tests were conducted on GH1059 superalloy at RT and 550 °C. Based on experimental results and microstructural analysis, the following conclusions can be drawn:
  • Based on the tensile tests of GH1059 superalloy, dynamic strain aging is present at elevated temperatures, which inhibits the decrease in the material’s ultimate tensile strength under high-temperature conditions. At the same time, dynamic strain aging also influences the low-cycle fatigue behavior of the material at high temperatures, making it differ from that observed at RT.
  • GH1059 superalloy underwent three distinct stages during fatigue loading at RT: cyclic hardening, gradual cyclic softening, and final fracture. The second stage at 550 °C was different: it was cyclic hardening at low strain amplitudes and it was stress saturation at high amplitudes. Fatigue tests under multiple strain amplitudes at RT and 550 °C yielded Coffin–Manson curves. According to the fitted fatigue life curves, the fatigue life at 550 °C was lower than that at RT, especially at high strain amplitudes.
  • At RT and 550 °C, fatigue performance was predominantly governed by friction stress whose variation correlates with the change in dislocation density. The change of friction stress aligned consistently with the microstructural evolution via TEM.
  • The dislocation density at 550 °C and 0.9% strain amplitude was significantly higher than that at RT and the same amplitude. It is because that DSA at 550 °C inhibits dislocation annihilation. This disparity explains two key findings: First, the low-cycle fatigue behavior of GH1059 superalloy at 550 °C was different from that at RT. Second, the associated high localized stress concentrations from the dense dislocations account for the accelerated degradation in fatigue life, which is particularly significant at high strain amplitudes and elevated temperatures.

Author Contributions

Conceptualization: W.Y.; Methodology: Z.C., M.F., Y.D. and B.Y.; Validation: Z.C., Y.D. and B.Y.; Formal analysis: Z.C. and M.F.; Investigation: Z.C.; Resources: W.Y., Y.D. and B.Y.; Data curation: Z.C.; Writing—original draft preparation: Z.C.; Writing—review and editing: Y.D. and B.Y.; Supervision: W.Y. and B.Y.; Project administration: B.Y.; Funding acquisition: B.Y. All authors have read and agreed to the published version of the manuscript.

Funding

This research is financially supported by the National Magnetic Confinement Nuclear Fusion Energy Development Research Project (Grant No. 2022YFE0312000).

Data Availability Statement

The original contributions presented in the study are included in the article, further inquiries can be directed to the corresponding author.

Conflicts of Interest

All Authors were employed by the China Institute of Atomic Energy. All authors declare that the research was conducted in the absence of any commercial or financial relationships that could be construed as a potential conflict of interest.

References

  1. Delage, F.; Carmack, J.; Lee, C.B.; Mizuno, T.; Pelletier, M.; Somers, J. Status of advanced fuel candidates for Sodium Fast Reactor within the Generation IV International Forum. J. Nucl. Mater. 2013, 441, 515–519. [Google Scholar] [CrossRef]
  2. Du, P.; Xiong, Q.; Shan, J.; Deng, J.; Chen, W.; Huang, T.; Wu, Z. Development and application of 3D pool-type sodium cooled fast reactor system analysis program. Prog. Nucl. Energ. 2022, 144, 104027. [Google Scholar] [CrossRef]
  3. Hu, W.; Ren, L.; Liu, Z.; Song, W. Study on technical scheme for passive shutdown of pool-type sodium-cooled fast reactor. Nucl. Sci. Eng. 2014, 34, 23–27. [Google Scholar]
  4. Rai, R.K.; Chandra, S.; Singh, A.P.; Paulose, N.; Srivastava, C. Oxidation-fatigue damage mechanisms in a directionally solidified Ni-based superalloy at 850 °C. Mater. Sci. Eng. A 2025, 922, 147630. [Google Scholar] [CrossRef]
  5. Zhong, M.; Yu, H.; Wang, Z.; Xue, H.; Zhang, F.; Wang, G.; Zhang, X.; Qu, J. Effect of solution temperature on low-cycle fatigue behavior and microstructural evolution of GH4738 Ni-based superalloy. Intermetallics 2025, 186, 108970. [Google Scholar] [CrossRef]
  6. Wang, Y.; Yeli, G.; Yang, H.; Chen, X.; Zhao, H.; Shi, L.; Li, K.; Wang, H.; Cai, Z.; Li, C.; et al. Creep deformation and microstructure evolution of Ni-based superalloy GH3128 for VHTR applications. J. Alloys Compd. 2025, 1029, 180808. [Google Scholar] [CrossRef]
  7. Huang, X.; Qi, H.; Li, S.; Yang, X.; Shi, D. Fatigue behavior of welded joints of a Ni–Fe-based superalloy. Weld. World 2025, 69, 657–669. [Google Scholar] [CrossRef]
  8. Fournier, D.; Pineau, A. Low cycle fatigue behavior of Inconel 718 at 298 K and 823 K. Metall. Trans. A 1977, 8A, 1095–1105. [Google Scholar] [CrossRef]
  9. Worthem, D.W.; Robertson, M.I.; Leckie, F.A.; Socie, D.F.; Altstetter, C.J. Inhomogeneous deformation in Inconel 718 during monotonic and cyclic loadings. Metall. Trans. A 1990, 21, 3215–3220. [Google Scholar] [CrossRef]
  10. Zhang, P.; Zhu, Q.; Hu, C.; Wang, C.; Chen, G.; Qin, H. Cyclic deformation behavior of a nickel-base superalloy under fatigue loading. Mater. Des. 2015, 69, 12–21. [Google Scholar] [CrossRef]
  11. Kulig, A.; Oskay, C.; Mengis, L.; Nowak, B.; Galetz, M.C.; Glatzel, U.; Daoud, H. Improvement of fatigue life by aluminizing of additive manufactured Fe- and Ni-base alloy. Surf. Coat. Technol. 2024, 494, 131493. [Google Scholar] [CrossRef]
  12. Rai, R.K. The role of local crystallography on fatigue crack initiation and growth mechanisms of a Ni-based superalloy. Mater. Chem. Phys. 2025, 345, 131303. [Google Scholar] [CrossRef]
  13. Li, Y.; Guo, H.; Wang, X.; Tan, Z.; Yang, Y.; Du, Y.; Liu, J.; Zhou, Y.; Sun, X. Oxidation micromechanics and contribution during the low-cycle fatigue failure of a Ni-based single crystal superalloy. Int. J. Fatigue 2025, 190, 108586. [Google Scholar] [CrossRef]
  14. Cao, J.; Gu, M.; Guo, W. Slow fatigue crack growth induced microstructure evolution far beyond the crack tip plastic zone in nickle-based superalloy. Int. J. Fatigue 2026, 206, 109430. [Google Scholar] [CrossRef]
  15. Zhao, Y.; Zhai, H.; Liu, S. Low cycle fatigue properties of CLAM steel at 450 °C and 550 °C. Fusion Eng. Des. 2016, 112, 213–217. [Google Scholar] [CrossRef]
  16. Gladman, T. Precipitation hardening in metals. Mater. Sci. Technol. 1999, 15, 30–36. [Google Scholar] [CrossRef]
  17. Gerland, M.; Violan, P. Secondary cyclic hardening and dislocation structures in type 316 stainless steel at 600 °C. Mater. Sci. Eng. 1986, 84, 23–33. [Google Scholar] [CrossRef]
  18. Yu, D.; Yu, W.; Chen, G.; Jin, F.; Chen, X. Role of dynamic strain aging in the tensile property, cyclic deformation and fatigue behavior of Z2CND18.12N stainless steel between 293 K and 723 K. Mater. Sci. Eng. A 2012, 558, 730–736. [Google Scholar] [CrossRef]
  19. Rodriguez, P. Serrated plastic flow. Bull. Mater. Sci. 1984, 6, 653–663. [Google Scholar] [CrossRef]
  20. McCormigk, P.G. A model for the Portevin-Le Chatelier effect in substitutional alloys. Acta Metall. 1972, 20, 351–354. [Google Scholar] [CrossRef]
  21. Van den Beukel, A. Theory of the effect of dynamic strain aging on mechanical properties. Phys. Stat. Sol. A 1975, 30, 197–206. [Google Scholar] [CrossRef]
  22. Roberts, M.J. Effect of transformation substructure on the strength and toughness of Fe−Mn alloys. Metall. Trans. 1970, 1, 3287–3294. [Google Scholar] [CrossRef]
  23. Cottrell, H. Dislocations and Plastic Flow in Crystals; Oxford University Press: London, UK, 1953. [Google Scholar]
  24. Kuhlmann-Wilsdorf, D.; Laired, C. Dislocation behavior in fatigue II. Friction stress and back stress as inferred from an analysis of hysteresis loops. Mater. Sci. Eng. 1979, 37, 111–120. [Google Scholar] [CrossRef]
  25. Dickson, J.I.; Boutin, J.; Handfield, L. A comparison of two simple methods for measuring cyclic internal and effective stresses. Mater. Sci. Eng. 1984, 64, L7–L11. [Google Scholar] [CrossRef]
  26. Alvarez-ArmasL, I.; Armas, A.F.; Herenu, S.; Degallaix, S.; Degallaix, G. Correlation between cyclic deformation behaviour and microstructure in a duplex steel between 300 and 773 K. Fatigue Fract. Eng. Mater. Struct. 2003, 26, 27–35. [Google Scholar] [CrossRef]
  27. Lu, K.; Chauhan, A.; Knöpfle, F.; Aktaa, J. Effective and back streesses evolution upon cycling a high-entropy alloy. Mater. Res. Lett. 2022, 10, 169–176. [Google Scholar] [CrossRef]
  28. Yu, H.; Xu, W.; van der Zwaag, S. Microstructure and dislocation structure evolution during creep life of Ni-based single crystal superalloys. J. Mater. Sci. Technol. 2020, 45, 207–214. [Google Scholar] [CrossRef]
  29. Deng, B.; Ru, Y.; Wen, J.; Li, X.; Cao, Y.; Hu, Y.; Yang, F.; Pei, Y.; Li, S.; Gong, S. Improving oxidation resistance property of single-crystal Ni-based superalloy via utilizing high temperature aging-induced dislocations. J. Mater. Res. Technol. 2025, 35, 504–513. [Google Scholar]
Figure 1. Size and shape of (a) tensile test specimen and (b) fatigue test specimen (mm).
Metals 16 00416 g001
Figure 2. Tensile curves of GH1059 superalloy at (a) RT and (b) 550 °C. The tensile curve of the GH1059 superalloy at 550 °C exhibits the characteristic of dynamic strain aging.
Metals 16 00416 g002
Figure 3. Cyclic stress response of GH1059 superalloy under RT and 550 °C.
Metals 16 00416 g003
Figure 4. Hysteresis loops of fatigue specimens under different test conditions. (a) RT and 0.4% strain amplitude. (b) RT and 0.9% strain amplitude. (c) 550 °C and 0.4% strain amplitude. (d) 550 °C and 0.9% strain amplitude.
Metals 16 00416 g004
Figure 5. Coffin–Manson curves of GH1059 superalloy steel at (a) RT and (b) 550 °C.
Metals 16 00416 g005
Figure 6. The comparison of fatigue life curves of different temperatures.
Metals 16 00416 g006
Figure 7. Friction stress curves of tests conducted at different conditions.
Metals 16 00416 g007
Figure 8. Fractographs observed via SEM of the GH1059 superalloy after low-cycle fatigue at RT and 0.4% strain amplitude. (a) Fatigue crack initiation and crack propagation region of the specimen. (b) Fatigue striations in crack propagation region. (c) Instant rupture region of the specimen.
Metals 16 00416 g008
Figure 9. Fractographs observed via SEM of the GH1059 superalloy after low-cycle fatigue at RT and 0.9% strain amplitude. (a) Full scene of the fracture morphology. (b) Fatigue striations toward different directions. (c) Secondary crack.
Metals 16 00416 g009
Figure 10. Fractographs observed via SEM of the GH1059 superalloy tested at 550 °C. (a) Full scene of the specimen tested at 550 °C and 0.4% strain amplitude. (b) Secondary cracks of the specimen tested at 550 °C and 0.4% strain amplitude. (c) Full scene of the specimen tested at 550 °C and 0.9% strain amplitude. (d) Secondary cracks of the specimen tested at 550 °C and 0.9% strain amplitude.
Metals 16 00416 g010
Figure 11. TEM images of dislocations in base metal. (a) Dislocations pinned by precipitates. (b) Dislocations distributed along the grain boundaries.
Metals 16 00416 g011
Figure 12. TEM images and EDS spectrum of two precipitates in superalloy. (a) The morphology of the Cr-rich precipitate. (b) The EDS spectrum of the Cr-rich precipitate. (c) The morphology of the Pb-rich precipitate. (d) The EDS spectrum of the Pb-rich precipitate.
Metals 16 00416 g012
Figure 13. TEM images of dislocation structures of different test conditions. (a) At RT and 0.9% strain amplitude. (b) At 550 °C and 0.9% strain amplitude. (c) At RT and 0.4% strain amplitude. (d) At 550 °C and 0.4% strain amplitude.
Metals 16 00416 g013
Table 1. Chemical composition of GH1059 superalloy (wt. %).
ElementsFeNiCrMoMnCWAlNPPb
wt. %Bal.36.3016.443.401.510.0630.060.080.0180.0050.0001
Table 2. Yield strength and ultimate tensile strength of GH1059 superalloy at different temperatures.
TemperatureYield Strength (MPa)Ultimate Tensile Strength (MPa)
RT238 ± 5587 ± 9
550 °C147 ± 8510 ± 2
Table 3. Coffin–Manson parameters.
Temperature (°C)σf′/Eεfbc
RT1.2723.07−0.20−0.49
5501.3220.22−0.17−0.52
Table 4. The measurements of dislocation densities of different test conditions.
Test ConditionsBase MetalRT, ∆εt/2 = 0.4%RT, ∆εt/2 = 0.9%550 °C, ∆εt/2 = 0.4%550 °C, ∆εt/2 = 0.9%
Dislocation density (m−2)0.18 × 10146.88 × 10141.43 × 10147.32 × 10146.15 × 1014
Disclaimer/Publisher’s Note: The statements, opinions and data contained in all publications are solely those of the individual author(s) and contributor(s) and not of MDPI and/or the editor(s). MDPI and/or the editor(s) disclaim responsibility for any injury to people or property resulting from any ideas, methods, instructions or products referred to in the content.