Article

A Numerical Simulation on the Melting Behavior of Ferrochrome Alloy in Molten Steel

1
Key Laboratory for Ferrous Metallurgy and Resources Utilization of Ministry of Education, Wuhan University of Science and Technology, Wuhan 430081, China
2
Hubei Provincial Key Laboratory of New Processes of Ironmaking and Steelmaking, Wuhan University of Science and Technology, Wuhan 430081, China
3
Guangdong Provincial Key Laboratory of New Energy Materials Service Safety, College of Materials Science and Engineering, Shenzhen University, Shenzhen 518060, China
4
Joint International Research Laboratory of Refractories and Metallurgy, Wuhan University of Science and Technology, Wuhan 430081, China
*
Authors to whom correspondence should be addressed.
Metals 2026, 16(2), 158; https://doi.org/10.3390/met16020158
Submission received: 31 December 2025 / Revised: 24 January 2026 / Accepted: 26 January 2026 / Published: 28 January 2026
(This article belongs to the Section Computation and Simulation on Metals)

Abstract

Ferrochrome alloy is a crucial additive in steelmaking, significantly enhancing the strength, hardness, and corrosion resistance of steel; investigating the melting behavior of ferrochrome alloy could provide a theoretical foundation for producing stainless steel with improved properties. To gain insight into the melting behavior and mechanism of ferrochrome alloy in molten steel, this paper employed a numerical simulation with ANSYS Fluent software to investigate the effects of bath temperature, bath chromium content, bath carbon content, alloy chromium content, alloy carbon content, alloy size, and alloy preheating temperature on the melting behavior of ferrochromium alloy. The results showed that when the ferrochrome alloy is immersed into the molten bath, a solidified layer formed on the surface of the alloy, and as immersion time increased, the thickness of the solidified layer initially increased and then decreased; subsequent to the complete melting of the solidified layer, the alloy body began to melt. The center temperature of the alloy remained the lowest throughout the melting process and raised with increasing immersion time. Additionally, as the bath temperature and bath carbon content increased, the formation time of the solidified layer on the surface of the alloy shortened, its maximum thickness decreased, the alloy’s melting rate accelerated from 0.49 × 10⁻⁴ m/s to 1.22 × 10⁻⁴ m/s, and the complete melting time decreased from 134.7 s to 41 s. Conversely, increasing the bath chromium content raised the melting point of the solidified layer, prolonged the time required for remelting, slowed the alloy’s melting rate from 2.47 × 10⁻⁴ m/s to 0.91 × 10⁻⁴ m/s, and increased the complete melting time from 67.6 s to 75.2 s. As the alloy carbon content and preheating temperature increased, the alloy chromium content and size decreased, the formation time of the solidified layer shortened, its maximum thickness initially increased and then decreased, the melting rate of the alloy accelerated from 0.47 × 10⁻⁴ m/s to 1.97 × 10⁻⁴ m/s, and the complete melting time reduced from 165.8 s to 18.1 s.

1. Introduction

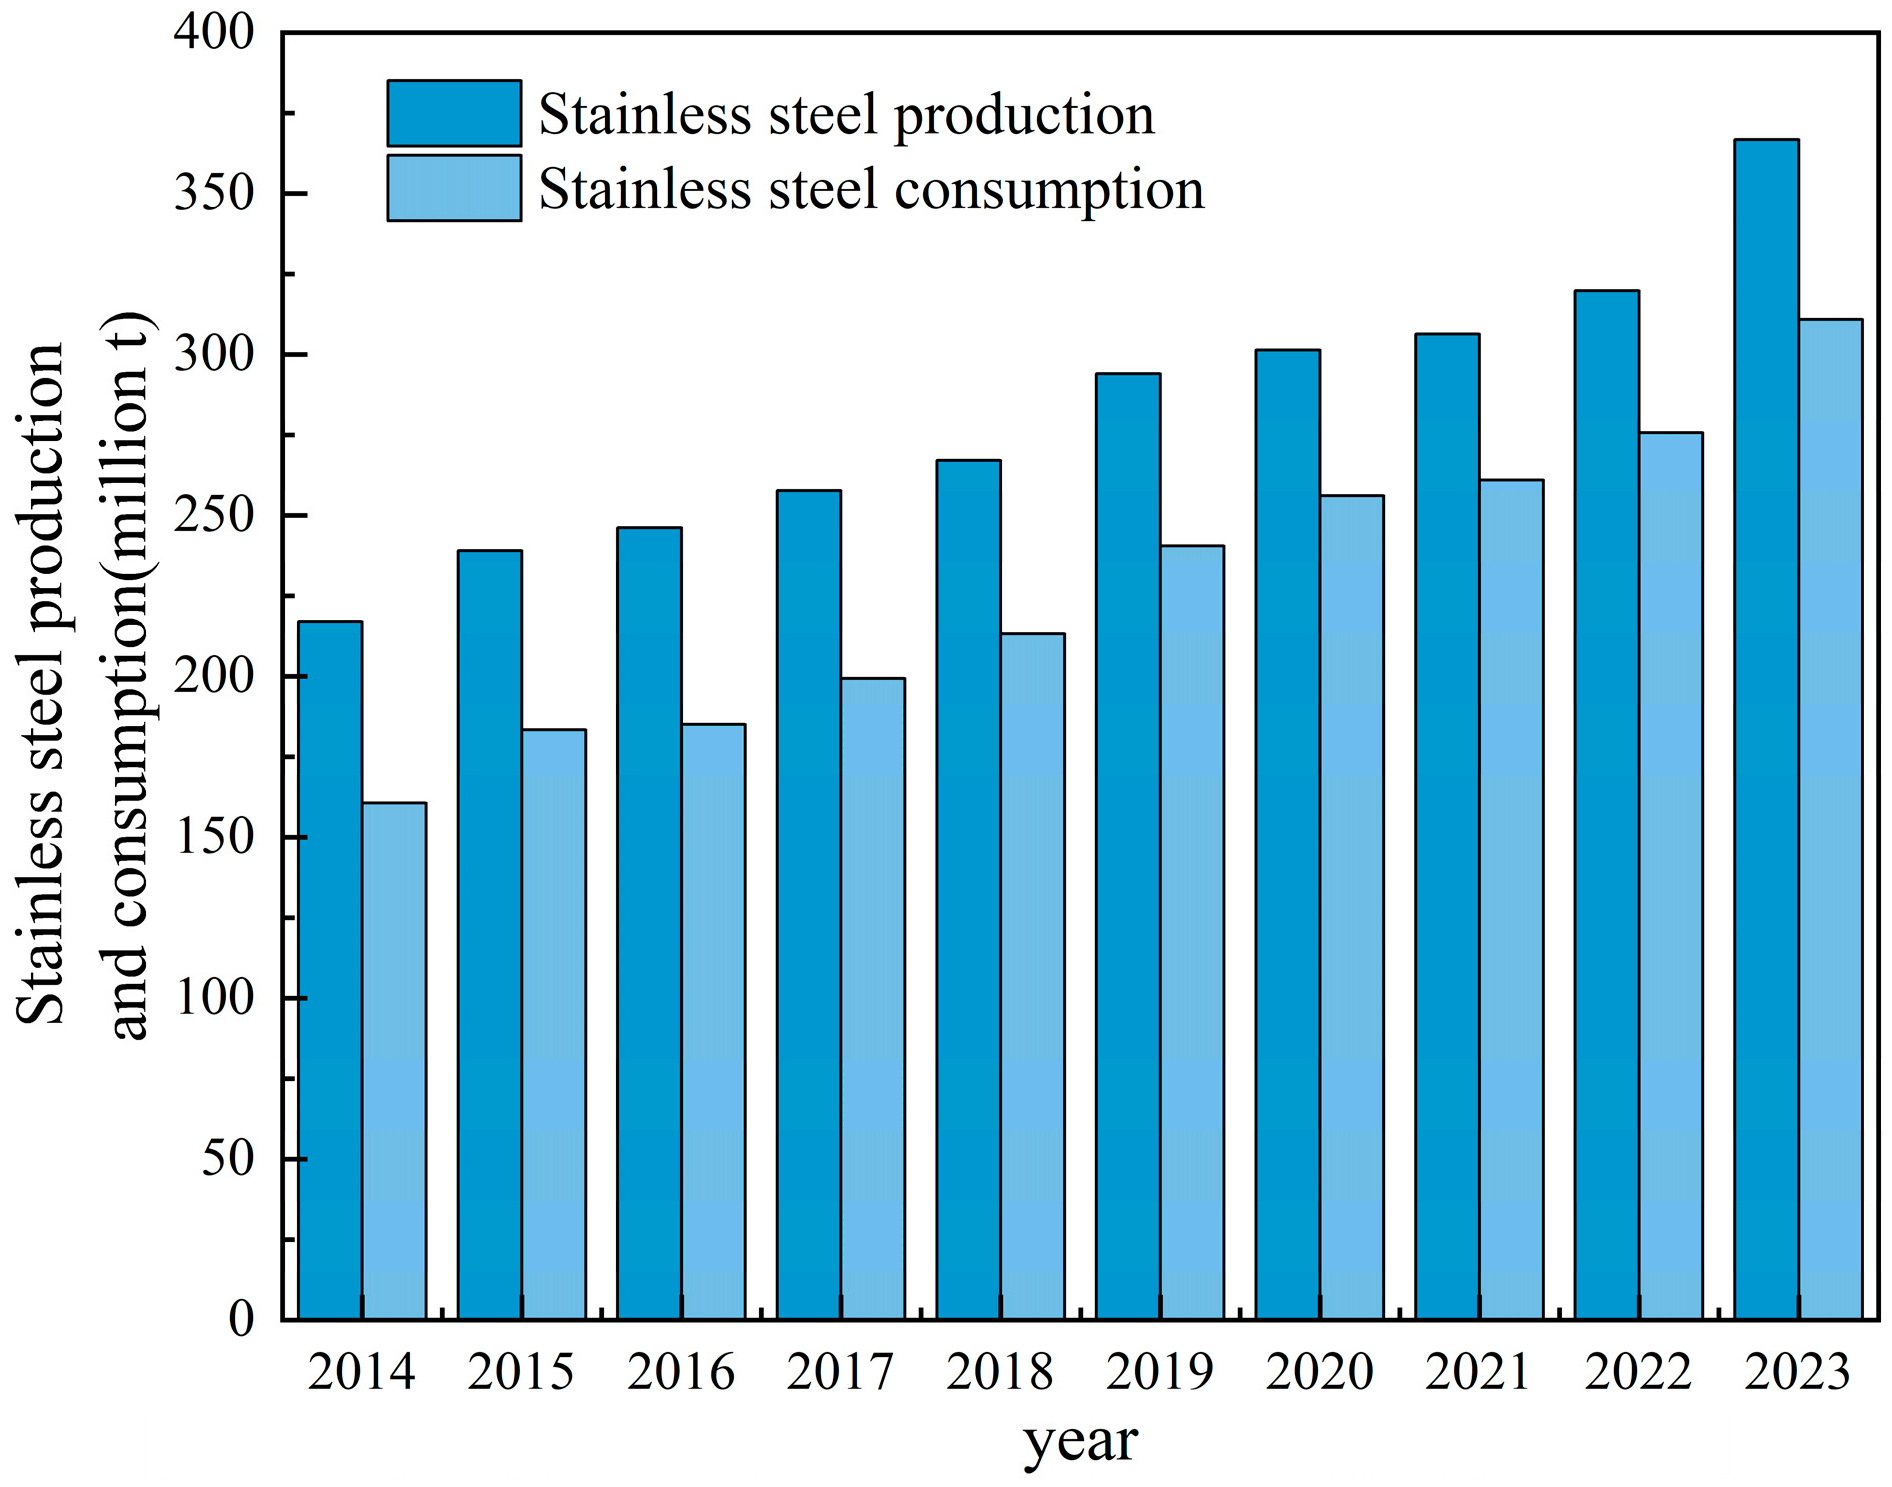
Ferrochrome is a significant alloy additive in the steelmaking process, primarily comprising Cr and Fe, with additional elements including C, Si, P, and S [1]. The rapid growth of China’s national economy has resulted in a corresponding increase in demand for ferrochrome, and China has now become the world’s largest producer and consumer of ferrochrome alloys. In recent years, with the continuous development of China’s economy and the steady advancement of urbanization and industrialization, people’s living standards have significantly improved, leading to an increasing demand for stainless steel and driving the growth of the stainless steel industry. Figure 1 shows China’s stainless steel production and consumption from 2014 to 2023. As shown in Figure 1, both stainless steel production and consumption have exhibited a steady upward trend. Stainless steel production increased from 21.69 million tons in 2014 to 36.67 million tons in 2023, while consumption rose from 16.06 million tons in 2014 to 31.08 million tons in 2023. Overall, China’s stainless steel industry has undergone significant changes, with both the production and consumption of stainless steel expected to continue growing. As an essential raw material for stainless steel production, the demand for ferrochrome alloy is also increasing annually [2].
Currently, ferrochrome alloy is commonly used in converters, electric arc furnaces, and secondary refining processes. The addition of an appropriate amount of chromium in converter steelmaking can improve the hardness, strength, corrosion resistance, and oxidation resistance of steel. During the converter smelting of chromium-containing molten iron, variations in the chemical reaction kinetics and thermodynamic conditions within each smelting batch lead to changes in the chromium content in the final steel melt. A higher chromium content in the final steel melt from the converter can effectively reduce the amount of ferrochrome alloy added during the deoxidation and alloying process for various chromium-containing steel grades [3]. Concurrently, chromium can supplant a portion of the metallurgical function of other alloying elements, thereby reducing the total consumption of alloy in the steelmaking process [4]. Therefore, increasing the chromium content at the end of converter steelmaking can effectively reduce the cost of the deoxidation alloying process in converter steelmaking. Adding an appropriate amount of ferrochrome alloy in the electric arc furnace can substitute elements like Si and Mn, thereby reducing smelting costs. After adding ferrochrome alloy to an electric arc furnace, the oxygen-blowing intensity must be increased to achieve rapid decarburization, allowing for melting, refining, reduction, and alloying to be completed quickly within the furnace. The AOD (Argon Oxygen Decarburization) and VOD (Vacuum Oxygen Decarburization) processes are the primary methods used for producing stainless steel. Ferrochrome alloy is an essential raw material for the production of stainless steel and other specialty steels, with approximately 80% of ferrochrome alloy used in stainless steel production. Consequently, the production of ferrochrome alloy is directly influenced by stainless steel production to a certain extent.
Li et al. [5] studied the melting performance of chromium ore in molten steel. In the thermal simulation experiments, chromium ore and slag were placed in a MgO crucible and heated, and the reaction products were analyzed using SEM and XRD. The results showed that the yield could reach 80%, and other elements in the chromium ore, such as Mg and Al, had a minimal effect on its performance, which still met production requirements. Cui [6] studied the heating characteristics of carbon-containing chromite powder in a microwave environment. By analyzing the specifics of microwave heating and the temperature rise characteristics of chromite powder in microwaves, a related calculation model was established. Through finite element analysis, a coupling method for the microwave-temperature field during microwave heating was provided, and the heat flux density and temperature field patterns in the microwave heating process were analyzed. The numerical simulation results were consistent with the experimental data, indicating that the composition of carbon-containing chromite ore fines plays a decisive role in microwave heating. There are relatively few previous studies on the melting behavior of ferrochrome alloy in molten steel, so it is necessary to study its melting process. Numerical simulations require less time and cost compared with high-temperature tests; furthermore, numerical simulations have the ability to simulate ideal conditions, enabling many studies to be conducted that would be difficult or impossible to perform in laboratory and industrial tests [7]. Therefore, to investigate the melting behavior and mechanism of ferrochrome alloy in molten steel, in this paper, the effects of bath temperature, bath chromium content, bath carbon content, alloy chromium content, alloy carbon content, alloy size, and alloy preheating temperature on the melting behavior of ferrochrome alloy have been investigated through numerical simulation using ANSYS Fluent 16.0 software.

2. Theoretical Model of Ferrochrome Melting

The ANSYS Fluent software employs the enthalpy-porosity method to address the melting of alloy across a range of temperatures [8]. In this technique, the mushy region is considered as a porous medium, while the liquid phase volume fraction is equivalently considered as the porosity. The additional pressure drop resulting from the presence of solid phase is accounted by incorporating a source term into the momentum equation [9].

2.1. Basic Assumptions

For the purpose of simplicity, the following hypotheses have been made.
(1)
The solid ferrochrome alloy and the liquid melt are simplified to a Cr-Fe-C ternary alloy ignoring the effects of elements such as Mn, P, Si, and S, as the contents of these elements in the investigated system are relatively low, and their influence on mass transfer and interfacial reactions is therefore considered secondary.
(2)
The steel fluid is assumed to be an incompressible Newtonian fluid.
(3)
The temperature at the wall of the bath remains constant.
(4)
The ferrochrome alloy is not in contact with the walls of the bath.

2.2. The Mathematical Equations Controlling Heat Transfer

For the heat transfer behavior of ferrochrome alloy in the molten bath, the energy equation can be expressed as follows:
ρ H t + ρ v H = k e f f T
where ρ is the density of the fluid, kg/m3; v is the velocity of the fluid, m/s; H is the total enthalpy, J/kg; keff is the effective thermal conductivity of the fluid, W/(m·K); and T is the temperature, K.
H = h + θ Δ H f
where θ is the liquid phase volume fraction defined as follows:
θ = 0                                                         T < T S T T S T l T s                                 T l > T > T S 1                                                         T > T l
where Ts and Tl are solid-phase line and liquid-phase line temperatures, K, respectively; ΔHf is the latent heat of solidification of the material, J/kg; h is the sensible enthalpy, J/kg; and the expression is as follows:
h = h r e f + T r e f T C p d T
where Tref is the reference temperature, taken as 298 K; href is the enthalpy at the reference temperature, J/kg; Cp is the specific heat capacity, J/kg·K; and keff is the effective thermal conductivity of the fluid, W/(m·K).

2.3. The Mathematical Equations Controlling Chromium and Carbon Mass Transfer

The component transport conservation equation is used to describe the transport behavior of chromium and carbon during the melting process of ferrochrome alloy:
ρ v i C x i = x i ρ D e f f C x i + S c
where Sc is the source term with the expression:
S c = x i ρ θ D e f f ( C r , l C r ) x i + x i ρ C r , l C r v i u i , s
where C is the chromium or carbon content, wt%; vi is the velocity of the fluid in the i-direction, m/s; ui,s is the velocity of the solid in the i-direction, m/s; Cr,l is the chromium content of the liquid melt, wt%; Deff is the effective diffusion coefficient of chromium in the liquid melt, cm2/s; and the expression is as follows:
D e f f = D t + D
D t = μ t ρ S c t
where Dt is the turbulent diffusion coefficient, cm2/s; D is the laminar diffusion coefficient, cm2/s; and Sct is taken as 0.7.

2.4. The Mathematical Equations of Turbulent Flow Characteristics of the Molten Bath

The RNG k-ε turbulence model is used to characterize the turbulent flow properties of the molten bath [10], and the specific control equations are as follows:
(1)
The continuity equation.
ρ t + ρ v i x i = 0
(2)
Momentum conservation equation.
ρ v i t + ρ v i v j x j = P x i + x j μ e f f v i x j + v j x i + S i
where vi is the velocity of fluid in the i-direction, m/s; vj is the velocity of fluid in the j-direction, m/s; P is the static pressure, Pa; μeff is the effective viscosity, Pa·s; and μ is the laminar viscosity, Pa·s.
μ e f f = μ t + μ
Si is the momentum transport source term formed by the reduction of porosity in the mushy zone, expressed as follows:
S i = A m u s h 1 θ 2 θ 3 + q
where Amush is the mushy region constant, taken as 1 × 10⁵, and q is a smaller number, taken as 0.001 [11].
(3)
RNG k-ε turbulence equation.
Turbulent kinetic energy (k) equation is as follows:
ρ k t + ρ k v i x i = x j α ε μ e f f k x j + G k ρ ε + S k
Turbulent kinetic energy dissipation rate (ε) equation is as follows:
ρ ε t + ρ ε v i x i = x j α ε μ e f f ε x j + C 1 ε G k C 2 ρ ε 2 k + S ε
where C1 and C2 are taken as 1.44 and 1.92 [12], respectively; Sk and Sɛ are the turbulent source terms caused by the solidification and melting process, as shown in Equations (15) and (16), respectively; αk and αɛ are the turbulence Planck’s numbers of k and ɛ, respectively; and Gk is the turbulence kinetic energy caused by the laminar velocity gradient, m2/s3, with the expression Equation (17) shown as follows:
S k = A m u s h 1 θ 2 θ 3 + q k
S ε = A m u s h 1 θ 2 θ 3 + q ε
G k = μ t v j x i v j x i + v i x j

2.5. Boundary Condition

The boundary condition for the side walls of the molten bath is set as a solid wall.

2.6. Physical Parameters

In this study, JMatpro 9.0 software [13] was used to calculate the solidus and liquidus temperatures, the latent heat of fusion, the dynamic viscosity, specific heat capacity, density, thermal conductivity, enthalpy, and other physical parameters of the molten bath and alloys.
(1)
The solidus and liquidus temperatures as well as the latent heat of fusion are critical parameters influencing the flow of molten steel and the melting behavior of ferrochrome alloy [14], and their values are shown in Table 1.
(2)
Solute diffusion coefficient.
The diffusion coefficients of carbon and chromium in the melt follow the relationships given below [15]:
D c T = 0.0052 exp 11700 R T
D C r T = 1.885 × 10 6 exp 4.16 × 10 5 R T
where Dc(T) and DCr(T) are the diffusion coefficients of carbon and chromium at a temperature of T, cm/s, respectively, and R is the molar gas constant with a value of 8.314 J/(mol·K).
(3)
Other physical parameters.
The dynamic viscosity, specific heat capacity, density, thermal conductivity, and enthalpy are important parameters affecting the flow of liquid steel and the melting behavior of ferrochrome alloy [16], and their values are shown in Table 2. In order to simplify the calculation, the parameters are averaged and imported into ANSYS Fluent software in this study.
The properties of the bath and alloy are functions of the elemental composition and temperature. These functions are calculated based on the thermodynamic software JMatPro and fitted using the least squares method. Specific parameters are presented in Table 3.

3. Simulation Process

3.1. Experimental Parameters

This study employed a single-factor method to simulate and investigate the effects of bath temperature, bath chromium content, bath carbon content, alloy chromium content, alloy carbon content, alloy size, and alloy preheating temperature on the melting behavior of ferrochrome alloy in molten steel, and the experimental parameters are shown in Table 4.

3.2. Simulation Method and Procedure

This study used ANSYS Fluent software to simulate the flow field of molten steel within the molten bath and the melting behavior of ferrochrome alloy. The specific procedures are as follows [17].
(1)
CAD 2010 software was utilized to create the model diagrams of the ferrochrome alloy and the molten bath and to establish the geometric model.
(2)
ICEM 16.0 software was used for mesh generation, including boundary definition. A structured mesh with approximately 35,000 elements was created, with a mesh quality exceeding 0.95, and a mesh independence study was conducted.
(3)
The mesh was imported into the Fluent solver, and the necessary simulation parameters were set. The solidification and melting model, energy model, component transport model, and RNG k-ε model were used to simulate the unsteady flow of molten steel within the molten bath and the melting behavior of ferrochrome alloy. An unsteady pressure-based solver was used to solve the partial differential equations; the PISO algorithm was employed for fluid calculations, with pressure, momentum, and volume fraction discretized using PRESTO, Second-order upwind, and Geo-reconstruct schemes, respectively. Turbulence kinetic energy and its dissipation rate were discretized using the Second-order upwind scheme.
(4)
Finally, Tecplot 2024R1 software was used to analyze and process the calculation results [18].

4. Results and Discussion

4.1. Melting Mechanism of Ferrochrome Alloys

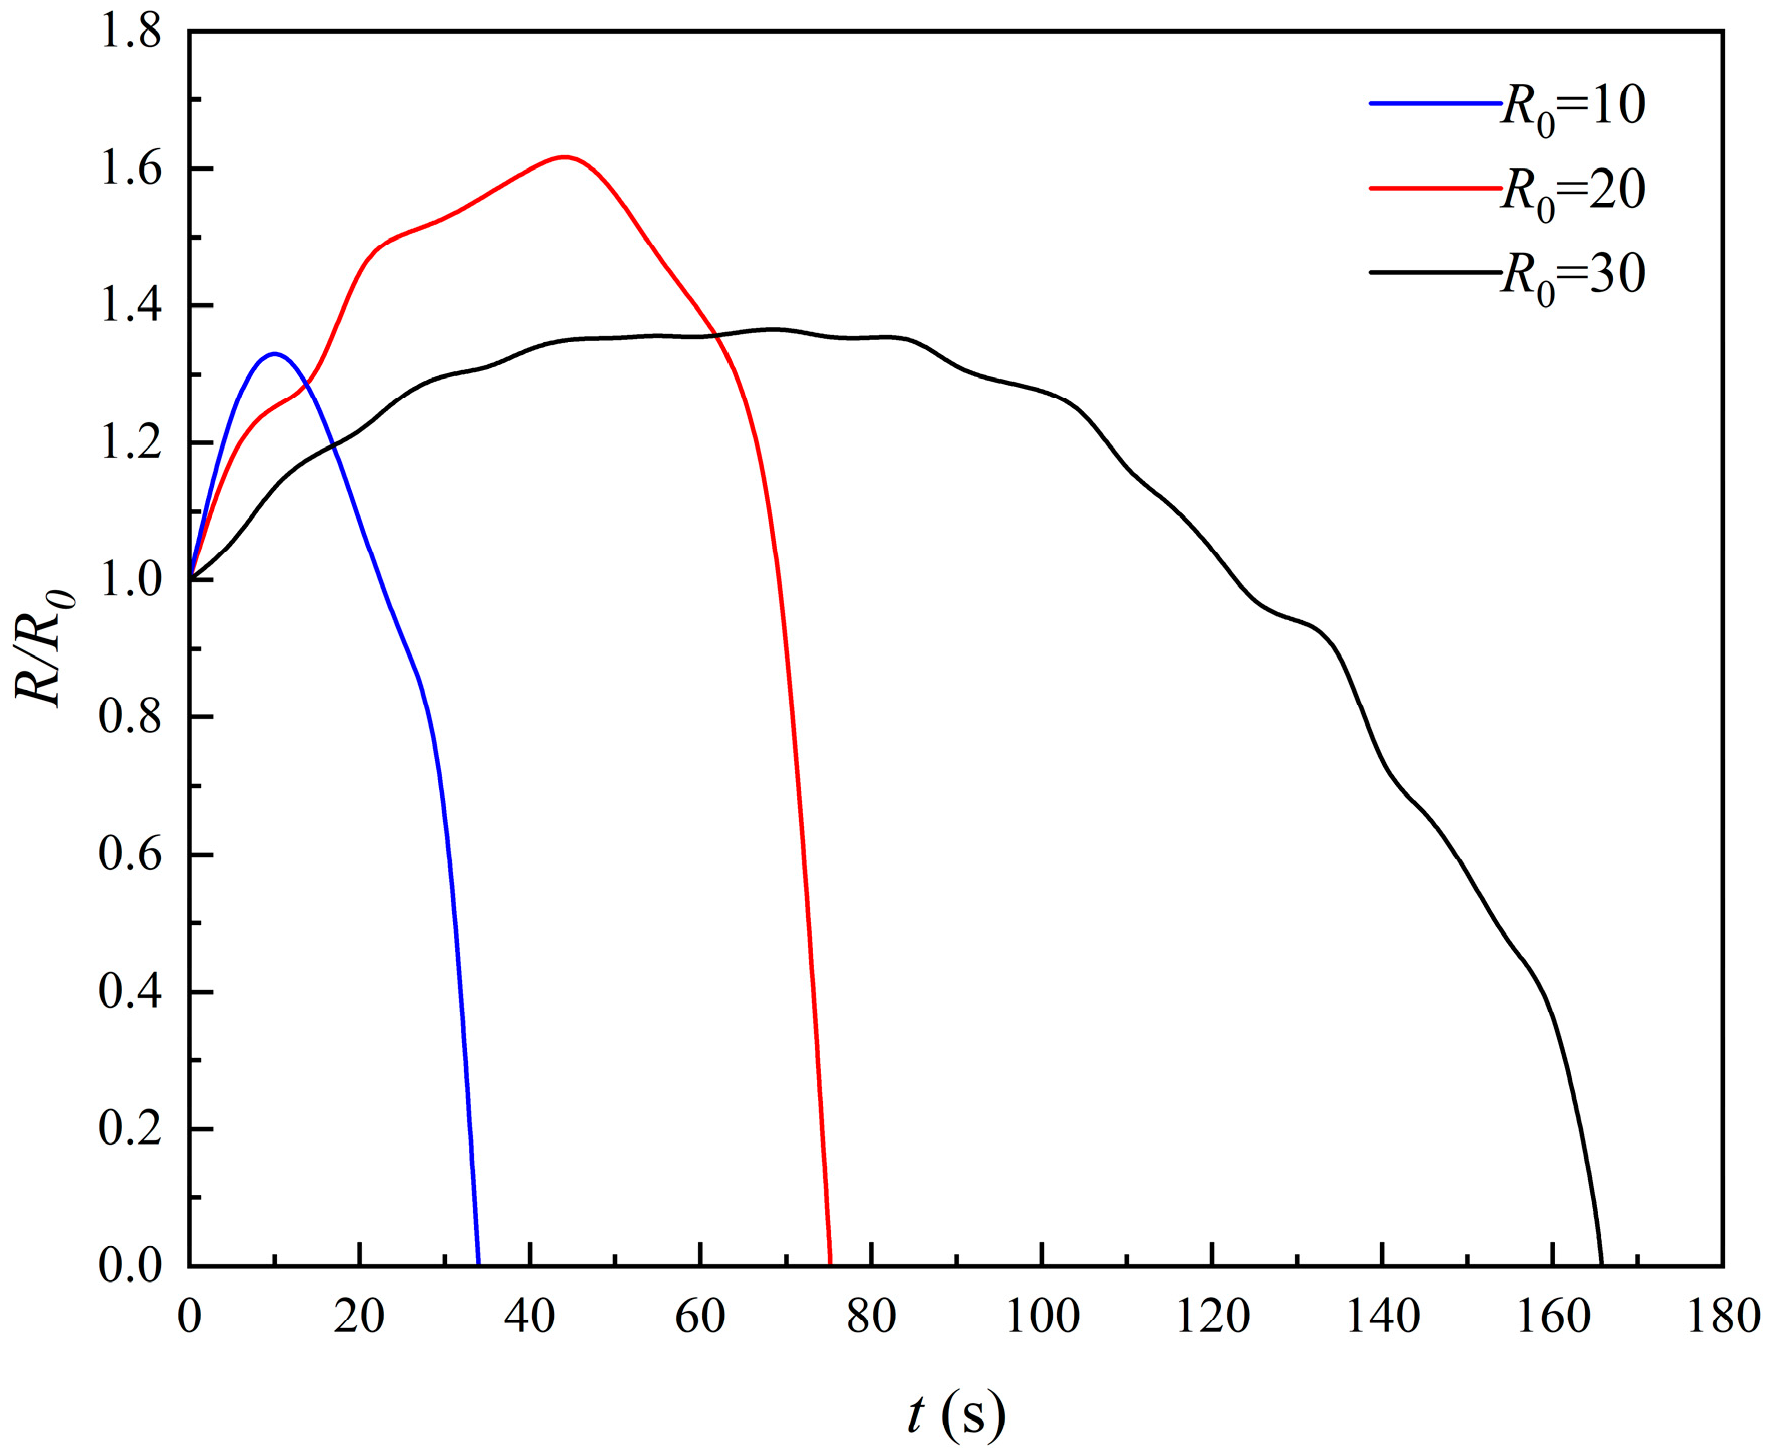
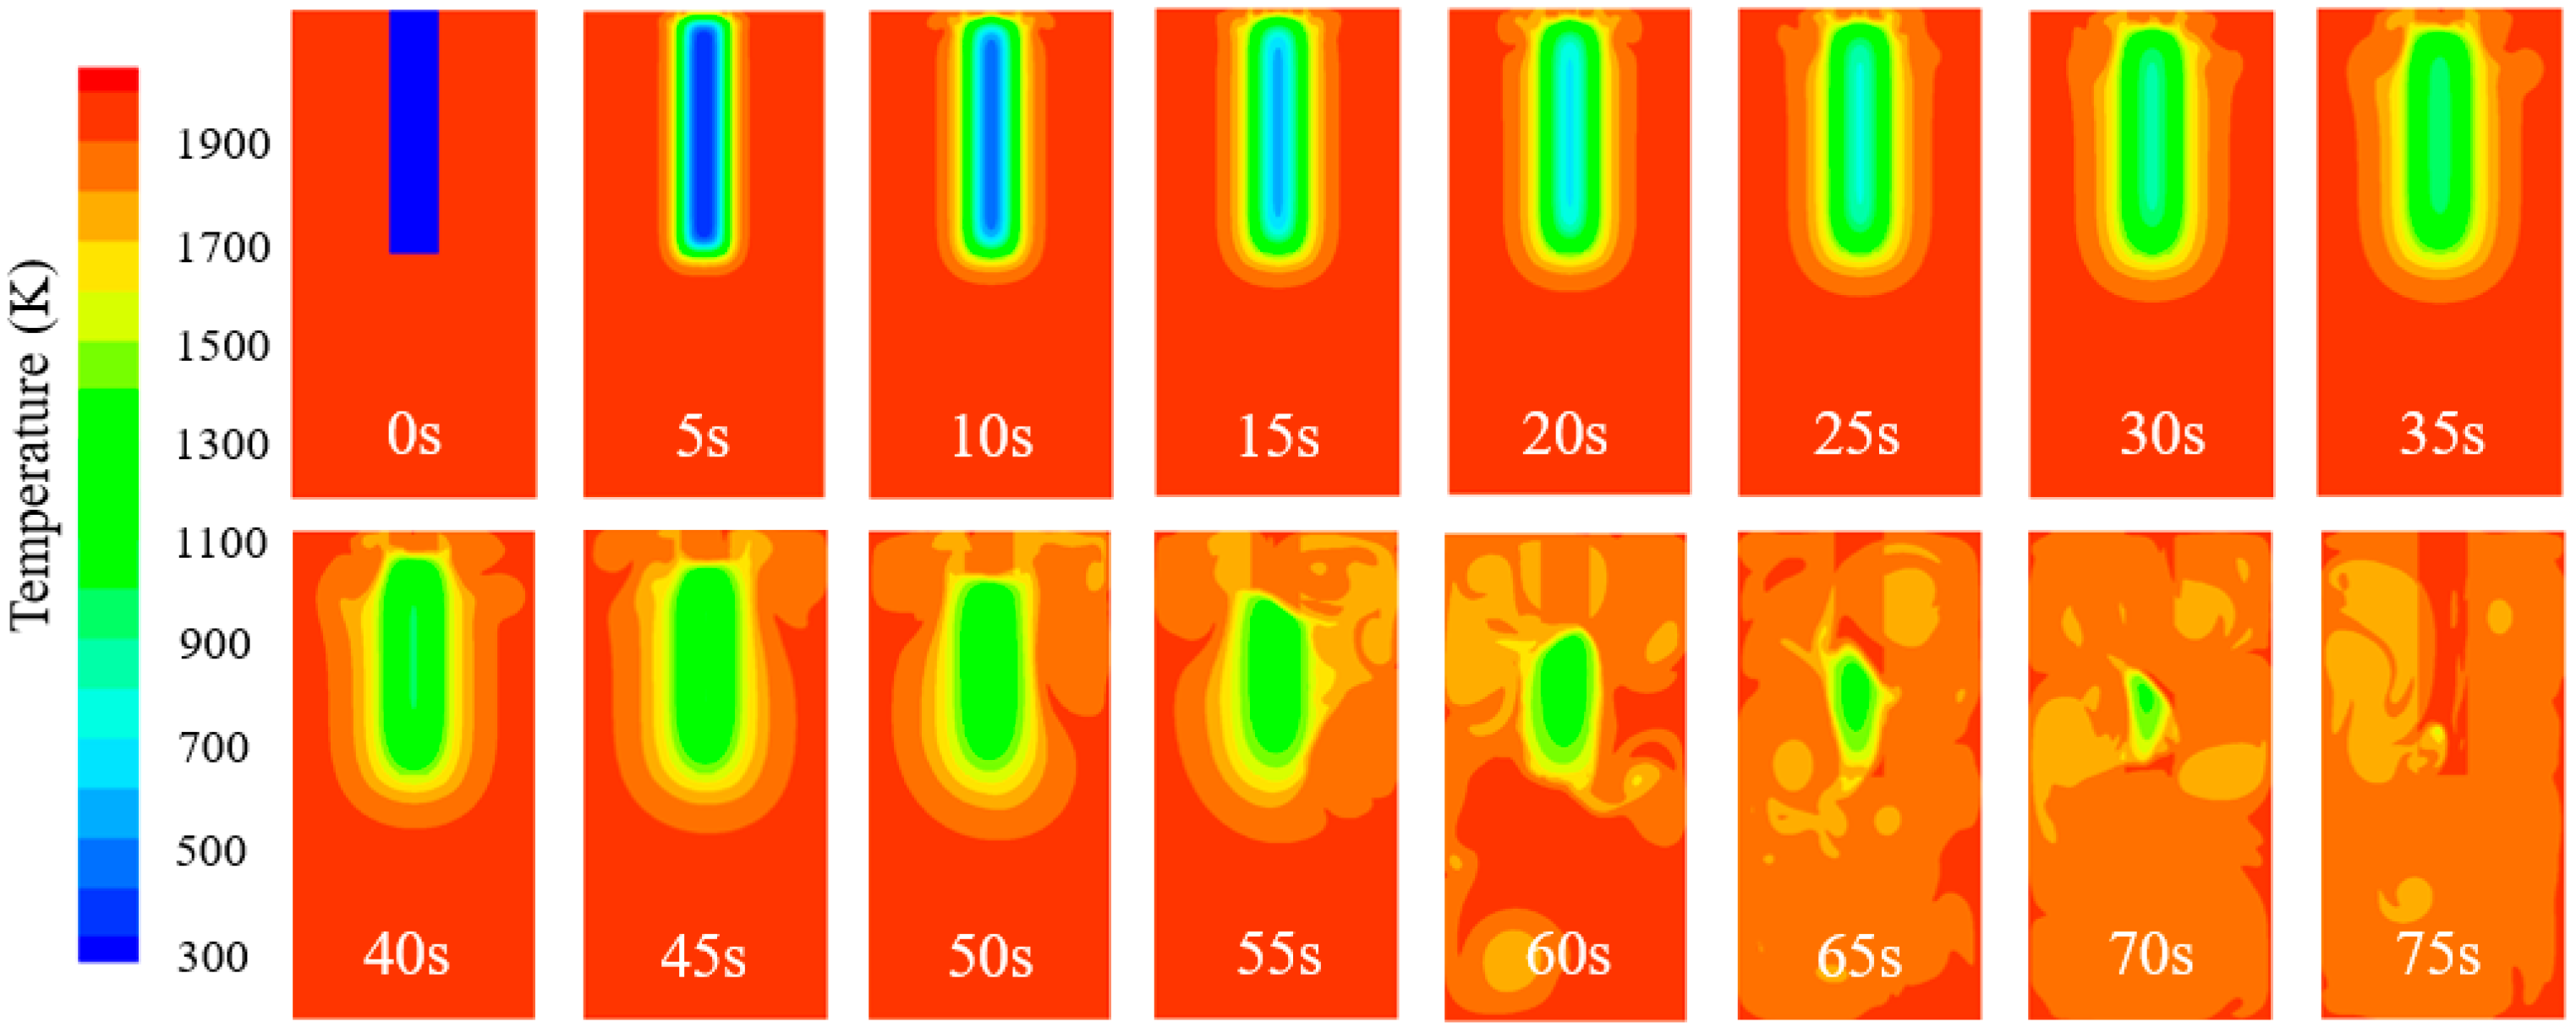
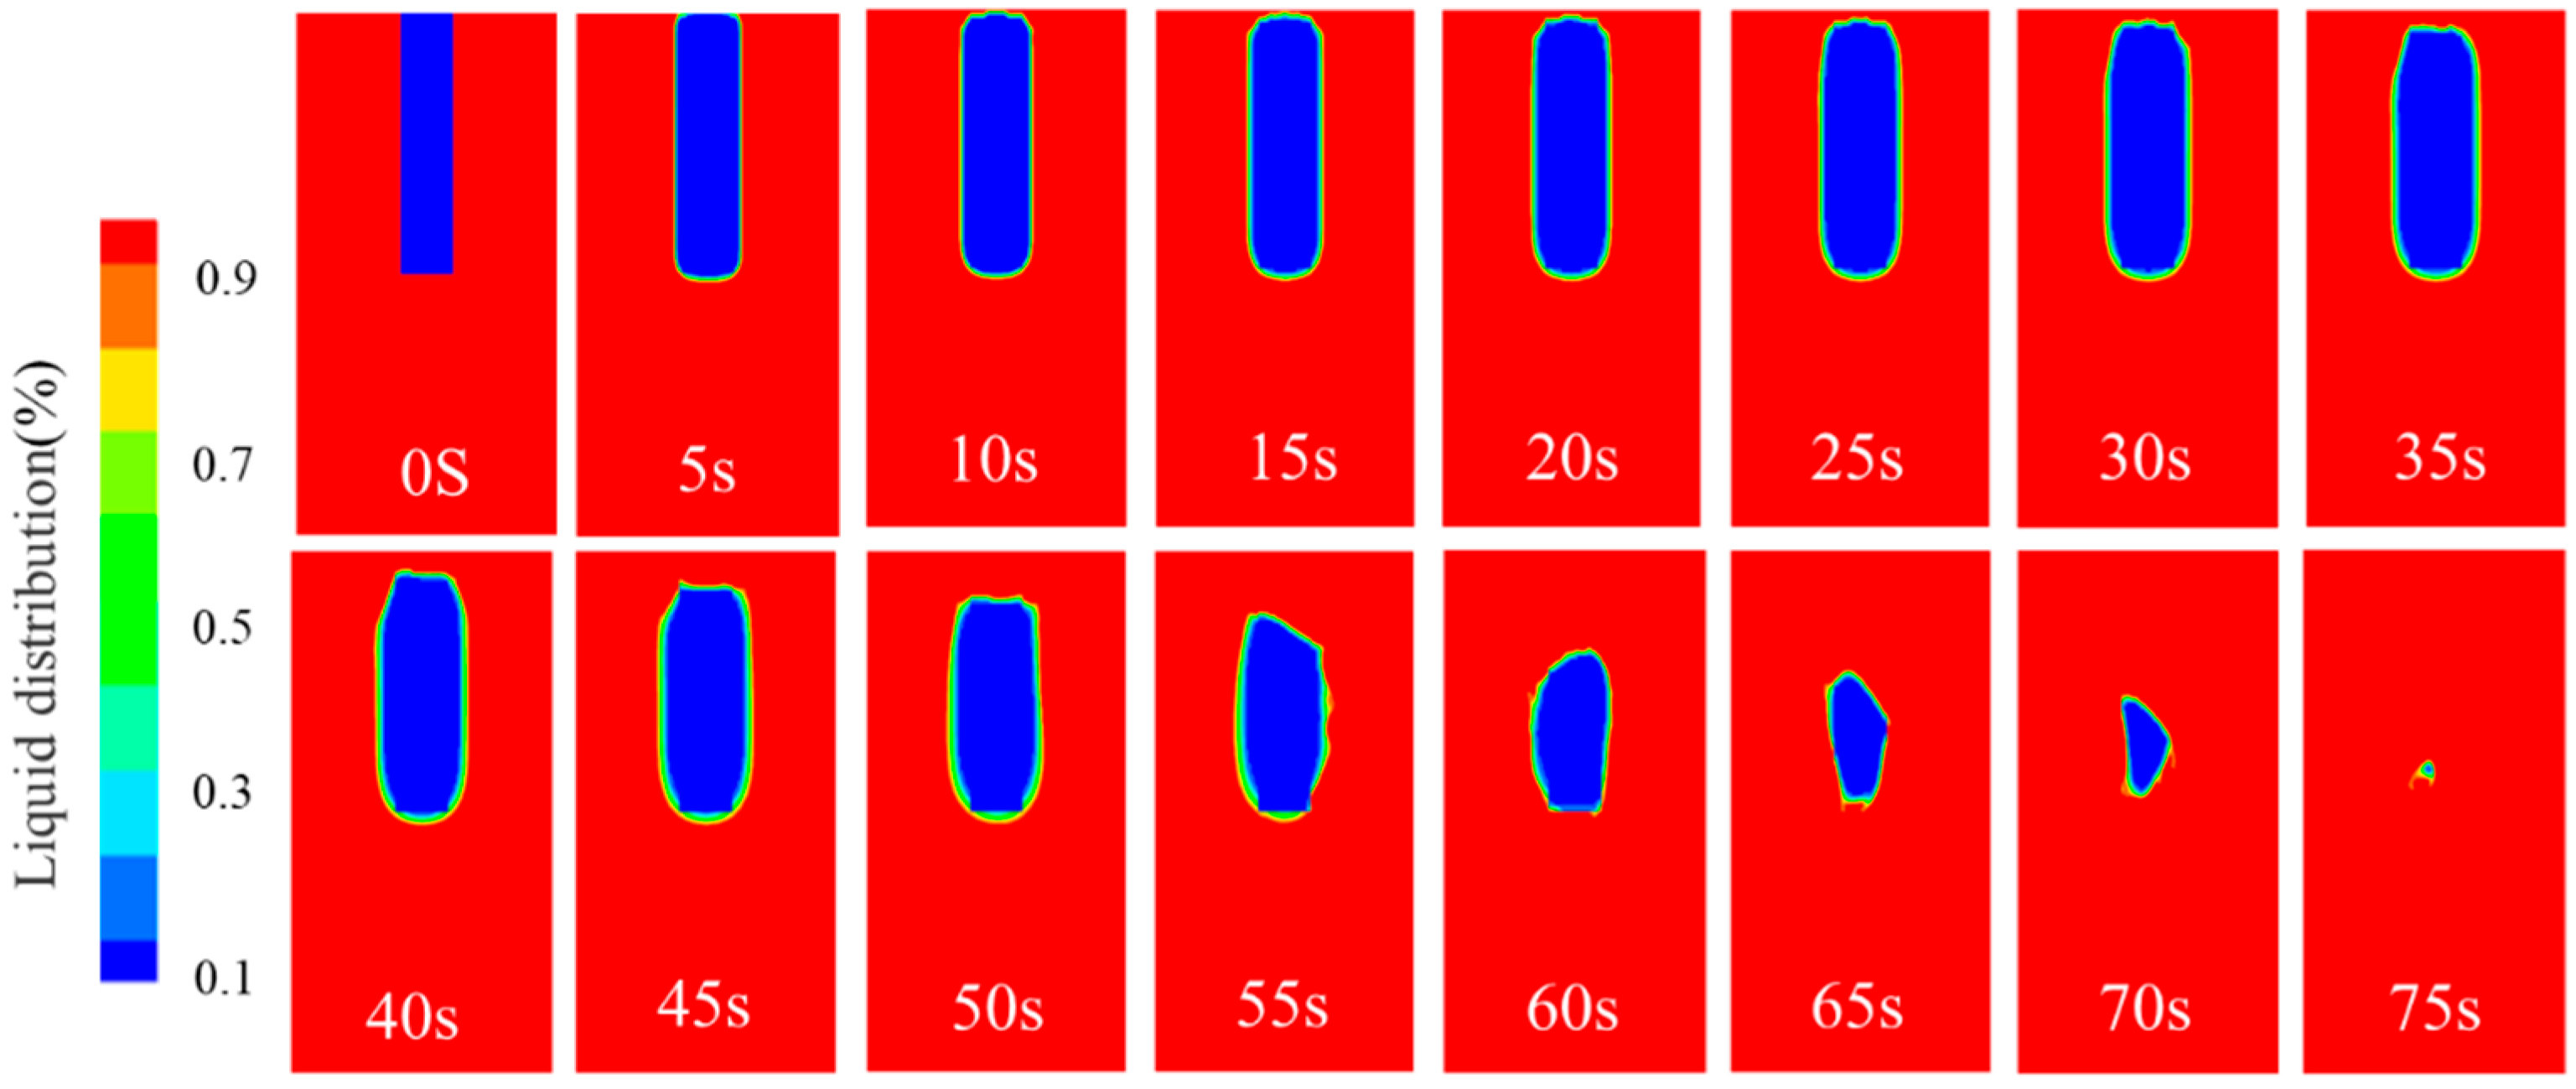
Figure 2 and Figure 3 show the variation in the temperature field and the liquid fraction contours during the melting process of the ferrochrome alloy, respectively. As shown in Figure 2, after the solid alloy is immersed in the liquid melt, heat transfer begins from the melt to the alloy, causing the alloy temperature to gradually increase. However, the temperature gradient at the interface remains relatively high; at this time, the heat flow provided by the melt is less than the heat flow dissipated by the heating alloy, resulting in a negative heat flow for the melting alloy. Consequently, the melt solidifies on the surface of the alloy, forming a solidified layer [19,20]. As the immersion time increases, the temperature gradient at the interface gradually decreases, and the thickness of the solidified layer increases. The thickness of the solidified layer reaches its maximum when the heat consumed by the alloy melting equals the heat provided by the melt. Figure 3 indicates that at 45 s, the solidified layer reaches its maximum thickness, at which point the ratio of the alloy’s characteristic length (R) to its initial length (R0) is 1.59, and the thickness of the solidified layer is 11.8 mm. With further increases in immersion time, the temperature gradient at the interface continues to decrease, and the overall temperature of the alloy gradually rises. The heat flow consumed by the alloy melting begins to turn positive, leading to the remelting of the solidified layer. Once the solidified layer is completely melted, the bulk of the alloy also starts to melt. The alloy is fully melted after an immersion time of 75.2 s.
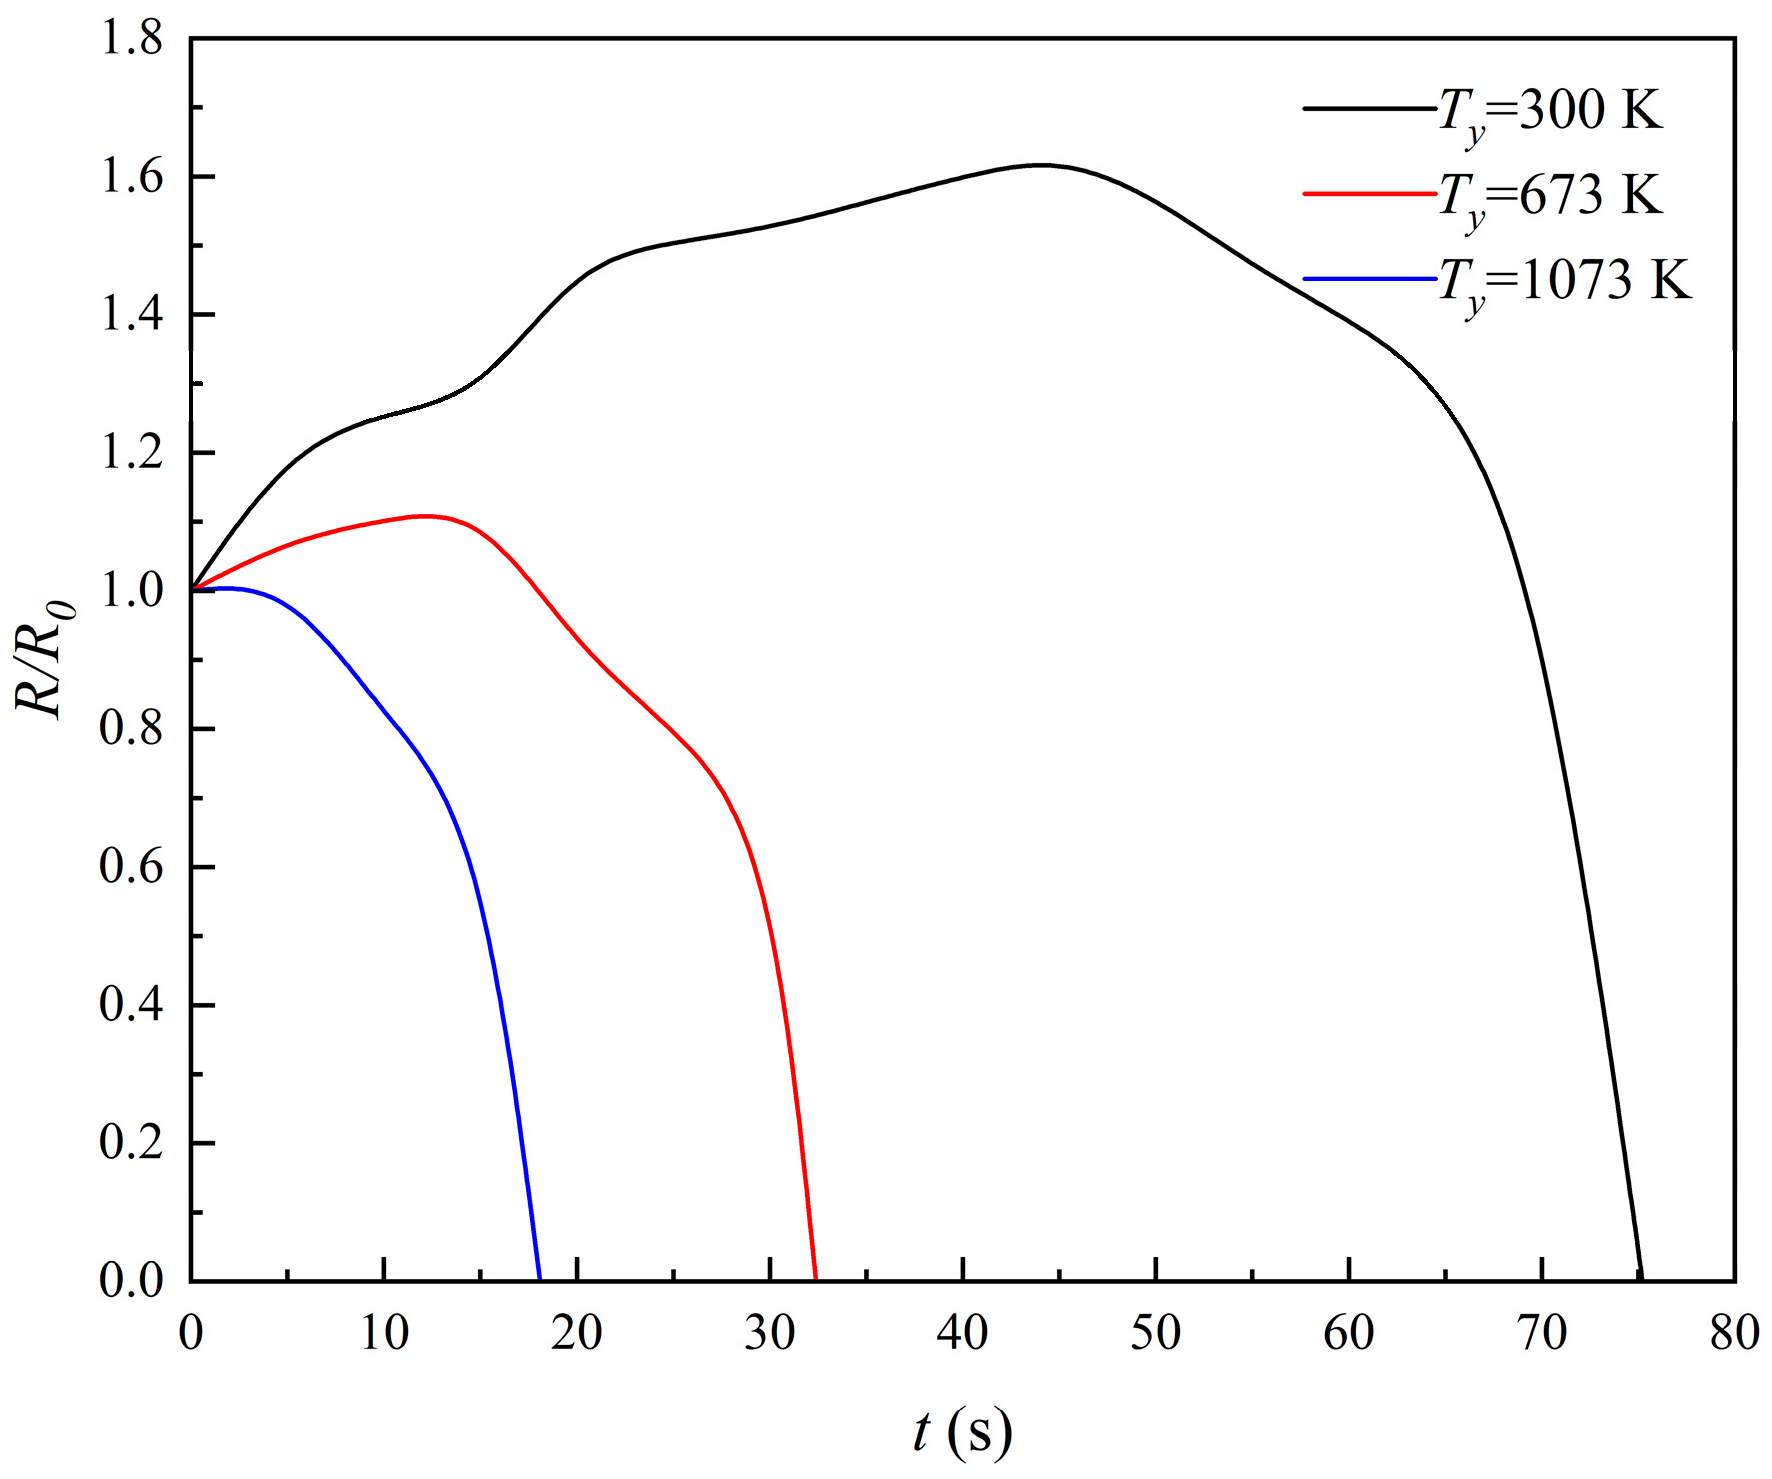
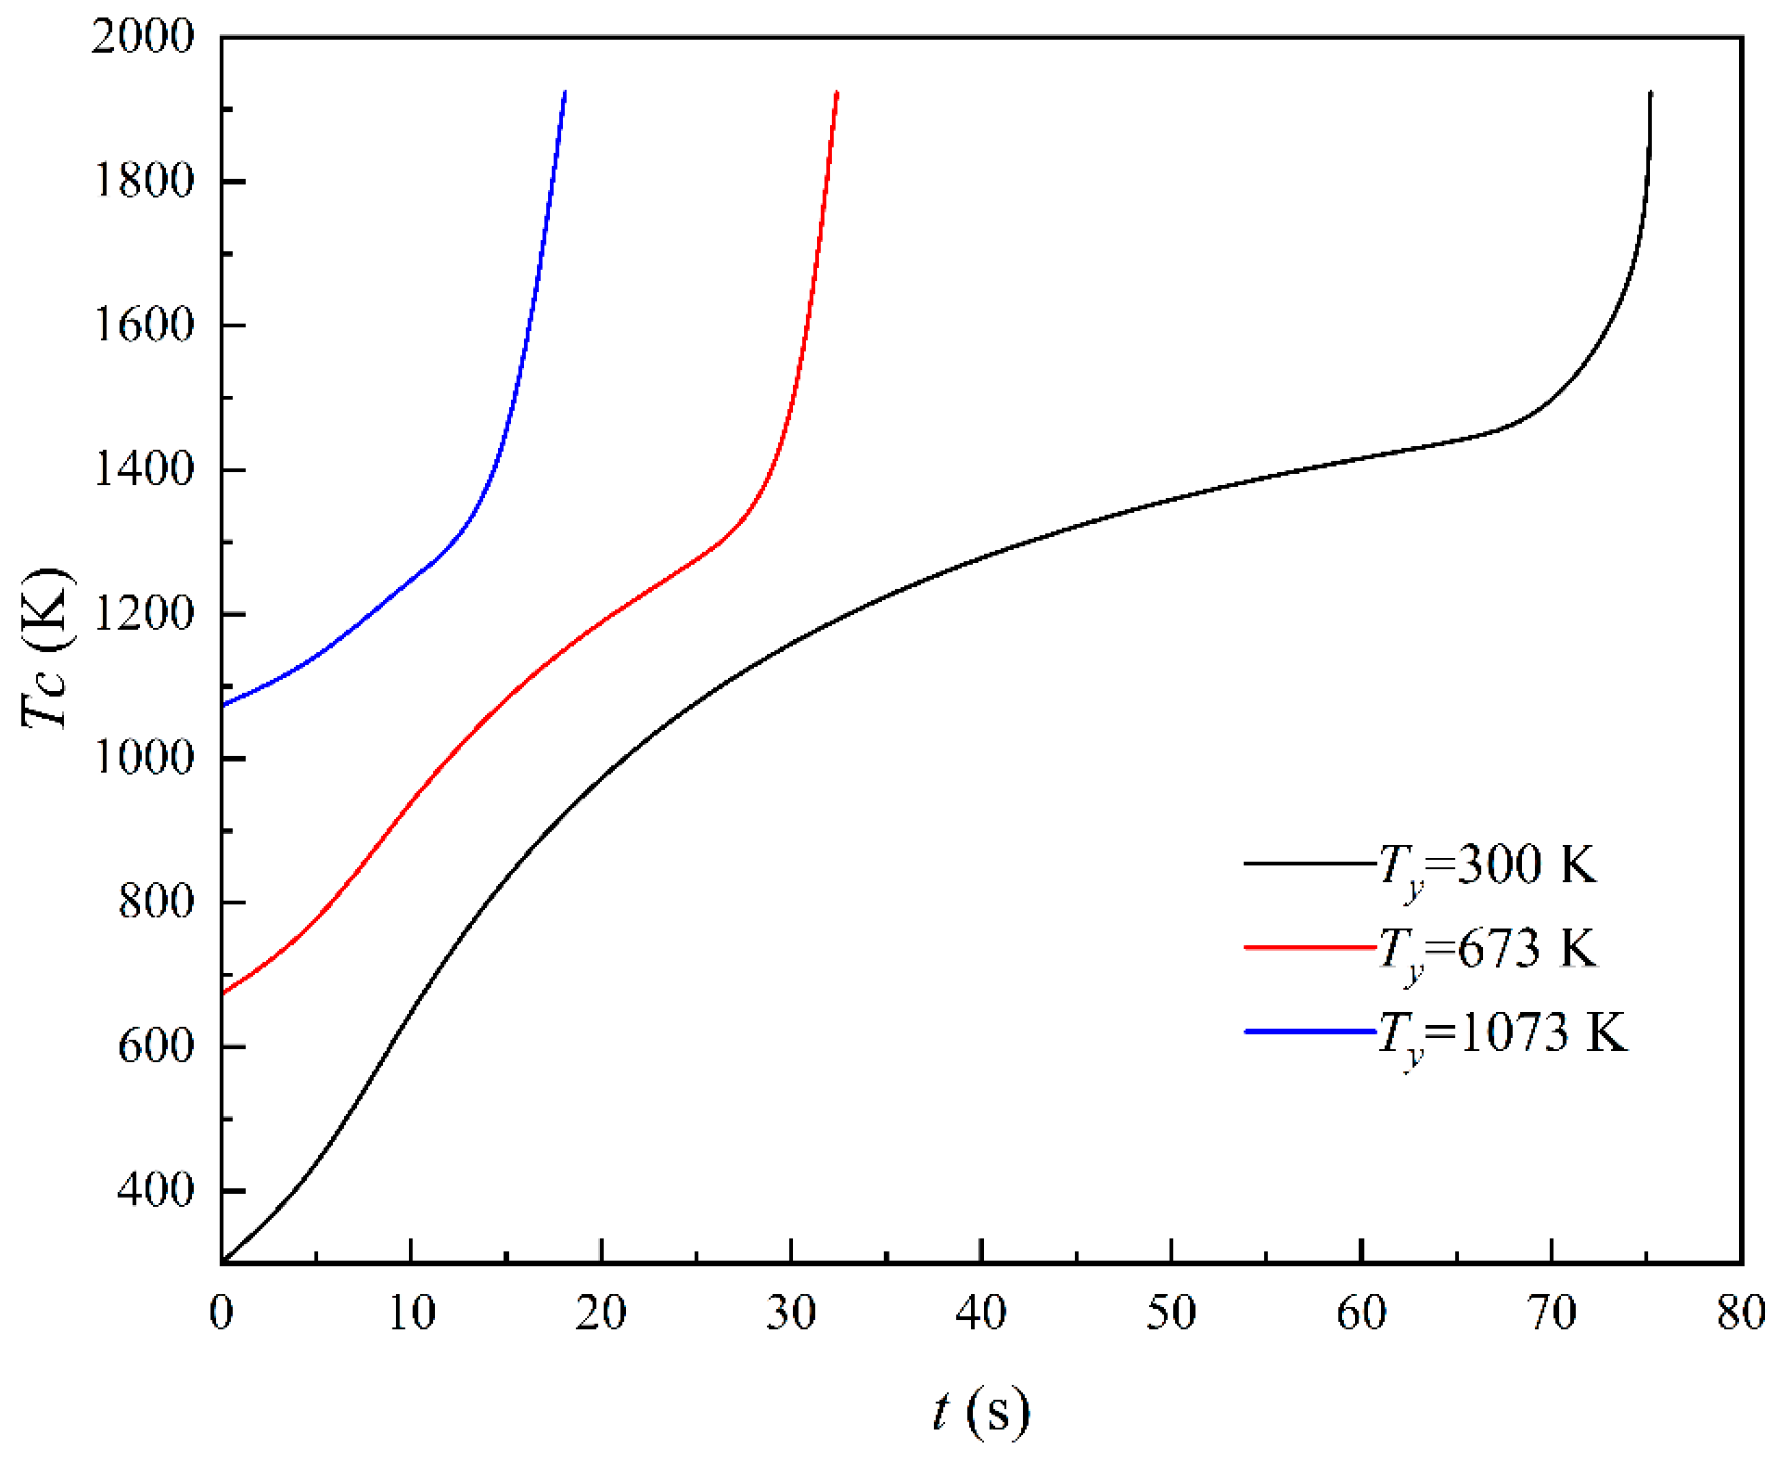
Here, Tb is the bath temperature, K; Cr1 is the bath chromium content, wt%; Cb1 is the bath carbon content, wt%; Cr2 is the alloy chromium content, wt%; Cb2 is the alloy carbon content, wt%; R0 is the initial radius of the alloy, mm; and Ty is the center temperature of the alloy, K.
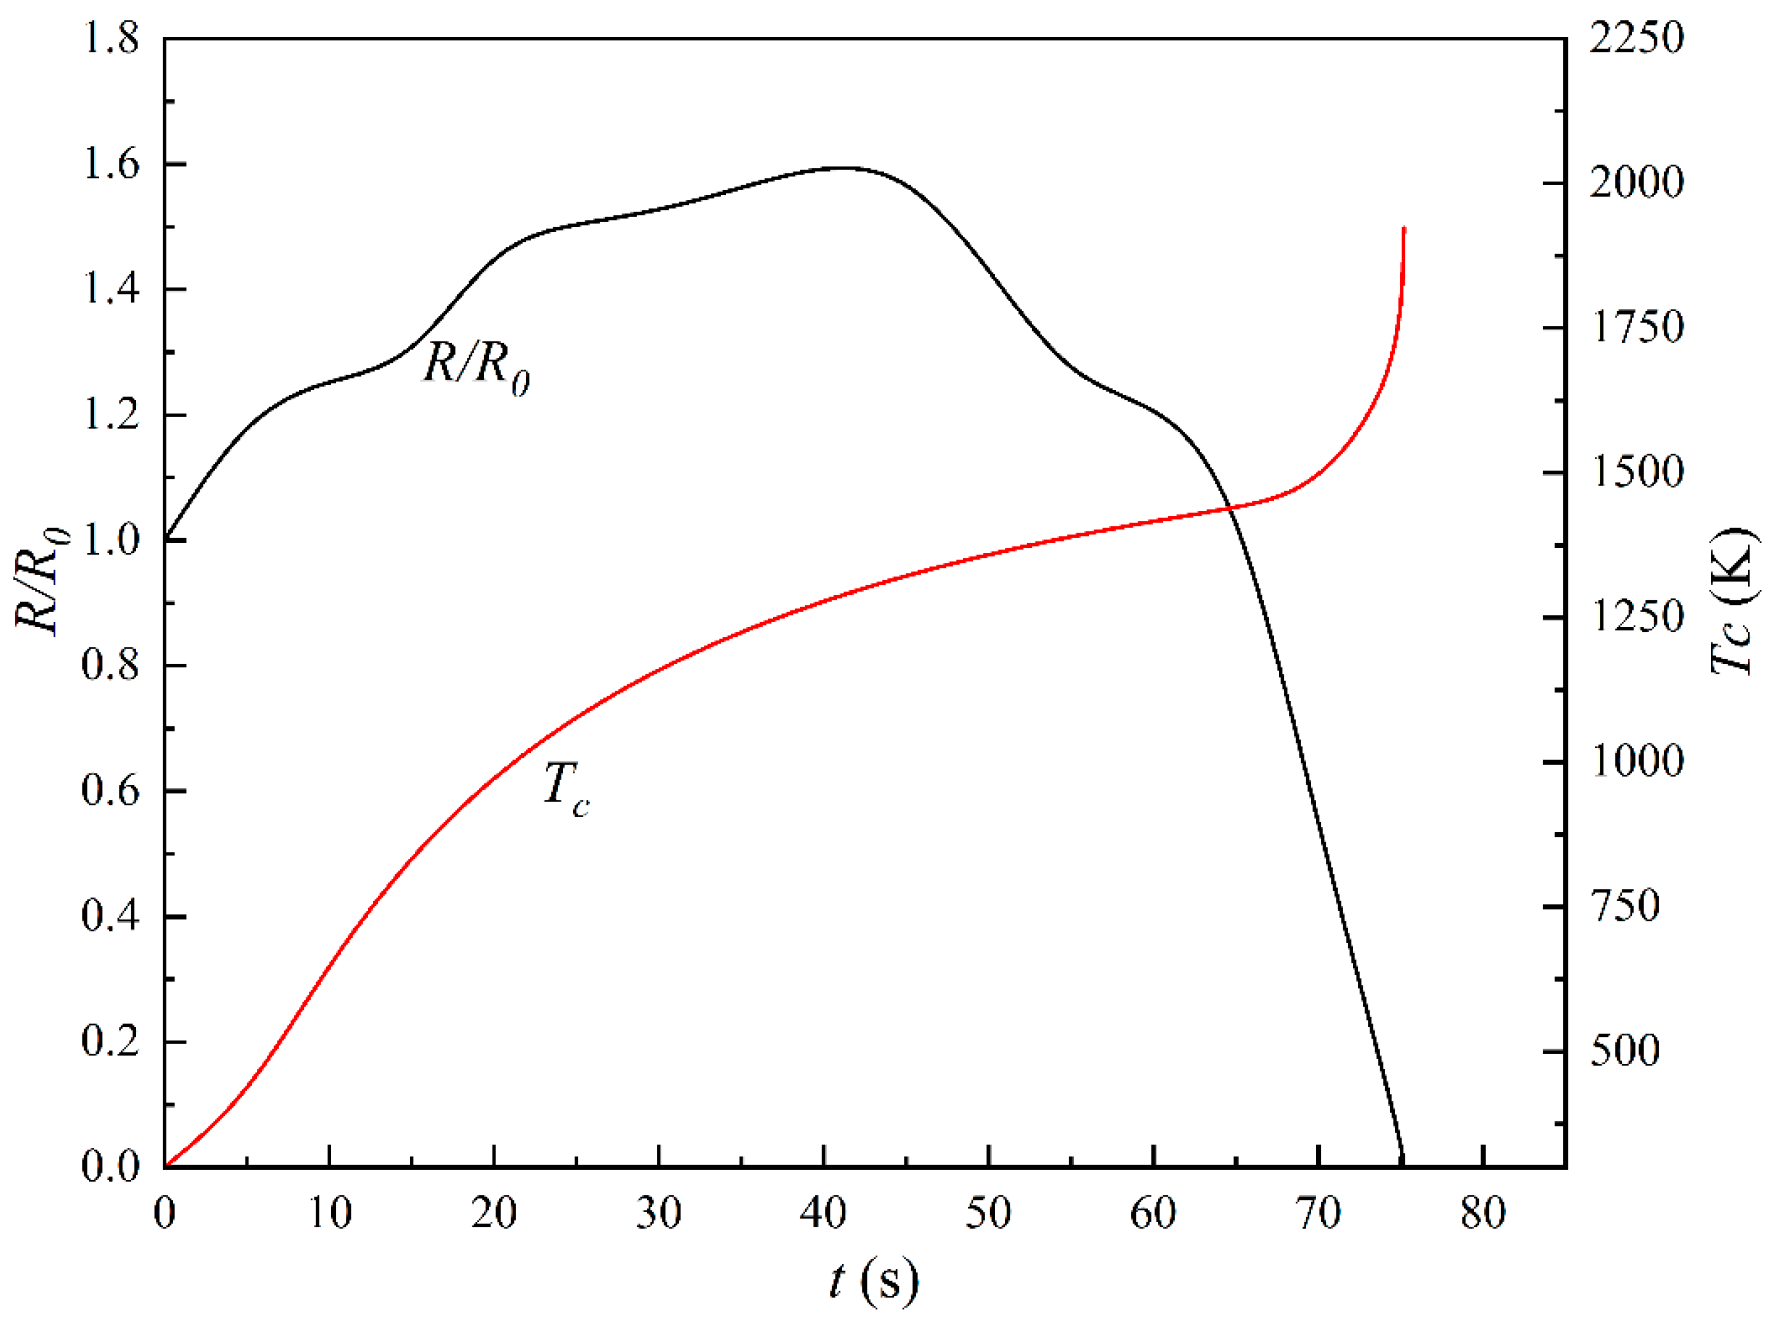
Throughout the entire alloy melting process, the center temperature of the alloy (Tc) remains at its lowest value, as shown in Figure 4. In the first 70 s of alloy melting, the center temperature of the alloy gradually increases, with its heating rate being approximately linear with the immersion time. In this phase, the heating rate of the alloy center is 21 K/s, and this phase primarily involves the formation and remelting of the solidified layer, with part of the heat flow from the melt used to heat and melt the solidified layer. After the immersion time reaches 70 s, the heating rate of the alloy center increases significantly because the solidified layer on the alloy’s surface has completely melted, and the heat flow from the melt is entirely used to melt the alloy.

4.2. Effect of Bath Temperature on Melting Behavior of Ferrochrome Alloy

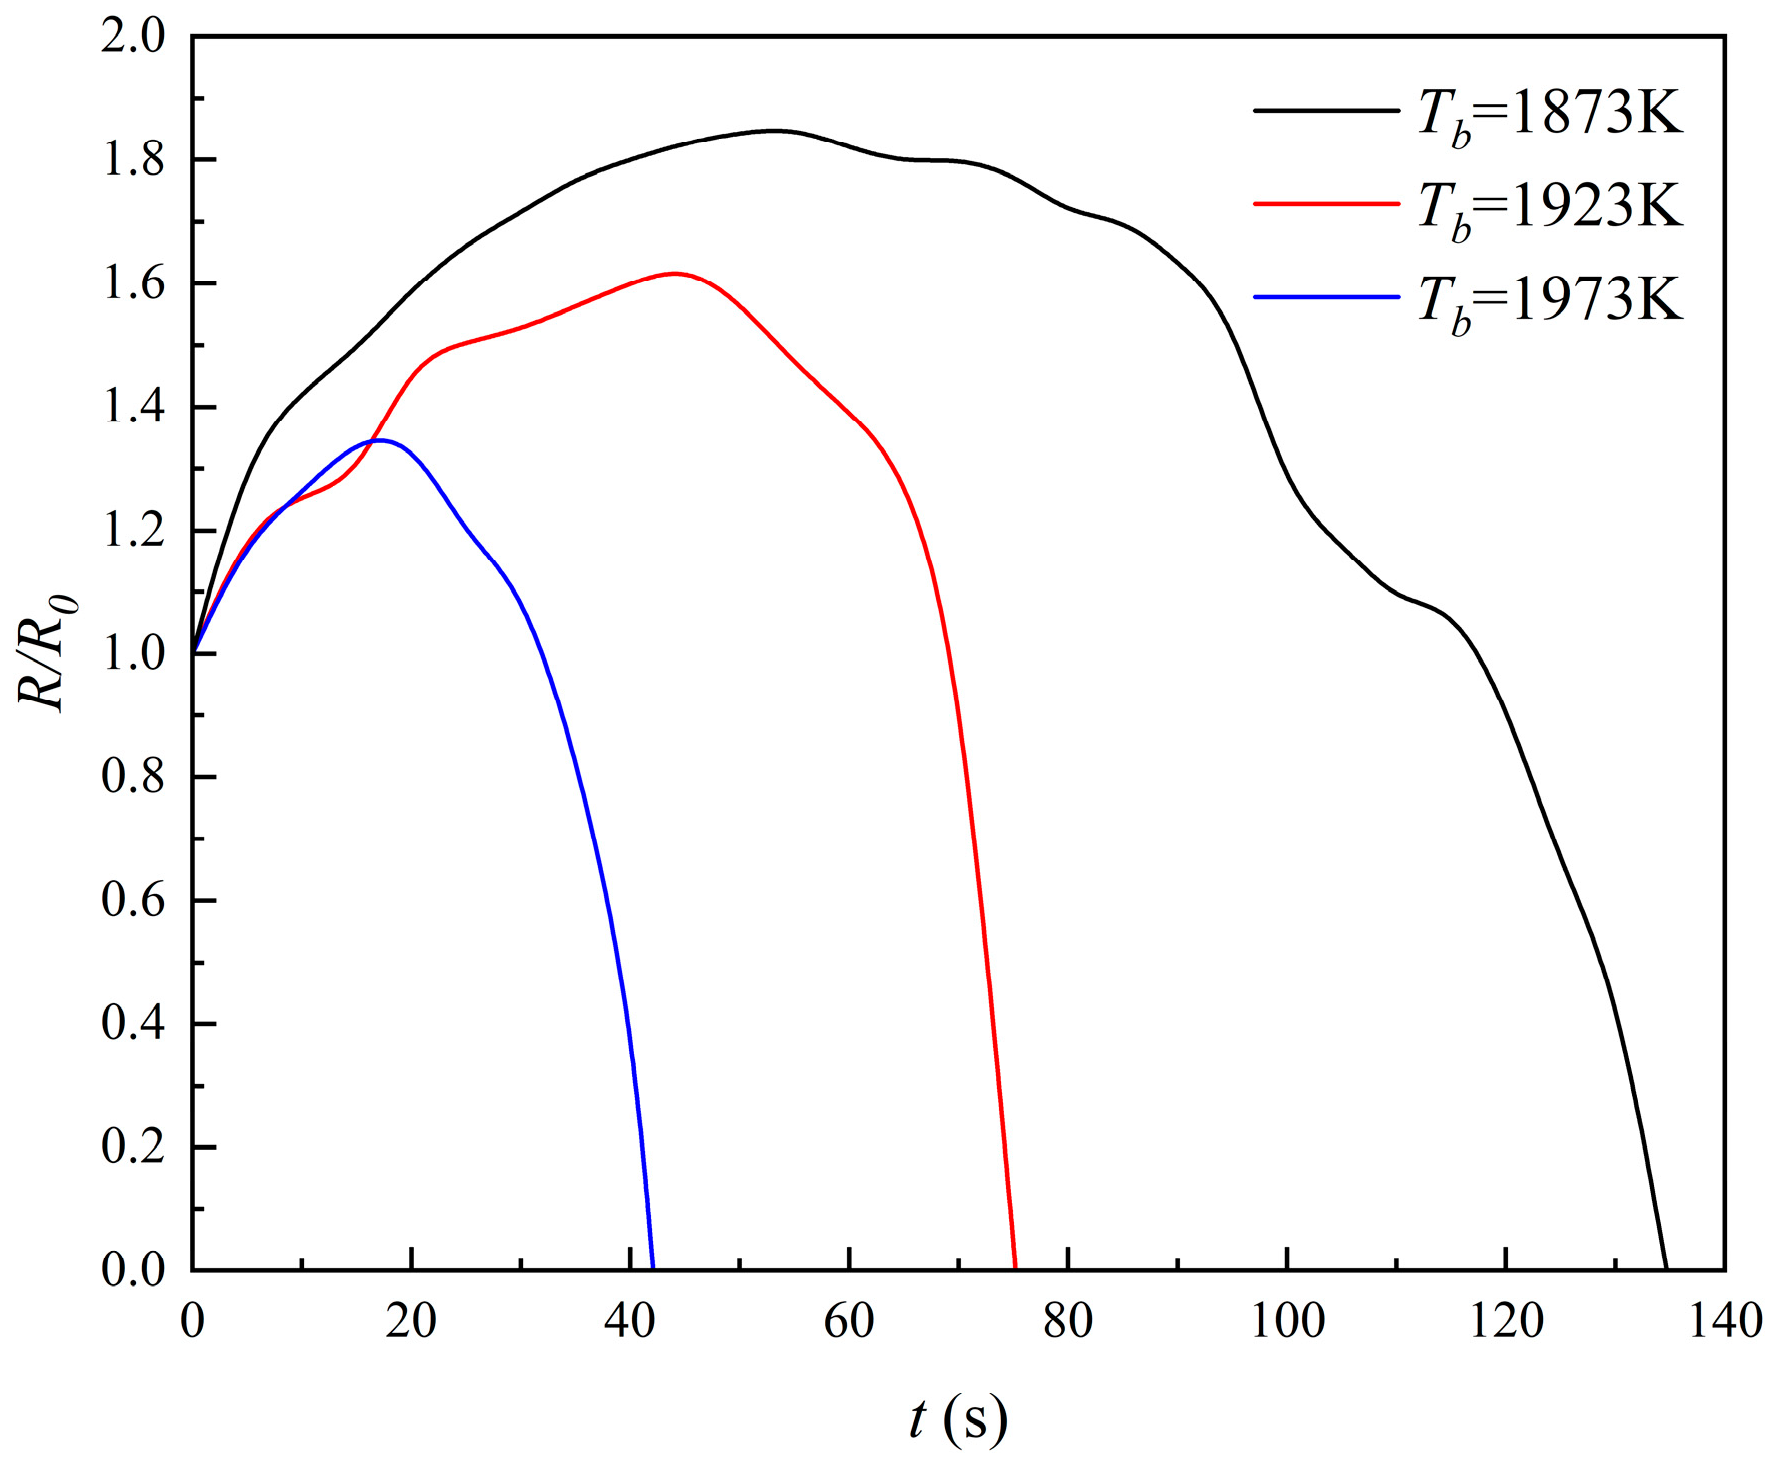
Figure 5 shows the variation in characteristic length of ferrochrome alloy with the immersion time of different bath temperatures. As the bath temperature increases, the heat flow provided by the melt to the alloy also rises, resulting in a greater heat flow for melting the alloy. Consequently, the formation time of the solidification layer gradually decreases, the maximum thickness gradually reduces, and the melting rate of the alloy accelerates from 0.48 × 10⁻⁴ m/s to 1.22 × 10⁻⁴ m/s. Additionally, the time for complete melting gradually decreases from 134.7 s to 42.1 s.
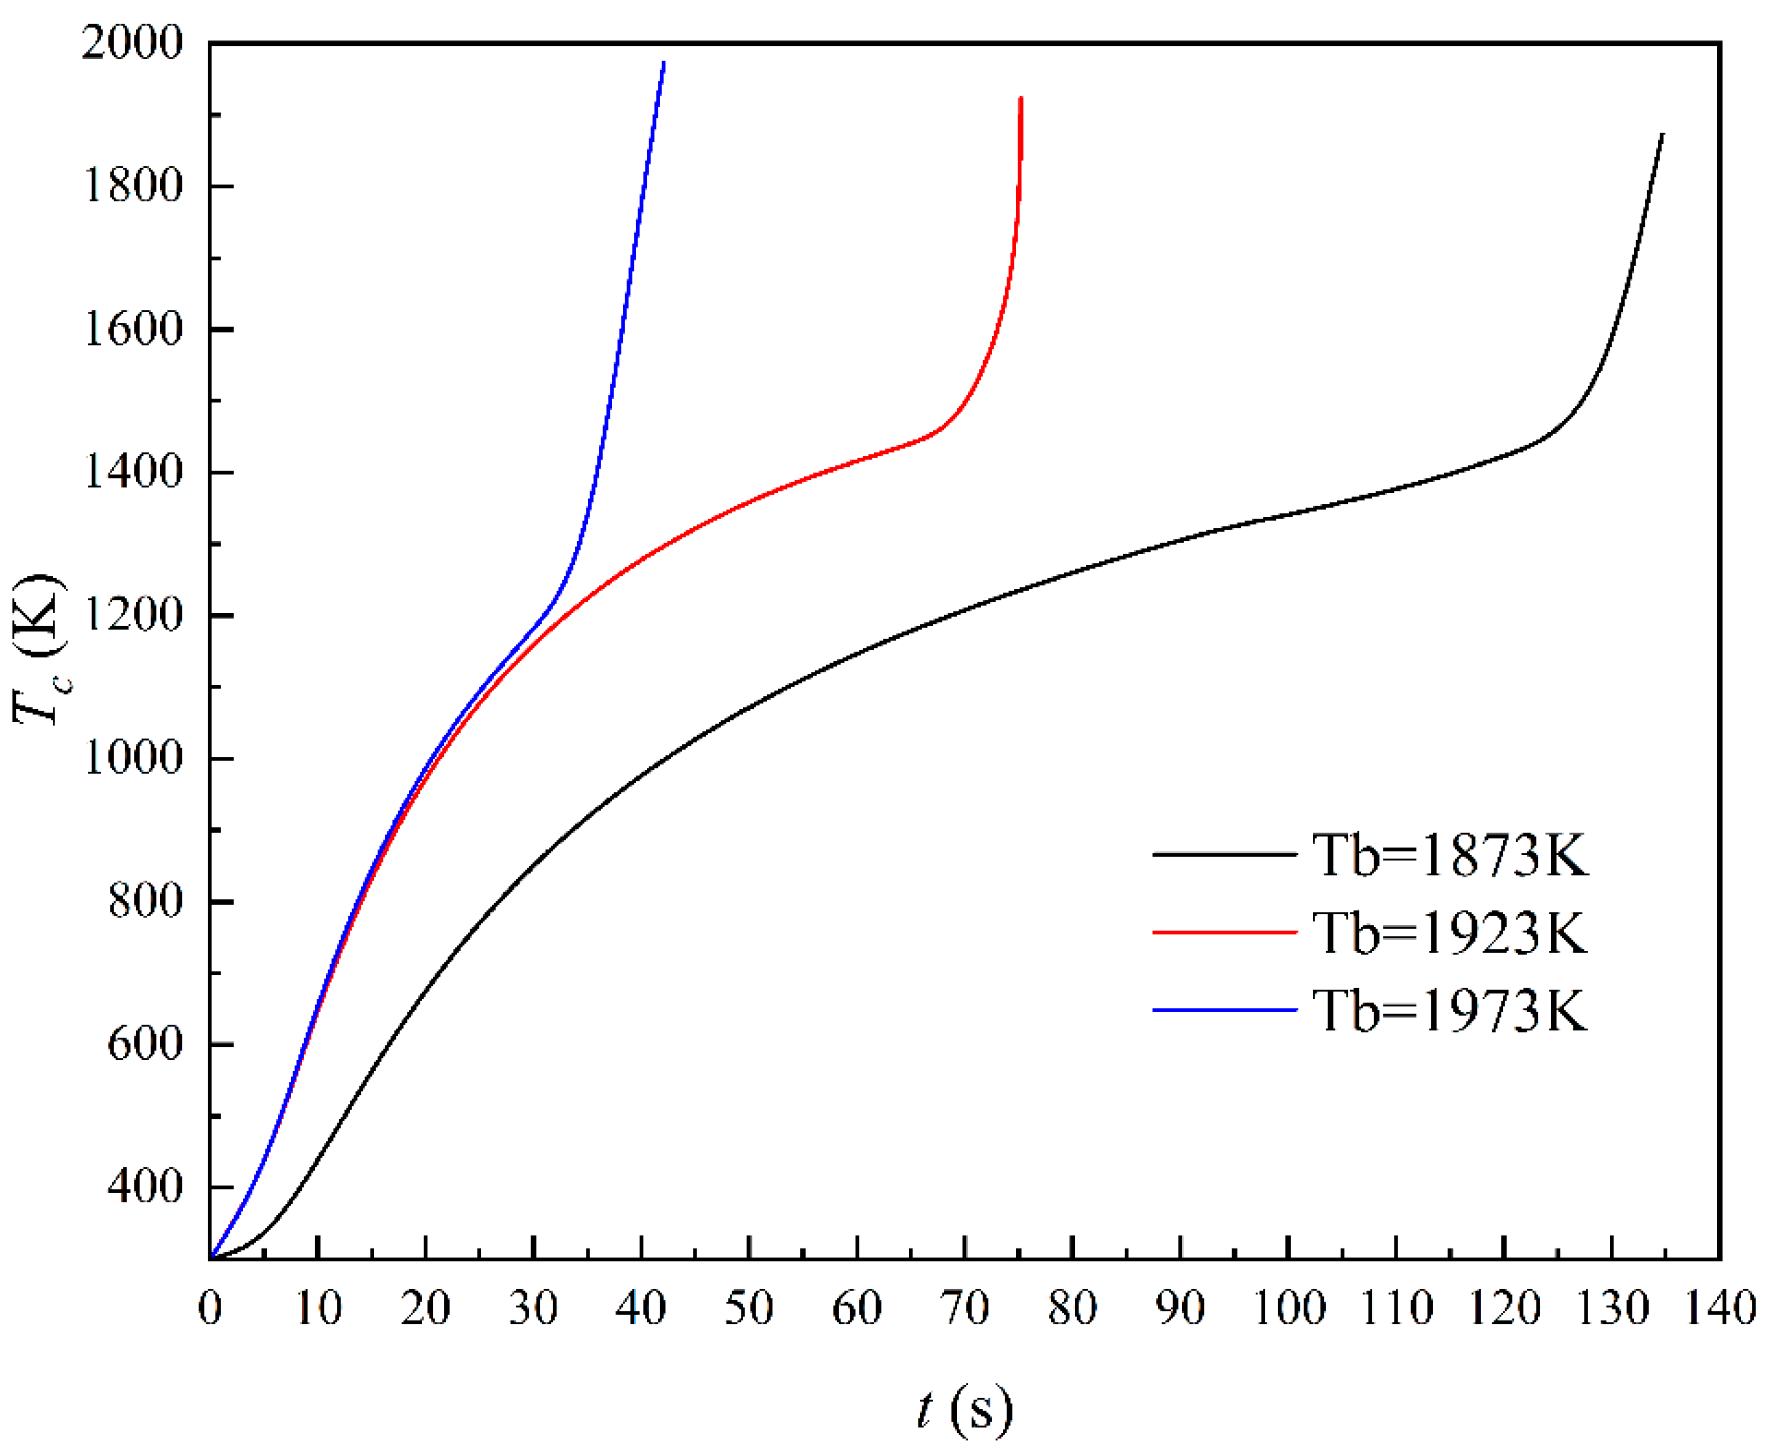
Figure 6 shows the variation in the center temperature of ferrochrome alloy with the immersion time of different bath temperatures. As can be seen in Figure 5, with the increase in bath temperature, the heating rates of the alloy center remain relatively constant at 9.6 K/s, 16.7 K/s, and 27.8 K/s in the first 130 s, 70 s, and 35 s of the melting process when the temperatures are 1873 K, 1923 K, and 1973 K, respectively. This is due to the large temperature gradient at the interface during this process, where most of the additional heat flow generated by the increased bath temperature is dissipated by heating and melting the solidification layer. Furthermore, as the bath temperature rises, the melting rate of the solidification layer also accelerates. After the solidification layer is completely remelted, the heat flow provided by the melt to the alloy body increases with the rising bath temperature, resulting in a gradual acceleration of the heating rate at the alloy center, increasing from 49.3 K/s to 90.1 K/s.

4.3. Effect of Bath Chromium Content on Melting Behavior of Ferrochrome Alloy

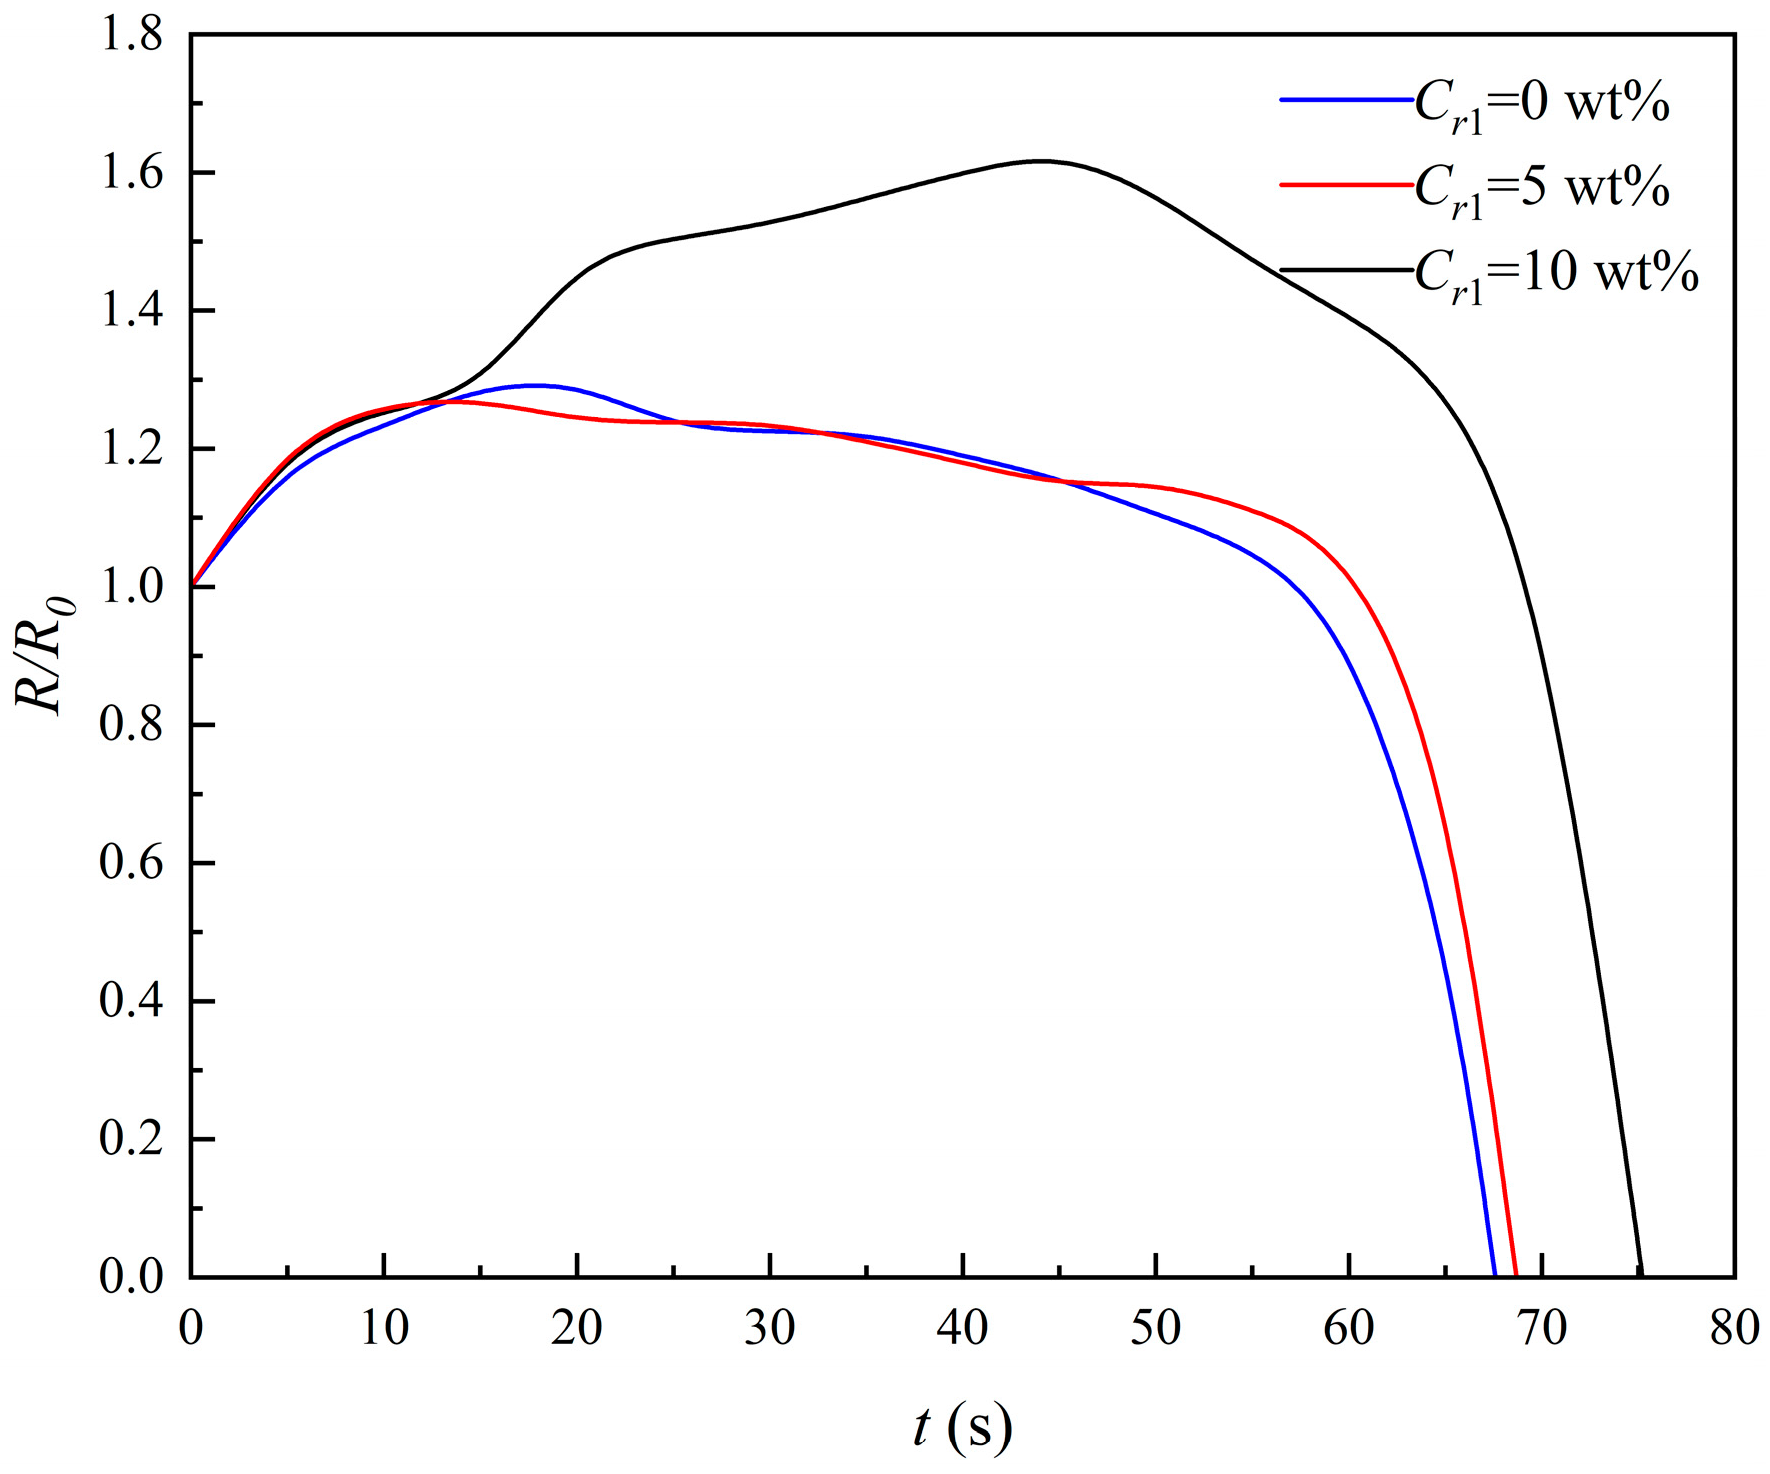
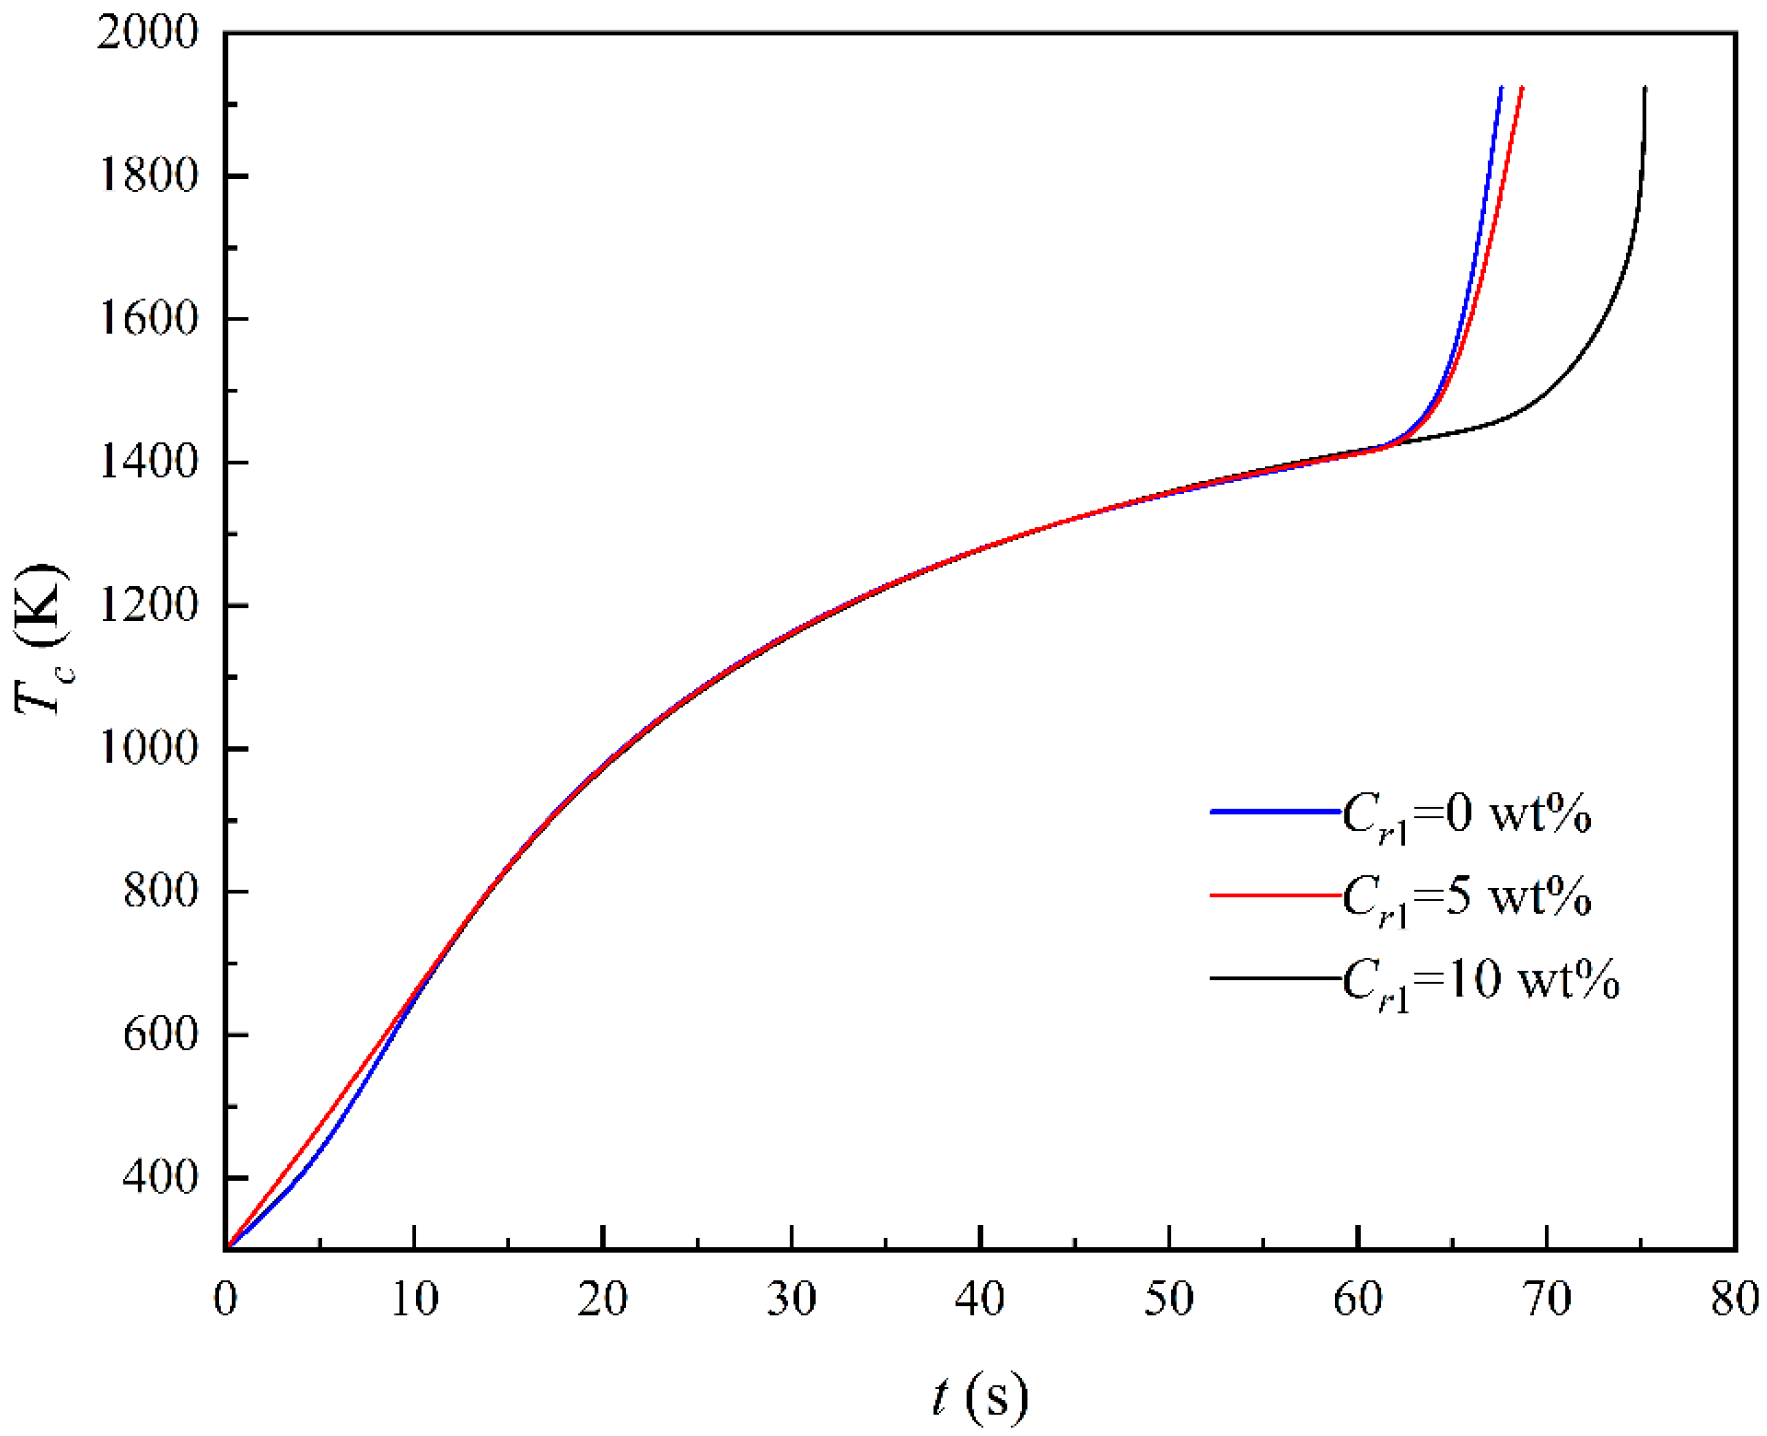
Figure 7 shows the variation in the alloy characteristic length with the immersion time of different bath chromium contents. As the bath chromium content increases, the formation time of the solidification layer gradually increases, and its maximum thickness also increases, resulting in a decreasing melting rate of the alloy from 2.47 × 10⁻⁴ m/s to 0.91 × 10⁻⁴ m/s, and the complete melting time gradually increased from 68.7 s to 75.2 s. When the bath chromium content is 0 wt% and 5 wt%, the complete melting times are similar, but when the bath chromium content is 10 wt%, the time for complete melting significantly increases. This is because with the increase in bath chromium content, the melting point of the solidified layer formed by the solidification of the melt increases, so the heat required for the heating and melting of the solidified layer increases, the melting rate of the alloy slows down, and the complete melting time increases.
Figure 8 shows the variation in the alloy center temperature with the immersion time of different bath chromium contents. As indicated in Figure 7, with the increase in bath chromium content, the heating rate of the alloy center remains relatively constant at approximately 18.6 K/s during the initial 62 s of alloy melting, primarily involving the remelting of the solidification layer. Once the solidification layer is completely melted, the heating rate at the alloy center decreases with increasing bath chromium content. This is due to the increase in the chromium transfer rate between the melt and the alloy as the bath chromium content rises, resulting in a higher chromium content entering the alloy, which in turn raises the alloy’s melting point and reduces its melting rate from 98.3 K/s to 38.5 K/s.

4.4. Effect of Bath Carbon Content on Melting Behavior of Ferrochrome Alloy

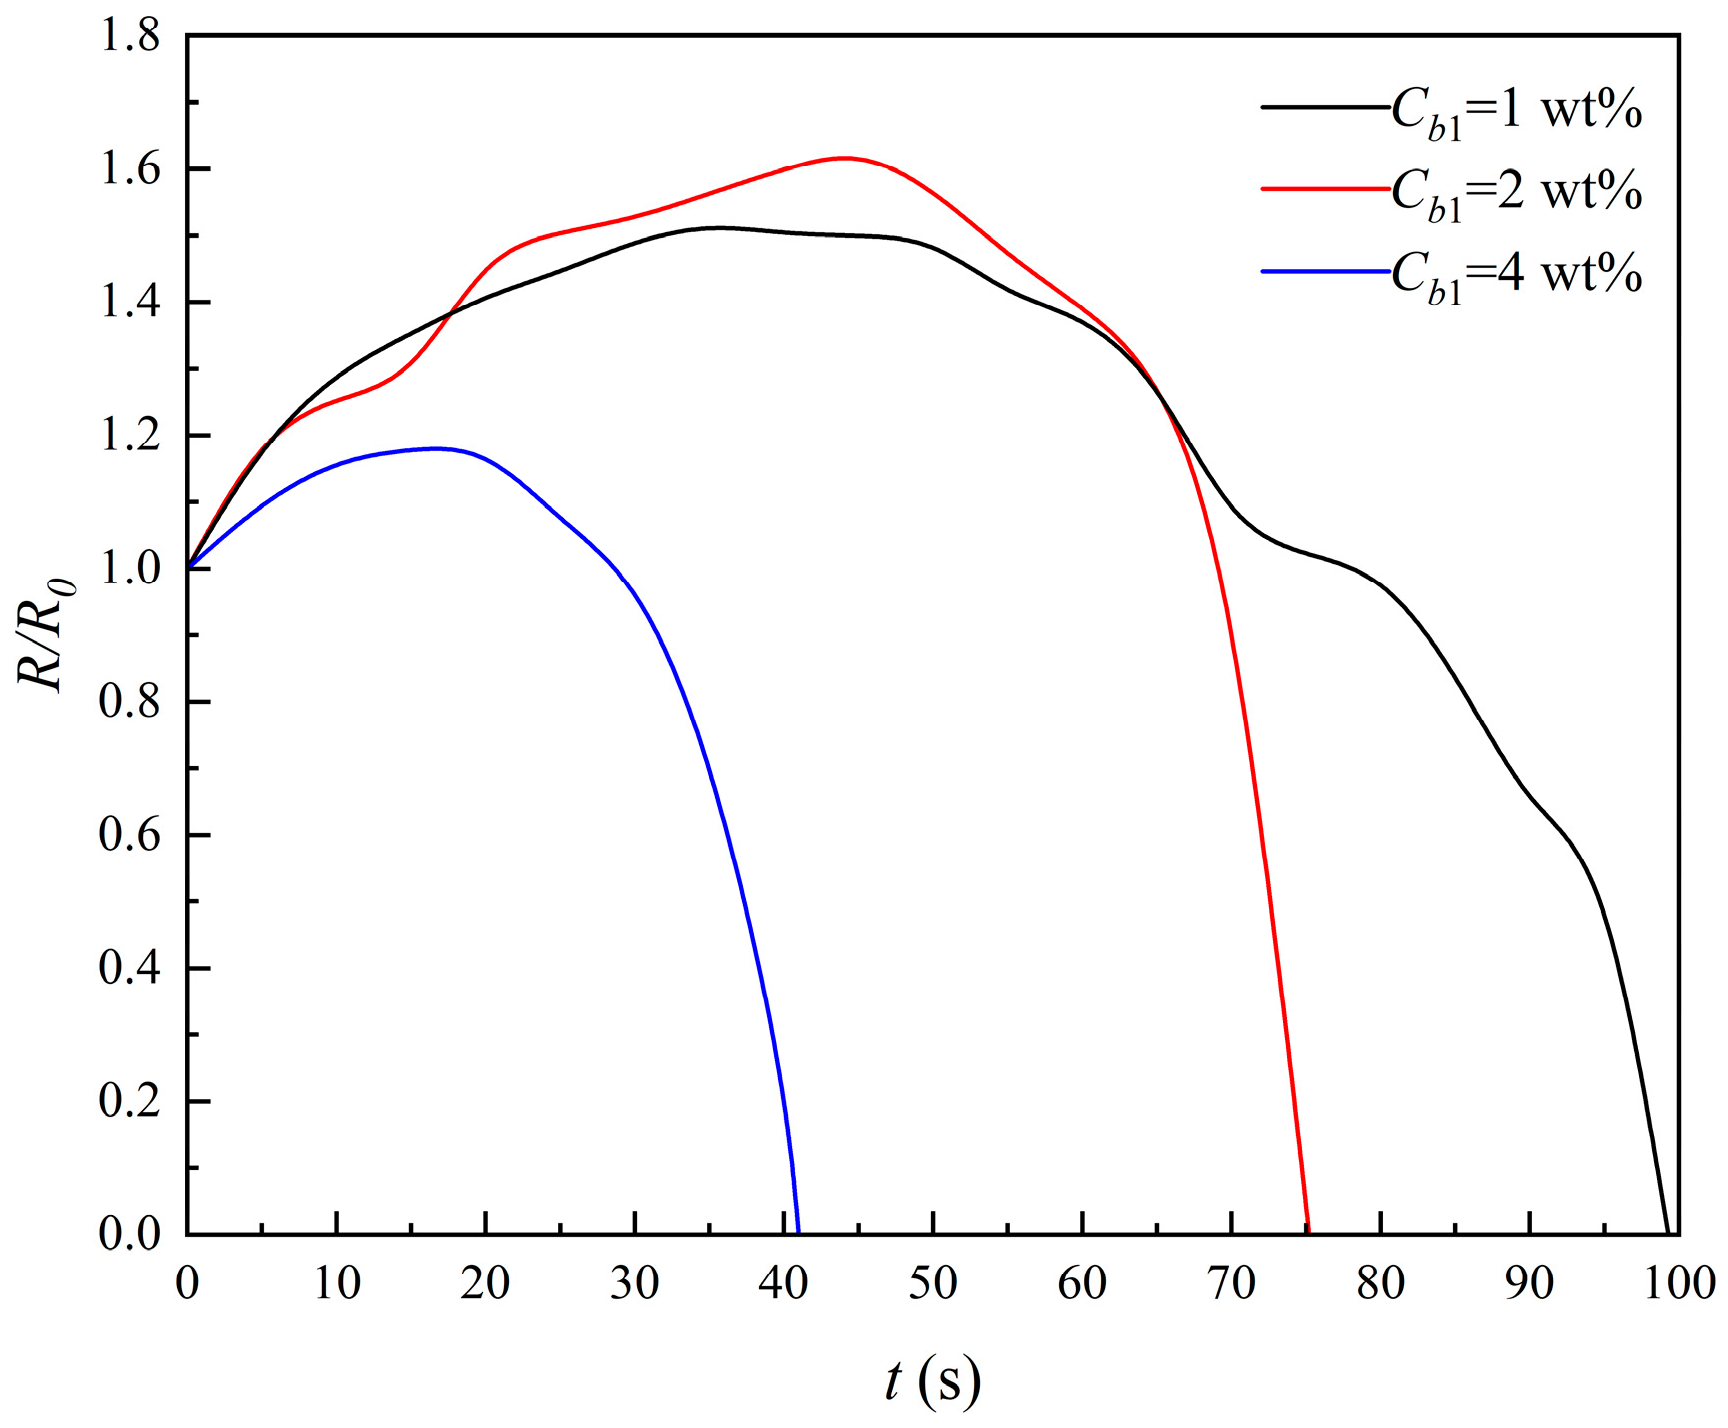
Figure 9 shows the variation in the characteristic length of the alloy with the immersion time of different bath carbon contents. As shown in Figure 8, with the increase in bath carbon content, the formation time of the solidification layer gradually decreases. The maximum thickness of the solidification layer is similar for bath chromium contents of 1 wt% and 2 wt%, but it significantly decreases at 4 wt%, leading to an overall reduction in maximum thickness of the solidification layer. The melting rate of the alloy gradually increases from 0.61 × 10⁻⁴ m/s to 1.13 × 10⁻⁴ m/s, while the complete melting time decreases from 99.3 s to 41 s. This is because the melting point of the solidification layer formed by the solidification of the melt decreases with increasing bath carbon content, reducing the heat required for its heating and melting. Additionally, once the solidification layer on the alloy surface is completely remelted, the carbon diffusion rate from the melt to the alloy surface increases, lowering the melting point of the alloy body and accelerating the melting rate. Additionally, once the solidification layer on the alloy surface is completely remelted, the carbon diffusion rate from the melt into the alloy surface increases, lowering the melting point of the alloy body and accelerating the melting rate.
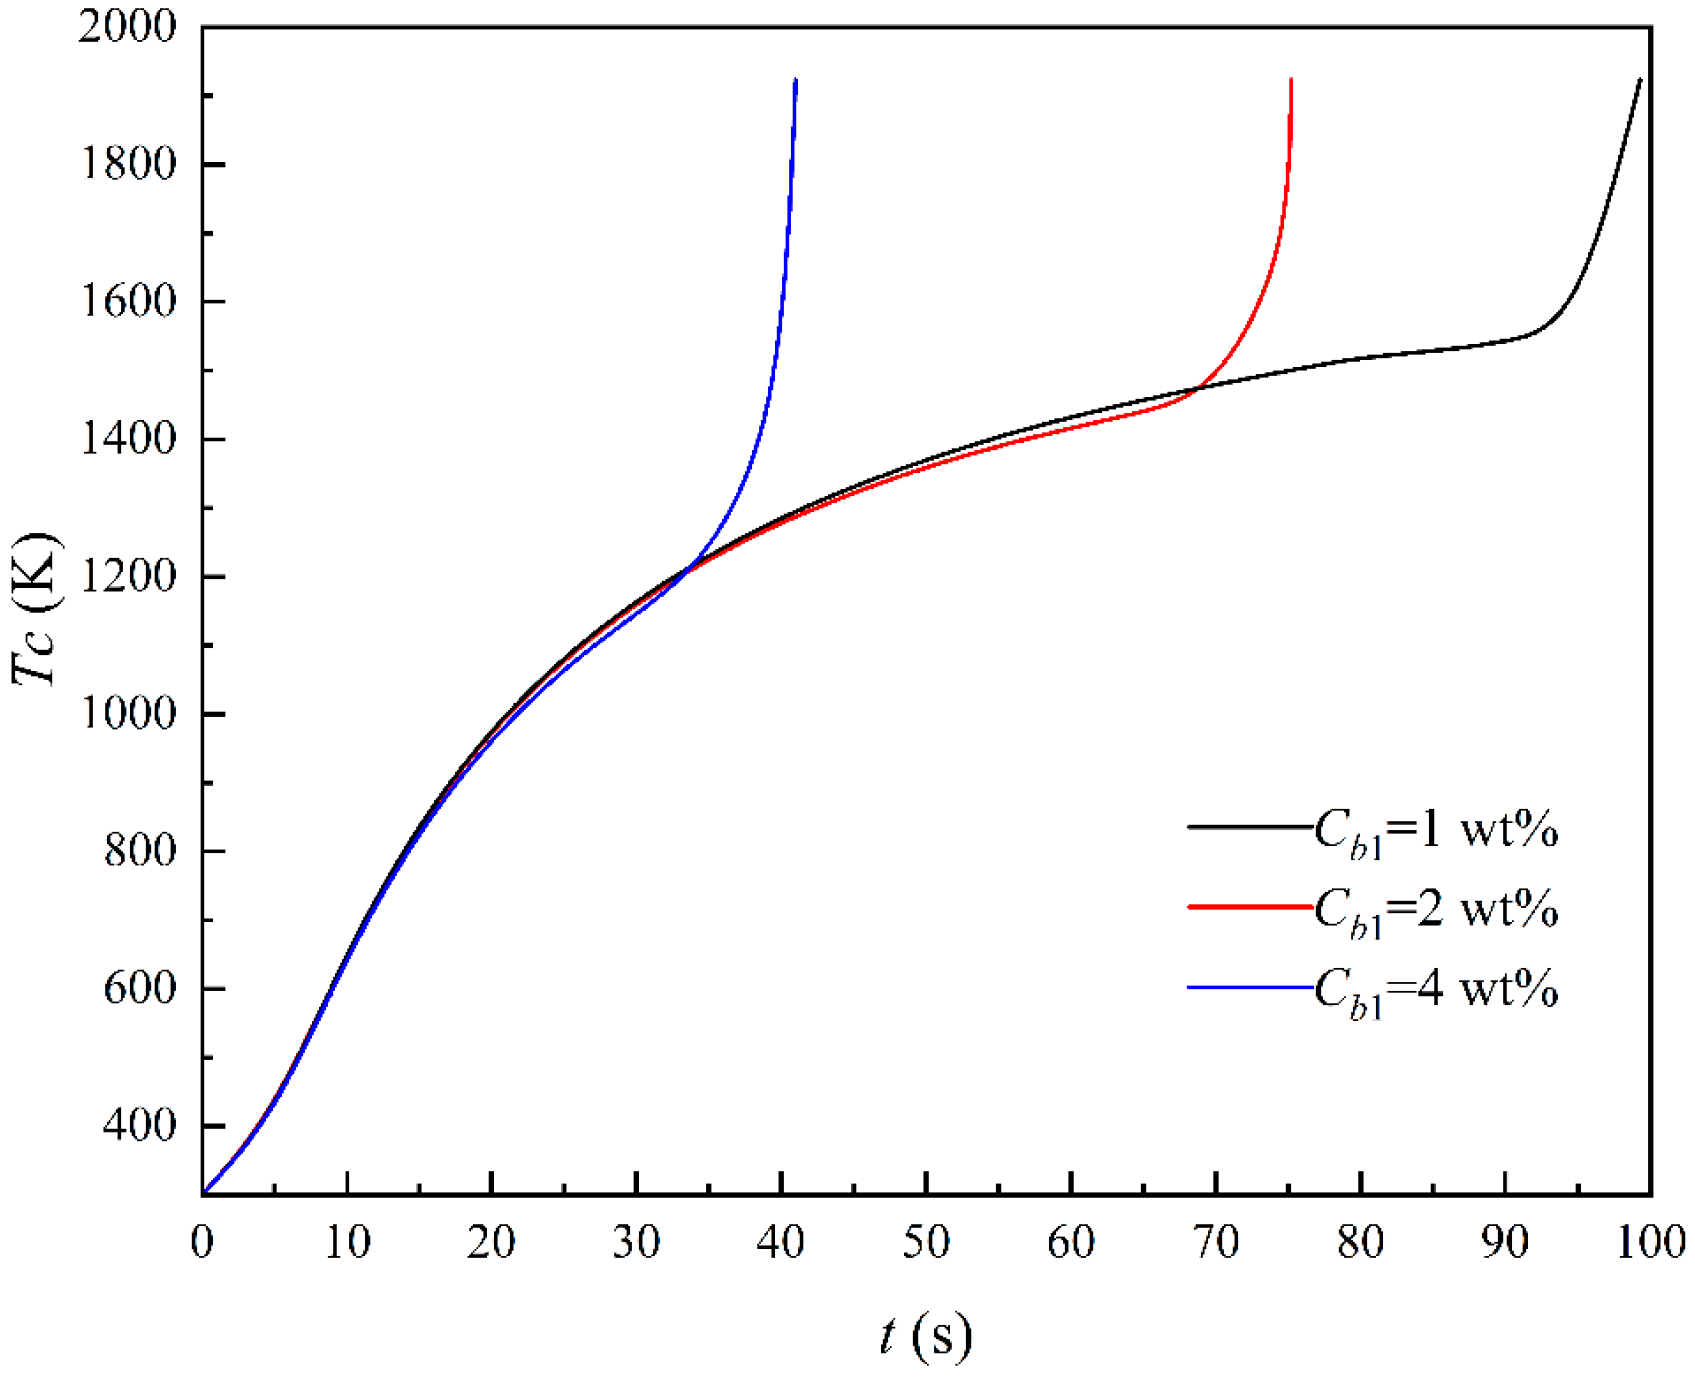
Figure 10 shows the variation in the alloy center temperature with the immersion time of different bath carbon contents. As shown in Figure 9, with the increase in bath carbon content, the remelting of the solidified layer mainly occurs in the first 35 s of the alloy melting process, and the heating rate at the center of the alloy remains relatively constant at approximately 26.5 K/s. Once the solidification layer is completely remelted, the heating rate at the alloy center increases significantly. This is because with the increase in bath carbon content, the carbon diffusion rate between the melt and the alloy also increases, leading to a reduction in the melting point of the alloy and an acceleration of the melting rate, increasing from 41.0 K/s to 116.4 K/s.

4.5. Effect of Alloy Chromium Content on Melting Behavior of Ferrochrome Alloy

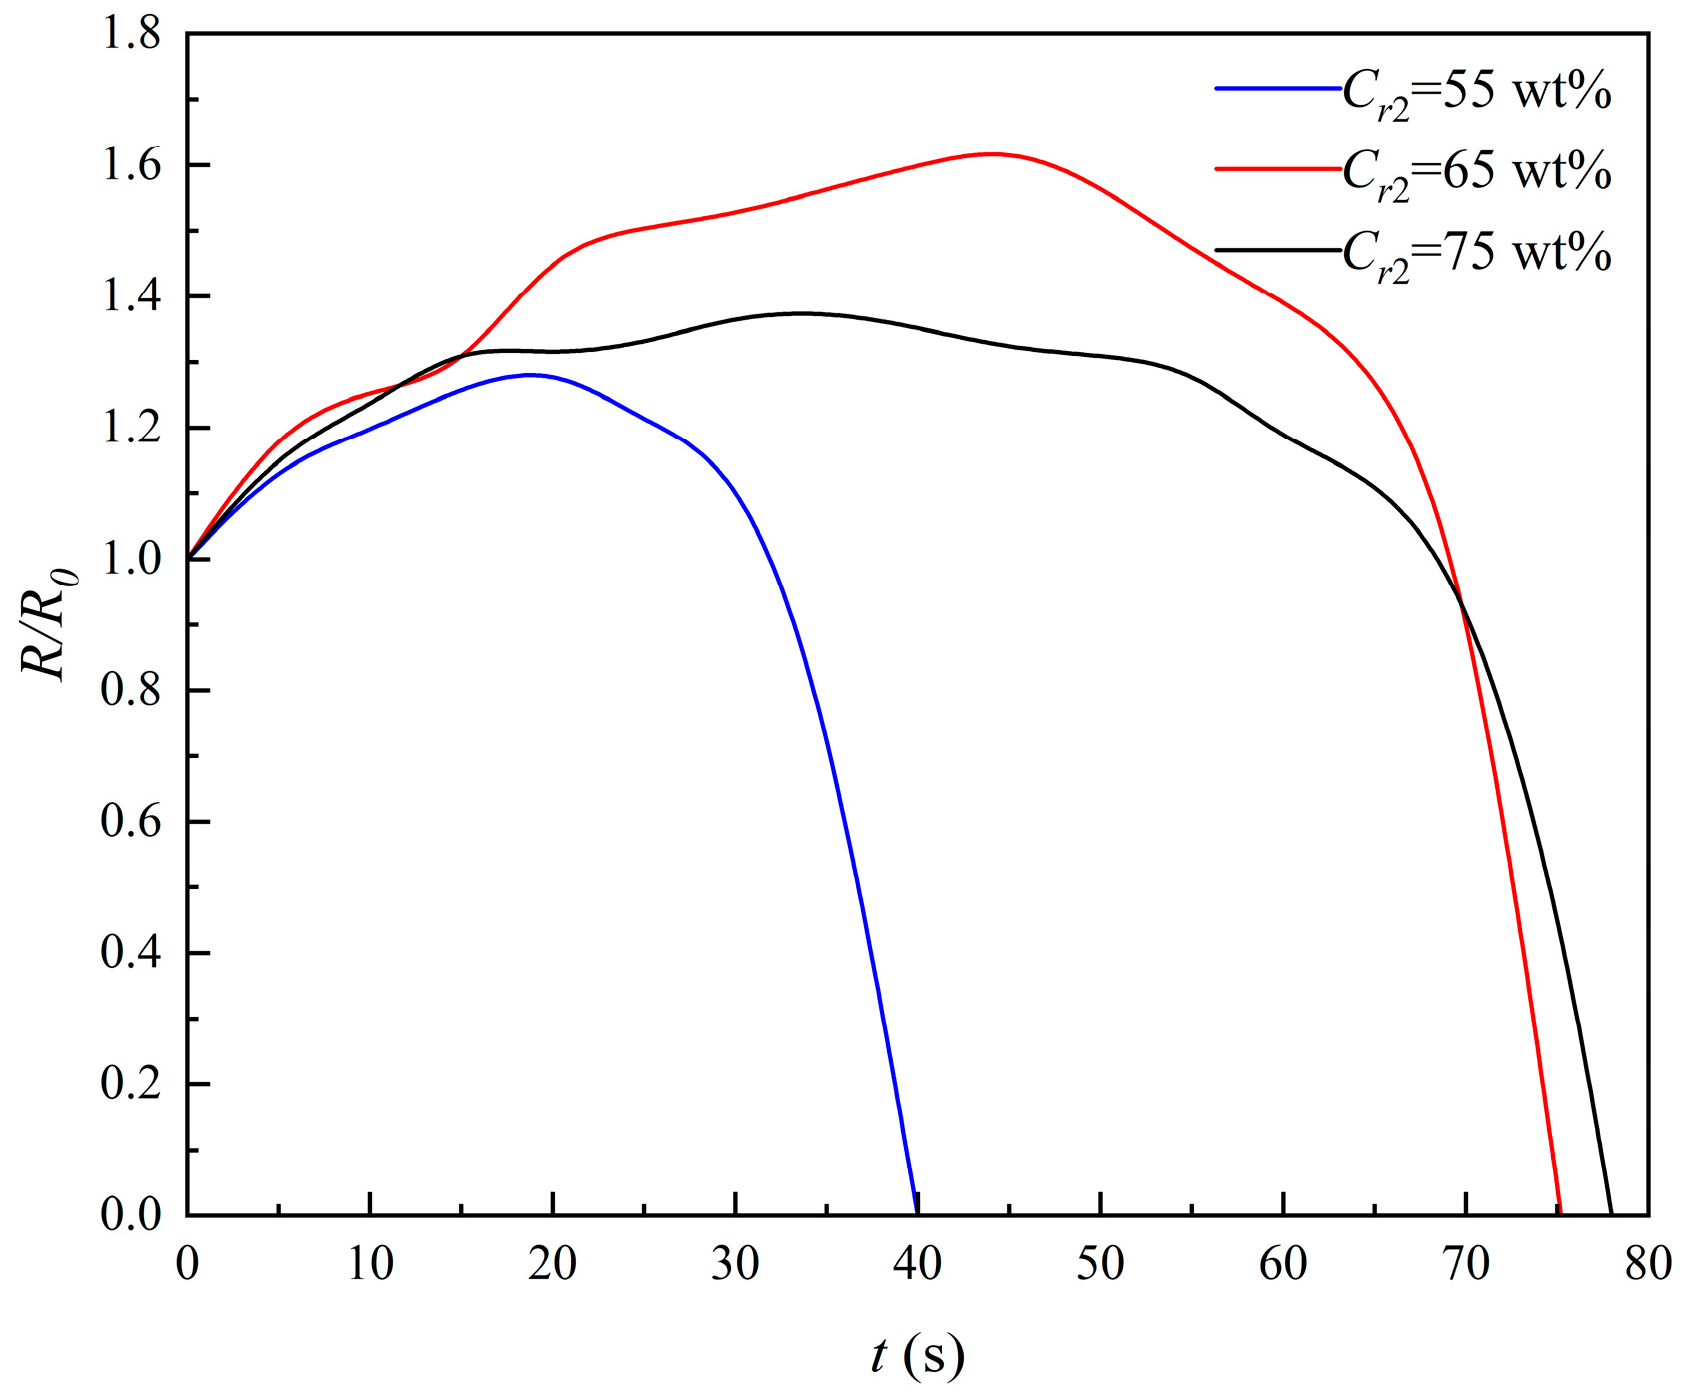
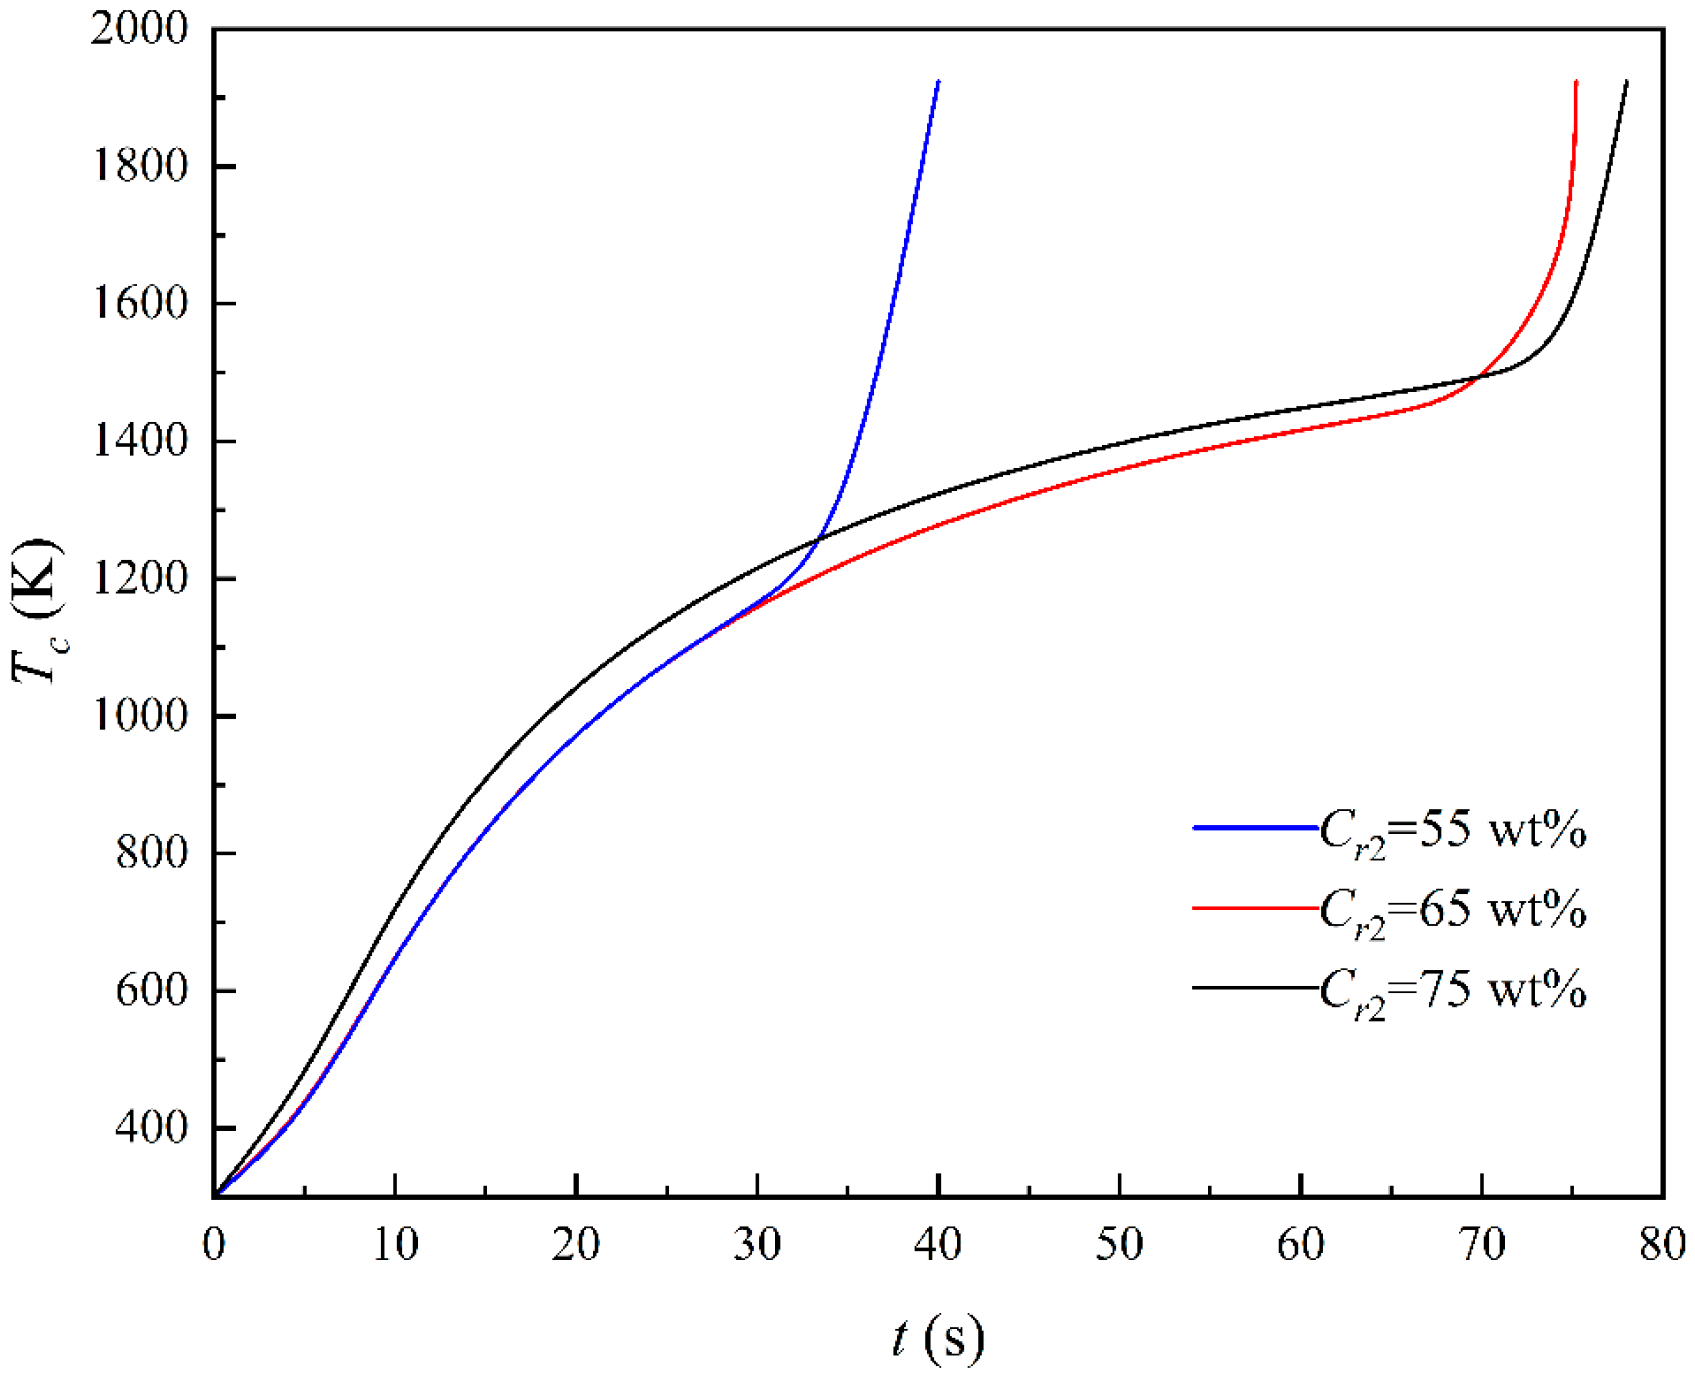
Figure 11 shows the variation in the alloy characteristic length with the immersion time of different alloy chromium contents. As the alloy chromium content increases, the formation time of the solidification layer increases, the maximum thickness initially increases and then decreases, and the melting rate of the alloy gradually slows down from 1.29 × 10⁻⁴ m/s to 0.71 × 10⁻⁴ m/s. Additionally, the complete melting time increases from 40 s to 78 s. This is because with the increase in chromium content, the melting point of the alloy rises, while the heat flow from the melt to the alloy decreases, leading to a slower remelting rate of the solidification layer. Once the solidification layer is completely remelted, the increase in chromium content reduces the rate of heat transfer from the melt to the alloy, resulting in a decreased melting rate and an extended time for complete melting.
Figure 12 shows the variation in the alloy center temperature with the immersion time of different alloy chromium contents. As shown in Figure 12, with the increase in immersion time, during the first 30 s of alloy melting, the primary occurrence is the remelting of the solidification layer, while the melting rate of the alloy remains basically unchanged, and the heating rate at the center of the alloy remains approximately 28.7 K/s. However, once the solidification layer is completely remelted, the increase in chromium content slows the heat transfer rate from the melt to the alloy, resulting in a decrease in the alloy’s melting rate from 76.04 K/s to 53.9 K/s.

4.6. Effect of Alloy Carbon Content on Melting Behavior of Ferrochrome Alloy

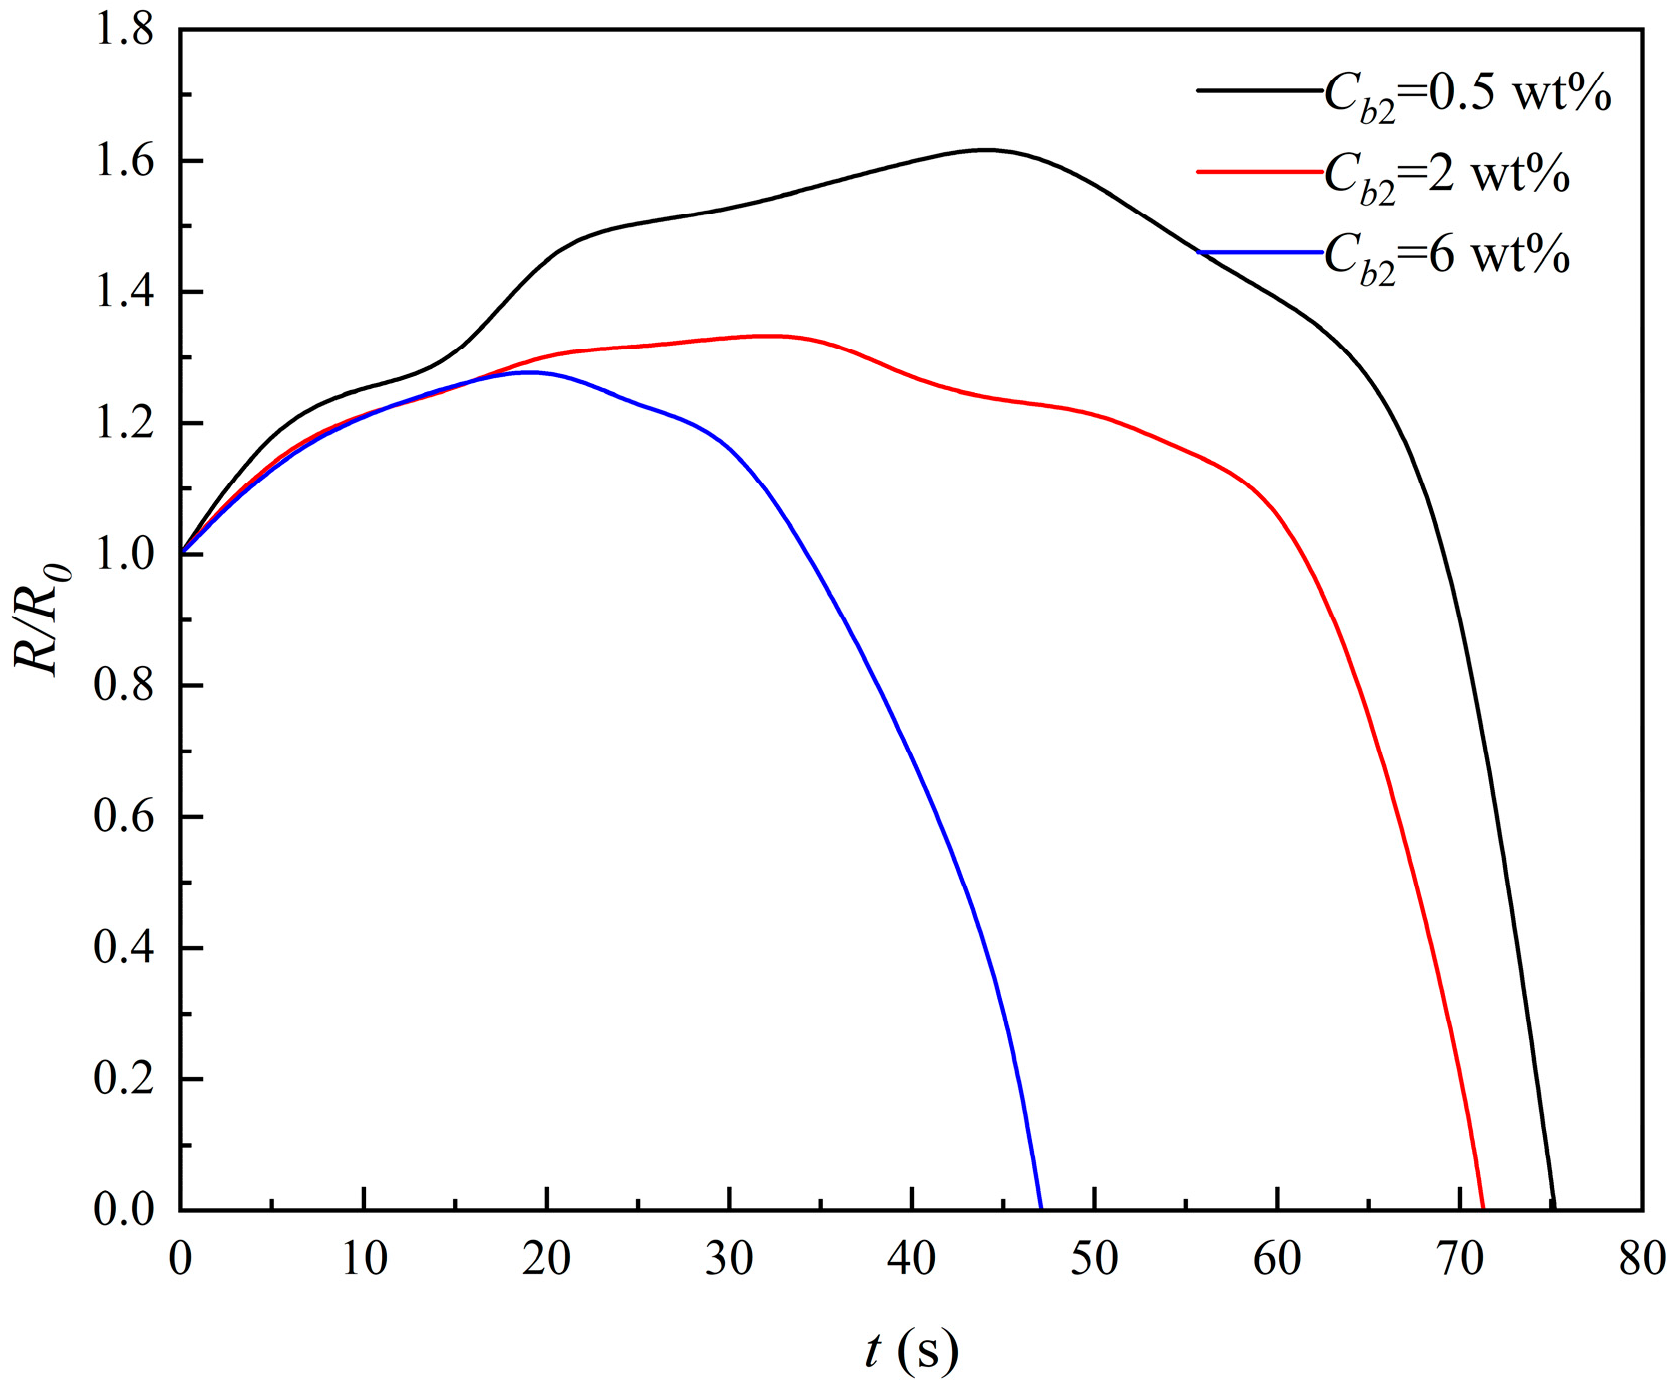
Figure 13 shows the variation in the alloy characteristic length with the immersion time of different alloy carbon contents. As the alloy carbon content increases, the formation time of the solidified layer gradually decreases, the remelting rate of the solidified layer increases, the maximum thickness gradually decreases, the melting rate of the alloy increases from 0.91 × 10⁻⁴ m/s to 1.97 × 10⁻⁴ m/s, and the complete melting time of the alloy decreases from 75.2 s to 47.1 s. This is because with the increase in alloy carbon content, the heat transferred from the bath to the alloy gradually increases, leading to a corresponding increase in the heat available for the remelting of the solidification layer. Additionally, once the solidification layer is completely remelted, the increase in alloy carbon content results in a lower melting point, which further increases the heat transferred from the bath to the alloy, thereby accelerating the melting rate of the alloy [21].
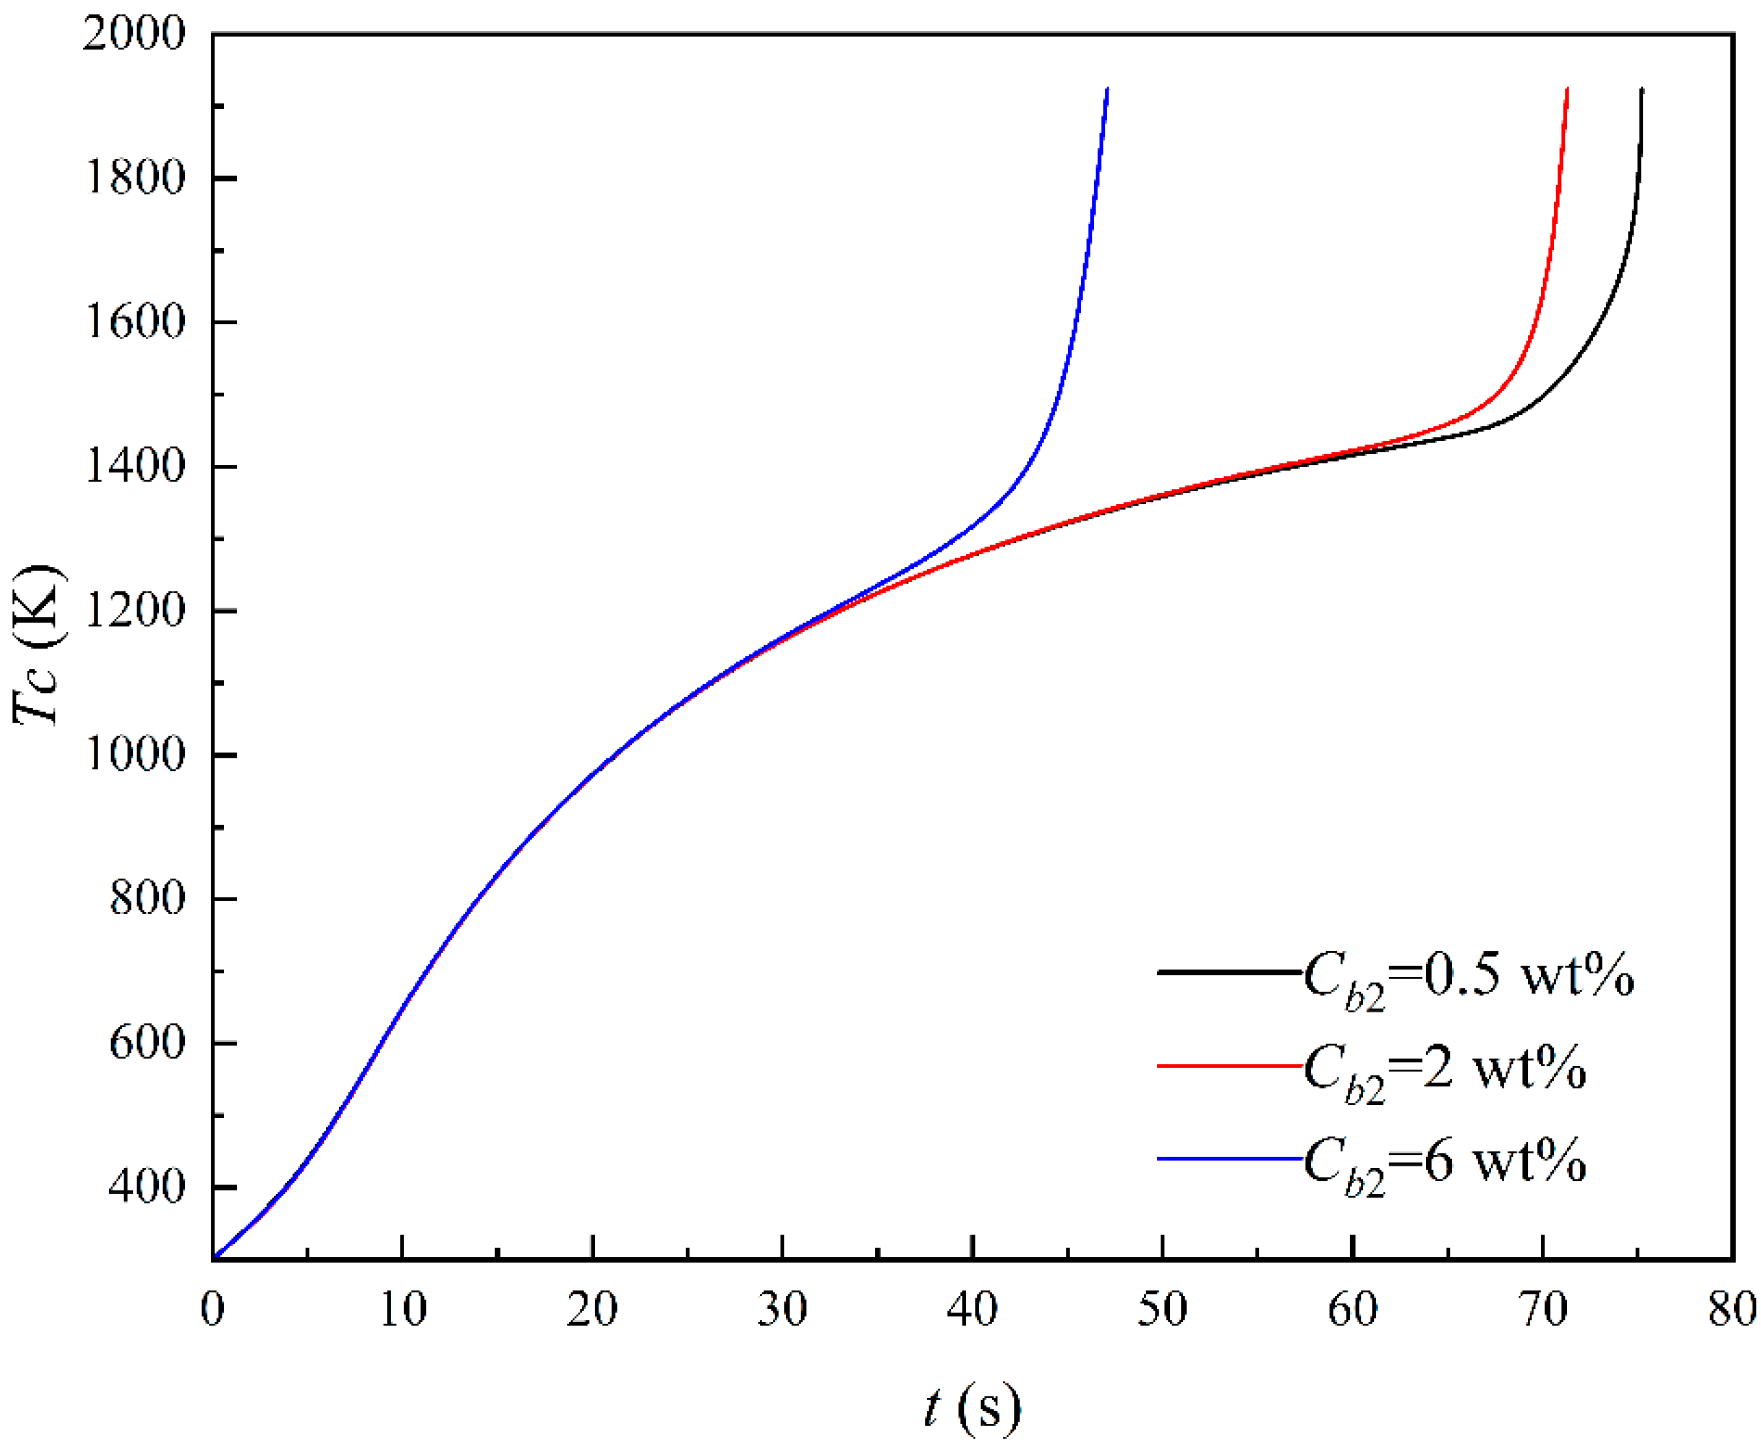
Figure 14 shows the variation in the alloy center temperature with the immersion time of different alloy carbon contents. As shown in Figure 14, when the alloy carbon content is 0.5 wt% and 2 wt%, the heating rate at the center of the alloy remains relatively constant at 25.2 K/s during the first 65 s of alloy melting. When the alloy carbon content is 6 wt%, the melting rate at the center of the alloy is 17.7 K/s in the first 40 s of alloy melting, which primarily involves the remelting of the solidification layer. After the solidification layer is completely remelted, the increase in alloy carbon content lowers the melting point of the alloy, resulting in an increase in the heating rate at the center of the alloy from 47.4 K/s to 86.6 K/s.

4.7. Effect of Alloy Size on Melting Behavior of Ferrochrome Alloy

Figure 15 shows the effect of different alloy sizes on the melting behavior of the ferrochrome alloy. As can be seen in the figure, with the increase in alloy size, the formation time of the solidification layer is gradually extended, and the maximum thickness of solidification layer increases, the heat required for melting the alloy rises, and the melting rate of the alloy decreases from 1.96 × 10⁻⁴ m/s to 0.47 × 10⁻⁴ m/s, while the complete melting time increases from 34 s to 165.8 s. This is because with the increase in alloy size, the temperature gradient of the alloy becomes larger, resulting in a higher amount of heat consumed when melting the alloy.
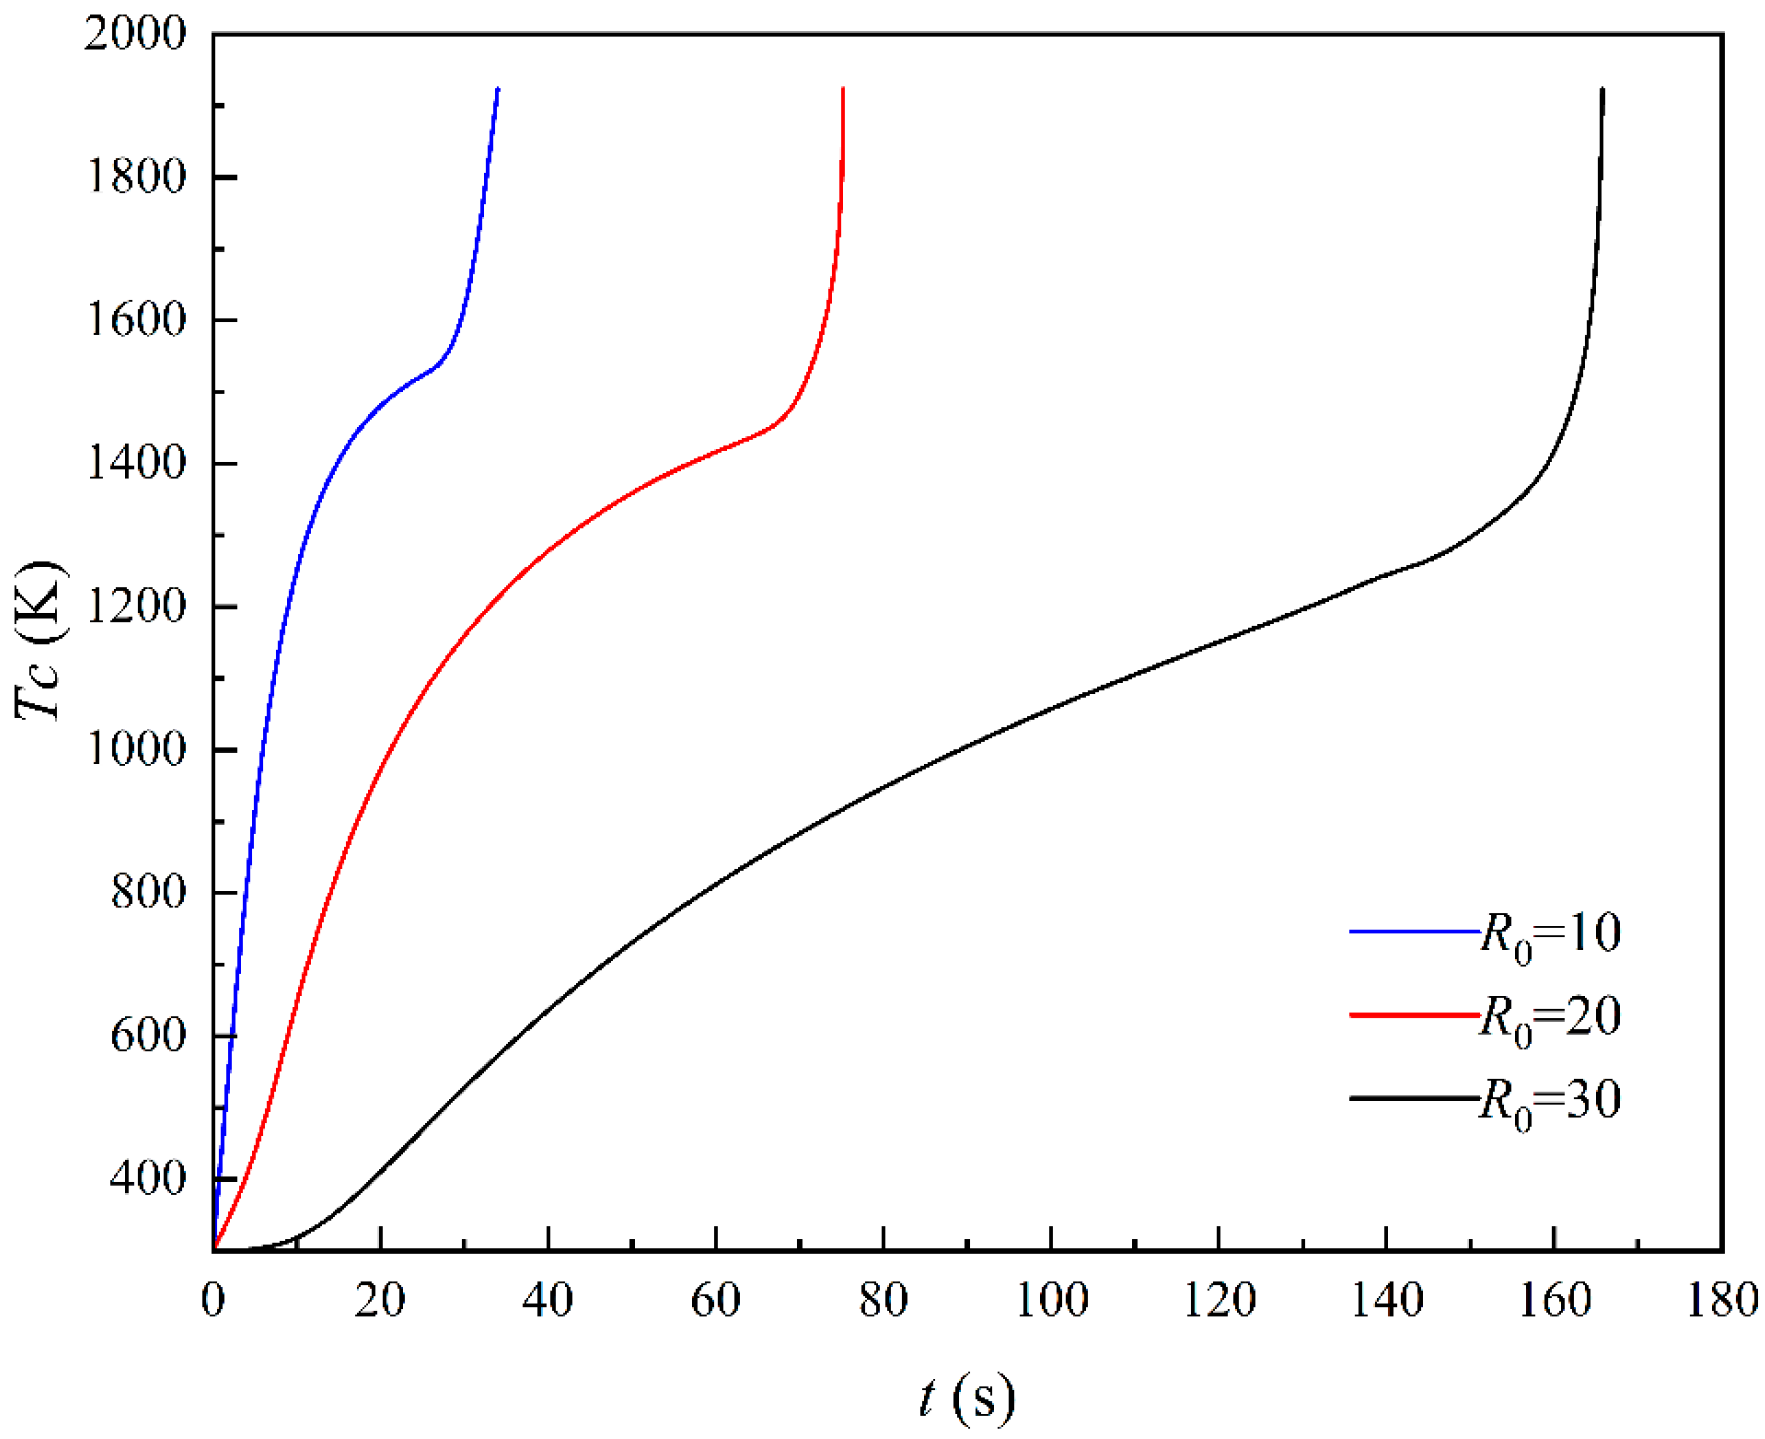
Figure 16 shows the variation in the alloy center temperature with the immersion time of different alloy sizes. As shown in the figure, with the decrease in alloy size, the heating rate at the center of the alloy gradually increases from 44.3 K/s to 90.6 K/s. This is because a smaller alloy size results in the less heat dissipation, making it easier for the alloy to be “heat penetrated”.

4.8. Effect of Alloy Preheating Temperature on Melting Behavior of Ferrochrome Alloy

Figure 17 shows the variation in the alloy size with the immersion time of different preheating temperatures. As shown in the figure, with the increase in preheating temperature, both the formation time and maximum thickness of the solidification layer decrease, the melting rate of the alloy accelerates from 0.91 × 10⁻⁴ m/s to 1.55 × 10⁻⁴ m/s, and the complete melting time decreases from 75.2 s to 18.1 s. This is because with the increase in preheating temperature, the temperature gradient at the surface of the alloy gradually decreases, the chilling effect weakens, and the heat required for heating and melting the solidification layer diminishes. Meanwhile, with the increase in preheating temperature, the reduced temperature gradient at the surface of the alloy decreases the heat dissipated for heating the alloy, while the heat for melting the alloy increases, leading to an acceleration in melting rate and a reduction in complete melting time.
Figure 18 shows the variation in the alloy center temperature with the immersion time of different preheating temperatures. As shown in the figure, with the increase in preheating temperature, the melting rate of the alloy remains relatively constant during the remelting of the solidification layer. After the solidification layer is completely melted, the melting rate at the center of the alloy increases to a certain value and then stabilizes. This is because with the increase in preheating temperature, the temperature gradient at the interface decreases, reducing the heat consumed for heating the alloy, which consequently increases the heating rate from 181.1 K/s to 230.2 K/s.

5. Conclusions

(1)
When the ferrochrome alloy is immersed in the molten bath, a solidified layer formed on the surface of the alloy, and as the immersion time increased, the thickness of the solidified layer initially grew and then decreased; subsequent to the complete melting of the solidified layer, the alloy body began to melt. The center temperature of the alloy remained the lowest throughout the melting process and raised with increasing immersion time.
(2)
With the bath temperature and bath carbon content increased, the formation time of the solidified layer on the surface of the alloy shortened, its maximum thickness decreased, the alloy’s melting rate accelerated from 0.49 × 10⁻⁴ m/s to 1.22 × 10⁻⁴ m/s, and the complete melting time decreased from 134.7 s to 41 s. Conversely, increasing the bath chromium content raised the melting point of the solidified layer, prolonged the time required for remelting, slowed the alloy’s melting rate from 2.47 × 10⁻⁴ m/s to 0.91 × 10⁻⁴ m/s, and increased the complete melting time from 67.6 s to 75.2 s.
(3)
With the alloy carbon content and preheating temperature increased, the alloy chromium content and size decreased, the formation time of the solidified layer shortened, its maximum thickness initially increased and then decreased, the melting rate of the alloy accelerated from 0.47 × 10⁻⁴ m/s to 1.97 × 10⁻⁴ m/s, and the complete melting time reduced from 165.8 s to 18.1 s.

Author Contributions

Conceptualization, M.L.; Methodology, M.L. and G.M.; Validation, D.Z.; Formal analysis, Y.H. and D.Z.; Data curation, Y.H. and X.Z.; Writing—original draft, Y.H. and M.L.; Writing—review and editing, M.L. and G.M.; Visualization, Y.H. and X.Z.; Supervision, G.M.; Funding acquisition, M.L. and G.M. All authors have read and agreed to the published version of the manuscript.

Funding

This work was financially supported by the Nature Science Foundation of Hubei Province, China (grant no. 2024AFB277); the Open Foundation of Key Laboratory for Ferrous Metallurgy and Resources Utilization of Ministry of Education, China (grant no. FMRUlab25-05); and Hubei Provincial Special Fund for Central-Guided Local S&T Development (grant no. 2025CSA017).

Data Availability Statement

The original contributions presented in this study are included in the article. Further inquiries can be directed to the corresponding authors.

Conflicts of Interest

The authors declare no conflict of interest.

References

  1. Li, Y.J.; Zhang, J.T. Current situation of chromite ore in China and recommendation on its sustainable supply. Met. Mine 2011, 10, 27–30. [Google Scholar]
  2. Chen, G.C. China FeCr production and development. Ferro-Alloys 2000, 31, 40–42. [Google Scholar]
  3. Panagiotis, G.S.; Stavros, A. Convective heat-transfer measurements in liquid metals under different fluid flow conditions. Metall. Trans. B 2007, 19, 859–870. [Google Scholar]
  4. Du Preez, S.P.; Van Kaam, T.P.; Ringdalen, E.; Tangstad, M.; Morita, K.; Bessarabov, D.G.; van Zyl, P.G.; Beukes, J.P. An overview of currently applied ferrochrome production processes and their waste management practices. Minerals 2023, 13, 809. [Google Scholar] [CrossRef]
  5. Li, X.H.; Zhou, Y.; Wang, X.L. Research on the melting properties of the chromium ore in molten steel. J. Anhui Univ. Technol. (Nat. Sci.) 2011, 28, 329–331, 334. [Google Scholar]
  6. Cui, H.J.; Chen, J.; Wang, D.B.; Liu, J.Y. Analysis of temperature distribution in coal-containing chromite fines during microwave heating. Acta Sci. Nat. Univ. Sunyatseni 2007, 46, 198–199. [Google Scholar]
  7. Penz, F.; Schenk, J. A review of steel scrap melting in molten iron-carbon melts. Steel Res. Int. 2019, 90, 1262–1281. [Google Scholar] [CrossRef]
  8. Rybdylova, O.; Al, Q.M.; Braun, M.; Crua, C.; Manin, J.; Pickett, L.; de Sercey, G.; Sazhina, E.; Sazhin, S.; Heikal, M. A model for droplet heating and its implementation into ANSYS Fluent. Int. Commun. Heat Mass Transf. 2016, 76, 265–270. [Google Scholar] [CrossRef]
  9. Huang, S.X. Formation and usage of differential momentum equation. Mech. Eng. 2022, 44, 390–392. [Google Scholar]
  10. Yuan, B.Q.; Qin, G.Q. Local existence of strong solutions to the k-ε model equations for turbulent flows. Bound. Value Probl. 2016, 2016, 27. [Google Scholar] [CrossRef][Green Version]
  11. Deng, S.; Xu, A.J.; Yang, G.; Wang, H. Analyses and calculation of steel scrap melting in a multifunctional hot metal ladle. Steel Res. Int. 2019, 90, 1800435. [Google Scholar] [CrossRef]
  12. Lou, W.T.; Zhu, M.Y. Numerical simulation of desulfurization behavior in gas-stirred systems based on computation fluid dynamics–simultaneous reaction model (CFD–SRM) coupled model. Metall. Mater. Trans. B 2014, 45, 1706–1722. [Google Scholar] [CrossRef]
  13. Lin, H.B.; Wu, D.J.; Peng, X.P. Heat treatment parameters simulation of low alloy wear resistant steel based on JMatPro software. Hot Work. Technol. 2015, 44, 76–78,82. [Google Scholar]
  14. Shukla, A.; Deo, B.; Robertson, D. Scrap dissolution in molten iron containing carbon for the case of coupled heat and mass transfer control. Metall. Mater. Trans. B 2013, 44, 1407–1427. [Google Scholar] [CrossRef]
  15. Fang, Q.; Ni, H.W.; Zhang, H.; Wang, B.; Liu, C. Numerical study on solidification behavior and structure of continuously cast U71Mn steel. Metals 2017, 7, 483. [Google Scholar] [CrossRef]
  16. Li, J.; Brooks, G.; Provatas, N. Kinetics of scrap melting in liquid steel. Metall. Mater. Trans. B 2005, 36, 293–302. [Google Scholar] [CrossRef]
  17. Yang, X.Y.; Li, Y.; Zhao, S.L.; Zhang, Q. Application of fluent for heat transfer analysis. Ind. Heat. 2018, 47, 1–4. [Google Scholar]
  18. Xi, X.J.; Yang, S.F.; Li, J.; Chen, X.; Ye, M. Thermal simulation experiments on scrap melting in liquid steel. Ironmak. Steelmak. 2020, 47, 442–448. [Google Scholar] [CrossRef]
  19. Liu, M.K.; Zheng, D.L.; Ma, G.J.; Fang, Q.; Lv, R.; Gu, H.; Zhang, X. Cold model experiment to simulate the melting process of recycled steel for a converter using ice water mixture. Steel Res. Int. 2025, 96, 2300845. [Google Scholar] [CrossRef]
  20. Liu, M.K.; Ma, G.J.; Zhang, X.; Zheng, D. Numerical simulation on the melting kinetics of steel scrap in iron-carbon bath. Case Stud. Therm. Eng. 2022, 34, 101995. [Google Scholar] [CrossRef]
  21. Xi, X.J.; Li, S.Y.; Yang, S.F.; Zhao, M.; Li, J. Melting characteristics of steel scrap with different carbon contents in liquid steel. Ironmak. Steelmak. 2020, 47, 1087–1098. [Google Scholar] [CrossRef]
Figure 1. China’s stainless steel production and consumption from 2014 to 2023.
Metals 16 00158 g001
Figure 2. The temperature field distribution in the melting of the alloy. (Tb = 1923 K, Cr1 = 10 wt%, Cb1 = 2 wt%, Cr2 = 65%, Cb2 = 0.5 wt%, R0 = 20 mm, Ty = 300 K).
Metals 16 00158 g002
Figure 3. The variation in the liquid phase fraction in the melting of the alloy. (Tb = 1923 K, Cr1 = 10 wt%, Cb1 = 2 wt%, Cr2 = 65%, Cb2 = 0.5 wt%, R0 = 20 mm, Ty = 300 K).
Metals 16 00158 g003
Figure 4. Variation in alloy characteristic length and center temperature with immersion time.
Metals 16 00158 g004
Figure 5. Variation in alloy characteristic lengths with immersion time of different bath temperatures.
Metals 16 00158 g005
Figure 6. Variation in alloy center temperature with immersion time of different bath temperatures.
Metals 16 00158 g006
Figure 7. The variation in the alloy characteristic length with the immersion time of different bath chromium contents.
Metals 16 00158 g007
Figure 8. Variation in alloy center temperature with immersion time of different bath chromium contents.
Metals 16 00158 g008
Figure 9. Variation in alloy characteristic lengths with immersion time of different bath carbon contents.
Metals 16 00158 g009
Figure 10. Variation in alloy center temperature with immersion time of different bath carbon contents.
Metals 16 00158 g010
Figure 11. Variation in alloy characteristic lengths with immersion time of different alloy chromium contents.
Metals 16 00158 g011
Figure 12. Variation in alloy center temperature with immersion time of different alloy chromium contents.
Metals 16 00158 g012
Figure 13. Variation in alloy characteristic lengths with immersion time of different alloy carbon contents.
Metals 16 00158 g013
Figure 14. Variation in alloy center temperature with immersion time of different alloy carbon contents.
Metals 16 00158 g014
Figure 15. Variation in melting rate with immersion time of different alloy sizes.
Metals 16 00158 g015
Figure 16. Variation in alloy center temperature with immersion time of different alloy sizes.
Metals 16 00158 g016
Figure 17. Variation in alloy characteristic lengths with immersion time of different alloy preheating temperatures.
Metals 16 00158 g017
Figure 18. Variation in alloy center temperature with immersion time of different alloy preheating temperatures.
Metals 16 00158 g018
Table 1. Latent heat of fusion, solidus, and liquidus temperatures for different baths and alloys.
BaseComposition
(wt%)
Latent Heat of Fusion
(J/kg)
Solidus Temperatures
(K)
Liquidus Temperatures
(K)
Bath0Cr-2C-98Fe359,2501433.221657.39
5Cr-2C-93Fe329,0201464.151658.38
10Cr-1C-89Fe284,6401608.821715.95
10Cr-2C-88Fe301,2001517.091653
10Cr-4C-86Fe264,1901453.051495.29
Alloy55Cr-0.5C-44.5Fe413,8201618.221871.36
65Cr-0.5C-34.5Fe484,7301650.311943
65Cr-2C-33Fe437,17016331768.26
65Cr-6C-29Fe825,83015731830.03
75Cr-0.5C-24.5Fe505,48016932013.22
Table 2. Density, thermal conductivity, viscosity, specific heat capacity, and enthalpy of different molten bath and alloys.
BaseComposition
(wt%)
Density
(g/cm3)
Thermal Conductivity
(W/(m·K))
Viscosity
(mPa·s)
Specific Heat Capacity
(J/(g·K))
Enthalpy
(J/g)
Bath0Cr-2C-98Fe7.3530.914.740.83776.49
5Cr-2C-93Fe7.3532.034.700.84748.25
10Cr-1C-89Fe7.3637.485.080.87704.11
10Cr-2C-88Fe7.3334.174.650.92729.31
10Cr-4C-86Fe7.2527.743.820.85793.27
Alloy55Cr-0.5C-44.5Fe7.1429.785.540.80755.04
65Cr-0.5C-34.5Fe7.1133.185.270.89715.88
65Cr-2C-33Fe6.9931.034.700.95702.02
65Cr-6C-29Fe6.8031.553.291.13621.26
75Cr-0.5C-24.5Fe7.0535.364.960.86693.24
Table 3. Material properties.
Composition
(wt%)
Density
(g/cm3)
Thermal Conductivity
(W/(m·K))
Viscosity
(mPa·s)
Specific Heat Capacity
(J/(g·K))
Enthalpy
(J/g)
10Cr–1C–89Fe (Bath)7.77–3.19 × 10⁻⁴ T,
298 K < T < 1075.82 K;
8.04–5.72 × 10⁻⁴ T,
1075.82 K < T < 1608.82 K;
−1.56 × 10⁻¹³ × exp(x/51.14) + 7.32
8.18–7.88 × 10⁻⁴ T,
1608.82 K < T < 1873 K
exp(3.62 + 4.55 × 10⁻⁴ T–1.20 × 10⁻⁶ T2),
298 K < T < 613 K;
45.47–0.02 T,
613 K < T < 1073.15 K;
17.64 + 0.01 T,
1073.15 K < T < 1633 K;
exp(−8.97 + 0.02 T–6.4 T2),
1633 K < T < 1713 K;
9.01 + 0.02 T,
1713 K < T < 1873 K
7.27 × 10⁵ × exp(−x/113.40) + 4.65,
T > Tliq
0.43 + 5.03 × 10⁻⁴ T,
298 K < T < 873 K;
−0.21 + 0.005 T,
873 K < T < 1083 K;
0.48 + 3.08 × 10⁻⁴ T,
1083 K < T < 1463 K;
0.45 + 1.86 × 10⁻⁴ T,
1463 K < T < 1613 K;
5.33 × 10⁻¹⁸ × exp(−x/34.83) + 1.03,
1613 K < T < 1713 K;
0.38 + 2.96 × 10⁻⁴ T,
1713 K < T < 1873 K
69.19 + 0.66 T,
298 K < T < 1073 K;
−72.36 + 0.77 T,
1073 K < T < 1608.82 K;
9.75 × 10⁻⁹ × exp(x/59.49) + 899.73,
1608.82 K < T < 1715.97 K;
35.13 + 0.83 T,
1715.97 K < T < 1873 K
65Cr–2C–33Fe (Alloy)7.35–2.74 × 10⁻⁴ T,
298 K < T < 1656.39 K;
6.06 × exp(−x/71.08) + 6.62,
656.39 K < T < 1873 K
20.09 + 0.01T,
298 K < T < 1633 K;
exp(2.38 + 0.002 T–6.66 × 10⁻⁷ T2),
1633 K < T < 1768.26 K
23.57 + 0.007 T,
1768.26 K < T < 1873 K
4.24 × exp(−x/29.84) + 4.89,
T > Tliq
0.53 + 1.84 × 10⁻⁴ T,
298 K < T < 1623 K;
−5.10 + 0.005 T,
1623 K < T < 1763 K;
0.49 + 2.51 × 10⁻⁴ T,
1763 K < T < 1873 K
−50.86 + 0.66 T,
298 K < T < 1631.39 K;
−1.591.84 × 10−4 + 12.41 T,
1631.39 K < T < 1655.8 K;
−392.73 + 1.15 T,
1655.8 K < T < 1873 K
Table 4. Experimental parameters in numerical simulation.
Simulation SequenceBath Temperature/KBath Chromium Content/wt%Bath Carbon Content/wt%Alloy Chromium Content/wt%Alloy Carbon Content/wt%Alloy Size/mmAlloy Preheating Temperature/K
11923102650.520300
21873102650.520300
31973102650.520300
4192302650.520300
5192352650.520300
61923102550.520300
71923102750.520300
81923102650.510300
91923102650.530300
101923102650.520673
111923102650.5201073
121923101650.520300
131923104650.520300
14192310265220300
15192310265620300
Disclaimer/Publisher’s Note: The statements, opinions and data contained in all publications are solely those of the individual author(s) and contributor(s) and not of MDPI and/or the editor(s). MDPI and/or the editor(s) disclaim responsibility for any injury to people or property resulting from any ideas, methods, instructions or products referred to in the content.