1. Introduction
Metal matrix composites (MMCs) are advanced engineering materials formed by incorporating a ceramic-based reinforcement phase into a ductile metal matrix, thereby exhibiting superior properties such as high stiffness, strength, and wear resistance [
1,
2,
3,
4]. The synergistic interaction between the matrix and reinforcement phases enables MMCs to demonstrate higher specific mechanical and functional performance compared to monolithic metals. Among these composite systems, aluminum metal matrix composites (AMMCs) have found widespread application particularly in the automotive, aerospace, and marine industries due to aluminum’s low density, high specific strength, good corrosion resistance, and excellent manufacturability [
5,
6]. However, the low hardness and insufficient wear resistance of monolithic aluminum alloys constitute a significant limitation in applications involving friction, contact loads, and abrasive environments. To overcome these disadvantages, ceramic reinforcement phases with high hardness and elastic modulus, such as SiC, Al
2O
3, TiC, TiB
2, and ZrB
2, have been incorporated into the aluminum matrix, resulting in notable improvements in mechanical and tribological properties. Consequently, AMMCs have been increasingly employed in wear-critical applications such as engine components, brake disks, cylinder liners, and sliding mechanical parts [
5,
6,
7].
Nevertheless, the improvements achieved by increasing the ceramic reinforcement content often lead to a reduction in properties such as ductility, fracture toughness, and impact resistance, thereby causing embrittlement of the composite material. In homogeneously structured AMMCs, this trade-off between surface durability and bulk toughness complicates the design of engineering components that are subjected to different loading conditions in different regions. This situation has highlighted the need for new approaches in which material properties can be controllably tailored as a function of position [
5,
7,
8]. In conventional aluminum matrix composites, the reinforcement phase is typically distributed uniformly throughout the material volume [
1,
4]. While such homogeneous reinforcement improves hardness and wear resistance, it often leads to reduced ductility and fracture toughness due to the absence of property gradation. Previous studies have reported that this limitation becomes particularly critical under tribological loading conditions, where stress localization may promote brittle failure in uniformly reinforced aluminum matrix composites [
5].
In this context, functionally graded composite materials (FGCMs) have emerged as advanced materials in which the composition and microstructure are gradually varied along a specific direction, thereby providing location-dependent mechanical and tribological properties [
6,
9,
10]. In aluminum-based FGCMs, the reinforcement content is generally designed to increase from the inner region toward the outer surface, ensuring high hardness and wear resistance at the surface while maintaining ductility and toughness in the core region. This graded structure enables the integration of conflicting properties within a single component, offering significant advantages in terms of service life and performance [
11,
12]. Within this context, functionally graded composite structures offer distinct functional advantages in applications where surface performance is critical, while maintaining structural strength and toughness in the inner regions. Moreover, such graded architectures present significant engineering potential by reducing the brittleness and risk of sudden catastrophic failure that are commonly encountered in homogeneous composite systems, as reported in studies on functionally graded aluminum matrix composites produced by centrifugal casting [
5,
12,
13,
14].
Wear is one of the most critical damage mechanisms limiting the service life of engineering components, and it has been reported that approximately 70–75% of machine failures are associated with surface-related wear [
15]. Therefore, the development of materials with high wear resistance has become a critical requirement, particularly for moving and contact-based systems. Aluminum matrix FGCMs provide an effective solution to this requirement by enhancing surface tribological properties while preserving the mechanical integrity of the internal structure [
16].
Various fabrication methods, including powder metallurgy, plasma spraying, liquid metal infiltration, and centrifugal casting, have been employed in the production of FGCMs. Among these methods, centrifugal casting stands out due to its advantages in terms of manufacturing simplicity, low cost, and industrial scalability. During centrifugal casting, the centrifugal force enables controlled redistribution of reinforcement particles within the molten metal depending on their density and size, allowing the formation of a natural compositional gradient [
16,
17].
Ceramic reinforcements can be introduced into molten aluminum either by external addition (ex situ) or by direct synthesis within the melt through chemical reactions (in situ). While ex situ methods suffer from disadvantages such as poor wettability, particle agglomeration, and weak interfacial bonding, in situ synthesis methods provide fine-grained, homogeneously distributed, and thermodynamically stable reinforcement phases with strong matrix–reinforcement interfaces. These characteristics make in situ methods more attractive for the production of high-performance aluminum matrix composites [
18,
19,
20,
21,
22]. Ceramic reinforcements such as SiC, Al
2O
3, B
4C, TiB
2, and ZrB
2 are commonly used to improve the hardness and wear resistance of aluminum matrix composites, as widely reported in studies on functionally graded materials and aluminum-based metal matrix composites. In functionally graded aluminum matrix composites, the reinforcement content typically varies along the thickness or radial direction and is generally reported in the range of 5–20 wt. %, depending on the targeted properties and fabrication route [
12,
18]. Among these reinforcements, ZrB
2 is particularly attractive due to its high hardness, thermal stability, and strong interfacial bonding with aluminum, especially when synthesized via in situ methods, which promote fine particle size and homogeneous distribution. Numerous studies in the literature have reported significant improvements in hardness, mechanical strength, and wear resistance of ZrB
2-reinforced aluminum composites [
20,
21,
22,
23].
Functionally graded composite structures enable the spatial tailoring of mechanical and tribological properties within a single material, allowing conflicting engineering requirements to be satisfied simultaneously in a single component. In this design approach, regions requiring high hardness and wear resistance can be integrated with zones where ductility and damage tolerance are dominant, while preserving overall material integrity [
24,
25,
26]. Although Al–ZrB
2-based aluminum matrix composites have been widely investigated in the literature, the majority of these studies have primarily focused on homogeneous composite systems. In the present study, the ZrB
2 reinforcement phase was synthesized in situ within the aluminum matrix and a functionally graded structure was achieved through centrifugal casting [
18,
19,
20,
21,
22].
Despite these advantages, studies that systematically address both the fabrication processes and wear behavior of in situ synthesized ZrB
2-reinforced functionally graded aluminum matrix composites remain limited in the literature [
19,
22]. In particular, comprehensive investigations focusing on the optimization of parameters affecting wear performance in such composites produced by centrifugal casting are still scarce. In this context, the present study aims to provide a holistic and systematic evaluation of the fabrication and wear behavior of functionally graded Al/ZrB
2 composites by simultaneously considering multiple wear parameters, including applied load, sliding speed, sliding distance, and reinforcement gradient [
12,
27,
28,
29].
2. Materials and Methods
In this study, Al/ZrB2 functional graded composite materials (FGCMs) were produced using a two-step process. At first, ZrB2 particles were synthesized in a liquid aluminum matrix using an in situ method; in the second step, FGCM with the desired structure was produced using the centrifugal casting technique.
For the synthesis of ZrB
2 particles, 200 g of Al-Zr alloy, 60 g of Al-B alloy, and 500 g of pure aluminum, with the chemical composition given in
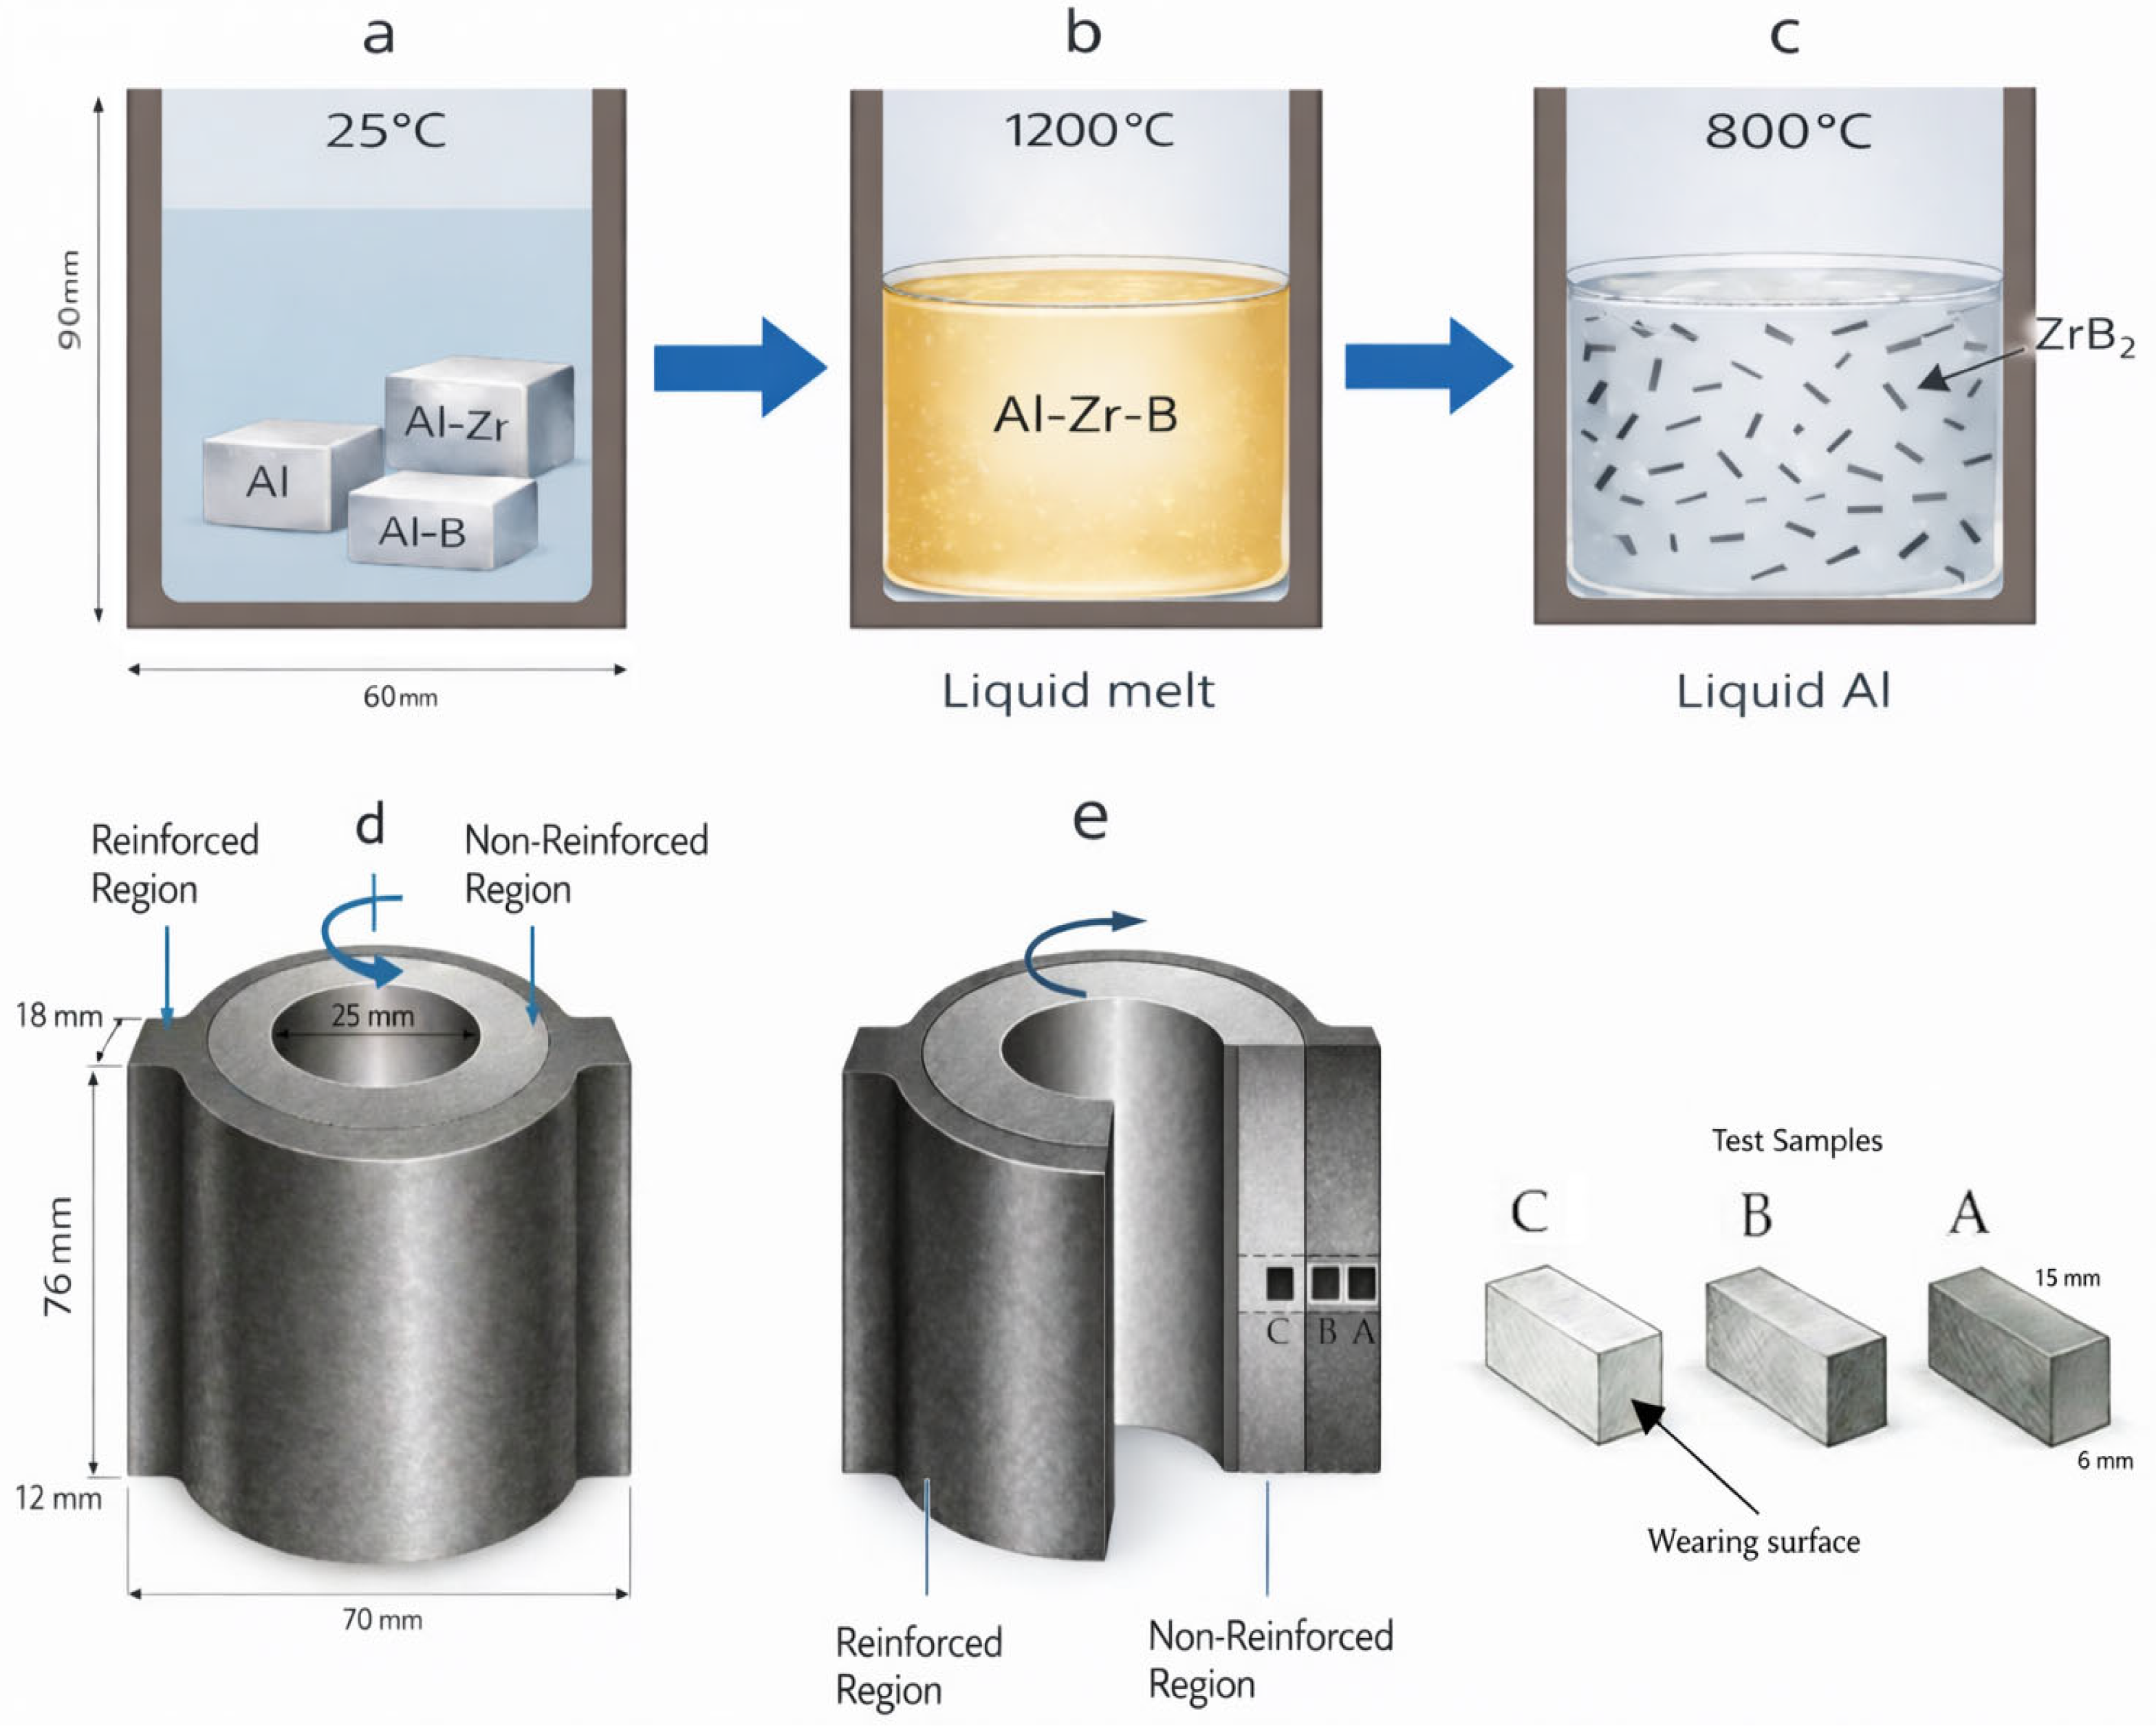
Table 1, were placed in a graphite crucible and melt down in an induction furnace at 1200 °C. As a result of this process, an Al-Zr-B alloy containing approximately 3% Zr and 1.3% B was obtained (
Figure 1a,b). The melt was cooled to 800 °C to facilitate the in situ formation of ZrB
2 particles and held at this temperature for 2 h (
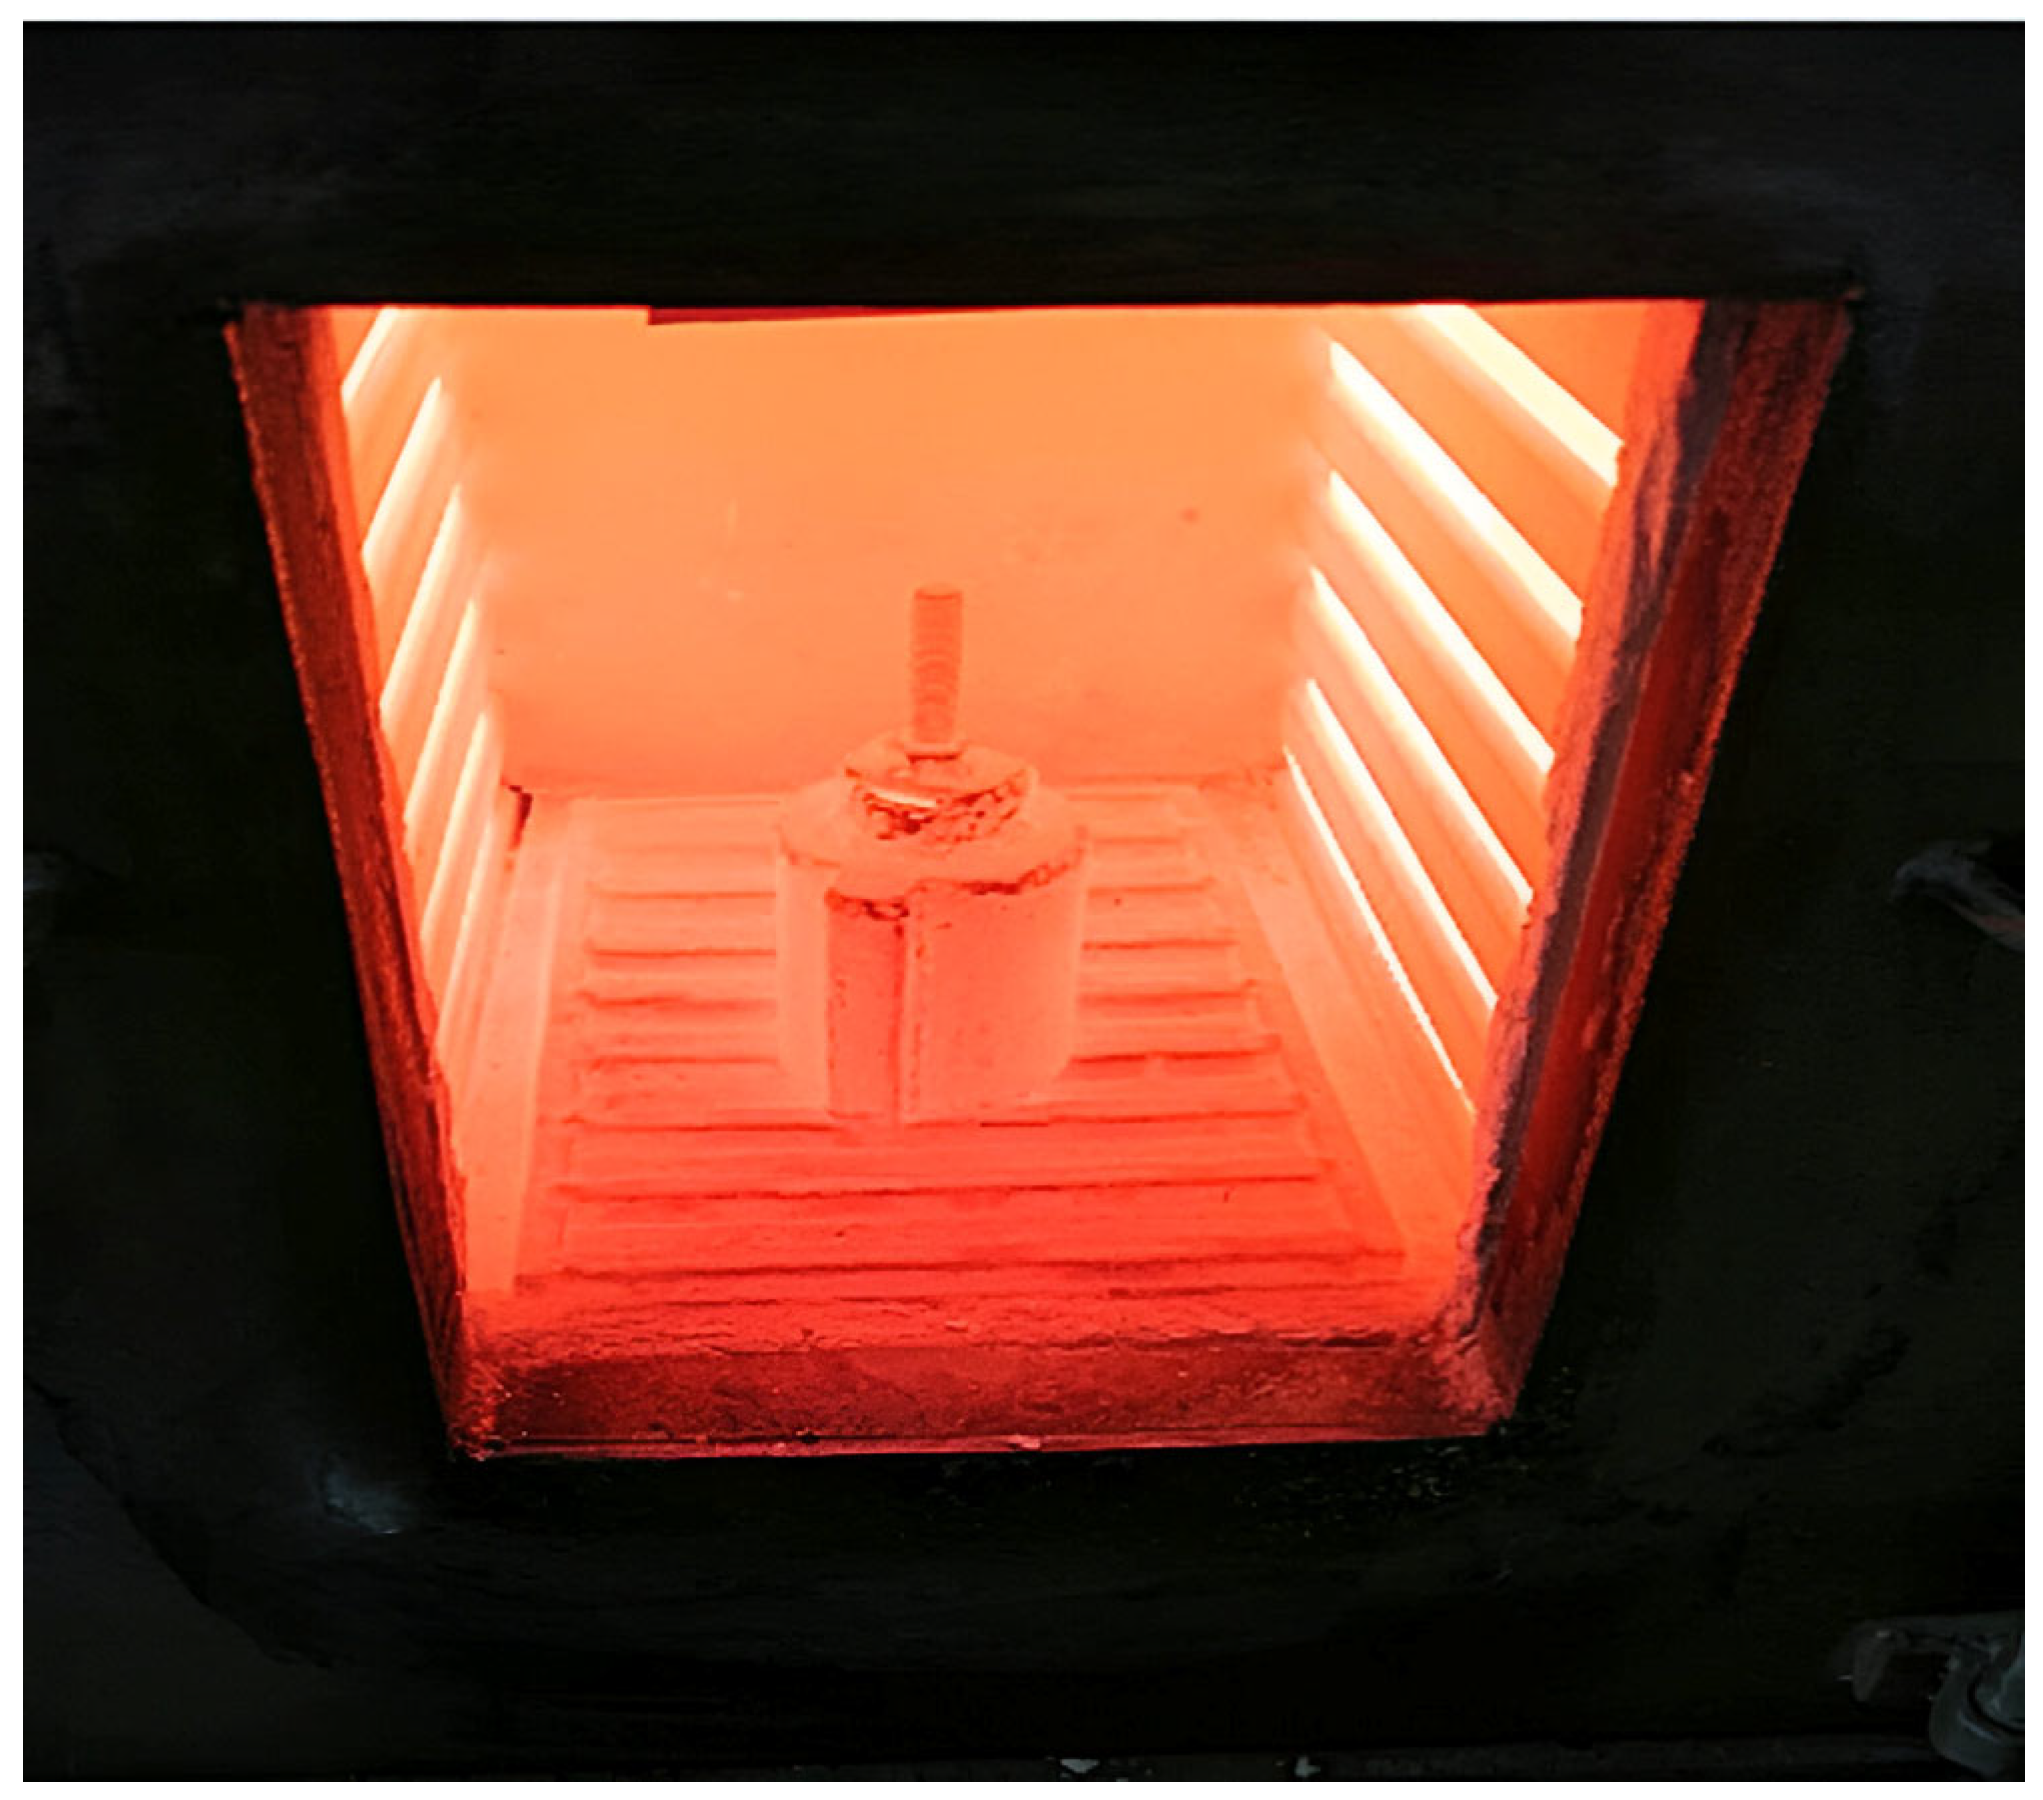
Figure 1c). Heat treatment and preheating operations were carried out using an electric laboratory furnace (Protherm PLF series, Ankara, Turkey).
The functionally graded Al/ZrB
2 composites were produced using an in situ centrifugal casting method. During casting, the molten aluminum was poured into a preheated mold and subjected to a rotational speed of 1200 rpm. The casting process was carried out at a pouring temperature of 900 °C, and the centrifugal force was applied for a duration of 2 min to promote reinforcement segregation. After completion of the spinning process, the cast samples were allowed to cool naturally in air. In the study, two symmetrically placed closures were created on the mold, as seen in
Figure 2, to ensure the concentration of ZrB
2 particles in a specific area. This design aimed to obtain a specialized area, ZrB
2 particles accumulated densely.
The mold rotation speed was selected as 1200 rpm to generate a sufficient centrifugal force for effective migration of ZrB2 particles toward the outer regions of the casting, thereby ensuring a clear functional gradient. Previous studies have shown that mold rotation speed critically affects particle segregation and gradient formation in functionally graded aluminum matrix composites produced by centrifugal casting, with effective gradation achieved at intermediate rotation speeds (Babu et al., Journal of the Brazilian Society of Mechanical Sciences and Engineering; Hosseini et al., International Journal of Engineering).
In this study, the processing parameters employed during the centrifugal casting of Al/ZrB2 composites were evaluated in order to optimize the distribution of the reinforcement phase. Different holding temperatures, spinning durations, and rotational speeds were examined, and the resulting structures were compared in terms of microstructural integrity and continuity of the reinforcement distribution. Based on these preliminary evaluations, processing conditions providing a stable and reproducible reinforcement distribution were identified.
Accordingly, the samples selected for microstructural characterization and abrasive wear tests were taken from the cast ingot produced under optimized conditions, namely a rotational speed of 1200 rpm, a casting temperature of 900 °C, and a spinning duration of 2 min.
For the characterization, samples were taken, as represented in
Figure 1e, from the outer surface towards the interior at distances of 1 mm (A region), 8 mm (B region), and 15 mm (C region) distances in dimensions of 6 × 6 × 15 mm. Microstructure analysis, density measurement, hardness, and wear tests were conducted on these samples to thoroughly examine the local properties of the composite material.
For density measurements, cube-shaped samples were extracted from Regions A, B, and C of the functionally graded composites. All surfaces of the samples were ground using 1200-grit silicon carbide abrasive paper to ensure smooth and uniform surfaces prior to measurement. The densities of the samples were then determined using the Archimedes principle.
The samples were ground with SiC paper abrasives ranging from 180 to 1500 mesh, then the surfaces were thoroughly polished with a 0.25 µm diamond suspension. To examine the microstructures of the metallographically prepared samples, scanning electron microscope (SEM) images were performed at different magnifications using a JEOL JSM 6060LV device (Tokyo, Japan). XRD patterns were obtained using a D8 ADVANCE Da Vinci X-Ray device (Bruker Corporation, Billerica, MA, USA) to identify and analysis the elements and compounds in the crystalline structure in detail. Microstructural observations were conducted using an optical microscope (Nikon Eclipse LV series, Tokyo, Japan).
Brinell hardness (HB) test was used to determine hardness values. The tests were carried out using a Wolpert Wilson Instrument brand 402MVD model device (Wilson Hardness, Aachen, Germany). At least five measurements were taken from each of the A, B, and C regions. Brinell hardness measurements were carried out in accordance with standard procedures using a 2.5 mm diameter tungsten carbide ball indenter (standard accessory of the hardness testing device) under an applied load of 62.5 kgf, with a dwell time of 30 s. For each region of the functionally graded composite, multiple measurements were performed and the average values were reported.
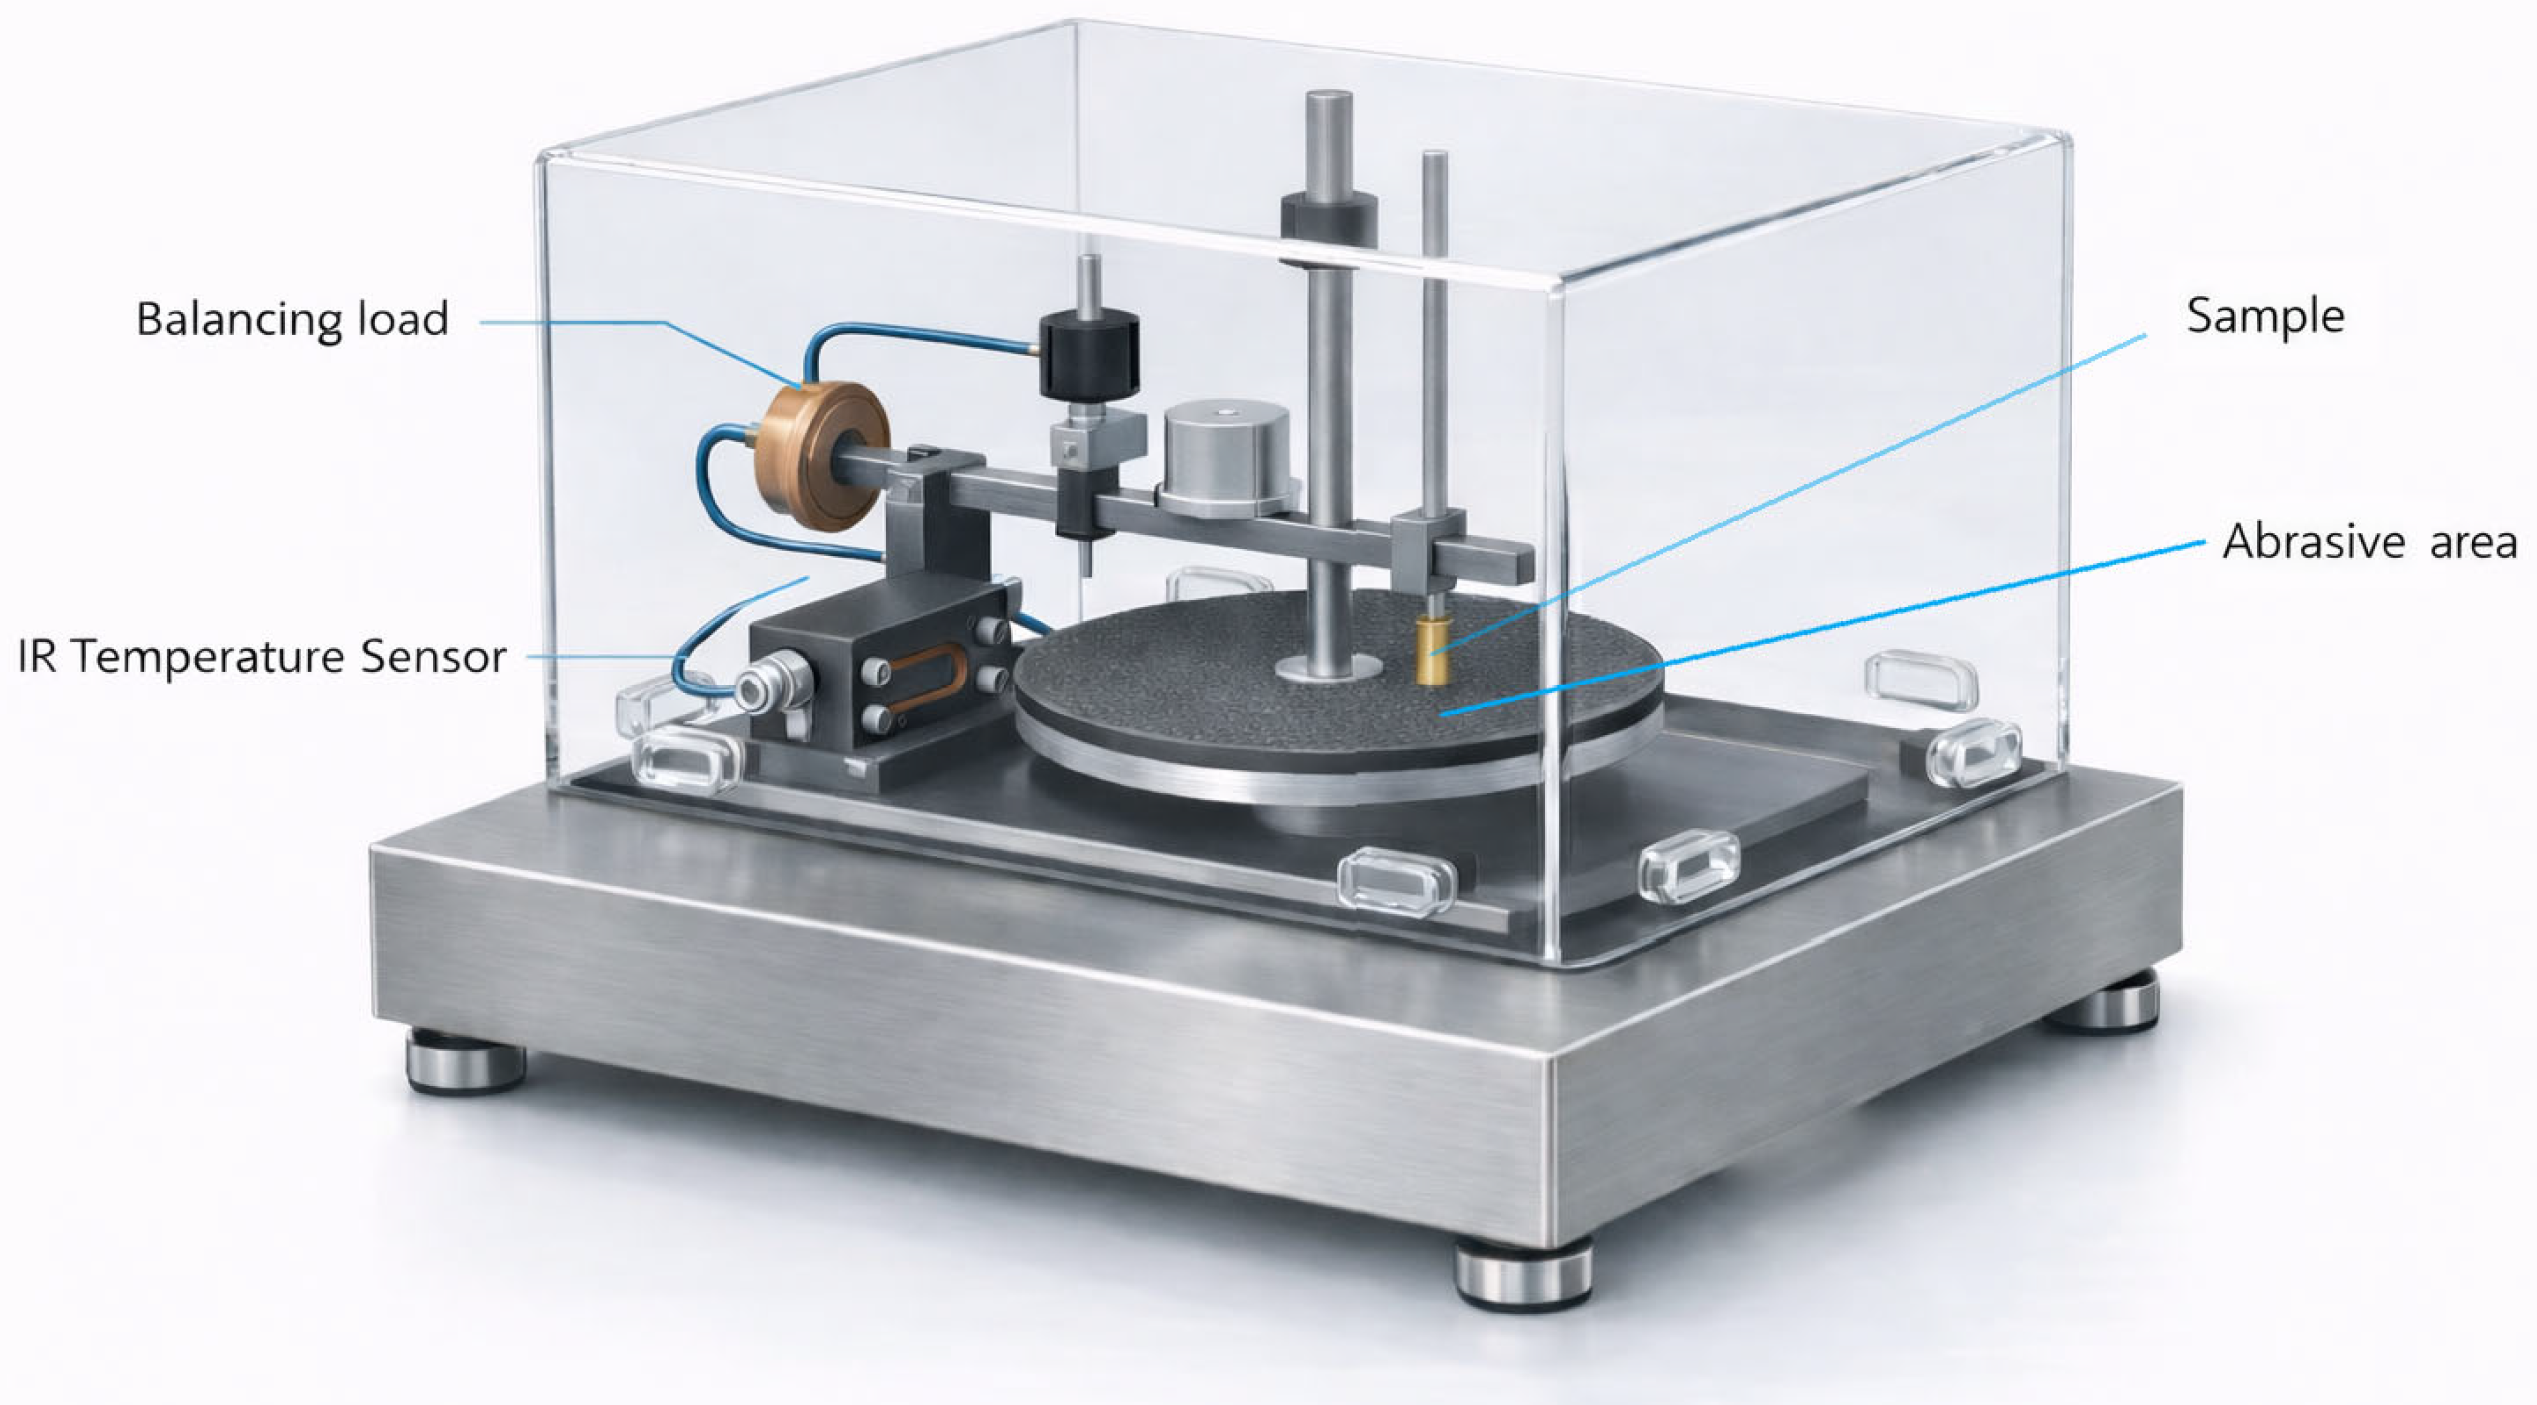
Wear tests were performed using the pin-on-disk technique. For the abrasive wear tests, samples were taken separately to represent the rich (A and B regions) and poor regions (C region) of the composites. This method is schematically given in
Figure 3. The abrasive wear tests were performed using a pin-on-disk configuration, where the pins slid against a rotating disk along a circular wear track with a diameter of 150 mm.
The factors and levels selected for abrasive wear tests are given in
Table 2 and five factors were selected to determine the analysis of the wear behavior of the composites. Each of these factors was determined at three levels. Wear analysis was conducted on abrasive papers with 1000, 320, and 180 grit at sliding speeds of 3, 5, and 7 m/s, and loads of 1, 2, and 3 N.
The abrasive wear tests were carried out using silicon carbide waterproof abrasive papers. According to the FEPA (P-grit) standard, the P1000 abrasive paper (Atlas Zımpara, İstanbul, Turkey), corresponding to an average abrasive particle size of approximately 18 µm, was selected as the lowest abrasive size level in the experimental design. In contrast, the P320 and P180 abrasive papers, with average particle sizes of approximately 46 µm and 82 µm, respectively, were defined to represent intermediate and coarse abrasive conditions. Accordingly, the abrasive particle sizes of 18, 46, and 82 µm used in this study correspond to the nominal abrasive size levels defined as control factors in the Taguchi experimental design.
Under the selected test conditions, the duration of each abrasive wear experiment ranged approximately between 7 and 50 s, depending on the applied sliding speed and sliding distance. This relatively short test duration ensured that the abrasive paper retained its integrity throughout the experiment and prevented significant degradation of the abrasive surface during testing.
For each abrasive wear experiment, fresh waterproof silicon carbide abrasive paper was used in order to ensure consistent and comparable test conditions. The abrasive paper type and test parameters were optimized to maintain abrasive integrity throughout the entire test duration. No tearing, cracking, or detachment of the abrasive paper was observed during the experiments, and the abrasive surface remained intact until the completion of each test. To ensure the reliability and repeatability of the results, each wear test was repeated three times, and the reported values represent the average of the repeated measurements.
For the abrasive wear tests, separate counter pins were prepared from each functional region (A, B, and C) of the functionally graded composites. The pins were machined directly from the cast samples with dimensions of 6 × 6 × 15 mm
3. Prior to the wear tests, all pins were ground using silicon carbide abrasive papers up to 1200 grit in order to ensure comparable surface conditions. After surface preparation, the pins were subjected to abrasive wear testing. The extraction of the pins from different regions of the graded structure is schematically illustrated in
Figure 1e.
In this study, the wear behavior of the composites was analyzed by considering the volumetric wear rate (mm3/m), defined as the volume loss per unit sliding distance, which is widely used in abrasive wear testing. During the wear experiments, the masses of the test specimens were measured before and after each test using a precision balance. The measured mass losses were converted into volume losses by taking into account the density values corresponding to each composite region. The obtained volume losses were then divided by the sliding distance to calculate the volumetric wear rates.
3. Results and Discussion
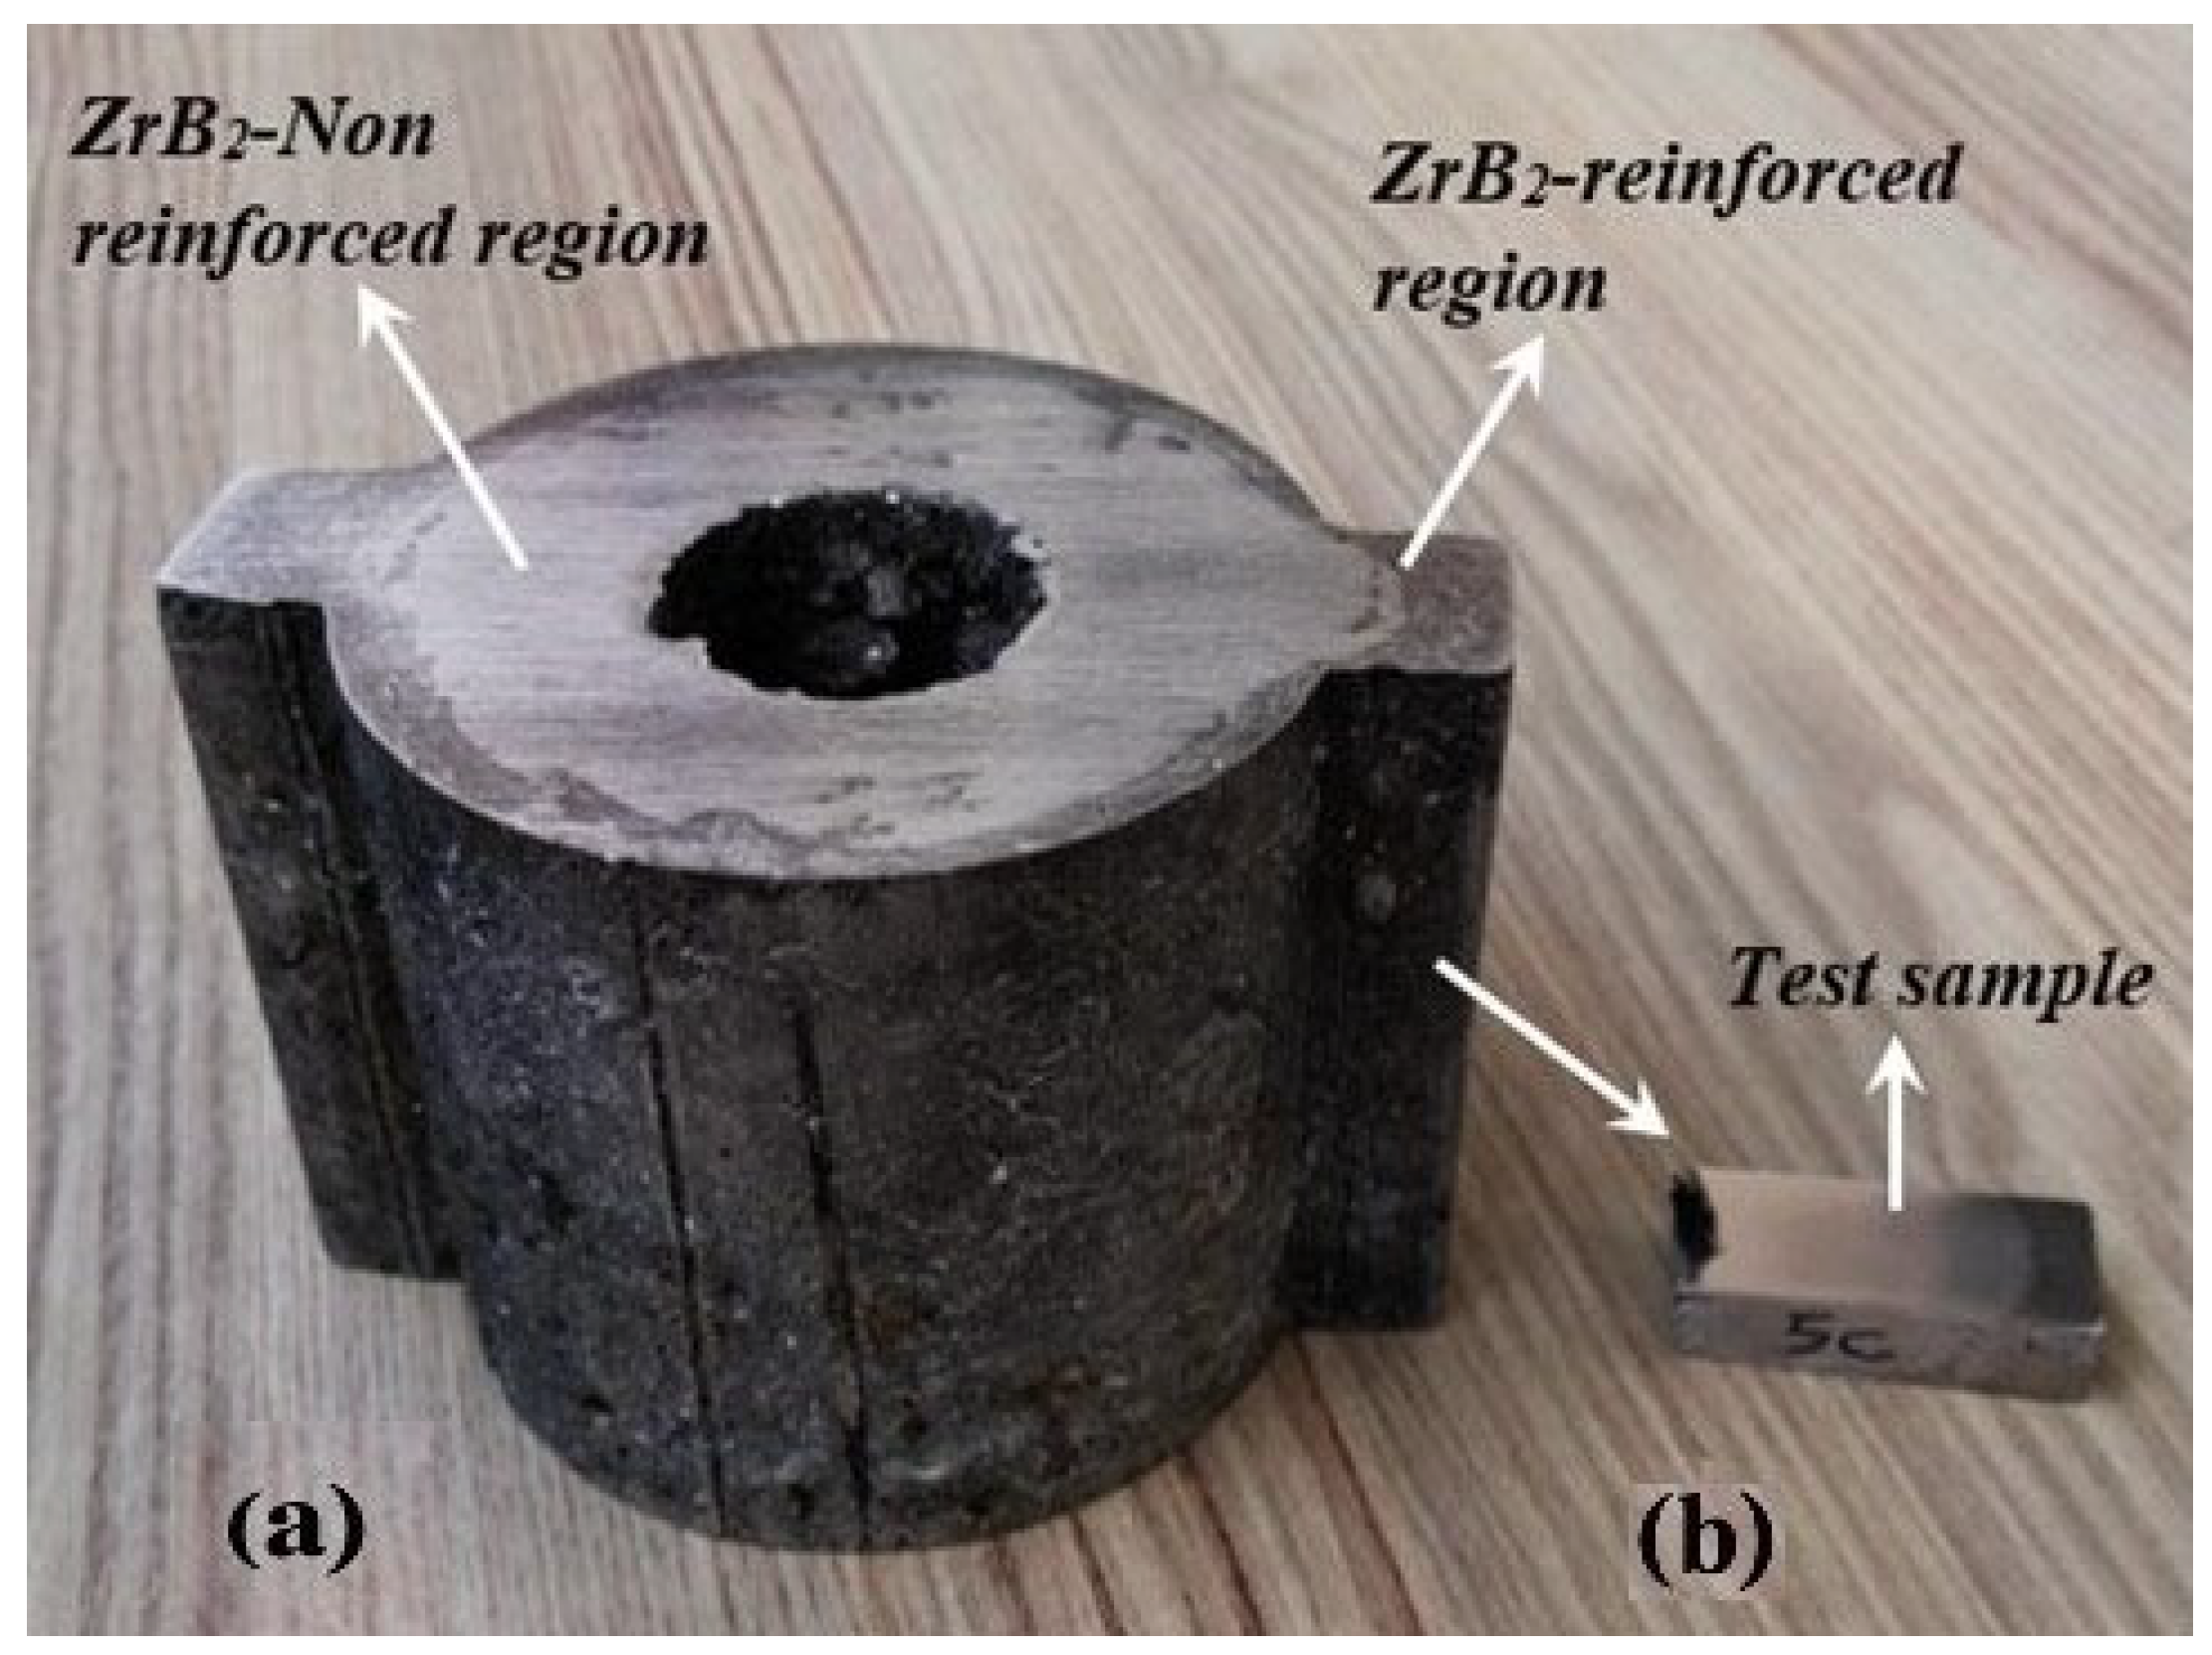
The functional graded Al/ZrB
2 composite material produced by the centrifugal casting process is presented in
Figure 4a as the main part and in
Figure 4b as a sample of it. Upon examination of the images, two distinct regions are observed: a lighter-colored inner region and a darker-colored outer region. This indicates the distribution of the reinforcing phases from the center towards the outer regions.
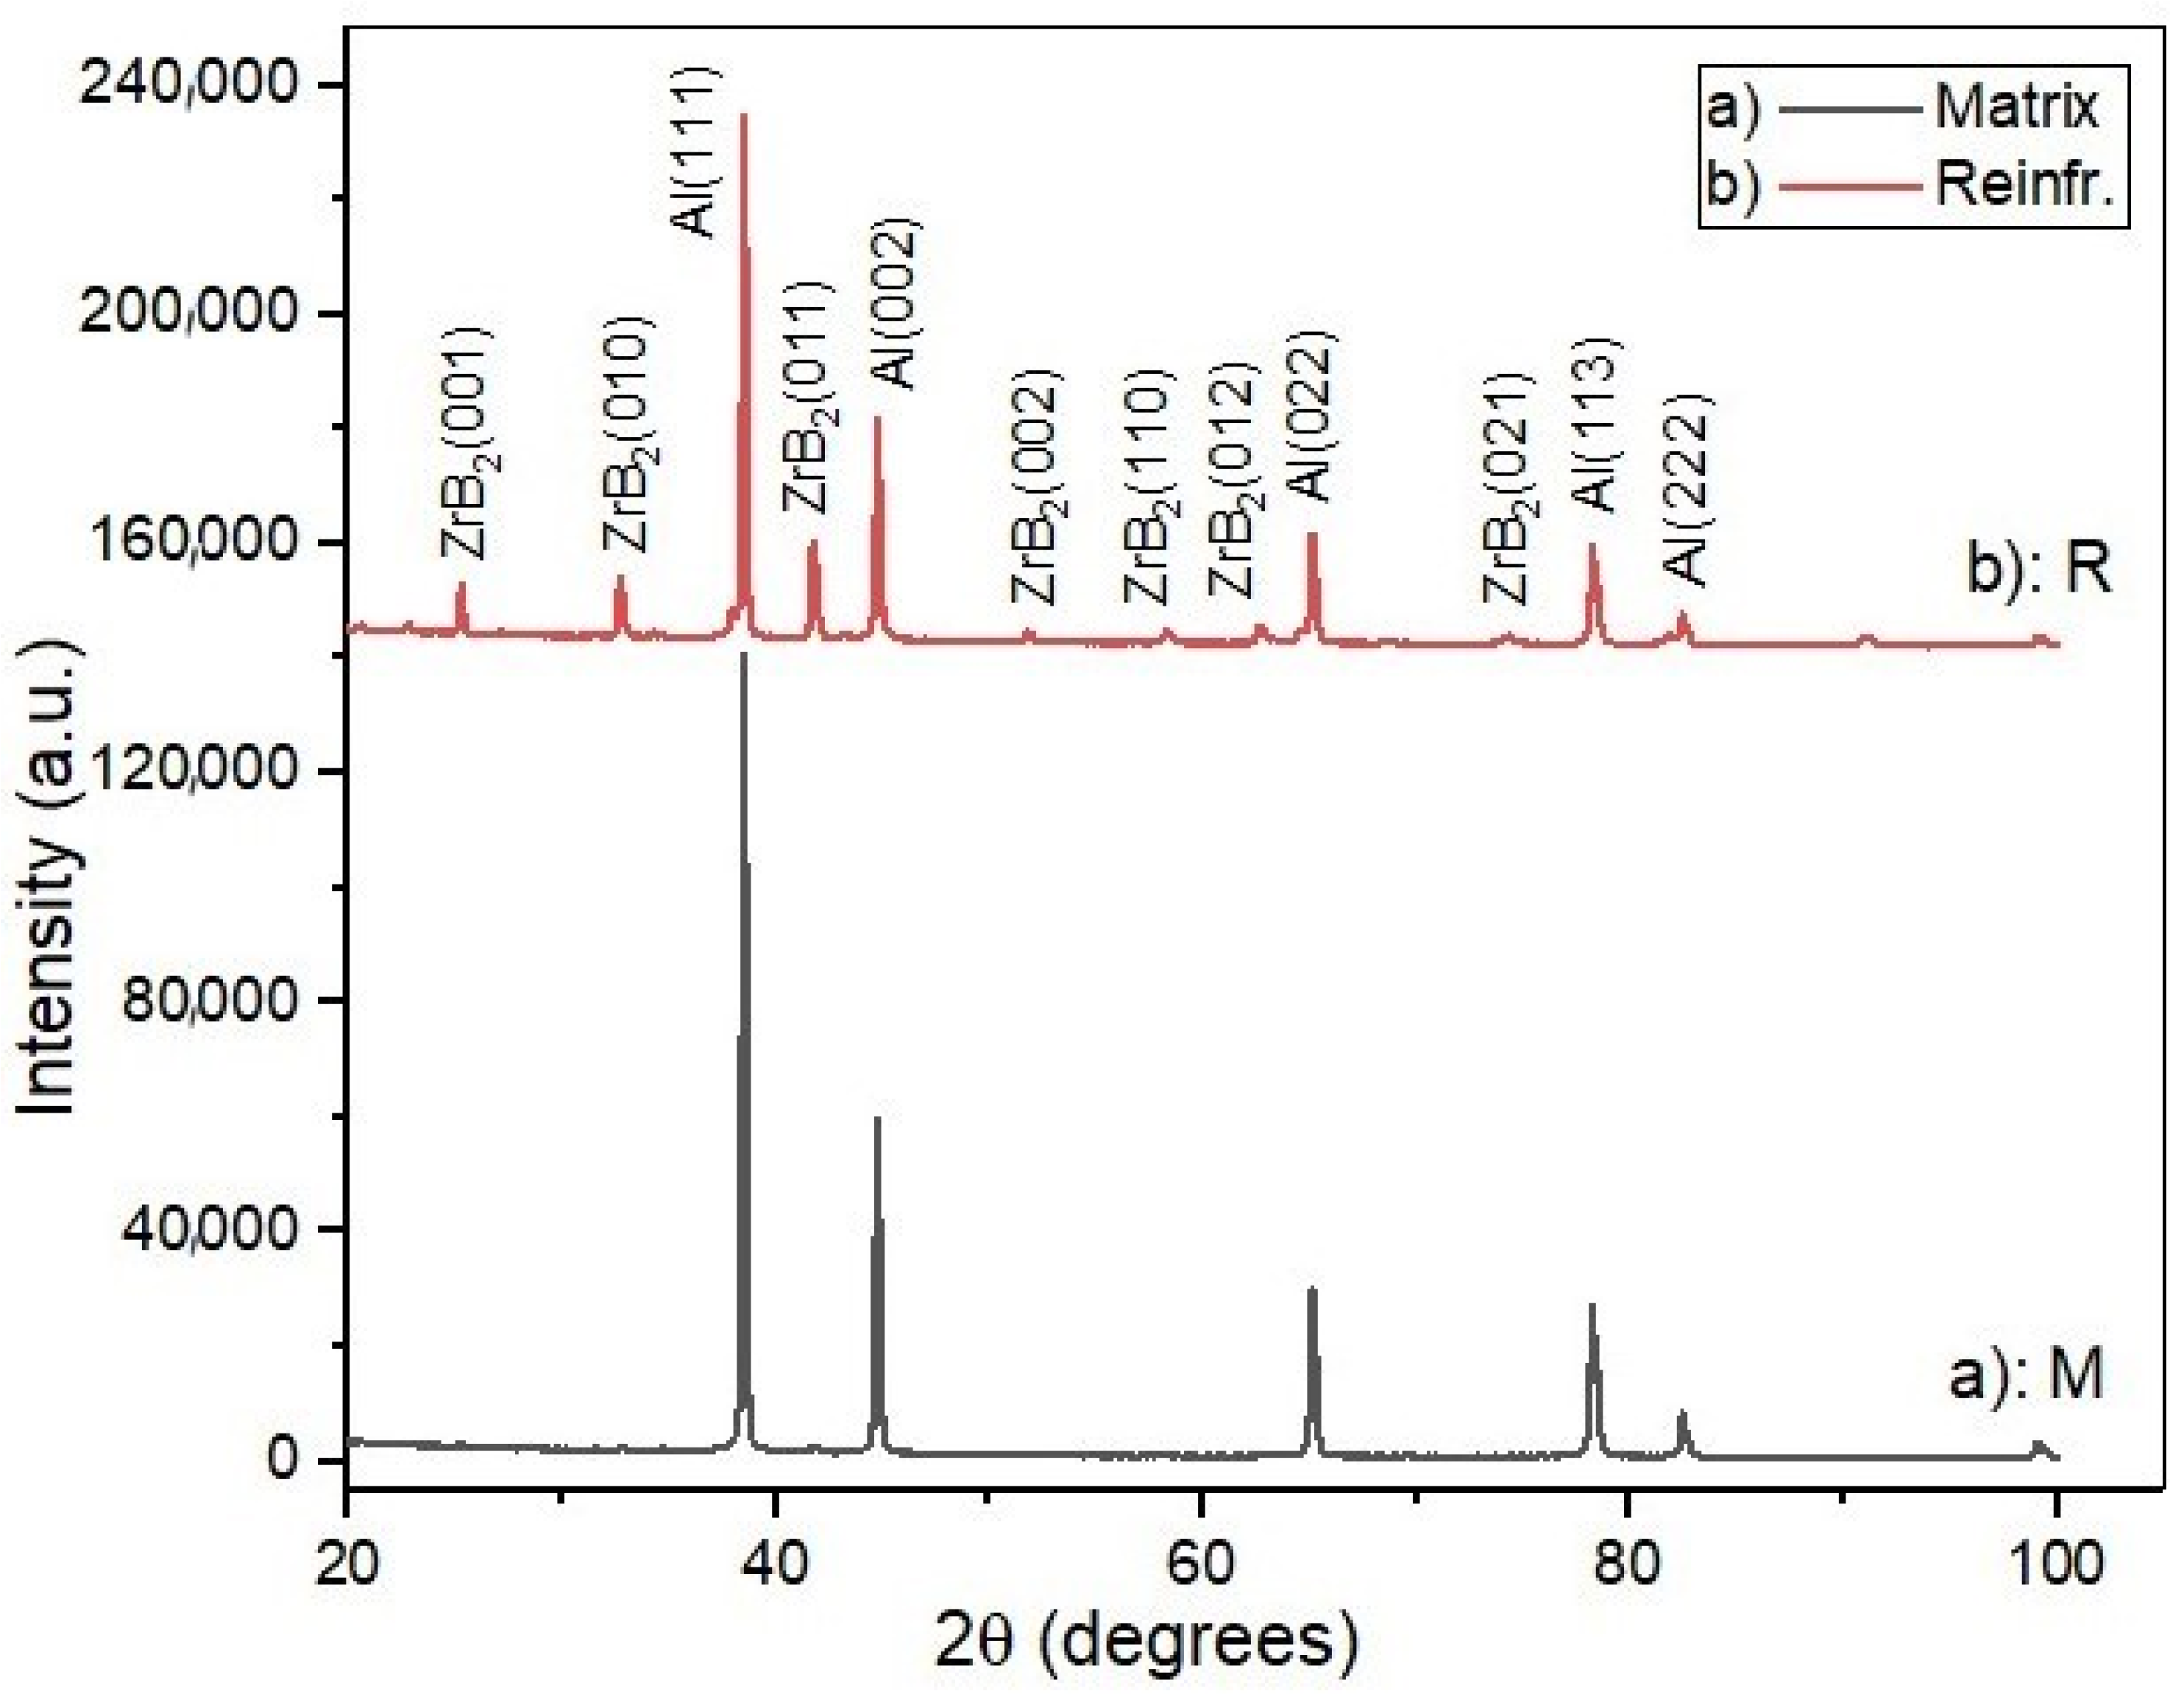
XRD patterns obtained from the light and dark-colored regions of the composite material are presented in
Figure 5. According to the XRD results, only aluminum phase peaks were observed in the light-colored region in
Figure 5 (letter a), whereas in
Figure 5 (letter b), characteristic peaks belonging to the ZrB
2 phase were also detected in addition to the aluminum peaks in the dark-colored region.
In the phase analysis, the observation of only ZrB
2 peaks in addition to aluminum indicates that the Al-Zr-B melt system prepared at 1200 °C indicates that the Zr and B elements in the liquid aluminum reacted in accordance with the reactions given in ‘Equations (1)–(3)’ during the cooling of the Al-B melt system prepared at 1200 °C to 800 °C, thereby synthesizing ZrB
2 particles in situ [
24,
28,
29,
30]. Additionally, the detection of ZrB
2 peaks only in the dark-colored region (
Figure 5 (letter b)) indicates that the solid ZrB
2 (boride) structures formed concentrated and accumulated on the outer part of the mold due to centrifugal force. Based on these findings, the observations on the composite material and the results of the phase analysis, the dark-colored region has been designated as the “ZrB
2-rich region” and the light-colored regions as the “ZrB
2-poor regions”.
Additionally, the XRD patterns presented in
Figure 5 demonstrate that the phase of ZrB
2 synthesized in situ has a thermodynamically stable structure. It has been observed that ZrB
2 does not react with molten Al alloy to form new metallic compounds. Furthermore, the absence of significant amounts of other phases indicates that the Al-ZrB
2 interface is clean and free from contamination. Dinaharan et al. reported similar results in their study as well [
26,
31].
It has been widely reported that XRD patterns belonging to the ZrB
2 reinforcement phase were clearly detected in AA7075/ZrB
2 aluminum matrix composite (AMC) material, and that the intensity of these peaks increased as the ZrB
2 content in the material increased [
32,
33]. This indicates that ZrB
2 is directly reflected in the XRD patterns in a manner dependent on its concentration, which is consistent with the findings of our study. In this study, the approximate percentage distributions of phase components in different regions were calculated by considering the intensities of characteristic peaks belonging to ZrB
2 and Al phases obtained from the XRD patterns. As a result of this analysis, it was determined that in the ZrB
2-poor region of the composite, only aluminum peaks were present in the XRD patterns, and ZrB
2 phase was negligible (approximately 0%). In the ZrB
2-rich region, in addition to aluminum peaks, distinct ZrB
2 peaks were also observed, and ZrB
2 phase was found to constitute approximately 15% by weight.
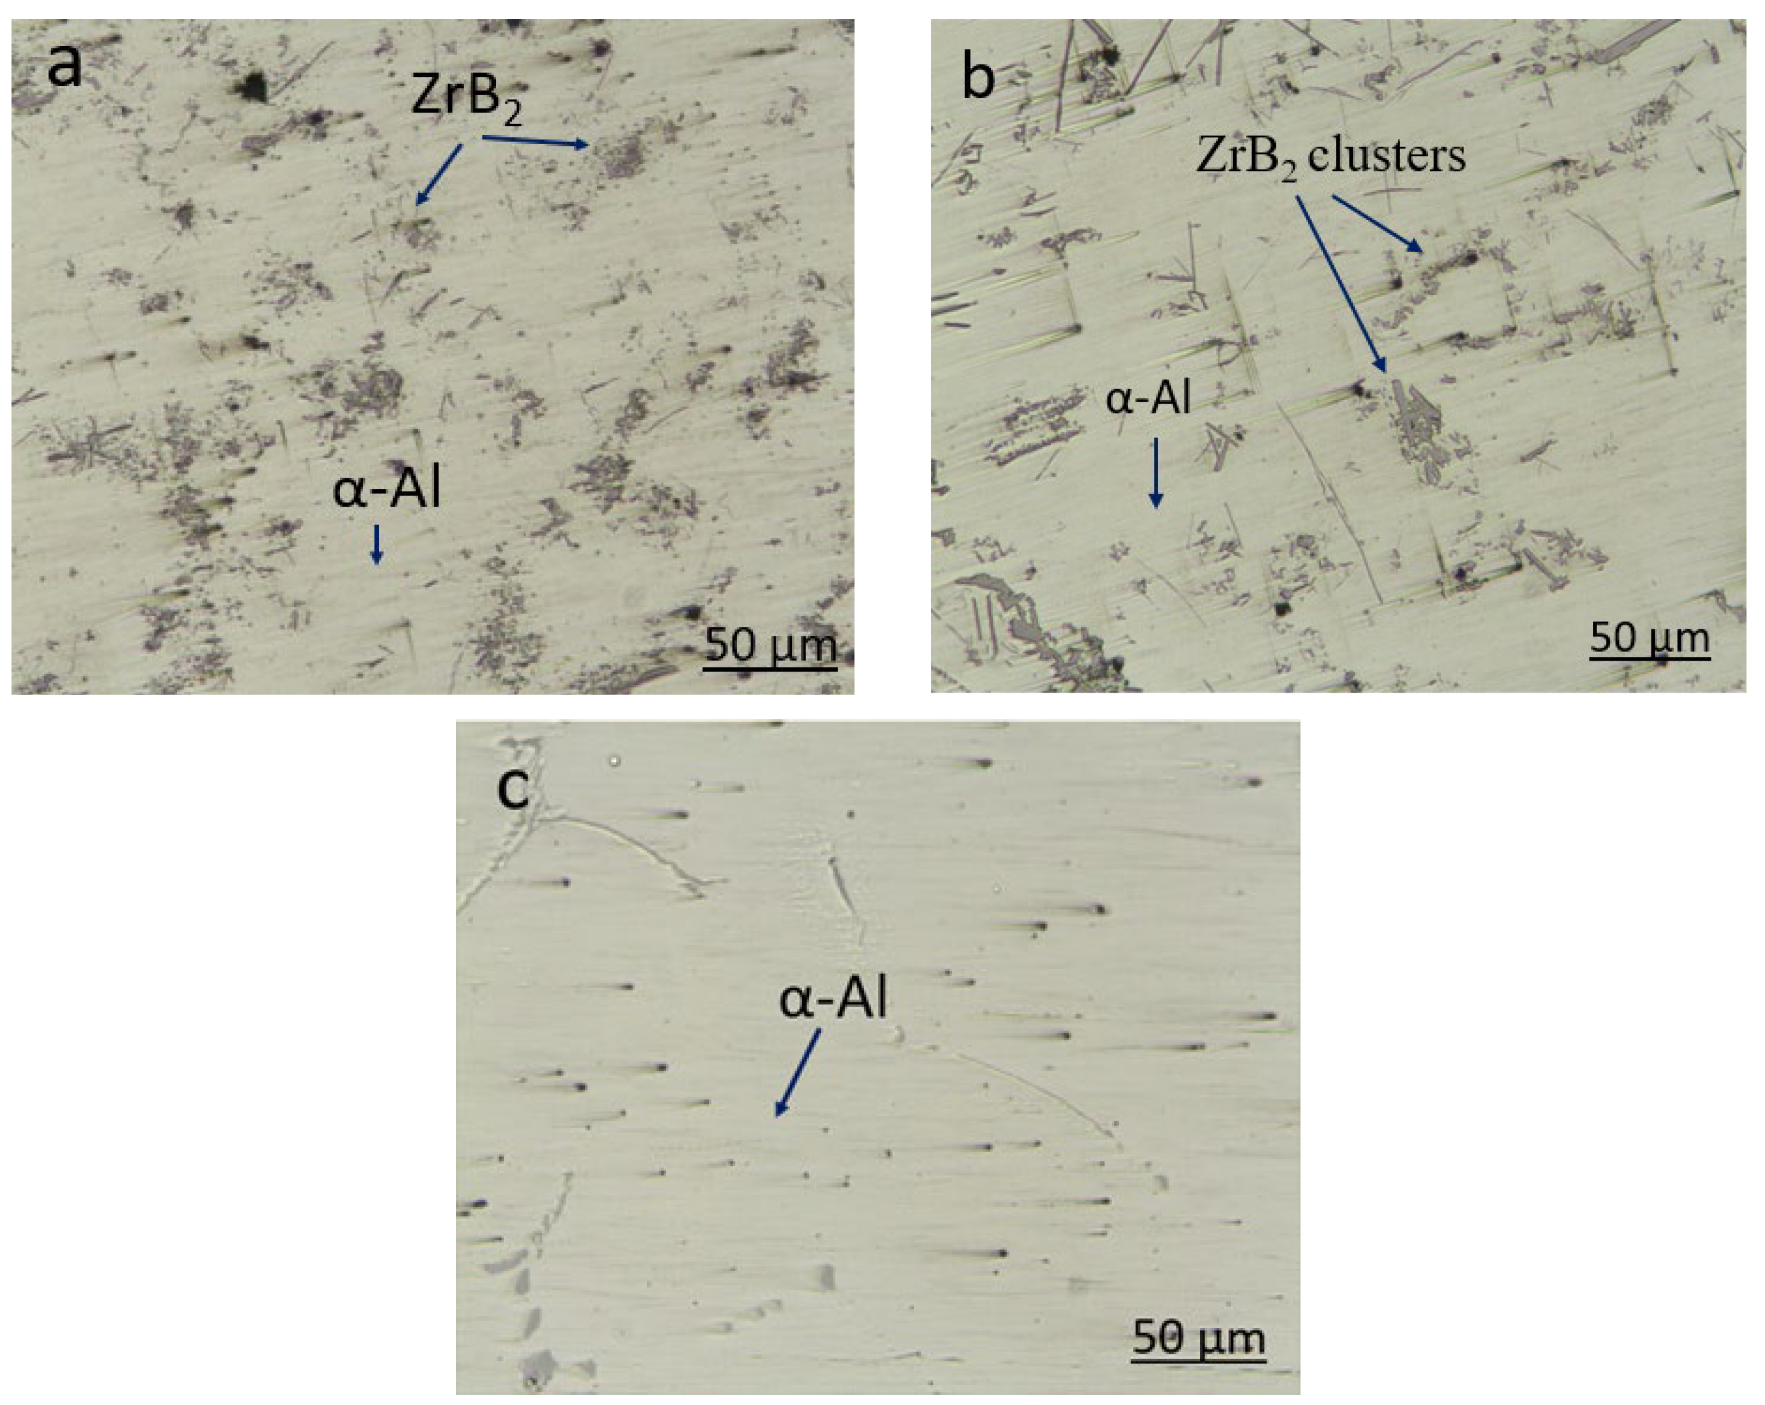
Microstructural images of the composites from Regions A, B, and C are presented in
Figure 6. In these images, dark-colored ZrB
2 reinforcement particles are clearly observed within the white-colored α-aluminum matrix. Detailed examination of
Figure 6, it is observed that ZrB
2 particles are most densely distributed in the outer region (A), less densely in the middle region (B), and least densely in the inner region (C). The primary reason for this distribution is that the specific gravity of ZrB
2 (approximately 6.1 g/cm
3) is significantly higher than that of aluminum (approximately 2.66 g/cm
3), and during centrifugal casting, the centrifugal force causes these heavier phases to be pushed towards the outer regions.
Additionally, during examining of
Figure 6a,b, it was observed that ZrB
2 particles tend to form clusters rather than distributing homogeneously within the matrix. This situation may be caused by the growth of the solid α-Al phase during solidification, which pushes or compresses the particles in the liquid melt, causing them to accumulate at grain boundaries or specific regions [
20,
21]. The line-like features observed in the microstructures shown in
Figure 6 correspond to grain boundaries, which become more pronounced due to the solidification characteristics of the aluminum matrix and the presence of the ceramic reinforcement.
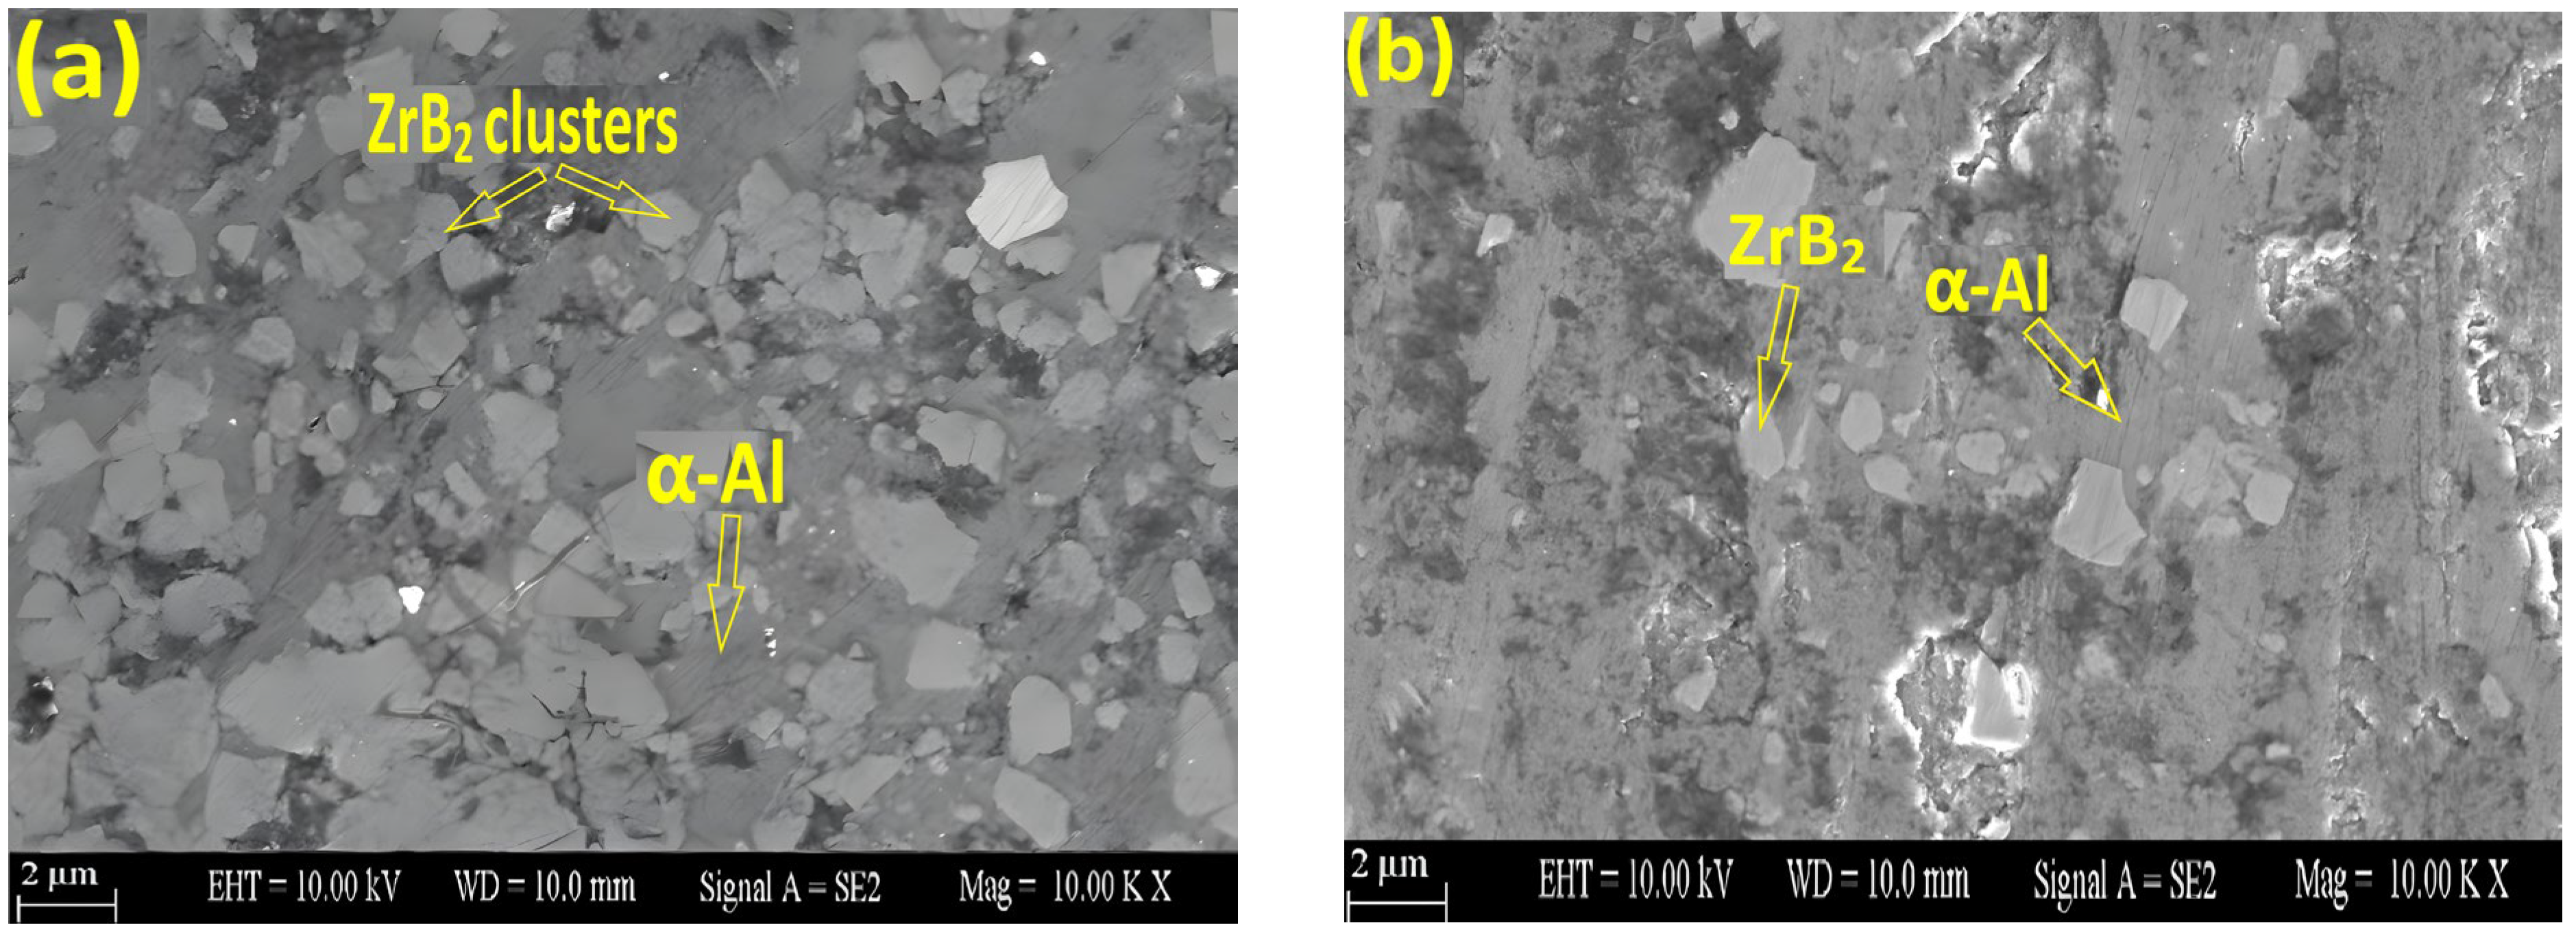
SEM images taken from areas where ZrB
2 particles form clusters and from outside these areas are shown in
Figure 7 to outgaze the microstructures. In
Figure 7a, ZrB
2 particles are seen to be densely distributed and clustered (in a cluster-like manner) within the aluminum matrix in the clustered area. In contrast, in
Figure 7b, it is seen that ZrB
2 particles are present in negligible amounts outside the cluster region. Additionally, no interphase formation was observed between ZrB
2 particles and the aluminum matrix in the SEM images.
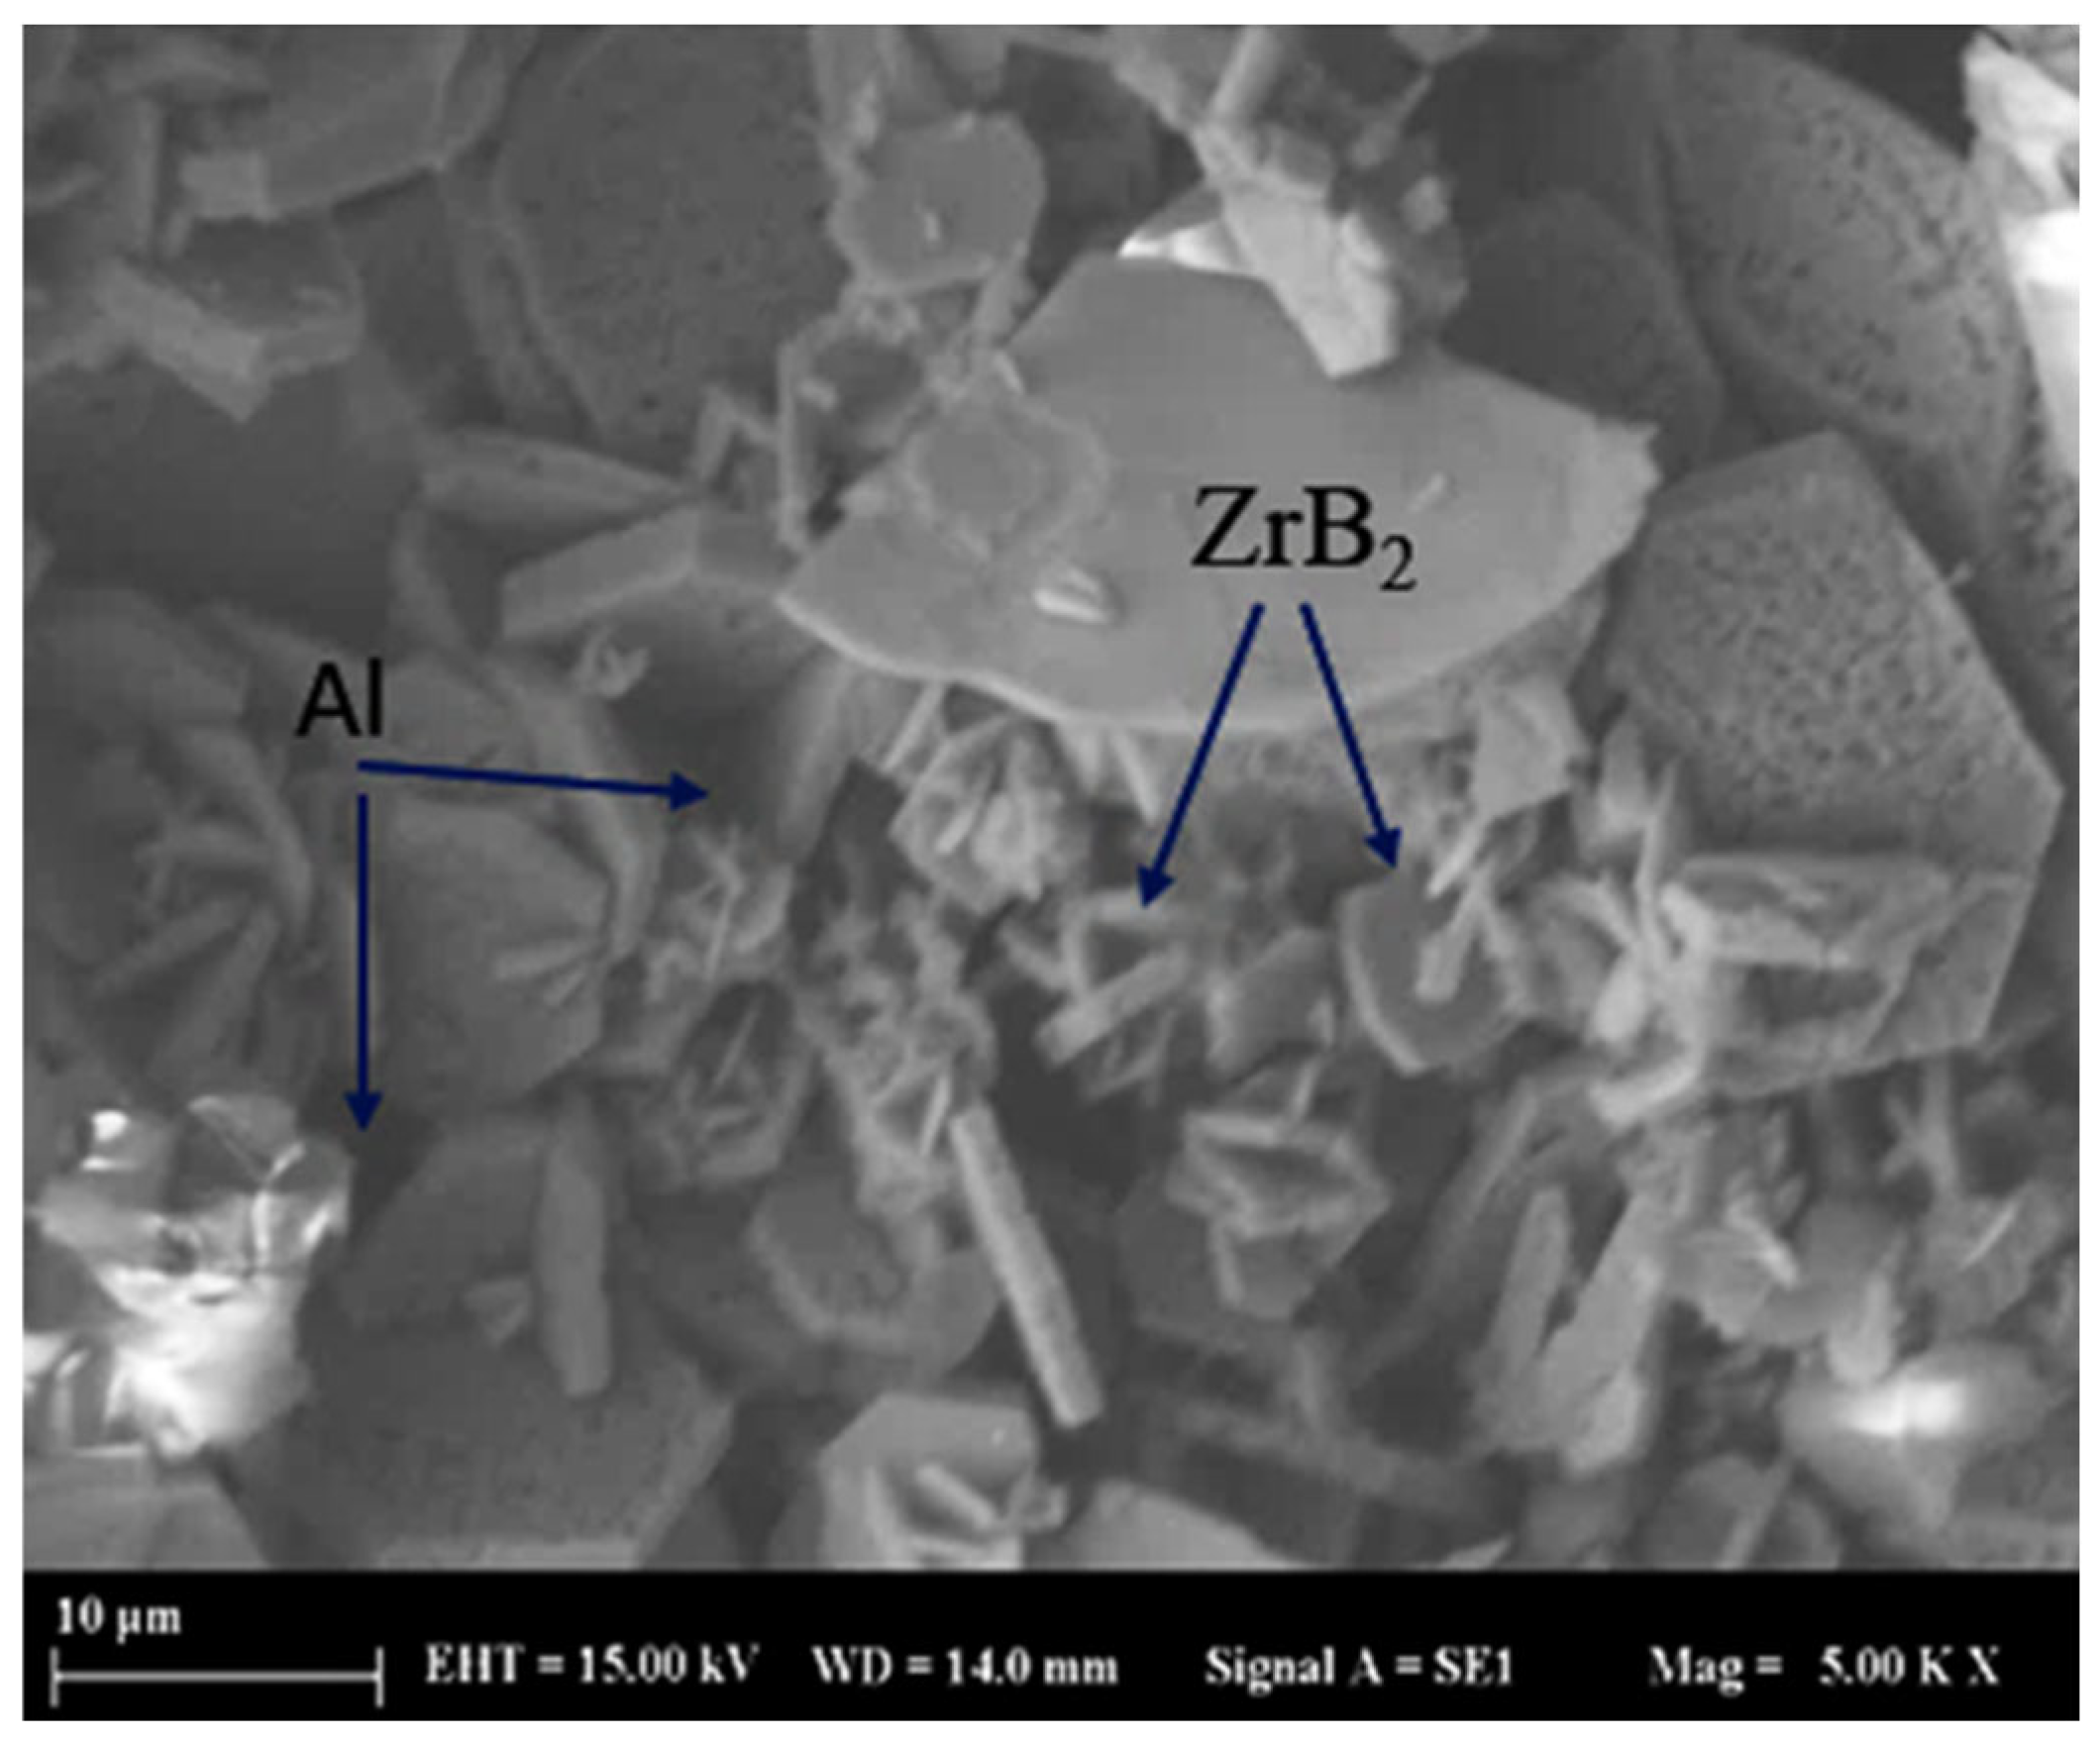
In order to reveal the morphology of ZrB
2 particles more clearly, a sample taken from composite Region A was subjected to deep etching with 15% HCl solution for 5 min, and then SEM image was obtained and presented in
Figure 8. All particles in the SEM image (
Figure 8) belong to the ZrB
2 phase. Both large and small ZrB
2 particles are observed. The large particles clearly exhibit a hexagonal crystal morphology. In contrast, the smaller particles are observed to be synthesized on top of each other and exhibit forms resembling a hexagonal structure. According to the quantitative analysis of ZrB
2 particles based on SEM images obtained from Regions A and B, the width of the larger particles was determined to be 10 ± 3 μm for both regions, while the width of the smaller particles was 5 ± 1.5 μm. The thickness of both particle types was found to be approximately ≈1 μm on average.
Table 3 presents the density values of the FGCM in Regions A, B, and C, the reinforcement ratios calculated based on these densities, and the average hardness values. Increases in density and hardness values were observed from the inner region to the outer region of the composite. The density in Region C was about 2.69 g/cm
3, whereas it increases to 2.90 g/cm
3 in Region B and 2.94 g/cm
3 in Region A, respectively. Based on these density values, the reinforcement ratios of the composite regions were calculated according to the mixing rule. As a result of the calculations, the highest particle content was determined to be 15.2 ± 3% in Region A, followed by Region B at 12.1 ± 3%, and Region C had an almost negligible reinforcement ratio (0 ± 0.1%). These results are qualitatively consistent with the relative reinforcement distribution inferred from the XRD peak intensity trends.
During examining the hardness values of the regions in the table, the highest hardness value was measured as 75 HB in Region A having the highest reinforcement ratio (15%). In Region B, with a ZrB2 content of 12%, the hardness was measured as 68 HB. In Region C, which contains no particles, the lowest hardness value of 28 HB was measured. These results indicate a direct relationship between the ZrB2 particle ratio including to the aluminum matrix and hardness, meaning that as the reinforcement ratio increases, hardness also increases. The probable reason for this is that ZrB2 particles form a hard and rigid phase within the matrix, increasing resistance to deformation and thereby enhancing the overall hardness of materials. Consequently, as the reinforcement ratio in the composite increases, hardness values increase functionally from the inner to the outer parts of the material.
When the data presented in the table are examined, it is clearly observed that the hardness increases significantly from the inner region toward the outer region depending on the reinforcement ratio. The highest hardness value was measured as 75 HB in Region A, which contains 15% ZrB
2 and has the highest reinforcement ratio. In Region B, which contains 12% ZrB
2, the hardness was measured as 68 HB, whereas the lowest hardness value of 28 HB was obtained in the unreinforced Region C. These results clearly demonstrate that there is a direct relationship between the ZrB
2 reinforcement ratio and the hardness of the composite. The increase in hardness can be attributed to the formation of a hard and rigid phase by ZrB
2 particles within the aluminum matrix, which enhances resistance to plastic deformation. In addition, the increased dislocation density generated at the particle–matrix interfaces also contribute to the improvement in hardness [
34].
In functionally graded structures produced by the centrifugal casting method, it is well known that reinforcement particles are transported toward the outer regions under the effect of centrifugal force due to the density difference between the reinforcement and the aluminum matrix. This results in higher hardness values in the outer regions as a consequence of the increased reinforcement content. Similar trends have also been reported in various ceramic-reinforced aluminum-based functionally graded composites produced by centrifugal casting [
34,
35,
36,
37]. These studies indicate that the concentration of the reinforcement phase in the outer regions plays a decisive role in determining the hardness and wear resistance.
The hardness gradient obtained in the present study is consistent with those reported in the literature for functionally graded aluminum composites reinforced with TiB2, SiC, and B4C, demonstrating that ZrB2 reinforcement can be effectively graded through the combination of in situ synthesis and centrifugal casting. Therefore, ZrB2-reinforced functionally graded structures can be considered to have significant potential for engineering applications, as they provide high hardness and wear resistance at the surface while exhibiting more ductile behavior in the inner regions.
According to the Taguchi approach, the L
27(3
5) orthogonal series was selected for wear tests in accordance with the factors and levels given in
Table 2. The L
27(3
5) orthogonal series prepared according to
Table 2 is shown in
Table 4. A total of 27 test procedures were obtained according to this orthogonal series. Wear tests were conducted using the obtained test procedures, and weight losses were measured after the tests. Wear rates were calculated in mm
3/m·10
−3. The Taguchi approach, effectively used in the literature, was utilized in the analysis of the results. In the Taguchi approach, S/N represents the signal-to-noise ratio, which is used to evaluate the robustness of the process by considering both the mean value and the variability of the experimental results. According to the Taguchi approach, since low wear rates were desired, S/N ratios were calculated based on the “smallest is best” quality characteristic given in “Equation (4)”, and analyses were conducted using
Table 4 [
35].
Table 4 was calculated using the equations given in “Equations (5)–(10)”.
where yi: performance characteristic, i: observed value, n: number of tests in the experiment, and y: average of the observed values, SST is the sum of squares due to total variation, N is the total number of experiments, SSA represents the sum of squares due to factor A, KA is number of levels for factor A, Ai stands for the sum of the total ith level of the factor A, is the number of samples for ith level of factor A, T is the sum of total (S/N) ratio of the experiments, VA is the variance of the factor, FA is the F ratio of the factor.In
Table 4, the wear test results corresponding to Regions A, B, and C of the composite are presented together under the “Area of composite” column.
Table 4 presents the wear rates on the tests along with their averages and S/N ratios. The table shows that the wear rates ranged from 2.30·10
−3 to 574.5·10
−3 mm
3/m. The lowest average wear rate of 3.9·10
−3 mm
3/m was obtained in the “1st trial”, whereas the highest average wear rate of 512.6·10
−3 mm
3/m was observed in the “27th Trial”. Based on the results, it is quite difficult to determine which factors are effective and which are ineffective. Therefore,
Table 5 was prepared by considering the S/N ratios indicated in the table to identify the effects of the factors.
Table 5, created using the Taguchi approach, reveals the effect of the factors in the experiment on wear behavior and the statistical significance of these effects. In ANOVA analysis, the F-value represents the magnitude of the effect of the relevant factor on the system. The higher the F-value, the greater the effect of the factor. In the table, the
p-value determines whether the factor has a statistically significant effect. A
p-value of <0.05 indicates that the factor is significant, whereas a
p-value of >0.05 indicates that it is not significant. The error term represents the effect of uncontrollable external factors and provides information about the accuracy of the model. In this study, five different factors (composite region, abrasive particle size, load, speed, and road) were examined. The critical F-value for confidence levels of 99%, 95%, and 90% (α = 0.01, α = 0.05, α = 0.1) was determined as 2.39, 3.63, and 6.23, respectively. According to the ANOVA results; abrasive particle size (F = 165.05;
p = 0.00) was the most dominant factor with a contribution rate of 47.80%. Composite region (F = 124.21;
p = 0.00) ranked second with a contribution of 35.97%, while Applied load (F = 45.24;
p = 0.00) ranked third with a contribution of 13.10%. The F-values of these three factors are well above the critical threshold of 6.23, and their
p-values are below 0.05; therefore, it can be said that they have statistically significant effects. In contrast, the values of the speed factor (F = 2.09;
p = 0.157) and Wear path (F = 0.72;
p = 0.5) remain below the threshold value (2.39) even at a 90% confidence level. This indicates that these two factors do not have a statistically significant effect and do not play a significant role in the wear rate. When the error analysis is examined, the mean square error is calculated as 4.78. This value is quite low and indicates that the model represents the experimental data with high accuracy. Additionally, the error contribution ratio is at a low level of 2.32%, which proves the success of the experimental design and that measurement errors are kept to a minimum.
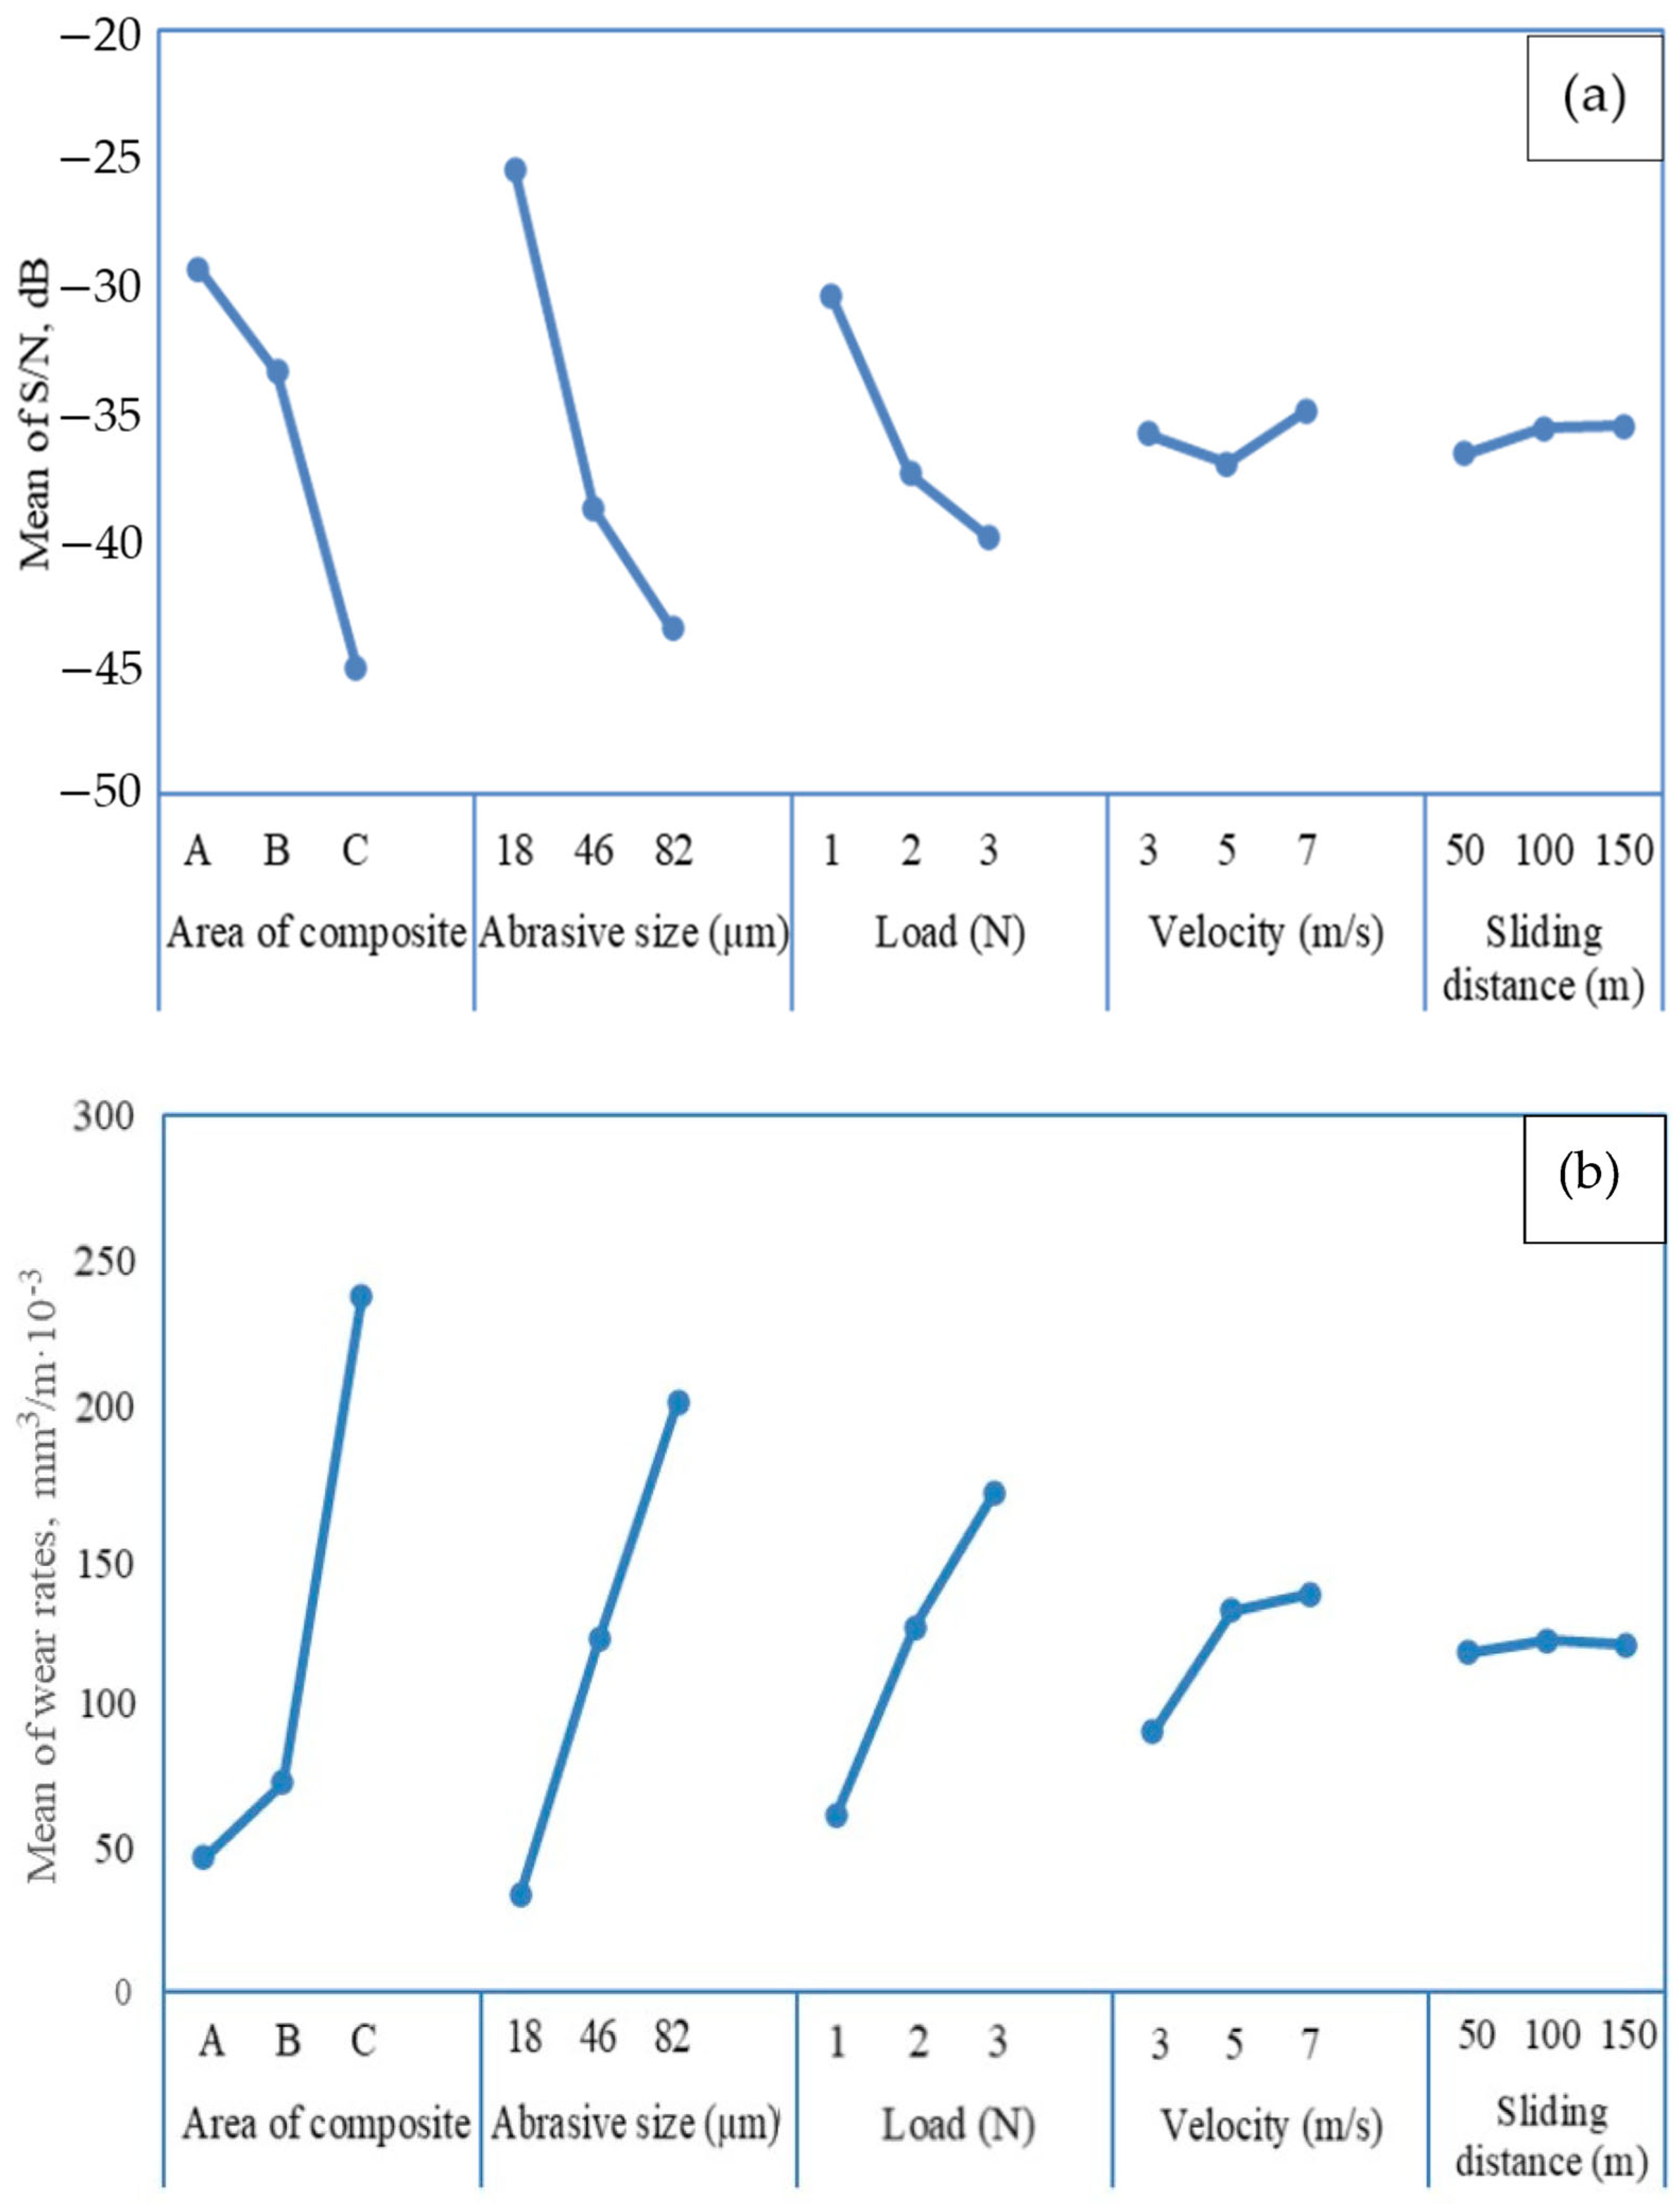
According to the Taguchi approach, main effects plots were drawn in this study to identify the dominant parameters affecting wear and to determine the optimum experimental conditions. Main effects plots are constructed by taking the average response values corresponding to the levels of each factor. Based on the S/N ratios and average wear rates presented in
Table 6, the main effects plots are shown in
Figure 9a and
Figure 9b, respectively. Examination of these graphs reveals that the composite region parameter has the most pronounced effect on the wear rate. The lowest wear rate was obtained in Region A, which has the highest ZrB
2 reinforcement content, followed by Region B, while the unreinforced Region C exhibited the highest wear rate. This behavior indicates that the wear resistance of the functionally graded composite material increases progressively from the inner region toward the outer region.
The primary reason for this behavior is the transport of ZrB
2 particles, which have a higher density than the aluminum matrix, toward the outer regions under the effect of centrifugal force during centrifugal casting. As a result, the increased ZrB
2 content in the outer regions forms a hard and rigid load-bearing phase, limiting the direct exposure of the matrix to abrasive action and thereby reducing the wear rate. Similarly, it has been reported in the literature that lower wear rates are obtained in the outer regions of various ceramic-reinforced functionally graded aluminum composites produced by centrifugal casting [
34].
When the wear parameters are evaluated, it is observed that the wear rate increases with increasing applied load. This can be explained by the deeper penetration of abrasive particles into the surface and the increased material removal associated with higher loads. Similar trends have been reported for TiB
2-and other ceramic-reinforced aluminum-based functionally graded composites [
37]. In contrast, a decrease in wear rate was observed with decreasing abrasive particle size, which can be attributed to the reduced penetration depth of finer abrasive particles into the surface.
In this study, the effects of sliding speed and sliding distance on the wear rate were found to be more limited. A slight decrease in wear rate was observed with increasing sliding speed, while a modest reduction in wear rate was detected with increasing sliding distance. This behavior can be associated with the gradual blunting of abrasive particles and the partial loss of their effective abrasive characteristics over time. These results indicate that the wear behavior of in situ ZrB2-reinforced functionally graded aluminum matrix composites is predominantly controlled by the reinforcement gradient and the applied load.
According to the main effect graph of the factors, the high levels of each factor indicate the optimum test conditions that provide the lowest wear rate. Based on this graph, the lowest wear rate in the study is achieved under the A
1B
1C
1D
3E
3 experimental conditions: Region A, 1000 grit abrasive grade, 1 N load, 7 m/s sliding speed, and 150 m sliding distance. In accordance with the Taguchi approach, the estimated average S/N ratio and its confidence interval should be calculated using Equations (11)–(13), considering the optimal parameter combination determined to validate the experiments [
35,
36]. Then, a validation experiment should be conducted under these experimental conditions, and the actual results obtained should be compared with the estimated values. If the results obtained from the validation experiment fall within the calculated confidence interval, this indicates that the experiments were conducted correctly and supports the validity of the model. However, if the results fall outside the confidence interval, it should be considered that an error may have been made in the experiments, and the repetition of the experiments should be evaluated. This comparison is critical for testing the reliability and consistency of the experimental design. In this study, the estimated and actual experimental results obtained for the A
1B
1C
1D
3E
3 experimental conditions are presented comparatively in
Table 6. The notation A
1B
1C
1D
3E
3 represents the optimal combination of factor levels determined from the Taguchi analysis. Here, A1 corresponds to composite Region A, B1 to an abrasive size of 18 µm, C1 to a load level of 1 N, D3 to a sliding speed of 7 m/s, and E3 to a sliding distance of 150 m.
where
is the estimated average S/N values, µ is the validation test average S/N values, F(f) is F ratio, Ve is error variance, n is number of tests under the given condition.For the optimum parameter combination A1B1C1D3E3 presented in the table, the estimated average S/N ratio was determined as −12.04 dB, corresponding to a wear rate of 4 × 10⁻³ mm3/m. At a 95% confidence level, the confidence interval for the S/N ratio was calculated to be between −14.45 and −9.64 dB, while the confidence interval for the wear rate ranged from 5.25 × 10⁻³ to 3.03 × 10⁻³ mm3/m. The average wear rate measured in the verification experiment was 4.60 × 10⁻³ mm3/m, with a corresponding S/N ratio of −13.26 dB. The fact that these experimental results fall within the calculated confidence intervals demonstrates that the experimental procedure was carried out correctly and that the predictions made using the Taguchi method are reliable. The obtained findings indicate that the optimum parameter combination effectively minimizes the wear rate and that the developed model operates with high accuracy.