Article

A Practical 1D Approach for Real-Time Prediction of Argon Flow and Pressure in Continuous Casting of Steel

Department of Mechanical Engineering, Inha University, Incheon 22212, Republic of Korea
*
Author to whom correspondence should be addressed.
Metals 2025, 15(9), 978; https://doi.org/10.3390/met15090978 (registering DOI)
Submission received: 3 June 2025 / Revised: 20 August 2025 / Accepted: 26 August 2025 / Published: 1 September 2025

Abstract

The pressure and flow rate of an argon line embedded within a stopper rod serve as useful industrial indicators and control factors for mitigating air aspiration into the Submerged Entry Nozzle (SEN) during the continuous casting of steel. This manuscript investigates several challenges associated with interpreting monitored argon line pressures and gas flow rates, including variations in gas pressure during delivery, actual volumes of gas entering the nozzle, argon leakage, and air aspiration. To address these issues, a new one-dimensional (1D) analytical model of compressible argon flow in the stopper rod was developed, incorporating gas dynamics and heat transfer. This concise 1D model was validated using data from a continuous casting simulator (CCS) employing a low-melting-point Bi-Sn alloy (melting point 137 °C). Pilot trials were conducted to replicate various industrial casting scenarios, generating datasets for model validation and demonstration of real-time operation. The 1D model predictions were compared with those from a CFD-based compressible flow model under CCS operating conditions. Following validation, parametric studies were conducted to explore realistic industrial scenarios (e.g., gas flow rate < 5 SLPM, nozzle diameter < 5 mm), including extreme conditions such as air aspiration and choking: a critical nozzle diameter (1.223 mm) corresponds to choked flow, limiting the maximum achievable gas flow rate to 5 SLPM. Additionally, the real-time prediction capabilities of the model were demonstrated using measured argon line pressures and flow rates from CCS trials. The proposed 1D model thus provides a practical tool for accurately interpreting SEN flow conditions from monitored argon pressures and effectively estimating argon bubble injection by clarifying actual gas pressures and flow rates at the stopper injection point.

Graphical Abstract

1. Introduction

Injection of inert gas during metallurgical processes is a popular method for diverse purposes. In steelmaking, argon injection is commonly used for agitating liquid steel pool, removing impurities (e.g., ladle/tundish refining and degassing process) or controlling chemical reactions (e.g., Argon Oxygen Decarburization process). In the continuous casting of steel, argon injection is an important casting parameter owing to its effectiveness against air aspiration and clogging in the Submerged Entry Nozzle (SEN), which delivers liquid steel from a tundish to a bottomless mold. It has been empirically demonstrated that argon injection helps to mitigate nozzle clogging, and several possible mechanisms have followed to explain the relation between argon injection and nozzle clogging. A convincing mechanism for the relation between argon injection, air aspiration, and clogging is that argon injection alleviates nozzle clogging by lessening air aspiration [1,2]. Since air aspiration due to severe negative pressure in the nozzle (below atmospheric pressure) leads to re-oxidation of dissolved deoxidizer (Al, Si, or Mn) or alloyed elements and nozzle clogging consequently, keeping the nozzle pressure positive is crucial during the process [3].
According to previous studies, both experimental and numerical works have shown that negative pressure can develop near the partially closed opening regulated by a flow control system such as a slide-gate or a stopper rod and argon injection can be an effective measure to increase the minimum pressure in the nozzle [4,5,6]. Argon is introduced in the SEN in a different way depending on the flow control system. While argon is typically injected at the tip of the stopper nose which regulates the inlet of the SEN in stopper-rod systems, argon is blown from porous nozzle walls before the flow passes through the partly open gate in sliding gate systems [7]. In the case of stopper-rod systems, the pressure and flow rate of the argon line delivering argon gas are monitored during industrial practices. Particularly, the argon line pressure is a useful indicator for air aspiration because the outlet of the argon line in the stopper is closely located near the concentric opening where the minimum pressure is expected in the SEN. As the argon line may turn into an easy path for air to penetrate the system, it is important to minimize air aspiration by keeping the argon line pressure positive [5,8]. Thus, the argon flow rate is controlled by an operator depending on the monitored argon line pressure in case negative pressure is detected.
In general, the monitored argon line pressure and flow rate are measured at room temperature before the gas enters the stopper: They are typically measured far from the caster in many cases. Thus, substantial thermal expansion of gas and corresponding variation in pressure is expected during the delivery of gas through the argon line with possible pressure losses. Furthermore, the gas volume is affected by air aspiration and argon leakage through the refractory wall of the stopper depending on the extent of the pressure difference between the argon line and atmospheric pressure. It has been reported that too high of an argon line pressure makes argon gas leak through the porous stopper wall while severe negative argon line pressure sucks air into the system [5,8]. Thus, the total mass of the gas flow is not likely to be conserved in the argon line if the pressure difference with the atmospheric pressure is large.
To minimize this issue, a restrictor in the argon line has been introduced to control the axial pressure distribution [8,9]. Typically, a porous plug-type or thick plate orifice-type restrictor is deployed to increase the upstream pressure through a pressure drop. A main role of the restrictor is separating the low- and high-pressure regions in the argon line by introducing a substantial pressure drop in between. The extent of the generated pressure drop is designed to compensate for the negative pressure transmitted from the nozzle. Therefore, a major variation in gas pressure is expected near the restrictor. Also, the type of injection at the outlet of the argon line strongly influences the gas flow [10,11,12]. Diverse designs for the injection type including a single nozzle type or a porous plug type have been developed and are popularly used these days for different demands from steelmakers such as controlling the distribution and size of injected bubbles as well as ensuring that the argon line pressure is positive. A considerable change in gas velocity, pressure, and temperature accompanies the gas passing through the outlet according to the type and its design factors such as the nozzle diameter or the porosity of the plug.
Considering the addressed issues described above, it is appropriate to presume that the monitored gas flow rate and pressure do not necessarily need to be the same as the actual gas flow rate going into the system and the pressure in the SEN. Therefore, a mathematical model to analyze the actual gas flow in the argon line is required to comprehend the monitored signals from the argon line and ultimately to control the SEN pressure through argon injection.
Despite the usefulness of monitored argon line data in casting processes, research on the gas flow in stoppers has mainly been implemented from a design perspective by refractory suppliers. In contrast to the very few research paper publications on this subject, numerous patents can be found for argon line designs including bore diameters, injection types, restrictor types, and connections [8,9,13,14]. However, the aforementioned issues have not been elucidated as patents mainly focus on the description of new designs rather than investigating the underlying mechanisms, as research papers do. To the best of the author’s knowledge, discrepancies between monitored and actual pressures and gas flow rates, as well as their dependence on argon line design and operating conditions, have not been addressed in research papers to date.
Therefore, a concise 1D analytical model for gas flow in the argon line is proposed in this manuscript to estimate the nozzle pressure and the actual gas flow rate injected into the system based on the monitored flow rate and argon line pressure, which are commonly available in steel plants. The model calculates the gas flow in the argon line with thermal and volumetric expansion as a compressible flow based on gas dynamics and convective heat transfer. Argon leakage and air aspiration are predicted together using Darcy’s law. Using measured argon line pressures and flow rates from CCS trials, we demonstrated the real-time prediction capabilities of the proposed 1D model. It accurately predicts nozzle pressure and argon flow rate in real time, showing strong potential as an online monitoring tool for capturing rapid changes in casting conditions. The developed model is implemented to answer important questions in the argon line during continuous casting as follows:
  • Pressure loss in argon line.
  • Impact of thermal expansion on gas flow in argon line.
  • Amount of air aspiration/argon leakage.
  • Actual gas volume flow rate injected to the system.
  • Influence of argon line design factors on the argon line pressure.

2. Model Description: 1D Argon Line Model

Figure 1 shows a schematic of the 1D argon line model developed in this work. This new argon line model is composed of five sections connected in serial: (1) gas supply conduit before entering the stopper, (2) axial bore in the stopper including a possible restrictor, (3) gas outlet in the stopper nose, (4) metal–gas interface at the gas bubbling, (5) flow in the SEN. Five points are defined between each section to estimate the variation in gas pressure and flow properties as shown in Figure 1. Two more intermediate points could be introduced at both ends of the restrictor in case it is used.
This 1D model can be run with a monitoring system by feeding the monitored readings: The model estimates the actual gas flow rate being injected and nozzle pressure based on the monitored argon line pressure and gas flow rate as known values. The calculation sequence aligns with the direction of gas flow. It calculates the difference in pressure and gas flow rate between two points sandwiching each section by modeling the important phenomena described in Figure 1. Governing equations for predicting each key phenomena are described in the following section.

2.1. Gas Supply Conduit Before Entering the Stopper (P1–P2 Section in Figure 1)

Argon gas is supplied through a conduit connecting a pressurized gas tank to a stopper. In this section, the pressure loss by wall friction is considered to take into account the distance between a tank and a caster. The gas flow is treated as an isothermal incompressible flow since it is likely to be a subsonic flow in room temperature. Thus, the flow rate is assumed to be constant in this section (Q1 = Q2). The Darcy–Weisbach equation is applied to calculate the wall friction loss in the gas supply conduit as follows:
P 1 2 = 1 2 ρ V 2 × f L D
where ρ is the density of the gas, V is the cross-section averaged velocity of the gas, f is the friction factor that depends on the Reynolds number and relative roughness ( ε D ) of the wall, L is the length of conduit, and D is the conduit diameter. The friction factor f is obtained by the explicit relations of the Moody diagram as follows:
f = 64 R e
For laminar flow (Re < 2300) and transition/turbulent flow (Re > 2300),
f = 1.322 ln ε D 3.7 + 7 R e 0.9 2
where the Reynolds number ( R e ) for the gas flow in the conduit is calculated by
R e = ρ V D μ = 4 m ˙ π μ D
where μ is the viscosity of the gas and m ˙ is the mass flow rate of the gas.
The gas flow in the conduit is assumed to be laminar flow considering a typical range of argon flow rate (0–10 SLPM). Using Equation (1) with a suitable friction coefficient f , the pressure loss by wall friction between the monitored point P1 and the inlet point P2 (i.e., P 1 2 = P 1 P 2 ) is calculated.

2.2. Axial Bore in Stopper (P2–P3 Section in Figure 1)

Once the gas flow enters the stopper, the supplied argon gas heats up gradually by the hot wall and expands accordingly while it flows into the stopper bore. As certain gas expansion is expected by the operating temperature of the system, the compressibility effects must be treated properly with convective heat transfer to predict the flow properties of the gas accurately. Therefore, the flow is assumed to be a compressible flow in this section.
In this argon line model, the variation in gas temperature is estimated first by modeling convection between the stopper wall and gas flowing into the axial bore. Considering the process of industrial practice that a stopper is dipped in a tundish filled with molten steel for several hours, it is reasonable to assume that the stopper temperature is the same as the liquid metal temperature (i.e., pouring temperature) by reaching a thermal equilibrium with the surrounding molten steel. Therefore, the heat transfer in the argon line is treated as convective heat transfer under a constant wall temperature.
Based on the energy balance, the gas temperature can be obtained as follows under the assumption of ideal gas and a constant heat capacity c p , which are valid for argon gas [15]:
T s T x T s T i = exp p x m ˙ c p h ¯
where T s is the surface temperature of the hot stopper inner wall, T i is the gas temperature at inlet of stopper bore, T x is the axial temperature profile along the bore, p is the perimeter of the bore, m ˙ is the mass flow rate of gas, c p is the gas heat capacity, and h ¯ is the average heat transfer coefficient. This equation is applicable for compressible flows if the variation in heat capacity is insignificant such as argon gas [16].
For convective heat transfer problems, it is crucial to select a proper correlation for the heat transfer coefficient h ¯ depending on its flow condition. There are two criteria for selecting h ¯ : (1) laminar or turbulence, (2) fully developed or including entrance length. Considering the typical range of gas flow rate during continuous casting (0–10 SLPM), the flow regime is expected to be between laminar ( R e < 2300) and transition regimes (2300 < R e < 10 4 ) in the argon line. Also, considering the configuration of the argon supply system (>>1 m length) and stopper dimension (~1 m length), it is reasonable to assume that the gas flow has a fully developed velocity profile before entering the stopper while the gas temperature profile develops in the stopper (i.e., thermal entry problem). Therefore, the heat transfer coefficient must include the effect of thermal entry length. The average heat transfer coefficient h ¯ considering the thermal entry length is obtained from a Nusselt number ( N u ¯ ) correlation below based on the Reynolds ( R e ) and Prandtl numbers ( P r ) [15]:
For laminar flow (Re < 2300),
N u ¯ = 1.86 R e P r L D 1 / 3 μ μ s 0.14
For transition/turbulent flow (2300 < R e < 10 4 ),
N u ¯ = f 8 R e 1000 P r 1 + 12.7 f 8 1 2 ( P r 2 3 1 )
where the Nusselt number N u ¯ D is
N u ¯ = h ¯ D k
D is the diameter of the stopper bore, k is the gas thermal conductivity, μ is the gas viscosity, and μ s is the gas viscosity at bore inner wall. The friction coefficient f is calculated by Equations (2) and (3), according to its flow regime. Once the average heat transfer coefficient h ¯ is calculated with Equation (6) or (7), the temperature profile of the argon gas in the axial bore T x is obtained by Equation (5).
The estimated increase in gas temperature by convection leads to thermal expansion in the axial stopper bore and causes corresponding variations in the pressure, velocity, and density of gas flow during delivery. Thus, compressibility must be counted through governing equations including the continuity, momentum equations and ideal gas law as a compressible flow. The predicted gas temperature at the end of the axial bore (Temperature at Point 3 in Figure 1, T 3 ) through Equation (4) is applied to obtain the Mach number at Point 3 ( M 3 ) using Equation (9) below. The Mach number at the inlet of the axial bore M 2 can be calculated with the gas flow rate Q 2 and temperature T 2 at Point 2 which are assumed to be the same as the values at the measurement point (Point 1 in Figure 1).
T 3 T 2 = M 3 2 M 2 2 1 + γ M 2 2 2 1 + γ M 3 2 2
where γ is the specific heat ratio of the gas. Using the obtained Mach numbers M 2 and M 3 , the variations in other flow properties can be calculated by the equations below:
P 3 P 2 = 1 + γ M 2 2 1 + γ M 3 2
V 3 V 2 = M 3 2 M 2 2 1 + γ M 2 2 1 + γ M 3 2
ρ 3 ρ 2 = M 2 2 M 3 2 1 + γ M 3 2 2 1 + γ M 2 2 2
where P is the gas pressure, V is the gas velocity, and ρ is the gas density. Equations (10)–(12) provide the flow properties at the outlet of the argon line before entering the gas outlet (Point 3 in Figure 1).

2.3. Restrictor in Stopper (P2–P3 Section in Figure 1)

In the case that a restrictor is located in the argon line to increase the argon line pressure, the pressure drop by the restrictor needs to be estimated. A suitable model for the pressure drop ( P ) can be applied depending on the type of the restrictor. For porous plug types, Darcy’s law can be applied as follows [17]:
P = Q g a s μ L κ A
where Q g a s is the gas flow rate and A is the cross-sectional area. The length ( L ) and permeability ( κ ) of the porous plug are the design parameters to control the magnitude of the pressure drop. For thick plate orifice types, the correlation described below is applied for the model [18]:
P = ρ V 2 2 A b o r e ν A o r i f i c e 1 2
where ν = 0.63 + 0.37 A o r i f i c e A b o r e 3 . The primary function of the restrictor is to generate a positive gas pressure upstream, thereby preventing air aspiration. Therefore, any restrictor design can be employed as long as it produces a sufficient pressure drop to counteract the negative pressure transmitted from the nozzle.

2.4. Air Aspiration and Argon Leakage in Stopper (P2–P3 Section in Figure 1)

The model estimates the amount of air aspiration or argon leakage by assuming the stopper wall is porous. A Darcy’s law-based equation is employed to calculate the gas flow through the wall as a function of the pressure gradient across it [4].
Q = κ π ( P i n 2 P o u t 2 ) μ P i n l n ( R o u t R i n ) × L
where refractory wall porosity κ = 1 × 10 14   m 2 [19], R i n is the inner bore diameter, R o u t is the stopper diameter, and L is the effective length of aspiration or leakage. Since air aspiration occurs above the tundish level, while argon leakage may occur along the entire stopper length, the effective length L is defined accordingly in the model.

2.5. Gas Outlet of Stopper (P3–P4 Section in Figure 1)

The delivered gas through the argon line is injected through the outlet by a different injection type such as a single nozzle or a porous plug. Typically, the cross-sectional area is reduced to control the bubble size through a single nozzle diameter or pores in the porous plug and a considerable pressure drop accompanying variations in other flow properties occurs simultaneously. For single nozzle types, compressibility needs to be considered as the gas can be accelerated considerably (i.e., >0.3 M) depending on the hole diameter. Likewise for the governing equations in the axial bore section, the compressibility is considered properly through the continuity, energy equations and the ideal gas law as a compressible fluid. The derivation and applied assumptions are described elsewhere [20]. Once the Mach number at the injection point M 4 (Point 4 in Figure 1) is calculated from the ratio of cross-sectional area A 4 / A 3 and M 3 in the previous section using Equation (16), variations in other flow properties such as pressure, temperature, and density are calculated by equations as follows (Equations (16)–(19)):
A 4 A 3 = M 3 M 4 1 + γ 1 2 M 4 2 1 + γ 1 2 M 3 2 γ + 1 2 γ 1
P 4 P 3 = 1 + γ 1 2 M 3 2 1 + γ 1 2 M 4 2 γ γ 1
T 4 T 3 = 1 + γ 1 2 M 3 2 1 + γ 1 2 M 4 2
V 4 = M 4 γ R T 4
For porous plug types, Darcy’s law is applied again to calculate the pressure drop occurring in the stopper nose under a constant gas flow rate as an incompressible flow. Thus, the same equation (Equation (13)) can be applied for the variation in pressure.

2.6. Gas Bubbling at the Metal–Argon Interface (P4–P5 Section in Figure 1)

When the argon gas is injected into the SEN through the argon line gas outlet, interfacial tension between the argon gas and liquid steel creates a capillary pressure, influencing the gas pressure. This capillary pressure at the argon–steel interface is calculated using the Young–Laplace equation:
Δ P = P 4 P 5 = 2 σ r n o z z l e
The capillary pressure depends on the radius of the nozzle outlet ( r n o z z l e ). As indicated by Equation (20), decreasing the nozzle radius increases the pressure difference Δ P between the outlet P 4 and the nozzle pressure P 5 . After determining P 4 via Equation (17), the liquid steel pressure within the SEN P 5 is obtained by considering this pressure jump due to interfacial tension. Compressibility is not considered in this section (Q5 = Q4).
Consequently, the monitored gas flow rate (Q1) and pressure (P1) at the measurement point under standard conditions (atmospheric pressure and room temperature) are converted to the gas flow rate (Q5) and pressure at the stopper tip (P5) using the 1D argon line model.

3. Validation of the 1D Model

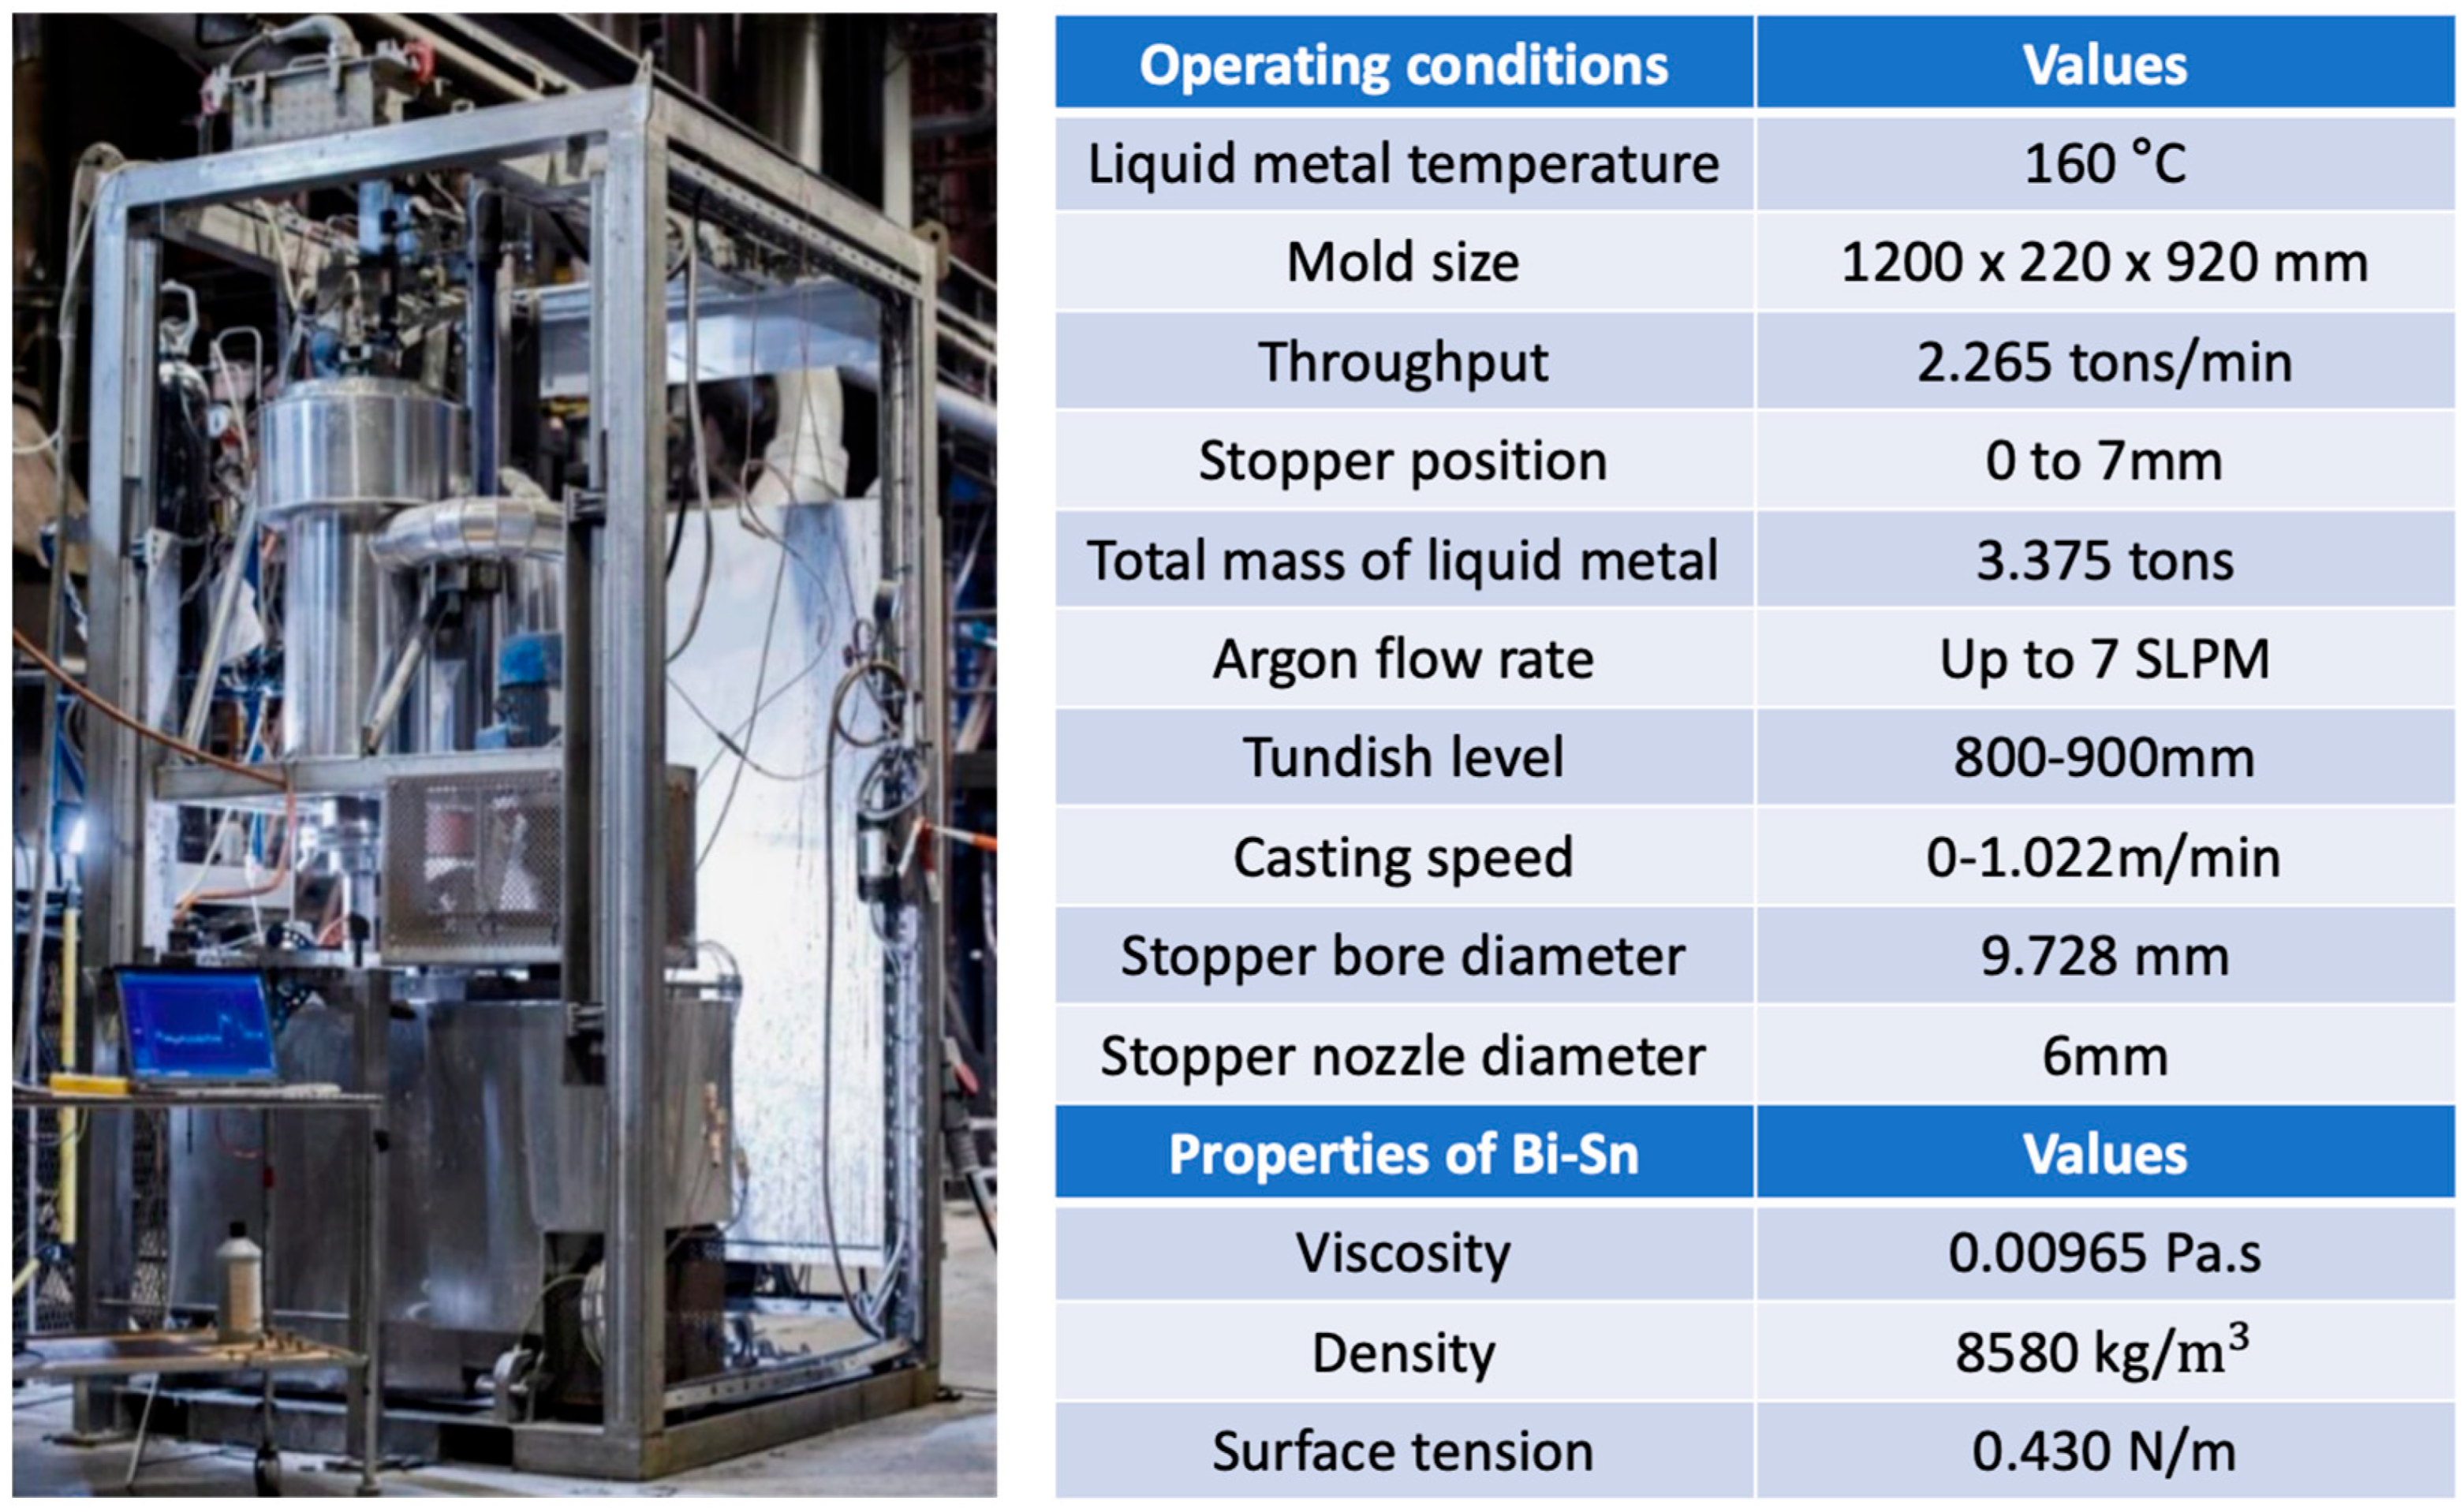
The proposed 1D argon line model was applied to a full-scale continuous casting simulator (CCS) using a Bismuth–Tin alloy (Figure 2). Due to its low melting point (137 °C), this simulator operates at lower temperatures (150–200 °C) than those used in continuous casting of steel, while maintaining similar properties of liquid steel. Detailed information on the liquid metal model is provided in the previous publication [5].
The stopper dimensions, operating conditions, and the measured back pressure from a CCS trial were used as inputs for the 1D argon line model. Model predictions of pressure, temperature, and density during gas delivery were validated against a CFD-based compressible flow model. The computational domain of the CFD model, shown in Figure 3, consists of three sections—argon conduit, stopper bore, and stopper nose—based on the CCS stopper dimensions. Each section was modeled as 2D axisymmetric.
Mass, momentum, and energy conservation equations were solved in a coupled manner to predict the variation in argon flow properties (i.e., pressure, velocity, and density fields) with its temperature. These given governing equations enable the estimation of pressure loss, convective heat transfer, and volumetric and thermal expansion of gas flow during gas delivery.
Mass conservation
ρ t + · ρ u = 0
Momentum conservation
ρ u t + · ρ u u = P + · τ + ρ g
Energy conservation
( ρ C p T ) t + · ρ C p T u = · ( k T )
Ideal gas law
ρ = P R T
To account for compressibility effects in the CFD model, the density of argon gas ρ was modeled using the ideal gas law (Equation (24)). A pressure-based solver integrated with the ideal gas law was employed to numerically capture compressibility. The computational mesh was refined with careful attention to boundary layer resolution. In particular, the cell size near the wall was determined based on the dimensionless wall distance y + , with the first layer set to y + 1 (approximately 0.07 mm) to resolve the viscous sublayer ( 0 < y + < 5 ) and capture pressure loss accurately. Boundary conditions were defined using data from a CCS trial. The inlet shown in Figure 3 was set as a mass flow rate boundary with 4 SLPM of argon gas (1.109 × 10⁻⁴ kg/s). The stopper bore wall is modeled as an isothermal wall boundary at 160 °C, matching the measured liquid metal temperature during the trial.
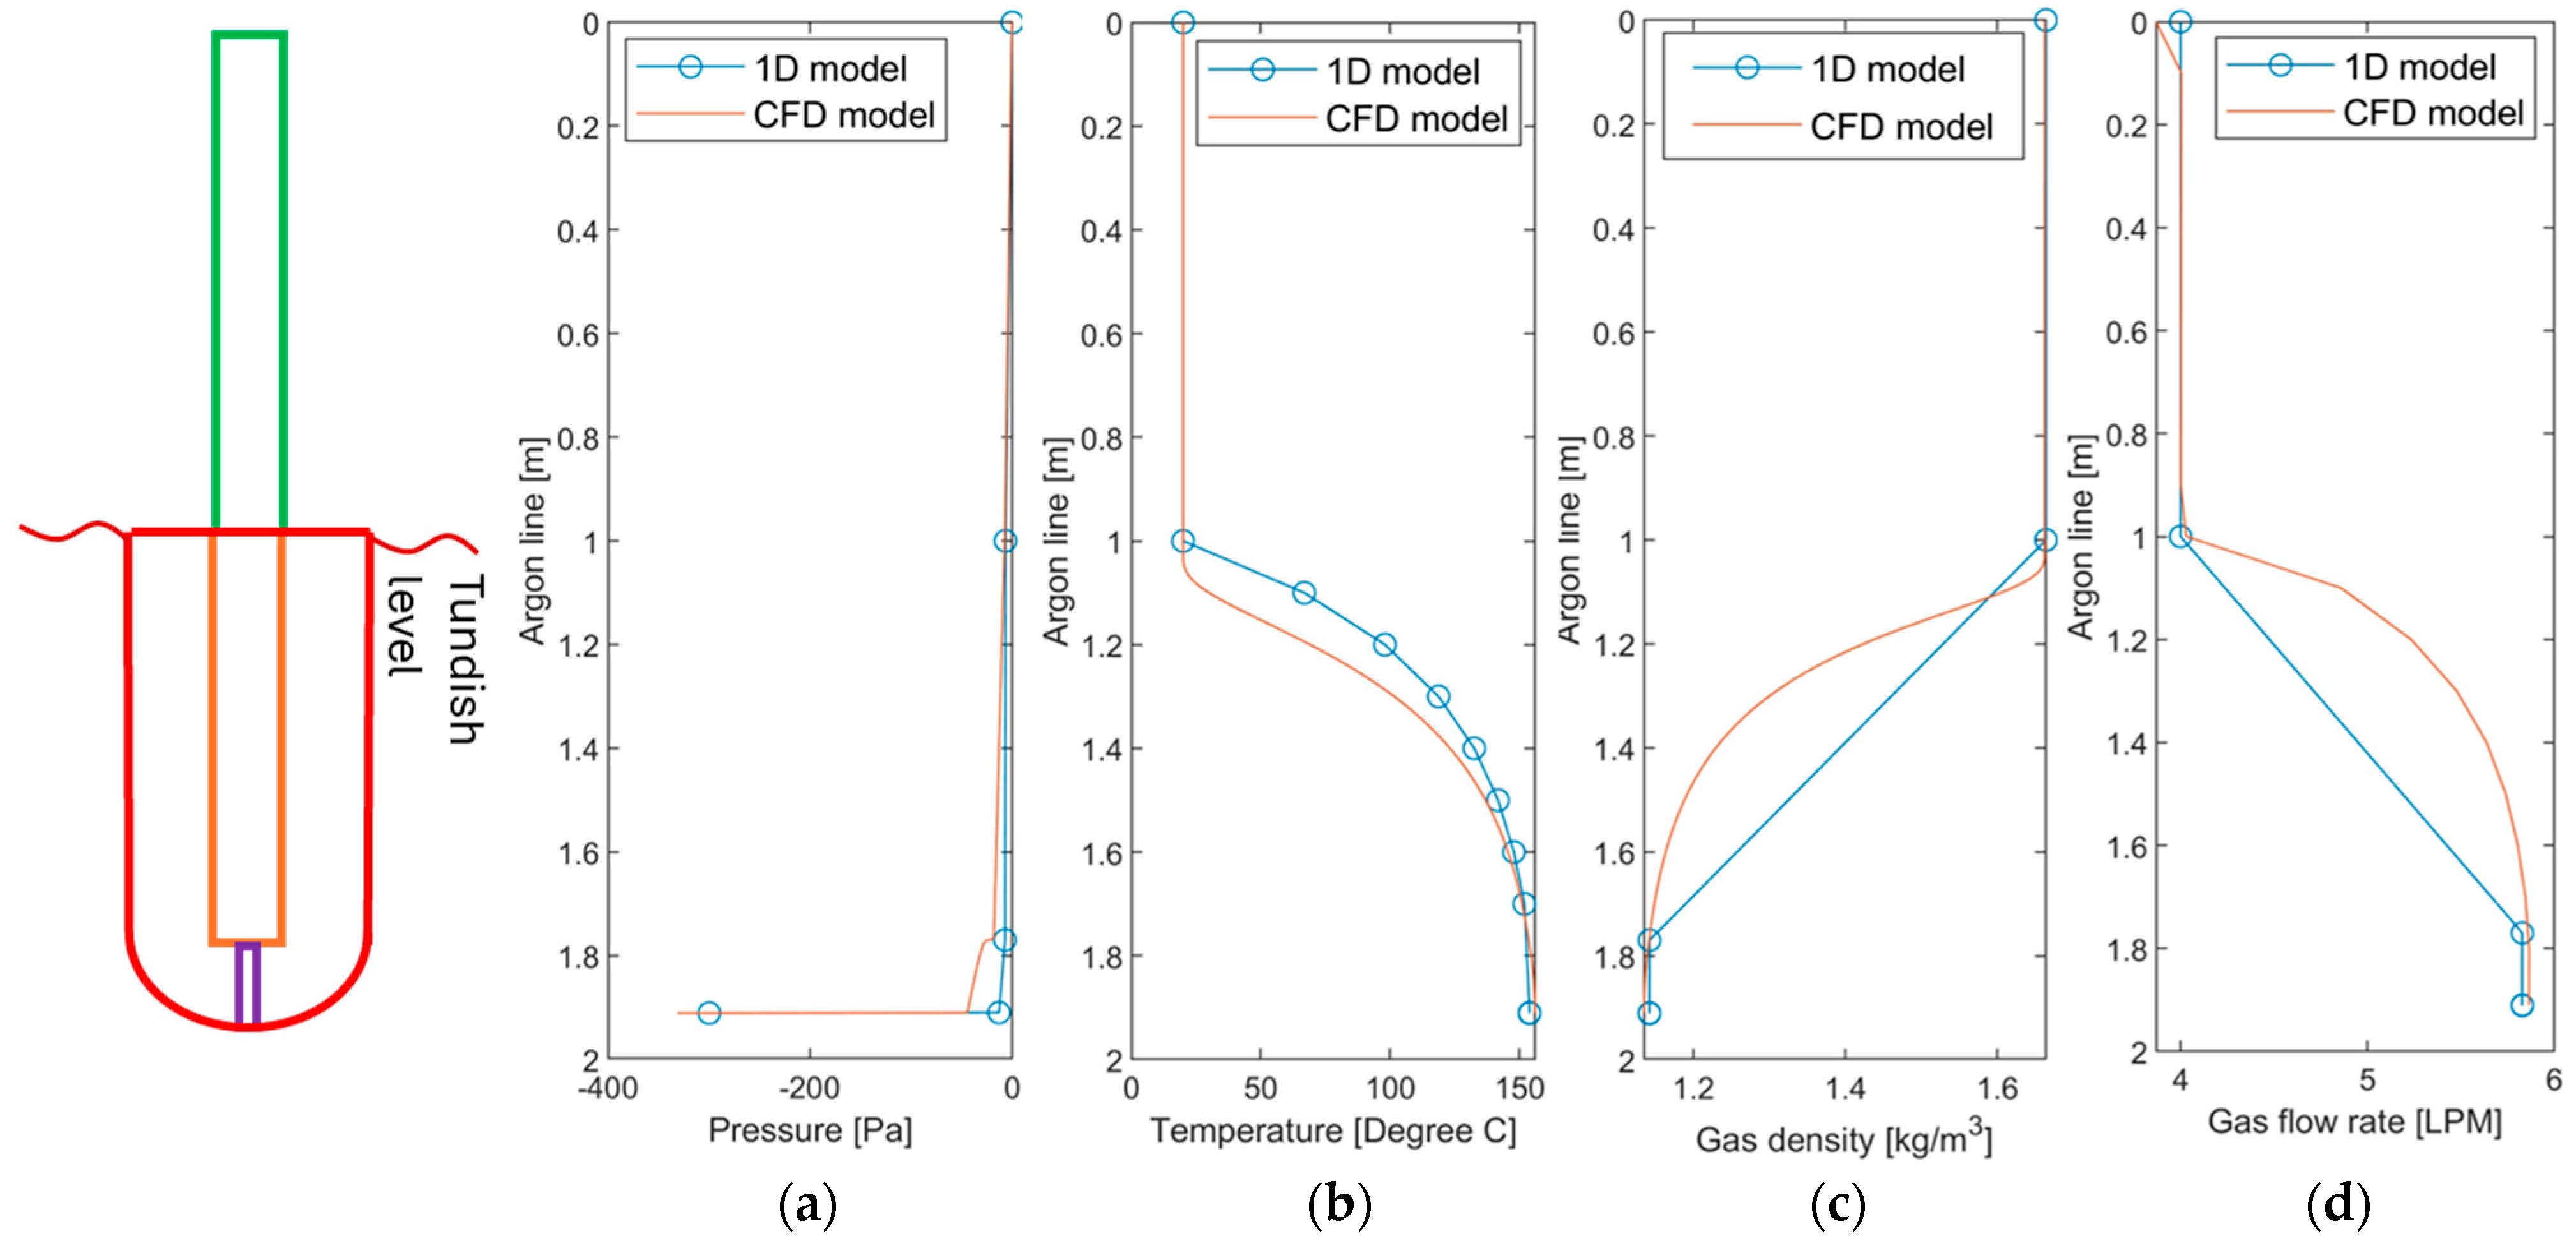
Figure 4 compares the results of the 1D argon line model with those of the CFD-based compressible flow model. The horizontal axis represents the position along the argon line, with reference to the schematic of the stopper rod shown on the left. A position of 0 m corresponds to the inlet of the argon conduit, while 1 m marks the beginning of the stopper bore section. The variation in flow properties along the argon line is predicted in the 1D model by linearly interpolating values between discrete calculation points, as illustrated in Figure 1. Each calculated point is indicated by a circular marker in Figure 4. Overall, the pointwise results from the 1D model show good agreement with the CFD predictions.
Both models predict a small pressure loss during gas delivery, with an overall drop of approximately 300 Pa. The primary pressure drop occurs at the stopper tip, where capillary pressure is applied at the metal–argon interface. This capillary effect is accounted for in the CFD model through post-processing, since the liquid metal phase is not included in the simulation. Pressure losses in the argon conduit and stopper bore sections are minimal due to low gas velocity. The predicted gas velocity in the argon line conduit remains within the laminar flow regime, at approximately 0.9 m/s.
For the temperature profile, the 1D model includes additional calculation points within the stopper bore section to capture the nonlinear temperature rise of the gas. As shown in Figure 4b, the 1D predictions closely follow the nonlinearly increasing temperature trend observed in the CFD results. Both models indicate that the argon gas is heated to approximately 150 °C, which approaches the measured liquid metal temperature of 160 °C. As expected, the gas density decreases and the flow rate increases due to thermal expansion. The pointwise results from the 1D model show good agreement with the CFD predictions for temperature, density, and velocity.
One reason the pressure loss was relatively small in the CCS stopper is the absence of flow-restricting features. The stopper is simply designed with a straight bore of fixed diameter (d = 9.728 mm), without any specialized treatments commonly used in industrial systems. This design choice is due to the pilot caster’s use of a low-melting-point liquid metal, which allows operation at relatively low temperatures (e.g., 160 °C). As a result, a refractory stopper is not required, and an aluminum stopper is used instead. The non-porous nature of the aluminum material effectively prevents unintended air aspiration or gas leakage during argon delivery.
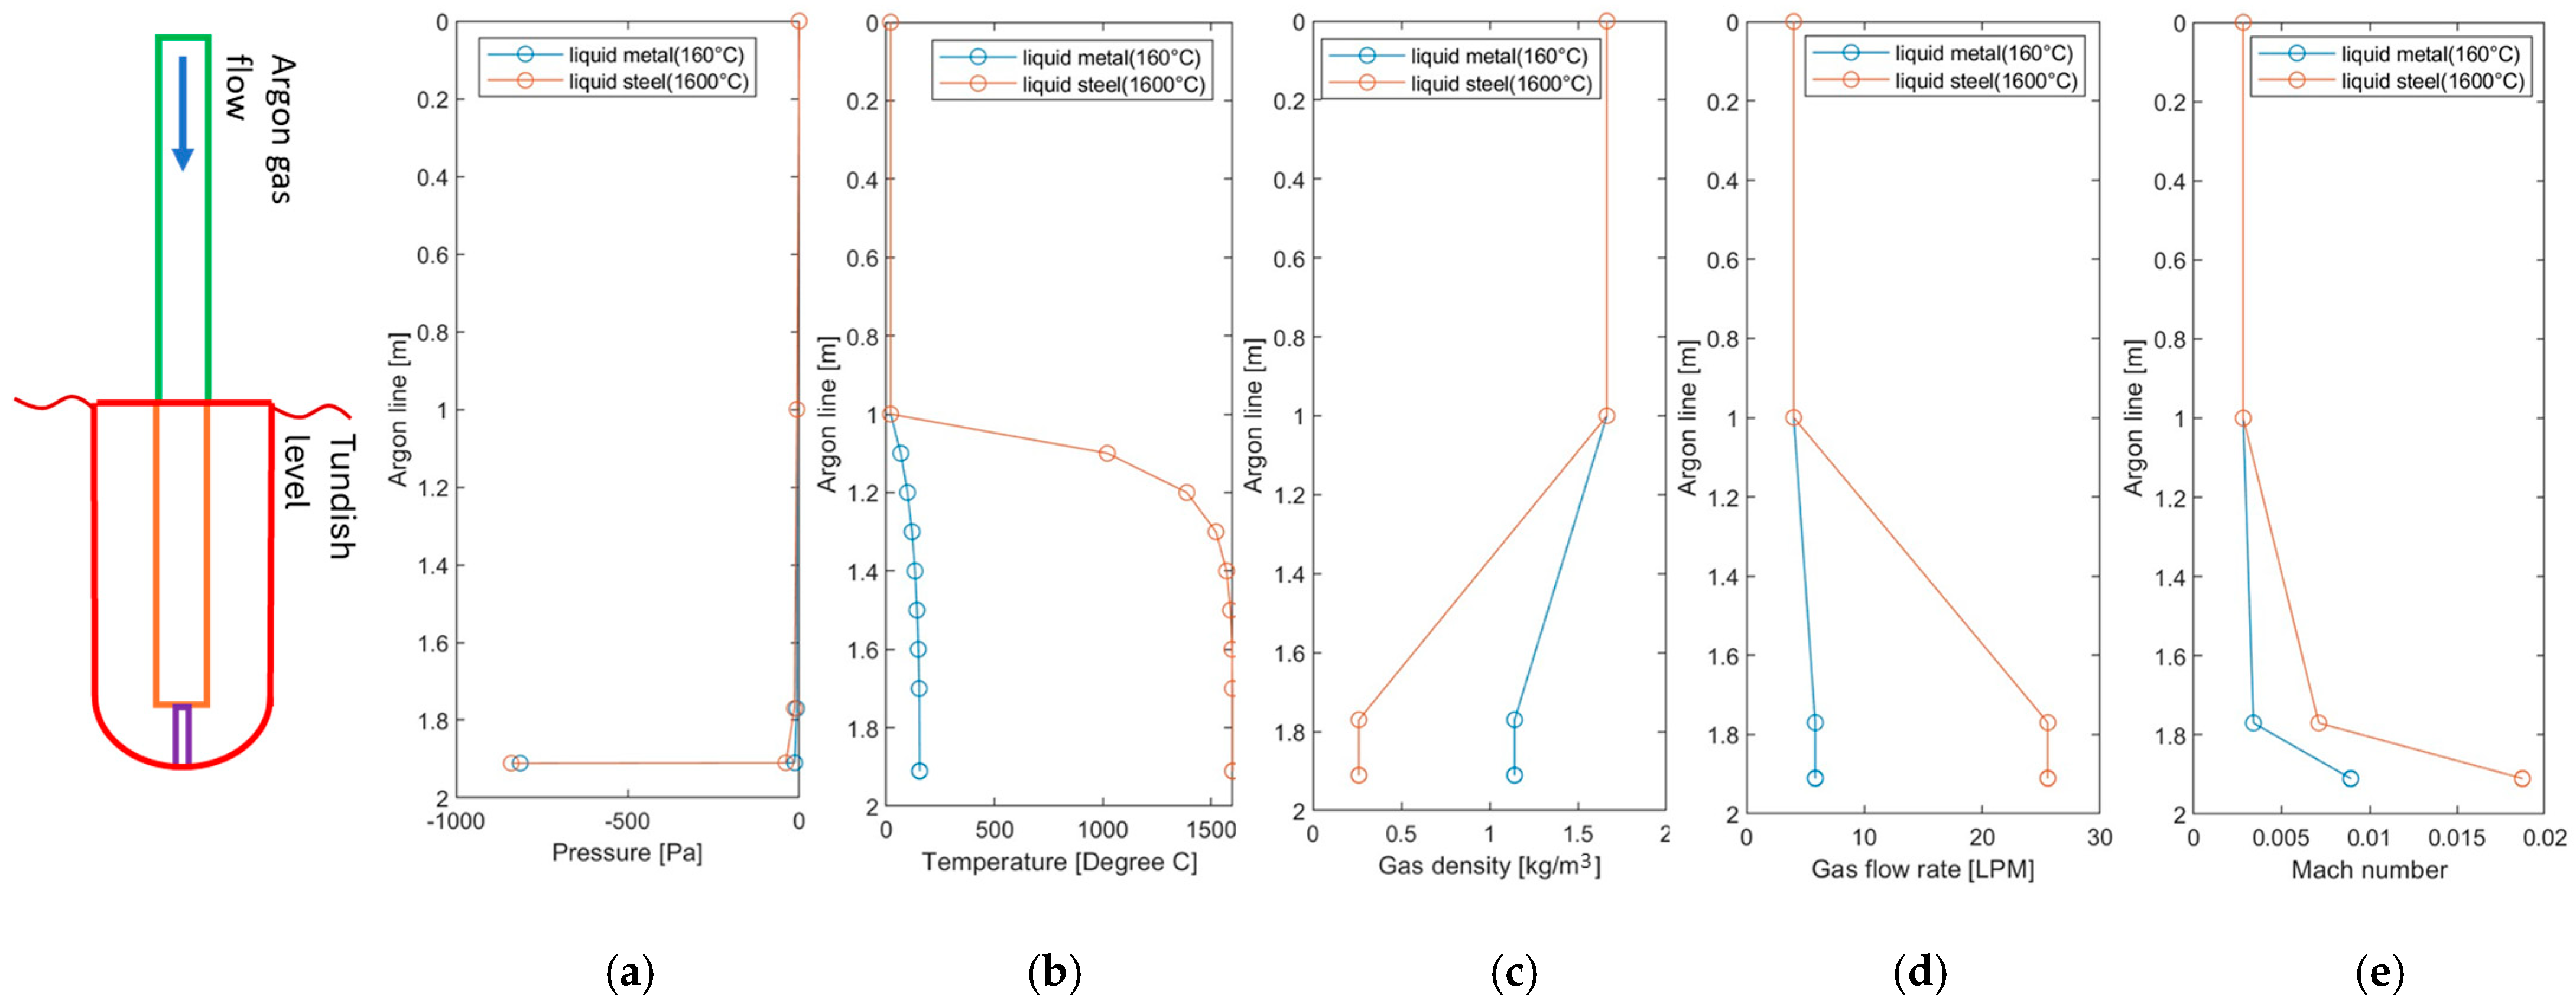
This unique configuration enabled the observation of cavitation within the SEN through stopper regulation, as reported in [5]. However, in industrial applications, such an argon line configuration can be problematic. Without a significant pressure drop across the stopper bore, a negative pressure generated in the SEN can transmit upstream into the argon line. As discussed in the Introduction, this creates a pathway for air aspiration into the caster when severe negative pressure develops. To prevent this, industrial stoppers often incorporate flow-restricting features such as a small nozzle for a stopper tip, porous plug, or mechanical restrictors [8]. Moreover, under actual steelmaking conditions, the system operates at much higher temperatures, approximately 1600 °C. The following results from the 1D model in Figure 5 examine the effect of operating temperature on argon flow properties, with all other conditions held constant.
The primary difference between the two cases is the effect of thermal expansion. As the argon gas enters the stopper bore, it is rapidly heated and gradually approaches the wall temperature through convective heat transfer. This wall temperature corresponds to the liquid metal temperature, according to the assumption made in Section 2.2. While the predicted pressure drop remains similar in both cases, noticeable differences are observed in gas density and flow rate due to thermal expansion.
The Mach number profile, which indicates compressibility of the flow, shows a sudden increase at the stopper nose because of the abrupt reduction in argon line diameter from 9.728 mm (stopper bore) to 6 mm (stopper tip nozzle diameter). However, the Mach number remains sufficiently low (M < 0.02) in both cases for the flow to be classified as incompressible. The nozzle diameter at the stopper tip largely determines the initial size of argon bubbles injected into the SEN. Since industrial stoppers can feature various argon line designs such as small tip nozzle diameters or porous plugs, these practical configurations are explored in the next section.

4. Parametric Study Using the 1D Argon Line Model

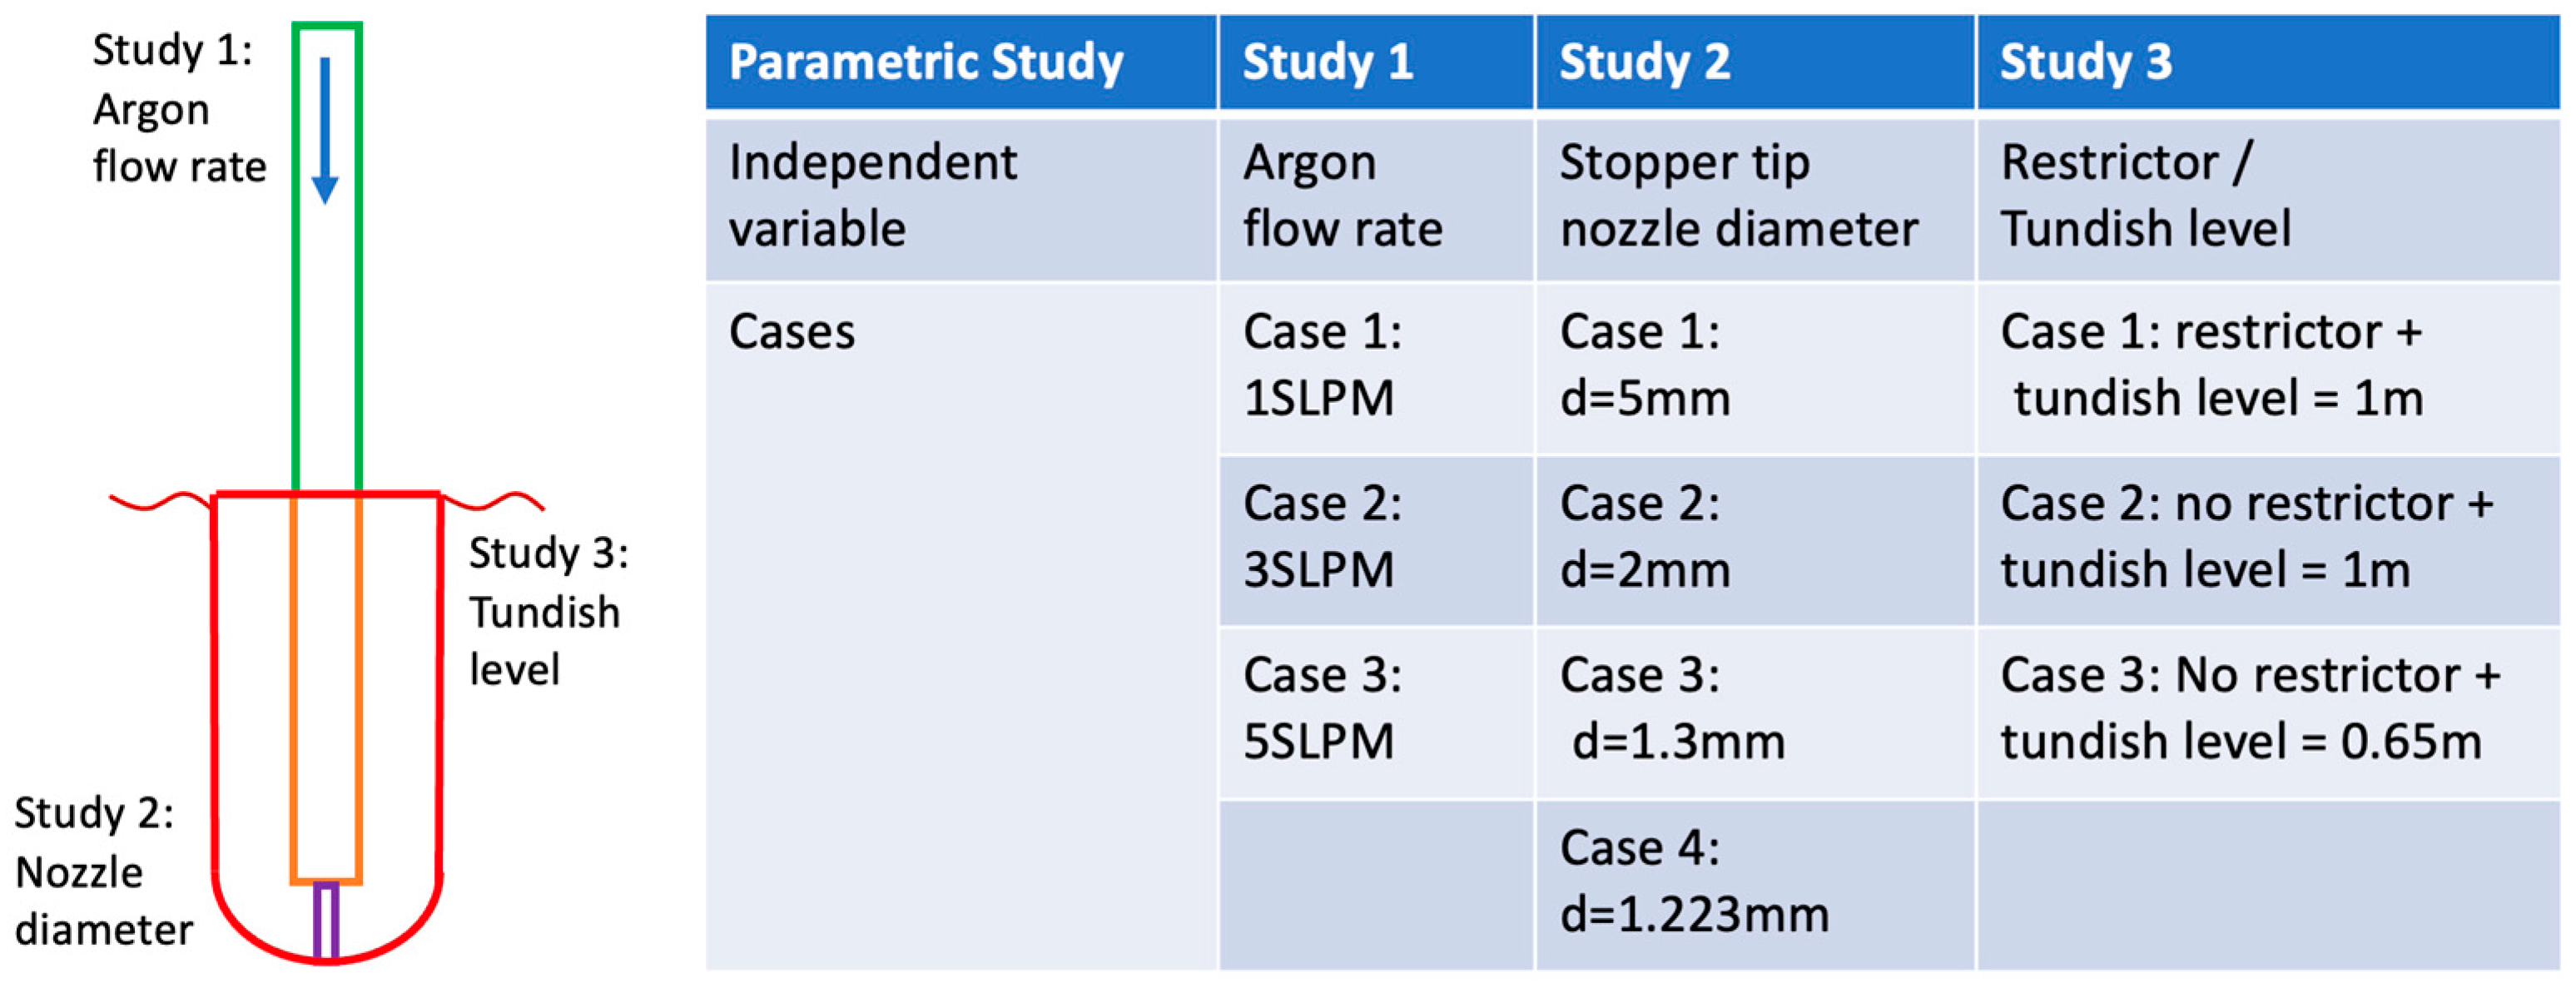
The validated 1D argon line model is applied to various industrial casting conditions to investigate the complex phenomena occurring within the argon line system. Three parametric studies are conducted based on the operating conditions summarized in Figure 6 and Table 1.

4.1. Effect of Gas Flow Rate

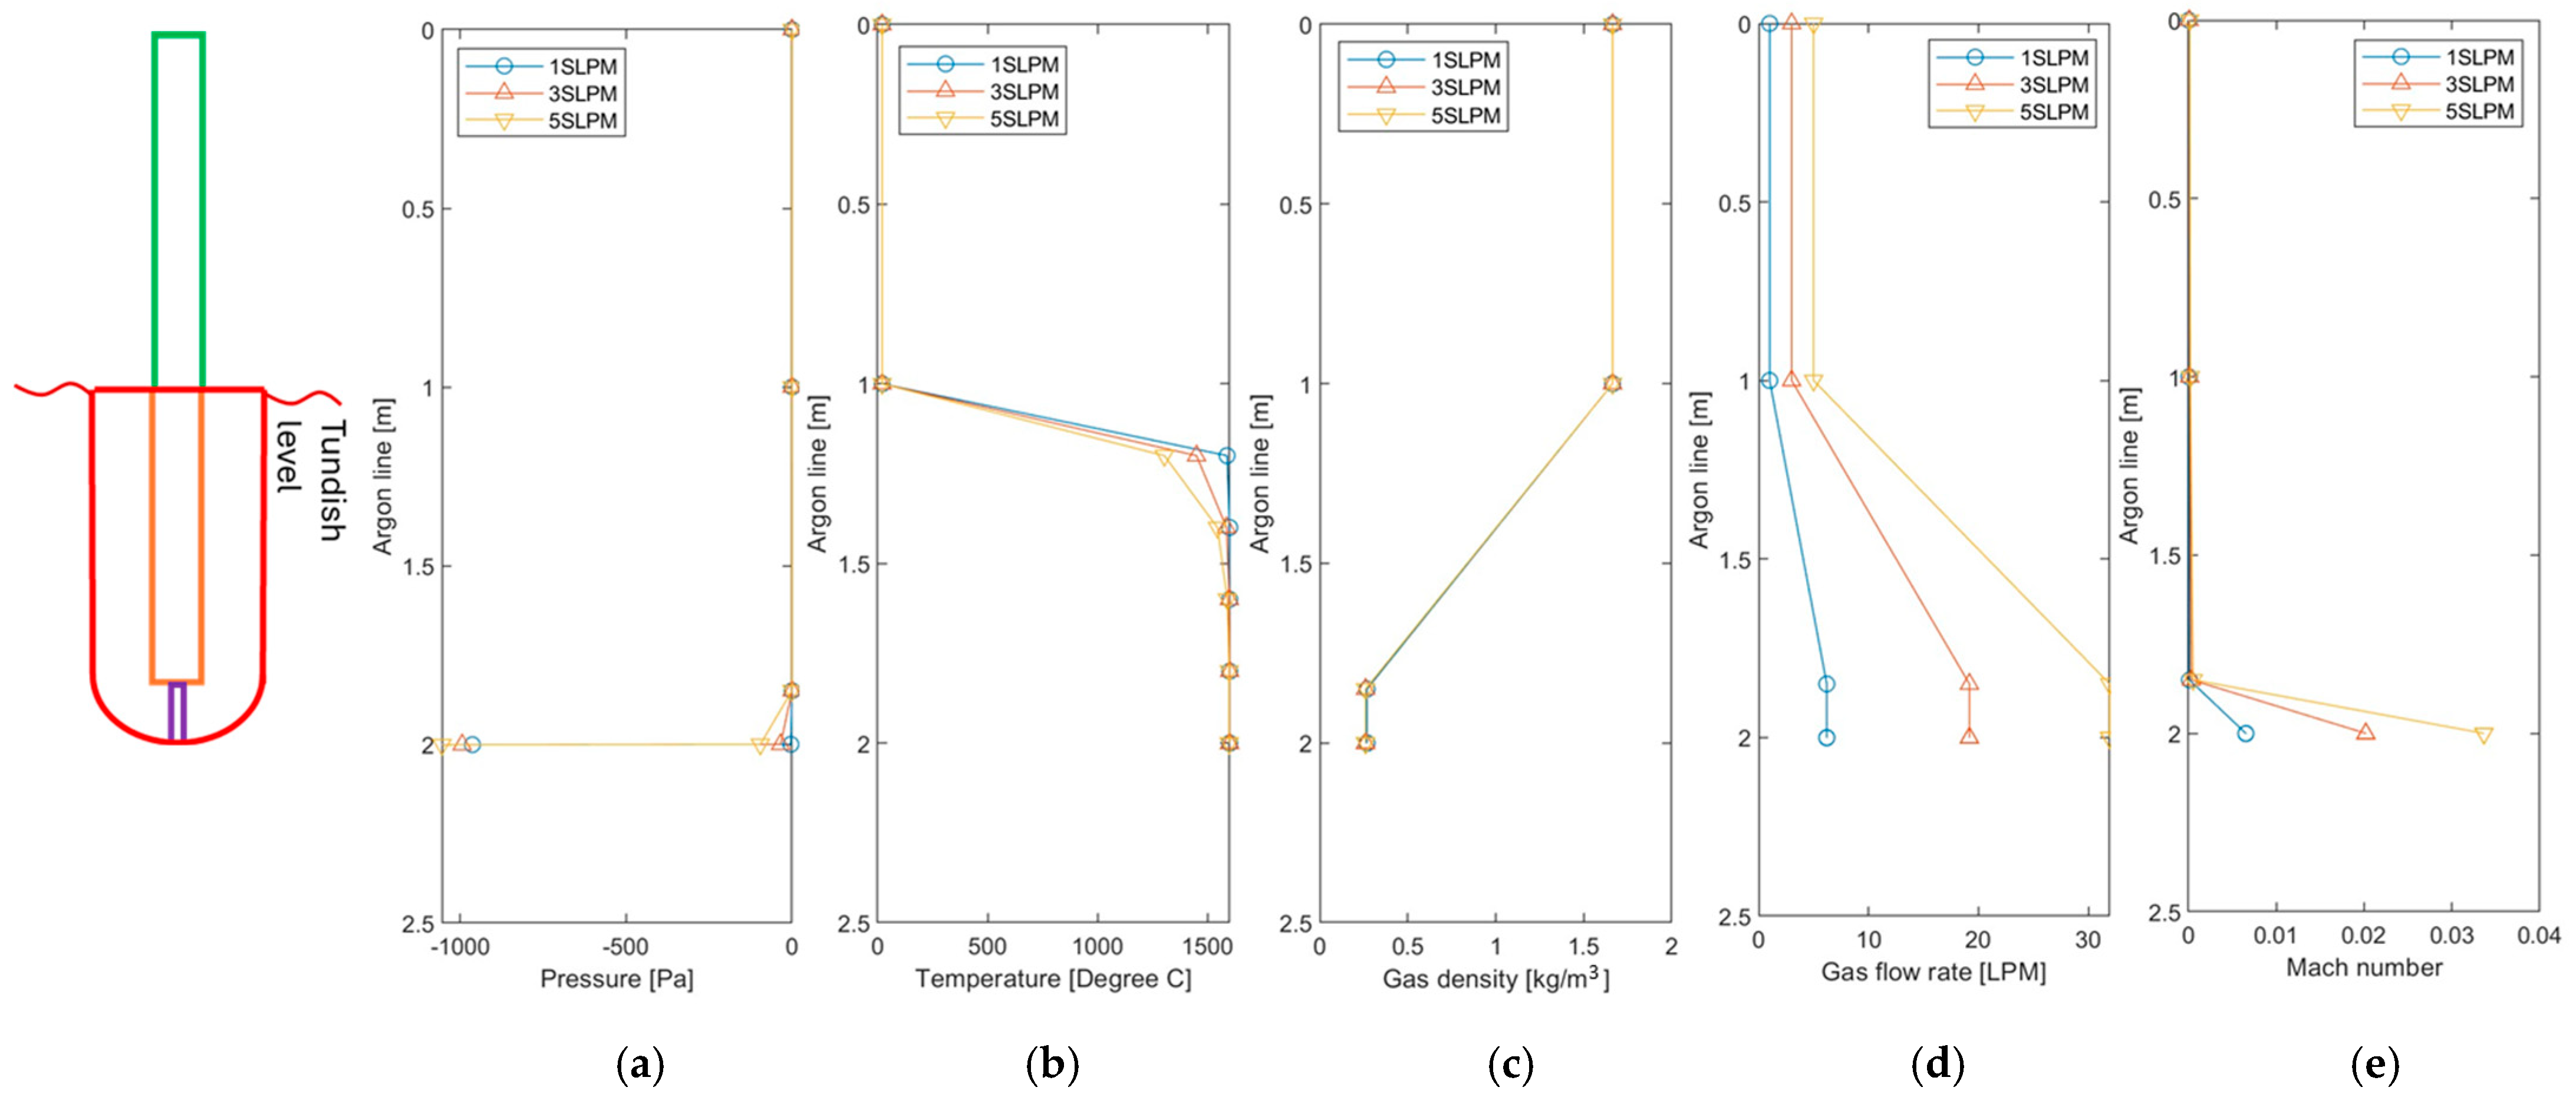
The influence of argon flow rate is examined under a fixed stopper design. Figure 7 compares the results for three different flow rates: 1, 3, and 5 SLPM. The pressure loss remains relatively unchanged across all cases. In each scenario, the gas temperature gradually increases within the stopper bore and approaches approximately 1520 °C. However, the rate of heating varies with the flow rate: lower flow rates result in a quicker temperature increase. For example, the 1 SLPM case exhibits the fastest temperature rise, while the 5 SLPM case shows the slowest due to the larger volume of gas requiring heat transfer.
In all cases, the gas expands by a factor of approximately six upon exiting the stopper tip, primarily due to thermal expansion (from 293 K to 1873 K). As a result, injecting 5 SLPM of argon at room temperature leads to approximately 30 SLPM of gas entering the SEN after heating. The Mach number peaks near the stopper tip due to the contraction of the nozzle diameter, but remains below 0.3 in all cases. This indicates that compressibility effects are limited, and thermal expansion is the dominant factor influencing the increase in volumetric flow rate, particularly when the nozzle diameter is not small enough to induce compressibility.

4.2. Effect of Stopper Tip Nozzle Diameter

The effect of nozzle diameter at the stopper tip is examined by testing four different diameters: 5.0 mm, 2.0 mm, 1.3 mm, and 1.223 mm. The diameter of 1.223 mm corresponds to the choking condition, where the gas velocity reaches the speed of sound under the given operating conditions. As shown in the Mach number profiles in Figure 8, smaller nozzle diameters such as 1.3 mm and 1.223 mm exhibit Mach numbers exceeding 0.3, indicating the presence of compressibility effects. In these cases, the gas undergoes additional expansion accompanied by a temperature drop and a noticeable pressure loss within the stopper nose. These results demonstrate that the 1D model is capable of capturing complex compressible flow behavior in addition to thermal expansion.
The case with a 1.223 mm nozzle represents the critical diameter at which choked flow occurs. This means the maximum achievable mass flow rate under the given upstream and downstream conditions is limited to 5 SLPM; any further reduction in nozzle diameter will result in a lower flow rate. Moreover, once choked, the flow rate becomes independent of downstream pressure (i.e., SEN pressure). For example, even if a severe negative pressure develops in the SEN (e.g., below −60,000 Pa), the argon flow rate will not increase, as the nozzle flow is already choked. This characteristic of choked flow can be advantageously used in industrial practice. It offers a passive method for limiting excessive gas flow into the SEN, which can otherwise disrupt mold flow stability during continuous casting.

4.3. Effect of Restrictor and Tundish Level

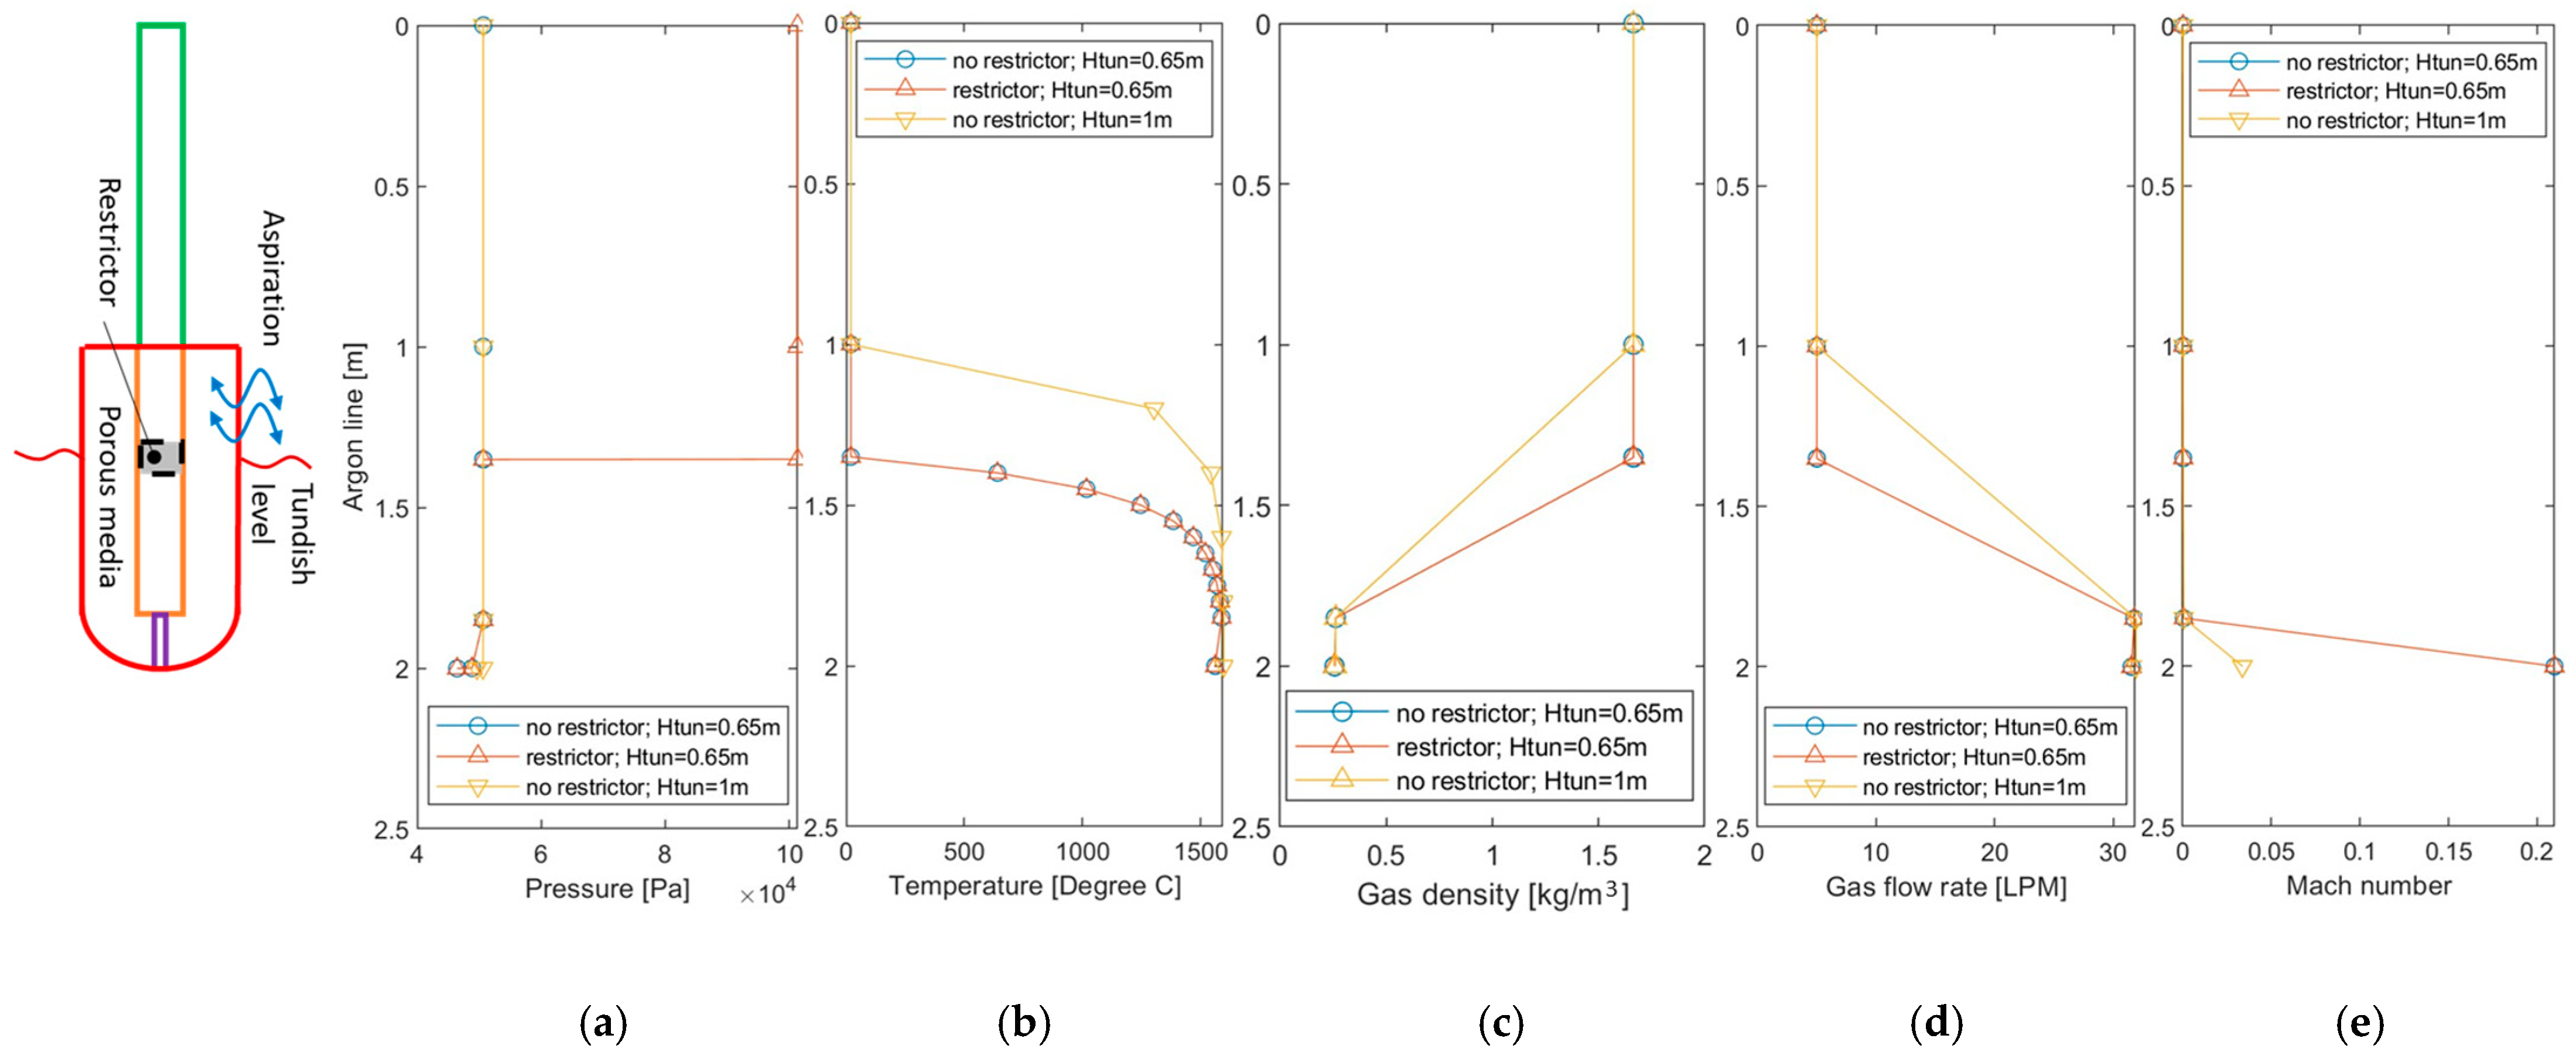
In the third parametric study, a restrictor is introduced into the stopper to create an artificial pressure drop, effectively isolating the negative-pressure region within the argon line. Three scenarios are compared: (1) with restrictor (tundish level = 0.65 m), (2) without restrictor (tundish level = 0.65 m), (3) without restrictor (tundish level = 1.0 m). The restrictor effect is simulated using the model described in Section 2.3, placed within the stopper bore. For the restrictor case, the restrictor is positioned at the tundish level (0.65 m), ensuring that negative pressure originating from the SEN does not propagate above this level, where the stopper is exposed to air. To quantify potential air aspiration, the same operating conditions are simulated without the restrictor. Additionally, another scenario without a restrictor but at a higher tundish level (1.0 m) is examined to evaluate the influence of the tundish level.
The results in Figure 9 clearly demonstrate the advantage of incorporating the restrictor. With the restrictor in place, negative pressure from the SEN is effectively contained, preventing air aspiration into the argon line. As shown in Figure 9a, pressure within the stopper bore remains positive (>1 bar) above the tundish level, where the porous stopper wall is exposed to air. In contrast, without a restrictor at a tundish level of 0.65 m, the negative pressure generated at the outlet propagates upstream toward the inlet, leading to approximately 3 SLPM of air aspiration (calculated by Equation (13) in Section 2.4). This significant leakage highlights the potential for air aspiration through porous refractory structures under typical industrial pressure conditions. However, air ingress is effectively prevented when the tundish level is sufficiently high (1.0 m), as the stopper remains fully immersed in liquid metal and is not directly exposed to air. Apart from pressure control, the presence of the restrictor does not noticeably affect other flow properties.
The tundish level, on the other hand, significantly influences the argon flow temperature by determining the location of the hot boundary in the calculation domain. For example, in the case of a 1.0 m tundish level, the argon gas is heated along the entire length of the stopper bore because the stopper is completely submerged in hot metal. Consequently, heating begins earlier (at argon line position = 1 m), leading to corresponding changes in density and flow rate. The 1D model accurately captures this effect by implementing convective heat transfer boundary conditions in the stopper bore, as described in Section 2.2.

4.4. Demonstration of Real-Time Operation Using Continuous Caster Simulator (CCS)

Lastly, the real-time capability of the 1D model is demonstrated by predicting the argon flow rate into the nozzle and the nozzle pressure, using measured argon flow rate and back pressure data from CCS. A time-series dataset of measured back pressure and argon flow rate, recorded at a frequency of 2 Hz (every 0.5 s), serves as the input for the model calculations. This demonstration is performed in a post-processing manner: measurement data obtained from a CCS trial are sequentially fed into the 1D model, effectively simulating online operation.
The CCS trial was conducted over 9 h, including an initial 2 h startup phase. During the trial, various operating conditions were emulated to reflect industrial casting scenarios, including changes in casting speed, stopper position, argon flow rate, immersion depth, and tundish level. The range for each operating condition is summarized in Figure 2. Multiple sensors installed in the CCS continuously measured flow properties and operational parameters, including the argon flow rate, argon line back pressure, stopper-nozzle gap pressure, operating temperature, metal level, and tundish level. The measured argon flow rate from the gas tank and the argon line back pressure were continuously monitored and recorded by a connected PC.
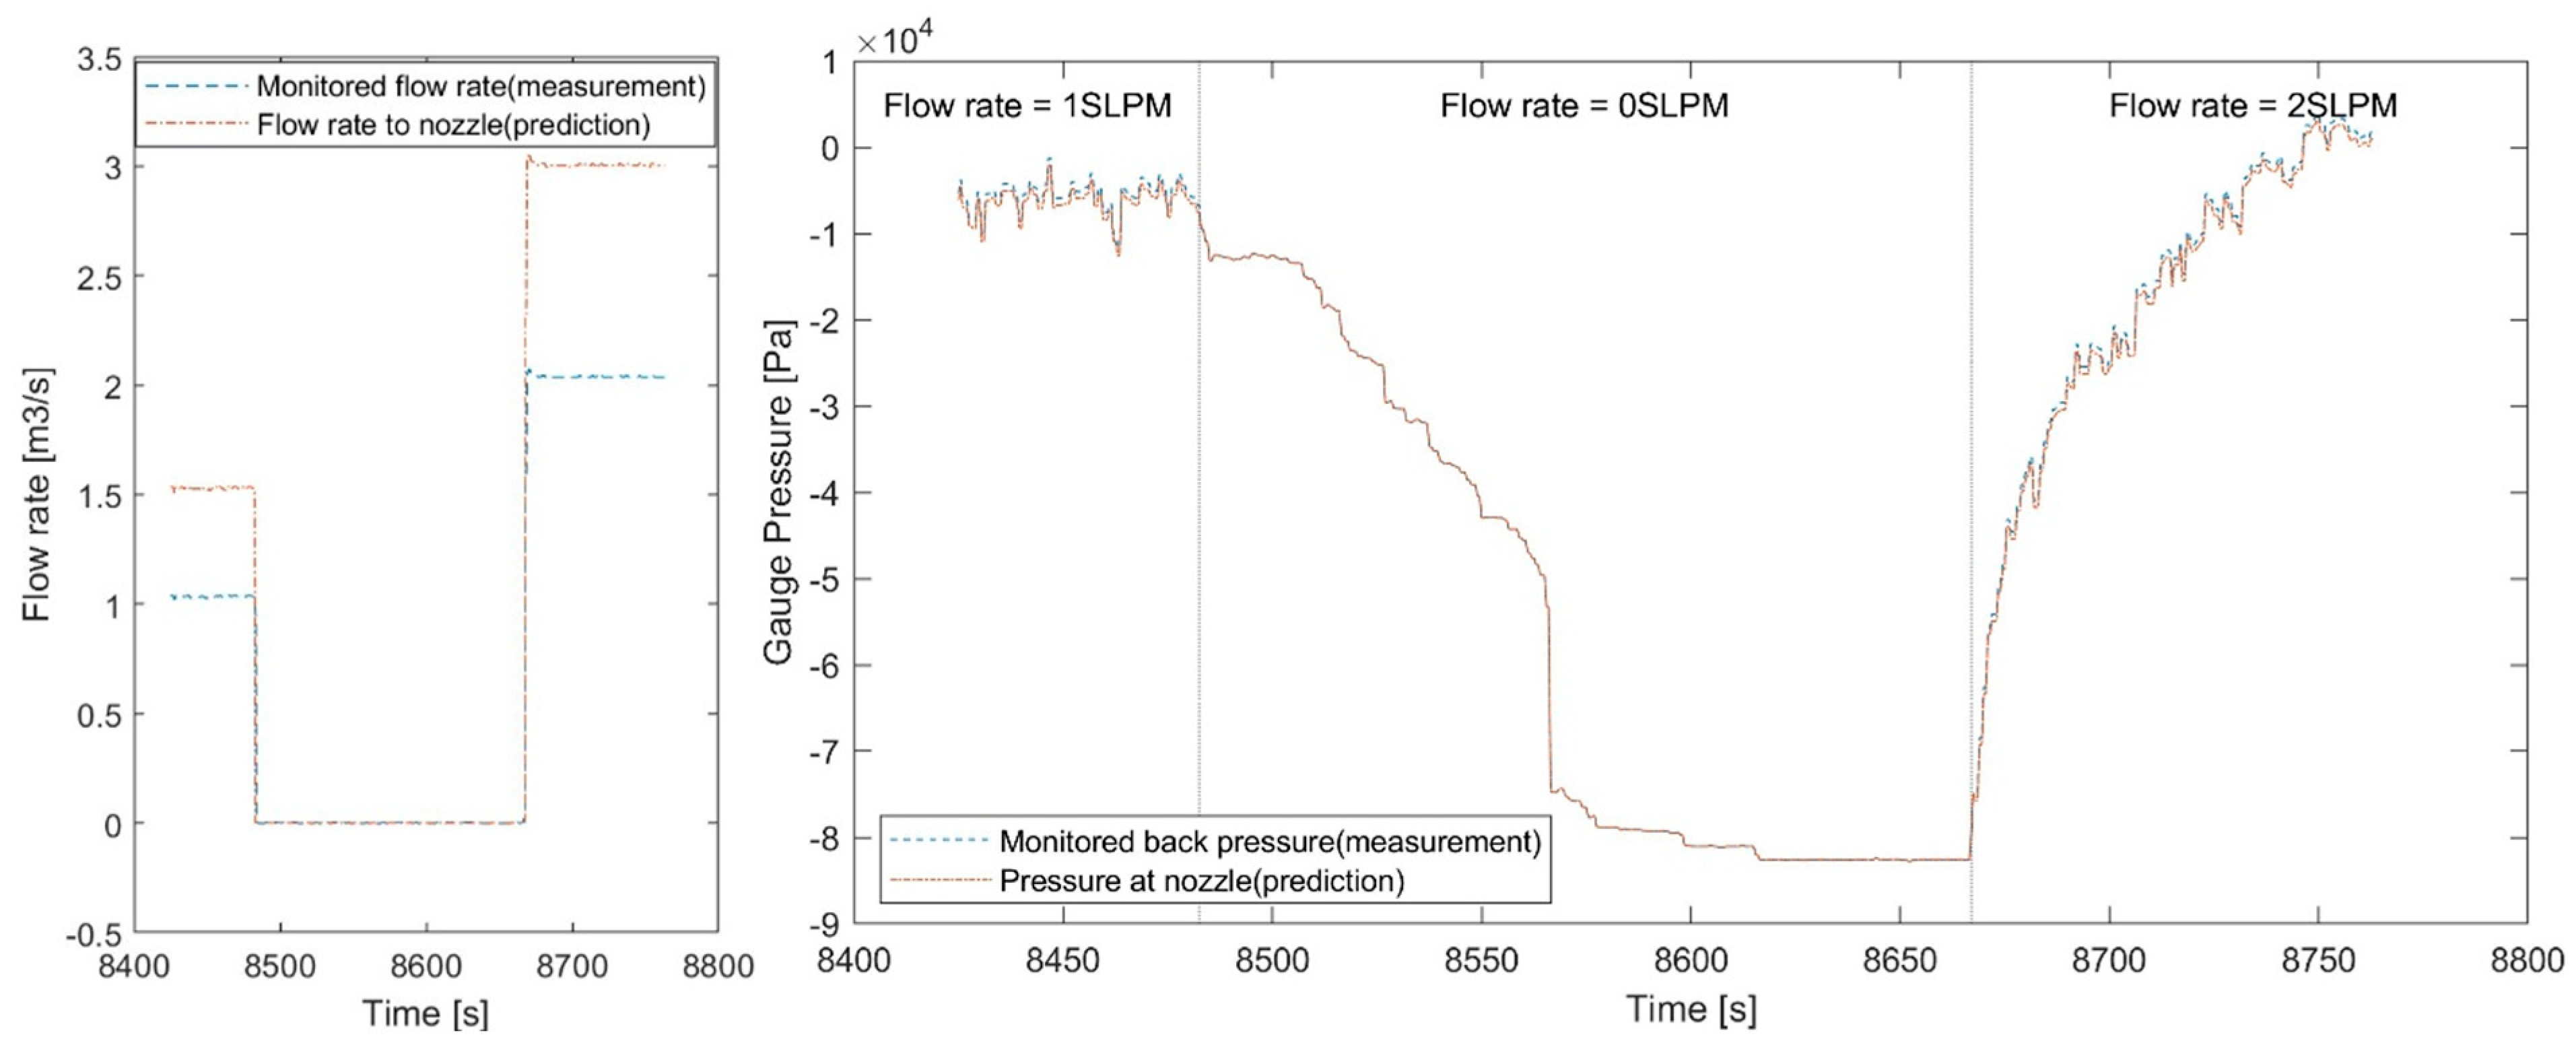
From the 9 h dataset, a representative 400 s period was selected for demonstration of the 1D model, during which the argon flow rate changed sequentially from 1 SLPM to 0 SLPM, and then to 2 SLPM, at a constant casting speed. Figure 10 presents the measured argon flow rate and back pressure along with the predicted nozzle pressure and argon flow rate entering the nozzle. When argon supply was shut off (0 SLPM) at t = 8482 s, the recorded argon line back pressure showed a significant drop, gradually decreasing from around −10 kPa to −80 kPa gauge over approximately 100 s, ultimately reaching approximately −85 kPa. This substantial negative pressure was maintained due to the pore-free structure of the aluminum stopper and SEN used in the CCS. Upon reintroducing argon at 2 SLPM at t = 8667 s, the back pressure recovered to 0 Pa gauge within ~70 s.
When sequentially fed to the 1D model, the measured data allowed prediction of the actual argon flow rate entering the SEN and its pressure. The 1D model indicated an approximate 50% increase in argon flow rate due to thermal expansion during delivery. This expansion occurred under CCS operating conditions at 160 °C, facilitated by the low-melting-point Bi-Sn alloy; higher thermal expansion rates are anticipated in actual industrial processes, as previously discussed (Section 4.1, Section 4.2 and Section 4.3). Regarding SEN pressure predictions, the difference compared to measured back pressure was minimal under 1–2 SLPM of argon injection, reflecting the simple argon line design of the CCS aluminum stopper, as noted in Section 3. The observed pressure difference between the measured argon line back pressure and predicted nozzle pressure was approximately 300 Pa. This difference may become significant if flow-restricting features common in industrial stoppers are introduced, as demonstrated by the parametric studies (Section 4.1, Section 4.2 and Section 4.3). As shown in Figure 10, this pressure difference collapses to zero when argon injection is stopped (t = 8482–8667 s), since no pressure loss occurs in the absence of gas flow. Overall, the 1D model demonstrated strong potential for application as an online monitoring tool at plant sites, with model predictions responding adequately to the 2 Hz measurement frequency.

5. Conclusions

A concise one-dimensional (1D) analytical model was developed to interpret argon line pressure and gas flow rate measurements typically monitored during continuous casting processes. The model predicts the SEN pressure and actual argon flow rate entering the nozzle based on measured argon flow rate and back pressure, while considering variations in gas pressure, temperature, and volume during gas delivery. Compressibility effects are incorporated using gas dynamics and heat transfer principles. This feature enables prediction of gas flow up to the speed of sonic (Mach number ≤ 1) and associated phenomena including choking. The model predictions were validated against a CFD-based compressible flow model under conditions representative of a continuous casting simulator (CCS) operated with a low-melting-point Bi–Sn alloy. Additionally, the real-time operational capability of the model was demonstrated by sequentially feeding measured time-series data of argon line pressure and flow rate from the CCS trials. The key findings from this study are summarized below:
  • Under a fixed argon line design (diameter > 5 mm), variations in argon flow rate (1, 3, and 5 SLPM) do not significantly affect pressure loss but influence gas heating rates; lower flow rates result in quicker temperature increases. Argon gas expands approximately six-fold due to thermal expansion upon heating, confirming thermal expansion as the primary factor of increased volumetric flow. Compressibility effects remain minimal (Mach number < 0.3), indicating insignificant impact at the tested argon line diameters.
  • Reducing the stopper tip nozzle diameter significantly increases compressibility effects, causing higher Mach numbers, gas expansion, temperature drops, and pressure losses. A critical nozzle diameter (1.223 mm) corresponds to choked flow, limiting the maximum achievable gas flow rate to 5 SLPM and making the flow rate independent of downstream pressure conditions. This choking characteristic can be effectively utilized as a passive method to prevent excessive argon injection, thus ensuring mold flow stability during continuous casting.
  • Introducing a restrictor effectively prevents negative pressure from propagating upstream within the argon line, eliminating significant air aspiration through the porous stopper. Without a restrictor, negative pressure can lead to considerable air aspiration (~3 SLPM) under given conditions, but this can also be mitigated by maintaining a sufficiently high tundish level, ensuring the stopper remains fully submerged. Additionally, the tundish level influences argon heating, impacting gas density and flow rate, a behavior accurately captured by the proposed 1D model.
The proposed 1D model predicts nozzle pressure and argon flow rate in real time using measured argon line data, demonstrating strong potential as an online monitoring tool capable of capturing rapid changes in casting conditions.

Author Contributions

Conceptualization, H.Y. and B.-M.J.; Methodology, H.Y. and H.K.; Software, H.Y. and S.S. (Seungwon Seo); Validation, S.S. (Seunghyun Sim); Formal analysis, B.-M.J.; Investigation, H.K.; Resources, H.Y. and S.S. (Seungwon Seo); Data curation, S.S. (Seunghyun Sim); Writing—original draft, H.Y.; Writing—review & editing, H.Y.; Visualization, S.S. (Seungwon Seo); Supervision, H.Y.; Project administration, H.Y. and S.S. (Seunghyun Sim); Funding acquisition, H.Y. All authors have read and agreed to the published version of the manuscript.

Funding

This work was supported by the Korea Institute of Energy Technology Evaluation and Planning (KETEP) grant funded by the Korean Government (MOTIE) (RS-2023-00243974, Graduate School of Digital-based Sustainable Energy Process Innovation Convergence). This work was also supported by an INHA UNIVERSITY Research Grant.

Data Availability Statement

The datasets presented in this article are not readily available because the data are part of an ongoing study. Requests to access the datasets should be directed to the corresponding author.

Conflicts of Interest

The authors declare no conflicts of interest.

Nomenclature

ρ i Gas density at point i [kg/m3] T i Gas temperature at point i [K] R i n Inner radius [m]
V i Cross-section averaged gas velocity at point i [m/s] p Perimeter of bore [m] R o u t Outer radius [m]
f Friction factor h ¯ Average heat transfer coefficient [W/m2·K] R Ideal gas constant [J/mol.K]
ε Absolute roughness [m] N u ¯ Average Nusselt number σ Interfacial tension [N/m]
L Length of conduit [m] P r Prandtl number r n o z z l e Radius of the nozzle outlet [m]
D Conduit diameter [m] k Gas thermal conductivity [W/m.K] u Gas velocity field [m/s]
R e Reynolds number M i Mach number at point i τ Shear stress tensor [Pa]
μ Gas viscosity [Pa.s] γ Specific heat ratio g Gravitational acceleration [m/s2]
m ˙ Gas mass flow rate [kg/s] Q i Gas flow rate at point i [m3/s] t Time [s]
P i Pressure at point i [Pa] A Cross-sectional area [m2] y + Dimensionless wall distance
c p Heat capacity [J/kg.K] κ Permeability [m2]

References

  1. Bai, H.; Thomas, B.G. Effects of clogging, argon injection, and continuous casting conditions on flow and air aspiration in submerged entry nozzles. Metall. Mater. Trans. B 2001, 32, 707–722. [Google Scholar] [CrossRef]
  2. Yang, H.; Vanka, S.P.; Thomas, B.G. Modeling Argon Gas Behavior in Continuous Casting of Steel. JOM 2018, 70, 2148–2156. [Google Scholar] [CrossRef]
  3. Park, J.H.; Kang, Y.-B. Reoxidation Phenomena of Liquid Steel in Secondary Refining and Continuous Casting Processes: A Review. Steel Res. Int. 2024, 95, 2300598. [Google Scholar] [CrossRef]
  4. Yang, H.; Olia, H.; Thomas, B.G. Modeling Air Aspiration in Steel Continuous Casting Slide-Gate Nozzles. Metals 2021, 11, 116. [Google Scholar] [CrossRef]
  5. Yang, H.; Eck, J.; Lopez, P.E.R. Analysis of a Full-Scale Bi–Sn Liquid Metal Model for the Continuous Casting of Steel. Met. Mater. Int. 2024, 30, 1370–1386. [Google Scholar] [CrossRef]
  6. Olia, H.; Palmer, D.; Jebellat, E.; Thomas, B.G. Investigation of Multiphase Flow in Continuous-Casting Water Model with Measurements and Computational Modeling. Fluids 2025, 10, 113. [Google Scholar] [CrossRef]
  7. Liu, R.; Thomas, B.G. Model of gas flow through porous refractory applied to an upper tundish nozzle. Metall. Trans. B 2015, 46, 388–405. [Google Scholar] [CrossRef]
  8. Nitzl, G. Stopper Rod. US Patent 9168586 B2, 27 October 2015. [Google Scholar]
  9. Nitzl, G. Ceramic Refractory Stopper. US Patent 9302321B2, 5 April 2016. [Google Scholar]
  10. Cho, S.-M.; Thomas, B.G.; Kim, S.-H. Bubble Behavior and Size Distributions in Stopper-Rod Nozzle and Mold during Continuous Casting of Steel Slabs. ISIJ Int. 2018, 58, 1443–1452. [Google Scholar] [CrossRef]
  11. Liu, R.; Forman, B.; Yin, H.; Lee, Y. A New Insight into the Flow and Pressure Behavior of a Stopper Rod Flow Control System. Steel Res. Int. 2023, 94, 2200626. [Google Scholar] [CrossRef]
  12. Eck, J.; Lopez, P.E.R.; Cervantes, M.J. Investigation of Pressure Distribution during Flow Regulation with a Stopper and Associated Mould Level Stability in a Continuous Cast-ing Simulator based on Liquid Metal. Metall. Ital. 2022, 114, 42–51. [Google Scholar]
  13. Hackl, G. A Stopper Rod and a Method for Providing a Uniform Gas Curtain Around a Stopper Rod. EU Patent 3705204A1, 28 January 2020. [Google Scholar]
  14. Takahashi, S. Stopper for Continuous Casting. US Patent 6478201B2, 12 November 2002. [Google Scholar]
  15. Bergman, T.L.; Lavine, A.S.; Incropera, F.P. Fundamentals of Heat and Mass Transfer, 7th ed.; John Wiley & Sons, Incorporated: Hoboken, NJ, USA, 2011. [Google Scholar]
  16. NIST. NIST Chemistry Webbook SRD69; NIST: Gaithersburg, MD, USA, 2005.
  17. Kaviany, M. Principles of Heat Transfer in Porous Media; Springer: New York, NY, USA, 2012. [Google Scholar]
  18. Erhard, P.; Etling, D.; Muller, U.; Riedel, U.; Sreenivasan, K.; Warnatz, J. Prandtl-Essentials of Fluid Mechanics; Springer Science & Business Media: Berlin/Heidelberg, Germany, 2010; Volume 158. [Google Scholar]
  19. Suzuki, M.; Yamaoka, Y.; Kubo, N.; Suzuki, M. Oxidation of molten steel by the air permeated through a refractory tube. ISIJ Int. 2002, 42, 248–256. [Google Scholar] [CrossRef]
  20. Zucker, R.D. Fundamentals of Gas Dynamics, 2nd ed.; Zucker, R.D., Biblarz, O., Eds.; Wiley: Hoboken, NJ, USA, 2002. [Google Scholar]
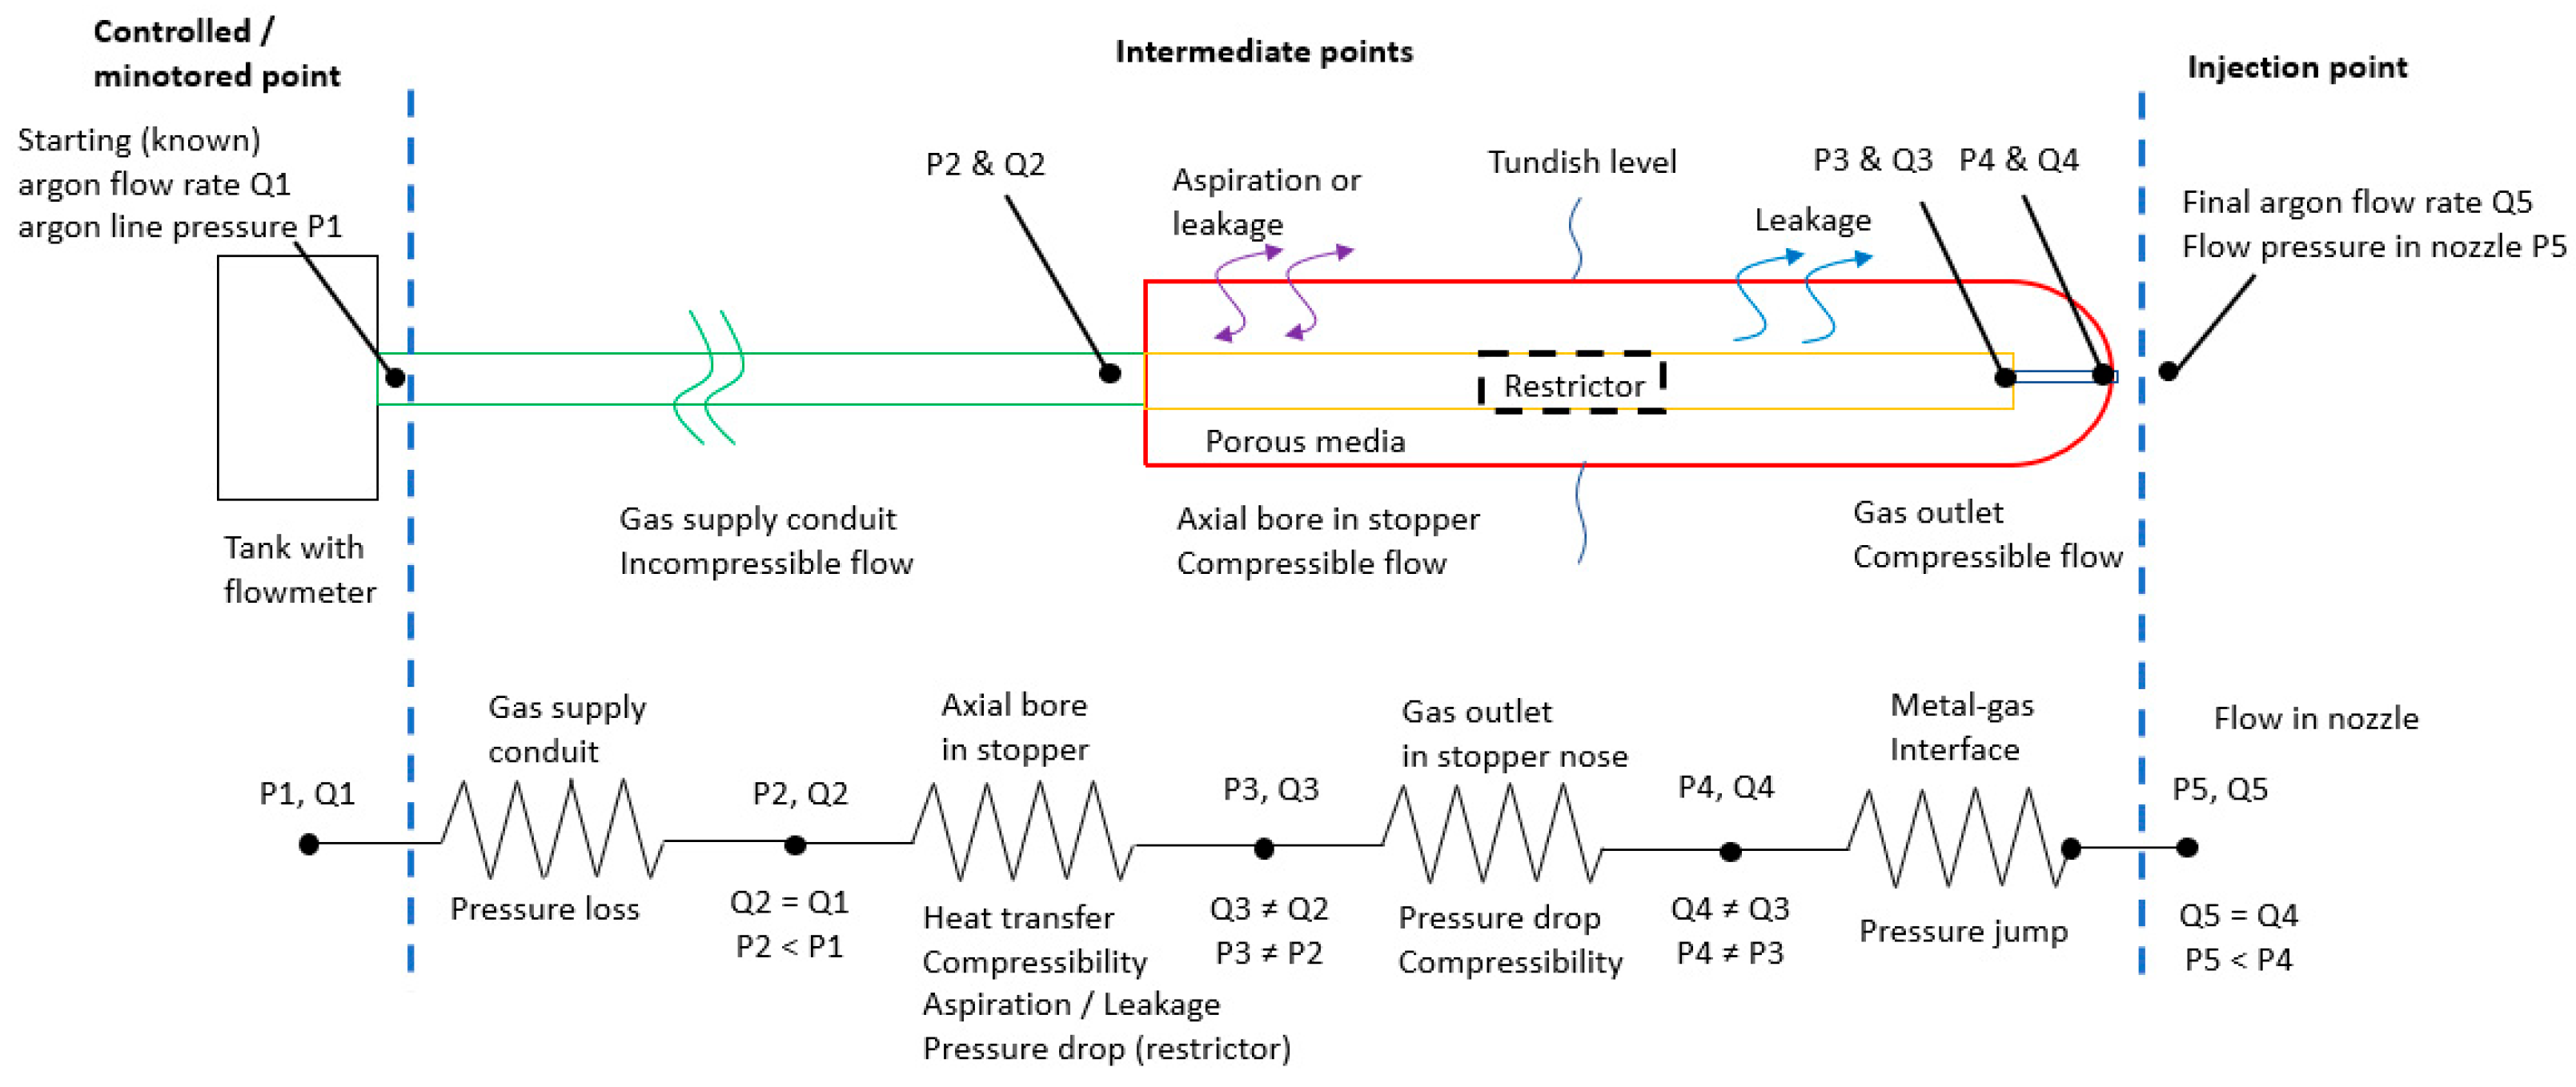
Figure 1. Schematic of the 1D argon line model.
Metals 15 00978 g001
Figure 2. Operating conditions of the continuous casting simulator (CCS) and material properties of the Bismuth–Tin (Bi-Sn) alloy.
Metals 15 00978 g002
Figure 3. Computational domain of CFD calculation for validation.
Metals 15 00978 g003
Figure 4. Comparison between 1D model predictions and CFD results for argon flow properties: (a) pressure, (b) temperature, (c) density, and (d) flow.
Metals 15 00978 g004
Figure 5. Comparison of 1D model predictions for two liquid metal temperatures: 160 °C (pilot scale) and 1600 °C (industrial scale): (a) pressure, (b) temperature, (c) density, (d) flow rate, and (e) Mach number.
Metals 15 00978 g005
Figure 6. Summary of stopper designs and operating conditions used in the parametric studies conducted in this work.
Metals 15 00978 g006
Figure 7. Variation in argon flow properties for different flow rates (1 SLPM, 3 SLPM, and 5 SLPM): (a) pressure, (b) temperature, (c) density, (d) flow rate, and (e) Mach number.
Metals 15 00978 g007
Figure 8. Variation in argon flow properties for different nozzle diameters (d = 5 mm, 2 mm, 1.3 mm, 1.223 mm): (a) pressure, (b) temperature, (c) density, (d) flow rate, and (e) Mach number.
Metals 15 00978 g008
Figure 9. Effect of restrictor and tundish level on argon flow properties: (a) pressure, (b) temperature, (c) density, (d) flow rate, and (e) Mach number.
Metals 15 00978 g009
Figure 10. Demonstration of the 1D model using CCS time-series data of argon back pressure and flow rate.
Metals 15 00978 g010
Table 1. Detailed operating conditions for parametric studies.
Operating Condition
Operating temperature1600 °C (liquid steel)
Argon flow rate5 SLPM (Parametric study 1: 1, 3, 5 SLPM)
Tundish level1 m (Parametric study 3: 0.65, 1 m)
Argon line design
Argon conduit diameter50 mm
Stopper bore diameter40 mm
Stopper tip nozzle diameter5 mm (Parametric study 2: 5, 2, 1.3, 1.223 mm)
Stopper bore length0.85 m
Stopper nose length0.15 m
Disclaimer/Publisher’s Note: The statements, opinions and data contained in all publications are solely those of the individual author(s) and contributor(s) and not of MDPI and/or the editor(s). MDPI and/or the editor(s) disclaim responsibility for any injury to people or property resulting from any ideas, methods, instructions or products referred to in the content.