Article

Microstructure and Mechanical Properties Change of Al7SiMgxEr (x: 0.03–0.1)

1
Mechanical Engineering, Graduate Education Institute, Bayburt University, Bayburt 69000, Türkiye
2
Materials Science and Engineering, Transportation Technologies Institute, Gebze Technical University, Kocaeli 41400, Türkiye
3
Metal Production and Processing, SINTEF Industry, 7034 Trondheim, Norway
*
Author to whom correspondence should be addressed.
Metals 2025, 15(9), 969; https://doi.org/10.3390/met15090969
Submission received: 4 August 2025 / Revised: 26 August 2025 / Accepted: 27 August 2025 / Published: 30 August 2025
(This article belongs to the Section Metal Casting, Forming and Heat Treatment)

Abstract

Aluminum and its alloys are widely used in many fields, such as automotive, aerospace, and defense industries, due to their many advantages. Due to such critical applications, the quality demands are also increasing. With the recent development in technologies, studies on casting of aluminum with different alloying element additions are ongoing rapidly. Various elements are added to the alloy to provide the desired properties. In this study, the effects of 0.03, 0.06, and 0.1 wt% Er addition to A356 aluminum alloy were evaluated simply because in the literature, only 0.1 wt% and above additions were studied. Samples were prepared using permanent molds and subjected to mechanical testing and microstructural characterization. Changes in the microstructure (evaluated via SDAS and SDAL) and mechanical properties of the cast specimens were analyzed. The results showed that Er addition improved tensile strength by up to 30%, increased elongation fourfold, and enhanced toughness by a factor of 4.5.

1. Introduction

Aluminum alloys are widely used in various industries due to their advantageous properties, such as their high strength, light weight, conductivity, and good performance–price ratio. Improving the mechanical properties of aluminum alloys has gained a lot of attention, especially with the increasing demand in the automotive and aerospace industries. Factors affecting the mechanical properties of aluminum–silicon alloys (3xx series) include cooling rate, silicon morphology, and grain structure [1]. With their use in various fields, the alloy quality and mechanical properties are aimed at being enhanced [2]. One of the most critical parameters is the cleanliness of the melt which should be free from oxides [3]. Gyarmati [4,5] has carried out an extensive study on the importance of melt quality over the final product properties. Zhang [6,7] showed that it is easy to remove smaller oxides by the use of flux. Olafsson [8,9], on the other hand, exploited the importance of hidden defects in the final product where oxides are more pronouncedly affecting the toughness of the cast parts rather than the pores. Similarly, Bogdanoff [10,11] showed that even after HIP, the defects are only hindered not to be visible by non-destructive methods; however, the mechanical properties are still decreased.
Different methods are being investigated to improve the mechanical properties of aluminum alloys. One of these methods is the addition of rare earth elements to the alloy. Nogita [12] was probably the first to investigate 14 different rare earth elements and their effect on the morphology of AlSi alloys. Eu was reported to be the best modifier. The addition of rare earth elements to aluminum alloys has been shown to refine grain size and modify eutectic morphology. These additions can also inhibit recrystallization, leading to improved mechanical properties of the alloy [13,14,15].
The addition of one of the rare earth elements, erbium, to aluminum alloys has recently attracted great interest due to its positive effects on the microstructure and mechanical properties of these alloys. Studies have confirmed that the addition of erbium results in the formation of the Al3Er phase, characterized by a stable FCC lattice structure similar to aluminum. This phase is used for heterogeneous nucleation sites, thus the refinement of the grain structure within the alloy [16]. In addition, the presence of Er was found to reduce the amount of nucleation sites for eutectic phases and lead to increased supercooling of the melt. Erbium can modify Si and even decrease SDAS. 0.22 wt% Er revealed the best mech properties but 0.4 wt% resulted in formation of chunky Er-based intermetallic phases which decreased the mechanical properties in A356 alloy [17]. Sahin [18] added 0.1 and 0.3 wt% Er-Eu combinations. Although Eu revealed the best modification of eutectic Si phase, 0.1 wt% Er addition had the highest mechanical properties. Shi [19] reported very similar findings where 0.3 wt% Er was able to achieve both grain refinement and modification of Si phase [20]. Wu [21] showed that combined effect of Sr and Er in Al11SiCu alloy was more pronounced on the mechanical properties. Lei [22] reported that in Al3SiMgCu alloy, with the increased Er content from 0.2 to 0.6 wt%, the grain size decreased to 50% compared to unmodified alloy. Ou [23] found out that La-Ce addition transformed the Chinese script Fe morphology to more blocky shape in which the fracture was turned completely into brittle mode. Li [24] characterized the formation of Al10Fe2Er intermetallic phase formation. By the addition of both Sc and Er up to 0.6 wt%, formation of irregular polygonal morphology had led to increased wear resistance in A360 alloy [25]. Pandee [26] showed that after several holding durations, no fading of grain refinement was observed when Er was used because it is well known that commercially used Ti-based master alloys have a tendency to sediment after approximately 20 min, losing their grain-refining efficiency [27]. Gao [28] studied the effect of Er in pure aluminum and reported that 0.2 wt% Er not only refined the structure but also modified the Fe-intermetallic phases into finer morphology. Guo [29] found similar findings where 0.3 wt% Er addition eliminated the formation of coarse Al3Fe phases as well as a decrease in the grain size. Peeratatsuwan [30] found that Er addition increased the rheocast quality index of semi-solid A356 alloy that resulted in much finer globular grains during rheocasting, in which Si phase refinement was also enhanced. Furthermore, Khrustalyov [31] showed that the incorporation of Al3Er particles into the AA5056 alloy composition leads to an increase in ultimate tensile strength and plasticity. Qin [14] even studied the addition of Er to 2024 wrought alloy and reported that due to the better refinement of grains, a significant increase in mechanical properties were achieved. Similar work was carried out by Wang [13] on 7075 with Er and Sm addition. Addition rates above 0.4 wt% of RE caused a decrease in the mechanical properties due to formation of large intermetallic phases. In recent studies, the addition of rare earth elements to commercially pure aluminum has also been shown to enhance microstructure, hardness, corrosion resistance, and machinability, further supporting the role of RE elements in improving alloy performance [32]. There are many studies on the development of mechanical properties with alloying element additions such as Vanadium, Boron, Strontium, and Niobium in the casting of aluminum alloys [33,34,35].
In studies conducted on Er addition as discussed in the section above, it has been observed that the addition amount usually starts from 0.1 wt% going up to 0.4 wt%, which was reported to be harmful. Therefore, in this study, it was uniquely addressed to the effects of very low Er additions (0.03–0.1 wt%) in A356 alloy cast via permanent molds, evaluating their influence on mechanical and microstructural characteristics. A356 alloy was used, and castings were made in permanent molds to characterize the mechanical properties and microstructural changes.

2. Materials and Methods

2.1. Sample Preparation

A356 casting alloy was used in the experiments. In order to investigate the effect of different ratios of Er addition to the aluminum alloy, the target composition was aimed to contain 0.03, 0.06, and 0.1 wt% Er in the alloy. AlEr3 master alloy was used for the Er addition to the alloy. Within the scope of the study, the experimental procedure including A356 alloy, a reference and 3 different ratios of Er containing alloy was cast. The A356 alloy was melted at 720 °C in a SiC crucible using an electric resistance furnace (8 kg capacity). AlEr3 master alloy was used for Er addition at 0.03, 0.06, and 0.1 wt%. The Al3Er master alloy used for Er addition was commercially procured from a supplier operating in the metal industry market. After addition, the melt was held for 15 min before casting at 700 °C. The chemical composition of the as-cast alloys was determined using a Foundry-Master Pro optical emission spectrometer (OES) (Oxford Instruments, Abingdon, UK). Erbium content, which could not be measured by OES, was determined by X-ray fluorescence (XRF) analysis. Melts were degassed using rotary degassing with nitrogen gas (5 L/min at 300 rpm for 5 min).

2.2. Determination of Mechanical Properties

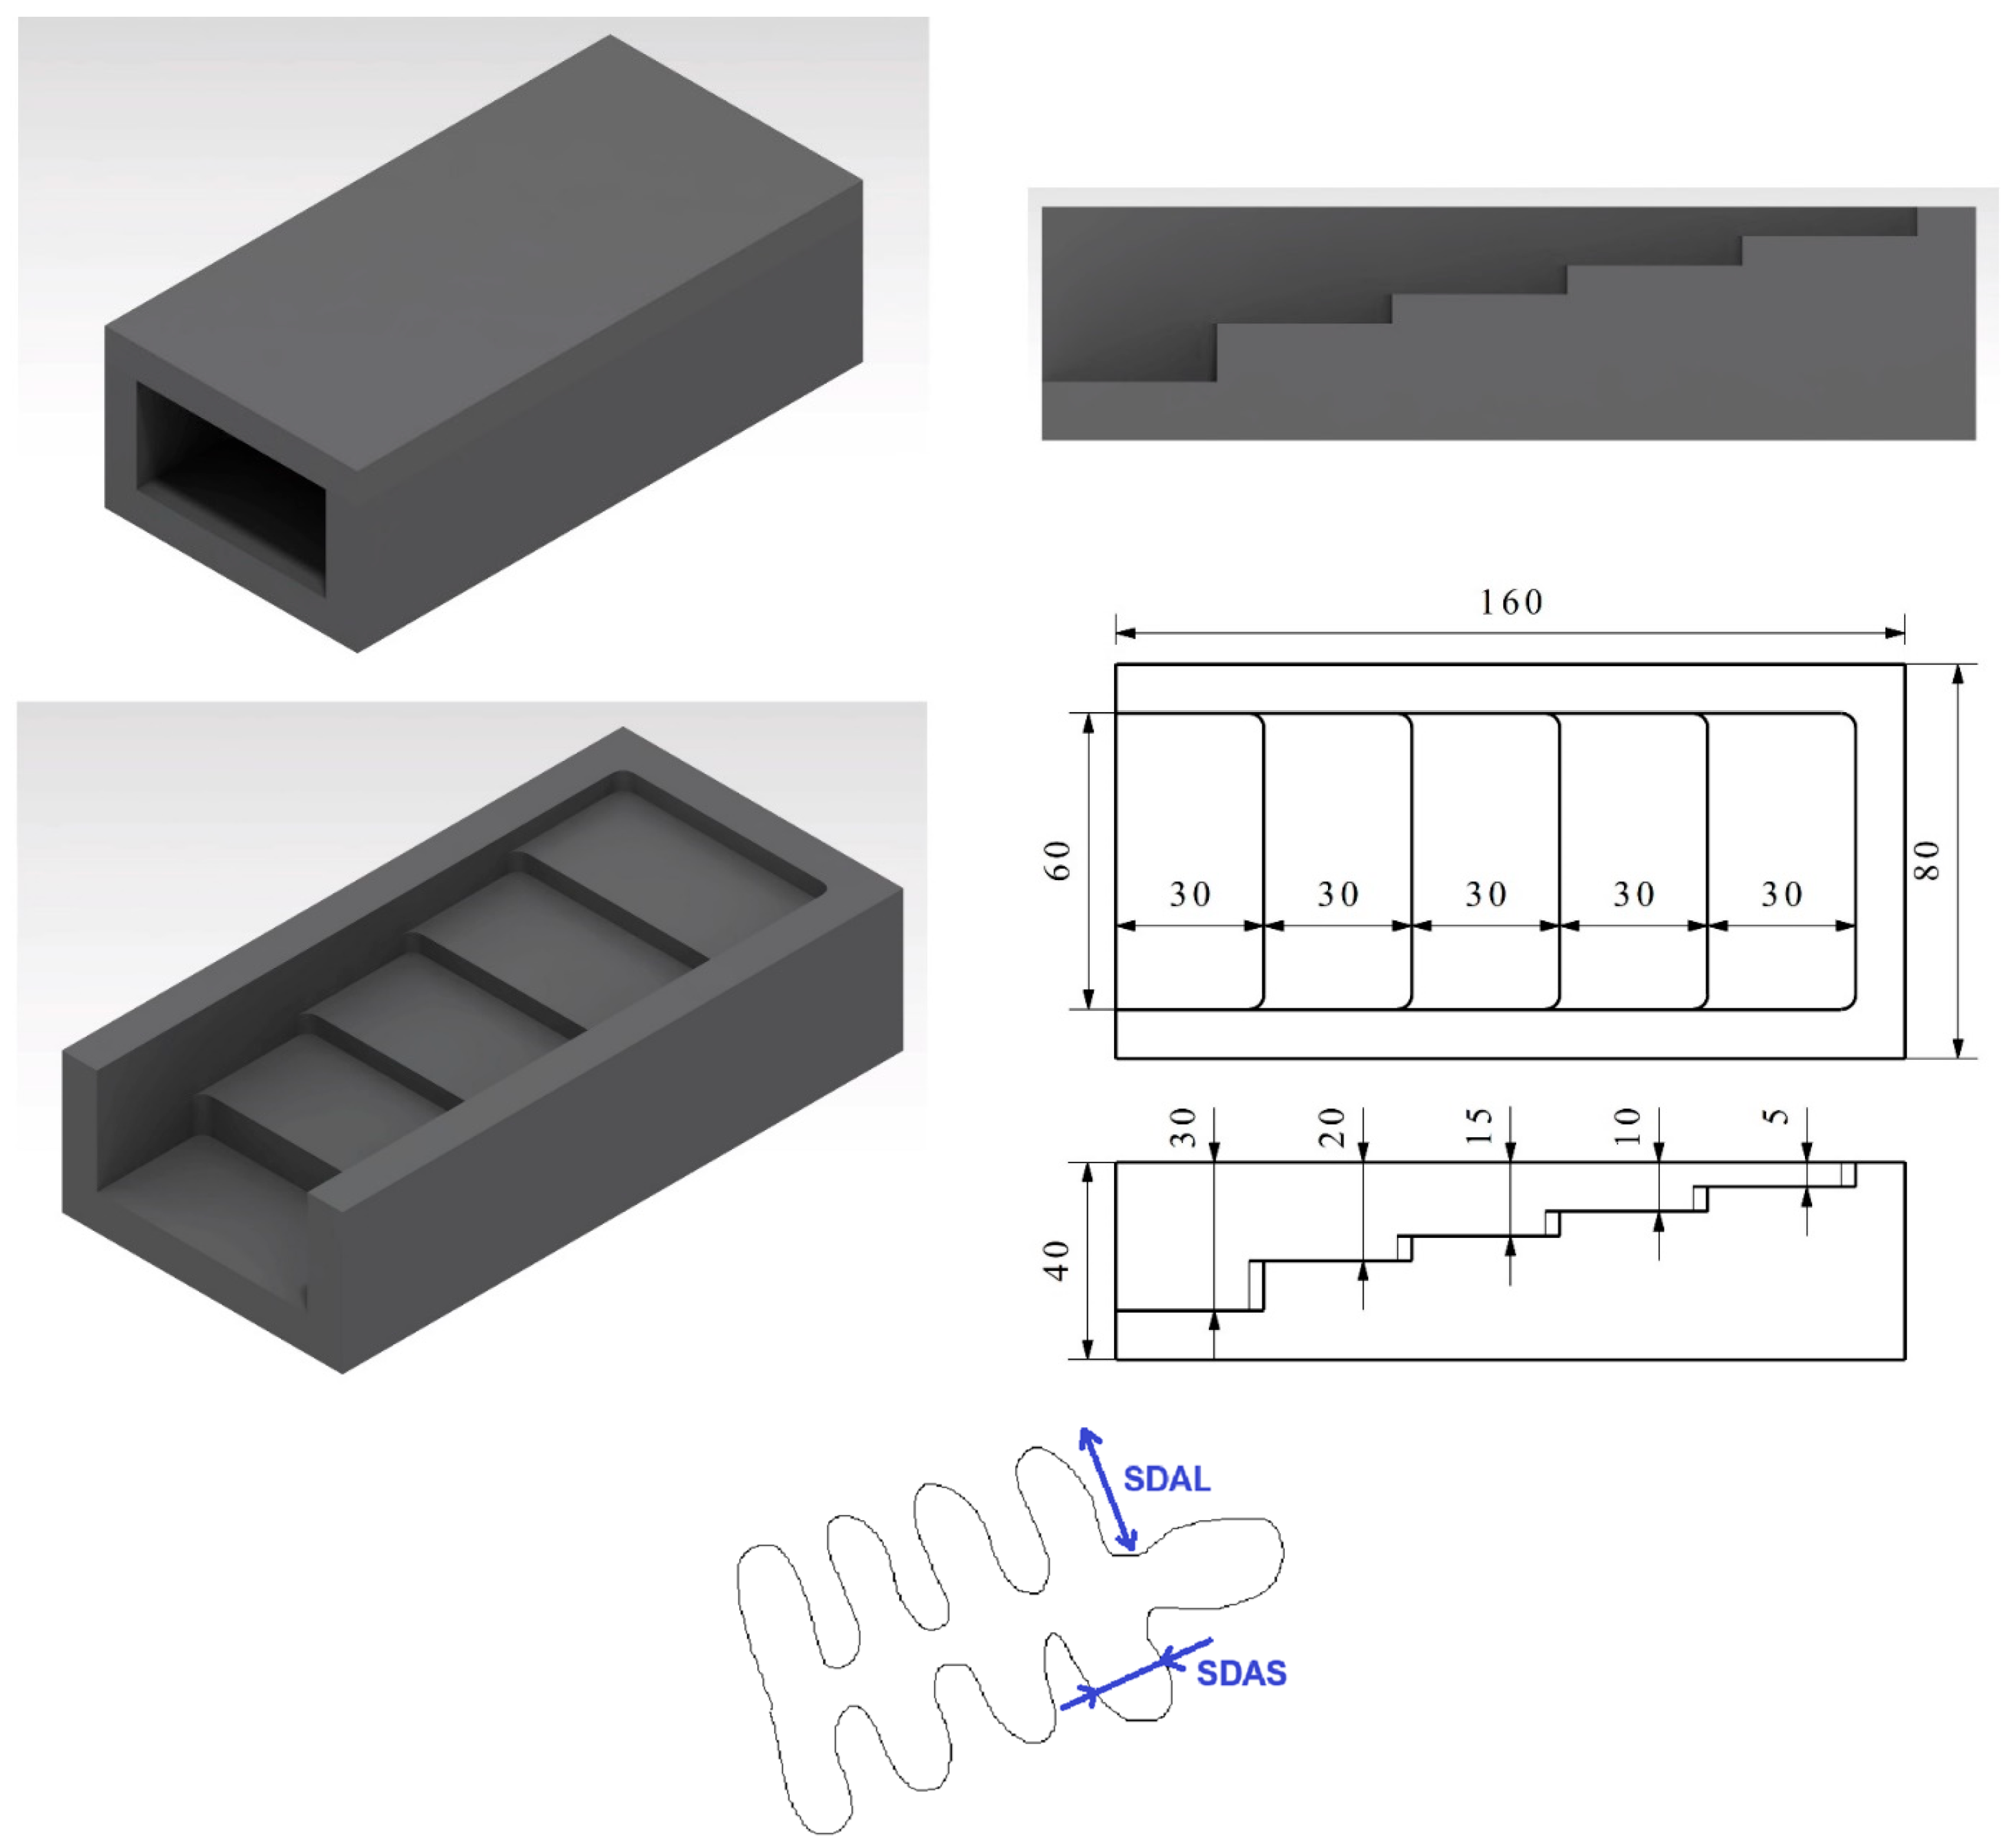
Castings were poured at 700 °C into preheated permanent molds (steel) (250 °C, coated with Boron Nitrate (BN)). The dimension of the cast part produced by permanent mold is given in Figure 1.
Tensile bars were obtained by cutting runners from the castings made into the mechanical test mold, as shown in Figure 1. The samples were processed according to the E8/E8M-13a standard for tensile tests creating tensile bars (dimensions include gage dia.). Tensile samples were machined from runners and heat treated to T6 temper. Specifically, samples were solution treated at 540 °C for 6 h, quenched in water at 80 °C, and artificially aged at 160 °C for 4 h. Tensile testing (6 specimens per condition) was performed at 1 mm/min on an MTS 370.10 machine (100 kN) (MTS Systems Corporation, Eden Prairie, MN, USA).
Brinell hardness tests were performed on flat-faced, machined samples with dimensions of approximately 20 mm × 20 mm × 10 mm, taken from the central regions of the cast specimens. A 2.5 mm diameter steel ball and a 62.5 kgf load were applied for 10 s in accordance with [36]. For each alloy condition, hardness was measured on six different regions, and the average value was reported.

2.3. Solidification Test

In the experiments conducted to see the effect of solidification time on the microstructure, another series of castings were made of into a step mold. The dimension of the sample is given in Figure 2. The aim was targeted to examine the solidification behavior and microstructure of samples at different section thicknesses.
Microstructural analyses were performed using an NMM-800/820 series metallurgical optical microscope (Sumer Lab, Hangzhou, China). The specimens were grinded, polished, and etched with Keller’s reagent (95 mL H2O, 2.5 mL HNO3, 1.5 mL HCl, 1 mL HF) to reveal grain boundaries and eutectic structures. The secondary dendrite arm spacing (SDAS) and secondary dendrite arm length (SDAL) were measured from optical micrographs to evaluate the effects of cooling rate and Er addition on microstructure (Figure 2). Images were captured at magnifications of 50×, 100×, and 200× to evaluate SDAS and microstructural changes.

3. Results

Chemical composition analysis results of the samples to check the suitability of the alloy used in the casting processes are given in Table 1.
Table 1 shows that A356 alloys are within the standard composition range. Er addition control was performed on the chemical analysis device, but values related to Er element analysis could not be determined on the relevant device. Er values were measured by XRF.
The Archimedes principle was used to determine the densities of the samples taken from the RPT (Reduced Pressure Test) device. According to this method, the weights of each sample were measured first in air and then in pure water, whose temperature was measured as 20 °C and whose density was accepted as ds = 0.99821 g/cm3. Density measurements were found to be 2.661, 2.662, 2.661, and 2.661 g/cm3, respectively, for reference, 0.03, 0.06, and 0.1 wt% Er containing alloy. The reference density of the sample solidified in air was measured as 2.67 g/cm3; therefore, the volumetric porosity amounts were recorded as 0.337%, 0.309%, 0.364%, and 0.364%, respectively. The porosity percentage was measured from the obtained values, and it was determined that the porosity values calculated in all test samples were below 0.5%. It was seen that this result provided an acceptable level of liquid metal cleanliness in each casting process. Then, the RPT samples were cut in half vertically, grinded, and the porosity distribution on the cross-sectional surfaces were examined in detail. Images of the cross-sectional surfaces of the RPT samples are presented in Figure 3.
When the cross-sectional surface images of the RPT samples were examined, it can be seen that no apparent large pores were detected. The surface sink and almost no pores on the sample surface confirm that the alloys were of the highest quality in terms of liquid metal cleanliness. In the RPT samples, a smooth and uniform surface sink without observable internal pores was present, and the measurement of bifilm index values were recorded to be less than 2 mm, which is considered an indication of good melt cleanliness. This is in agreement with standard melt quality assessment methods [37].

3.1. Mechanical Test Results

Based on the mechanical tests, a stress–strain graph representing the average results (of six samples) from the tests is given in Figure 4. Also, the average results from the tensile test are presented in Table 2. It is important to note that the toughness values were measured as the area under the tensile curve.
When the graph in Figure 4 is examined, the significant effects of Er addition on stress and deformation are clearly seen. While the maximum tensile stress values were 141.52 MPa in reference alloy, with Er addition, it increased to 185.44 MPa in 0.03 wt% Er, 187.07 MPa in 0.06 wt% Er, and 187.88 MPa in 0.1 wt% Er addition. The addition of Er element to A356 aluminum alloy increased the tensile strength in all samples. When the results are examined closely, there is a 30% increase with Er addition compared to reference alloy; however, this value remains very close to each other regardless of Er content varying from 0.03 to 0.1 wt%. These results show that Er addition improves the mechanical properties of A356 alloy and makes a positive contribution to the tensile stress. Similar findings were reported in the literature which was mainly attributed to the decreased grain size [19,26]. Sahin [18] reported a 28% increase in UTS with the highest value of 177 MPa in A356 alloy.
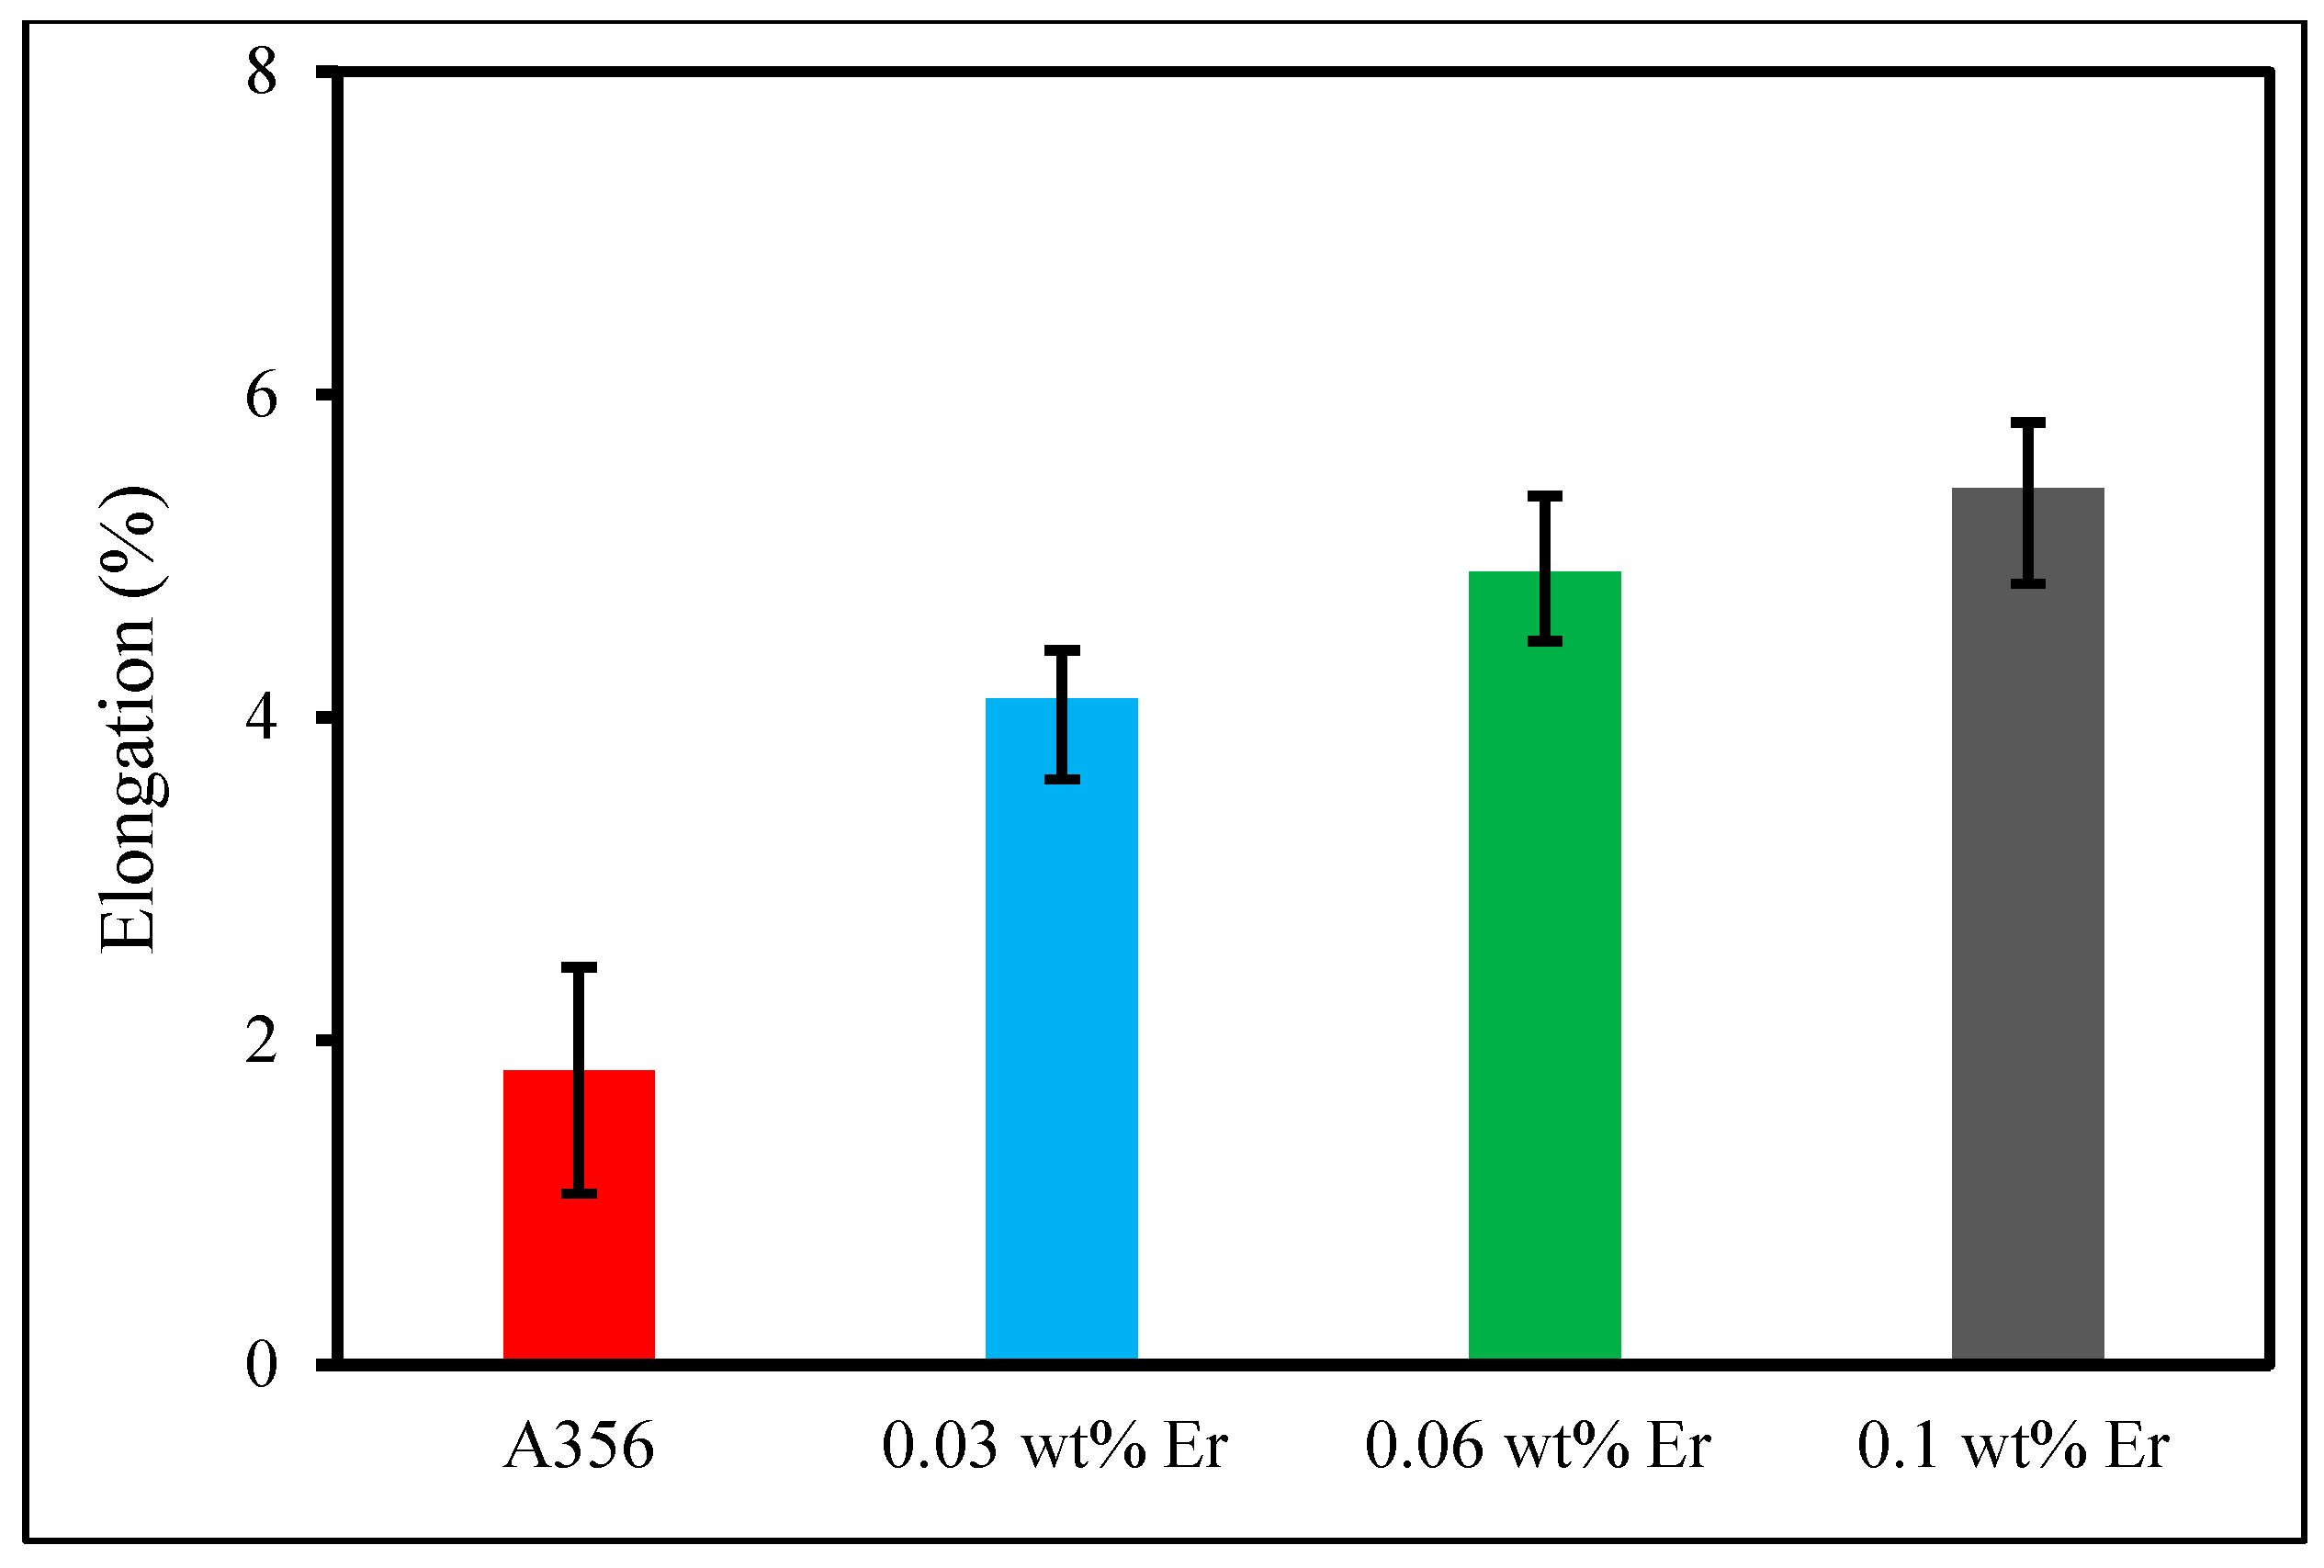
Figure 5 shows the changes in the elongation at fracture values with Er addition to A356 alloy. Toughness strength data were obtained from the tensile test results. The area under the curve in the stress strain graphs of the samples gave us the toughness value.
When the elongation values given in Figure 5 are examined, it is seen that the addition of Er increases the ductility of the material. The elongation, which was 1.8% in reference casting, increased to 4.1% with 0.03 wt% Er addition, and to 4.9% and 5.4% for 0.06 and 0.1 wt% Er additions, respectively. This shows that Er addition improves the deformation capability of the material by increasing ductility. When the toughness values were analyzed, it was found that the addition of Er had a significant positive contribution to the A356 alloy toughness. The toughness value was 2122 kJ/m3 in the alloy without Er addition, which was then increased to 6353 kJ/m3 with 0.03% Er addition, 7758 kJ/m3 with 0.06% Er addition, and 8966 kJ/m3 with 0.1% Er addition. These findings reveal that the addition of Er increases the energy absorption capacity of the alloy significantly, almost 4 times higher.
Research on the effects of Er addition on the mechanical properties of Al-Si-Mg alloys usually start from 0.1 wt% Er in the alloy and above. However, to the knowledge of the authors, no reports were found where lower addition ratios of Er were evaluated. In particular, when Er was high in the alloy [17,18], intermetallic phase quantity was increased in the matrix. Thus, it is also reported that the addition of high amounts of Er can have adverse effects on the mechanical properties. These findings suggest that the addition of Er content needs to be carefully optimized, and the performance of Al-Si-Mg alloys can be significantly improved by using appropriate amounts.
Pandee [26] investigated the addition of Er to Al-7Si-0.3Mg cast alloy as an effective method to improve tensile strength. In particular, the addition of 0.2 wt% Er significantly improves the tensile strength of the casting, and this improvement is associated with optimizing the microstructure, i.e., finer grain size. However, the addition of higher amounts of Er increases the formation of Er-containing intermetallic phases, which may lead to a slight decrease in tensile strength. Therefore, the amount and process of Er additions should be carefully controlled so that the mechanical properties of the alloy can be maximally maintained.
Wen [20] studied the effect of Er on the microstructure and mechanical properties of Al-Mg-Mn-Zr alloys. It was found that the addition of 0.2 wt% Er increases the tensile strength of the alloy by 50% by promoting the formation of secondary Al3Er precipitates. These precipitates improve the performance of the material by providing strength even at high temperatures. However, increasing the amount of Er more than 0.2 wt% leads to the formation of primary Al3Er, forming undesirable structures at the grain boundaries, which has a negative effect on the mechanical properties. However, there are currently no reported works in the literature on the fatigue or wear resistance with Er additions to aluminum alloys. Regarding the observed behaviors reported in the literature on the effects of Er in aluminum alloys, it is believed that fatigue strength could also be increased as long as the Er additions are below 0.2 wt%. However, the presence of Er containing intermetallic phases could aid the wear resistance in the required application areas.
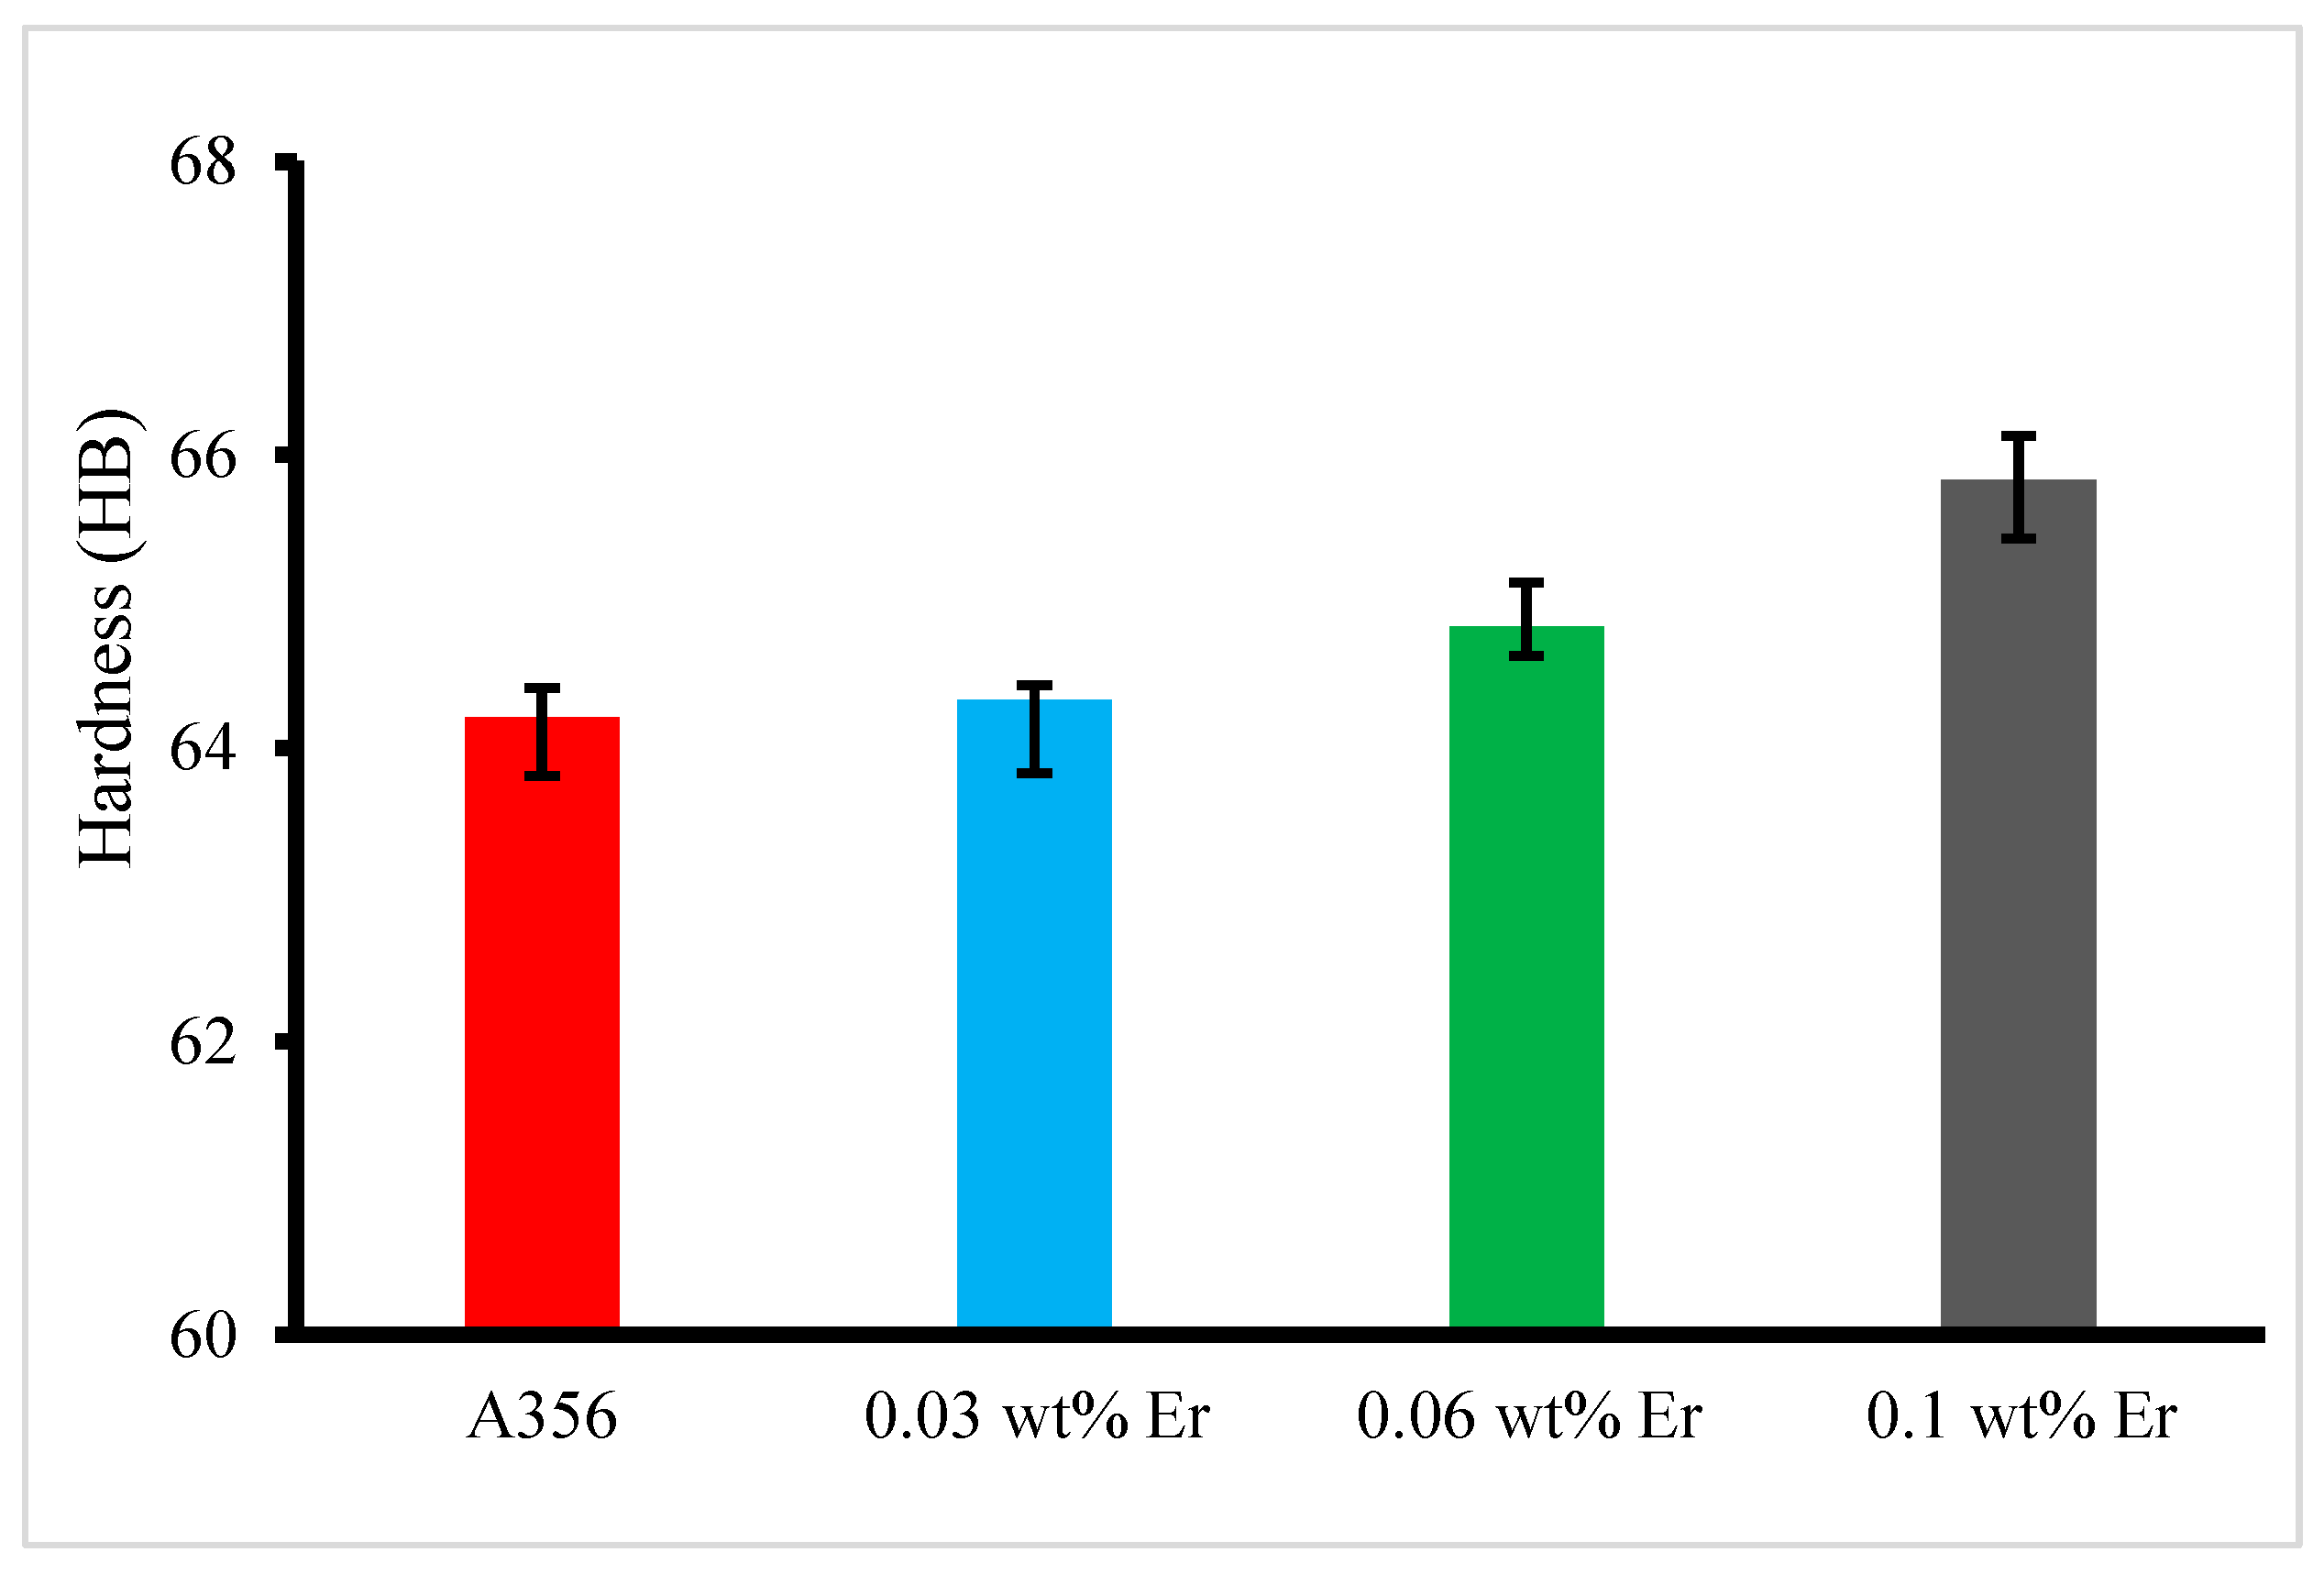
The hardness measurements of the samples obtained from liquid metal castings with different ratios of Er addition to A356 alloy without addition are given in Figure 6. When the data in Figure 6 is examined, it is determined that the average hardness values in the casting without Er addition are 64.2 HB, and in the casting with 0.03, 0.06, and 0.1 wt% Er addition the hardness values were 64.33, 64.83, 65.83 HB, respectively. It is seen that the Er addition causes almost no increase in hardness. In the study conducted by Gao [28], it is stated that Er addition increased the hardness only by 4 units in pure aluminum.

3.2. Microstructure Results

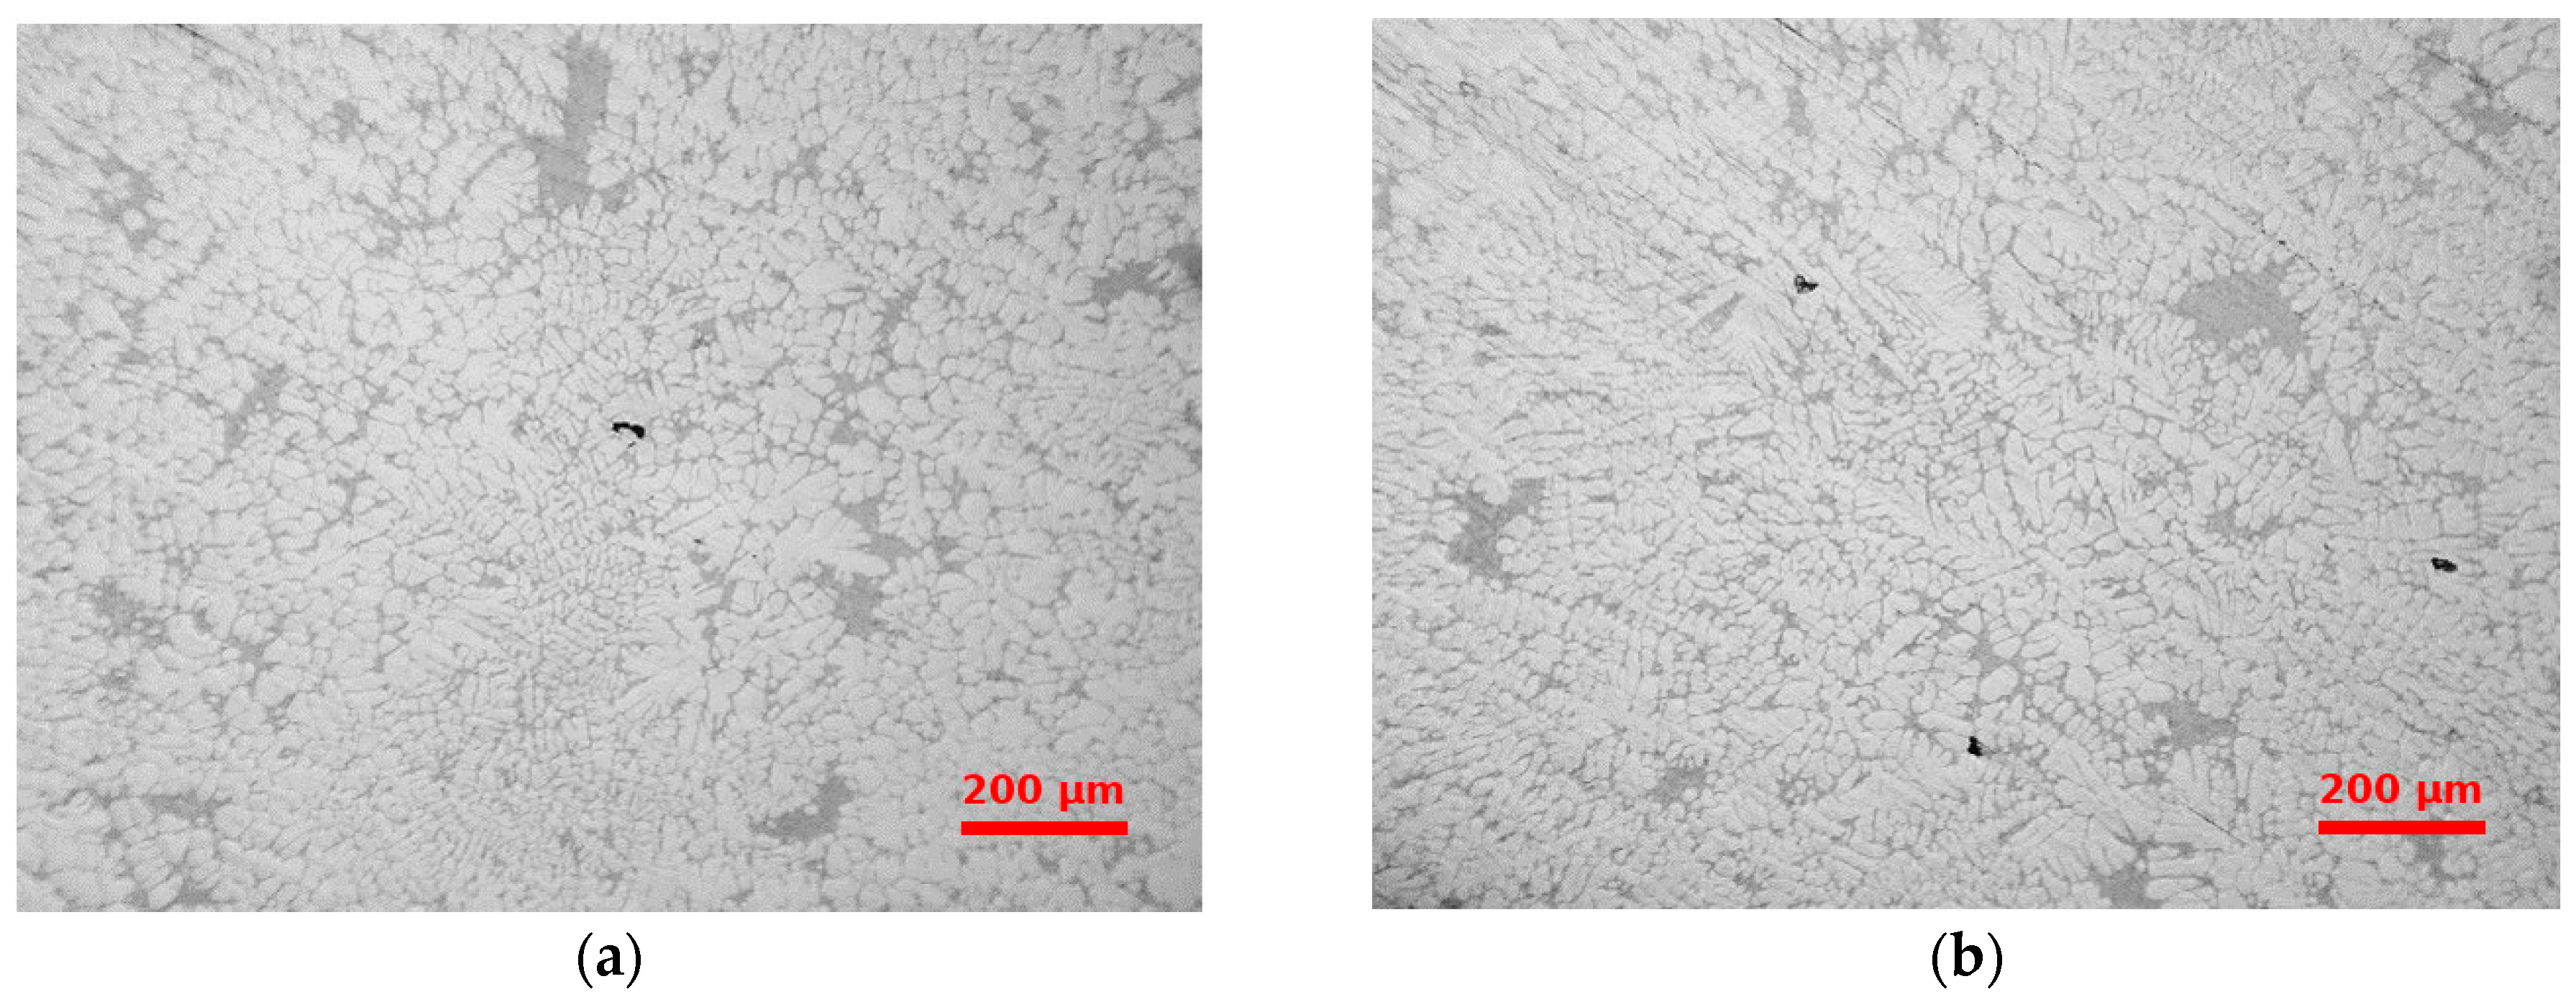
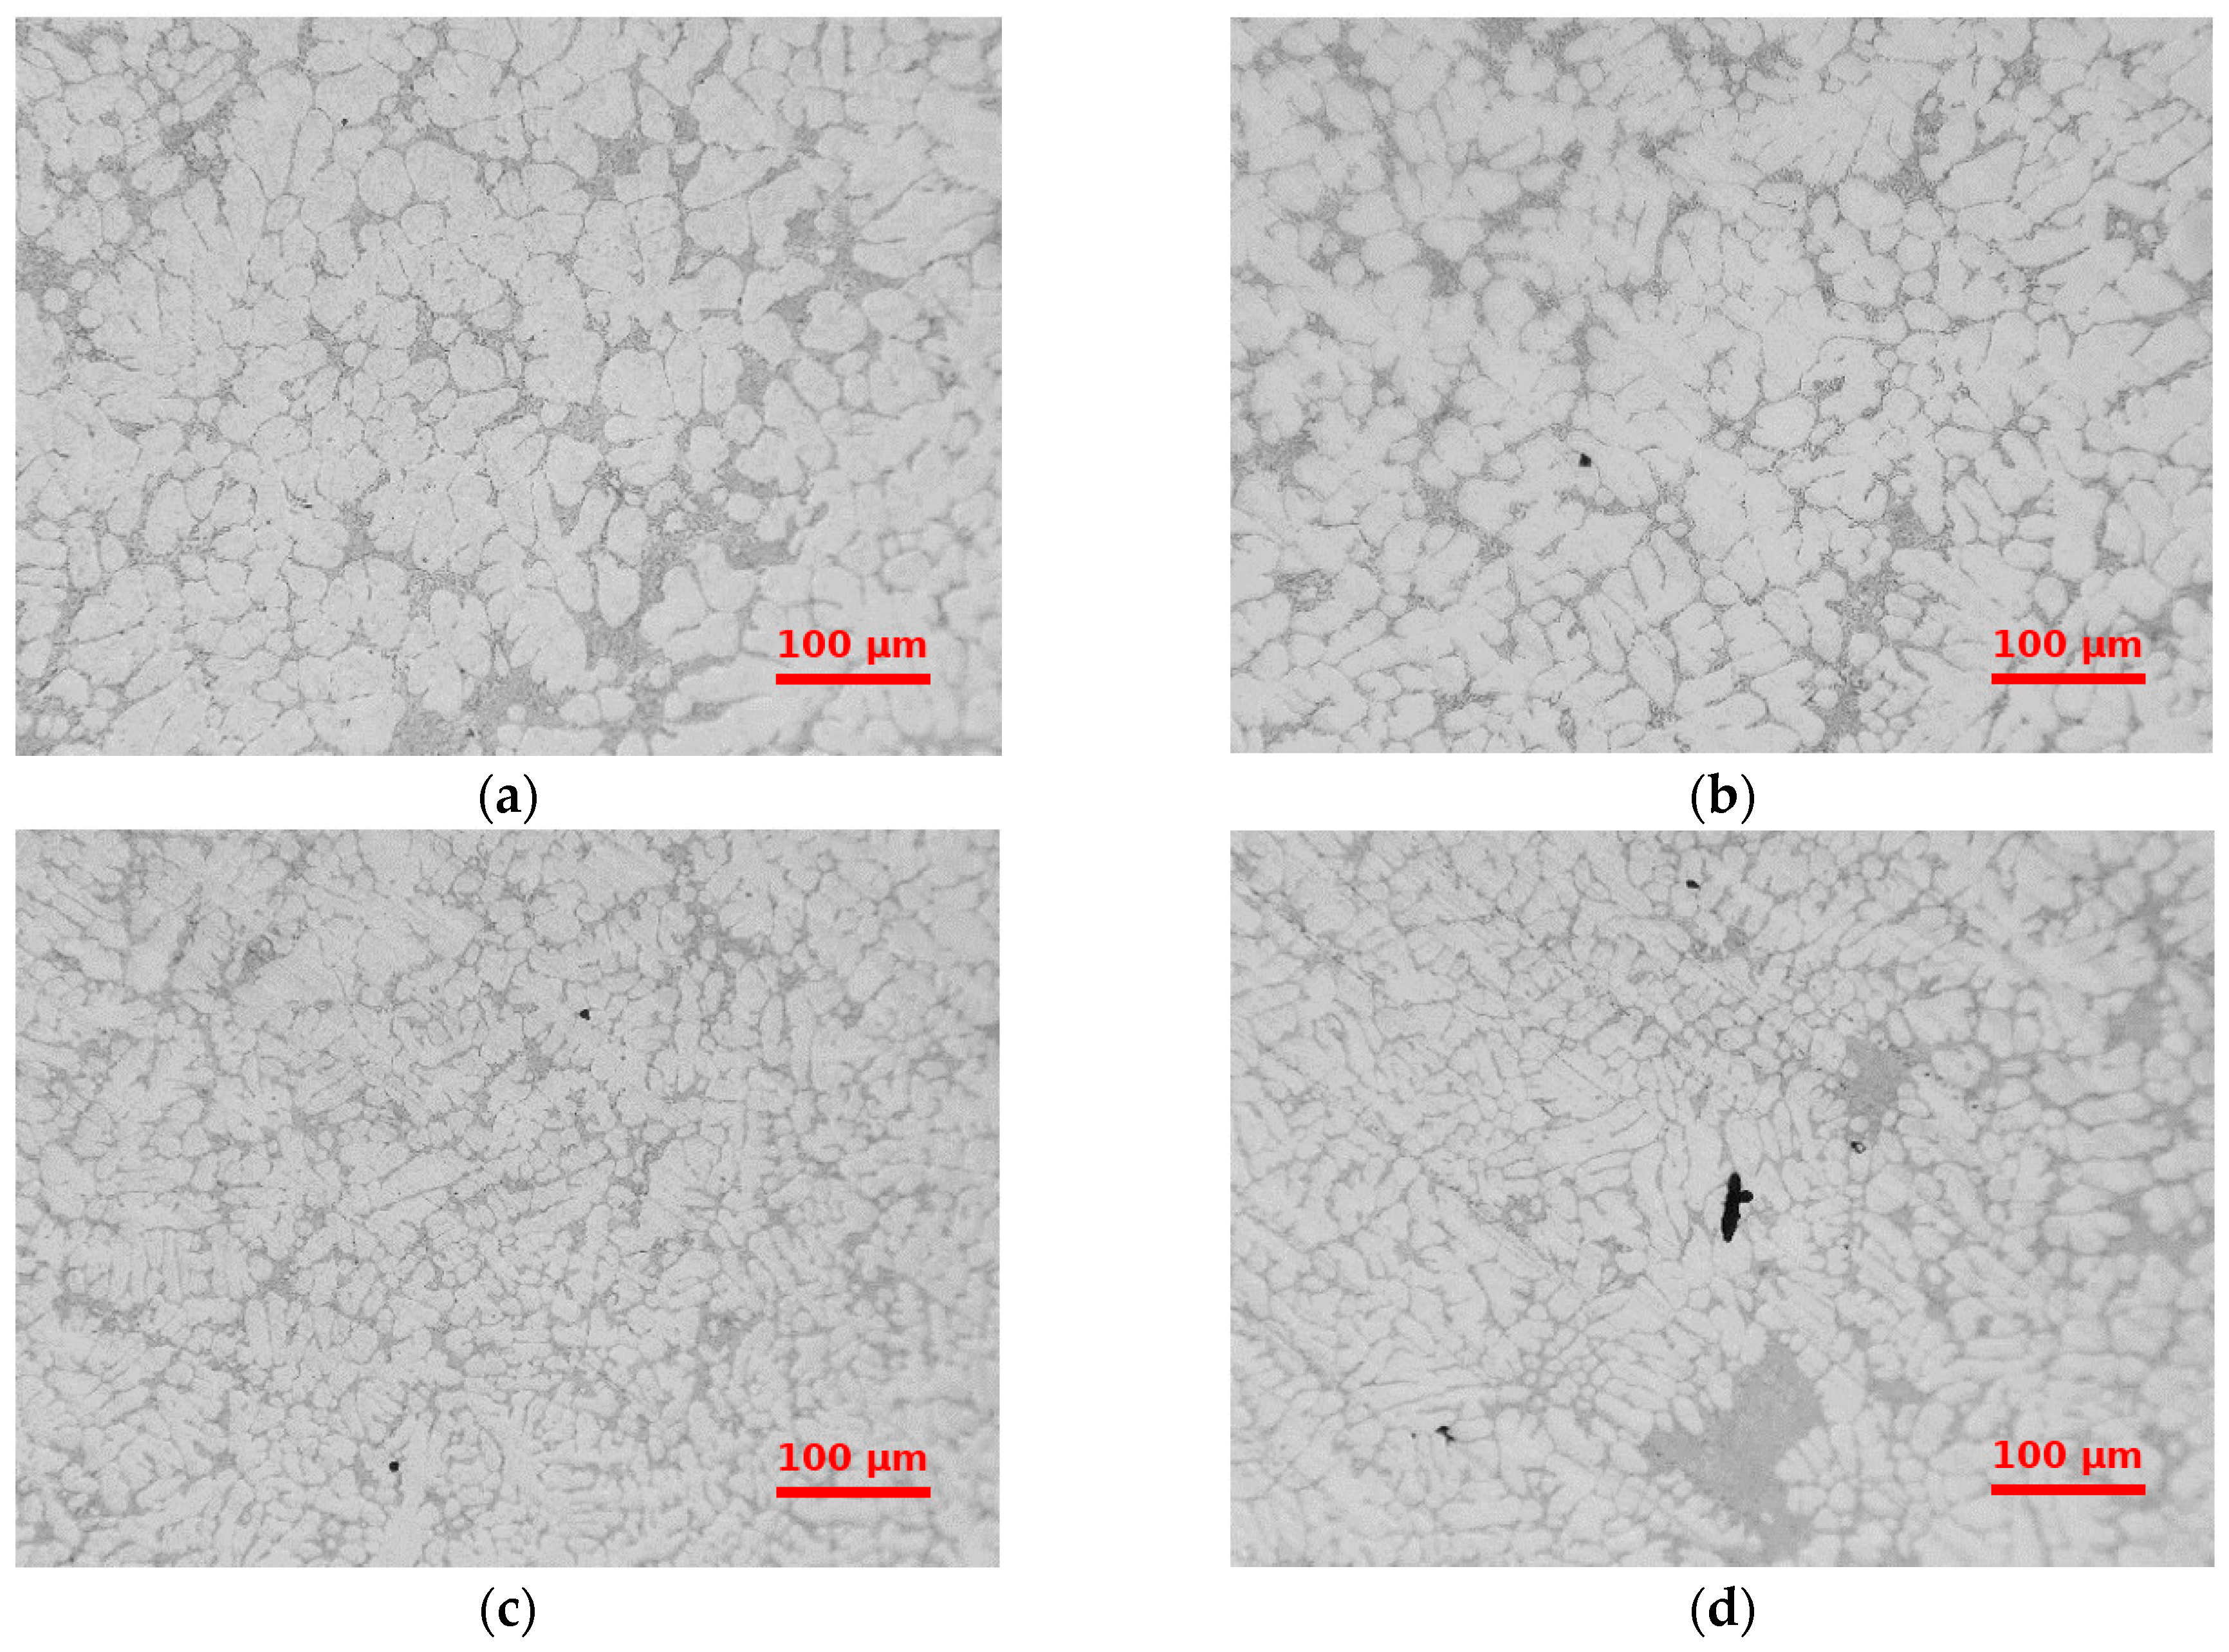
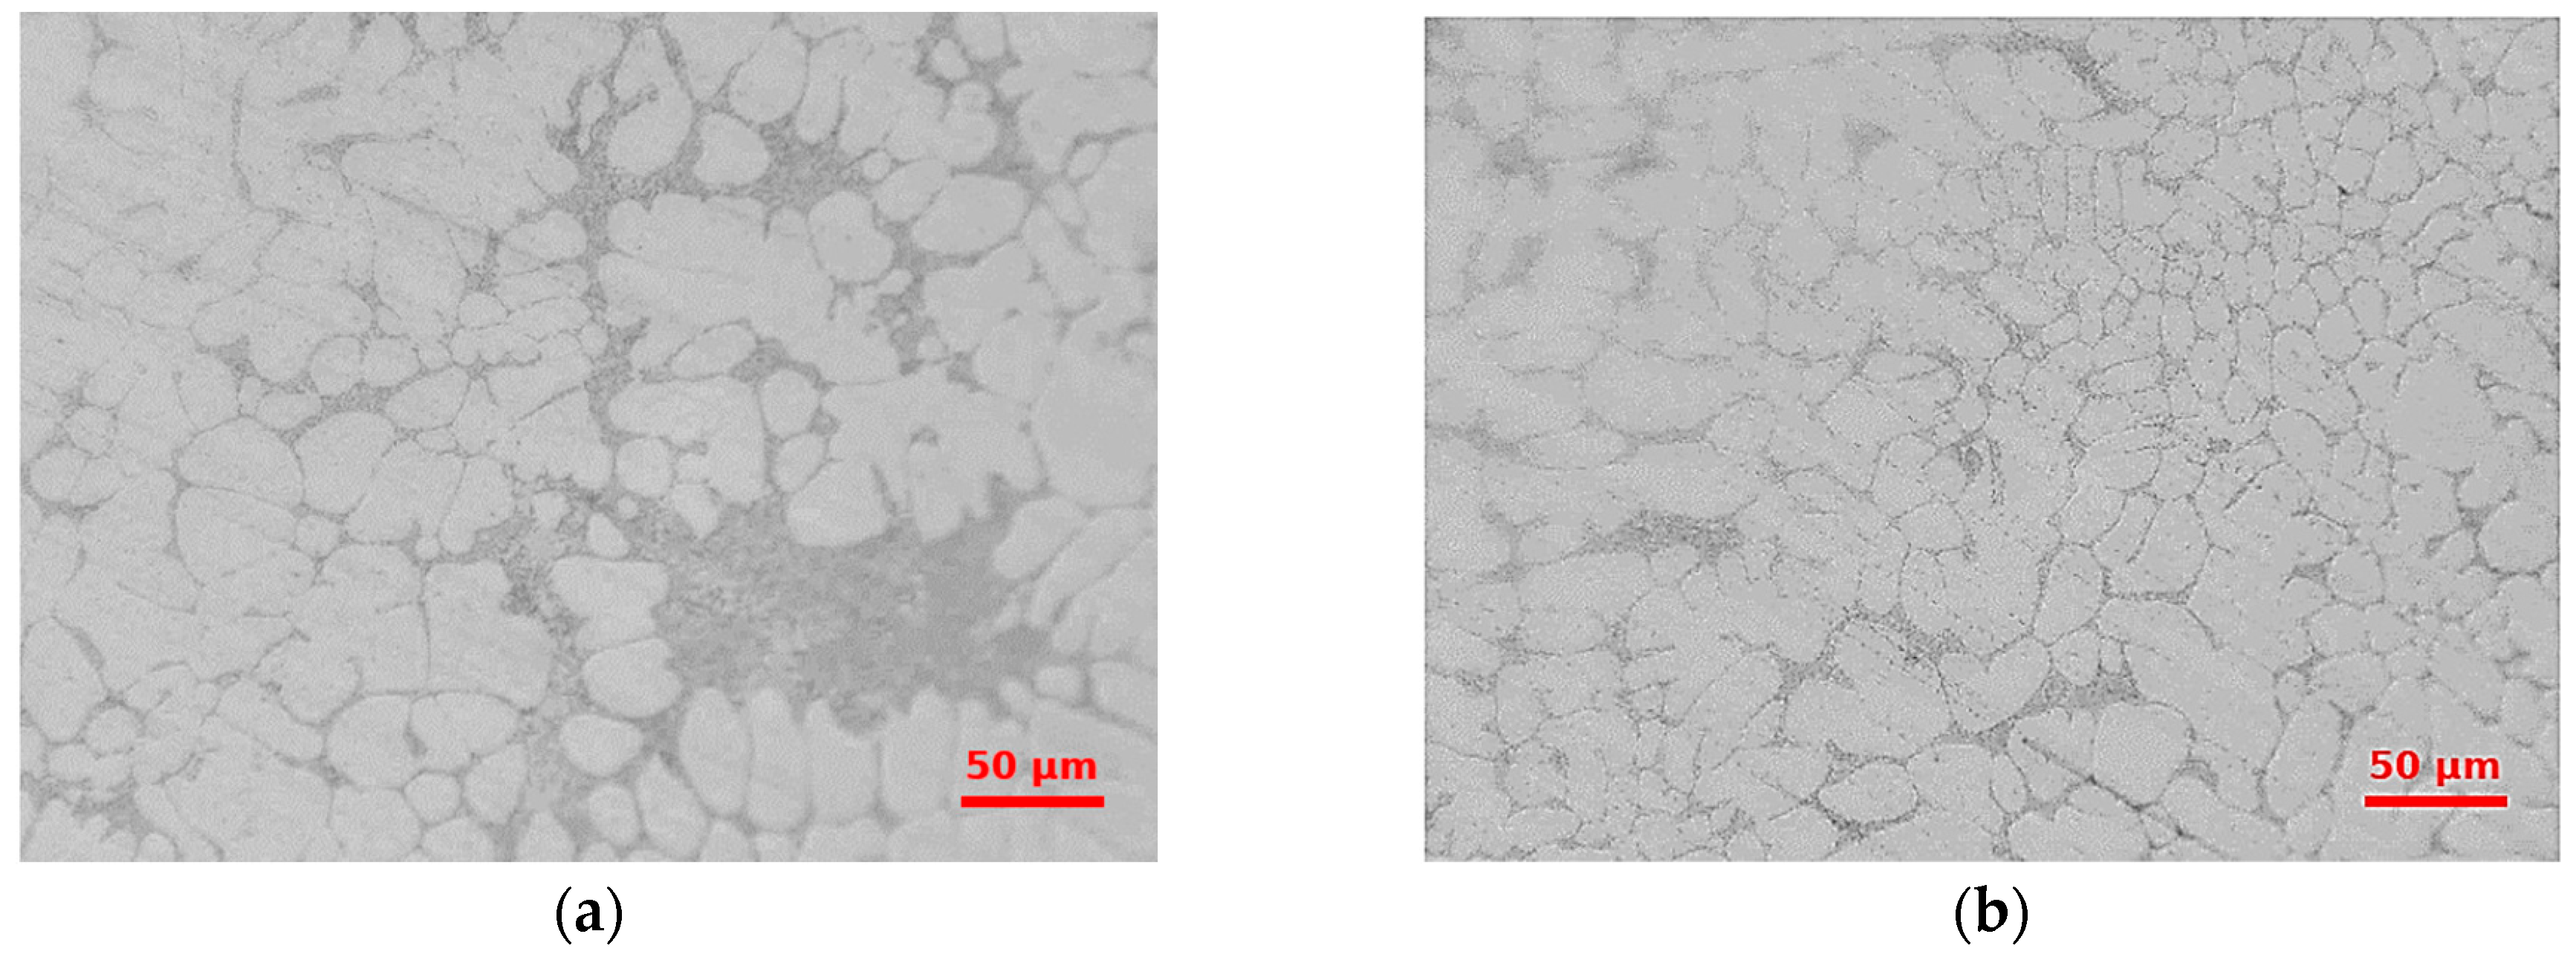
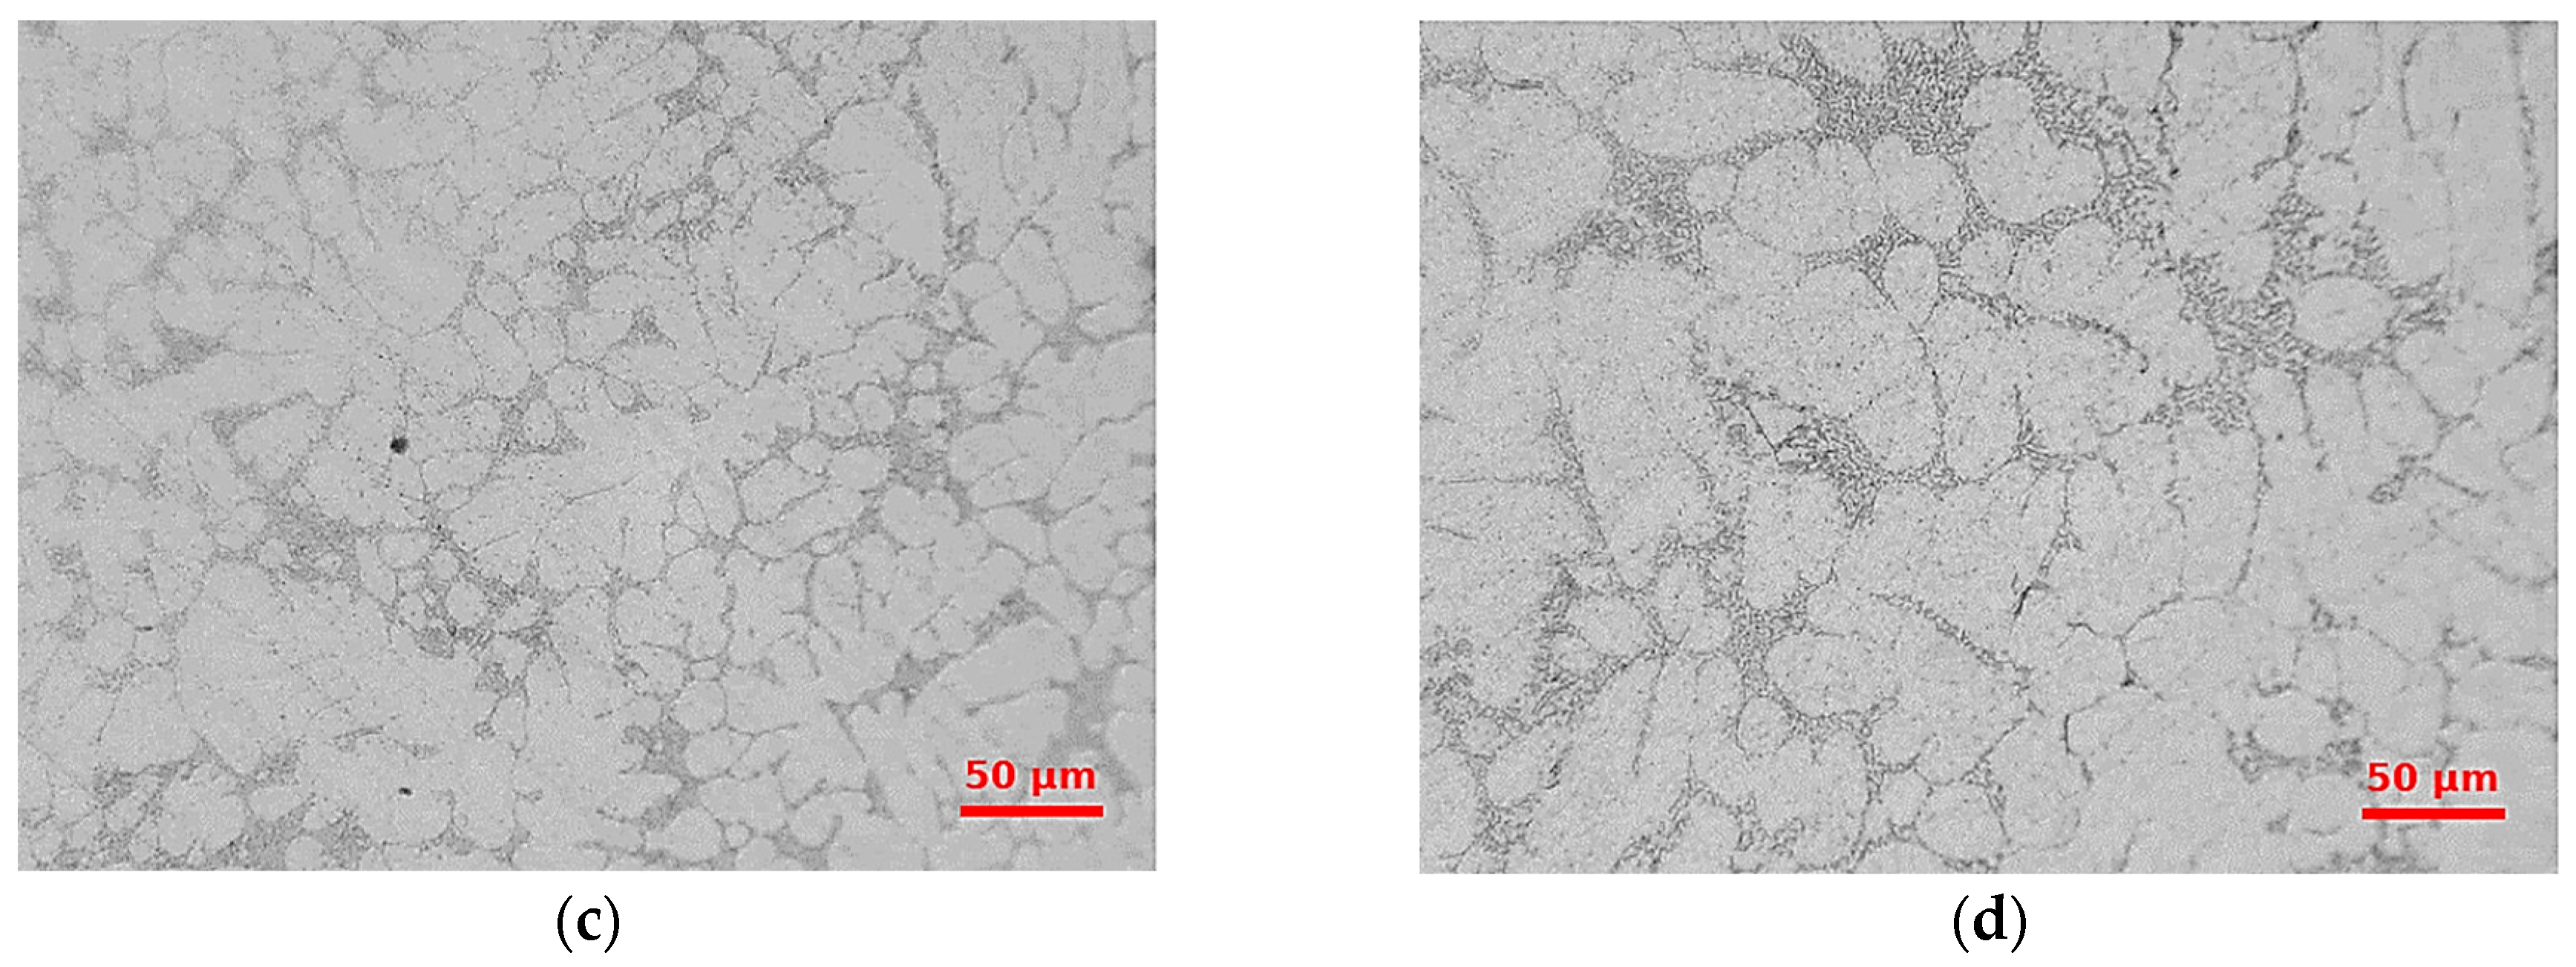
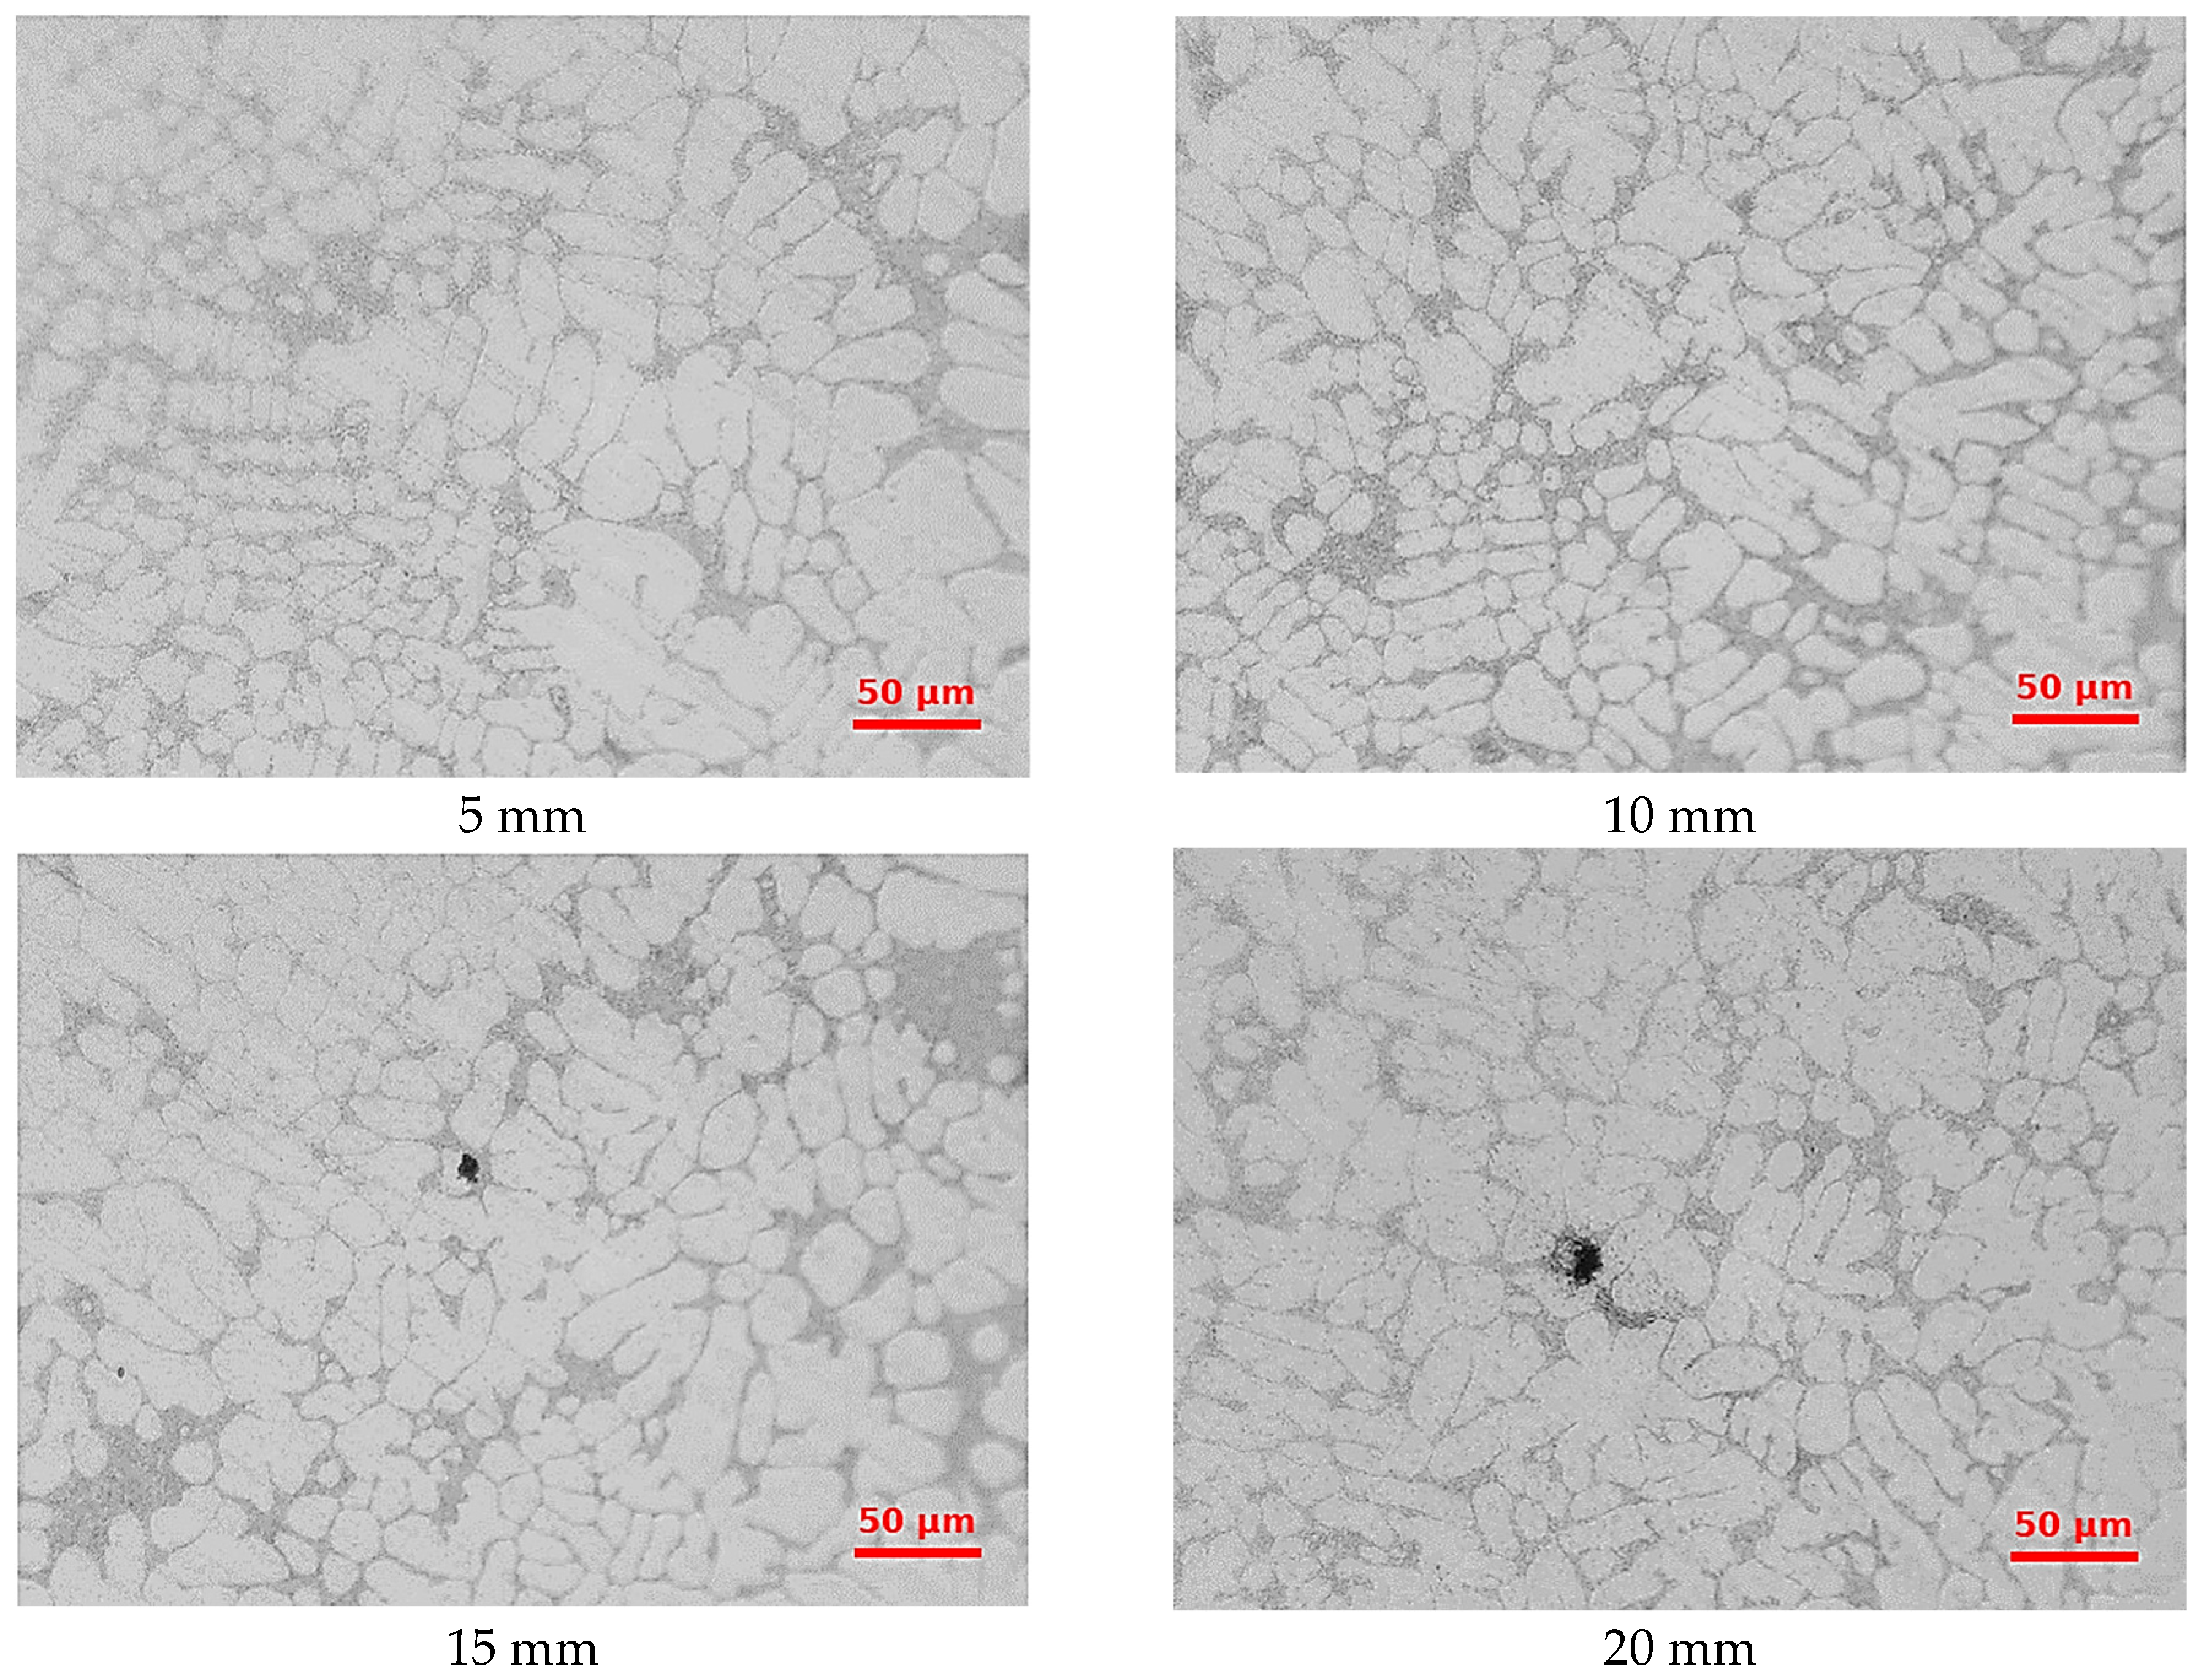
In microstructural analyses, samples were taken from each section of the stepped mold in order to examine the effect of section thickness on solidification. In order to see the effect of Er addition from the 10 mm section sample, images taken at 50× magnification are given in Figure 7, images taken at 100× magnification are given in Figure 8, and images taken at 200× magnification are given in Figure 9. Microstructure images of the cast sample with 0.06% Er addition for 5, 10, 15, and 20 mm section thicknesses are given in Figure 10.
When the microstructure images presented in these figures are examined, it is seen that the grain structures change with both Er content and cooling rate. Microstructure analyses revealed that the secondary arms become finer with increased cooling rate and increased Er content. In the study where the effect of Er addition at varying rates to A319 alloy on microstructure and mechanical properties was investigated, it was observed that the grain size of primary α-Al significantly decreased and eutectic silicon transformed from a flake-like structure to a lamellar or transitional lamellar structure [38]. In addition, alloying element additions such as TiB are used to refine grain size [39,40]. It is also known that Sr and CuSn5 alloys give effective results as modifiers in eutectic Al-Si alloys [41]. The secondary dendrite arm spacing (SDAS) and secondary dendrite arm length (SDAL) were measured from optical micrographs to evaluate the effects of cooling rate and Er addition on microstructure. The cooling rate values in Figure 2 for each step were calculated to be 1.9, 0.8, 0.5, and 0.3 °C/s.
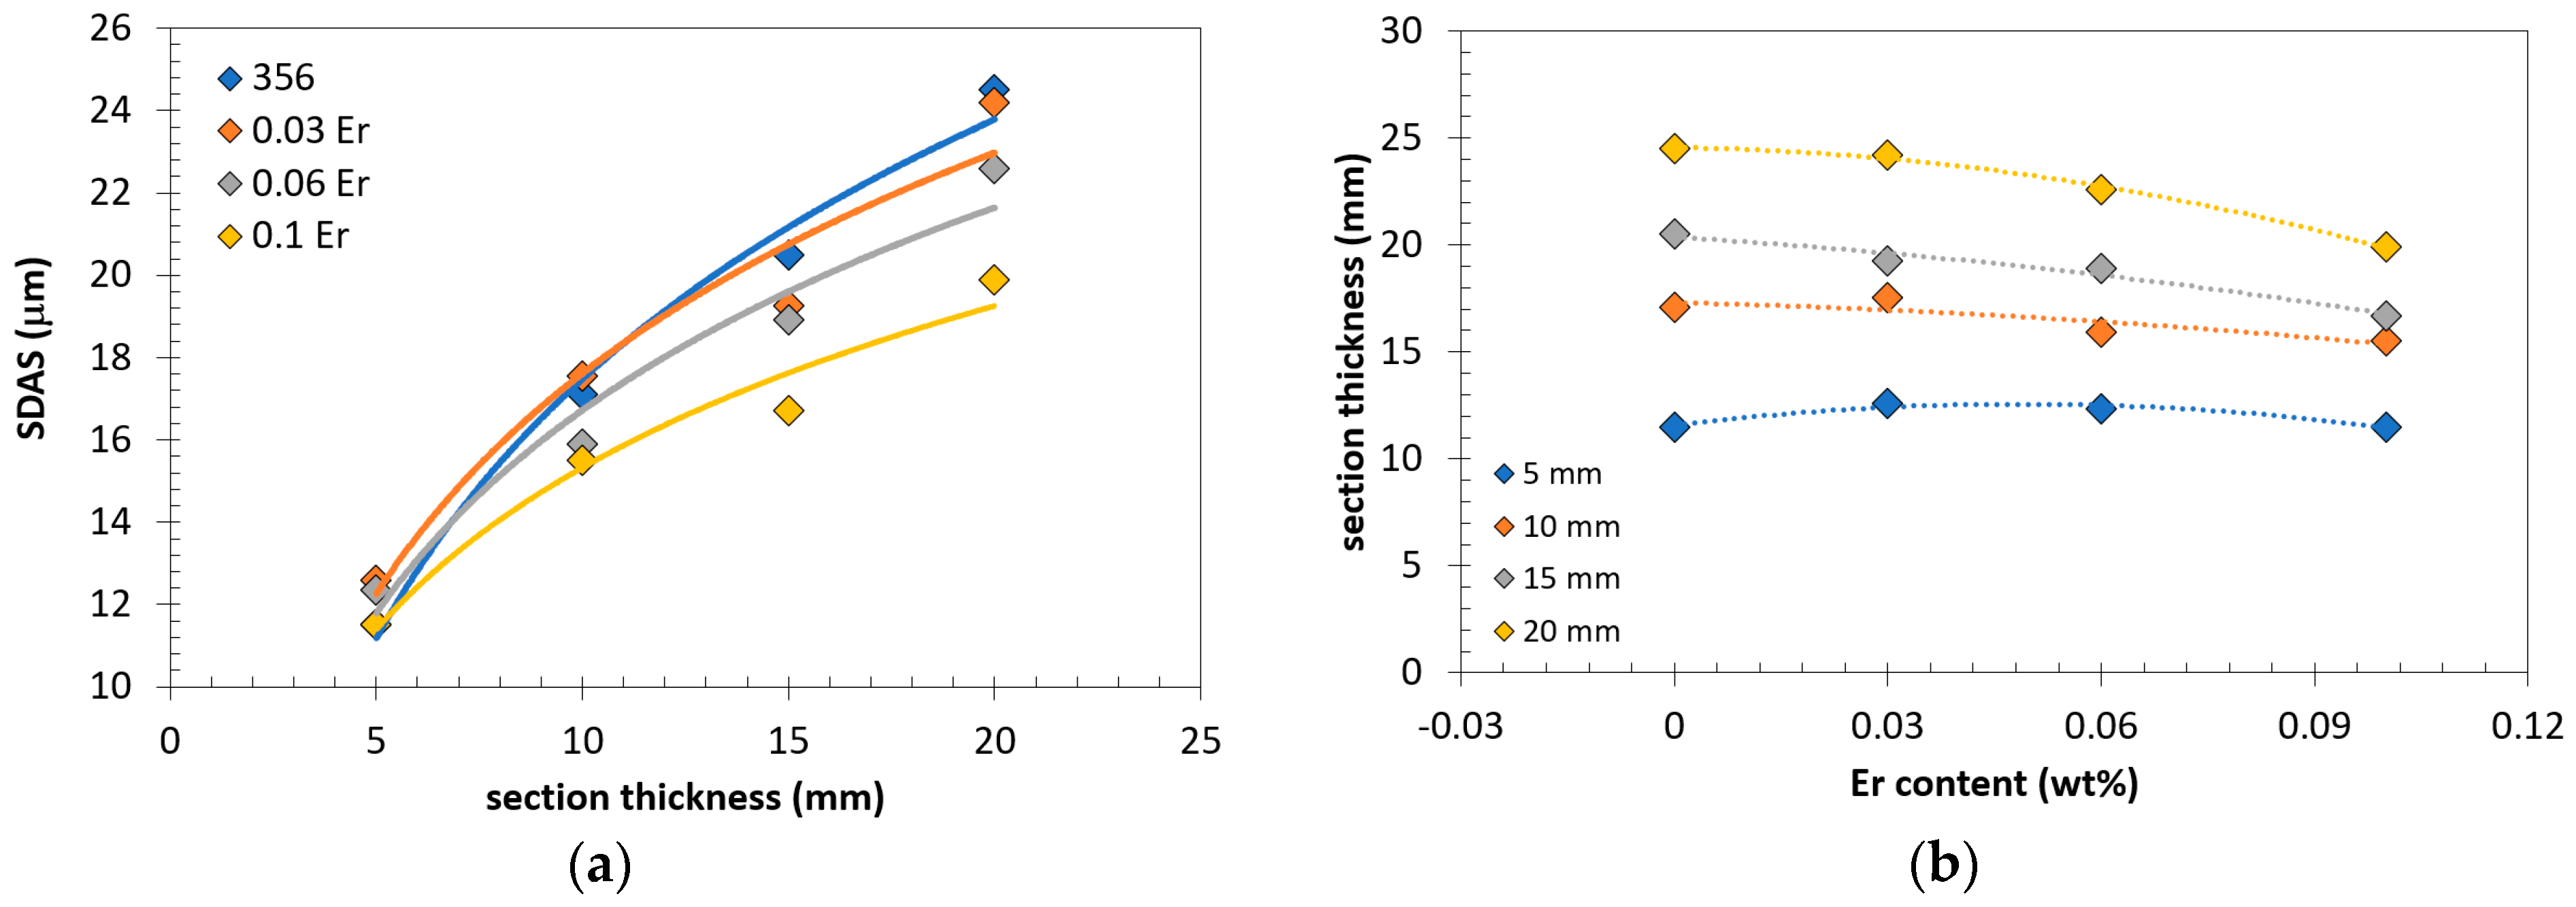
Figure 11 shows how SDAS values change depending on the step thickness. The line method was used to measure SDAS, and an average of 20 measurements were reported in the graphs. Error bars were not used because the visual interpretation of the data would look too complicated, but the standard deviation for all the measurements were within ±4 micron. The SDAS values for the 5 mm thick step were determined as 11.5 µm, 12.6 µm, 12.35 µm, and 11.5 µm, respectively. For the 10 mm thick step, these values were measured as 17.5 µm, 17.55 µm, 15.9 µm, and 15.55 µm. The SDAS values for the 15 mm thick step were recorded as 20.45 µm, 19.25 µm, 18.9 µm, and 16.7 µm, respectively. Finally, the SDAS values of the 20 mm thick step were determined as 24.46 µm, 24.2 µm, 22.66 µm, and 19.93 µm. As seen in Figure 11a, SDAS values decrease logarithmically with increased Er content. Based on the change in SDAS by section thickness (Figure 11b), it can be seen that at 5 mm thickness, SDAS does not seem to be affected by the Er content. At 10 mm, there is a slight decreasing trend in SDAS by Er content. The highest pronounced decrease was observed at 20 mm thickness.
Figure 12 shows the changes in SDAL values depending on the section thickness. SDAL was considered as the length of a single dendrite where the SDAS (which is the width) was used. The SDAL values for the 5 mm thick step were determined as 47.8 µm, 59.8 µm, 55.1 µm, and 49.2 µm. For the 10 mm thick step, these values were measured as 58.4 µm, 64.2 µm, 59.6 µm, and 53.4 µm. The SDAL values of the 15 mm thick step were recorded as 68.2 µm, 73.8 µm, 70.2 µm, and 68.4 µm, respectively. The SDAL values for the 20 mm thick step were determined as 82.4 µm, 85.6 µm, 81.2 µm, and 72.3 µm. For the unadded A356 alloy, the SDAL values corresponding to the steps of 5, 10, 15, and 20 mm thicknesses were measured as 48 µm, 58 µm, 68 µm, and 82 µm, respectively. It was determined that the increase in the cooling rate (decrease in section thickness) caused a decrease in the SDAL and SDAS values. The data obtained are in agreement with the previous casting studies and confirm that the cooling rate is an important factor in determining the microstructural properties of A356 alloys. In the studies conducted by Shi [19], while the average size of α-Al grains without addition was 85.6 μm, 0.1% Er addition reduced this value to 57.3 μm. Increasing the Er addition amount to 0.2% reduced the size of α-Al grains further down to 42.6 μm, while the lowest value of 22.2 μm was reached with 0.3% Er addition. However, an increase in the size of α-Al grains was observed again with 0.4% Er addition, reaching 47.1 μm.
Another important factor for the microstructural changes in a cast alloy is the cooling rate of the liquid metal in the mold. The research of Sheykh-Jaberi [42] has comprehensively investigated the effects of the cooling rate on the microstructure of A356 aluminum alloy. In the study, microstructural changes obtained with different cooling rates were analyzed. According to the findings, the SDAS value was measured as 43 µm at a cooling rate of 1.8 K/s, 90 µm at a cooling rate of 0.12 K/s, and 124 µm at a cooling rate of 0.08 K/s. These results show that there is a significant increase in the SDAS values with the decrease in the cooling rate. Jeon and Bae [43] investigated the effects of cooling rate on microstructure by using a sand mold with section thicknesses of 5, 10, 15, and 20 mm. It has been stated that the elements La and Ce in A356 and A413 alloys containing 6–11% Si cause changes in the melting point and eutectic temperature of the alloy. In the study, it was emphasized that 0.2% Ce decreases the melting point by approximately 6 C. In addition, the increase in the solidification range with the addition of rare earth elements leads to the formation of significant shrinkage [44]. The cooling rates corresponding to these thicknesses were reported as 1.9, 0.8, 0.5, and 0.3 °C/s, respectively. SDAS values for these cooling rates were determined as 30, 40, 55, and 70 µm, respectively, which is given in Figure 13. As can be seen, as the cooling rate increases SDAS and SDAL decreases logarithmically.
Although detailed phase analysis was not performed via XRD or SEM-EDX in this study, previous investigations [17,19,24,28,29] have reported that Er addition can result in the formation of Al3Er and Er–Fe intermetallic phases, which act as potent nucleation sites for α-Al grains and contribute to grain refinement. Furthermore, Er is known to suppress coarse eutectic Si formation by promoting a more fibrous or lamellar morphology, especially under increased cooling rates. These findings support the observed improvements in mechanical properties and finer SDAS values reported in this study.

4. Conclusions

The results obtained from the experimental studies are given below.
  • The analyses clearly showed that Er addition has significant effects on the mechanical properties of A356 aluminum alloy. While the tensile stress values were 141.5 MPa in the casting without Er addition, these values increased by at least 30% to 185.4 MPa in 0.03 wt% Er addition, 187.0 MPa in 0.06 wt% Er addition, and 187.8 MPa in 0.1 wt% Er addition.
  • When the elongation values were examined, it was seen that the Er addition improved the ductility of the material. The elongation rate, which was 1.816% in the casting without the Er addition, increased 4 times to 4.1% with the addition of 0.03 wt% Er, to 4.9% with the addition of 0.06 wt% Er, and to 5.4 wt% with the addition of 0.1% Er.
  • When looking at the toughness values, it was determined that Er addition made a significant contribution to the A356 alloy in a positive way in terms of mechanical properties. The toughness value, which was 2122 kJ/m3 in the alloy without Er addition, was determined as 6353 kJ/m3 with 0.03 wt% Er addition, 7758 kJ/m3 with 0.06 wt% Er addition, and 8966 kJ/m3 with 0.1 wt% Er addition.
  • With regard to the cooling rate, the SDAS was not affected by Er content at 5 mm thickness; however, as the thickness was increased to 20 mm, the SDAS values were decreased logarithmically from 24 to 18 μm.

Author Contributions

Conceptualization, M.C.; methodology, M.C., E.A.M., M.T. and D.D.; formal analysis, M.C., E.A.M. and M.T.; investigation, M.C., E.A.M. and M.T.; writing—original draft, M.C. and M.T.; writing—review and editing, M.C. and D.D.; supervision, D.D. All authors have read and agreed to the published version of the manuscript.

Funding

This research was funded by Bayburt University Scientific Research Projects Coordination (2023/69003-01) and APC is covered by SINTEF.

Data Availability Statement

The original contributions presented in this study are included in the article. Further inquiries can be directed to the corresponding author.

Conflicts of Interest

Author Derya Dispinar was employed by the company SINTEF Industry. The remaining authors declare that this research was conducted in the absence of any commercial or financial relationships that could be construed as a potential conflict of interest.

References

  1. Sigworth, G.K. Grain Refining of Aluminum Casting Alloys: Unsolved Mysteries. Int. J. Met. 2024, 18, 1–30. [Google Scholar] [CrossRef]
  2. Uyan, T.Ç.; Otto, K.; Silva, M.S.; Vilaça, P.; Armakan, E. Industry 4.0 Foundry Data Management and Supervised Machine Learning in Low-Pressure Die Casting Quality Improvement. Int. J. Met. 2023, 17, 414–429. [Google Scholar] [CrossRef]
  3. Lazaro-Nebreda, J.; Patel, J.B.; Lordan, E.; Zhang, Y.; Karakulak, E.; Al-Helal, K.; Scamans, G.M.; Fan, Z. Degassing of Aluminum Alloy Melts by High Shear Melt Conditioning Technology: An Overview. Metals 2022, 12, 1772. [Google Scholar] [CrossRef]
  4. Gyarmati, G.; Kéri, Z.; Mende, T.; Molnár, D. Analysis of the Quality of Incoming AlSi9Mn Alloy Ingots. Int. J. Met. 2024, 18, 1723–1738. [Google Scholar] [CrossRef]
  5. Gyarmati, G.; Pálóczi, Á.; Somfai, D.; Ferenczi, T.; Mende, T.; Kéri, Z. Analysis of Different Commercial Solid Fluxes Used During the Rotary Degassing Melt Treatment of Casting Aluminum Alloys. Met. Mater. Trans. B 2025, 56, 782–797. [Google Scholar] [CrossRef]
  6. Zhang, Q.; Liljenfors, T.; Jansson, S.; Jonsson, S.; Jarfors, A.E. Effect of Na-based flux on melt quality assessment of 46,000 alloys. J. Mater. Res. Technol. 2023, 27, 1830–1842. [Google Scholar] [CrossRef]
  7. Zhang, Q.; Liljenfors, T.; Jonsson, S.; Jarfors, A.E. On the application of reduced pressure test for the prediction of ductility of 46000 alloy: Role of pore’s morphology and distribution. J. Mater. Res. Technol. 2024, 31, 927–934. [Google Scholar] [CrossRef]
  8. Olofsson, J.; Bogdanoff, T.; Tiryakioğlu, M. On the Competition between Pores and Hidden Entrainment Damage during In Situ Tensile Testing of Cast Aluminum Alloy Components. Metals 2024, 14, 1175. [Google Scholar] [CrossRef]
  9. Olofsson, J.; Bogdanoff, T.; Tiryakioğlu, M.; Bramann, H.; Sturm, J. The Effect of Hidden Damage on Local Process Variability in Al-10 Pct Si Alloy High-Pressure Die Castings. Met. Mater. Trans. B 2025, 56, 595–607. [Google Scholar] [CrossRef]
  10. Bogdanoff, T.; Tiryakioğlu, M. An In Situ Study of Short Crack Initiation and Propagation During Fatigue Testing of a Hot Isostatically Pressed Al-7%Si-0.5%Mg (A357-T6) Alloy Specimen. Materials 2024, 17, 5928. [Google Scholar] [CrossRef]
  11. Bogdanoff, T.; Tiryakioğlu, M.; Liljenfors, T.; Jarfors, A.E.W.; Seifeddine, S.; Ghassemali, E. On the Effectiveness of Rotary Degassing of Recycled Al-Si Alloy Melts: The Effect on Melt Quality and Energy Consumption for Melt Preparation. Sustainability 2023, 15, 5189. [Google Scholar] [CrossRef]
  12. Nogita Kazuhiro Stuart, D. McDonald, and Arne K. Dahle. Eutectic modification of Al-Si alloys with rare earth metals. Mater. Trans. 2004, 45, 323–326. [Google Scholar] [CrossRef]
  13. Wang, J.; Li, F. Effect of Sm + Er and Heat Treatment on As-Cast Microstructure and Mechanical Properties of 7055 Aluminum Alloy. Materials 2023, 16, 4846. [Google Scholar] [CrossRef]
  14. Qin, T.; Fan, B.; Yu, J.; Bu, C.; Zhang, J. Effect of Erbium Micro-Additions on Microstructures and Properties of 2024 Aluminum Alloy Prepared by Microwave Sintering. Crystals 2024, 14, 382. [Google Scholar] [CrossRef]
  15. Xia, Y.; Wang, D.; Jia, J.; Wu, J.; Wang, Z.; Li, X.; Yuan, W.; Huang, J. An investigation on the precipitated phases and mechanical properties of cerium modified 2024 aluminum alloy. Mater. Werkst. 2020, 51, 1267–1273. [Google Scholar] [CrossRef]
  16. Savchenkov, S.; Kosov, Y.; Bazhin, V.; Krylov, K.; Kawalla, R. Microstructural Master Alloys Features of Aluminum–Erbium System. Crystals 2021, 11, 1353. [Google Scholar] [CrossRef]
  17. Colombo, M.; Gariboldi, E.; Morri, A. Er addition to Al-Si-Mg-based casting alloy: Effects on microstructure, room and high temperature mechanical properties. J. Alloys Compd. 2017, 708, 1234–1244. [Google Scholar] [CrossRef]
  18. Sahin, H.; Dispinar, D. Effect of Rare Earth Elements Erbium and Europium Addition on Microstructure and Mechanical Properties of A356 (Al–7Si–0.3Mg) Alloy. Int. J. Met. 2023, 17, 2612–2621. [Google Scholar] [CrossRef]
  19. Shi, Z.; Wang, Q.; Zhao, G.; Zhang, R. Effects of erbium modification on the microstructure and mechanical properties of A356 aluminum alloys. Mater. Sci. Eng. A 2015, 626, 102–107. [Google Scholar] [CrossRef]
  20. Wen, S.P.; Xing, Z.; Huang, H.; Li, B.; Wang, W.; Nie, Z. The effect of erbium on the microstructure and mechanical properties of Al–Mg–Mn–Zr alloy. Mater. Sci. Eng. A 2009, 516, 42–49. [Google Scholar] [CrossRef]
  21. Wu, Z.; Shi, Z.; Yan, H.; Luo, C.; Li, H.; Xie, X.; Nie, Q.; Hu, Z. Modification and strengthening mechanism of high strength-toughness as-cast Al–11Si–3Cu alloy modified with minor Sr and Er content. Mater. Sci. Eng. A 2024, 903, 146670. [Google Scholar] [CrossRef]
  22. Lei, X.; Zhang, Z.; Dong, H.; Wang, C.; Du, X. Effect of erbium on microstructure and mechanical properties of Al-Si-Mg-Cu alloy. Mater. Werkst. 2020, 51, 1389–1397. [Google Scholar] [CrossRef]
  23. Ou, L.; Xing, S.; Sun, T.; Zhao, B.; Yan, G. Effect of Mixed Rare Earth on the Iron Phase and Tensile Properties in Squeeze Casting 6066 Aluminum Alloys. Int. J. Met. 2024, 19, 1354–1368. [Google Scholar] [CrossRef]
  24. Li, M.; Shi, Z.; Wu, X.; Wang, H.; Liu, Y. Study of the Microstructure and Crack Evolution Behavior of Al-5Fe-1.5Er Alloy. Materials 2019, 12, 172. [Google Scholar] [CrossRef]
  25. Yuan, S.; Peng, J.; Wang, W.; Zhan, Y.; Zeng, J.; Gan, P.; Ji, J. Effects of Sc–Er Rare Earth on Solidification Microstructure and Mechanical Properties of A360 Alloy. Int. J. Met. 2024, 19, 1532–1545. [Google Scholar] [CrossRef]
  26. Pandee, P.; Patakham, U.; Limmaneevichitr, C. Microstructural evolution and mechanical properties of Al-7Si-0.3Mg alloys with erbium additions. J. Alloys Compd. 2017, 728, 844–853. [Google Scholar] [CrossRef]
  27. Schaffer, P.L.; Dahle, A.K. Settling behaviour of different grain refiners in aluminium. Mater. Sci. Eng. A 2005, 413–414, 373–378. [Google Scholar] [CrossRef]
  28. Gao, Z.; Li, H.; Lai, Y.; Ou, Y.; Li, D. Effects of minor Zr and Er on microstructure and mechanical properties of pure aluminum. Mater. Sci. Eng. A 2013, 580, 92–98. [Google Scholar] [CrossRef]
  29. Guo, W.; Chen, X.; Liu, P.; Yu, G.; Fu, S.; Fan, J.; Zhou, H.; Liu, H. Effects of Er Additions on the Microstructure, Mechanical Properties, and Electrical Conductivity of the Al-0.4 Fe-0.05 Si Alloy. Adv. Eng. Mater. 2021, 23, 2000955. [Google Scholar] [CrossRef]
  30. Peeratatsuwan, C.; Pandee, P.; Patakham, U.; Limmaneevichitr, C. Effect of erbium on the rheocast quality index of A356 semisolid feedstock. Mater. Sci. Technol. 2021, 37, 424–438. [Google Scholar] [CrossRef]
  31. Khrustalyov, A.P.; Kozulin, A.A.; Zhukov, I.A.; Nikitin, P.Y.; Sachkov, V.I.; Vorozhtsov, A.B. Effect of Al3Er Particles on the Structure, Mechanical Properties, and Fracture of AA5056 Alloy After Casting and Deformation Treatment. JOM 2021, 73, 3858–3865. [Google Scholar] [CrossRef]
  32. Baysal, E.; Koçar, O.; Kahrıman, F.; Köklü, U. Investigation of Microstructure, Hardness, Corrosion and Machinability Properties of Commercially Pure Aluminum alloyed with Rare-Earth Elements. Int. J. Met. 2025, 19, 1–21. [Google Scholar] [CrossRef]
  33. Gursoy, O.; Colak, M.; Tur, K.; Dispinar, D. Characterization of properties of Vanadium, Boron and Strontium addition on HPDC of A360 alloy. Mater. Chem. Phys. 2021, 271, 124931. [Google Scholar] [CrossRef]
  34. Çolak, M.; Yalçin, Ö. Investigation of the Effect of Niobium Addition on Fluidity and Mechanical Properties in Casting of Aluminum Alloys. Int. J. Met. 2025. [Google Scholar] [CrossRef]
  35. Çeker, M.; Çolak, M. Investigation of the Effect of Vanadium Addition on Mechanical Properties in A356 Aluminum Casting Alloys. Int. J. Met. 2024. [Google Scholar] [CrossRef]
  36. ASTM E10; Standard Test Method for Brinell Hardness of Metallic Materials. ASTM International: West Conshohocken, PA, USA, 2023.
  37. Erzi, E.; Gürsoy, Ö.; Yüksel, Ç.; Colak, M.; Dispinar, D. Determination of acceptable quality limit for casting of A356 aluminium alloy: Supplier’s quality index (SQI). Metals 2019, 9, 957. [Google Scholar] [CrossRef]
  38. Patel, D.N.; Sutaria, M.P. Effect of Trace Rare Earth Er Addition on Microstructure and Tensile Properties of 319 Al-Si-Cu Alloy. Int. J. Met. 2022, 16, 2199–2209. [Google Scholar] [CrossRef]
  39. Çolak, M.; Arslan, I. Investigation of the effect of the addition of grain refiner and modifier addition on wear properties in sand and permanent mould casting of A357 and A380 aluminium alloys. Int. J. Cast Met. Res. 2022, 35, 17–23. [Google Scholar] [CrossRef]
  40. Uslu, E.; Tiğli, A.; Çolak, M. The effect of cooling plate, mechanical vibration, and grain refinement on the microstructure and hardness of A380 produced by sand mold. Int. J. Cast Met. Res. 2024, 37, 108–116. [Google Scholar] [CrossRef]
  41. Çolak, M. Modification of eutectic Al–Si alloys by Sr and CuSn5. Mater. Res. Express 2019, 6, 1065a2. [Google Scholar] [CrossRef]
  42. Sheykh-Jaberi, F.; Cockcroft, S.; Maijer, D.; Phillion, A. Comparison of the semi-solid constitutive behaviour of A356 and B206 aluminum foundry alloys. J. Mater. Process. Technol. 2019, 266, 37–45. [Google Scholar] [CrossRef]
  43. Jeon, J.; Bae, D. Effect of cooling rate on the thermal and electrical conductivities of an A356 sand cast alloy. J. Alloys Compd. 2019, 808, 151756. [Google Scholar] [CrossRef]
  44. Samuel, A.M.; Zedan, Y.; Doty, H.W.; Songmene, V.; Samuel, F.H. Role of the Addition of La and Ce on the Cooling Characteristics and Porosity Formation in A356 and A413 Alloys. Int. J. Met. 2022, 16, 553–572. [Google Scholar] [CrossRef]
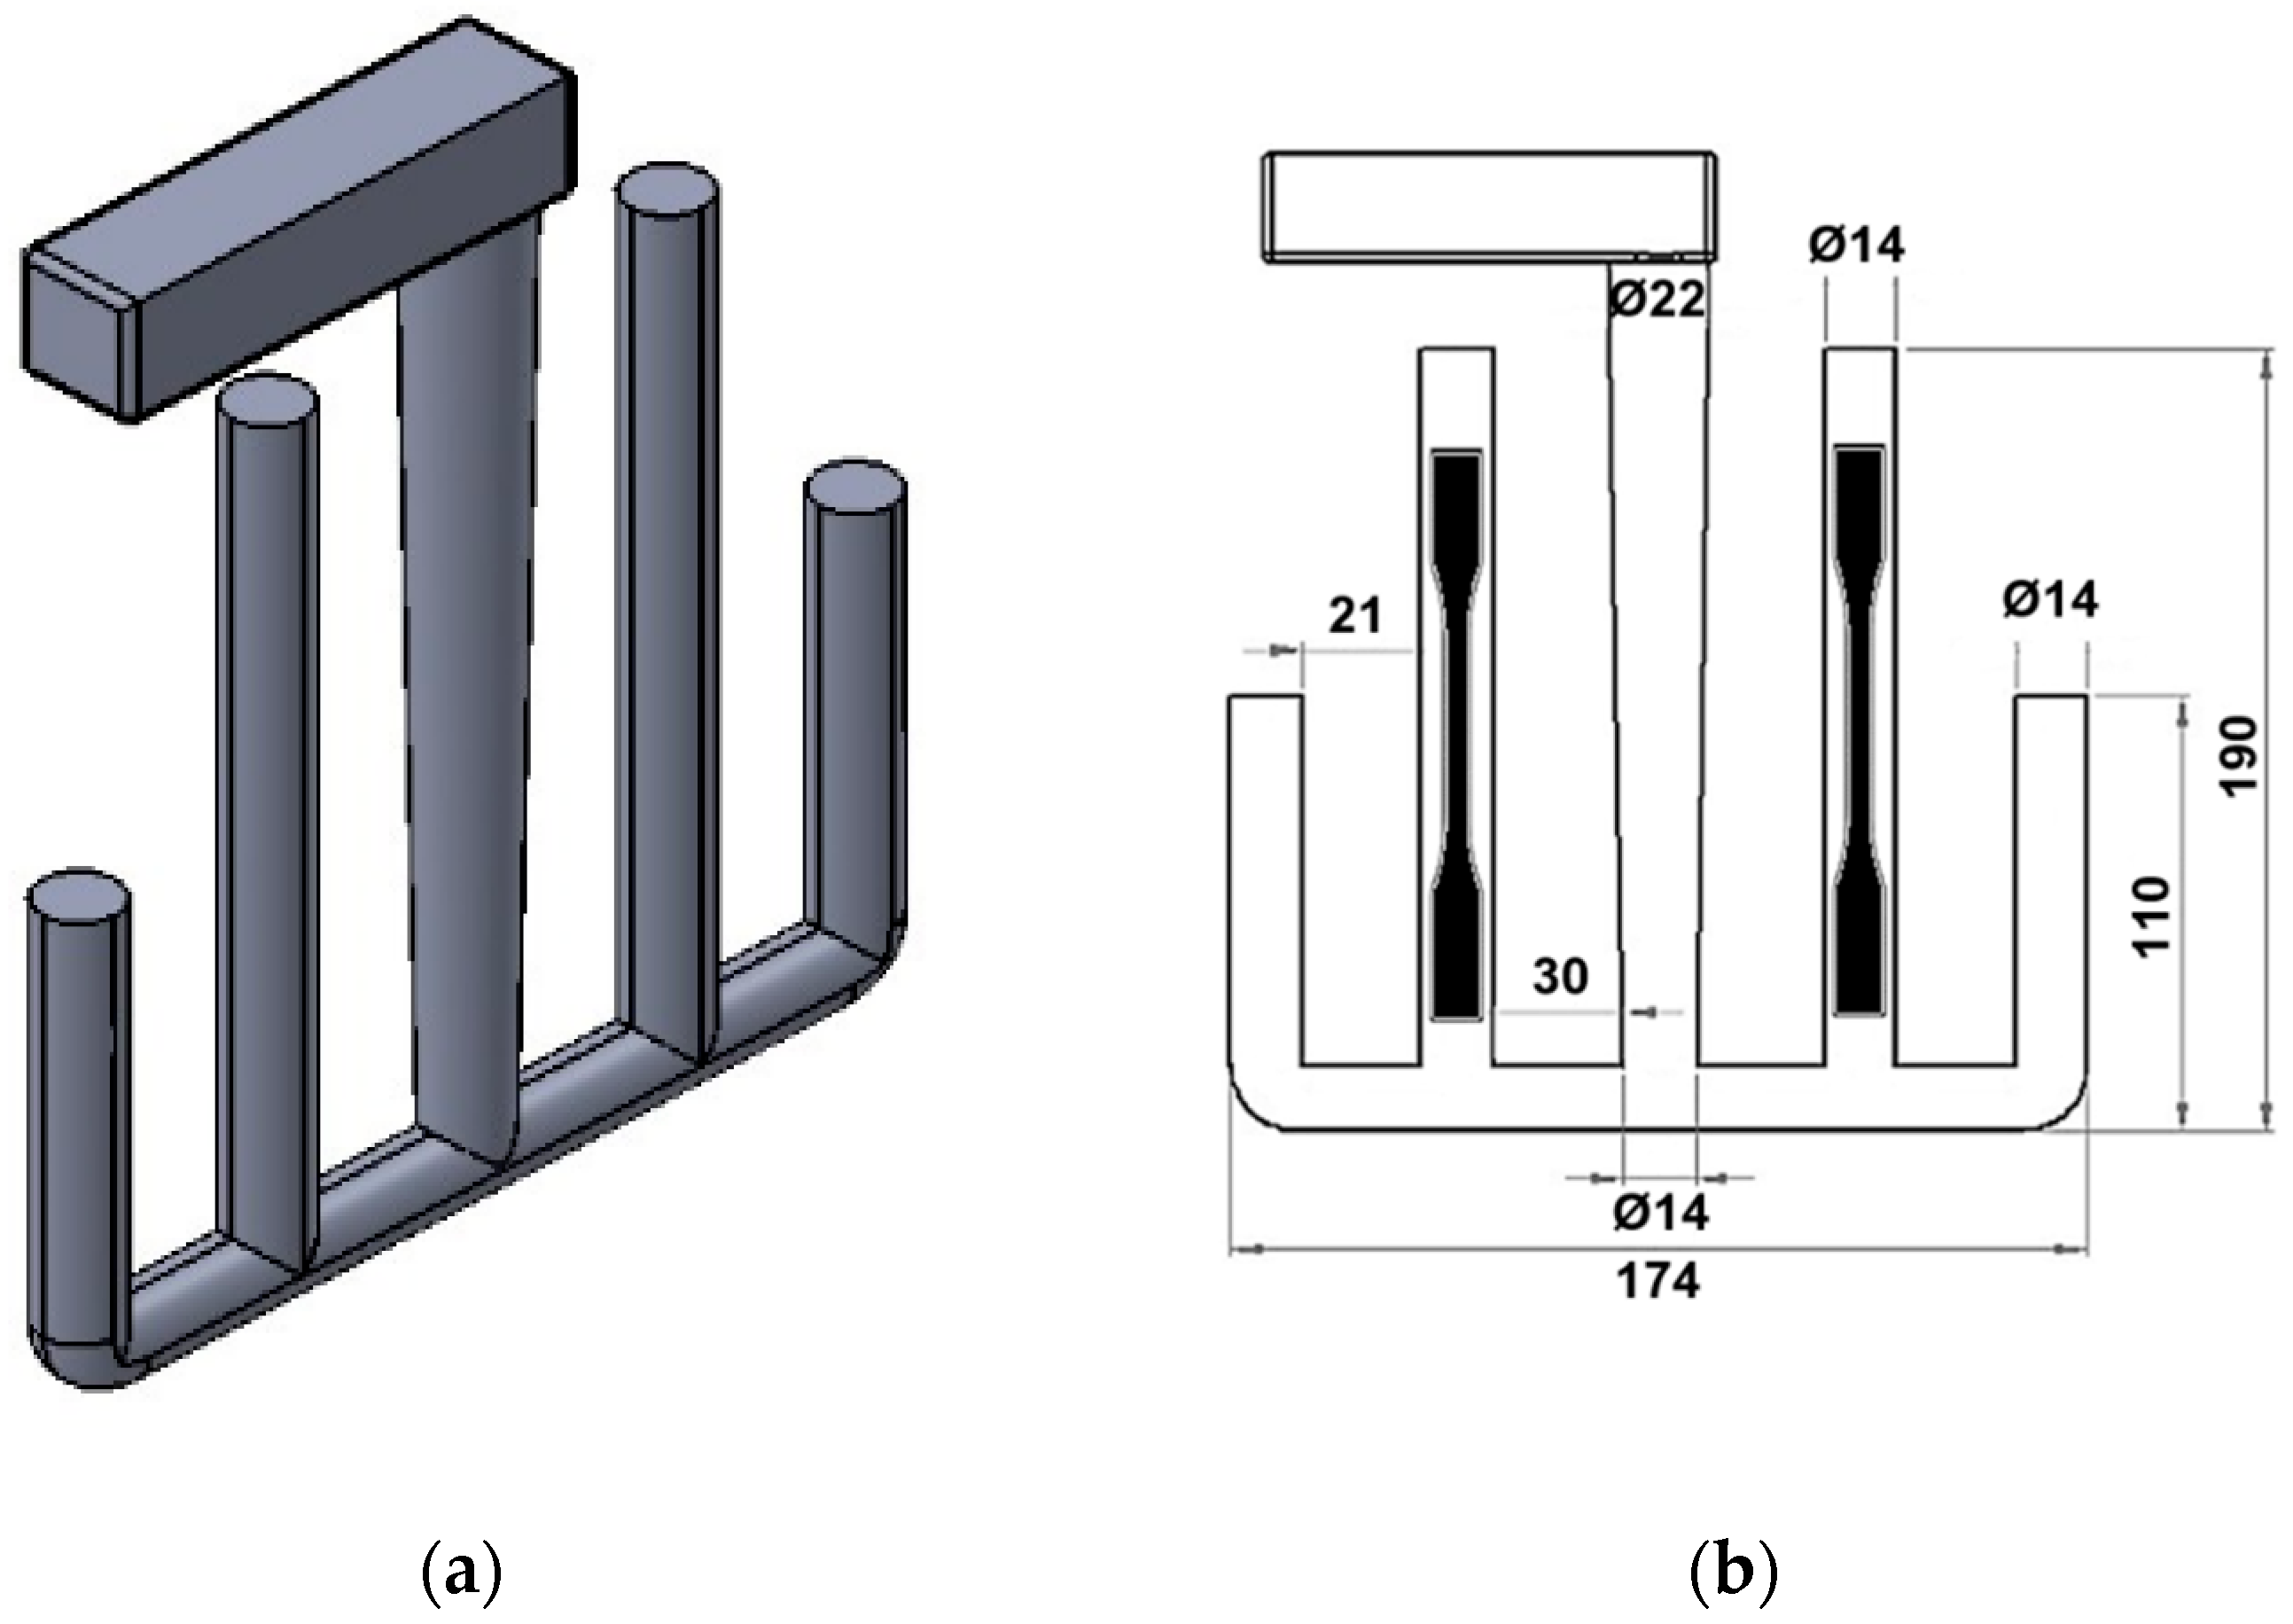
Figure 1. Dimensions of the permanent mold used in casting trials (mm): (a) solid image of tensile test sample, (b) dimensions of sample.
Metals 15 00969 g001
Figure 2. Step test mold sample (mm) and schematic representation of SDAL and SDAS in a microstructure.
Metals 15 00969 g002
Figure 3. RPT sample cross-section images.
Metals 15 00969 g003
Figure 4. Tensile test curves representing the effect of Er addition.
Metals 15 00969 g004
Figure 5. Change in % elongation values depending on Er addition.
Metals 15 00969 g005
Figure 6. Graphical representation of hardness test results depending on Er content (wt%).
Metals 15 00969 g006
Figure 7. 50× microstructure images (a) A356, (b) 0.03 wt% Er, (c) 0.06 wt% Er, (d) 0.1 wt% Er.
Metals 15 00969 g007aMetals 15 00969 g007b
Figure 8. 100× microstructure images (a) A356, (b) 0.03 wt% Er, (c) 0.06 wt% Er, (d) 0.1 wt% Er.
Metals 15 00969 g008
Figure 9. 200× microstructure images (a) A356, (b) 0.03 wt% Er, (c) 0.06 wt% Er, (d) 0.1 wt% Er.
Metals 15 00969 g009aMetals 15 00969 g009b
Figure 10. Microstructure images taken from varying section thicknesses in castings with 0.06% Er addition (200× magnification).
Metals 15 00969 g010
Figure 11. Change in measured SDAS values according to (a) step thickness and (b) Er ratio.
Metals 15 00969 g011
Figure 12. Change in SDAL values according to (a) step thickness and (b) Er ratio.
Metals 15 00969 g012
Figure 13. (a) SDAS and (b) SDAL change with cooling rate at different Er content.
Metals 15 00969 g013
Table 1. Chemical Composition Results (wt%).
AlloysFeSiCuMnMgZnTiErAl
A356 standard≤0.206.5–7.5≤0.20≤0.100.25–045≤0.100.10–0.20-Remain
A3560.1216.740.0120.0150.2610.02760.1160.001Remain
A356 + 0.03 wt% Er0.1126.710.0110.0190.2770.02950.1090.028Remain
A356 + 0.06 wt% Er0.1366.680.0160.0270.3120.05950.1120.059Remain
A356 + 0.1 wt% Er0.0936.840.0140.0230.2930.03930.1230.102Remain
Table 2. Tensile test results.
AlloysUTS (MPa)YS (MPa)Elongation %Toughness (kJ/m3)
A356141.591.41.82122.7
A356 + 0.03 wt% Er185.493.04.16353.2
A356 + 0.06 wt% Er187.192.74.97758.0
A356 + 0.1 wt% Er187.991.85.48966.5
Disclaimer/Publisher’s Note: The statements, opinions and data contained in all publications are solely those of the individual author(s) and contributor(s) and not of MDPI and/or the editor(s). MDPI and/or the editor(s) disclaim responsibility for any injury to people or property resulting from any ideas, methods, instructions or products referred to in the content.