Abstract
The induction quenching–tempering process typically enhances the surface strength and core toughness of alloy steels by utilizing the skin effect. However, the impact of parameters like quenching current and heating time on the microstructure and mechanical property of 34CrNiMo6 steel crankshafts remains unclear. In this work, the microstructure of 34CrNiMo6 steel after induction quenching exhibits three distinct zones: a martensite hardened layer; a transition zone of martensite and tempered sorbite; and a matrix of tempered sorbite. As the induction current (400, 500, and 600 mA) and heating time (3, 5, and 7 s) increase, the hardened layer thickness enhances (up to 3.21 mm). Under the 600 mA and 7 s, the hardened layer reaches peak hardness and residual stress values of 521.48 HV and −330.12 MPa, showing a decreasing trend from surface to core. After tempering at 330 °C for 2 h, the hardened layer mainly consists of tempered martensite, and the surface hardness and residual stress decrease to 417.94 HV and −12.33 MPa. The temperature gradient from quenching balances after tempering, with martensitic phase transformation and stress redistribution reducing hardness and residual stress. Furthermore, the induction quenching–tempering process enhances the toughness of 34CrNiMo6 steel when compared to the untreated specimen, boosting its tensile yield strength, elongation, and tensile strength by 15.3%, 14.9%, and 19.5%, respectively. This work deepens the understanding of induction quenching–tempering process and provides valuable insights for designing alloy steels with excellent mechanical properties.
1. Introduction
The 34CrNiMo6 steel is a typical medium-carbon steel renowned for its high strength, excellent toughness, and superior wear resistance, making it widely applicable in engineering components such as engine crankshafts [1,2,3]. However, these components often endure demanding service conditions, involving alternating loads and high-speed rotation. The steel must exhibit high strength, wear resistance, and fatigue resistance at the surface while maintain outstanding plasticity and toughness in the core [4,5,6]. In this case, the induction quenching–tempering process, due to its electromagnetic induction heating principle, causes current to produce the “skin effect” at the workpiece surface. The larger current density at the workpiece surface promotes rapid temperature rise reaching the quenching temperature, while the interior maintains the original microstructure, thereby achieving effective control over the hardness and toughness of the alloy steel [7]. During induction quenching–tempering, different process parameters induce variations in the microstructure, residual stress, and hardness of hardened layer [8]. Consequently, investigating the evolution of microstructure and hardness through parameter adjustments plays a crucial role in enhancing both production efficiency and component service life.
The evolution of microstructure and mechanical properties in alloy steel after induction quenching–tempering typically depends on the heating temperature, duration, and cooling rate [9,10,11]. Tang et al. [12] observed that under induction quenching at 420 V, 300 L/h cooling water flow, and 200 mm/min specimen speed, G18NiMoCr36 steel develops a uniform fine martensitic structure, substantially enhancing its strength. Areitioaurtena et al. [13] reported that induction quenching produces a hard martensitic layer on 42CrMo4 steel surface, accompanied by compressive residual stresses in the hardened layer and tensile stresses in the untreated core. Zhang et al. [14] investigated the fatigue behavior of S38C railway axles after induction quenching, noting that hardened layer hardness tripled that of the matrix, while coarse ferrite and pearlite in the transition zone and matrix blunted long cracks. Additionally, Xing et al. [15] found that induction quenching increases dislocation density for strengthening compared to conventional heating, but tempering reduces dislocations with rising temperature, lowering strength while enhancing ductility. Rodman et al. [16] also asserted that induction quenching induces severe thermal gradients and high residual stresses in 42CrMo4 steel, while tempering effectively reduces residual stresses and suppresses fatigue crack initiation. Current research mainly focuses on the effects of a single parameter (such as tempering temperature) on microstructure and mechanical properties, yet studies on structural, hardness gradients, and mechanical properties induced by specific parameters (e.g., induction current, heating time) remain insufficient. As a common material for engine crankshafts, 34CrNiMo6 steel withstands complex bending and torsional loads under service conditions, making it prone to fracture from fatigue damage and wear [17]. For instance, Wu et al. [18] emphasized that 34CrNiMo6 steel operates under high-load conditions, rendering extended service life critical. Gu et al. [19] conducted high-frequency induction quenching (200 kHz) followed by tempering at 220 °C on 42CrMo steel, and the average hardness of the hardened layer was 415–435 HV. Therefore, rational selection of induction current and quenching duration can elucidate the mechanism of induction quenching–tempering affects the microstructure evolution and mechanical properties of 34CrNiMo6 steel, providing valuable insights for optimizing manufacturing processes and enhancing components service life.
In this work, the effects of the induction quenching–tempering process on the microstructure and mechanical properties of 34CrNiMo6 steel by regulating quenching parameters were investigated. Using optical/scanning electron microscopy, Vickers hardness, X-ray stress analysis, and tensile tests, correlations between the microstructure and mechanical properties of alloy steel were established, along with a detailed analysis of the morphology and structure of the hardened layer. These findings would contribute to advancements in quenching technology and metal processing techniques, enhancing the capability of the manufacturing sector.
2. Experiments
2.1. Material Preparation
The raw material used was the bar-shaped quenched and tempered (Q&T) 34CrNiMo6 steel [20]. The steel underwent the initial Q&T process, which involved holding at 850 °C for 50 min, followed by quenching, and then tempering at 600 °C for 2 h, resulting in tempered sorbite (a mixture of ferrite and cementite). The Q&T 34CrNiMo6 steel rods were machined into cylindrical specimens (80 mm in length, 15 mm in diameter). High-frequency induction quenching was performed using a GY-25AB induction heating power supply (Dongguan Guangzhiyuan Electronic Technology Co., Ltd., Dongguan, China) based on electromagnetic induction principles [21]. The induction coil had an inner diameter of 20 mm and a 2 mm gap, with a minimum current of 200 mA. The copper coil carrying alternating current rapidly heated the surface of the metal workpiece when positioned near it, followed by immediate cooling. This process imparted high hardness and wear resistance to the surface while maintaining excellent toughness in the core [22]. By adjusting the quenching current (400, 500, and 600 mA) and heating duration (3, 5, and 7 s) with AQ251C quenchant cooling, rapid heating and cooling were achieved to control hardened layer thickness and hardness. The peak temperature was recorded in real-time using a SCIT-1MK1A infrared thermometer with an accuracy of ±5 °C (China Science Infrared Technology Co., Ltd., Beijing, China). The parameters of the induction quenching process, including surface peak temperature, heating rate, and cooling rate, are summarized in Table S1. The induction quenching process is illustrated in Figure 1a. After induction quenching, the specimens were tempered in a MICRO-X box resistance furnace (Micro-X Ltd., Tonsley, South Australia) at 330 °C for 2 h. The heating rate was 50 °C/min, followed by cooling to room temperature at a rate of 5 °C/min, as shown in Figure 1b.
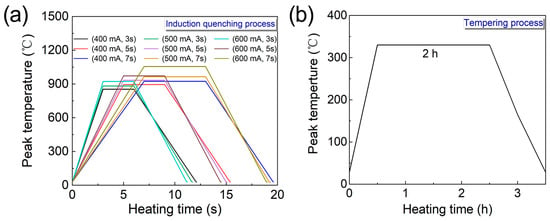
Figure 1.
Schematic of induction quenching and tempering process: (a) quenching process; (b) tempering process.
2.2. Microstructural Characterization
Specimens of 34CrNiMo6 steel under different processing conditions (Q&T, quenched, and tempered states) were machined rods with a diameter of 5 mm and a length of 10 mm using a CH7516GS lathe (Qinchuan Machine Tool & Tool Group Share Co., Ltd., Baoji, China). Specimen surfaces were ground using SiC abrasive papers with grits of 180, 400, 800, 1200, 1500, and 2000, followed by fine polishing with 0.25 μm and 0.15 μm diamond suspensions. Final etching was performed using a 4% nital solution (nitric acid in ethanol). Post-etching microstructures were clearly observed using a Zeiss inverted optical microscope (OM, Carl Zeiss AG, Oberkochen, Germany) and a FEI Helios G4 CX scanning electron microscope (SEM, FEI, Hillsboro, OR, USA). The composition and proportions of carbides were determined using an Oxford X-MaxN energy-dispersive spectroscopy (EDS, Oxford, Tubney Woods, UK) and Image J (Image J 1.52v). The crystal structure of samples was identified by X-ray diffraction (XRD, Bruker D8, Billerica, MA, USA) with Cu Kα radiation (λ = 1.5406 Å). The measurements were conducted in the 2θ range of 30° to 100° with a step size of 0.02° and a counting time of 2 s per step. The operating voltage and current were 40 kV and 40 mA, respectively.
2.3. Mechanical Property Measurement
Vickers hardness testing was conducted on the specimen surfaces with a 402MVD™ hardness tester (Illinois Tool Works, Norwood, MA, USA). The diamond pyramid indenter applied a 500 gf load with 15 s dwell time. Each hardness measurement was repeated more than 5 times to ensure reproducibility, with indentations spaced larger than 0.5 mm apart to prevent mutual interference. Residual stresses induced by the induction quenching–tempering process can be detected using an μ-X360S X-ray stress analyzer (Pulstec Industrial Co., Ltd., Yokohama, Kanagawa, Japan). These stresses originate from lattice distortion in crystals during heat treatment and machining processes, leading to compressive or tensile stress states [23]. Variations in residual stress alter crystal structures and diffraction angles. By measuring the ratio of diffraction angle 2θ to orientation angle on the crystal surface, the residual stress distribution across the specimen surface is determined [24]. Tensile testing was performed with a DBSL-5t machine (Jinan Oriental Testing Machine Co., Ltd., Jinan, China), applying tensile loads that gradually increased at a constant rate of 3 mm/min. Throughout the test, both the tensile force and elongation/displacement were monitored to generate stress–strain curves for a detailed evaluation of the material’s mechanical properties. The fracture surfaces were then analyzed using SEM to assess the failure behavior.
3. Results and Discussion
3.1. Microstructural Evolution
3.1.1. Quenching Current Effect
Figure 2 displays the microstructure of initial Q&T 34CrNiMo6 steel observed under an optical microscope at various magnifications. As evident in Figure 2, the structure exhibits an extremely fine lamellar morphology dominated by tempered sorbite, which is a composite of ferrite and cementite. The surface average hardness measured by Vickers hardness testing is 285.6 HV. After pre-experimental adjustments of the induction quenching parameters, heating currents of 400, 500, and 600 mA with heating durations of 3, 5, and 7 s are ultimately selected for the induction quenching–tempering experiments.
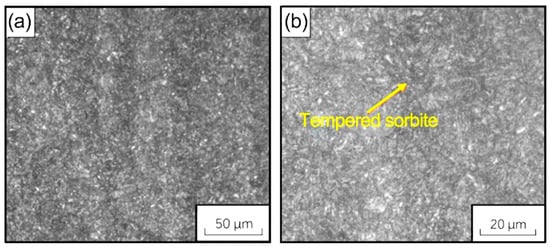
Figure 2.
Optical micrographs of initial Q&T 34CrNiMo6 steel at different magnifications: (a) ×100; (b) ×500.
To investigate the effect of quenching current on the microstructure of 34CrNiMo6 steel, the metallographic evolution under induction quenching at identical heating duration (3 s) with varying currents (400, 500, 600 mA) is shown in Figure 3. Figure 3a–c show the optical micrographs at different magnifications for 400 mA, 3 s quenching. The microstructure remains identical to the initial Q&T steel, exhibiting uniform lamellar tempered sorbite. This is attributed to insufficient heating current and duration for phase transformation, preserving the tempered sorbite structure. Figure 3d–f present microstructures after 500 mA, 3 s quenching. Figure 3d clearly reveals three distinct zones: hardened layer, transition zone, and matrix [25], with measured thicknesses of 0.51 mm and 0.25 mm for the hardened and transition layers, respectively. The hardened layer refers to the high-hardness surface region formed by quenching, enhancing wear resistance and strength [26]. The transition zone, characterized by progressively decreasing hardness, results from cooling rate gradients between the hardened layer and matrix [27]. As shown in Figure 3e,f, the hardened layer consists primarily of martensite, the transition zone comprises martensite and tempered sorbite, while the matrix remains as tempered sorbite. Martensite formation occurs when the surface of the specimen is rapidly heated to the austenitizing temperature, followed by immediate quenching. This rapid cooling prevents the transformation of the material into softer phases such as pearlite or ferrite, resulting in the formation of hard and brittle martensite [28]. The transition zone exhibits a heterogeneous microstructure due to the non-uniform cooling rates, which balances surface hardness and core toughness [29]. Figure 3g–i display the microstructures after quenching with 600 mA for 3 s. With the increase in current, the thicknesses of the hardened layer and transition zone rise to 0.63 mm and 0.32 mm, respectively. The three distinct zones remain clearly visible: the martensitic hardened layer, the transition zone (a mixture of martensite and tempered sorbite), and the tempered sorbite matrix. These structural changes highlight the impact of varying quenching parameters, such as current intensity, on the material’s microstructure and mechanical properties, contributing to improved hardness and resistance to crack formation while maintaining toughness.
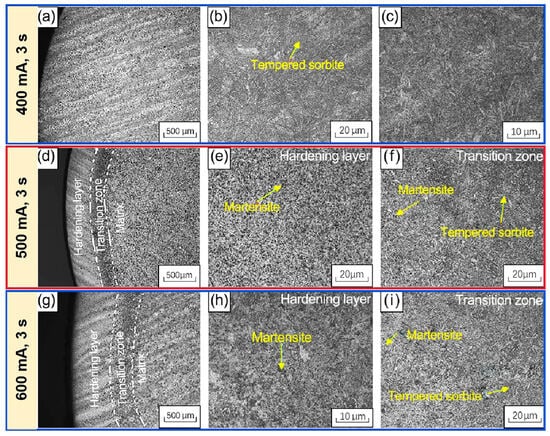
Figure 3.
Optical micrographs of 34CrNiMo6 steel specimens under 400 mA, 500 mA, and 600 mA at 3 s quenching: (a–c) 400 mA, 3 s; (d–f) 500 mA, 3 s; (g–i) 600 mA, 3 s.
After subjecting the aforementioned induction-quenched specimens to tempering at 330 °C for 2 h, their microstructures at various magnifications were examined as shown in Figure 4. Figure 4a–c present the metallographic structure of specimens quenched at 400 mA for 3 s followed by tempering. Due to the low induction current, no hardened layer is formed after tempering, and the microstructure remains as tempered sorbite. The limited induction heating current cannot generate sufficient heat to elevate the steel surface to the austenitizing temperature required for quenching. As a result, there is no complete transformation of the material into martensite, and the microstructure retains the original tempered sorbite structure [30]. Figure 4d–f display the microstructure after quenching at 500 mA for 3 s and subsequent tempering. Increased heating current divides the specimen surface into three distinct zones: hardened layer, transition zone, and matrix. The hardened layer primarily consists of tempered martensite; the transition zone contains tempered martensite and tempered sorbite; while the matrix maintains tempered sorbite. The hardened layer and transition zone are measured as 1.18 mm and 0.29 mm thick, respectively. Figure 4g–i illustrate the structure after quenching at 600 mA for 3 s followed by tempering. The microstructure is mirrored by that of the 500 mA quenched specimen. Higher current further increases the tempered hardened layer thickness to 1.40 mm and transition zone thickness to 0.53 mm.
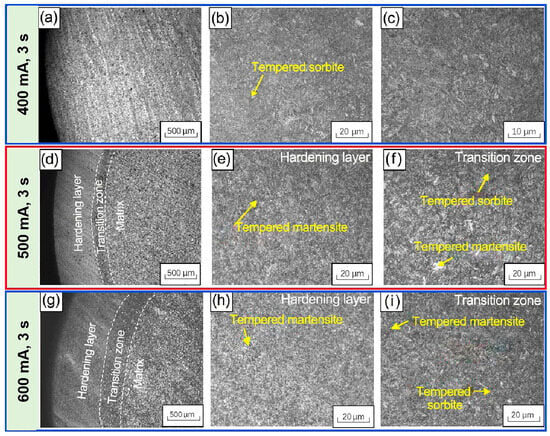
Figure 4.
Optical micrographs of 34CrNiMo6 steel under tempering at different induction currents: (a–c) 400 mA, 3 s; (d–f) 500 mA, 3 s; (g–i) 600 mA, 3 s.
3.1.2. Quenching Duration Effect
Furthermore, the effect of quenching duration on microstructural evolution in 34CrNiMo6 steel was investigated using induction quenching at a fixed current of 600 mA with varying heating times (3, 5, and 7 s), as shown in Figure 5. Metallographic analysis reveals that specimens subjected to 600 mA induction quenching consistently exhibit a structure comprising hardened layer, transition zone, and matrix. High temperatures partially transform tempered sorbite into martensite, constituting the primary phase in the hardened layer. The transition zone consists of martensite and tempered sorbite, exhibiting a composite structure, while the matrix retains its tempered sorbite characteristics. Figure 5a–c display the microstructure after 600 mA, 3 s quenching, with hardened layer and transition zone thicknesses measuring 0.63 mm and 0.31 mm, respectively. When heating duration extends to 5 s (Figure 5d–f), the hardened layer thickens to 1.75 mm and transition zone expands to 0.57 mm. At 7 s heating (Figure 5g–i), these dimensions further increase to 2.93 mm and 1.18 mm.
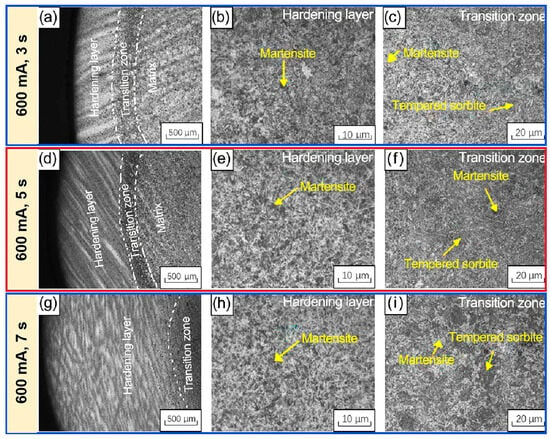
Figure 5.
Microstructure of 34CrNiMo6 steel specimens quenched at 600 mA with heating durations of 3, 5, and 7 s: (a–c) 600 mA, 3 s; (d–f) 600 mA, 5 s; (g–i) 600 mA, 7 s.
After tempering the aforementioned specimens quenched with different durations at 330 °C for 2 h, the microstructural evolution is shown in Figure 6. The sustained high temperatures during tempering promote the transformation of sorbite into tempered martensite, which characterizes the structural features of the hardened layer. The transition zone displays a mixed microstructure composed of tempered martensite and tempered sorbite, reflecting a gradual transition in hardness and phase composition. In contrast, the matrix retains its original tempered sorbite structure, which serves to balance the overall toughness of the material. For the specimens quenched at 600 mA with 3 s heating followed by tempering (Figure 6a–c), the hardened layer and transition zone are measured at thicknesses of 1.40 mm and 0.51 mm, respectively. When heating duration increases to 5 s (Figure 6d–f), post-tempering thicknesses reach 2.13 mm (hardened layer) and 0.42 mm (transition zone). At 7 s heating (Figure 6g–i), these dimensions further increase to 3.21 mm and 0.74 mm.
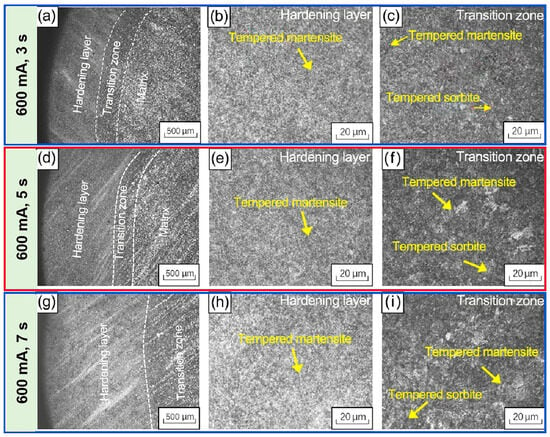
Figure 6.
Optical micrographs of 34CrNiMo6 steel specimens tempered with different heating durations: (a–c) 600 mA, 3 s; (d–f) 600 mA, 5 s; (g–i) 600 mA, 7 s.
3.1.3. Hardened Layer Analysis
To comprehensively evaluate the effects of induction current and heating time, the microstructures of 34CrNiMo6 steel subjected to quenching–tempering processes at 400, 500 mA and heating durations of 5 and 7 s are presented in Figures S1–S4 in Supplementary Materials. Combined with other quenching–tempering microstructures, the hardened layer thicknesses across specimens are statistically compiled in Table 1. At a constant heating duration, quenching with increasing induction current (400, 500, 600 mA) progressively thickens the hardened layer, with thicknesses ranging from 0 mm to 2.93 mm. After tempering, this thickness similarly increases with higher current, reaching a range of 0 mm to 3.21 mm. At a fixed quenching current, extending the heating time (3, 5, 7 s) results in a thicker hardened layer during quenching, with the thicknesses falling within the 0 mm to 2.93 mm range. The post-tempering thickness also grows accordingly, ranging from 0 mm to 3.21 mm. These results demonstrate that both elevated induction current and prolonged heating duration lead to a rapid increase in surface temperature, which promotes the formation of martensite and the thickening of the hardened layer. Following tempering, where martensite transforms into tempered martensite, the hardened layer thickness remains proportional to the induction current and heating time. Additionally, the more uniform temperature distribution achieved during tempering slightly enhances the hardened layer thickness, ensuring a more consistent microstructure throughout the material.

Table 1.
Statistics on the average thickness of the hardened layer under different induced current and heating duration.
Utilizing SEM to analyze the surface morphology of hardened layer in 34CrNiMo6 steel after quenching and tempering, the results are shown in Figure 7. Figure 7a,d show SEM images of 34CrNiMo6 steel in the Q&T state. A large number of spherical/granular carbides are uniformly distributed on the ferrite matrix, resembling a “sesame cake” structure, which is a typical feature of tempered sorbite. Tempered sorbite consists of a continuous ferrite matrix and finely dispersed cementite particles. Using Image J, the phase proportion and average size of cementite were calculated to be 19.67% and 0.53 μm, respectively (Figure 7a,d). Figure 7b,e display the surface morphology of the hardened layer at different magnifications after 600 mA, 7 s quenching treatment. High temperatures promote the transformation of tempered sorbite on the alloy steel surface into martensite, with lattice distortion causing a striated surface structure [31]. Figure 7c,f show the surface morphology of the hardened layer at different magnifications after tempering treatment. The alloy steel surface becomes more uniform, and martensite softens to form lath-like tempered martensite with blurred boundaries [32]. Additionally, the composition and phase fraction of the carbides on the surface of the hardened layer after induction hardening–tempering were semi-quantitatively estimated by EDS, as shown in Tables S2 and S3. After quenching, the martensite exhibits an elongated lath structure with a small amount of spherical carbides. The average size of lath martensite is 4.76 μm, accounting for 92.6% with highly dispersed orientations. The phase proportion and size of precipitated carbides are 11.87% and 0.092 μm, respectively (Figure 7e). The average carbon content in the matrix of the hardened layer for quenched samples is 5.17–9.04 at.%, while that in the precipitated carbides is 9.41–11.38 at.%. The increased carbon content indicates that carbon has begun to preliminarily enrich in the precipitated phases. The contents of Cr and Mo in carbides are similar to those in the matrix without obvious enrichment. These characteristics suggest that the carbides after quenching are most likely iron-rich carbides (such as ε-Fe2.4C or metastable Fe3C) [25]. The rapid cooling during induction quenching restricts the diffusion of elements like Cr and Mo, making it difficult to form alloy carbides. Thus, the carbon mainly combines with iron to form simple carbides. For the tempered martensite after tempering, it retains the original lath morphology, with granular nano-carbides dispersedly distributed inside or at the boundaries of the laths (Figure 7f). These nano-carbides have an average size of approximately 0.18 μm and a phase proportion of 26.12%. After tempering, the average carbon content in the matrix of the hardened layer decreases to 5.06%, while that in the precipitated structures increases to 16.75%. Thus, part of the carbon precipitates from the matrix during tempering, forming obvious segregation. The contents of Cr and Mo in carbides are significantly higher than those in the matrix, resulting in the formation of alloy carbides such as Mo23C6 [29]. The formation of these carbides will exert a certain influence on the mechanical properties of alloy steel.
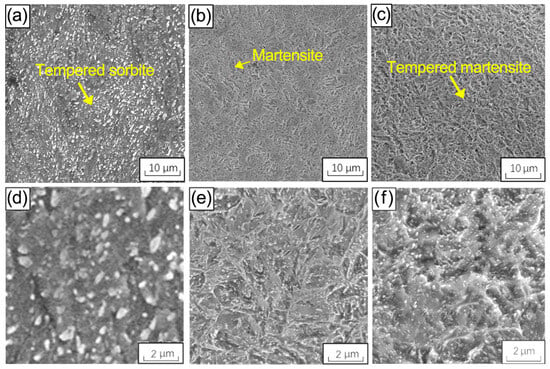
Figure 7.
SEM morphologies of hardened layer surfaces in 34CrNiMo6 steel after Q&T, quenching and tempering (600 mA, 7 s): (a,d) Q&T specimen; (b,e) as-quenched specimen; (c,f) tempered specimen.
In addition, XRD analysis was performed on different samples after induction quenching–tempering, as shown in Figure 8. All samples mainly consist of martensite and ferrite. Both martensite and ferrite are BCC phases, with no other phases formed. The presence of thermal stress from surface quenching leads to lattice distortion in the hardened layer, resulting in reduced interplanar spacing, refined grains, significantly increased dislocation density, and a rightward shift of martensite diffraction peaks. The surface layer of tempered samples is mainly composed of tempered martensite and ferrite. The tempering process releases the residual compressive stress on the sample surface, causing the diffraction angle of martensite to shift leftward, which indicates an increase in interplanar spacing and a decrease in dislocation density after tempering.
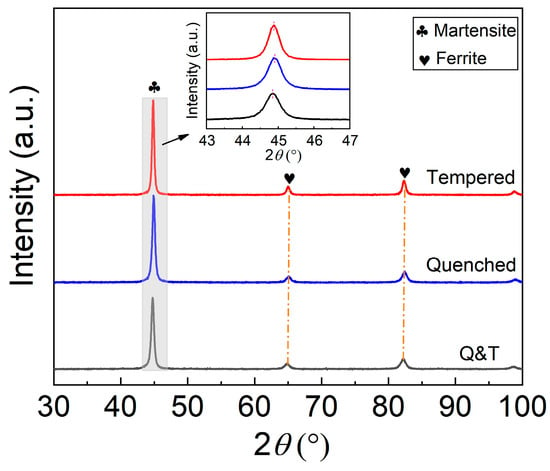
Figure 8.
XRD patterns of 34CrNiMo6 steel after quenching and tempering process.
3.2. Microhardness Evolution
3.2.1. Quenching Current Effect
The distinct phase structures formed in 34CrNiMo6 steel during quenching–tempering critically influence its microhardness evolution [33]. Figure 9 displays microhardness profiles under the quenching–tempering process at identical 3 s durations with varying induction currents (400, 500, 600 mA). Figure 9a shows the microhardness distribution curve of quenched specimens. At 400 mA, no hardened layer is observed, with the microstructure remaining as tempered sorbite. The hardness is relatively low, with an average value of 287.24 HV, and there is no significant gradient in hardness across the specimen. When the induction current increases to 500 mA, the hardness of the hardened layer averages 508.64 HV, while the matrix hardness is 284.43 HV. At 600 mA, the hardness of the hardened layer rises to 524.73 HV, with the matrix at 272.82 HV. The microhardness shows a clear decreasing trend with increasing cross-sectional depth under higher currents. In addition, as can be seen from Figure 7d,e and EDS analysis (Tables S2 and S3), the hardened layer of quenched specimens is predominantly martensitic, with carbide size and content significantly lower than those of the Q&T specimens. The hardness here is primarily governed by the lattice distortion strengthening and dislocation strengthening mechanisms inherent to martensite, resulting in extremely high surface hardness. Figure 9b presents the microhardness curve after tempering. For the 400 mA, 3 s specimen post-tempering, no hardened layer is formed, and the average hardness is 294.87 HV, showing no significant gradient. For the 500 mA, 3 s specimen after tempering, the hardened layer has an average hardness of 425.75 HV, while the matrix hardness averages 291.68 HV. The 600 mA, 3 s specimen after tempering shows a hardened layer average hardness of 419.17 HV and a matrix average hardness of 304.48 HV. After tempering, the martensite decomposes and carbides precipitate exhibiting increased content compared to the quenched specimens (Figure 7e,f). These carbides maintain a relatively high hardness through “dispersion strengthening” while alleviating the internal stress of martensite and preventing excessive brittleness [34]. As a result, the nano-sized carbides precipitate dispersedly, tempered martensite/sorbite has lower hardness compared to quenched martensite, and the reduction in residual stress contributes to the decreased hardness of the hardened layer.
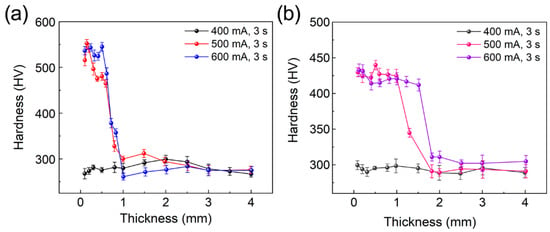
Figure 9.
Microhardness profiles of 34CrNiMo6 steel after quenching–tempering at different induction currents: (a) quenched specimens; (b) tempered specimens.
3.2.2. Quenching Duration Effect
Figure 10 illustrates the microhardness evolution of 34CrNiMo6 steel specimens under the induction quenching–tempering process at 600 mA with varying heating durations of 3, 5, and 7 s. Figure 10a displays the microhardness curves of induction-quenched specimens under different heating durations. Higher induction current transforms tempered sorbite into martensite throughout the hardened layer. Martensite exhibits higher hardness while the matrix shows lower hardness; therefore, all microhardness curves demonstrate distinct declining trends. The 600 mA, 3 s specimen exhibits hardened layer average hardness of 524.73 HV and matrix average hardness of 272.82 HV. The 600 mA, 5 s specimen exhibits hardened layer average hardness of 477.36 HV and matrix average hardness of 268.84 HV. The 600 mA, 7 s specimen exhibits hardened layer average hardness of 521.48 HV and matrix average hardness of 316.79 HV. With increasing heating duration, the hardened layer thickness gradually increases, forming high-strength and high-hardness martensite structures, consequently elevating microhardness. In the transition zone, reduced martensite content causes a slight hardness reduction. The matrix, primarily composed of low-hardness and high-ductility tempered sorbite, consequently exhibits decreased hardness. Figure 10b presents microhardness curves after tempering treatment. The 600 mA, 3 s specimens show a hardened layer average hardness of 419.17 HV and a matrix hardness of 304.48 HV. The 600 mA, 5 s specimens show a hardened layer average hardness of 422.28 HV and a matrix hardness of 284.76 HV. The 600 mA, 7 s specimens show a hardened layer average hardness of 417.94 HV and a matrix hardness of 289.65 HV. Post-tempering hardness distribution trends align with those of the quenched specimens: the maximum hardness is found in the hardened layer and the minimum in the matrix, with consistently declining curves. Tempering reduces the hardness of the hardened layer compared to quenching by alleviating internal residual stresses and mitigating brittleness.
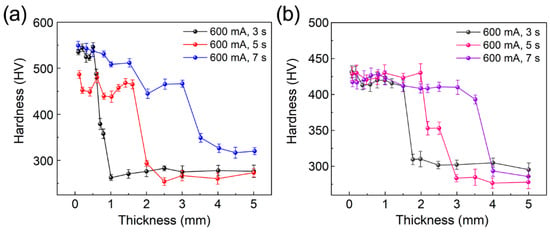
Figure 10.
Microhardness profiles of specimens after induction quenching–tempering with different heating durations: (a) quenched specimens; (b) tempered specimens.
3.3. Residual Stress Evolution
After induction quenching–tempering of 34CrNiMo6 steel, residual stress on specimen surfaces was measured using non-destructive X-ray diffraction. Considering the thickness of the hardened layer, four specimens processed at 500 mA, 7 s and 600 mA, 7 s after induction hardening and tempering are selected for residual stress detection in the hardened layer, transition zone, and matrix, respectively. The initial quenching and tempering (Q&T) specimens are used as controls. The residual stresses after quenching and tempering are presented in Table 2. All residual stress values are negative, indicating compressive stresses in all specimens [35]. During induction quenching, differential cooling rates between the surface and the interior occur. Specifically, the rapid cooling of the surface causes preferential contraction, while the slower cooling of the interior delays shrinkage. This mismatch in cooling rates generates tensile stress at the surface, commonly referred to as thermal stress [36]. Under these conditions, transformational stress resulting from the austenite-to-martensite phase transformation becomes the dominant factor and is manifested as compressive stress. Additionally, residual stress typically consists of both thermal and transformational stresses [37]. In this study, residual stress primarily originates from transformational stress and exists as compressive stress. Table 2 reveals that the quenched specimens exhibit significantly increased residual stress due to rapid cooling, compared to the Q&T specimens. Tempering effectively alleviates the quenching-induced residual stress by transforming martensite to tempered martensite, leading to a substantial reduction in residual stress. Additionally, higher induction currents markedly increase internal residual stress, mainly attributed to the amplified temperature gradients between surface and core.

Table 2.
Residual stress of 34CrNiMo6 steel under different quenching–tempering processes.
3.4. Tensile Property Evolution
Based on the above analysis, the 34CrNiMo6 steel with high surface hardness, processed by the 600 mA, 7 s induction quenching and tempering process, was selected. Its tensile properties were further tested, as shown in Figure 11. Figure 11a shows the stress–strain curves of 34CrNiMo6 steel under different processes. The yield strength and elongation are shown in Figure 11b. The yield strength and elongation of 34CrNiMo6 steel in the Q&T state are 960.89 MPa and 16.49%, respectively. After induction quenching and tempering treatments, the yield strength of steel increases to 1129.46 MPa and 1107.81 MPa, while the elongation changes to 14.91% and 18.96%. The increase in yield strength achieved through induction quenching and tempering demonstrates the effectiveness of these heat treatments in enhancing material strength. However, this comes at the cost of slightly reduced elongation, especially after quenching. Tempering helps to recover or even improve ductility, making the material more versatile by combining both high strength and good plasticity. In practical applications, this means that the 34CrNiMo6 steel treated by induction quenching and tempering offers a balance of high strength and adequate ductility, suitable for conditions requiring both strength and some degree of elongation. Furthermore, the tensile strength of 34CrNiMo6 steel increases from 1154.05 MPa in the Q&T state to 1274.62 MPa and 1378.71 MPa after quenching and tempering. The increase in tensile strength demonstrates that the induction quenching and tempering process significantly enhance the material’s mechanical properties. The refined microstructure, reduced residual stresses, and improved carbide distribution all contribute to the observed increase in tensile strength, making the material more suitable for high-strength applications.
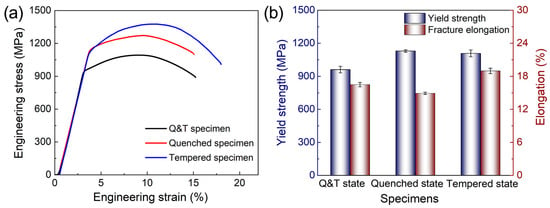
Figure 11.
Tensile properties of specimens after induction quenching–tempering: (a) stress–strain curve; (b) yield strength and fracture elongation.
Figure 12 presents the SEM images of tensile fracture surfaces for Q&T, quenched, and tempered specimens. Figure 12a–c show the fracture characteristics of different specimens. In Figure 12a, the Q&T specimen exhibits three distinct regions: the fibrous region, radial region, and shear lip region. The fibrous region typically displays clear tensile fracture patterns with a fibrous or striated surface texture, a hallmark of ductile fracture. The radial region shows a radiating morphology, representing the crack propagation area after the alloy experiences high stress concentration. The shear lip region located at the edge of the fracture surface appears as an irregular semi-circular area, indicating localized shear deformation. These three regions determine the fracture mode and ductility of the material. As shown in Figure 12a, the Q&T specimen undergoes ductile fracture, with irregular fibrous and shear lip regions present on the fracture surface, while the shear lip region is relatively small. Figure 12b, the quenched specimen, shows a fracture morphology with blurred boundaries between the fibrous, radial, and shear lip regions. The fibrous and shear lip regions are significantly larger compared to the Q&T specimen, and the fibrous region exhibits distinct steps, which primarily result from the martensitic phase transformation. Figure 12c shows the fracture morphology of the tempered specimen, with notably enlarged fibrous and shear lip regions, suggesting a ductile fracture mode. Figure 12d–f present the corresponding microscopic fracture morphologies of the Q&T, quenched, and tempered specimens. In Figure 12f, the tempered specimen shows a more uniform and finer dimple structure compared to the Q&T and quenched specimens. This uniform and high-density distribution of dimples helps to coordinate plastic deformation, which is crucial for enhancing the tensile ductility of 34CrNiMo6 steel.
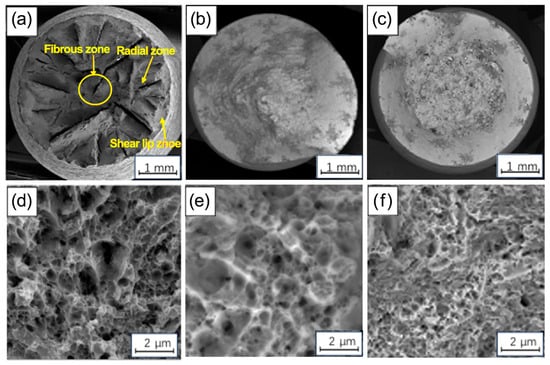
Figure 12.
Fracture morphology of specimens under different processes: (a,d) Q&T specimen; (b,e) quenched specimen; (c,f) tempered specimen.
4. Conclusions
In this work, the evolution of microstructure and hardness in 34CrNiMo6 steel under induction quenching–tempering was investigated. Except for the 400 mA, 3 s parameter set, specimens under all other process combinations (400, 500, 600 mA; 3, 5, 7 s) exhibit distinct layered structures comprising a hardened layer, transition zone, and matrix. The hardened layer consists of martensite, the transition zone displays a composite structure of martensite and tempered sorbite, while the matrix remains predominantly as tempered sorbite. At a constant heating duration, the hardened layer thickness progressively increases with induction current. Conversely, at a fixed current, the thickness increases with heating time (0~3.21 mm). Specimens quenched at 600 mA, 7 s demonstrate the maximum hardness and residual stress (521.48 HV and −330.12 MPa), with values decreasing significantly along cross-sectional depth. After tempering at 330 °C for 2 h, the specimens retain three distinct zones: a tempered martensite-dominated hardened layer, a transition zone containing tempered martensite and tempered sorbite, and a tempered sorbite matrix. Tempered specimens show the reduced hardness and residual stress (417.94 HV and −12.33 MPa) in the hardened layer. Furthermore, when compared to the untreated specimen, the induction tempering enhances the toughness of 34CrNiMo6 steel, boosting its tensile yield strength, elongation, and tensile strength by 15.3%, 14.9%, and 19.5%, respectively. This study provides theoretical guidance for understanding induction quenching–tempering mechanisms and enhancing alloy steel mechanical properties.
Supplementary Materials
The following supporting information can be downloaded at: https://www.mdpi.com/article/10.3390/met15090970/s1, Figure S1: Optical micrographs of 34CrNiMo6 steel specimens under 400, 500, 600 mA at 5 s quenching: (a,b) 400 mA, 5 s; (c,d) 500 mA, 5 s; (e,f) 600 mA, 5 s; Figure S2: Optical micrographs of 34CrNiMo6 steel specimens under 400, 500, 600 mA at 5 s tempering: (a,b) 400 mA, 5 s; (c,d) 500 mA, 5 s; (e,f) 600 mA, 5 s; Figure S3: Optical micrographs of 34CrNiMo6 steel specimens under 400, 500, 600 mA at 7 s quenching: (a,b) 400 mA, 7 s; (c,d) 500 mA, 7 s; (e,f) 600 mA, 7 s; Figure S4: Optical micrographs of 34CrNiMo6 steel specimens under 400, 500, 600 mA at 7 s tempering: (a,b) 400 mA, 7 s; (c,d) 500 mA, 7 s; (e,f) 600 mA, 7 s; Figure S5: EDS semi-quantitatively analysis of hardened layer for 34CrNiMo6 steel after quenching and tempering: (a) Quenched specimen; (b) Tempered specimen; Table S1: Summary of parameters for induction quenching process; Table S2: Summary of energy spectral data at different positions for the quenched specimen; Table S3: Summary of energy spectral data at different positions for the tempered specimen.
Author Contributions
Conceptualization, B.K. and Z.Y.; methodology, B.K. and G.W.; investigation, B.K. and G.W.; resources, D.T. and Q.J.; writing—original draft preparation, B.K. and Q.J.; writing—review and editing, Q.J., D.T. and Z.Y.; visualization, B.K. and G.W.; supervision, D.T. and Z.Y.; project administration, Z.Y.; funding acquisition, Q.J. All authors have read and agreed to the published version of the manuscript.
Funding
This research was funded by China Postdoctoral Science Foundation, grant number 2025MD774117.
Data Availability Statement
The original contributions presented in this study are included in the article. Further inquiries can be directed to the corresponding authors.
Acknowledgments
The authors would like to thank Ce Xiao from Xi’an Jiaotong University and Yue Ren from BYD Auto Industry Co., Ltd. for their assistance, and acknowledge the support from the China Postdoctoral Science Foundation (2025MD774117).
Conflicts of Interest
Author Bing Kong was employed by the company China North Engine Research Institute (Tianjin). The remaining authors declare that the research was conducted in the absence of any commercial or financial relationships that could be construed as a potential conflict of interest.
References
- Hamada, A.; Ali, M.; Ghosh, S.; Jaskari, M.; Allam, T.; Schwaiger, R.; Eissa, M.; Mattar, T. Comparative study of high-cycle fatigue and failure mechanisms in ultrahigh-strength CrNiMoWMnV low-alloy steels. Metals 2024, 14, 1238. [Google Scholar] [CrossRef]
- Mahdavi, Y.; Qods, F.; Ghasemi, B. Investigation of wear behavior of 34CrNiMo6 low alloy steel coated by PACVD method. JOM 2024, 76, 2189–2200. [Google Scholar] [CrossRef]
- Wang, Z.; Zhao, G.; Jing, G.; Zhang, L.; Hou, Y.; Pang, J. Low cycle fatigue behavior and failure mechanism of 34CrNiMo6 steel used as connecting rod for diesel engine. J. Phys. Conf. Ser. 2024, 2842, 012056. [Google Scholar] [CrossRef]
- Macek, W.; Branco, R.; Podulka, P.; Masoudi Nejad, R.; Costa, J.D.; Ferreira, J.A.M.; Capela, C. The correlation of fractal dimension to fracture surface slope for fatigue crack initiation analysis under bending-torsion loading in high-strength steels. Measurement 2023, 218, 113169. [Google Scholar] [CrossRef]
- Teixeira, M.C.; Awd, M.; Walther, F.; Pereira, M.V. Influence of the loading frequency on very high cycle fatigue behavior of structural steels. Fatigue Fract. Eng. Mater. Struct. 2024, 48, 751–763. [Google Scholar] [CrossRef]
- Qiu, C.; Liu, F.; Huang, C.; Liu, F.; Shu, Z.; You, Q.; Zheng, H.; Wang, L.; Yu, D. Effect of Y2O3 on microstructure and mechanical properties of 34CrNiMo6 steel fabricated by laser-directed energy deposition. J. Manuf. Process. 2024, 119, 270–281. [Google Scholar] [CrossRef]
- Shi, X.; Lv, C.; Li, G.; Wang, K.; Chen, J.; Tang, J. Study on induction hardening performance of 34CrNi3MoA steel crankshaft. Front. Mater. 2023, 10, 1240087. [Google Scholar] [CrossRef]
- Topuz, P. Microstructure of a chrome-boriding of induction hardened DIN Ck 45 steel. Mater. Test. 2022, 64, 1645–1650. [Google Scholar] [CrossRef]
- Prisco, U. Case microstructure in induction surface hardening of steels: An overview. Int. J. Adv. Manuf. Technol. 2018, 98, 2619–2637. [Google Scholar] [CrossRef]
- Fisk, M.; Lindgren, L.E.; Datchary, W.; Deshmukh, V. Modelling of induction hardening in low alloy steels. Finite Elem. Anal. Des. 2018, 144, 61–75. [Google Scholar] [CrossRef]
- Šapek, A.; Kalin, M.; Godec, M.; Donik, Č.; Markoli, B. Effect of feed rate during induction hardening on the hardening depth, microstructure, and wear properties of tool-grade steel work roll. J. Mater. Sci. Mater. Eng. 2024, 19, 42. [Google Scholar] [CrossRef]
- Tang, C.; Chen, B.; Fan, H. Induction hardening process of G18NiMoCr3-6 steel. IOP Conf. Ser. Mater. Sci. Eng. 2019, 677, 022085. [Google Scholar] [CrossRef]
- Areitioaurtena, M.; Segurajauregi, U.; Fisk, M.; Cabello, M.J.; Ukar, E. Numerical and experimental investigation of residual stresses during the induction hardening of 42CrMo4 steel. Eur. J. Mech.-A/Solids 2022, 96, 104766. [Google Scholar] [CrossRef]
- Zhang, H.; Wu, S.; Ao, N.; Zhang, J.; Li, H.; Zhou, L.; Xu, P.; Su, Y. Fatigue crack non-propagation behavior of a gradient steel structure from induction hardened railway axles. Int. J. Fatigue 2023, 166, 107296. [Google Scholar] [CrossRef]
- Xing, X.; Huang, S.; Li, L.; Ouyang, J.; Gao, J.; Chen, S.; Peng, Z. Optimizing dislocation strengthening in high-strength medium-carbon steel via fast induction heating quenching & tempering. J. Mater. Res. Technol. 2023, 25, 832–839. [Google Scholar]
- Rodman, D.; Nürnberger, F.; Dalinger, A.; Schaper, M.; Krause, C.; Kästner, M.; Reithmeier, E. Tempering induction hardened 42CrMo4 steel helical gearwheels from residual heat using spray cooling. Steel Res. Int. 2013, 85, 415–425. [Google Scholar] [CrossRef]
- Zabihi, A.; Juoksukangas, J.; Hintikka, J.; Salminen, T.; Mäntylä, A.; Vaara, J.; Frondelius, T.; Vippola, M. Influence of displacement amplitude on fretting-induced friction and wear of steel in oil-lubricated contact. Tribol. Int. 2024, 193, 109451. [Google Scholar] [CrossRef]
- Wu, Z.; Huang, C.; Liu, F.; Xia, C.; Ke, L. Microstructure and mechanical properties of 34CrNiMo6 steel repaired by friction stir processing. Materials 2019, 12, 279. [Google Scholar] [CrossRef]
- Gu, J.; Qin, Y.; Chen, Z.; Lu, Q. Effects of high frequency induction heating quenching and tempering on microstructure and hardness of 42CrMo Steel. Hot Work. Technol. 2010, 39, 160–162. [Google Scholar]
- Gong, B.; Duan, X.W.; Liu, J.S.; Liu, J.J. A physically based constitutive model of As-forged 34CrNiMo6 steel and processing maps for hot working. Vacuum 2018, 155, 345–357. [Google Scholar] [CrossRef]
- Dong, J.; Zhang, Z.; Wang, D.; Liu, Y.; Wu, Y.; Guo, Y. Research on erosion wear behavior of NiTi alloy coating fabricated via high-frequency induction heating technology. Wear 2024, 556–557, 205506. [Google Scholar] [CrossRef]
- Lu, S.-Q.; Chiu, L.-H.; Chang, P.-J.; Lin, C.-K. Effects of prior heat treatment and induction hardening on the properties of JIS SUJ3 bearing steel. Materials 2025, 18, 1797. [Google Scholar] [CrossRef]
- Wang, F.; Mao, K.; Li, B. Prediction of residual stress fields from surface stress measurements. Int. J. Mech. Sci. 2018, 140, 68–82. [Google Scholar] [CrossRef]
- Sun, J.; Dilger, K. Influence of initial residual stresses on welding residual stresses in ultra-high strength steel S960. J. Manuf. Process. 2023, 101, 259–268. [Google Scholar] [CrossRef]
- Peng, K.; Yu, D.; Zhang, P.; Wang, L.; Liao, Z.; Lu, Z.; Wu, G.; Song, C.; Li, L. Laminar plasma quenching-tempering: A rapid surface heat treatment technique for controllable modification of the rail steel. Surf. Coat. Technol. 2023, 473, 130029. [Google Scholar] [CrossRef]
- Li, Y.; Wang, J.; Han, E.-H.; Yang, C. Structural, mechanical and corrosion studies of Cr-rich inclusions in 152 cladding of dissimilar metal weld joint. J. Nucl. Mater. 2018, 498, 9–19. [Google Scholar] [CrossRef]
- Holmberg, J.; Wendel, J.; Stormvinter, A. Progressive Induction Hardening: Measurement and Alteration of Residual Stresses. J. Mater. Eng. Perform. 2024, 33, 7770–7780. [Google Scholar] [CrossRef]
- Li, X.; Li, Z.; Dong, L.; Liu, B.; Wang, H.; Shi, T.; Yuan, S.; Zhang, Y.; Ma, C. Study of microstructure evolution and fatigue crack extension properties of 42CrMo steel strengthened by induction hardening. J. Mater. Res. Technol. 2025, 35, 3887–3901. [Google Scholar] [CrossRef]
- Liu, J.; Li, J.; Cheng, X.; Wang, H. Microstructural evolution of aerMet100 steel coating on 300M steel fabricated by laser cladding technique. Metall. Mater. Trans. A 2018, 49, 595–603. [Google Scholar] [CrossRef]
- Wang, W.; Liang, C.; Zeng, J.; Zhou, Y.; Chen, B.; He, H. Mechanism of tempered sorbite formation and related enhanced mechanical properties for a typical high carbon steel billet under strong cooling intensity. Metall. Mater. Trans. B 2021, 52, 4061–4069. [Google Scholar] [CrossRef]
- Hao, Q.; Qin, S.; Liu, Y.; Zuo, X.; Chen, N.; Huang, W.; Rong, Y. Effect of retained austenite on the dynamic tensile behavior of a novel quenching-partitioning-tempering martensitic steel. Mater. Sci. Eng. A 2016, 662, 16–25. [Google Scholar] [CrossRef]
- Yen, H.-W.; Chiang, M.-H.; Lin, Y.-C.; Chen, D.; Huang, C.-Y.; Lin, H.-C. High-temperature tempered martensite embrittlement in quenched and tempered offshore steels. Metals 2017, 7, 253. [Google Scholar] [CrossRef]
- Huang, C.; Lin, X.; Liu, F.; Yang, H.; Huang, W. High strength and ductility of 34CrNiMo6 steel produced by laser solid forming. J. Mater. Sci. Technol. 2019, 35, 377–387. [Google Scholar] [CrossRef]
- Murdoch, H.A.; Field, D.M.; Szajewski, B.A.; McClenny, L.D.; Garza, A.; Rinderspacher, B.C.; Haile, M.A.; Limmer, K.R. Tempered hardness optimization of martensitic alloy steels. Integr. Mater. Manuf. Innov. 2023, 12, 301–320. [Google Scholar] [CrossRef]
- Li, H.Y.; Sun, H.L.; Bowen, P.; Knott, J.F. Effects of compressive residual stress on short fatigue crack growth in a nickel-based superalloy. Int. J. Fatigue 2018, 108, 53–61. [Google Scholar] [CrossRef]
- Lu, S.-Q.; Chiu, L.-H. Effect of different microstructures on surface residual stress of induction-hardened bearing steel. Metals 2024, 14, 201. [Google Scholar] [CrossRef]
- Shi, X.-L.; Xiu, S.-C.; Su, H.-L. Residual stress model of pre-stressed dry grinding considering coupling of thermal, stress, and phase transformation. Adv. Manuf. 2019, 7, 401–410. [Google Scholar] [CrossRef]
Disclaimer/Publisher’s Note: The statements, opinions and data contained in all publications are solely those of the individual author(s) and contributor(s) and not of MDPI and/or the editor(s). MDPI and/or the editor(s) disclaim responsibility for any injury to people or property resulting from any ideas, methods, instructions or products referred to in the content. |
© 2025 by the authors. Licensee MDPI, Basel, Switzerland. This article is an open access article distributed under the terms and conditions of the Creative Commons Attribution (CC BY) license (https://creativecommons.org/licenses/by/4.0/).