Abstract
In this work, a rapid process optimization framework for laser powder bed fusion (LPBF) based on a high-throughput mechanical testing platform and data analytical methods was proposed and validated. This framework enables the efficient building of a process–properties database and analytical model, as well as the fine-tuning of customized mechanical properties. Unlike previous approaches that focused primarily on density as the main optimization target, this method directly aligns the mechanical properties by systematically varying the LPBF process parameters (e.g., laser power, scanning speed, etc.). Tensile specimens in the high densification range were prepared and tested using a high-throughput mechanical property test platform (HTP). Following this, an analytical model correlating tensile properties and process parameters was developed using response surface methodology (RSM). Based on this model recommendation, a specimen with a densification of 99.46% and a yield strength (YS) of 524.74 MPa was achieved, with only a 3.72% variation compared to the predicted value (526.08 MPa), confirming the model’s reliability. A comprehensive analysis of relative density, phase content and microstructure was conducted, comparing them with a specimen exhibiting lower properties. This study provides an effective method for the rapid evaluation and optimization of LPBF processing parameters for fine-tuning customized mechanical properties.
1. Introduction
Additive manufacturing (AM), also known as 3D printing [1,2], is a technology that fabricates physical parts by successively adding materials layer by layer, based on three-dimensional CAD data [3]. Compared to conventional manufacturing processes, AM offers significant advantages, including high material utilization, near-net-shape fabrication, the ability to create complex geometries, and rapid turnaround times [4]. Depending on the material and energy source employed, AM can be classified into various techniques [5]. Among these, laser powder bed fusion (LPBF) stands out as an advanced metal additive manufacturing technology that utilizes a high-energy laser beam to selectively melt and consolidate powder materials, directly producing near-net-shape parts [6]. The unique processing mechanism of LPBF, where powder materials are fully melted and then rapidly solidified at cooling rates of 105–108 K/s, subjects the molten material to complex and non-equilibrium physical and metallurgical processes during LPBF. This extremely high cooling rate not only leads to the formation of non-equilibrium phases such as martensite transformation and nano-precipitation but also induces significant micro-segregation and residual stresses [6,7,8].
316L stainless steel fabricated by LPBF 316L exhibits significant mechanical anisotropy, whose formation mechanism can be traced to multi-scale structural heterogeneity. Firstly, it may be attributed to oxide inclusions, incomplete fusion defects, and elemental segregation at interlayer interfaces [9,10,11]. In addition, inhomogeneous grain morphology (the ratio of columnar grains to equiaxed grains) and preferred orientation [12,13,14,15] can also lead to the anisotropy of 316L, Moreover, the existing crystallographic texture induces differences in the activation of slip systems, thereby resulting in variations in mechanical properties [6,15,16]. It is worth noting that the anisotropic behavior of tensile properties shows complex dependence: specimens parallel to the build direction generally exhibit higher elongation at break, but vertically oriented specimens may also show advantages under specific process conditions [17], which reflects the nonlinear relationship between process, structure, and properties, thereby profoundly influencing the densification behavior and ultimately the mechanical properties of the material [18,19].
Process parameter optimization is a crucial step in achieving high-performance metal AM parts. Currently, for various metal alloys (e.g., 316L stainless steel [20], Inconel 718 [3], TC4 alloy [21], AlSi10 Mg alloy [22] and NiTi alloy [23], etc.), existing studies largely focus on density as the primary optimization target. However, for some readily processable metallic materials, the high-density processing window is quite broad. For instance, SS 316L can yield nearly fully dense (≥99.8%) samples using a volumetric energy density ranging from 46 to 127 J/mm3 [24]; similarly, Invar alloy exhibits analogous characteristics. However, pursuing high density alone may neglect microstructural regulation (e.g., inhibition of columnar grain growth) and residual stress control, resulting in the comprehensive performance of the material failing to meet the high-reliability requirements of applications such as aerospace and biomedical engineering. This “high density–low performance” paradox reveals the limitations of traditional density-oriented optimization strategies and highlights the necessity of establishing performance prediction models within the full parameter space.
To address the above challenges, this study proposes a rapid LPBF process optimization framework based on high-throughput experiments and response surface methodology (RSM), and conducts empirical research on commercial 316L stainless steel. This work forms a series of studies with [25]; the former systematically analyzes the influence mechanism of process parameters on microstructural evolution via electron backscatter diffraction (EBSD), while this study constructs a data-driven process–performance mapping model. Specifically, the research team fabricated and tested LPBF 316L specimens under 30 sets of process parameters (with three replicates per set) using a self-developed high-throughput tensile testing platform. Combined with RSM, a quadratic response model between yield strength and laser power (P), scanning speed (V), and hatch spacing (H) was established. Through analysis of variance (ANOVA), the influence weights of each parameter and their interaction effects on performance were quantified, ultimately achieving precise optimization of the process window that balances high density (≥98.5%) and customized mechanical properties. Compared with traditional single-factor experiments, this study significantly improves the efficiency of process development through closed-loop iteration of mathematical modeling and experimental verification, providing a quantifiable scientific basis for the high-performance manufacturing of LPBF alloys.
2. Material and Experimental Methods
2.1. Raw Material
Table 1 316L powder used in this study was supplied by Jiangsu Vilory Advanced Materials Technology Co., Ltd. in Xuzhou, China. The powder exhibited a high degree of sphericity (≥99%) and a Hall flow rate of 12.1 s/50 g. The chemical composition of the powder, presented in Table 1, conforms to the ASTM A240 standard. The morphology and particle size distribution of the powder are shown in Figure 1a and Figure 1b, respectively. As can be seen, the median particle size Dv (50) = 20.81 μm, which is suitable for LPBF technology.

Table 1.
Weight percentage composition (wt. %) of SS 316L powder elements.
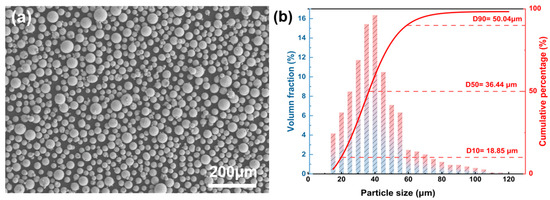
Figure 1.
SS 316L powder: (a) SEM morphology, (b) particle size distribution.
2.2. LPBF Equipment and Process Parameters
In this study, experiments were conducted using an HBD-80 additive manufacturing system manufactured by Shanghai Hanbo United 3D Technology Co., Ltd. (Hanbang Union 3D Technology Co., Ltd., Shanghai, China). The system is equipped with a YLR-500 fiber laser, with a working wavelength of 1064 nm and a laser beam diameter of approximately 33 μm. To ensure powder dryness, all powder materials were dried in a vacuum oven at 80 °C for 8 h prior to printing to completely remove any moisture. The LPBF process was performed under a protective atmosphere of argon gas, with the oxygen content controlled below 5 ppm. Figure 2a illustrates the manufacturing process flow of the LPBF device. To avoid the cumulative effect of scanning paths, a 67° rotation scanning strategy was adopted, where the scanning path was rotated by 67° after each layer was scanned, as shown in Figure 2b.
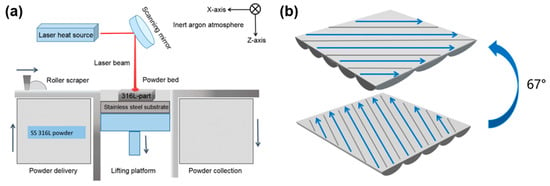
Figure 2.
(a) Schematic diagram of LPBF technology and (b) laser scanning strategy.
To investigate the influence of various process parameters on the quality of SS 316L, this study employs the volume energy density (VED) as an evaluation metric, which is calculated using the formula VED = P/(HVt), where P represents the laser power, H represents the laser scanning hatch spacing, V represents the laser scanning speed, and t represents the layer thickness. The selection of process parameters in this study was based on reference [25], and a total of 30 sets of experimental parameters were designed, as shown in Table 2. These parameters were varied within the following ranges: laser power P (150–225 W), scanning speed H (600–1000 mm/s), and hatch spacing H (80–120 μm).

Table 2.
Process parameters for LPBF-fabricated SS 316L (41.7 J/mm3 ≤ VED ≤ 156.3 J/mm3).
2.3. Materials Testing and Characterization
Traditional mechanical testing equipment would result in excessive time consumption and high costs. Therefore, a self-developed high-throughput testing platform was utilized to efficiently collect tensile testing data [26,27]. As shown in Figure 3, the experimental specimen consisting of a bottom cube sample and a top high-throughput tensile testing sample was fabricated with various parameters, where the Small red square samples were used to assess their relative density and microstructure. Cube shape with dimensions of 10 mm × 10 mm × 10 mm. The remaining portion serves as the high-throughput tensile specimen, and detailed testing conditions can be found in reference [25]. Figure 3b illustrates the high-throughput mechanical property testing process, testing specimens one by one.
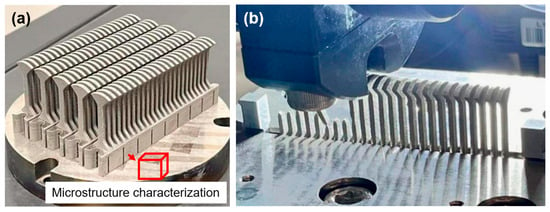
Figure 3.
(a) Printing model, (b) High throughput tensile process.
The Archimedes method was used to measure the density of the samples using a MAY-D80 automatic testing balance (MAYZUM Scientific Instruments (Shenzhen) Co., Ltd., Shenzhen, China). A Zeiss 40MAT optical microscope (Carl Zeiss (China) Co., Ltd., Suzhou, China) was used to observe the macroscopic structure of the samples. Electron backscatter diffraction (EBSD) data were acquired using a Zeiss Gemini 300 scanning electron microscope (Carl Zeiss AG, Oberkochen, Germany). Prior to EBSD analysis, the samples underwent electropolishing in a solution of C2H5OH (volume ratio of 1:9), followed by argon ion polishing using a Gatan precision etch coating system (PECS) II 685 (Gatan Inc., Pleasanton, CA, USA). Finally, EBSD testing was performed. The EBSD data were processed using Aztec Crystal 2.1 software.
2.4. Materials Properties-Process Analytical Modeling
To further investigate the linkage between process parameters and the mechanical properties of SS 316L under high-density conditions, Box–Behnken Design (BBD), a specific implementation of response surface methodology (RSM) [28], was employed using Design-Expert 13 software. BBD is a three-level fractional factorial design that efficiently explores quadratic response surfaces while avoiding extreme factor combinations, making it ideal for optimizing LPBF parameters [28]. With laser power P, scanning speed V, and hatch spacing H as experimental factors, the yield strength (YS) was set as the response variable. A multiple quadratic regression equation (Equation (1)) [29] was used to construct an approximate mathematical model as:
where y is the response variable, xi represents the independent variables, k is the number of experimental factors, α represents the regression coefficients, and ω is the random error.
3. Results
3.1. Relative Density
Figure 4 illustrates the relationship between volume energy density (VED) and relative density. It is evident that the relative densities of most samples exceed 98.5%, corresponding to a VED range of 55.56 J/mm3 to 156.3 J/mm3. This range highlights the broad LPBF processing window for SS 316L stainless steel. Consequently, subsequent LPBF process optimization experiments were conducted within the process parameters that correspond to a relative density greater than 98.5%.
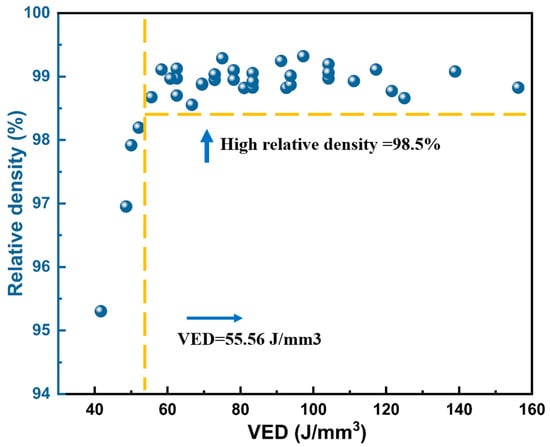
Figure 4.
The relationship between VED and the relative density for LPBF-fabricated SS 316L.
3.2. High-Throughput Tensile Testing
In order to effectively evaluate the mechanical properties of the material within the defined densification range, we used a self-developed high-throughput tensile testing platform to conduct tensile tests on the specimens. For each process parameter, three specimens were tested, respectively. The high-throughput tensile curves obtained are shown in Figure 5, and the experimental results are summarized in Table 3. These curves originated from 108 tests reported in reference [25] (36 sets of process parameters, each repeated 3 times); after screening based on the criterion of relative density ≥ 98.5%, 90 curves were retained from the highly densified specimens (30 sets of process parameters, each repeated 3 times).
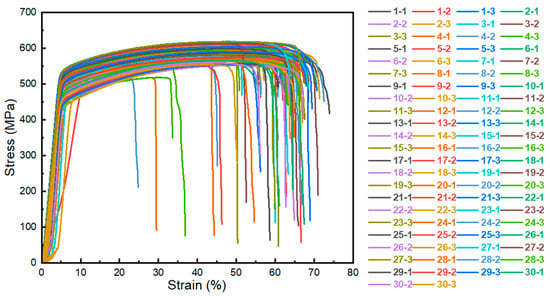
Figure 5.
Stress–strain curves of 90 specimens across 30 process parameters, with three repetitions, obtained through high-throughput tensile testing.

Table 3.
High-throughput tensile test results.
3.3. Process–Properties Analytical Model
Based on the tensile properties obtained above, Design-Expert 13 software was employed to analyze the experimental results using RSM, to identify the process parameters that yield optimal properties. The RSM parameter optimization process is presented in Figure 6, in accordance with Ref [28]. The results indicated that the multiple quadratic regression equation provided the best fit to the experimental data. The binary polynomial regression equation for yield strength (YS) as a function of laser power (P), scanning speed (V), and hatch spacing (H) is as follows:
YS = 404.02967 – 0.883200 P + 0.008094 V + 3.73227 H + 0.002172 P × V + 0.009000 P × H − 0.001589 V × H − 0.006229 P2 − 0.017849 H2
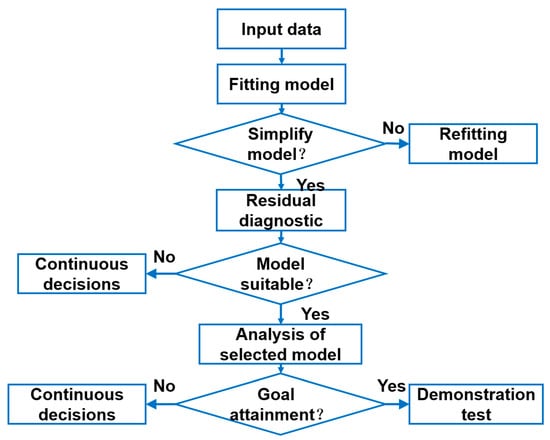
Figure 6.
RSM parameter optimization process Reprinted from Ref. [28].
Table 4 presents the variance analysis of the regression equation fitting. In this study, analysis of variance (ANOVA) was employed to assess the significance and confidence level of the response model [30]. In ANOVA, the significance of the model and its coefficients is typically evaluated based on the F-value and p-value [31,32]. The F-value is the statistic for the F-test, and the larger its value, the more significant the model, and the better the model’s fit to the data. The p-value represents the probability that the F-value is greater than the standard value and is used to test the significance of the model and to analyze the significance of the influence of different factors on the response value [33]. When the p-value is less than 0.05, the model is considered significant; when the p-value is less than 0.01, the model is considered very significant [34]; otherwise, the model is considered not significant. Furthermore, the larger the p-value, the greater the possibility of error in the model. Table 4 indicates that the regression model fits well, and the degree of influence of laser power (P), scanning speed (V), and hatch spacing (H) on density is approximately equivalent.

Table 4.
Variance analysis of regression equation terms.
Table 5 presents the reliability analysis results of the regression model. The closer the coefficient of determination (R2) and adjusted R2 are to 1, the smaller the error between the experimental and predicted values of the fitted model [35]. As shown in Table 5, the R2 of this model is 0.9465, and the adjusted R2 is 0.9224, indicating a high degree of fit with the true values and a small prediction error. The coefficient of variation (C.V.) reflects the degree of dispersion in the experimental data. A smaller C.V. value indicates less variability between experimental data points and higher data accuracy. The low C.V. value of 1.23 in Table 5 confirms the reliability of the experimental data. Adeg Precision measures the signal-to-noise ratio; a value of 21.5008 indicates that the model is effective in Design Expert software. Therefore, this mathematical model can be effectively used to analyze and predict the mechanical properties of LPBF samples.

Table 5.
Reliability analysis of regression variance.
To assess the goodness of fit and prediction accuracy of the response model, this study compared the predicted values with the experimental values. Figure 7 presents the fitting plot of predicted versus experimental values for the yield strength of LPBF-formed SS 316L. The predicted and experimental values are closely aligned on both sides of the straight line, with minimal deviation. The points in Figure 7 are approximately linearly distributed, further validating the reliability of the fitting results. In conclusion, it can be inferred that the mathematical model for yield strength (YS) developed in this study exhibits strong adaptability and high accuracy.
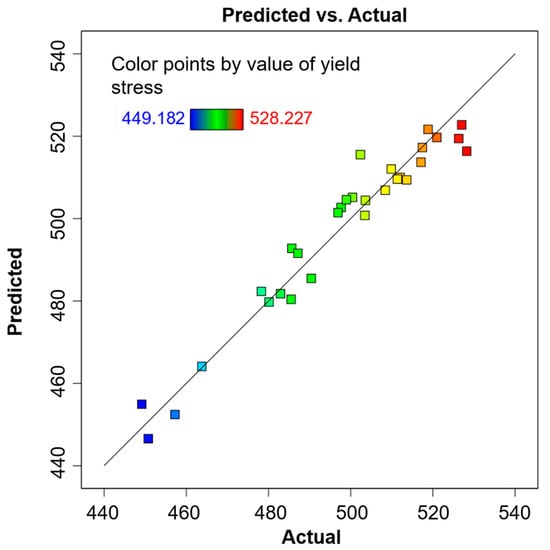
Figure 7.
Comparison of predicted and actual values of yield stress of LPBF SS 316L.
From Figure 8a, it can be observed that there is an approximately parabolic relationship between the laser power, scanning speed, hatch spacing, and yield strength. As the scanning speed (denoted as factor B) or hatch spacing increases, the yield strength also increases, indicating a positive correlation. Here, “B-600” and “B+1000” in the figure refer to specific levels of scanning speed, where B-600 represents a scanning speed of 600 mm/s and B+1000 represents a scanning speed of 1000 mm/s, selected as typical values to illustrate the influence trend of scanning speed on yield strength in the response surface analysis. A moderately high scanning speed (e.g., around B+1000) can improve the flow of the molten pool, reduce defects such as pores, increase the effective load-bearing area, and reduce stress concentration. However, an excessively high scanning speed beyond this range will lead to an increase in defects due to insufficient energy input, so there is an appropriate range. Figure 8b shows that as the laser power increases, the yield strength decreases, presenting a negative correlation. Meanwhile, the figure includes 95% confidence intervals (95% CI bands) to evaluate the reliability of the predicted values. The black solid line represents the predicted trend line, the red dots are the experimental design points, and the light-blue dashed lines are the 95% confidence interval. It can be seen from Figure 8c,d that factor A (laser power) is involved in multiple interactions. The trend shows that as the laser power (A) increases, the yield strength decreases. This is because a high energy density causes a high melting temperature in the molten pool. Subsequently, rapid cooling of the molten pool generates high residual stresses and pores, which in turn lead to a decrease in performance.
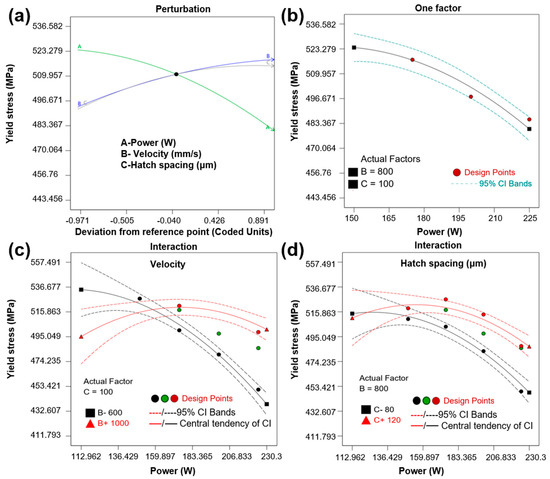
Figure 8.
(a) Effect of different factors on yield strength; (b) Effect of laser power on yield strength; (c) Effect of laser power and scanning speed on yield strength; (d) Effect of laser power and hatch spacing on yield strength.
Figure 9a presents a three-dimensional response surface plot of the yield strength (YS). This figure shows a mountain-shaped surface, indicating that the laser power, scanning speed, and hatch spacing have significant nonlinear interactions on YS. Figure 9b illustrates the effects of the laser power and scanning speed on the yield strength at a fixed hatch distance (H = 100 μm), while Figure 9c demonstrates the interaction effects of the laser power and hatch distance on the yield strength at a fixed scanning speed (v = 800 mm/s). It was observed that YS increases with the decrease in the laser power or the increase in the scanning speed. Notably, the optimal conditions for YS correspond to the combination of low laser power and high scanning speed. Therefore, it can be inferred that YS is not always positively correlated with the laser power and scanning speed. Figure 9d shows the interaction effects of the scanning speed and hatch distance on the yield strength at a fixed laser power (P = 187.5 W). A higher scanning speed can improve the flow of the molten pool, reduce defects such as pores, decrease stress concentration, and thus enhance the yield strength.
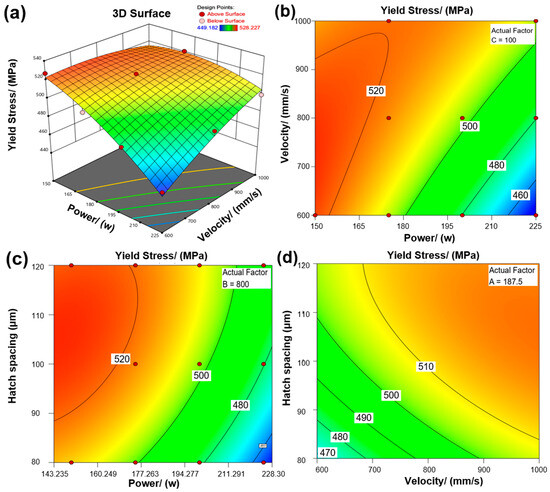
Figure 9.
Influence of laser power and laser velocity on yield stress of LPBF SS 316L: (a) 3D surface; (b) Contour maps illustrate the effect of power and velocity on the YS; (c) Contour maps illustrate the effect of power and hatch spacing on the YS; (d) Contour maps illustrate the effect of velocity and hatch spacing on the YS.
3.4. Process Optimization and Verification
To validate this method, two sets of processing parameters recommended by the software were experimentally tested: the optimal set (P = 150 W, H = 110 μm, v = 700 mm/s) for maximizing yield strength, and a sub-optimal set (P = 225 W, H = 80 μm, v = 800 mm/s), listed in Table 6. The given process parameters were rounded up, and three samples were printed for each set of processes. For the three specimens fabricated under the optimized process parameters, the coefficient of variation (standard deviation divided by the mean) of the experimentally measured yield strength was only 0.88%. In comparison, specimens produced using sub-optimal parameters exhibited a coefficient of variation of 0.45%. These small deviations indicate that the process is stable and exhibits high reliability. In addition, by comparing the actual values with the predicted values, the deviation rate between the actual value and the predicted value for the optimized process was 3.72% (Figure 10a), and for the sub-optimal process, the deviation rate was 0.26% (Figure 10b). When making predictions through the RSM, it is generally considered that a deviation rate within 10% between the predicted value and the experimental value is reliable. Therefore, in this study, the RSM was used to predict the optimal process parameters and mechanical properties of 316L stainless steel, and the selected mathematical model was effective and had a high prediction accuracy.

Table 6.
P, V, H, YS of predicted, optimal specimen and sub-optimal specimen.
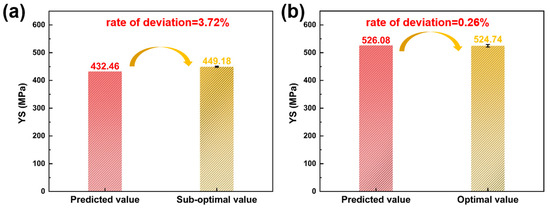
Figure 10.
Error of predicted and experimentally tested values: (a) predicted and sub-optimal value, (b) predicted and optimal value.
4. Discussion
4.1. Process–Microstructure–Properties Correlation for Optimal and Sub-Optimal Specimens
To reveal the intrinsic reasons for the variation in properties between the optimal and sub-optimal specimens, detailed characterization and analysis were conducted on both specimens.
4.1.1. Phase Analysis
Figure 11 shows the X-ray diffraction (XRD) patterns of the optimal sample and the sub-optimal sample. XRD pattern analysis reveals that the only detectable crystalline phase in both samples is austenite, which is consistent with the general results of 316L stainless steel fabricated by the LPBF process—under rapid cooling rates (105–108 K/s) similar to those in this study, the austenite phase is typically the main crystalline phase [31,32,33,34,35,36]. Therefore, the phase content is not the main factor contributing to the changes in performance.
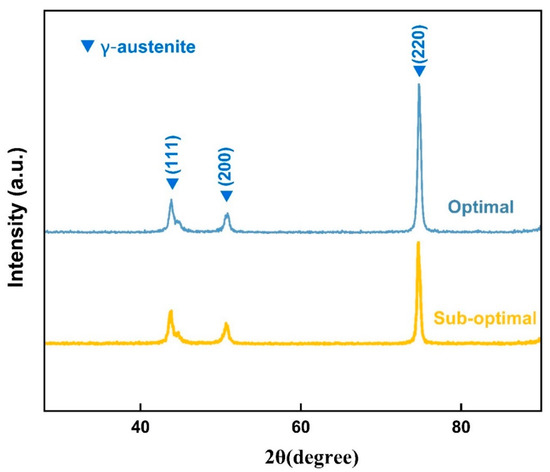
Figure 11.
SS 316L XRD patterns of optimal and sub-optimal specimens synthesized by LPBF.
4.1.2. Grain Size and Morphology
Figure 12a,b show the grain structure map of LPBF-fabricated 316L stainless steel under optimal process parameters (VED = 62.5 J/mm3) and sub-optimal process parameters (VED = 117.2 J/mm3), respectively. Figure 12c shows an average grain size of 7.29 μm, while Figure 12d shows an average grain size of 13.15 μm. This data clearly shows that the microstructure under the optimal process parameters is more refined, with the grain size reduced by approximately 45% compared to the suboptimal condition, laying the foundation for the enhancement of yield strength through fine-grain strengthening. The increase in grain size may be attributed to a decrease in grain nucleation density with increasing VED, where the grain growth tendency outweighs the nucleation tendency [37]. This phenomenon has also been reported in Invar alloys [38], titanium alloys [37,39] and steel [40]. The grain size distribution in Figure 12c is concentrated between 0 and 10 μm, with a high frequency. In contrast, the grain size distribution in Figure 12d is more dispersed, covering a range of 0 to 40 μm, with a relatively uniform frequency in different size intervals. Materials with finer grains typically exhibit higher strength based on the Hall–Pitch Equation.
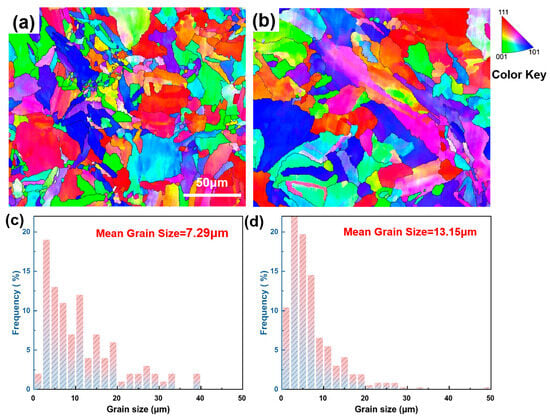
Figure 12.
Grain distribution of LPBF-fabricated SS 316L specimens at different processes: (a) optimal specimen (VED = 62.5 J/mm3); (b) sub-optimal specimen (VED = 117.2 J/mm3); (c) average grain size: 7.29 μm; (d) average grain size: 13.15 μm.
4.1.3. Geometric Dislocation Density
During the LPBF process, rapid cooling can lead to the accumulation of significant thermal stresses, which in turn induce plastic deformation in the microstructure. The accumulation of thermal stresses can cause plastic deformation in the microstructure [41]. Kernel average misorientation (KAM) values can quantify the degree of plastic deformation and reflect the concentration of thermal stresses or defect density [42]. In Figure 13a (the optimal sample), the green and yellow areas KAM are more widely distributed, indicating a higher cumulative amount of local plastic deformation and more significant interaction of dislocations. This is consistent with a higher geometric dislocation density (2.39 × 10¹⁴/m2), thereby enhancing the yield strength through the dislocation strengthening effect. Figure 13 shows the KAM maps and grain boundary angle distribution maps. In Figure 13a,b, the green regions represent higher KAM values, indicating that significant plastic deformation exists in these regions. The average grain boundary density in Figure 13a (2.39 × 10¹⁴/m2) is higher than that in Figure 13b (1.13 × 10¹⁴/m2), indicating that the material represented by Figure 13a has a higher grain boundary density, which typically implies smaller grain sizes in the material. This can improve the strength and hardness of the material.
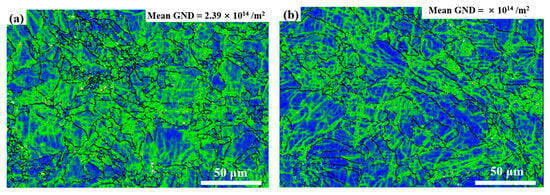
Figure 13.
KAM figures of LPBF-fabricated SS 316L specimens at different process parameters: (a) optimal specimen (VED = 62.5 J/mm3); (b) sub-optimal specimen (VED = 117.2 J/mm3).
Overall, though optimal and sub-optimal specimens have high density above 99%, the higher YS of the optimal specimen is attributed to smaller grain size and higher dislocation density and GND.
4.2. Advantages of This Method
4.2.1. High Efficiency
The entire framework was completed in 50 h due to the following factors. First, the high-throughput tensile testing platform automatically tested a batch of specimens in a short duration, increasing efficiency by a factor of 10 compared to manual testing. Second, significant time was saved on sample polishing and detailed microstructure characterization on all dense specimens. Third, RSM was used for data analysis, model development, and process parameter optimization.
4.2.2. Potential of Fine-Tuning Process Parameter for Customized Properties
Traditionally, process optimization has focused primarily on densification, defect control, and microstructure evolution. Mechanical properties have typically been tested only at selected process parameters, making it challenging to establish a comprehensive understanding of the relationship between process and properties. In this study, by utilizing 30 data points with corresponding process parameters and properties, we developed an analytical model capable of recommending process parameters for any customized properties within the specified range. This approach is critical for demanding applications in aerospace and medical fields.
5. Conclusions
In this study, a rapid process optimization framework for LPBF based on a high-throughput mechanical testing platform and data analytical methods was proposed and validated. A response surface model was developed to describe the relationship between laser power, scanning speed, hatch spacing, and yield strength, using 30 data points with corresponding process parameters and properties obtained from the high-throughput testing platform. The optimal specimen, based on the suggested processing parameters, showed a yield strength in agreement with the predicted value, and detailed characterization revealed the intrinsic factors contributing to the high yield strength.
The main research conclusions are summarized as follows:
- This new properties-oriented process optimization framework, based on a high-throughput testing platform and data analysis methods, is highly efficient, requiring 50 h to build the process–properties database and analytical model, as well as identify the processing parameters for the highest yield strength (YS).
- The constructed analytical model, based on 30 data points with corresponding process parameters and properties, has a coefficient of determination (R2) of 0.9465 and an adjusted R2 of 0.9224, demonstrating good agreement with the experimental results. The actual YS with the optimal process parameters deviates by only 0.26% from the model’s predicted value.
- The higher YS of the optimal specimen is attributed to its smaller grain size and higher dislocation density and grain boundary dislocations (GND), as revealed by detailed microstructure analysis.
This study aims to provide new insights into achieving high performance in LPBF-fabricated SS 316L, specifically by further improving its mechanical properties through precise control of process parameters, while maintaining high density.
Author Contributions
G.H.: Visualization, Resources, Investigation, Conceptualization. K.H.: Writing—review and editing, Supervision, Funding acquisition, Conceptualization. J.Z.: Writing—original draft, Software, Methodology, Investigation, Formal analysis. M.J.: Writing—review and editing, Visualization, Validation, Supervision, Resources. All authors have read and agreed to the published version of the manuscript.
Funding
This research received no external funding.
Data Availability Statement
The original contributions presented in this study are included in the article. Further inquiries can be directed to the corresponding author.
Acknowledgments
This article would like to thank Eff-M China Co., Ltd. for their high-throughput testing and analysis.
Conflicts of Interest
The authors declare no conflicts of interest.
References
- Sefene, E.M. State-of-the-art of selective laser melting process: A comprehensive review. J. Manuf. Syst. 2022, 63, 250–274. [Google Scholar] [CrossRef]
- Ishfaq, K.; Khan, M.D.A.; Khan, M.A.A.; Mahmood, M.A.; Maqsood, M.A. A correlation among industry 4.0, additive manufacturing, and topology optimization: A state-of-the-art review. Int. J. Adv. Manuf. Technol. 2023, 129, 3771–3797. [Google Scholar] [CrossRef]
- Blakey-Milner, B.; Gradl, P.; Snedden, G.; Brooks, M.; Pitot, J.; Lopez, E.; Leary, M.; Berto, F.; du Plessis, A. Metal additive manufacturing in aerospace: A review. Mater. Des. 2021, 12, 110008. [Google Scholar] [CrossRef]
- Yin, Y.; Tan, Q.; Bermingham, M.; Mo, N.; Zhang, J.; Zhang, M.-X. Laser additive manufacturing of steels. Int. Mater. Rev. 2022, 67, 487–573. [Google Scholar] [CrossRef]
- Huang, G.; He, G.; Gong, X.; He, Y.; Liu, Y.; Huang, K. Additive manufacturing of Invar 36 alloy. J. Mater. Res. Technol. 2024, 30, 1241–1268. [Google Scholar] [CrossRef]
- DebRoy, T.; Wei, H.L.; Zuback, J.S.; Mukherjee, T.; Elmer, J.W.; Milewski, J.O.; Beese, A.M.; Wilson-Heid, A.; De, A.; Zhang, W. Additive manufacturing of metallic components—Process, structure and properties. Prog. Mater. Sci. 2018, 92, 112–224. [Google Scholar] [CrossRef]
- Lewandowski, J.J.; Seifi, M. Metal Additive Manufacturing: A Review of Mechanical Properties. Annu. Rev. Mater. Res. 2016, 46, 151–186. [Google Scholar] [CrossRef]
- Collins, P.C.; Brice, D.A.; Samimi, P.; Ghamarian, I.; Fraser, H.L. Microstructural Control of Additively Manufactured Metallic Materials. Annu. Rev. Mater. Res. 2016, 46, 63–91. [Google Scholar] [CrossRef]
- Kong, D.; Ni, X.; Dong, C.; Zhang, L.; Man, C.; Cheng, X.; Li, X. Anisotropy in the microstructure and mechanical property for the bulk and porous 316L stainless steel fabricated via selective laser melting. Mater. Lett. 2019, 235, 1–5. [Google Scholar] [CrossRef]
- Casati, R.; Lemke, J.; Vedani, M. Microstructure and Fracture Behavior of 316L Austenitic Stainless Steel Produced by Selective Laser Melting. J. Mater. Sci. Technol. 2016, 32, 738–744. [Google Scholar] [CrossRef]
- Suryawanshi, J.; Prashanth, K.G.; Ramamurty, U. Mechanical behavior of selective laser melted 316L stainless steel. Mater. Sci. Eng. A 2017, 696, 113–121. [Google Scholar] [CrossRef]
- Hall, E.O. The Deformation and Ageing of Mild Steel: III Discussion of Results. Proc. Phys. Soc. Sect. B 2002, 64, 495. [Google Scholar] [CrossRef]
- Armstrong, R.W. The (cleavage) strength of pre-cracked polycrystals. Eng. Fract. Mech. 1987, 28, 529–538. [Google Scholar] [CrossRef]
- Im, Y.D.; Kim, K.H.; Jung, K.H.; Lee, Y.K.; Song, K.H. Anisotropic Mechanical Behavior of Additive Manufactured AISI 316L Steel. Metall. Mater. Trans. A 2019, 50, 2014–2021. [Google Scholar] [CrossRef]
- Niendorf, T.; Leuders, S.; Riemer, A.; Richard, H.A.; Tröster, T.; Schwarze, D. Highly Anisotropic Steel Processed by Selective Laser Melting. Met. Mater. Trans. B 2013, 44, 794–796. [Google Scholar] [CrossRef]
- Sun, Z.; Tan, X.; Tor, S.B.; Chua, C.K. Simultaneously enhanced strength and ductility for 3D-printed stainless steel 316L by selective laser melting. Npg Asia Mater. 2018, 10, 127–136. [Google Scholar] [CrossRef]
- Hitzler, L.; Hirsch, J.; Heine, B.; Merkel, M.; Hall, W.; Öchsner, A. On the Anisotropic Mechanical Properties of Selective Laser-Melted Stainless Steel. Materials 2017, 10, 1136. [Google Scholar] [CrossRef]
- Parry, L.; Ashcroft, I.A.; Wildman, R.D. Understanding the effect of laser scan strategy on residual stress in selective laser melting through thermo-mechanical simulation. Addit. Manuf. 2016, 12, 1–15. [Google Scholar] [CrossRef]
- Ma, M.; Wang, Z.; Zeng, X. A comparison on metallurgical behaviors of 316L stainless steel by selective laser melting and laser cladding deposition. Mater. Sci. Eng. A 2017, 685, 265–273. [Google Scholar] [CrossRef]
- Additive Manufacturing of FeCrAl Alloys for Nuclear Applications—A focused Review|Semantic Scholar, (n.d.). Available online: https://www.semanticscholar.org/paper/Additive-manufacturing-of-FeCrAl-alloys-for-nuclear-Palaniappan-Joshi/4b81ac05df3f91e315e414099e841955d3211cd8 (accessed on 19 February 2025).
- Zhang, L.C.; Attar, H. Selective Laser Melting of Titanium Alloys and Titanium Matrix Composites for Biomedical Applications: A Review. Adv. Eng. Mater. 2016, 18, 463–475. [Google Scholar] [CrossRef]
- Wang, D.; Wang, Y.; Yang, Y.; Lu, J.; Xu, Z.; Li, S.; Lin, K.; Zhang, D. Research on design optimization and manufacturing of coating pipes for automobile seal based on selective laser melting. J. Mater. Process. Technol. 2019, 273, 116227. [Google Scholar] [CrossRef]
- Hou, S.; Qi, S.; Hutt, D.A.; Tyrer, J.R.; Mu, M.; Zhou, Z. Three dimensional printed electronic devices realised by selective laser melting of copper/high-density-polyethylene powder mixtures. J. Mater. Process. Technol. 2018, 254, 310–324. [Google Scholar] [CrossRef]
- Diaz Vallejo, N.; Lucas, C.; Ayers, N.; Graydon, K.; Hyer, H.; Sohn, Y. Process Optimization and Microstructure Analysis to Understand Laser Powder Bed Fusion of 316L Stainless Steel. Metals 2021, 11, 832. [Google Scholar] [CrossRef]
- Huang, G.; Chen, H.; Ma, Z.; Zhang, R.; Pei, J.; Lie, Z.; Du, P.; Peng, X.; Liu, Y.; Huang, K. Microstructure and mechanical properties of stainless steel addictively manufactured via laser powder bed fusion in high-dense process parameter window. Mater. Sci. Eng. A 2025, 928, 148033. [Google Scholar] [CrossRef]
- Huang, K.; Kain, C.; Urbano, A.; Sarley, B. High throughput testing platform and application in wire arc additive manufactured superalloy: Anisotropy investigation and component qualification. Materialia 2021, 16, 101086. [Google Scholar] [CrossRef]
- Huang, K.; Kain, C.; Diaz-Vallejo, N.; Sohn, Y.; Zhou, L. High throughput mechanical testing platform and application in metal additive manufacturing and process optimization. J. Manuf. Process. 2021, 66, 494–505. [Google Scholar] [CrossRef]
- Zhou, Y.; Fang, Y.; Wang, J.; Xu, L.; Wang, D. Process Parameter Optimization on Selective Laser Melting of CuSn10 Powders Based on Response Surface Methodology. J. Phys. Conf. Ser. 2022, 2262, 012002. [Google Scholar] [CrossRef]
- Montgomery: Design and Analysis of Experiments, 6th Edition-Student Comanion Site 2025. Available online: https://bcs.wiley.com/he-bcs/Books?action=index&itemId=047148735X&itemTypeId=BKS&bcsId=2172 (accessed on 1 January 2004).
- Zhou, T.; Shi, G.; Wu, Q.; Wang, Z.; Che, J.; Wu, H. Optimization of Cutting Parameters for Cubic Boron Nitride Tool Wear in Hard Turning AISI M2. J. Mater. Eng. Perform. 2024, 33, 11298–11308. [Google Scholar] [CrossRef]
- Guo, C.; He, S.; Yue, H.; Li, Q.; Hao, G. Prediction modelling and process optimization for forming multi-layer cladding structures with laser directed energy deposition. Opt. Laser Technol. 2021, 134, 106607. [Google Scholar] [CrossRef]
- Zhou, T.; Wu, Q.; Wang, Z.; Zhao, G.; Li, S.; Guo, B.; Wu, H. Analysis of machined surface topography of AISI M2 in hard turning based on Box-Behnken Design. Proc. Inst. Mech. Eng. Part B J. Eng. Manuf. 2024, 238, 58–71. [Google Scholar] [CrossRef]
- Khorram, A.; Jamaloei, A.D.; Paidar, M.; Cao, X. Laser cladding of Inconel 718 with 75Cr3C2 + 25(80Ni20Cr) powder: Statistical modeling and optimization. Surf. Coat. Technol. 2019, 378, 124933. [Google Scholar] [CrossRef]
- Feng, Z.; Tan, H.; Fang, Y.; Lin, X.; Huang, W. Selective laser melting of TiB2/AlSi10Mg composite: Processability, microstructure and fracture behavior. J. Mater. Process. Technol. 2022, 299, 117386. [Google Scholar] [CrossRef]
- Radhakrishnan, R.M.; Ramamoorthi, V.; Srinivasan, R. Experimental investigation on powder processing and its flow properties of AlSi10Mg alloy with niobium carbide for additive manufacturing. Proc. Inst. Mech. Eng. Part. E J. Process Mech. Eng. 2022, 236, 1421–1429. [Google Scholar] [CrossRef]
- Tolosa, I.; Garciandía, F.; Zubiri, F.; Zapirain, F.; Esnaola, A. Study of mechanical properties of AISI 316 stainless steel processed by “selective laser melting”, following different manufacturing strategies. Int. J. Adv. Manuf. Technol. 2010, 51, 639–647. [Google Scholar] [CrossRef]
- Zinoviev, A.; Zinovieva, O.; Ploshikhin, V.; Romanova, V.; Balokhonov, R. Evolution of grain structure during laser additive manufacturing. Simulation by a cellular automata method. Mater. Des. 2016, 106, 321–329. [Google Scholar] [CrossRef]
- Huang, G.; He, G.; Peng, X.; He, Y.; Chen, H.; Huang, K.; Liu, Y. Effect of processing parameters on the microstructure, mechanical properties and thermal expansion behavior of Invar 36 alloy manufactured by laser powder bed fusion. Mater. Sci. Eng. A 2024, 897, 146329. [Google Scholar] [CrossRef]
- Cherry, J.A.; Davies, H.M.; Mehmood, S.; Lavery, N.P.; Brown, S.G.R.; Sienz, J. Investigation into the effect of process parameters on microstructural and physical properties of 316L stainless steel parts by selective laser melting. Int. J. Adv. Manuf. Technol. 2015, 76, 869–879. [Google Scholar] [CrossRef]
- Wang, F.Z.; Zhang, C.H.; Cui, X.; Zhou, F.Q.; Zhang, S.; Chen, H.T.; Chen, J. Effect of Energy Density on the Defects, Microstructure, and Mechanical Properties of Selective-Laser-Melted 24CrNiMo Low-Alloy Steel. J. Mater. Eng. Perform. 2022, 31, 3520–3534. [Google Scholar] [CrossRef]
- Sun, Q.; Du, D.; He, L.; Dong, A.; Zhang, C.; Sun, B. Laser powder bed fusion of a non-equiatomic FeNiCoAl-based high-entropy alloy: Printability, microstructure, and mechanical properties. J. Alloys Compd. 2023, 938, 168562. [Google Scholar] [CrossRef]
- Marchese, G.; Parizia, S.; Rashidi, M.; Saboori, A.; Manfredi, D.; Ugues, D.; Lombardi, M.; Hryha, E.; Biamino, S. The role of texturing and microstructure evolution on the tensile behavior of heat-treated Inconel 625 produced via laser powder bed fusion. Mater. Sci. Eng. A 2020, 769, 138500. [Google Scholar] [CrossRef]
Disclaimer/Publisher’s Note: The statements, opinions and data contained in all publications are solely those of the individual author(s) and contributor(s) and not of MDPI and/or the editor(s). MDPI and/or the editor(s) disclaim responsibility for any injury to people or property resulting from any ideas, methods, instructions or products referred to in the content. |
© 2025 by the authors. Licensee MDPI, Basel, Switzerland. This article is an open access article distributed under the terms and conditions of the Creative Commons Attribution (CC BY) license (https://creativecommons.org/licenses/by/4.0/).