Article

Numerical Investigation of Burden Distribution in Oxygen Blast Furnace Ironmaking

1
School of Metallurgical and Ecological Engineering, University of Science and Technology Beijing, Beijing 100083, China
2
School of Energy and Environment, Southeast University, Nanjing 210096, China
3
Center for Smart Process Engineering, Great Bay University, Dongguan 523808, China
*
Author to whom correspondence should be addressed.
Metals 2025, 15(9), 1048; https://doi.org/10.3390/met15091048
Submission received: 11 August 2025 / Revised: 15 September 2025 / Accepted: 17 September 2025 / Published: 19 September 2025
(This article belongs to the Special Issue Sustainable Ironmaking and Steelmaking: Challenges and Opportunities)

Abstract

The oxygen blast furnace (OBF) is a promising technology for ironmaking, and its burden distribution pattern plays a key role in optimizing performance. This study investigates the impact of the peripheral opening extent (POE), which reflects the coke distribution adjacent to the furnace wall, on OBF performance using a computational fluid dynamics (CFD) process model. A 380 m3 OBF is simulated, incorporating reducing gas injection through both the hearth tuyeres and shaft tuyeres. By analyzing the inner states, the global performance is evaluated. The results show that the optimal POE value is 20°, which minimizes the fuel rate, maximizes productivity, and achieves the highest top gas utilization factor. As POE increases, chemical reaction carbon consumption decreases. The combustion heat in front of the tuyeres initially decreases and then increases, leading to a corresponding decrease and subsequent increase in carbon consumption in the tuyeres. The combined effects of these factors cause the fuel rate to first decrease and then increase. Additionally, this study quantifies the relationship between shaft injection rate and burden distribution. It is found that shaft injection improves the furnace’s thermal state and enhances the reducing atmosphere, leading to a reduced fuel rate. Notably, the optimal POE value remains constant at 20°, regardless of the shaft injection rate, suggesting that POE selection is independent of the injection rate. Overall, appropriate peripheral openings contribute to improving OBF global performance. These findings should be helpful to the industrial OBF operation.

1. Introduction

The blast furnace (BF) is a key piece of metallurgical equipment, central to modern steel production. However, its operation largely depends on fossil fuels such as pulverized coal (PC) and coke. Together with associated equipment like coke ovens and pellet/sintering machines, the BF accounts for approximately 70% of energy consumption and 90% of carbon dioxide emissions in integrated steelworks [1,2,3,4]. Consequently, reducing the BF’s energy usage and carbon emissions has become a critical issue [5].
One promising solution is the oxygen blast furnace (OBF) [6,7]. Unlike conventional blast furnaces (BFs), the OBF utilizes oxygen-enriched blast instead of hot blast, significantly lowering carbon dioxide emissions, enhancing productivity, improving the reducing atmosphere, and reducing fuel consumption [8,9,10,11]. These advantages make the OBF a viable option for reducing emissions and improving efficiency. While challenges such as overheating in the lower BF and thermal shortages in the upper BF remain, these issues have been effectively addressed using techniques like hearth injection [12,13,14,15] and shaft injection [16,17], which have been validated in practical applications [17].
The overall performance of blast furnaces is influenced by multiple factors, such as injection rate, temperature, top pressure, etc., among which the influence of burden distribution is particularly significant. The burden distribution within a BF refers to the spatial arrangement of particles, affecting gas flow, heat transfer, mass transfer, momentum transfer, and the efficiency of chemical reactions [18], and plays a crucial role in the furnace’s performance. In modern BFs, the burden, consisting mainly of coke and iron ore, is typically arranged in alternating layers. Owing to its smaller particle size and higher density, iron ore resists upward gas flow more than coke. As a result, adjusting the burden distribution is a key method for optimizing gas flow and BF performance. This is especially important in OBFs, where shaft and hearth gas injection interact significantly with the solid phases to influence furnace performance [17]. Thus, a well-balanced burden distribution is essential for achieving optimal results. One strategy for optimization is to modify the radial ore-to-coke (O/C) ratio. However, the specific impact of different radial O/C profiles on OBF performance remains unclear. Further in-depth research is needed to support the industrial adoption of OBF.
Early research focused on analyzing burden distribution in the blast furnace through burden measurements and physical model experiments [19]. Various measurement techniques, such as burden probes [20,21] and radar [22,23], have been developed to capture data on the burden trajectory, filling points, and profile. Additionally, both full-scale [24] and reduced-scale [25,26] have been created to study blast furnace charging patterns. These experiments have significantly advanced the understanding of burden distribution. However, quantifying the impact of burden distribution on blast furnace performance remains challenging, particularly due to the extreme internal conditions during operation.
Mathematical models of blast furnace burden distribution [27,28,29] have provided valuable insights into burden behavior. Most of these models are based on the Discrete Element Method (DEM), which is widely used in areas such as burden distribution [30,31], the descent process [32], coke bed collapse [33], and the formation of mixed layers [34]. In recent years, this method has also been used to explore the specific impact of burden distribution on blast furnace performance [29,35,36]. However, DEM-based numerical simulations are computationally intensive, and many studies have not integrated thermochemical behavior in the blast furnace. Moreover, there is a lack of comprehensive research on how burden distribution affects overall performance.
The traditional computational fluid dynamics (CFD) method is widely used in industrial blast furnace simulations due to its computational efficiency, especially when analyzing the internal state and overall performance of the furnace [37,38,39,40]. Multi-fluid CFD models are commonly applied to study the impact of burden distribution on blast furnace (BF) performance. For instance, a burden distribution optimization technique was presented by Li et al. [41] after they investigated the impact of the burden distribution pattern on BF and concluded that it was beneficial. To investigate the behavior of furnaces using high-moisture burden materials, Zhao et al. [42] developed a transient BF model based on CFD methods to assess the effects. Li et al. [43] also studied the impact of burden in peripheral openings and the interaction between hydrogen injection rates and burden distribution in hydrogen blast furnaces. In recent years, CFD methods have been applied to OBF research. For instance, Nie et al. [44] explored the transition from a traditional BF to an OBF, while Li et al. [45] examined the effects of hot charge and reformed coke oven gas (RCOG) injection on OBF performance. Zhang et al. [46] investigated the impact of shaft tuyere locations, recycling gas temperatures, and the gas distribution ratio on the iron ore reduction process. In addition, Jiao et al. [17] analyzed the effects of hearth gas injection and the combined injection of hearth and shaft gases on OBF performance, showing that injecting reducing gases through the hearth tuyere can address two key issues of the OBF (namely, overheating in the lower part and thermal shortages in the upper part) and significantly reduce fuel consumption. Even though these studies have expanded our understanding of OBFs, limited research has explored the combined effects of burden distribution and OBF performance. Therefore, further investigation into the relationship between burden distribution and OBF is crucial.
This paper uses a validated three-dimensional CFD model [17,47] to study the impact of different burden distribution patterns on OBF performance under varying shaft injection (SI) rates. The focus is on analyzing how different charge distribution patterns, specifically changes in peripheral opening extent (POE), influence OBF performance. POE refers to the quantity of coke near the furnace wall, which significantly affects gas flow distribution and the internal reaction process. This study highlights the relationship between burden distribution and overall furnace performance, providing essential theoretical insights for optimizing OBF operation.

2. Model Description

2.1. Model Framework

For the purpose of this investigation, the three-dimensional multi-fluid BF process model proposed by Jiao et al. [48] is used. Utilizing the CFD method, it computes the distance between the slag surface at the hearth and the stockline at the throat. It treats the gas, solid, and liquid phases as inter-penetrating continua, with each phase containing components that have distinct physical properties and compositions. The conservation equations for mass, momentum, enthalpy, and species are applied to model these phases. A summary of the specific governing equations, interphase interaction forces, and transport coefficients is provided by Table 1 and Table 2. The key chemical reactions are listed in Table 3. Figure 1 illustrates the detailed calculation framework of the model.

2.2. Prediction of Productivity

The productivity can be predicted by the current model. In routine operations, the burden charging process is dynamically adjusted based on real-time stockline variations caused by coke and iron ore consumption. This control mechanism ensures stable productivity during steady production periods. The model simulates this process by calculating productivity under specified conditions, adjusting the burden charging rate iteratively, as shown in Figure 1a.
Coke consumption in a BF occurs through several pathways: chemical reactions, combustion in the raceways, and carburization in the hot metal. Under constant blast/injection conditions, coke consumption resulting from combustion is stable, as is the carburization per ton of hot metal. Nevertheless, coke consumption via chemical reactions varies with internal furnace conditions. The burden charging rate or solid inlet velocity is modified to accommodate these variations. This adjustment is made by maintaining coke balance within the BF through iterative calculations, as shown in Figure 1a. The equation for coke balance is Coke charged (A) = coke consumption from chemical reactions (B + C + D + E) + coke consumption from combustion (F) + coke consumption from carburization (G).
The converged findings are used to determine total coke consumption (=B + C + D + E + F + G) in each iteration utilizing reaction kinetics throughout the computational domain. This total consumption determines the coke charged (A) and the ore quantities for the next iteration. The iteration continues until the condition A = B + C + D + E + F + G is met within a predefined tolerance (0.1 kg/tHM in this study). When predicting productivity, the fuel rate remains fixed. The iterative coke balance process links reacted carbon (B + C + D + E + G), combusted carbon (F), and input carbon (A), ensuring carbon balance in the furnace. Upon convergence, the final productivity is determined.

2.3. Prediction of Fuel Rate

The current model can also predict fuel rate. In this study, 1813 K is set as the minimum acceptable hot metal (HM) temperature for stable furnace operation. The corresponding fuel rate represents the minimum operational requirement under specific blast/injection parameters, forming the outermost iterative loop in the computational framework (see Figure 1b). In addition, it is important to note that the model calculates the HM temperature at the slag surface, which is typically about 50 K higher than the taphole measurements due to thermal losses during tapping.
The existing three-dimensional BF process model exhibits numerous similarities to models created by other investigators [52,55,56,57]. However, it is unique in its integration with ongoing efforts to consider three-dimensional layered burden structure, three-dimensional layered cohesive zone (CZ), three-dimensional deadman profile prediction, three-dimensional trickling liquid flow, particle size degradation, productivity prediction, and fuel rate prediction. For the sake of conciseness, these aspects are not covered in depth here, and a comprehensive model explanation may be found elsewhere [47].

2.4. Layered Burden Structure

A layered burden distribution structure is considered in the current model. Typically, it is related to many factors, especially the ore batch weight and the ore-coke ratio distribution. This layered structure is maintained up to the cohesive zone, where liquid iron and coke coexist beneath it. Different particle sizes are set for different layers, for instance, the coke diameter is set to 0.04210 m, while the ore diameter is set to 0.01552 m in this study (see Table 4). This results in different permeability between different layers.
The layered burden structure significantly enhances the performance of the blast furnace by optimizing the arrangement and distribution of the burden. It improves the gas permeability of the burden and ensures uniform gas flow. However, for the sake of brevity, the layered structure is not directly presented in this article, and more detailed information can be found in our previous study [58].

2.5. Particle Size Degradation

The present BF process model also considers the variations in the physical properties of the burden particles throughout their descent. For example, the degradation of particles inside the furnace can alter the bed permeability and the associated upward gas flow, thereby changing the contact between the reducing gas and the iron-bearing materials, further affecting the performance of the blast furnace. In our previous study [59], we constructed the sinter reduction degradation sub-model and the coke gasification sub-model, introducing the reduction degradation index (RDI) to describe the degree of sinter size reduction caused by changes in particle structure. In this study, RDI remains unchanged for all cases. For brevity, the particle size degradation sub-models are not described here.

3. Simulation and Boundary Conditions

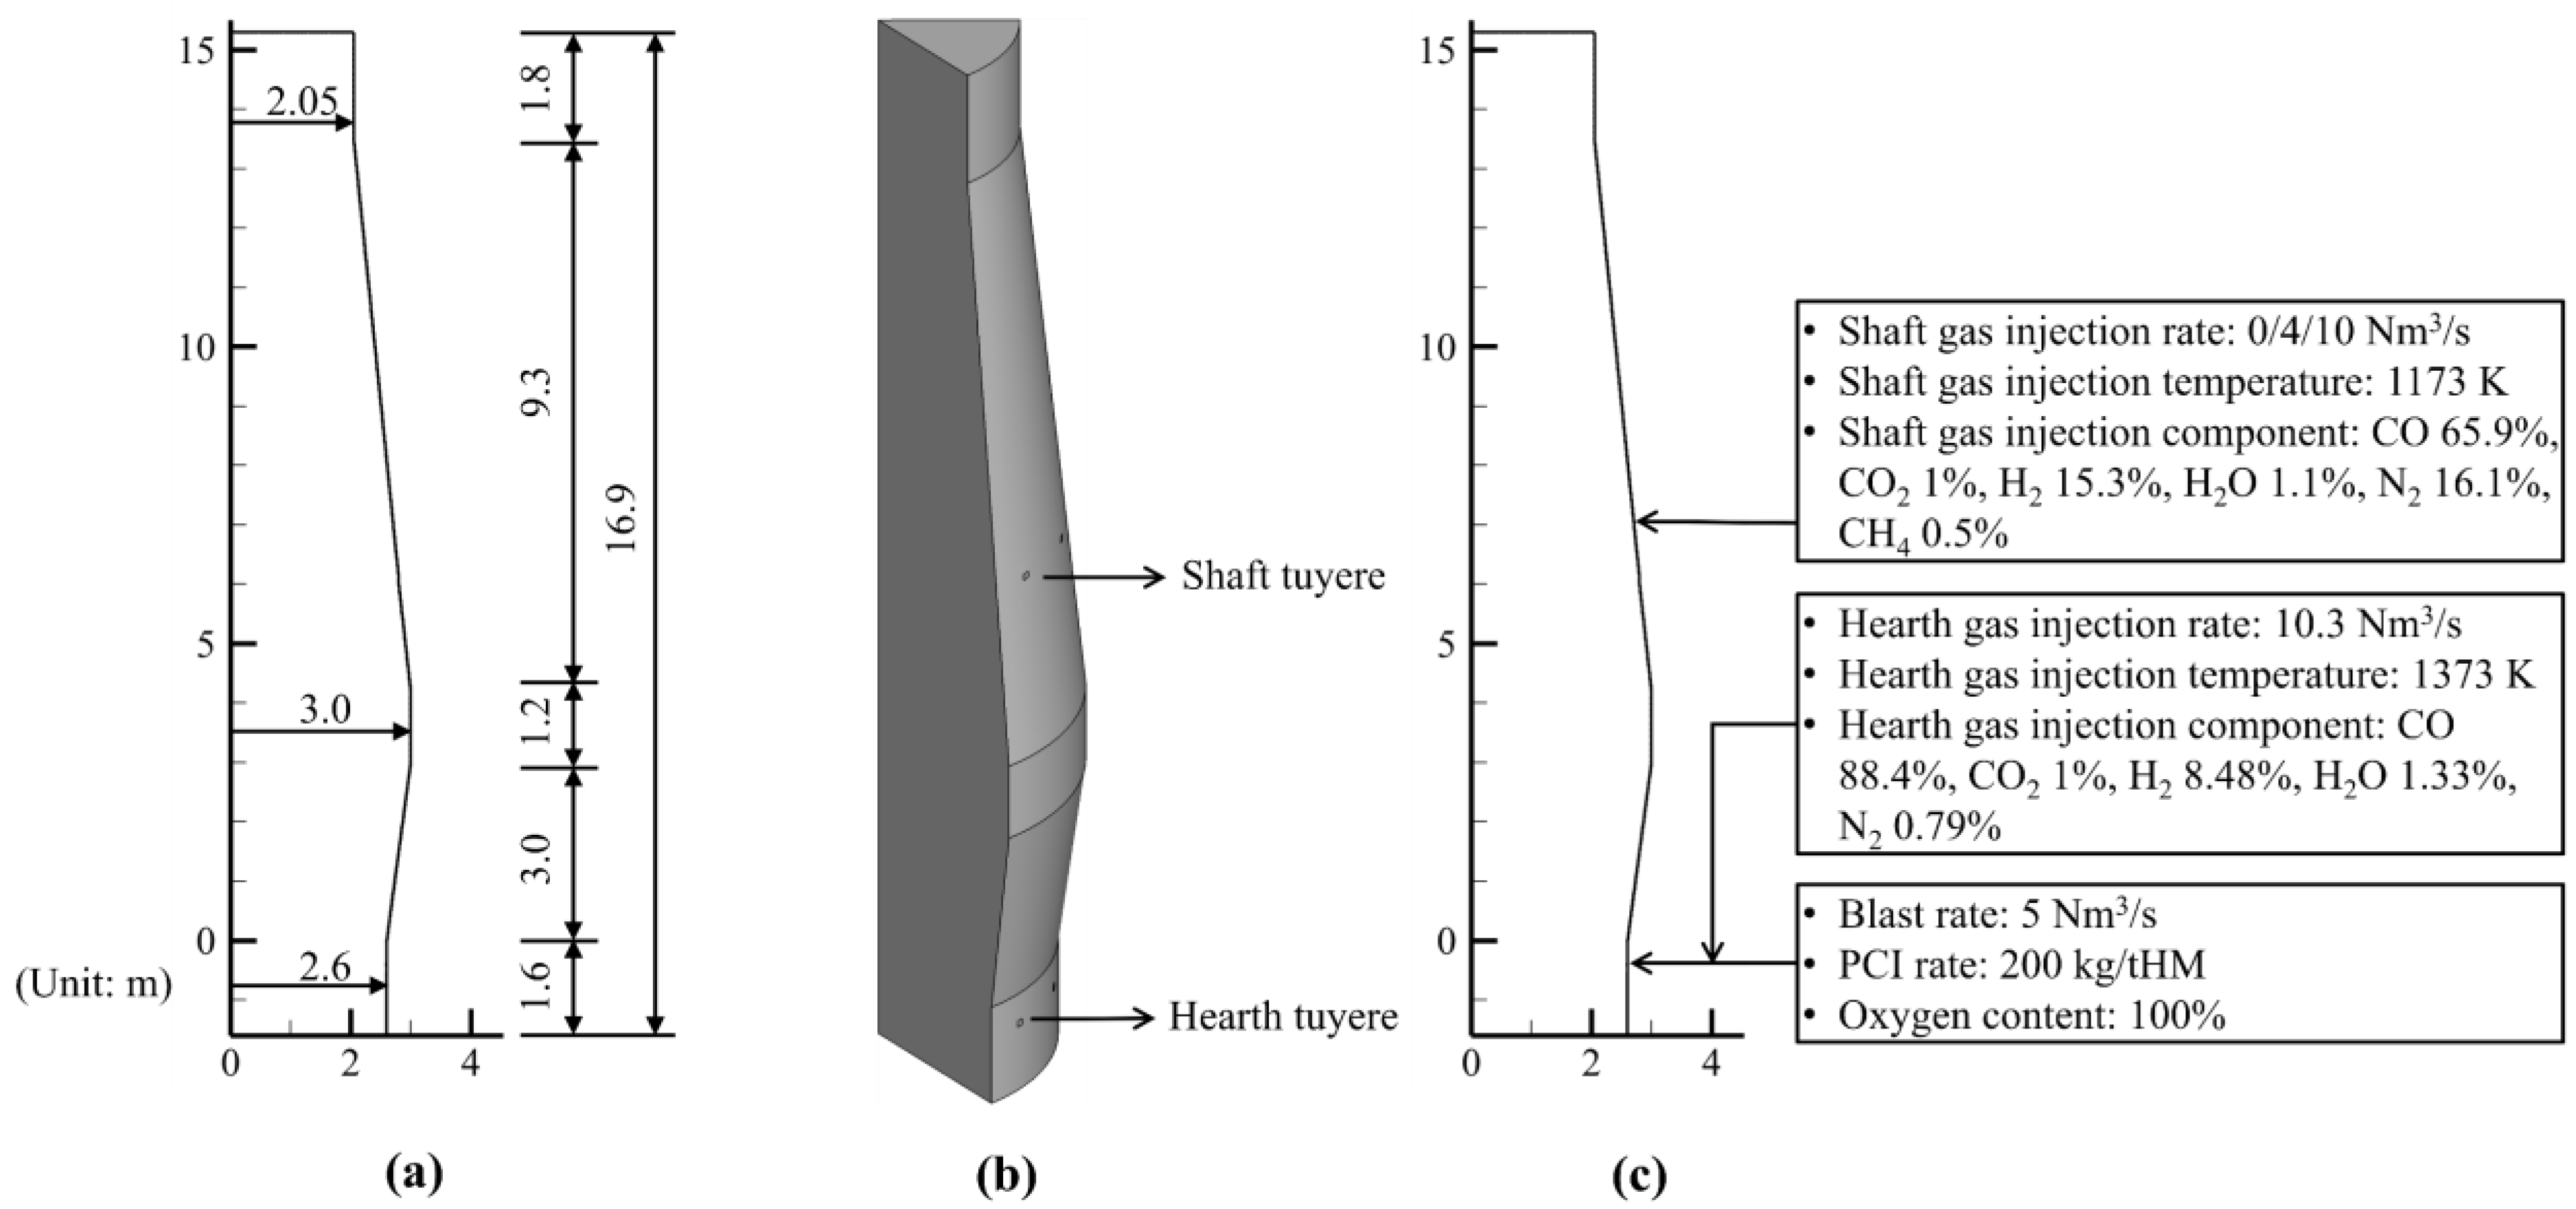
Figure 2 shows the geometric dimensions of the simulated OBF (see Figure 2a), the computational domain (see Figure 2b), and the injection conditions of the furnace (see Figure 2c). The volume of the OBF is 380 m3, with a 5.2 m diameter of hearth and a 16.9 m height from stockline to the slag surface. The furnace is equipped with 14 hearth tuyeres and 14 shaft tuyeres. The computational domain represents 1/7 of the entire OBF, including two hearth tuyeres and two shaft tuyeres, with the vertical cross-section set as a symmetric boundary. This configuration ensures good grid quality and high computational efficiency.
The fundamental operational conditions of the simulated OBF in this study are summarized in Table 4 (note, % refers to volume percentages). A mixture of pure oxygen at 25 °C (298 K), 200 kg/tHM of pulverized coal, and hot reducing gas is injected into the OBF by the hearth tuyeres. Moreover, the oxygen flow rate remains constant (5 Nm3/s) in all simulation cases. Shaft injection rates of 0 Nm3/s, 4 Nm3/s, and 10 Nm3/s are examined in this study. The batch weight of iron ore is 11.1 t, and the HM temperature is 1813 K; both of them remain constant. Additional details on injection composition, temperature, and conditions is provided in Figure 2c.
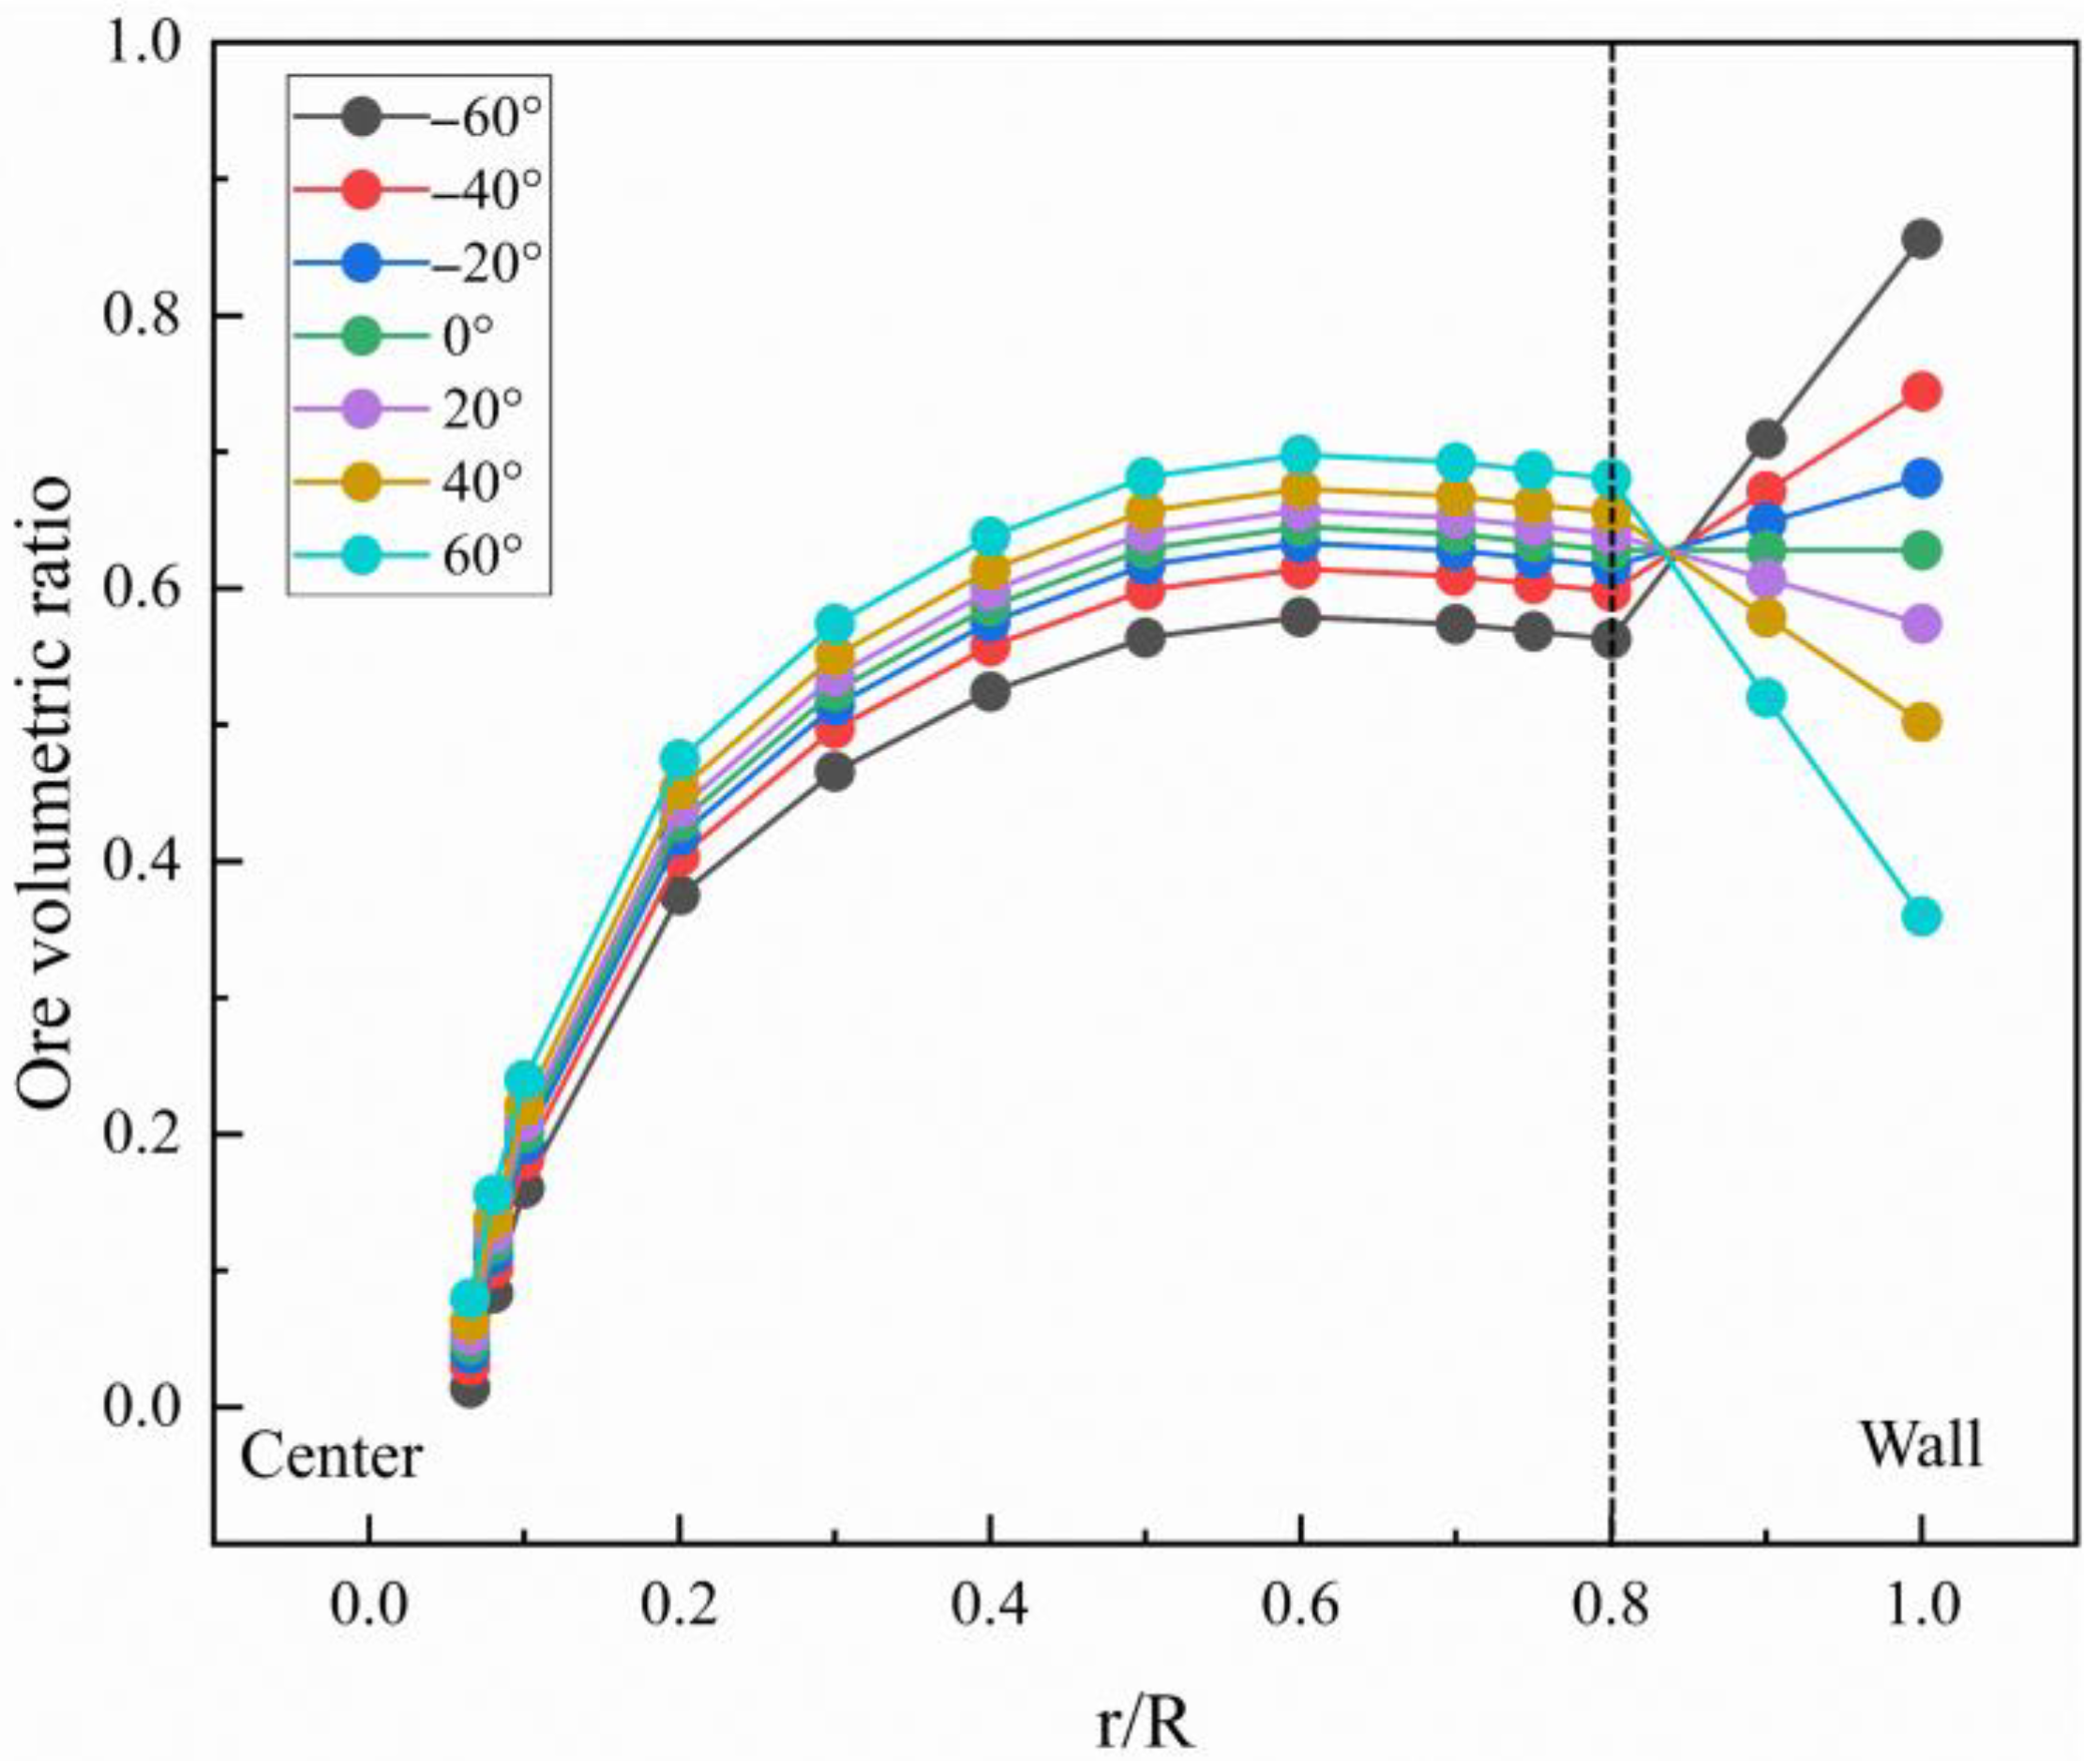
Figure 3 shows the radial distribution of the O/C ratio, quantified by the ore volumetric ratio (Vore/(Vore + Vcoke)). The three predominant methods of burden distribution are central opening, uniform distribution, and peripheral opening. “Opening” refers to an area with a high coke volumetric ratio, which facilitates gas flow. On the basis of central opening, this study integrated with multiple peripheral opening operations, characterized by distinct POE values. Specifically, the quantity of coke adjacent to the furnace wall within a 20% radius exhibits variation, resulting in different O/C ratios. POE refers to the angle formed between the O/C ratio curve and the horizontal axis, ranging from −90° to 90°. A larger POE indicates a higher coke concentration in the peripheral area, causing the ore layers at other radial positions to become thicker.

4. Results and Discussion

4.1. Model Applicability

The applicability of the current model has been validated under various conditions through experimental and industrial blast furnaces. For example, the 9 m3 LKAB experimental BF shows a strong correlation between predicted and measured performance indicators [47], with effective prediction of inner state, such as ore reduction degree distribution and internal gas temperature. Moreover, the 5000 m3 industrial BF exhibits favorable projected global performance indicators [47]. Additionally, the model’s predictive performance has been validated using operational data from a 380 m3 industrial OBF, which utilizes both pure oxygen and hearth gas injection. Comparing the model’s predicted results with industrial measurement data yielded satisfactory validation, further confirming its reliability and applicability in practical settings [17].

4.2. Effect of POE on BF Global Performance

Figure 4 illustrates the effects of the POE and shaft injection rate on the global performance indicators of the OBF, including fuel rate, productivity, top gas temperature, and top gas utilization factor. Figure 4a shows the relationship between fuel rate and POE, as well as the shaft injection rate. In this study, the fuel rate is defined as the aggregate coke rate and the pulverized coal injection (PCI) rate, with the PCI rate held constant. As a result, the trends of the fuel rate and coke rate are aligned. It is observed that as POE elevates from −60° to 60°, the fuel rate initially decreases and subsequently increases, attaining its minimum value at POE = 20°. This suggests that an optimal peripheral opening is beneficial for reducing the fuel rate in the OBF. Moreover, increasing the shaft injection rate significantly reduces the fuel rate.
Figure 4b presents the trend of productivity with respect to POE. As POE increases, productivity initially rises and then decreases, with the maximum productivity occurring at POE = 20°. This trend contrasts with that of the fuel rate. Additionally, increasing the shaft injection rate leads to a further improvement in productivity. Figure 4c shows the relationship between POE and top gas temperature. When POE is less than 20°, the top gas temperature decreases as POE increases. However, when POE exceeds 20°, the top gas temperature increases slightly. The lowest top gas temperature occurs at POE = 20°. Additionally, an increase in the shaft injection rate leads to a higher top gas temperature, as the larger injection rate introduces more heat into the system. Figure 4d displays the variation in the top gas utilization factor with POE. As POE increases, the top gas utilization factor initially rises and subsequently declines, reaching its peak value at POE = 20°, which contrasts with the coke rate (see Figure 4a).
Based on the above analysis, the optimal peripheral opening of the OBF can be determined, which is POE = 20°. At this value, the blast furnace achieves the lowest fuel rate, the highest productivity, the lowest top gas temperature, and the highest top gas utilization factor. Moreover, shaft injection has been shown to effectively lower fuel rate consumption while enhancing productivity. However, regardless of the shaft injection rate, the trend of POE’s impact on the OBF performance indicators remains the same, indicating that the injection rate does not alter the effect of POE on the global performance indicators.

4.3. Effect of POE on BF Inner States

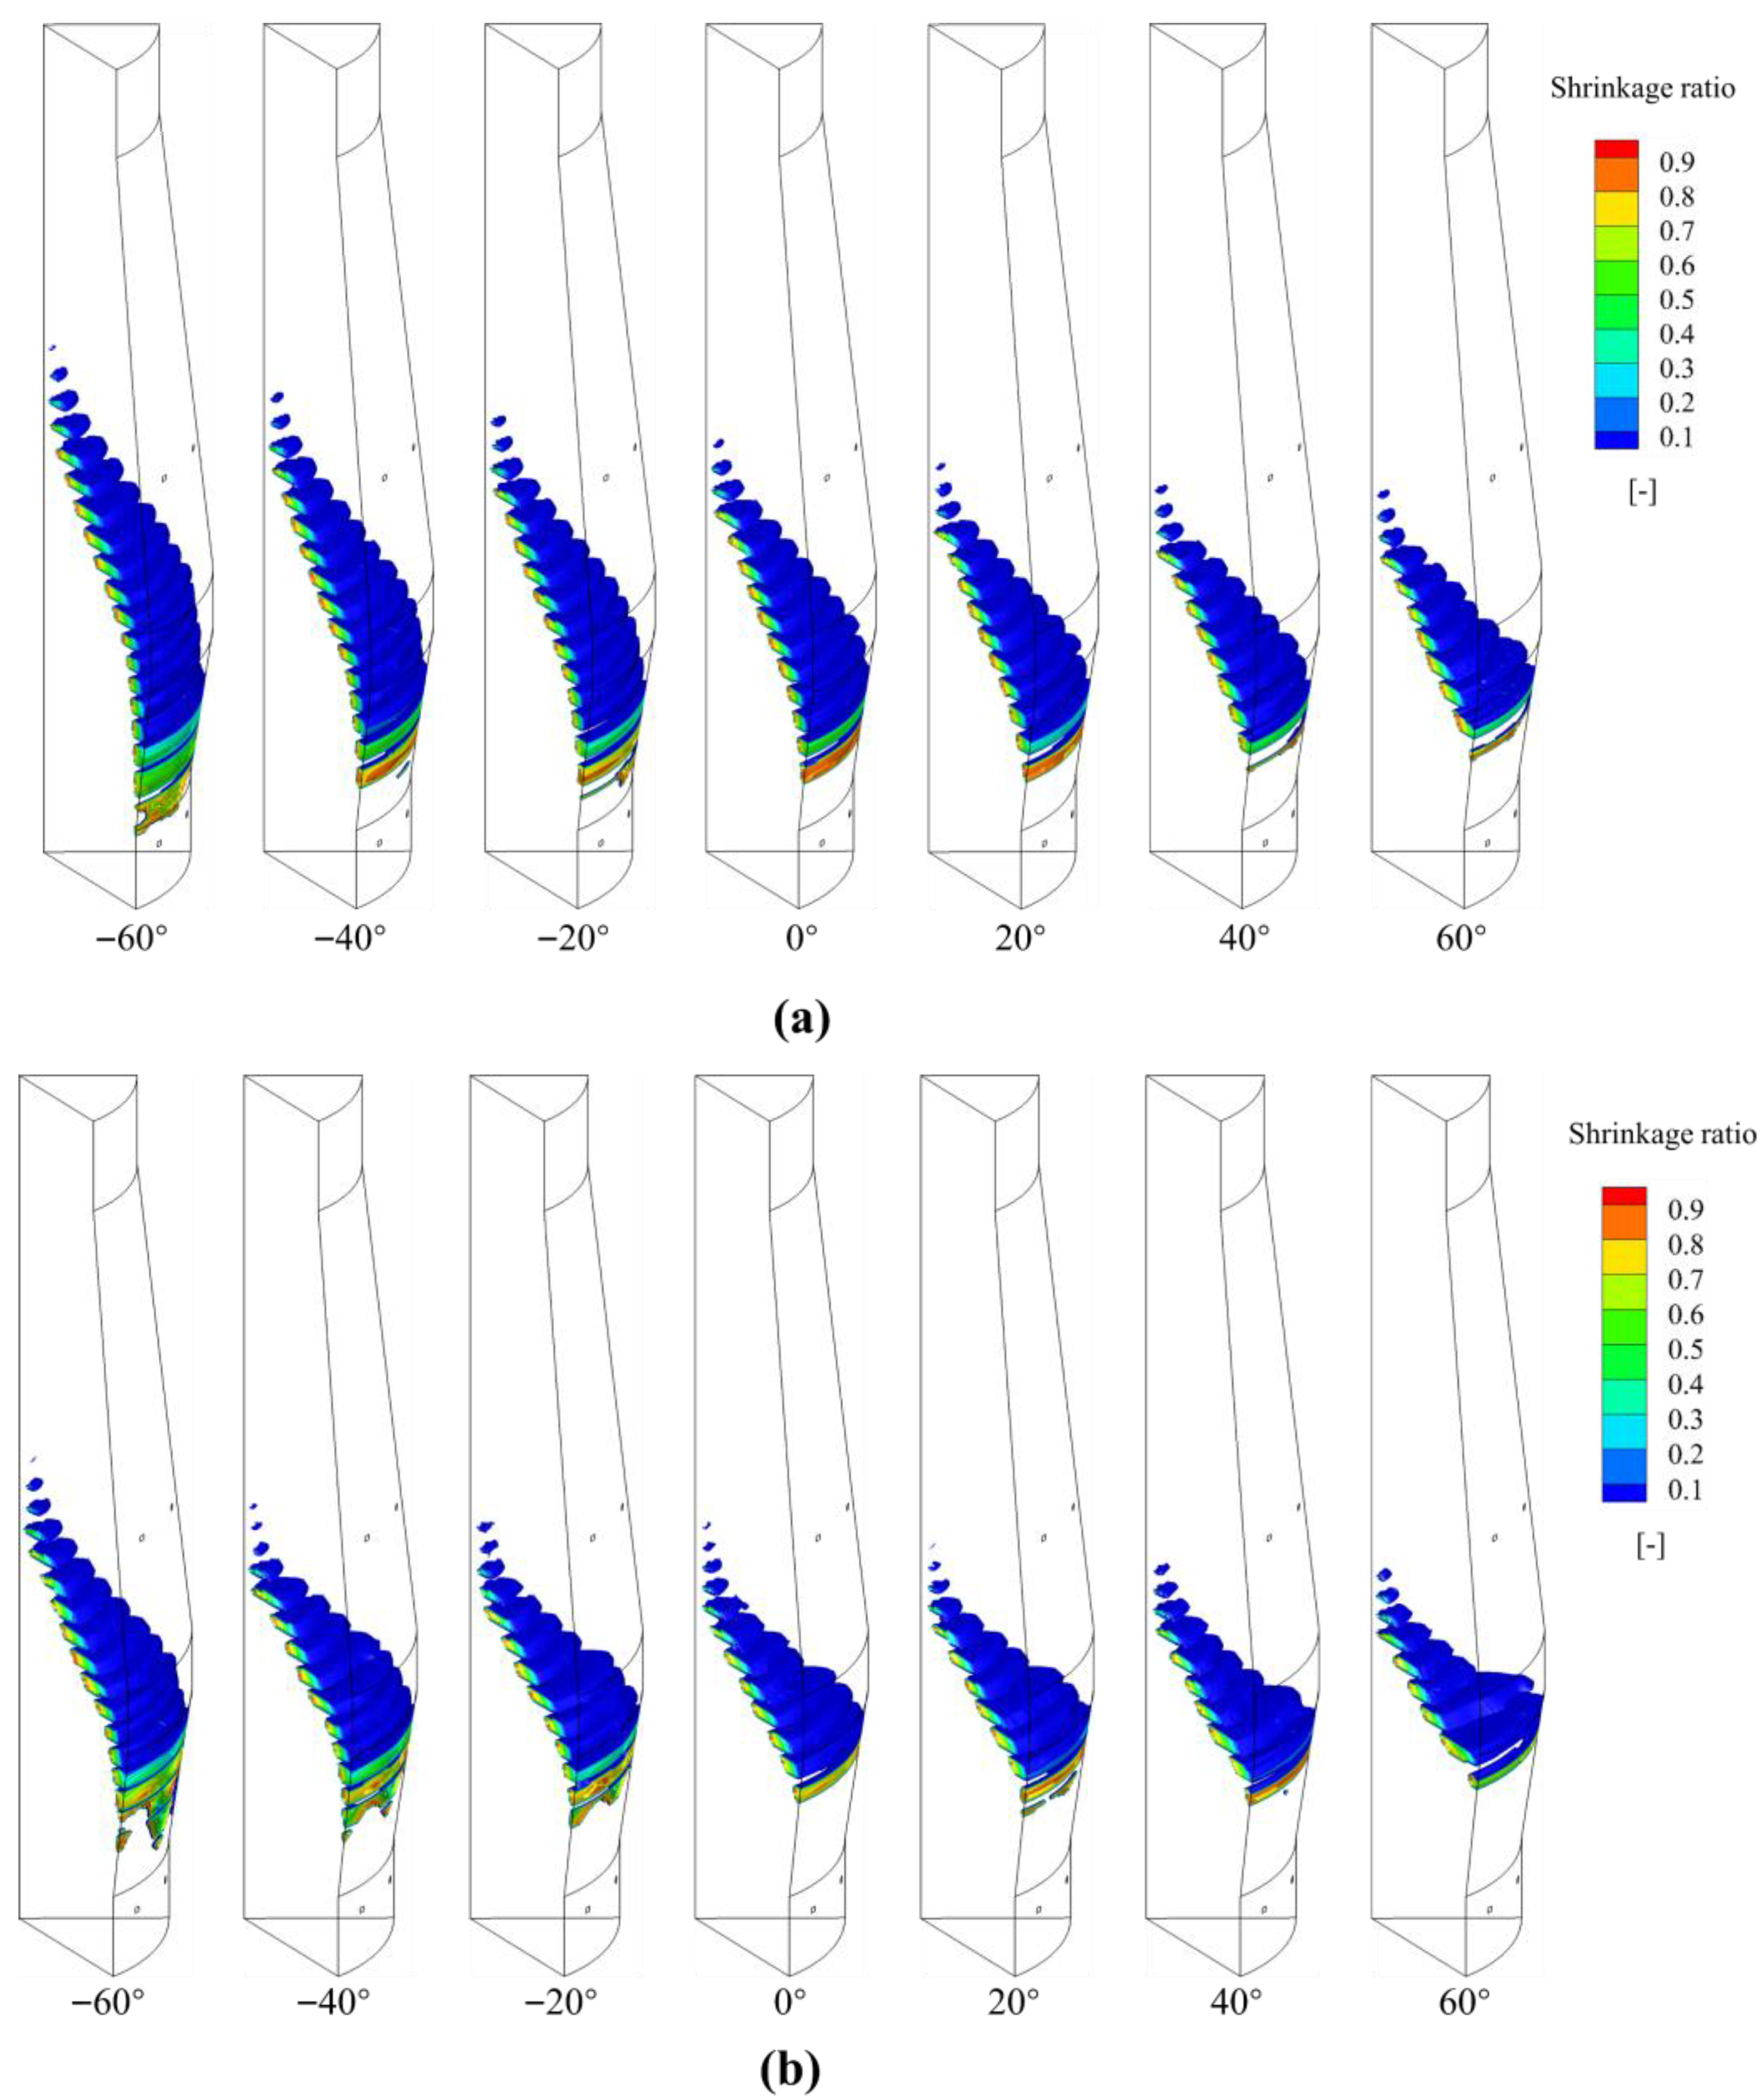
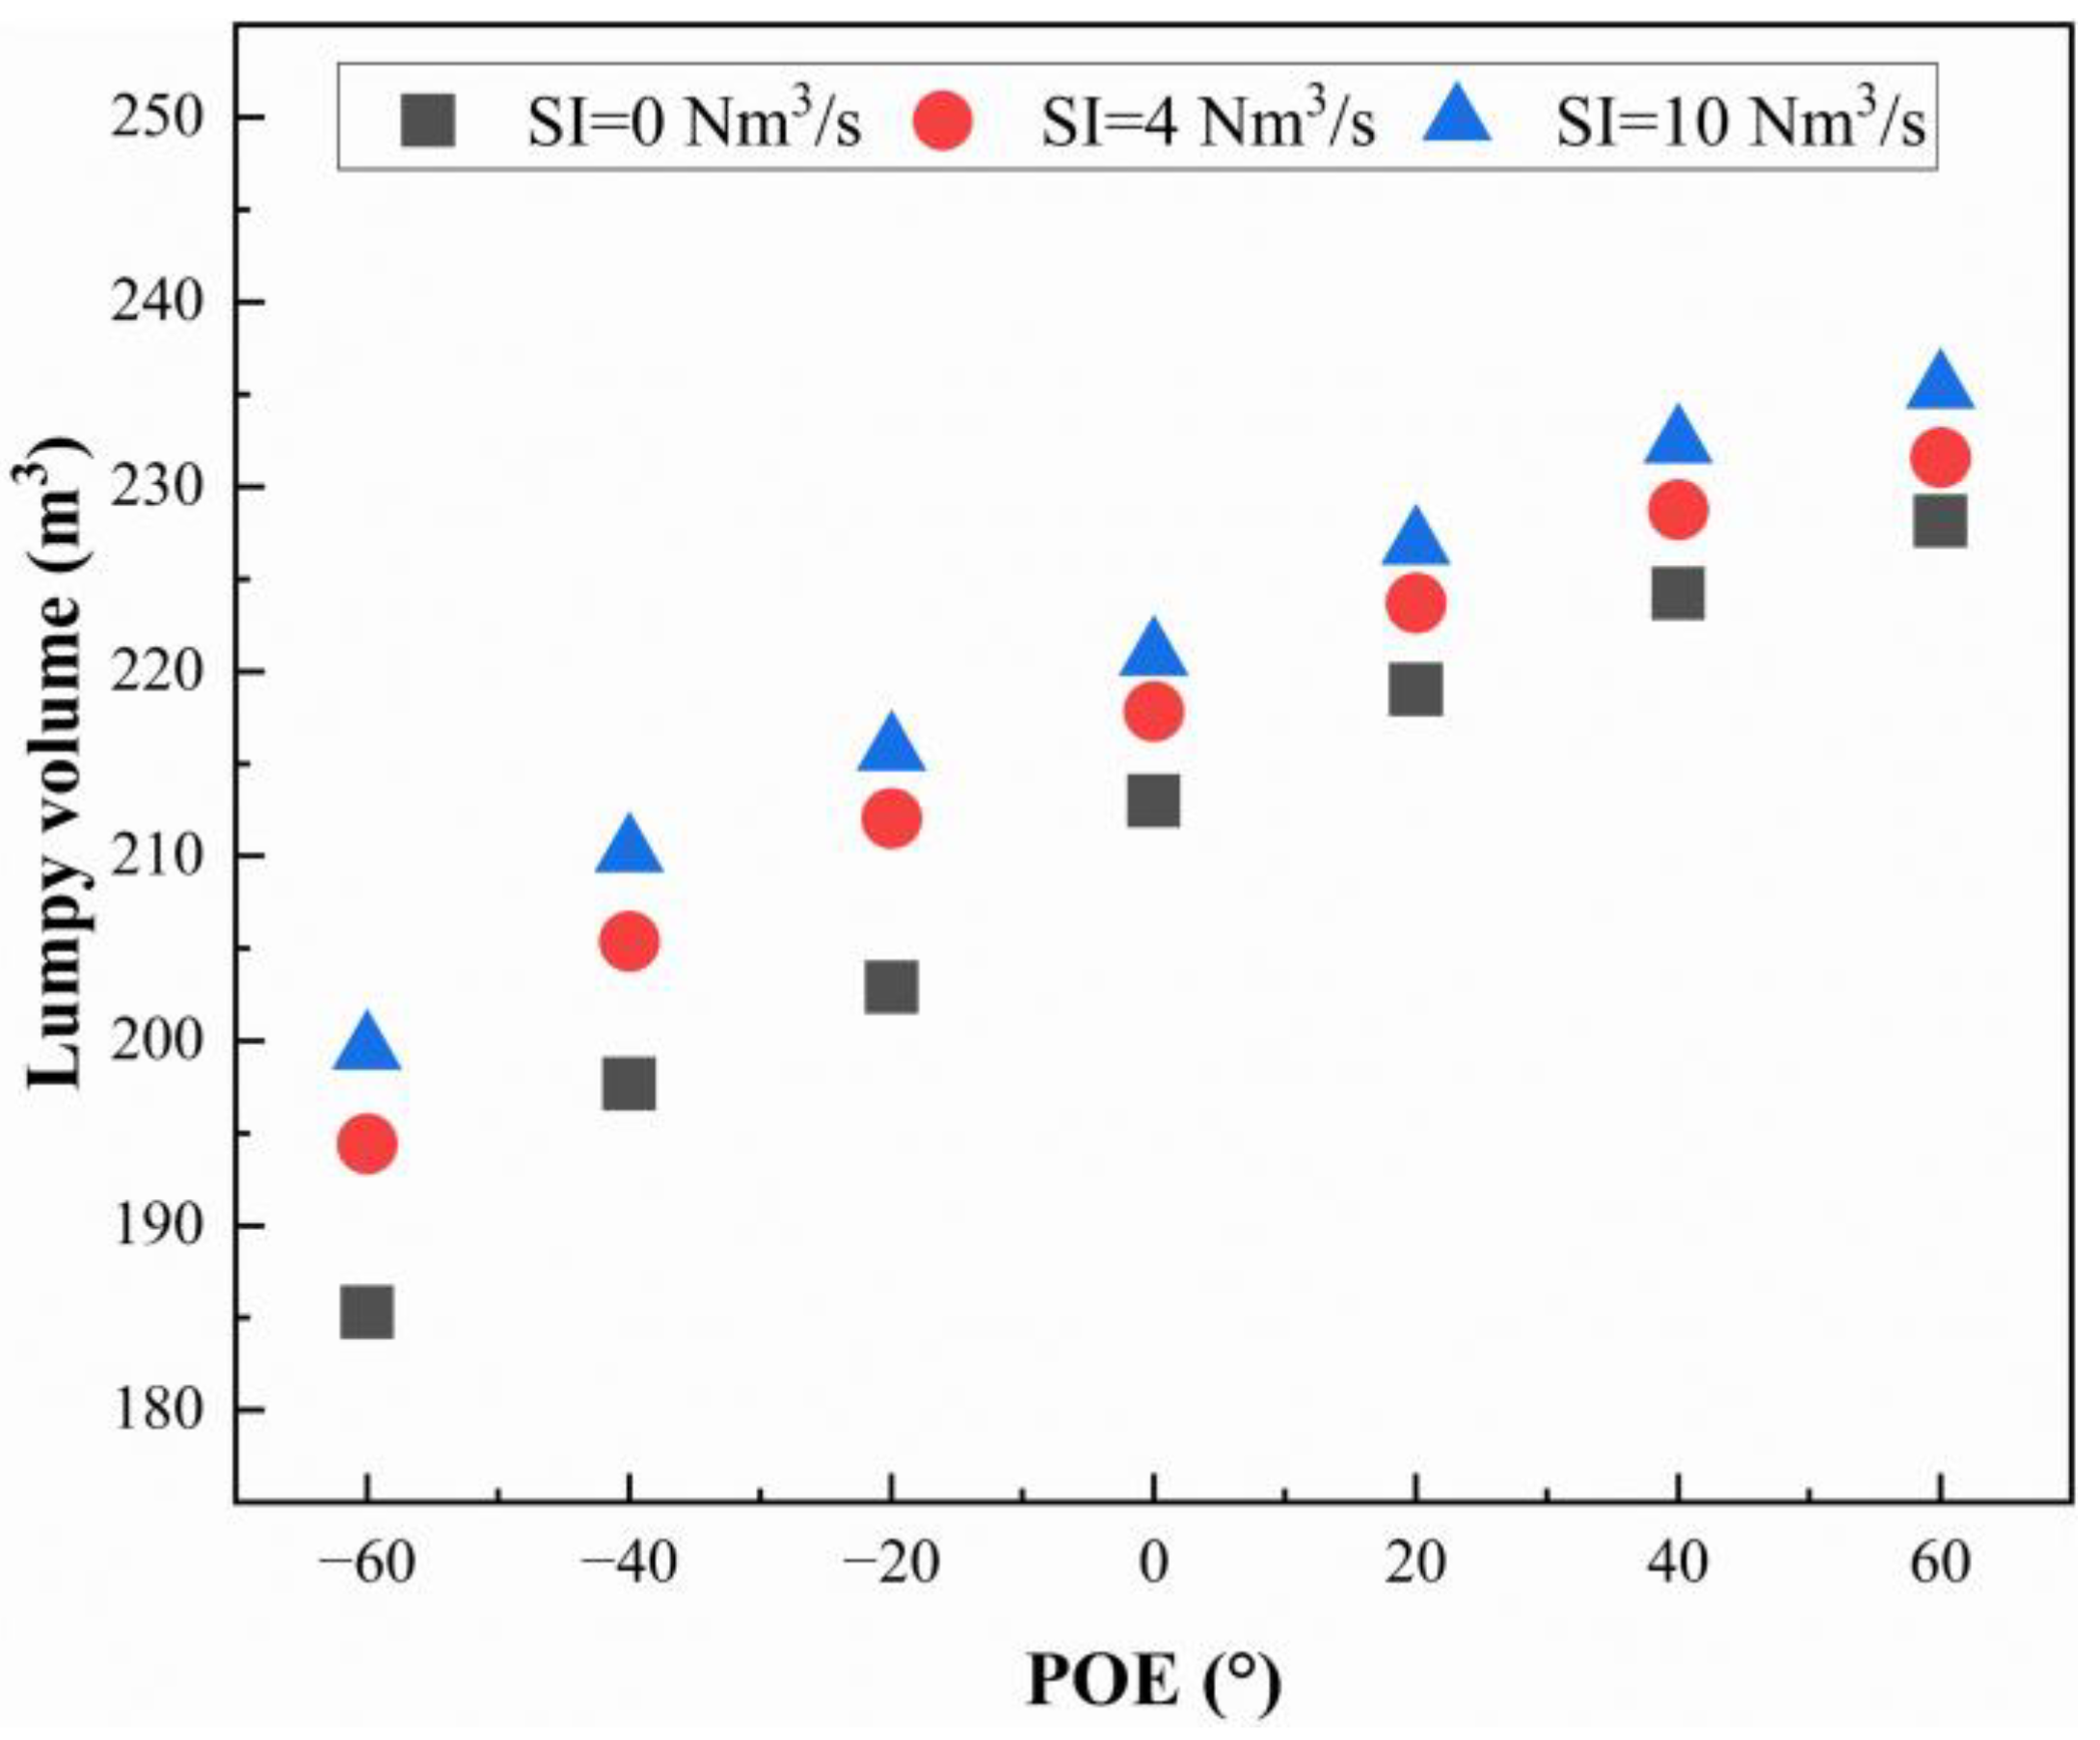
The CFD blast furnace process model provides valuable insights into internal states, such as the CZ and solid temperature, as illustrated in the following. Figure 5 compares the impact of POE on CZ across various shaft injection rates. Please note that, for brevity, the data related to a shaft injection rate of 4 Nm3/s are not listed here. Figure 5a illustrates that as POE increases, the head of the CZ gradually lowers while the root gradually rises, resulting in a decrease in its overall slope and a shortening of its total length. Fundamentally, the variation in CZ with POE is controlled by the gas flow development associated with different burden distribution patterns. As the POE increases, the iron ore adjacent to the furnace wall (r/R = 0.8 ~ 1.0) is removed and rearranged in the remaining radial positions. Thus, the gas flow is more pronounced in the peripheral region, while the gas flow in the central region weakens. As the injection rate increases, CZ also exhibits similar changes (see Figure 5b), with the head lowering and the root rising, but the overall change is not significant. Compared to the injection rate, the impact of POE on CZ is more significant. Furthermore, the shaft gas injection rate does not alter the trend of POE’s impact on CZ. In addition, the shortened CZ increases the volume of the lumpy zone (see Figure 6). The volume of the lumpy zone directly affects the indirect reduction region, which has a significant impact on the indirect reduction of iron ore. This will be analyzed in further detail below.
Figure 7 illustrates the effect of POE on the solid temperature distribution within the furnace. As POE increases, the temperature in the peripheral region rises, while the temperature in the central region decreases. The increase in peripheral temperature is attributed to the higher proportion of coke in the peripheral region, which enhances gas flow along the furnace wall peripheral region. Conversely, the reduction in central gas flow leads to a decrease in temperature in the central region of the furnace. Additionally, the overall temperature variation pattern in the upper part of the furnace is influenced by the productivity. As POE exceeds 20° (see Figure 4c), the temperature in the upper part of the BF slightly increases. With an increase in the shaft injection rate, the injected gas introduces more heat into the furnace, significantly raising the temperature, particularly in the upper section. This highlights that shaft injection plays a crucial role in improving the thermal state of the upper part of the OBF [17].
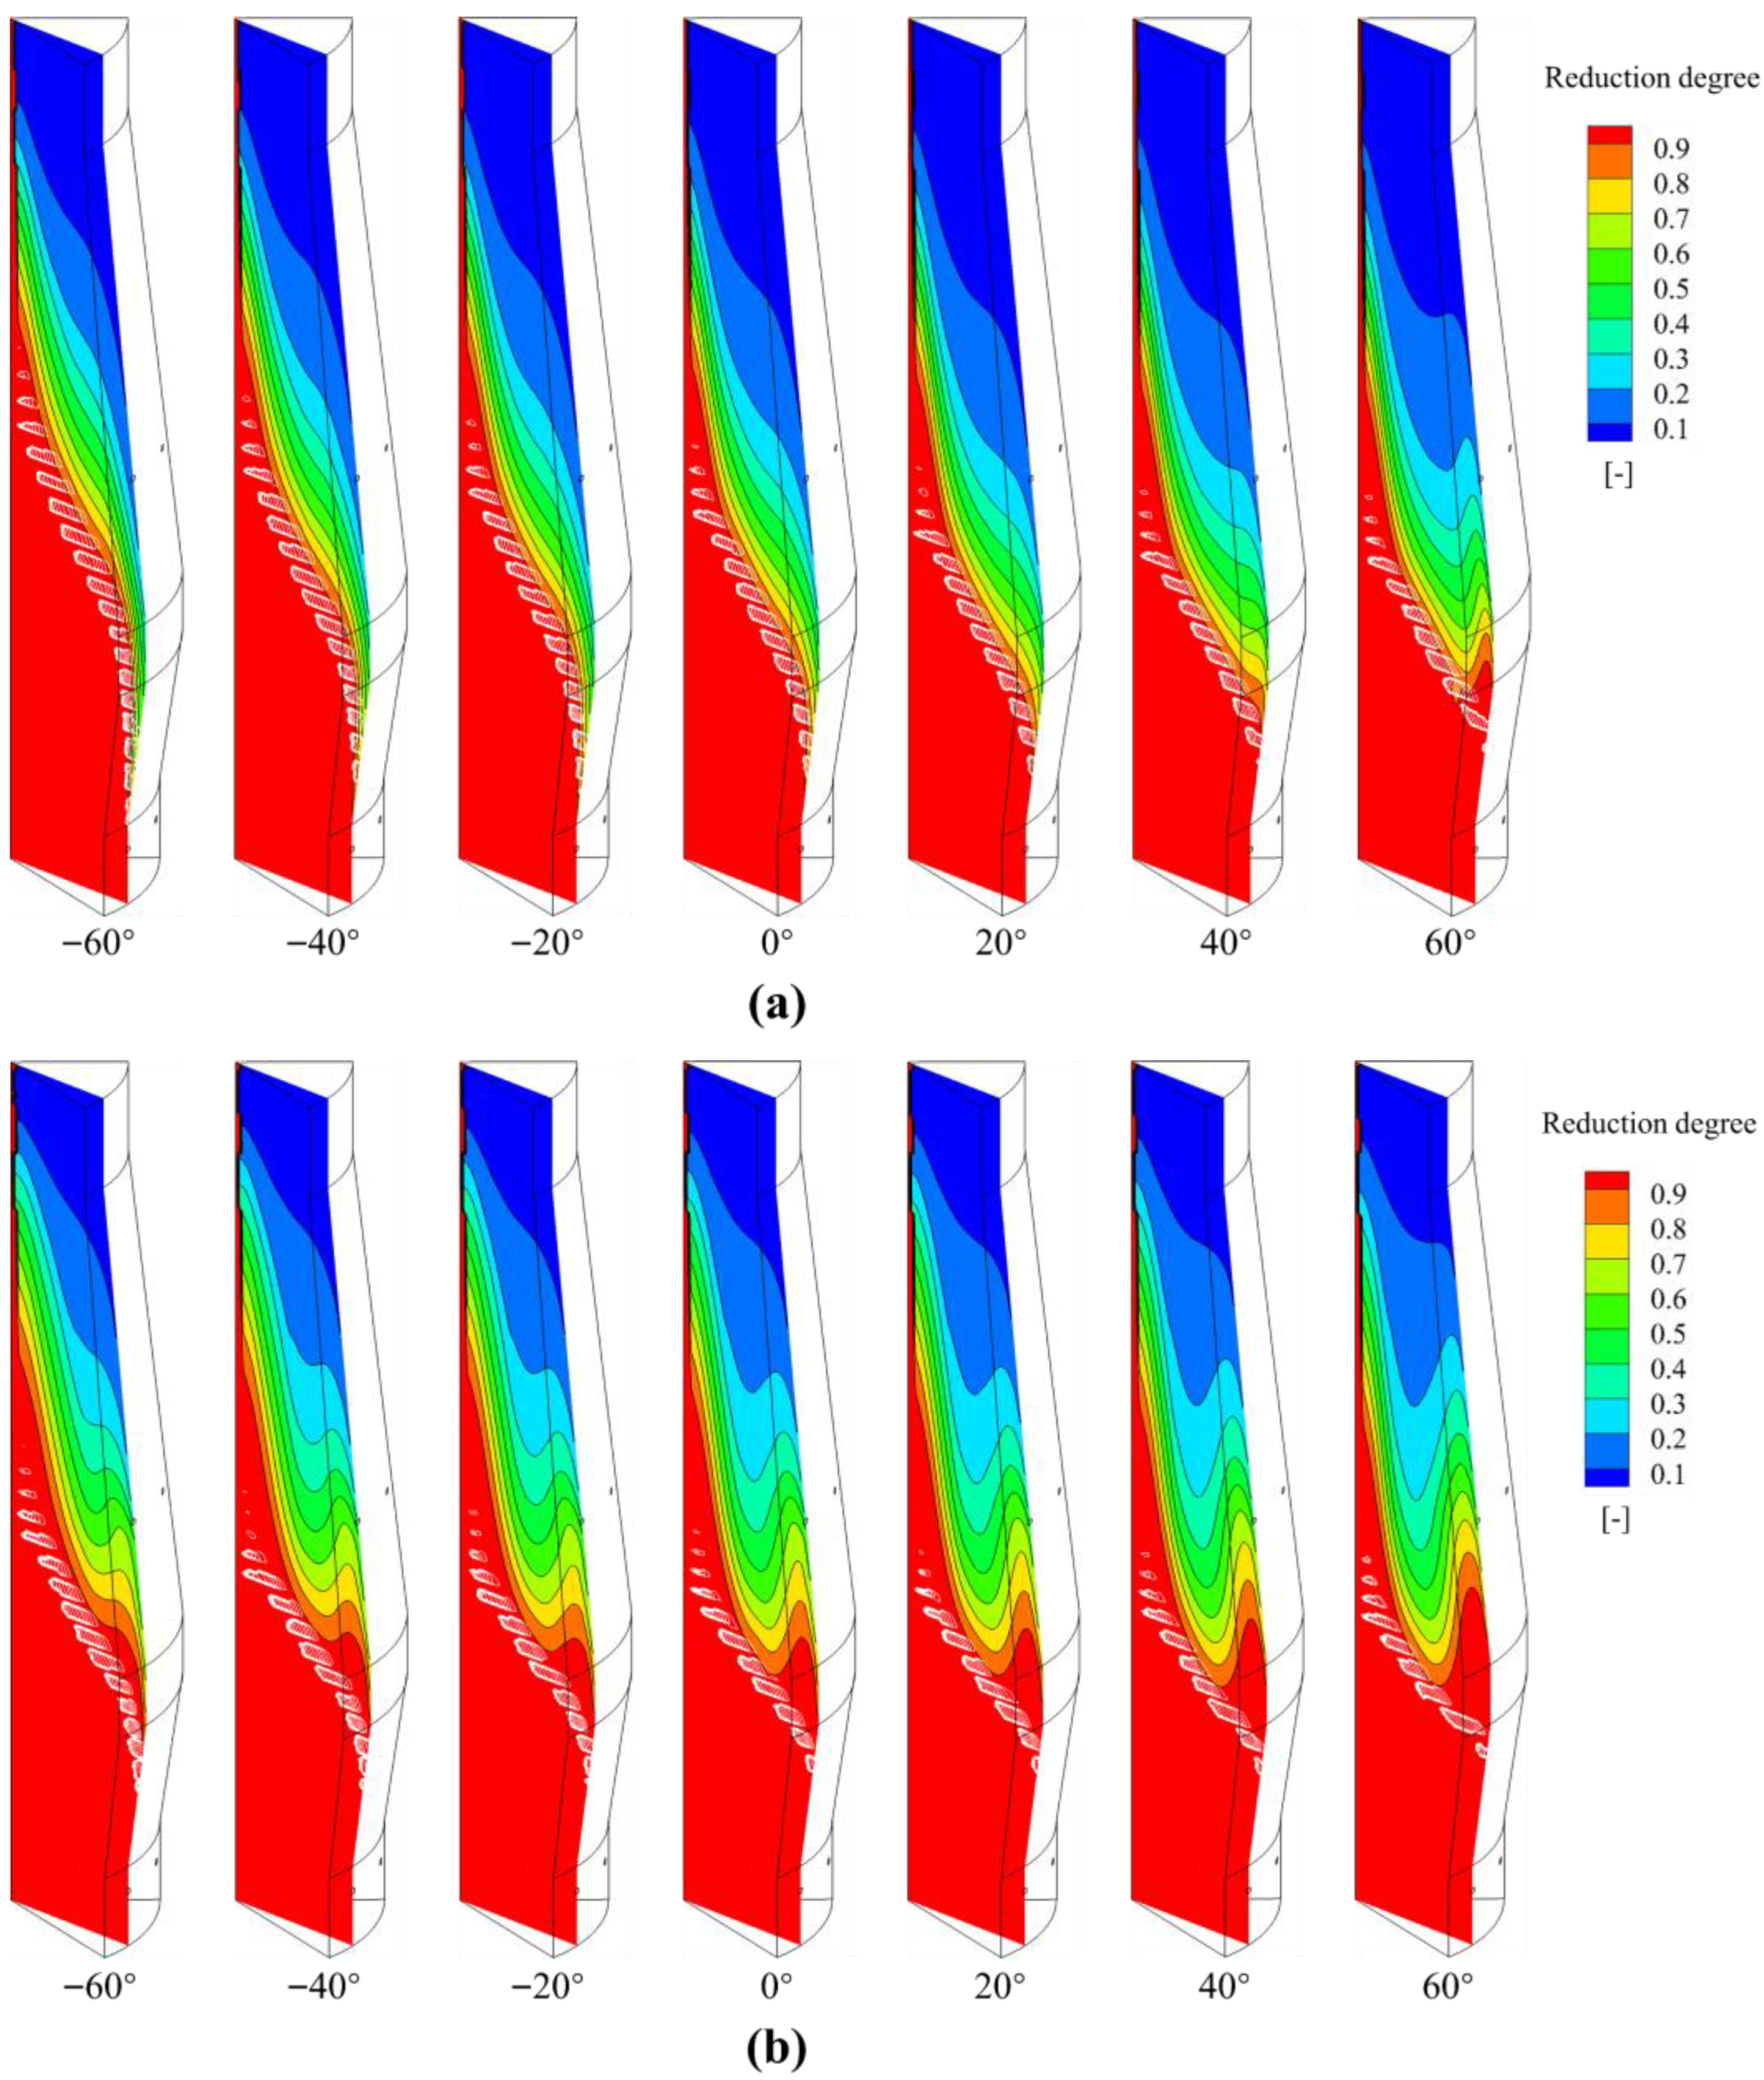
Figure 8 illustrates the trend of ore reduction degree with POE under different shaft injection rates. As POE increases, the temperature at the furnace wall peripheral region (see Figure 7) rises, resulting in an increase in the ore reduction degree near the furnace wall. This effect becomes more pronounced at higher POE values. Conversely, the low reduction degree area in the central region of the blast furnace slightly expands, which is attributed to the decrease in temperature in this area (see Figure 7). As the injection rate increases, the ore reduction degree also significantly improves. This is due to the additional heat introduced by the higher injection rate, which enhances the thermal conditions within the furnace and improves ore reduction.
Unlike physical experiments, numerical simulations offer comprehensive insights into the inner state of the BF, encompassing carbon consumption analysis and heat balance analysis, thereby elucidating variations in the furnace’s performance indicators. Figure 9 compares the impact of POE on the carbon consumption in the OBF at different injection rates. The carbon consumption in the blast furnace comprises three main components: combustion carbon, reaction carbon, and carburization. In this study, a constant level of carburization is maintained. Thus, Figure 9 focuses on the carbon consumption due to raceway combustion (see Figure 9a) and chemical reactions (see Figure 9b).
Figure 9a,b illustrate that with an increase in POE, combustion carbon initially declines and subsequently rises, while the carbon consumption from chemical reactions consistently decreases. The carbon consumption resulting from chemical reactions is further divided into two components: direct reduction (see Figure 9c) and solution loss reaction (see Figure 9d). As POE increases, the carbon consumption for direct reduction decreases initially and then increases, while the carbon consumption from the solution loss reaction steadily decreases. The underlying reasons for these changes are explained below, based on the inner state of the BF.
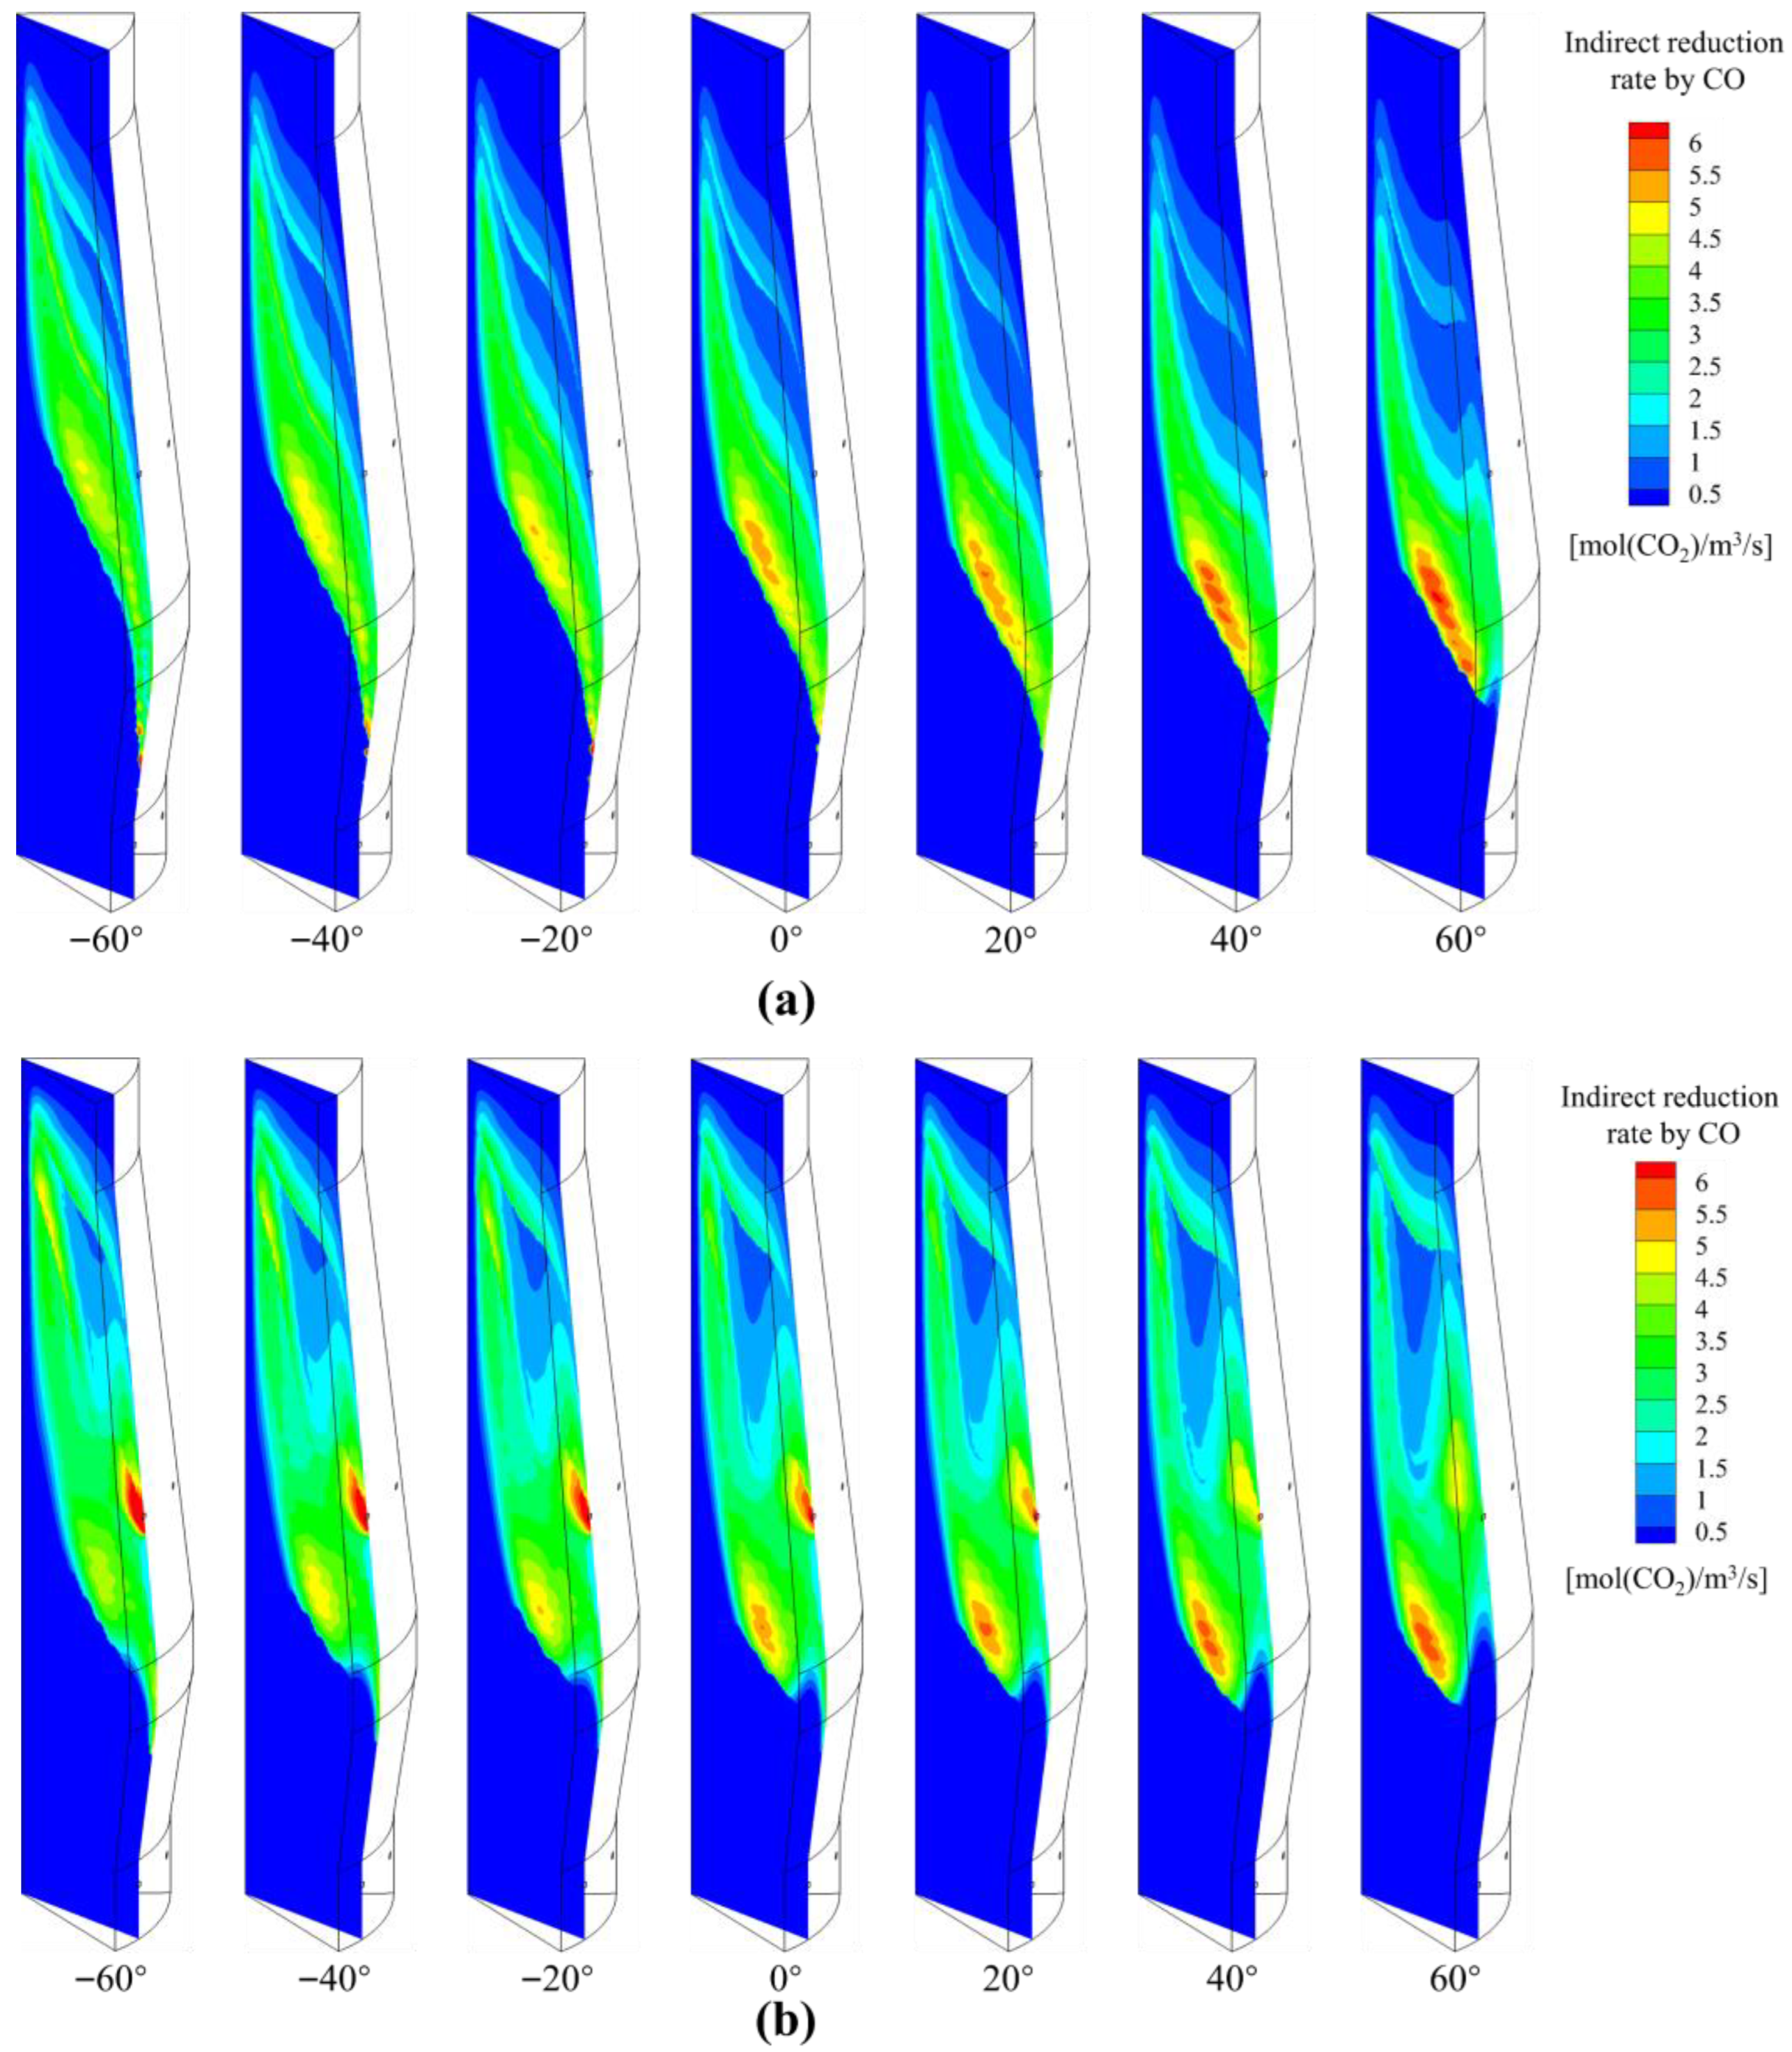
The analysis of carbon consumption changes during the chemical reaction is shown in Figure 9b. Additionally, Figure 10 and Figure 11 offer insights into the inner state of the BF concerning chemical reactions, specifically regarding the indirect reduction rate by CO and the carbon solution loss reaction. From Figure 6, it is evident that as POE increases, the reduction in CZ leads to an expansion of the lumpy zone, which in turn enlarges the indirect reduction region and increases the indirect reaction rate. However, the redistribution of ore particles causes the temperature in the upper central region (where the temperature is in the range of 473–673 K) of the furnace to decrease, leading to a reduction in the reduction rate in the upper region. The combined effect of these factors results in a trend where the indirect reduction rate first rises and subsequently declines. Specifically, when POE is less than 20°, the expansion of the indirect reduction zone predominates, resulting in an increase in the total indirect reduction rate. However, when POE exceeds 20°, the decrease in temperature in the upper central region (where the temperature is in the range of 473–673 K) of the furnace becomes the dominant factor, resulting in a decline in total indirect reduction rate. The maximum value occurs at POE = 20°. This trend also explains the variation in direct reduction carbon consumption with POE, as shown in Figure 9d.
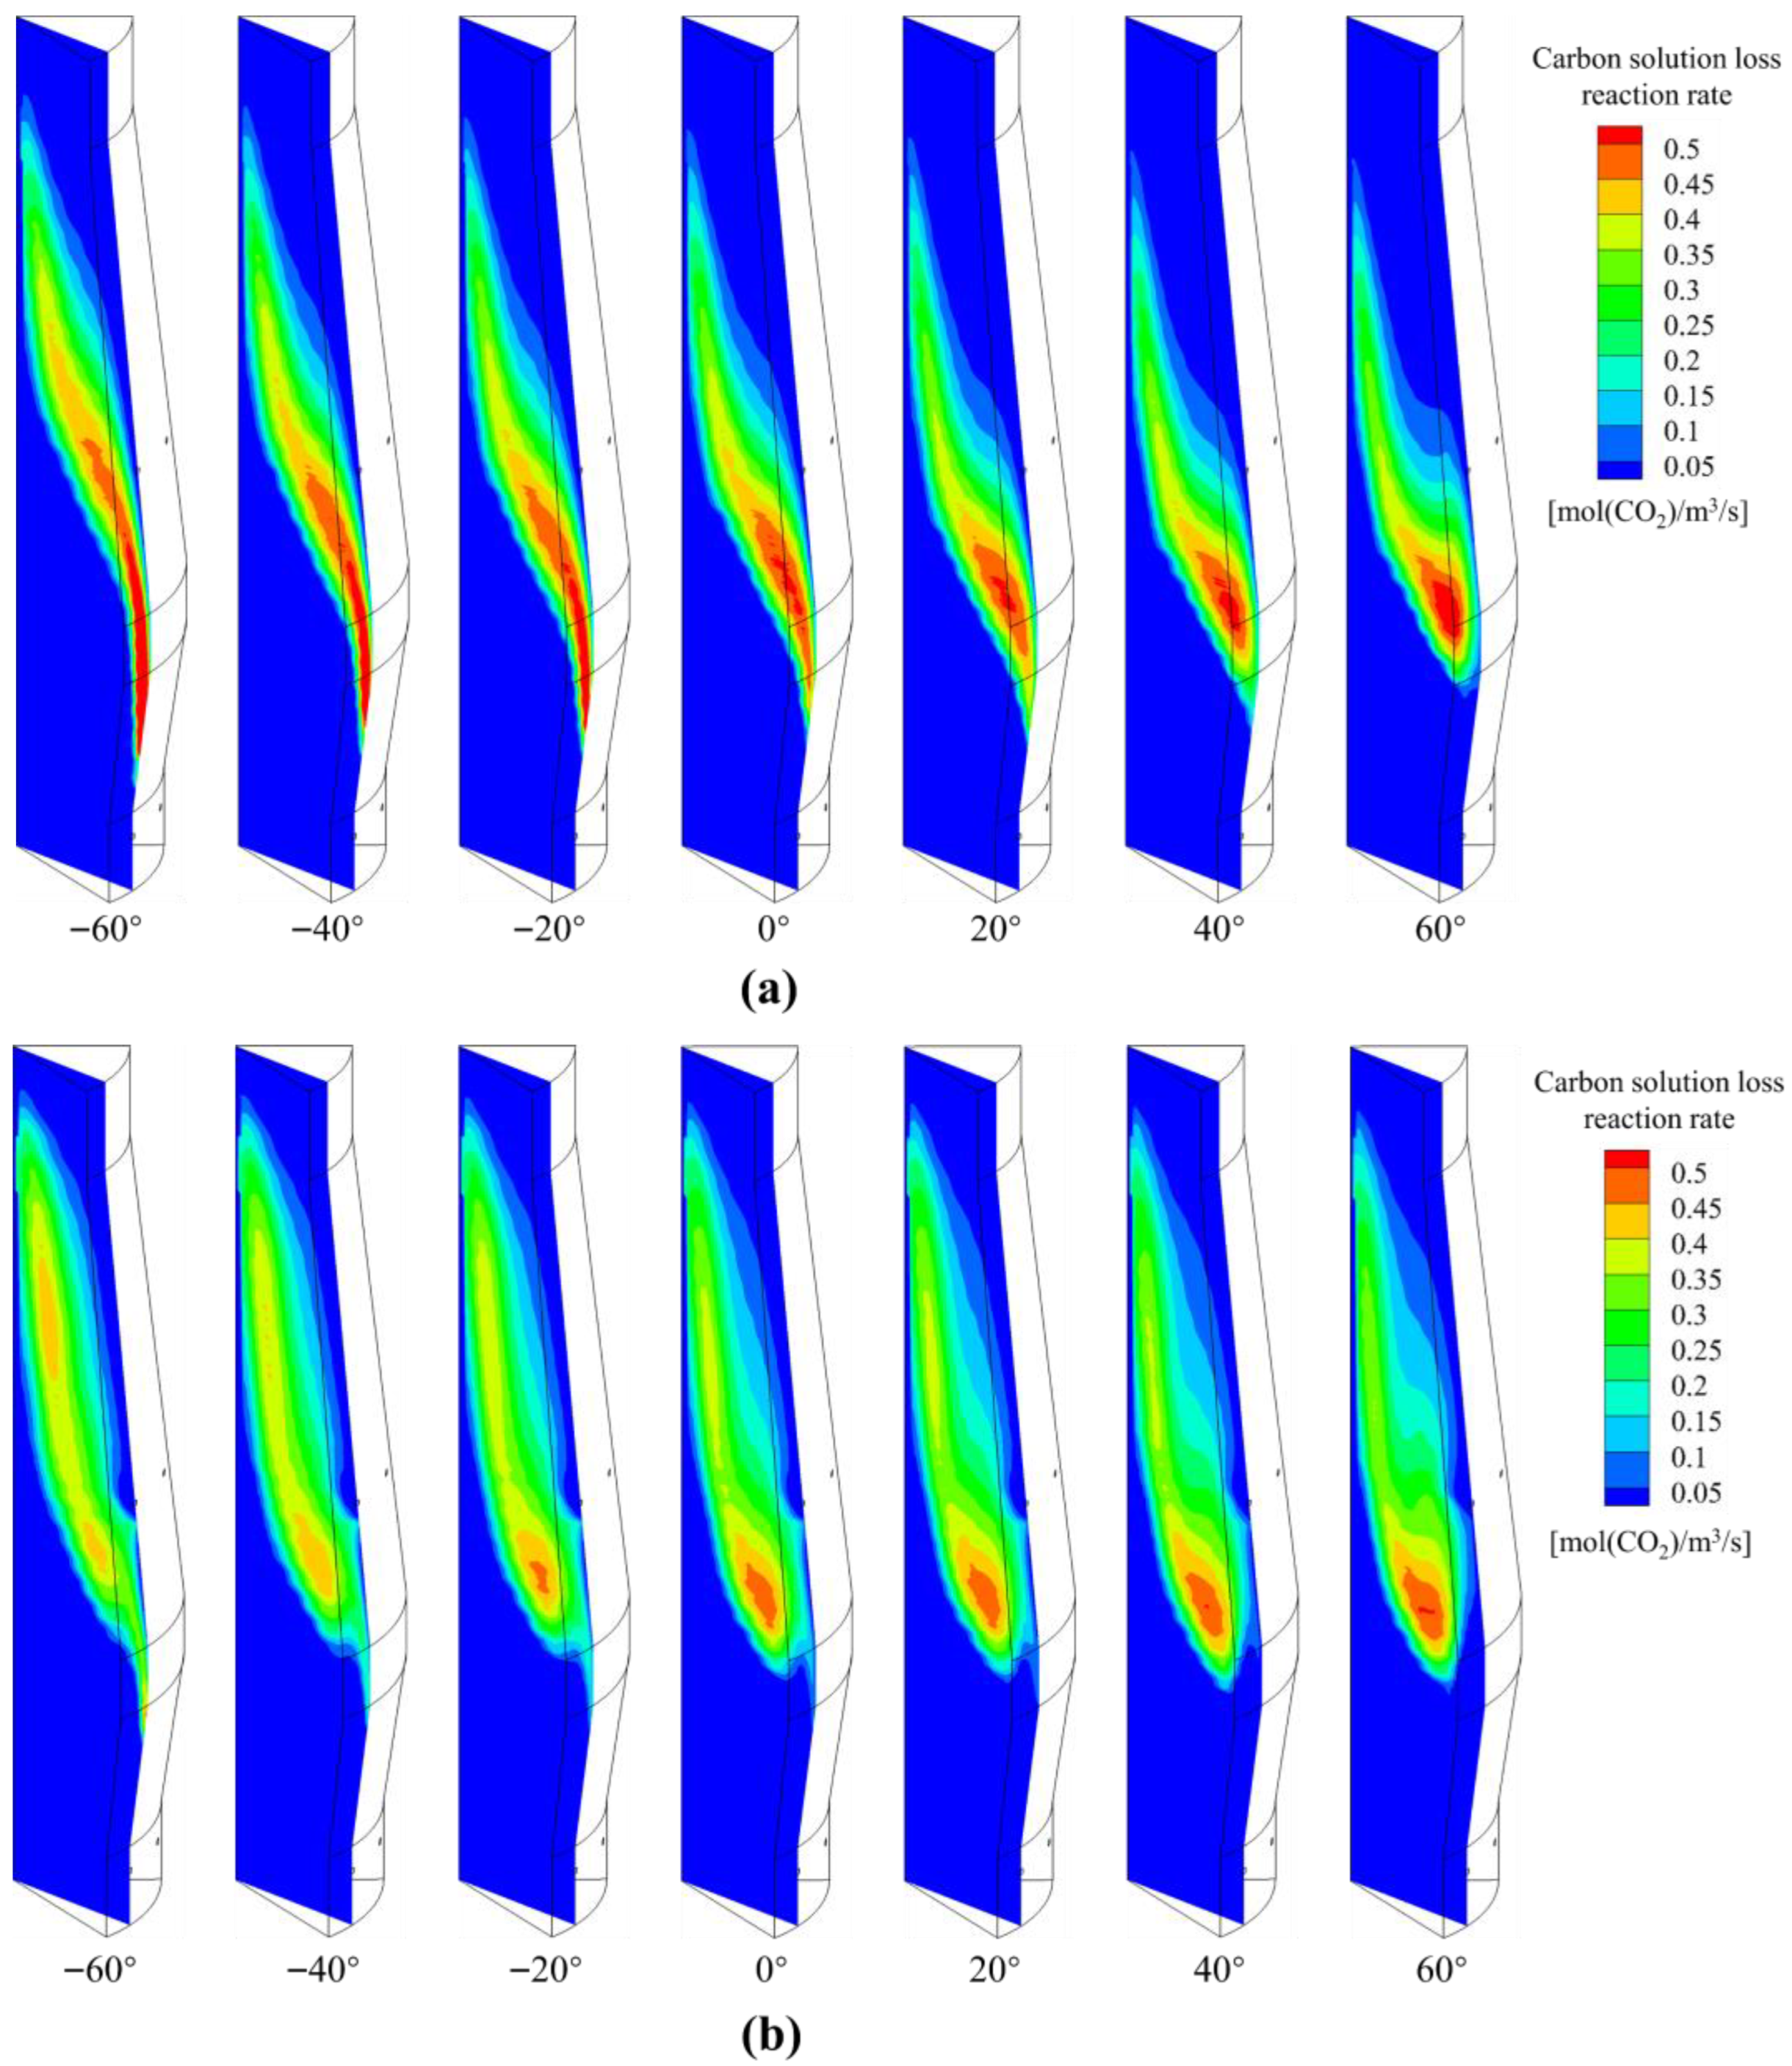
Figure 11 examines the variation in the carbon solution loss reaction rate as POE changes. As POE increases, the carbon solution reaction rate decreases. This is partly due to the temperature increase at the furnace wall peripheral region, which shifts the high-temperature zone in the peripheral region upward, raising the lower boundary of the carbon solution loss reaction. Simultaneously, the decrease in temperature in the upper part of the BF limits the upper boundary of the reaction. The interplay of these factors reduces the area of the carbon solution loss reaction, leading to a decrease in its rate (see Figure 9c).
Changes in the carbon consumption from direct reduction and the carbon solution loss reaction directly influence the trend in total chemical reaction carbon consumption (see Figure 9b). When POE < 20°, both direct reduction (see Figure 9d) and carbon solution loss reaction (see Figure 9c) carbon consumption decrease, resulting in lower total chemical reaction carbon consumption (see Figure 9b). However, when POE > 20°, while direct reduction carbon consumption increases (see Figure 9d), the reduction in carbon solution loss reaction carbon consumption dominates, leading to a decrease in total chemical reaction carbon consumption (see Figure 9b). Due to the simultaneous impact of combustion carbon consumption and chemical reaction carbon consumption, the fuel rate first declines and then rises (see Figure 4a).
Shaft injection significantly improves the thermal conditions in the furnace. It has been observed that when the shaft injection rate is increased, there is a corresponding decrease in carbon consumption from both combustion and chemical reactions (see Figure 9a,b). The additional heat brought by the increased injection rate significantly raises the furnace temperature, boosting the indirect reduction rate and lowering carbon consumption from both direct reduction and the carbon solution loss reaction (see Figure 9c,d). Additionally, at the shaft tuyere position, the indirect reduction rate decreases as POE increases because of a lower ore ratio in the peripheral region. Furthermore, changes in the blowing rate do not alter the trend of POE’s impact on carbon consumption.
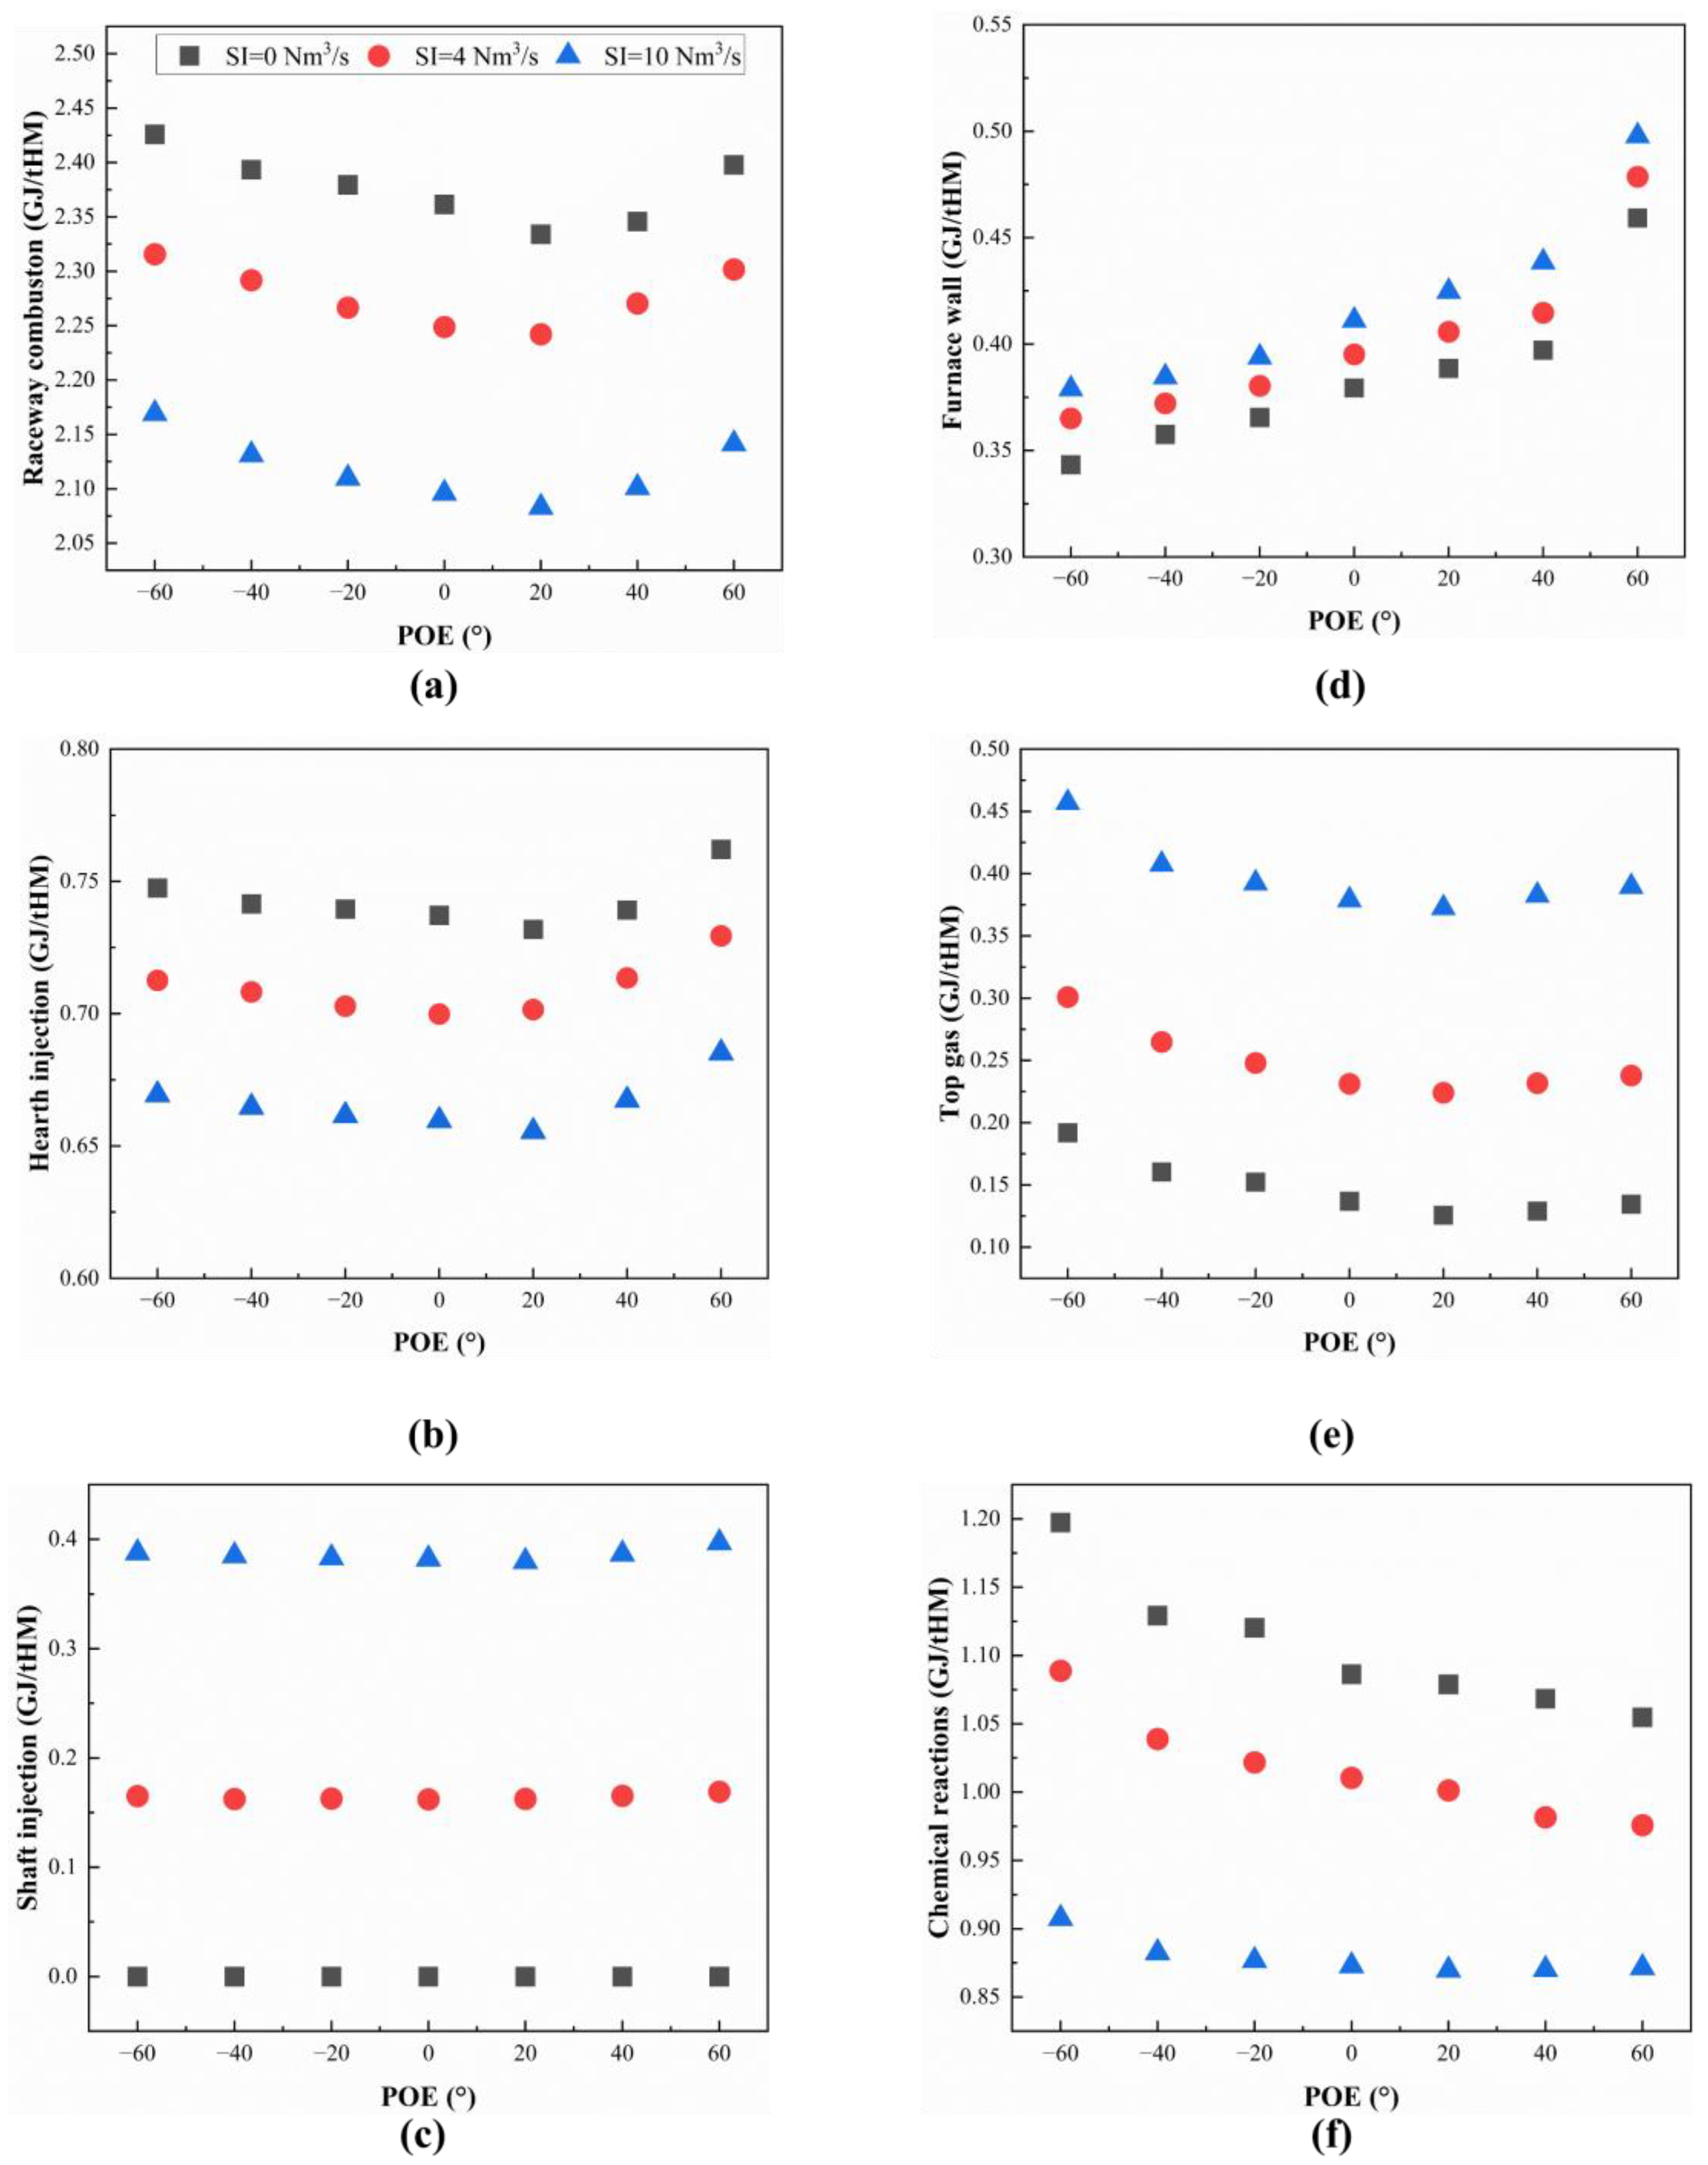
The carbon consumption during combustion, as illustrated in Figure 9a, has a strong connection with the heat input from combustion before the tuyere. Therefore, a comprehensive analysis of the blast furnace operation from a heat balance perspective is essential. The detailed thermal balance results are presented in Figure 12. The heat input to the blast furnace consists of three components: the physical heat from the hot blast, the combustion heat from solid fuels (such as coke and coal) (see Figure 12a), and the physical heat from the hot reducing gases (see Figure 12b,c). The heat output from the blast furnace is divided into four components: furnace wall dissipation (see Figure 12d), top gas heat loss (see Figure 12e), heat consumption due to chemical reactions (see Figure 12f), and physical heat of HM. Because this study uses a fixed hot blast rate and maintains a constant HM outlet temperature (1813 K), both the physical heat of the hot blast and the physical heat of HM are constant. Therefore, these components are not further discussed or compared.
From the perspective of heat output, as POE increases, the top gas heat dissipation initially decreases and then increases (see Figure 12e), corresponding to the changes in top gas temperature (see Figure 4c). Moreover, heat dissipation through the furnace wall increases with POE, as the gas flow in the peripheral region becomes more developed with higher POE values (see Figure 12d). Furthermore, heat consumption from chemical reactions decreases (see Figure 12f), which corresponds with the reduction in carbon consumption during these reactions (see Figure 9b).
Regarding thermal input, as POE increases, combustion heat first decreases and then increases (see Figure 12a). When POE < 20°, the combined effect of reduced heat consumption from chemical reactions (see Figure 12f) and decreased heat dissipation from the top gas (see Figure 12e) results in a lower heat demand from solid fuels. As a result, the combustion heat input diminishes (see Figure 12a), despite the increase in wall heat dissipation (see Figure 12d). However, when POE > 20°, the increased wall heat dissipation (see Figure 12d) and top gas heat dissipation (see Figure 12e) require additional heat input from fuels, leading to a gradual increase in combustion heat input before tuyeres (see Figure 12a). This elucidates the observed trend in carbon consumption before the tuyere (see Figure 9a). Additionally, as POE increases, the physical heat changes brought in by hearth injection (see Figure 12b) are relatively small, indicating that their effect on overall heat input is limited.
As the shaft injection rate increases, the reducing gas not only brings in more heat (see Figure 12c) but also improves the reducing atmosphere within the furnace. This results in a decrease in both combustion heat before the tuyeres and the heat consumption of reduction reactions (see Figure 12a,f). This trend aligns with the observed reductions in carbon consumption due to combustion and chemical reactions when the shaft injection rate rises (see Figure 9a,b). However, changes in the shaft injection rate do not alter the trend of POE’s impact on heat consumption.

5. Conclusions

This study examines the impact of varying peripheral opening extent (POE) on the gas flow, inner state, and global performance of OBF, considering different shaft injection rates into the furnace, utilizing a recently developed 3D CFD process model. Evaluating the addition of either more ore (POE < 0) or more coke (POE > 0) adjacent to the furnace wall while keeping the batch weight unchanged. The primary findings are outlined below:
(1)
As POE increases from −60° to 60°, the fuel rate of the OBF first decreases and then increases. The results indicate that when POE is 20°, the OBF achieves its lowest fuel rate, highest productivity, and maximum top gas utilization factor. These findings suggest that an appropriate peripheral opening promotes overall performance in the OBF.
(2)
As POE increases, the carbon consumption of direct reduction initially decreases and then increases, while the carbon consumption from the carbon solution reaction decreases and becomes dominant, resulting in an overall reduction in chemical reaction carbon consumption. In addition, the combustion heat in front of the tuyere first decreases and then increases, causing a corresponding decrease followed by an increase in carbon consumption in tuyeres. The combined effects of combustion and chemical reaction carbon consumption lead to a fuel rate that first decreases and then increases.
(3)
Shaft injection significantly enhances the thermal condition within the furnace, while the reducing gases injected further improve the reducing atmosphere in the upper part of the furnace. Together, these factors promote indirect reduction in the upper furnace, leading to a notable reduction in the fuel rate. Additionally, the impact of shaft injection on CZ is less pronounced than that of POE. Regardless of the shaft injection rate, POE = 20° remains the optimal peripheral opening and achieves the lowest fuel rate. Therefore, the selection of POE is independent of shaft injection rate.

Author Contributions

Conceptualization, L.J. and A.Y.; methodology, L.J. and A.Y.; software, L.J. and A.Y.; validation, L.J. and A.Y.; formal analysis, L.J., X.S., and A.Y.; investigation, L.J. and X.S.; resources, A.Y.; writing—original draft preparation, X.S.; writing—review and editing, L.J. and A.Y.; visualization, L.J. and X.S.; supervision, L.J. and A.Y.; project administration, A.Y.; funding acquisition, L.J. and A.Y. All authors have read and agreed to the published version of the manuscript.

Funding

This study was supported by the National Science Foundation of China [No. 52034003] and the Fundamental Research Funds of the University of Science and Technology Beijing [No. 00007889].

Data Availability Statement

The data presented in this study are available on request from the corresponding author. The data are not publicly available due to restrictions.

Acknowledgments

The authors are grateful to the National Supercomputing Center in Jinan (NSCCJN) for the use of high-performance computational facilities, Jianliang Zhang and Yanbing Zong for providing resources and useful discussion, and CAFFA3D for making a useful code available for free use and adaptation.

Conflicts of Interest

The authors declare no conflict of interest.

Abbreviations

Nomenclature
aFeOThe activity of molten wustite
AcEffective surface area of coke for reaction, m2
BFBlast furnace
cpSpecific heat, J·kg−1·K−1
CSiO2Concentration of SiO2, mol·m−3
CZCohesive zone
dDiameter of solid phase, m
doOre particle size, m
do,0Initial ore particle size before degradation, m
DDiffusion coefficient, m2·s−1
Ds5Intra-particle diffusion coefficient of H2 in reduced iron phase, m2·s−1
EfEffectiveness factors of solution loss reaction by CO
EfEffectiveness factors of water gas reaction
EglVolumetric enthalpy flux between gas and liquid, W·m−3
foReduction degree of iron ore
FInteraction force per unit volume, kg·m−2·s−2
gGravitational acceleration, m·s−2
hijHeat transfer coefficient between i and j phase, W·m−2·K−1
HEnthalpy, J·kg−1
ΔHReaction heat, J·mol−1
HMHot metal
kThermal conductivity, W·m−1·K−1
k1Rate constant of indirect reduction of iron ore by CO, m·s−1
k2Rate constant of direction reduction of molten wustite, mol·m2·s−1
K3Rate constant of solution loss reaction by CO, m3·kg−1·s−1
K5Rate constant of indirect reduction of iron ore by H2, m·s−1
K6Rate constant of water gas reaction, m3·kg−1·s−1
K8Rate constant of silica reduction reaction in slag, m·s−1
KfGas-film mass transfer coefficient, m·s−1
Kf5Gas-film mass transfer coefficient in indirect reduction of iron ore by H2, m·s−1
Kf6Gas-film mass transfer coefficient water gas reaction, m·s−1
K1Equilibrium constant of indirect reduction of iron ore by CO
K5Equilibrium constant of indirect reduction of iron ore by H2
MiMolar mass of the ith species in the gas phase
MsmMolar mass of FeO, or flux in solid phase, kg·mol−1
NcokeNumber of coke in unit volume of bed, m−3
NoreNumber of iron oxide in unit volume of bed, m−3
pPressure, Pa
PePeclet number
PrPrandtl number
RGas constant, 8.314 J·mol−1·K−1
R k * Reaction rate for the kth reaction, mol·m3·s−1
RDIReduction degradation index, %
ReReynolds number
SSource term
ScSchmidt number
S h r * Normalized shrinkage ratio
tsTimeline, s
TTemperature, K
TFTTheoretical flame temperature, K
uVelocity, m·s−1
yiMole fraction of the ith species in the gas phase
y C O , y H 2 Molar fraction of CO and H2
y C O * ,   y H 2 * Molar fraction of CO and H2 in equilibrium state for indirect reaction
y C O 2 , y H 2 O Molar fraction of CO2 and H2O(g)
Greek Symbols
αSpecific surface area, m2·m−3
ΓDiffusion coefficient
εVolume fraction
ηFractional acquisition of reaction heat
ΙIdentity tensor
μViscosity, kg·m−1·s−1
ξore, ξcokeLocal ore, coke volume fraction
ρDensity, kg·m−3
ρbulkBulk density of burden at BF throat, kg·m−3
τStress tensor, Pa
φ General variable
ωMass fraction
Subscripts
eEffective
gGas
iIdentifier (g, s or l)
i,mmth species in i phase
jIdentifier (g, s or l)
kkth reaction
lLiquid
l,dDynamic liquid
sSolid
smFeO or flux in solid phase
Superscripts
eEffective
gGas
lLiquid
sSolid
TTranspose

References

  1. Ariyama, T.; Murai, R.; Ishii, J.; Sato, M. Reduction of CO2 emissions from integrated steel works and its subjects for a future study. ISIJ Int. 2005, 45, 1371–1378. [Google Scholar] [CrossRef]
  2. Ujisawa, Y.; Nakano, K.; Matsukura, Y.; Sunahara, K.; Komatsu, S.; Yamamoto, T. Subjects for achievement of blast furnace operation with low reducing agent rate. ISIJ Int. 2005, 45, 1379–1385. [Google Scholar] [CrossRef]
  3. Ariyama, T.; Sato, M. Optimization of ironmaking process for reducing CO2 emissions in the integrated steel works. ISIJ Int. 2006, 46, 1736–1744. [Google Scholar] [CrossRef]
  4. Takeda, K.; Anyashiki, T.; Sato, T.; Oyama, N.; Watakabe, S.; Sato, M. Recent Developments and Mid and Long Term CO2 Mitigation Projects in Ironmaking. Steel Res. Int. 2011, 82, 512–520. [Google Scholar] [CrossRef]
  5. Rahmatmand, B.; Tahmasebi, A.; Lomas, H.; Honeyands, T.; Koshy, P.; Hockings, K.; Jayasekara, A. A technical review on coke rate and quality in low-carbon blast furnace ironmaking. Fuel 2023, 336, 127077. [Google Scholar] [CrossRef]
  6. Li, X.; Tian, W.; Li, H.; Quan, K.; Zhang, X.; Lu, X.; Bai, H. Effect of applying full oxygen blast furnace on the transformation of energy mix and reduction of CO2 emissions for an integral steel plant. Energy 2025, 315, 134390. [Google Scholar] [CrossRef]
  7. Qin, L.; Zhao, B.; Zhou, B.; Chen, W.; Han, J. Numerical simulation of biosyngas injection in air-blown and full-oxygen blast furnaces with lower carbon emissions. Appl. Therm. Eng. 2025, 279, 127798. [Google Scholar] [CrossRef]
  8. Zhang, W.; Dai, J.; Li, C.; Yu, X.; Xue, Z.; Saxén, H. A review on explorations of the oxygen blast furnace process. Steel Res. Int. 2021, 92, 2000326. [Google Scholar] [CrossRef]
  9. Zhang, S.; Zhang, J.; Wang, Z.; Zong, Y.; Guo, P.; Jiang, D.; Zhang, S. Advancements in oxygen blast furnace technology and its application in the smelting of vanadium-titanium magnetite: A comprehensive review. Miner. Eng. 2024, 212, 108732. [Google Scholar] [CrossRef]
  10. Tseitlin, M.A.; Lazutkin, S.E.; Styopin, G.M. A folw-chart for iron making on the basis of 100% usage of process oxygen and hot reducing gases injection. ISIJ Int. 1994, 34, 570–573. [Google Scholar] [CrossRef]
  11. Fang, M.; Xie, Y.; Shao, Y.; Xu, X.; Xia, Y.; Mou, M.; Hu, X.; Wang, T.; Liu, Z. Development of carbon capture absorbents for top gas recycling-oxygen blast furnace in the steel industry. Sep. Purif. Technol. 2025, 355, 129616. [Google Scholar] [CrossRef]
  12. Wang, H.; Chu, M.; Guo, T.; Zhao, W.; Feng, C.; Liu, Z.; Tang, J. Mathematical simulation on blast furnace operation of coke oven gas injection in combination with top gas recycling. Steel Res. Int. 2016, 87, 539–549. [Google Scholar] [CrossRef]
  13. Zhou, H.; Tian, X.; Yao, S.; Kou, M.; Wu, S.; Shen, Y. Numerical Analysis of Blast Furnace with Injection of COREX Export Gas After Removal of CO2. ISIJ Int. 2021, 61, 174–181. [Google Scholar] [CrossRef]
  14. Wu, W.; Zhu, R.; Wei, G.; Dong, K.; Jiang, J. Modeling on the blast furnace with CO2-enriched hot blast. J. Clean. Prod. 2021, 319, 128690. [Google Scholar] [CrossRef]
  15. Zhang, J.; Ye, L.; Xu, R.; Zhao, P.; Yu, Y.; Guo, P.; Li, T.; Wang, Y.; Zhu, J. Effects of Hydrogen-Rich Gas Composition on Energy Consumption and the Raceway State of Oxygen Blast Furnace. Metall. Mater. Trans. B 2025, 56, 499–514. [Google Scholar] [CrossRef]
  16. Ohno, Y.; Hotta, H.; Matsuura, M.; Mitsufuji, H.; Saito, H. Development of oxygen blast furnace process with preheating gas injection into upper shaft. Tetsu Hagané 1989, 75, 1278–1285. [Google Scholar] [CrossRef] [PubMed]
  17. Jiao, L.; Nie, H.; Kuang, S.; Li, J.; Yu, A. Numerical simulation and analysis of oxygen blast furnace under different injection conditions. Fuel 2024, 369, 131726. [Google Scholar] [CrossRef]
  18. Ichida, M.; Nishihara, K.; Tamura, K.; Sugata, M.; Ono, H. Influence of ore to coke ratio distribution on descending and melting behavior of burden in the blast furnace. Tetsu Hagané 1991, 77, 1617–1624. [Google Scholar] [CrossRef][Green Version]
  19. Tian, J.; Tanaka, A.; Gao, D.; Liu, Z.; Hou, Q.; Chen, X. Characterization of the Blast Furnace Burden Surface: Experimental Measurement and Roughness Statistics. ISIJ Int. 2023, 63, 1217–1225. [Google Scholar] [CrossRef]
  20. Saxén, H.; Nikus, M.; Hinnelä, J. Burden distribution estimation in the blast furnace from stockrod and probe signals. Steel Res. 1998, 69, 406–412. [Google Scholar] [CrossRef]
  21. Chakrabarty, A.; Ohri, R.; Chaudhari, U.; Sahoo, T.; Nag, S.; Gupta, I.P. Influence of above burden probes in blast furnace on centre coke charging and subsequent operational stability. J. Sustain. Metall. 2023, 9, 1790–1802. [Google Scholar] [CrossRef]
  22. Wei, J.; Chen, X.; Kelly, J.; Cui, Y. Blast furnace stockline measurement using radar. Ironmak. Steelmak. 2015, 42, 533–541. [Google Scholar] [CrossRef]
  23. Zhu, Q.; Lü, C.-L.; Yin, Y.-x.; Chen, X.-z. Burden distribution calculation of bell-less top of blast furnace based on multi-radar data. J. Iron Steel Res. Int. 2013, 20, 33–37. [Google Scholar] [CrossRef]
  24. Kajiwara, Y.; Jimbo, T.; Joko, T.; Aminaga, Y.-i.; Inada, T. Investigation of bell-less charging based on full scale model experiments. Trans. Iron Steel Inst. Jpn. 1984, 24, 799–807. [Google Scholar] [CrossRef]
  25. Jimenez, J.; Mochón, J.; Formoso, A.; de Ayala, J.S. Burden distribution analysis by digital image processing in a scale model of a blast furnace shaft. ISIJ Int. 2000, 40, 114–120. [Google Scholar] [CrossRef]
  26. Hattori, M.; Iino, B.; Shimomura, A.; Tsukiji, H.; Ariyama, T. Development of burden distribution simulation model for bell-less top in a large blast furnace and its application. ISIJ Int. 1993, 33, 1070–1077. [Google Scholar] [CrossRef]
  27. Yang, Y.; Yin, Y.; Wunsch, D.; Zhang, S.; Chen, X.; Li, X.; Cheng, S.; Wu, M.; Liu, K.-Z. Development of blast furnace burden distribution process modeling and control. ISIJ Int. 2017, 57, 1350–1363. [Google Scholar] [CrossRef]
  28. Chen, J.; Zuo, H.; Xue, Q.; Wang, J. A review of burden distribution models of blast furnace. Powder Technol. 2022, 398, 117055. [Google Scholar] [CrossRef]
  29. Chen, J.-S.; Zuo, H.-B.; Wang, J.-X.; Xue, Q.-G.; Wang, J.-S. Mathematical model of burden distribution in bell-less top blast furnace. J. Iron Steel Res. Int. 2023, 30, 216–226. [Google Scholar] [CrossRef]
  30. Yu, Y.; Saxén, H. Particle flow and behavior at bell-less charging of the blast furnace. Steel Res. Int. 2013, 84, 1018–1033. [Google Scholar] [CrossRef]
  31. Yu, Y.; Saxén, H. Flow of pellet and coke particles in and from a fixed chute. Ind. Eng. Chem. Res. 2012, 51, 7383–7397. [Google Scholar] [CrossRef]
  32. Yu, Y.; Saxén, H. Effect of DEM parameters on the simulated inter-particle percolation of pellets into coke during burden descent in the blast furnace. ISIJ Int. 2012, 52, 788–796. [Google Scholar] [CrossRef]
  33. Mitra, T.; Saxén, H. Investigation of coke collapse in the blast furnace using mathematical modeling and small scale experiments. ISIJ Int. 2016, 56, 1570–1579. [Google Scholar] [CrossRef]
  34. Mitra, T.; Saxén, H. Discrete element simulation of charging and mixed layer formation in the ironmaking blast furnace. Comput. Part. Mech. 2016, 3, 541–555. [Google Scholar] [CrossRef]
  35. Zhao, Z.; Saxén, H.; Liu, Y.; She, X.; Xue, Q. Numerical study on the influence of pellet proportion on burden distribution in blast furnace. Ironmak. Steelmak. 2023, 50, 613–620. [Google Scholar] [CrossRef]
  36. Chakrabarty, A.; Raju, A.B.; Pani, S.; Ghosh, U.; Nag, S.; Pal, P.; Singh, U. Effect of Selective Pellet Loading on Burden Distribution and Blast Furnace Operations. ISIJ Int. 2023, 63, 271–281. [Google Scholar] [CrossRef]
  37. Arroyo, J.; Pérez, L.; Cuervo-Piñera, V. CFD modeling and validation of blast furnace gas/natural gas mixture combustion in an experimental industrial furnace. Processes 2023, 11, 332. [Google Scholar] [CrossRef]
  38. Zhuo, Y.; Shen, Y. Transient 3D CFD study of pulverised coal combustion and coke combustion in a blast furnace: Effect of blast conditions. Fuel 2023, 340, 127468. [Google Scholar] [CrossRef]
  39. Okosun, T.; Nielson, S.; Zhou, C. Blast furnace hydrogen injection: Investigating impacts and feasibility with computational fluid dynamics. JOM 2022, 74, 1521–1532. [Google Scholar] [CrossRef]
  40. Xu, D.; Wang, S.; Shen, Y. Numerical investigation of the reacting flows of three adjunct raceways in an industrial-scale blast furnace. Fuel 2023, 354, 129339. [Google Scholar] [CrossRef]
  41. Li, Z.; Kuang, S.; Liu, S.; Gan, J.; Yu, A.; Li, Y.; Mao, X. Numerical investigation of burden distribution in ironmaking blast furnace. Powder Technol. 2019, 353, 385–397. [Google Scholar] [CrossRef]
  42. Zhao, Z.; Yu, X.; Shen, Y. Transient CFD study of wet burden charging on dynamic in-furnace phenomena in an ironmaking blast furnace: Impacts and remedies. Powder Technol. 2022, 408, 117708. [Google Scholar] [CrossRef]
  43. Li, J.; Kuang, S.; Zou, R.; Yu, A. Numerical investigation of burden distribution in hydrogen blast furnace. Metall. Mater. Trans. B 2022, 53, 4124–4137. [Google Scholar] [CrossRef]
  44. Nie, H.; Li, Z.; Kuang, S.; Yan, L.; Zhong, W.; Yu, A.; Mao, X.; Xu, H. Numerical investigation of oxygen-enriched operations in blast furnace ironmaking. Fuel 2021, 296, 120662. [Google Scholar] [CrossRef]
  45. Li, Z.; Kuang, S.; Yu, A.; Gao, J.; Qi, Y.; Yan, D.; Li, Y.; Mao, X. Numerical investigation of novel oxygen blast furnace ironmaking processes. Metall. Mater. Trans. B 2018, 49, 1995–2010. [Google Scholar] [CrossRef]
  46. Zhang, Z.; Meng, J.; Guo, L.; Guo, Z. Numerical study of the reduction process in an oxygen blast furnace. Metall. Mater. Trans. B 2016, 47, 467–484. [Google Scholar] [CrossRef]
  47. Jiao, L.; Kuang, S.; Yu, A.; Li, Y.; Mao, X.; Xu, H. Three-dimensional modeling of an ironmaking blast furnace with a layered cohesive zone. Metall. Mater. Trans. B 2020, 51, 258–275. [Google Scholar] [CrossRef]
  48. Jiao, L. Development and Applications of a Comprehensive Three-Dimensional (3D) Blast Furnace Process Model. Ph.D. Thesis, Monash University, Melbourne, VIC, Australia, 2020. [Google Scholar]
  49. Ergun, S. Pressure drop in blast furnace and in cupola. Ind. Eng. Chem. 1953, 45, 477–485. [Google Scholar] [CrossRef]
  50. Wang, G.; Chew, S.; Yu, A.; Zulli, P. Modeling the discontinuous liquid flow in a blast furnace. Metall. Mater. Trans. B 1997, 28, 333–343. [Google Scholar] [CrossRef]
  51. Omori, Y. Blast Furnace Phenomena and Modelling; Elsevier Applied Science: London, UK; New York, NY, USA, 1987. [Google Scholar]
  52. Austin, P.R.; Nogami, H.; Yagi, J.-i. A mathematical model of four phase motion and heat transfer in the blast furnace. ISIJ Int. 1997, 37, 458–467. [Google Scholar] [CrossRef]
  53. Austin, P.R.; Nogami, H.; Yagi, J.-i. A mathematical model for blast furnace reaction analysis based on the four fluid model. ISIJ Int. 1997, 37, 748–755. [Google Scholar] [CrossRef]
  54. Muchi, I. Mathematical model of blast furnace. Trans. Iron Steel Inst. Jpn. 1967, 7, 223–237. [Google Scholar] [CrossRef]
  55. Yang, K.; Choi, S.; Chung, J.; Yagi, J.-i. Numerical modeling of reaction and flow characteristics in a blast furnace with consideration of layered burden. ISIJ Int. 2010, 50, 972–980. [Google Scholar] [CrossRef]
  56. Fu, D.; Chen, Y.; Zhao, Y.; D’Alessio, J.; Ferron, K.J.; Zhou, C.Q. CFD modeling of multiphase reacting flow in blast furnace shaft with layered burden. Appl. Therm. Eng. 2014, 66, 298–308. [Google Scholar] [CrossRef]
  57. Zhou, P.; Li, H.-l.; Shi, P.-y.; Zhou, C.Q. Simulation of the transfer process in the blast furnace shaft with layered burden. Appl. Therm. Eng. 2016, 95, 296–302. [Google Scholar] [CrossRef]
  58. Dong, X.; Yu, A.; Chew, S.J.; Zulli, P. Modeling of blast furnace with layered cohesive zone. Metall. Mater. Trans. B 2010, 41, 330–349. [Google Scholar] [CrossRef]
  59. Jiao, L.; Kuang, S.; Liu, L.; Yu, A.; Li, Y.; Mao, X.; Xu, H. CFD modeling and analysis of particle size reduction and its effect on blast furnace ironmaking. Metall. Mater. Trans. B 2021, 52, 138–155. [Google Scholar] [CrossRef]
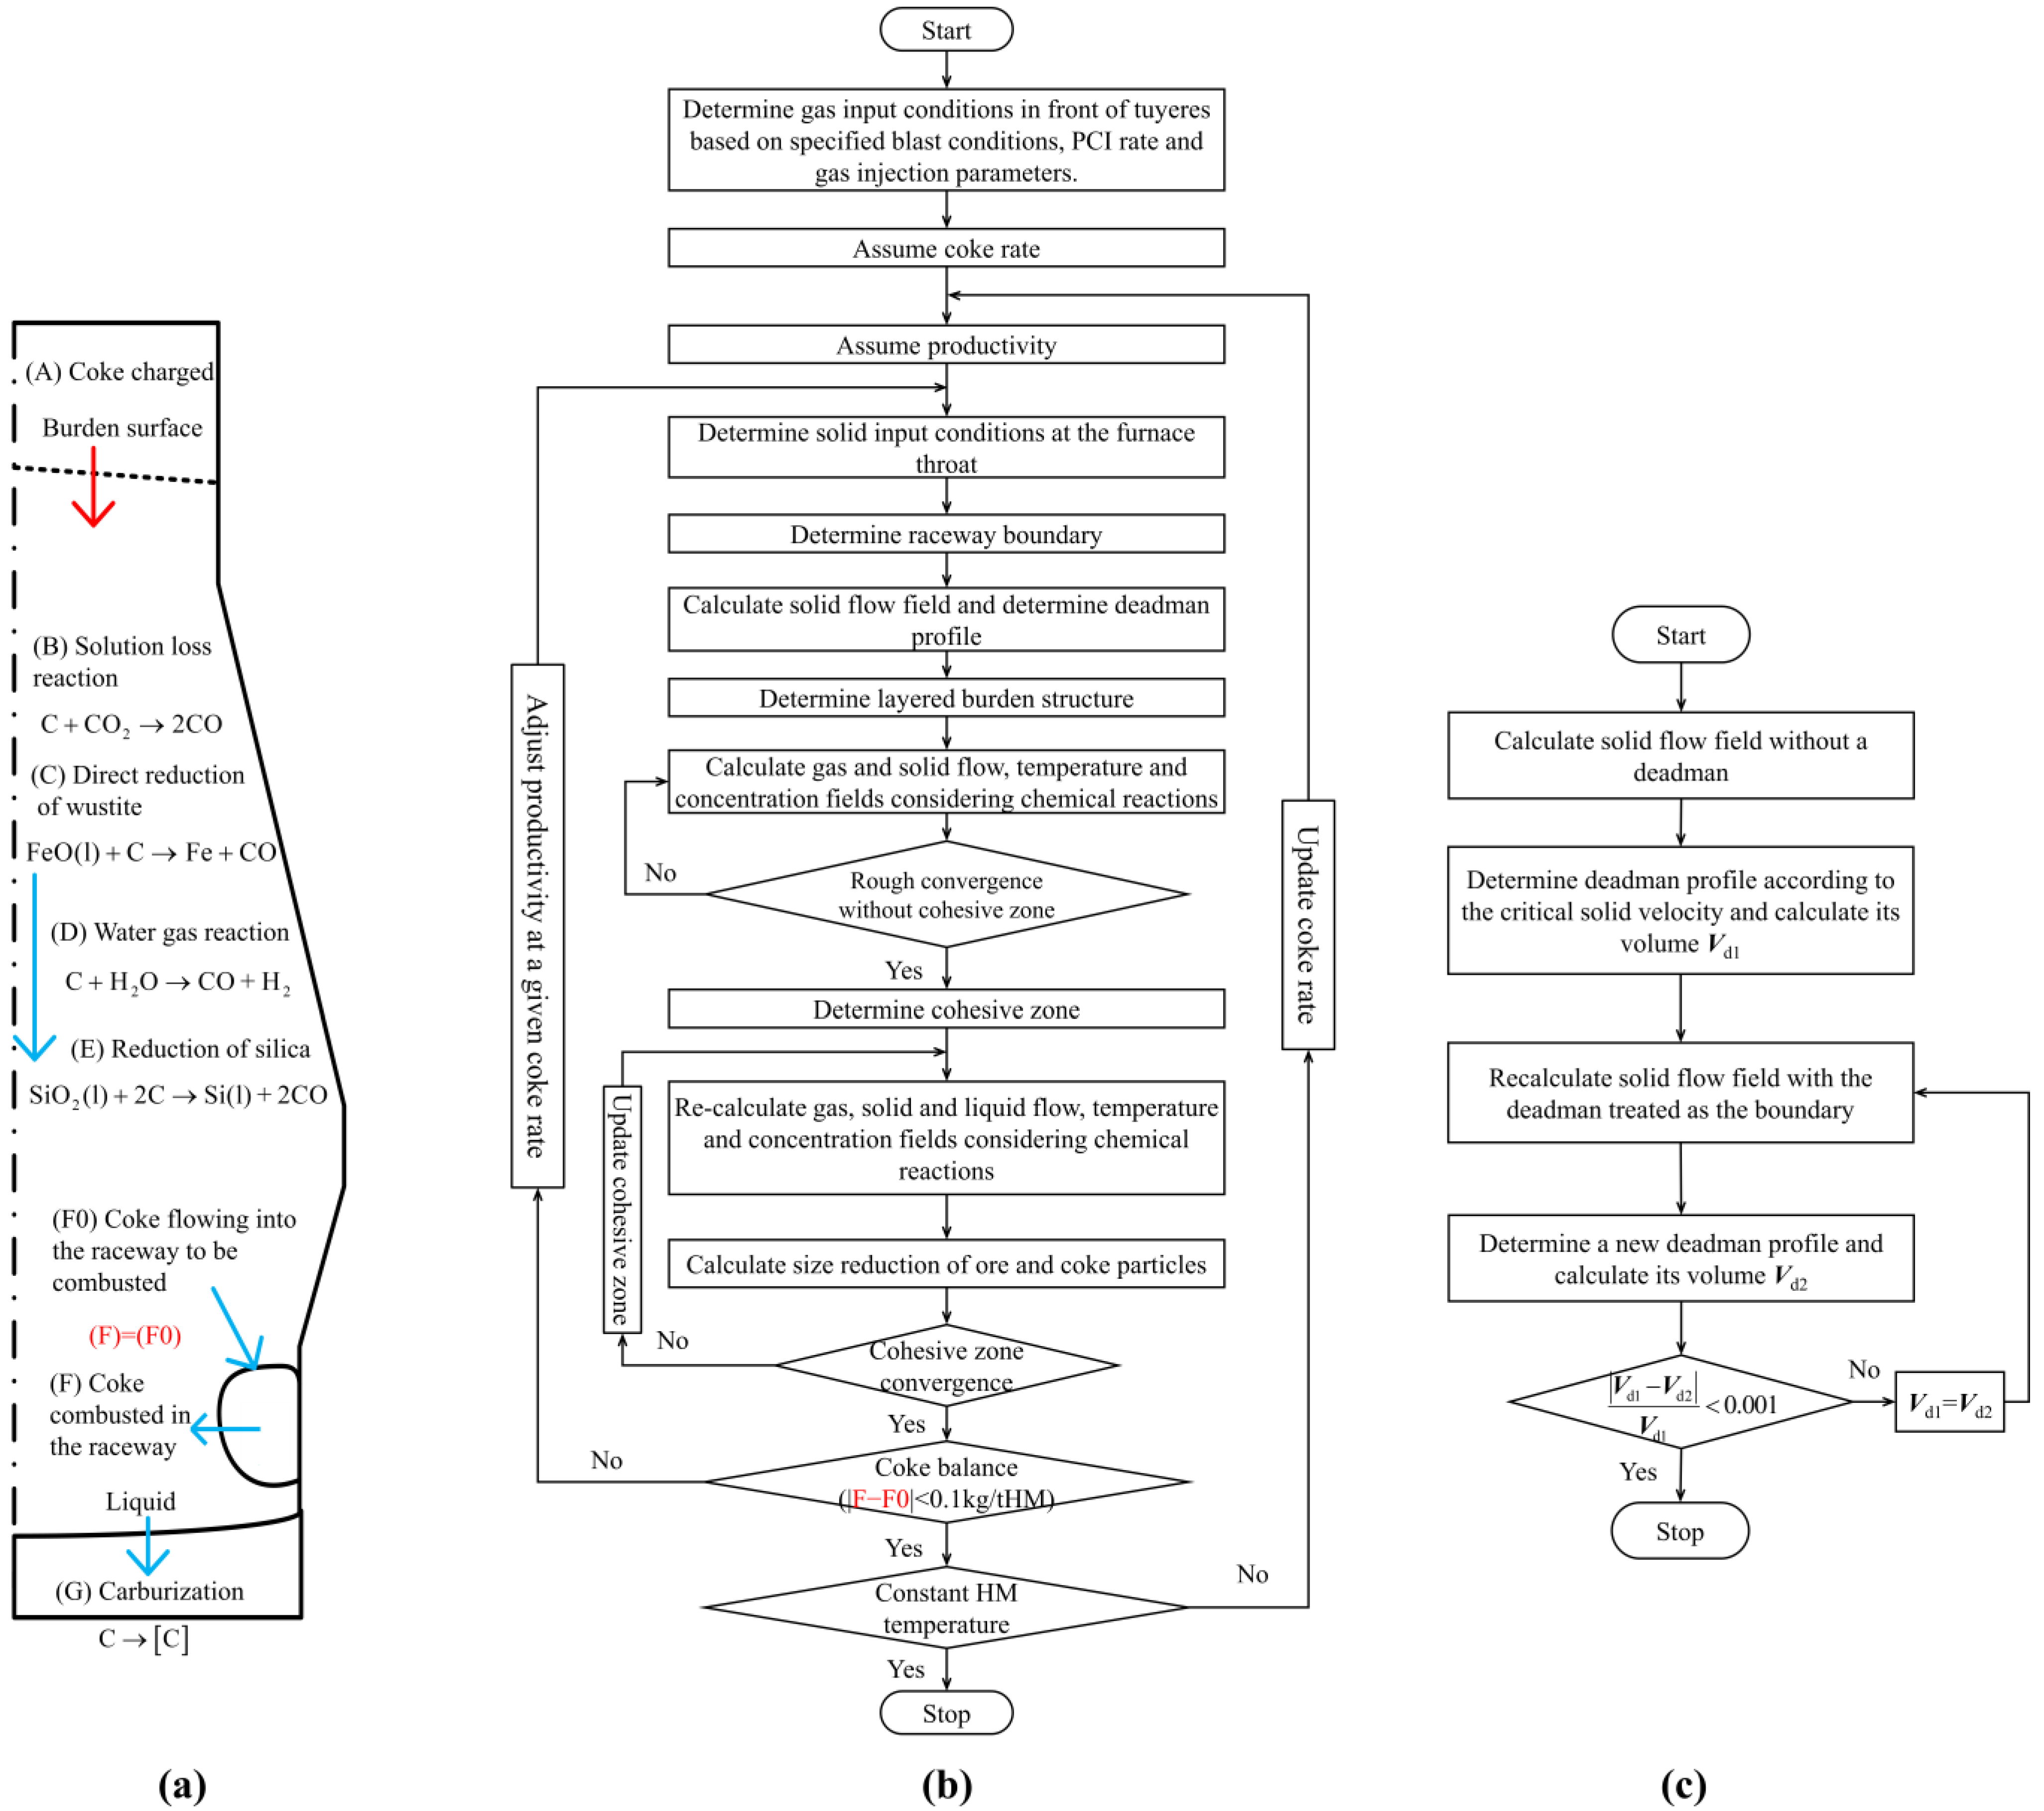
Figure 1. Schematic representation of (a) coke balance in a BF, (b) solution procedure of the current 3D CFD process model, and (c) the sub-model related to the determination of deadman profile.
Metals 15 01048 g001
Figure 2. Schematic representation of (a) the OBF geometric dimensions, (b) the computational domain, and (c) the gas injection conditions in the current study.
Metals 15 01048 g002
Figure 3. Schematic representation of ore volumetric ratio at different POEs.
Metals 15 01048 g003
Figure 4. Impact of POE on OBF global performance at different SI rates: (a) fuel rate, (b) productivity, (c) top gas temperature, and (d) top gas utilization factor.
Metals 15 01048 g004
Figure 5. Impact of POE on CZ at different SI rates: (a) SI = 0 Nm3/s and (b) SI = 10 Nm3/s.
Metals 15 01048 g005
Figure 6. Impact of POE on lumpy volume at different SI rates.
Metals 15 01048 g006
Figure 7. Impact of POE on solid temperature at different SI rates: (a) SI = 0 Nm3/s and (b) SI = 10 Nm3/s.
Metals 15 01048 g007
Figure 8. Impact of POE on reduction degree at different SI flow rates: (a) SI = 0 Nm3/s and (b) SI = 10 Nm3/s.
Metals 15 01048 g008
Figure 9. Impact of POE on carbon consumption: (a) combustion in raceway, (b) chemical reaction, (c) solution loss reaction, and (d) direct reaction at different SI rates.
Metals 15 01048 g009
Figure 10. Impact of POE on indirect reduction rate by CO at different SI flow rates: (a) SI = 0 Nm3/s and (b) SI = 10 Nm3/s.
Metals 15 01048 g010
Figure 11. Impact of POE on carbon solution loss reaction rate at different SI flow rates: (a) SI = 0 Nm3/s and (b) SI = 10 Nm3/s.
Metals 15 01048 g011
Figure 12. Impact of POE on heat input through (a) raceway combustion, (b) hearth injection, and (c) shaft injection; and heat output through (d) furnace wall, (e) top gas, and (f) chemical reactions at different SI rates.
Metals 15 01048 g012
Table 1. Governing equations of the 3D BF process model.
ItemsDescriptions
Mass conservation ε i ρ i u i =   S i ,   where ,   S i = k β i , k R k *
Momentum conservation
Gas ε g ρ g u g u g = τ g ε g p + ε g ρ g g +   F g s
τ g = ε g μ g u g +   u g T 2 3 ε g μ g u g Ι
Solid ε s ρ s u s u s = τ s ε s p s + ε s ρ s g
τ s = ε s μ s u s + u s T 2 3 ε s μ s u s Ι
Liquid F l , d g + F l , d s + F l , d gravity   = 0
Heat and species conservations ε i ρ i u i φ i , m ε i Γ i φ i , m =   S φ i , m
if   φ i , m is   H i , m ,   Γ i   =   k i c p , i ,
S φ i , m = δ i h ij α T i T j + η i k R k * η H k
if   φ i , m is   ω i , m ,   Γ i   =   ρ i D i ,   S φ i , m = k α i , m , k R k *
where ,   φ i , m =   ω g , CO ,   ω g , C O 2 ,   ω g , H 2 ,   ω g , H 2 O ,   ω g , N 2 ,
ω s , F e 2 O 3 ,   ω s , F e 3 O 4 ,   ω s , FeO ,   ω s , flux
Phase volume fraction i ε i = 1
State equation p = ρ g R T g i y i M i
Timeline equation ρ bulk u s t s = ρ bulk
Table 2. Interphase interaction forces and transport coefficients in the present model.
ItemsFormulations
Interaction forces
Gas–solid [49] F g s = 150 μ g ε s 2 / ( ε g d s 2 ) + 1.75 ε s ρ g u s u g / d s u s u g
Liquid–gas [50] F l , d g = 1 2 C DG A g-l ρ g u g u ¯ l u g u ¯ l
Liquid–solid [50] F l , d   s = 1 2 C DS A s-l ρ l u ¯ l u ¯ l
Gas diffusion coefficients [51] R e g     8 ;   P e g , rad = 8 ,   P e g , axis = 2.0
R e g   <   8 ;   P e g , rad   =   Re g ,   P e g , axis = 0.25 R e g
Conductivity
Gas [51] k gn = c p ρ D gn e
Solid [51] k se e = ( 1 ε g ) / ( 1 / k s +   1 / k s e ) + ε g k s e   and   k s e = 2.29   ×   1 0 7 d s T s 3
Liquid [52] k l = 0.0158 T l   for   HM ,   and   k l = 0.57   for   slag
Heat transfer coefficients
Gas–solid [53] h gs = k g / d s 2.0 + 0.39 R e gs 0.5 P r g 0.333   and   P r g =   c p g μ g / k g
Gas–liquid [52] E gl = 4.18   ×   1 0 4 ε g ρ g u g c p g ε l ρ l u l 0.35 Re gl 0.37 S c g / P r g 0.667 T l T g
Solid–liquid [53] h sl =   1 / 1 / h s + 1 / h l ,   h s = 2 k s c p s ρ s u ~ l u ~ s / π d s
h l = 2 k l d s R e sl P r l / 1.55 P r l + 3.09 0.372 0.15 P r l
where ,   R e sl = ϕ s d s ρ l u ~ l u ~ s / μ l   and   P r l =   c p l μ l / k l
Table 3. Chemical reactions considered in the present model.
ItemsFormulations
F e 2 O 3 ( s )   +   C O ( g ) F e ( s )   +   C O 2 ( g ) [54] R 1 * = 12 ξ ore ε ore P ( y CO y CO * ) / ( 8.314 T s ) d ore 2 / D g , CO e ( 1 f o ) 1 3 1 + d ore [ k 1 ( 1 + 1 / K 1 ) ] 1
Fe O ( l )   +   C ( s ) F e ( l )   +   C O ( g ) [51] R 2 * = k 2 ( A c / V B ) a FeO
C ( s )   +   C O 2 ( g ) 2 C O ( g ) [54] R 3   * = 6 ξ coke ε coke p y C O 2 / 8.314 T s d coke / k f + 6 / ρ coke E f k 3
Fe O ( s ) Fe O ( l ) [53]
Flu x ( s ) Sla g ( l )
R 4 * = T i   T min , s m T max , s m T min , s m 0 1 ω sm u i ρ i ε i dA M sm Vo l cell
F e 2 O 3 ( s )   +   H 2 ( g ) Fe ( s )   +   H 2 O ( g ) [51] R 5 * = π d ore 2 ϕ ore 1 N ore 273 P ( y H 2 y H 2 * ) / ( 22.4 T s ) 1 k f 5 +   ( d ore 2 ) ( 1 f o ) 1 3 1 / D s 5 + [ ( 1 f o ) 2 3 k 5 ( 1 + 1 / K 5 ) ] 1
C ( s )   +   H 2 O ( g ) C O ( g )   +   H 2 ( g ) [51] R 6 * = π d coke 2 ϕ coke 1 N coke 273 P y H 2 / 22.4 T s 1 / k f 6 + 6 / d coke ρ coke E f k 6
C O ( g )   +   H 2 O ( g ) C O 2 ( g )   +   H 2 ( g ) [51] R 7 * = 7.29   ×   1 0 11 ( y CO ) 1 2 ( y H 2 O ) ( P / T gas ) 3 2 ε exp ( 67300 / ( R T g ) ) 1 + 14.158 y H 2 P T g 1.386   ×   1 0 10 ( y C O 2 ) ( y H 2 ) 1 2 ( P / T gas ) 3 2 ε exp ( 57000 / ( R T g ) ) 1 + 4.24 y CO P T g
Si O 2 ( l )   +   2 C Si   +   2 C O ( g ) [51]
Si O 2 ( l )   +   2 C ( l ) S i ( l )   +   2 C O ( g )
R 8 * = k 8 ( A c / V B ) C Si O 2 ;   k 8 = 7.59   ×   1 0 4 exp ( 62870 / ( R T s ) )
Table 4. Constant simulation conditions considered in the present study.
VariablesValues
Gas phase
Inlet oxygen content, %100
Inlet oxygen temperature, K298
Inlet oxygen flow rate, Nm3/s5.0
Top pressure, kPa188
Solid phase
Ore components, mass fraction, %Fe2O3 74.55; FeO 7.67; CaO 7.86; MgO 1.40; SiO2 6.61; Al2O3 1.00; MnO 0.34; P2O5 0.57
Average ore particle size, mm15.52
Coke components, mass fraction, %C 86.31; S 0.44; H 0.44; N 0.44; Ash 12.37
Average coke particle size, mm42.10
Flux components, mass fraction, %CaO 1.87; MgO 1.82; SiO2 52.38; Al2O3 14.64; CaCO3 14.64; MgCO3 14.65
Ore voidage0.403 (100dore)0.14
Coke voidage0.153log dcoke + 0.742
Ore batch weight, t11.1
RDI value of iron ore20
Burden temperature, K298
Powder phase
Pulverized coal, kg/tHM200
Coal components, mass fraction, %C 78.30; H 3.64; O 5.50; N 1.07; S 0.46; H2O 3.84; Ash 9.84
Disclaimer/Publisher’s Note: The statements, opinions and data contained in all publications are solely those of the individual author(s) and contributor(s) and not of MDPI and/or the editor(s). MDPI and/or the editor(s) disclaim responsibility for any injury to people or property resulting from any ideas, methods, instructions or products referred to in the content.