1. Introduction
Laser powder bed fusion (L-PBF) is an additive manufacturing technique that employs high-power lasers to melt metallic powders into three-dimensional objects [
1]. The quality of L-PBF parts is affected by various process parameters, including laser power (P), scanning speed (V), hatch spacing (h), and layer thickness (t) [
2,
3]. These parameters can be combined into a single indicator known as volume energy density (
EV) [
4]:
Microstructural defects, such as gas and lack-of-fusion pores, significantly influence the mechanical properties of L-PBF parts [
2,
5]. While optimizing parameters can reduce porosity, achieving the desired microstructure, strength, and ductility simultaneously remains challenging [
5,
6,
7]. Additionally, reducing porosity may slow production speed [
5,
8].
The quality of L-PBF materials is determined by both porosity and mechanical properties, including yield strength (
σ0.2), ultimate tensile strength (
σv), and elongation at break (
δ). Optimizing these characteristics often requires trade-offs due to the varying importance of product requirements. Furthermore, the relationship between mechanical properties and microstructural defects can be weak or negative [
9]. Most studies focus on optimizing a single characteristic, with limited research on simultaneous optimization of multiple properties, presenting a significant challenge [
9,
10,
11,
12].
To determine optimal processing parameters, AM models and design-of-experiments (DoE) methods are essential. The literature reveals many studies on design-of-experiments (DoE) methods (e.g., Taguchi, half-factorial, central composite) and analysis of variance (ANOVA) for defining important parameters [
13,
14,
15,
16,
17,
18,
19,
20,
21,
22,
23,
24,
25,
26,
27,
28,
29,
30,
31,
32,
33,
34]. Full factorial DoE involves equal replicates for all combinations of processing parameters, allowing precise responses for parameter effects and interactions [
13]. However, full factorial DoE can be costly and time-consuming [
14], necessitating fractional factorial DoE methods like Taguchi, which efficiently analyzes significant parameter interactions and main effects [
15]. Taguchi offers a systematic approach to optimizing designs for quality and cost using orthogonal arrays [
16]. The Taguchi method aims to optimize parameters for metal additive manufacturing, particularly directed energy deposition (DED), to reduce deviations and achieve target output values [
17,
18,
19,
20,
21,
22]. Manjunath et al. [
18] optimized DED using the Taguchi L9 orthogonal design, achieving optimal interfacial adhesion with Colmonoy 52 alloy. Liu et al. [
17] employed the L25 design to maximize density in AlSi10Mg parts by optimizing laser power, scanning speed, powder feed rate, and shielding gas flow. The method has been applied to various materials, including titanium alloys [
19,
20], nickel-based superalloys [
21], and others. Key findings include the important influence of layer thickness and scanning speed on hardness and surface roughness [
22] The response surface method (RSM) improves stochastic response values through design-of-experiments (DoE) and regression analysis [
23]. Dada et al. [
24] used full-factor DoE with RSM for L-PBF high-entropy alloys, while Pant et al. [
25] modeled the DED process of 316L stainless steel with RSM. El-Sayed et al. [
26] proposed optimal parameters for Ti-6Al-4V medical implants, concluding that higher density reduces surface roughness and porosity. Marmarelis et al. [
27] combined Taguchi and RSM to study the effects of processing parameters on AlSi10Mg specimens, identifying hatch spacing as a significant factor.
Grey relational analysis (GRA) is often used alongside Taguchi’s method for multi-response and multifactor experiments. When an optimization problem involves multiple conflicting criteria, GRA can help to prioritize and weigh these criteria in order to find a balanced solution [
28,
29,
30].
The impact of factors (independent parameters) on quality indicators is multidirectional. Therefore, the problem of optimizing technological modes is multifactorial and multi-criteria [
31]. One method for solving such an optimization problem is linear programming. The idea behind this method is that, in order to reduce the dimensionality of the problem, a target function is formed from a linear combination of the optimization criteria. Furthermore, a constraint matrix consisting of inequalities is formed, including these criteria and the optimization parameters [
32]. The linear programming method, due to its specificity—and linearity—shows good results near the vector of optimal process parameters. Accordingly, its efficiency depends on the type of target function that includes the required optimization criteria, i.e., the target design parameters or, in other words, its quality characteristics. The present study aims to develop a linear programming method for optimizing L-PBF parameters and justify the type of target function that is resistant to variation in the factors affecting the criteria. To this end, Taguchi’s approach is supposed to be used.
The variability of additive manufacturing is due to the significant number of factors that influence growing conditions, which results in a decrease in the quality of parts.
Taguchi pointed out that excessive variation in quality indicators is the root cause of poor quality. In other words, he emphasized the importance of reducing process variability relative to design parameters and of bringing the average values of process parameters to target values [
33,
34]. A quality loss function is used to quantify the quality loss, which depends on the mean square deviation
and the deviation of the product characteristic
from the target value
:
where
is the difference between average and target value;
is the variation characteristic, i.e., noise;
is the quality loss impact factor.
Taguchi suggests that reducing the variation in product characteristics relative to their mean values will reduce quality losses. This reduction in variation is achieved by adjusting the mean value relative to the target value using a correction factor:
where
is the signal-to-noise ratio indicator.
The signal-to-noise ratio depends on the quality characteristics that need to be optimized during the experiment (see [
33]).
- (a)
Taguchi used the logarithmic scale in decibels (dB) because this scale is the standard for most acoustic, radio, etc. measurements. It provides a uniform and comprehensible means of expressing and comparing parameter ratios.
- (b)
It should also be noted that the logarithmic scale has the property of large negative values when the argument of the function becomes less than 1, which is very convenient when the argument of the logarithmic function is used as a constraint, for example, .
In the generalizable target function, the quality characteristics and the process parameters should be represented in dimensionless form. This recommendation can also be referred to as a constraint. In this vein, we can introduce the concept of a safety factor to define the limits of deviations from quality targets. A similar approach is used in our structural analysis, where the margin of safety (MoS or MS) is defined.
The
MS is a measure of satisfying design requirements (requirement verification). The margin of safety can be conceptualized to represent how much of the structure’s total capability is held “in reserve” during loading.
MS is a measure of structural capability; this definition of the margin of safetycommonly seen in textbooks [
35,
36] describes what additional load (beyond the design load) a part can withstand before failing. In effect, it is a measure of excess capability.
MS is a measure of requirement verification; any agencies and organizations such as National Aeronautics and Space Administration (NASA) [
37] and American Institute of Aeronautics and Astronautics (AIAA) [
38] define the margin of safety including the design factor. In other words, the margin of safety is calculated after applying the design factor. In the case of a margin of 0, the part is at exactly the required strength (that is, the safety factor would equal the design factor).
Clearly, the concept of MS as a measure of requirement verification can be extended to any relevant quality characteristic (or design factor).
The present study solves the following problems in such a formulation:
Development of a framework for multi-criteria optimization of additive manufacturing technological parameters using formalized quality indicators.
Approval of the developed framework for multi-criteria optimization of technological parameters for L-PBF AISI 321 under conditions of increased variability.
The general strategy of the study is as follows:
Design of experiments (DoE) is performed using the Taguchi plan, with mechanical characteristics and surface roughness as the dependent variables, to identify target process parameters and investigate process variability.
If the Taguchi method cannot identify the target process parameters due to high variability, GRA is used to select one of the process parameters from the DoE results and designate it a target value.
Constraints and a target function are formed using margins of safety and previously obtained target values for design parameters.
The optimal L-PBF parameters are sought using the linear programming method with the target function, and the constraint matrix is formed in terms of the margins of safety.
2. Theoretical Foundations of the Optimization Method and Models
According to the technical requirements for the workpieces, a set of design factors (5) are established. These factors may include tensile strength, surface roughness, residual porosity and other parameters.
Suppose that, as a result of the technological process, we obtain a workpiece characterized by a set of technological quality parameters.
Let us apply the concepts of design factor and margin of safety to other quality parameters, as well as to structural analysis. Assuming that the workpiece meets the technical requirements and is therefore considered to be of good quality, the margin of safety for each factor must be greater than 0, in accordance with the following relationship (7):
Next, based on Taguchi’s approach, we introduce the reward function (RF), which is essentially the opposite of QLF and should increase if the margin of safety increases.
Using the property of the logarithmic function to decrease sharply at values of the argument less than 1,
RF can be represented as a value proportional to the logarithm of
MS + 1.
is the coefficient of influence of the
i-th quality parameter, and
is the offset margin of safety.
When , also takes on a nominal value of Ki, and ki is the influence coefficient of the i-th quality characteristic.
Analysis of (9) shows that as we approach the zero critical value, the reward function decreases sharply due to an increase in process variability.
Based on Equation (1), it is clear that the reward function
for the
i-th quality parameter depends on laser power (
P), scanning speed (
V), hatch spacing (
h), and layer thickness (
t).
Let us decompose the functional dependence (10) into a Taylor series with respect to the nominal (‘target’) state
, retaining the first terms of the series. This represents the linear Equation (11) in the parameter plane.
The coefficients characterize the RF trend in relation to the variation of the factors and determine the inclination angles of the parameter plane (11) to the axes of the dimensionless parameters .
Taking dependencies (9)–(11) into account, the reward function for the quality parameter
i can be defined as follows:
In this case, the offset margin of safety for quality indicator
i will depend on the following:
Consider the following quality parameters and their limitations.
an offset margin of safety in terms of performance:
with lower limit ;
an offset margin of safety in terms of tensile strength
with lower limit ;
an offset margin of safety in terms of relative elongation
with lower limit ;
an offset margin of safety in terms of surface roughness
with upper limit .
Following the principle of additivity, the total reward function can be expressed as follows:
where
is the significance coefficient of the
i-th quality parameter, which takes a value from 0 to 1 and can be determined by expert judgement depending on the requirements of the workpiece.
Considering (12) to (17), the result dependency (18) is expressed as follows:
In accordance with the quality management objective, the total reward function should be set up to maximize, as follows:
The dependencies from (13) to (17) can be expressed in matrix form by taking the logarithm of the left and right sides of these inequalities, respectively.
In this case,
where
is the matrix of coefficients of influence of technological parameters;
is the vector of variables; and
is the constraint vector.
The objective functions (19) and (20) can be expressed in matrix form as follows:
where
is the vector of the significance coefficients of quality parameters.
The target function in the form of (23) and the constraints in the form of the inequalities in (22) represent the optimization problem, which is solved using the linear programming method. The dependencies obtained in (22) and (23) are defined in the form of a classical direct linear programming problem, in which the maximum total reward is sought, as the technological parameters vary within (24).
Taking (24) and the matrix notation of (22) into account, the latter can be written in the extended form (25):
where the expanded matrices are of the following form:
Thus, the objective function (23) and inequalities (26) correspond to the formulation of the linear programming optimization problem.
5. Discussion
The optimization technique described above has been tested. It is designed around the proposed multi-criteria optimization parameters, which are the logarithms of the safety margins from quality characteristics. It reduces process variability by redefining process parameters within a limited search area. This approach is similar to Taguchi’s approach, which is based on estimating quality losses according to mean square deviation and the deviation of product characteristics from the target value.
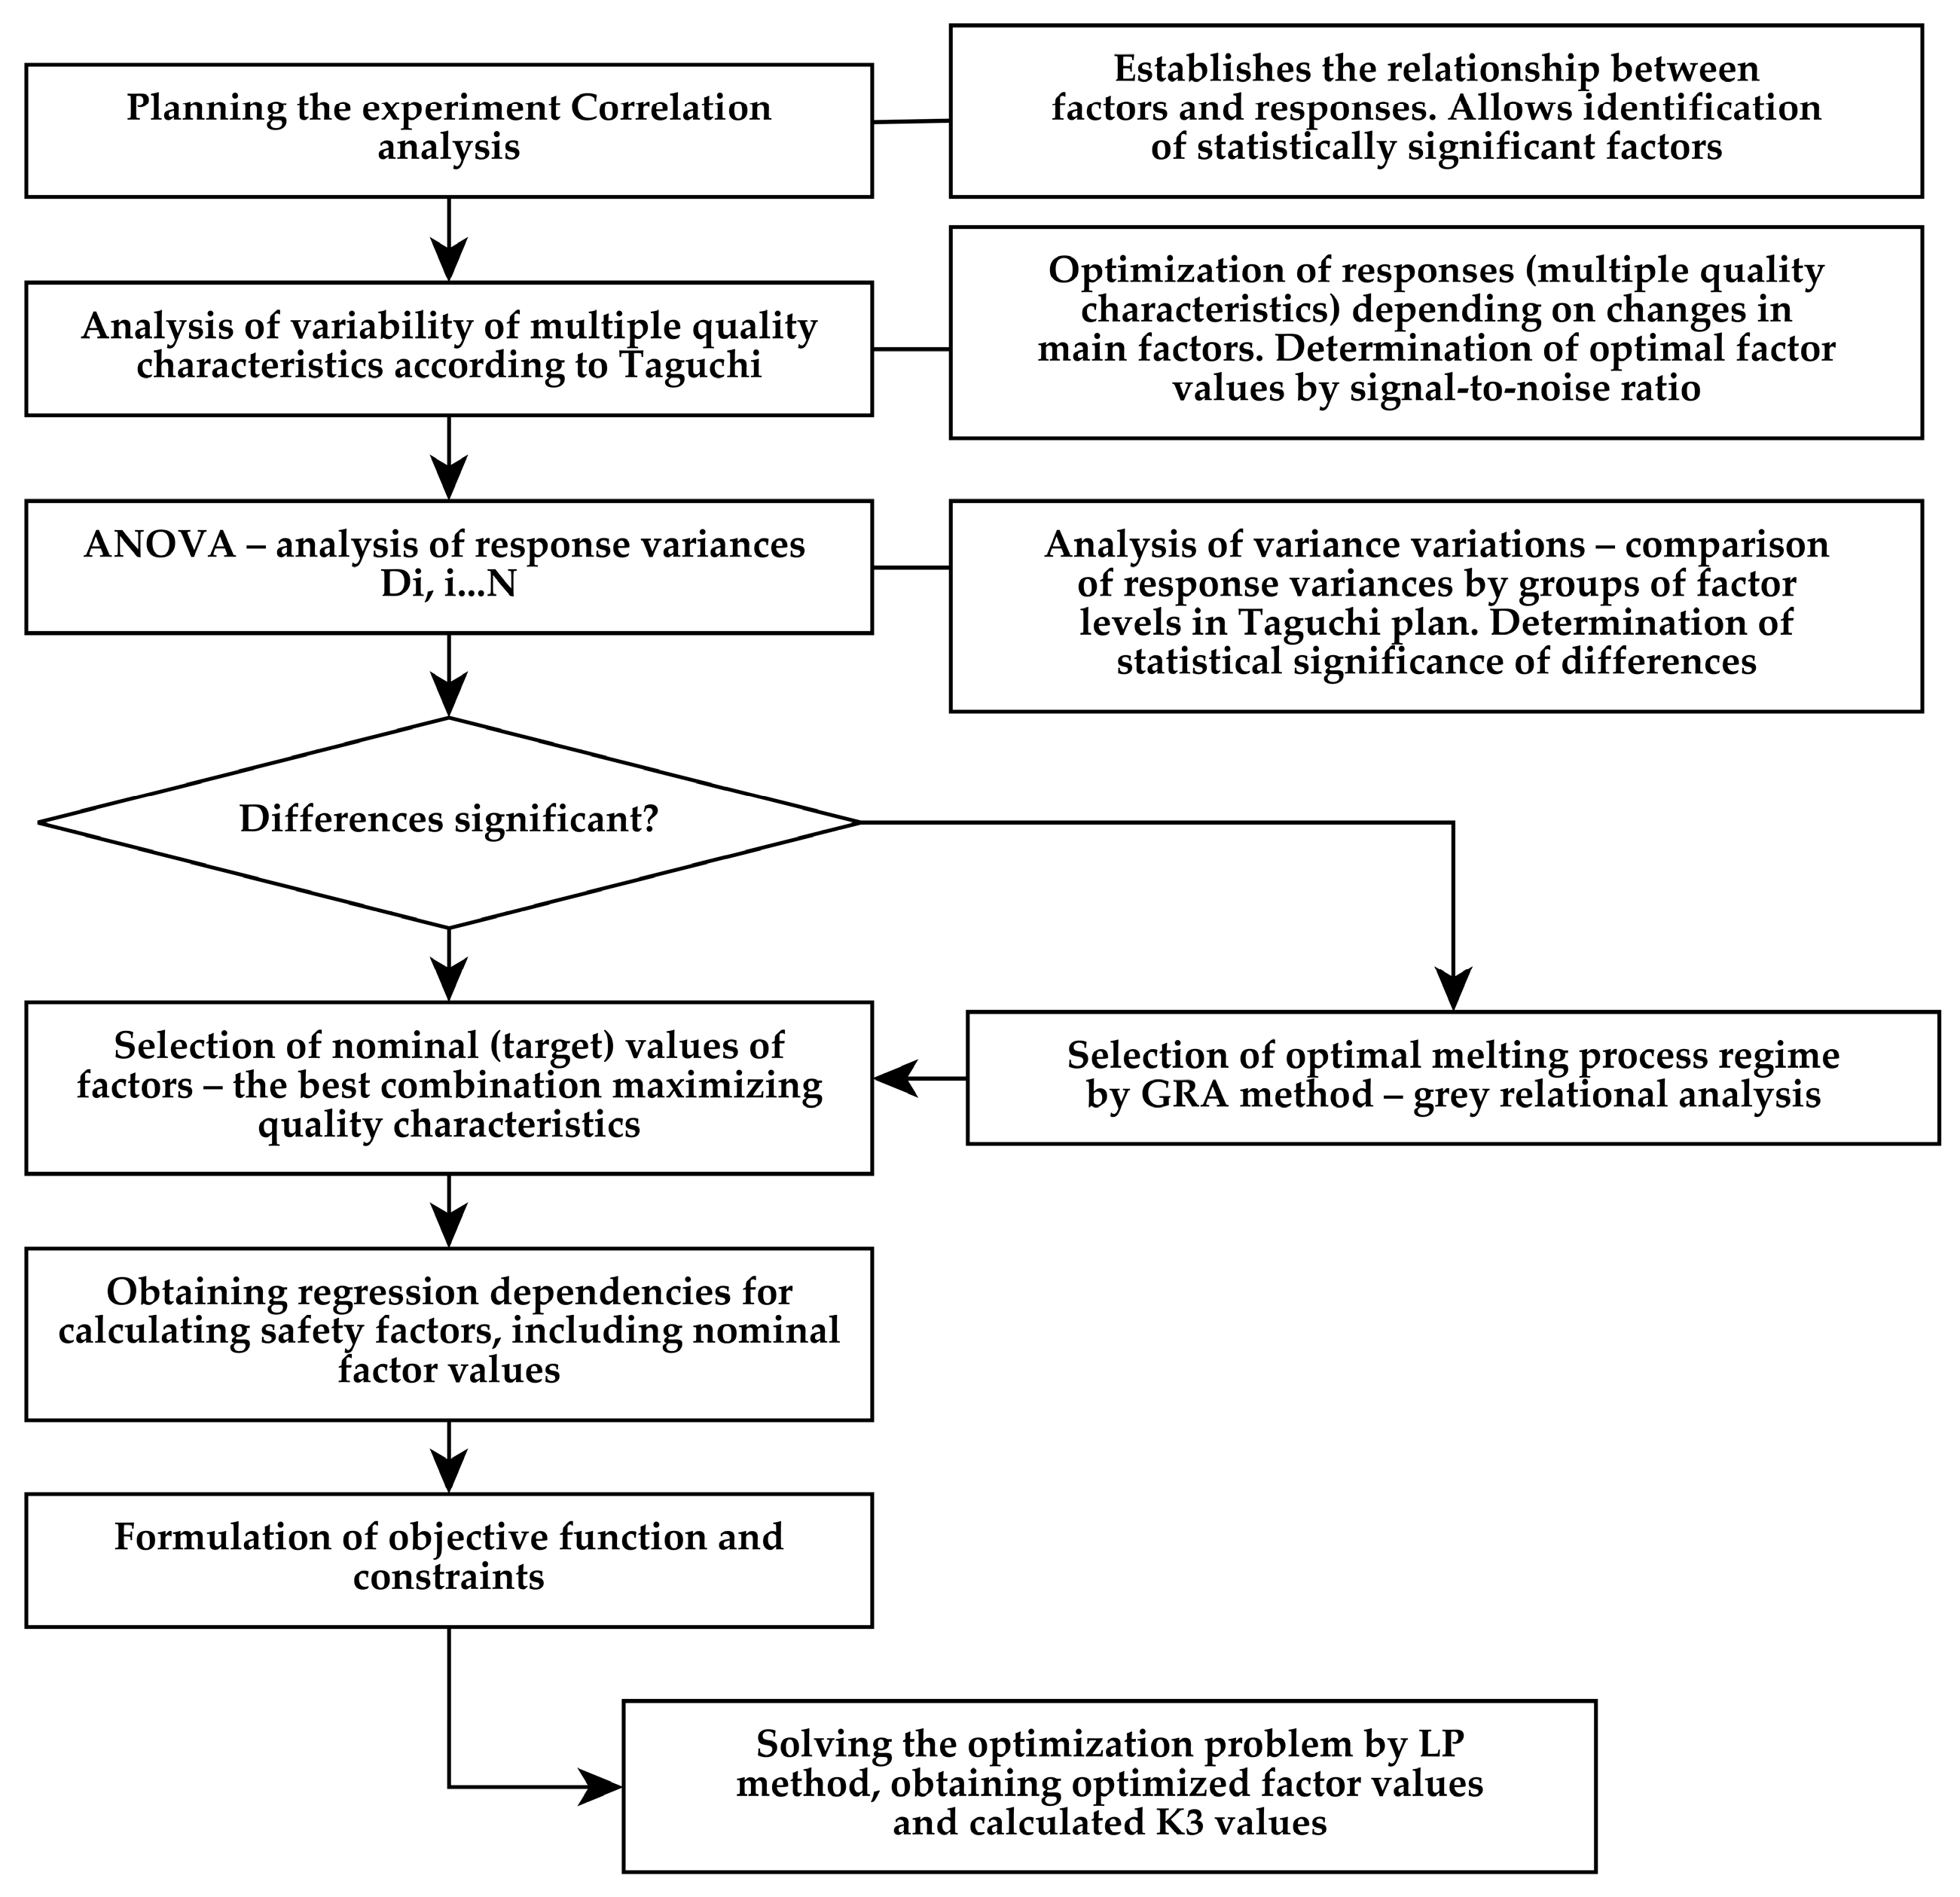
The solution scheme of the aforementioned optimization problem is presented in
Figure 6.
This study uses orthogonal Taguchi DoE and the Taguchi method itself in the first stage. The main objective of this stage is to determine the target process parameters, which will be used for further optimization. According to Taguchi principles, only the influence of the independent factors (i.e., the process parameters) is considered; the pairwise interactions of the factors and the higher-order interactions are not taken into account. If the process variability is high, as an analysis of variance (ANOVA) of the results of the first stage shows, it is statistically unreliable to consider the responses of the process to be a result of the independent factors. In this case, the optimal values of the process parameters, obtained by maximizing the S/N ratio, are not statistically reliable.
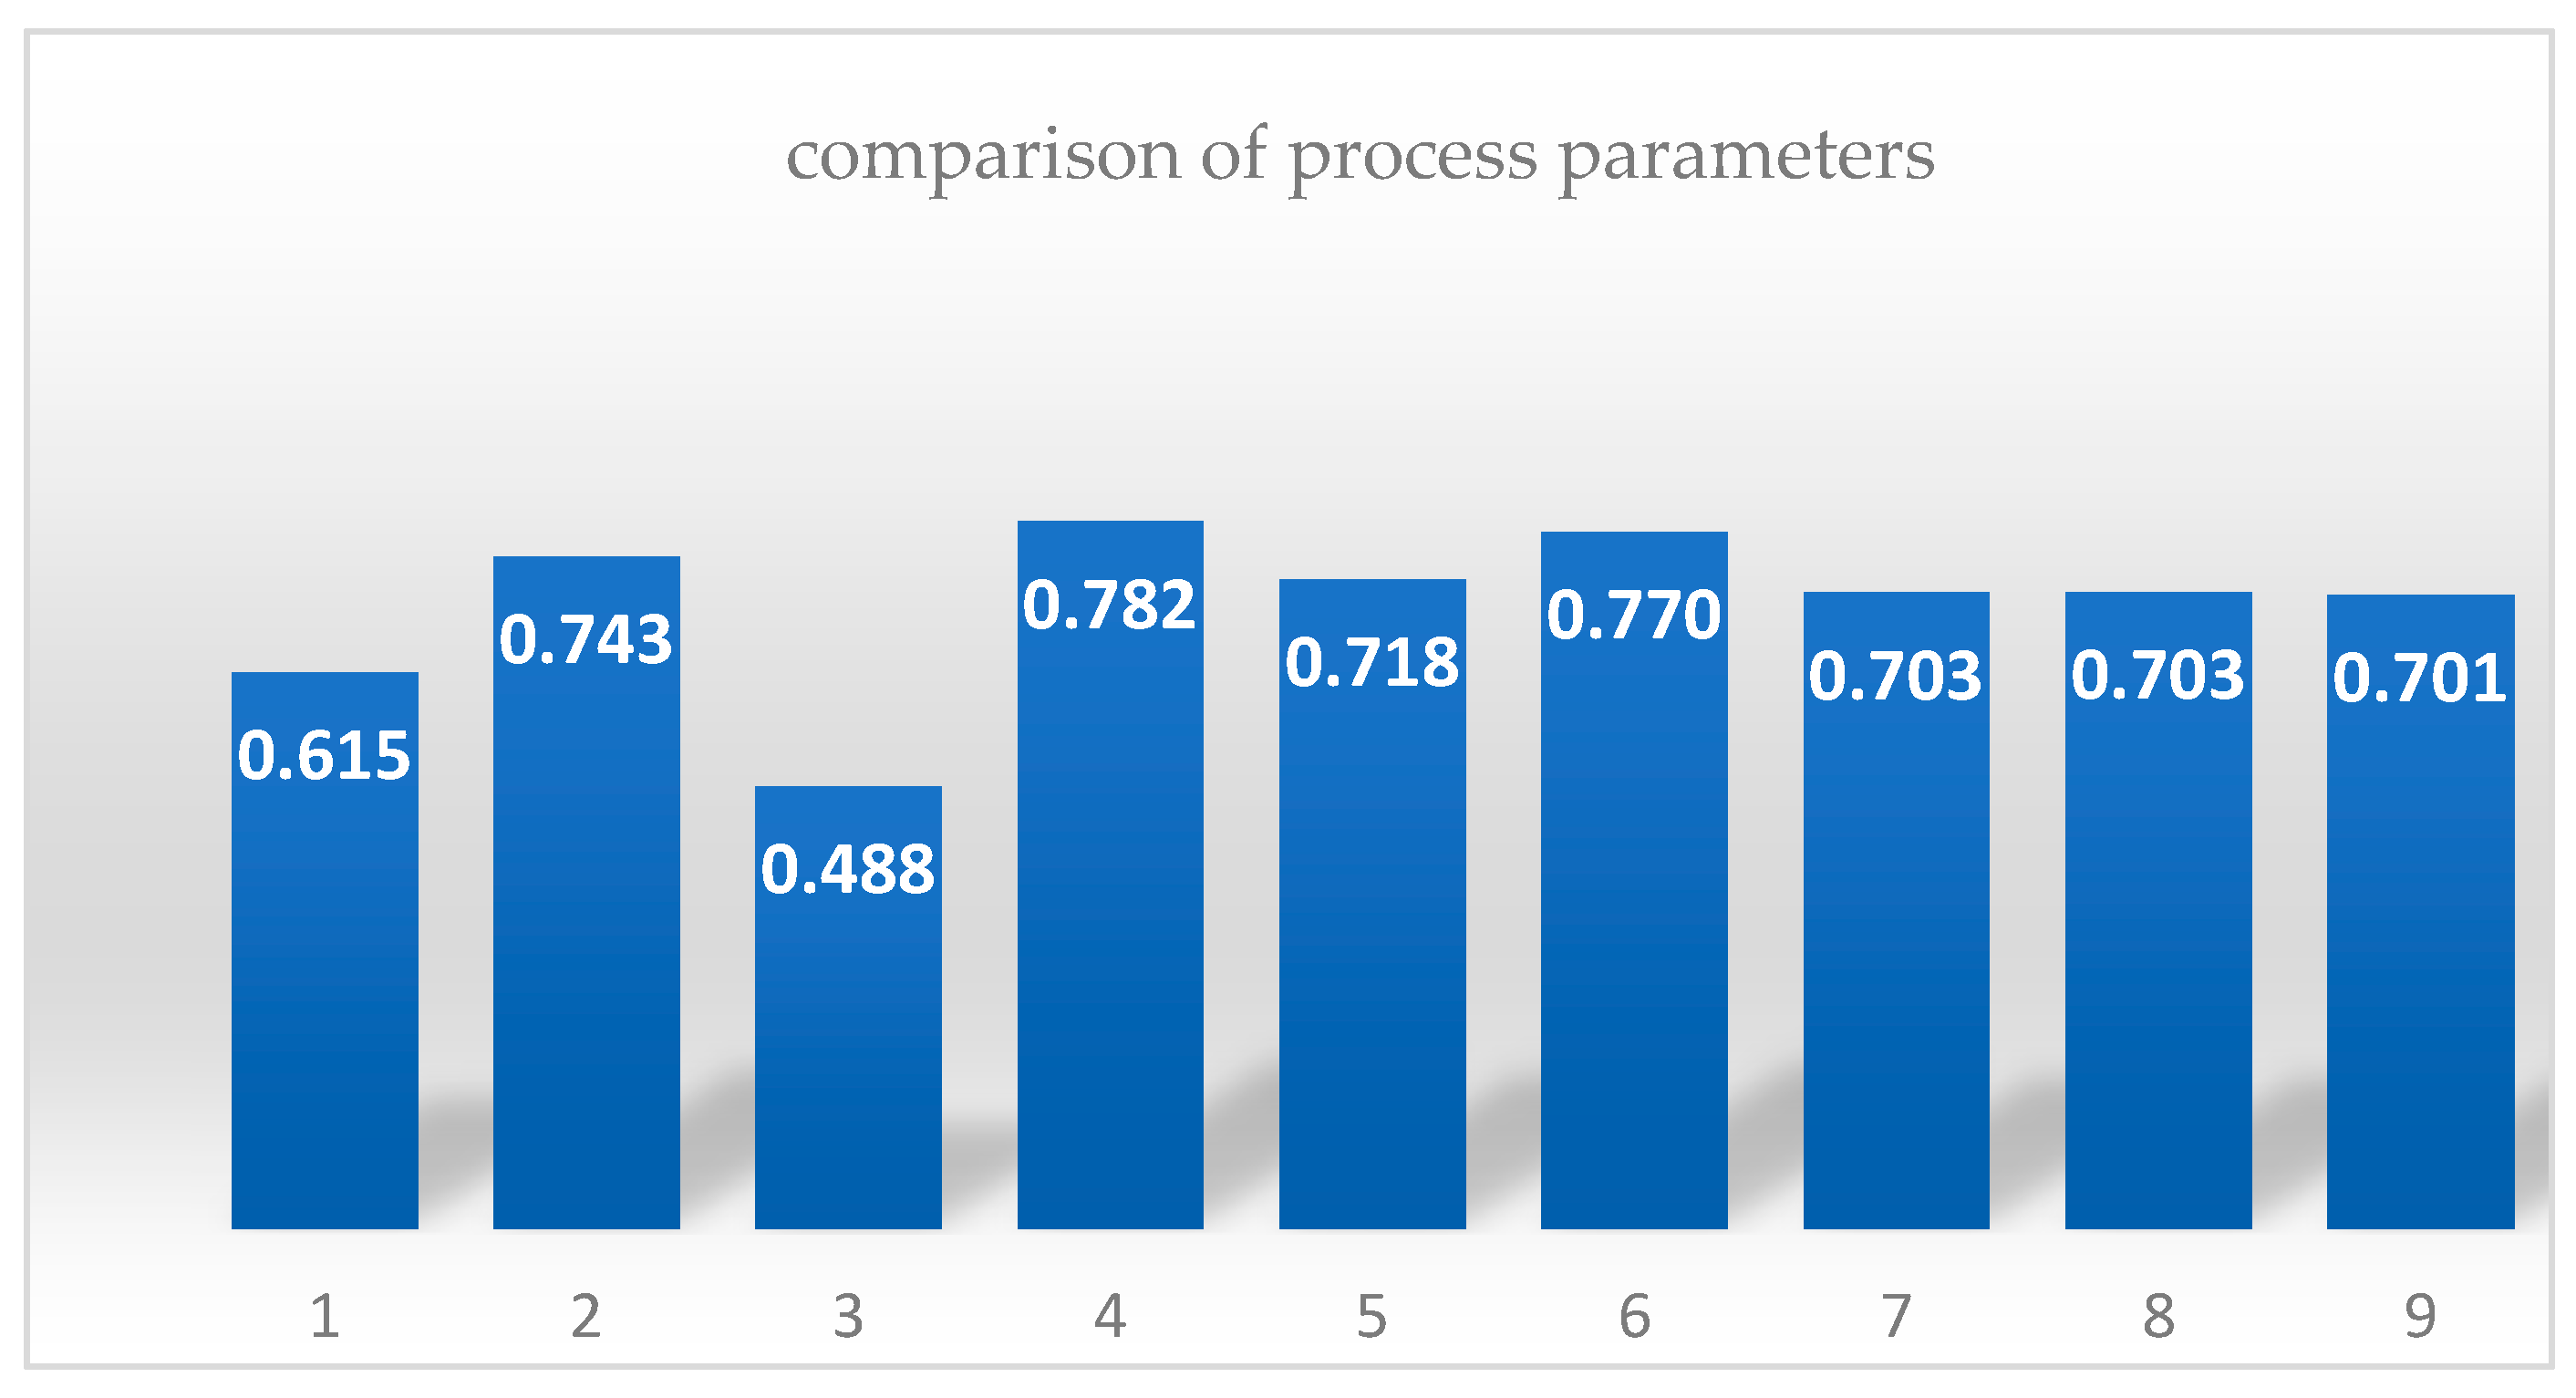
Instead, the process mode is selected from the experimental plan whose responses correspond to the target function as closely as possible. The Grey relational analysis (GRA) method can be used for this purpose.
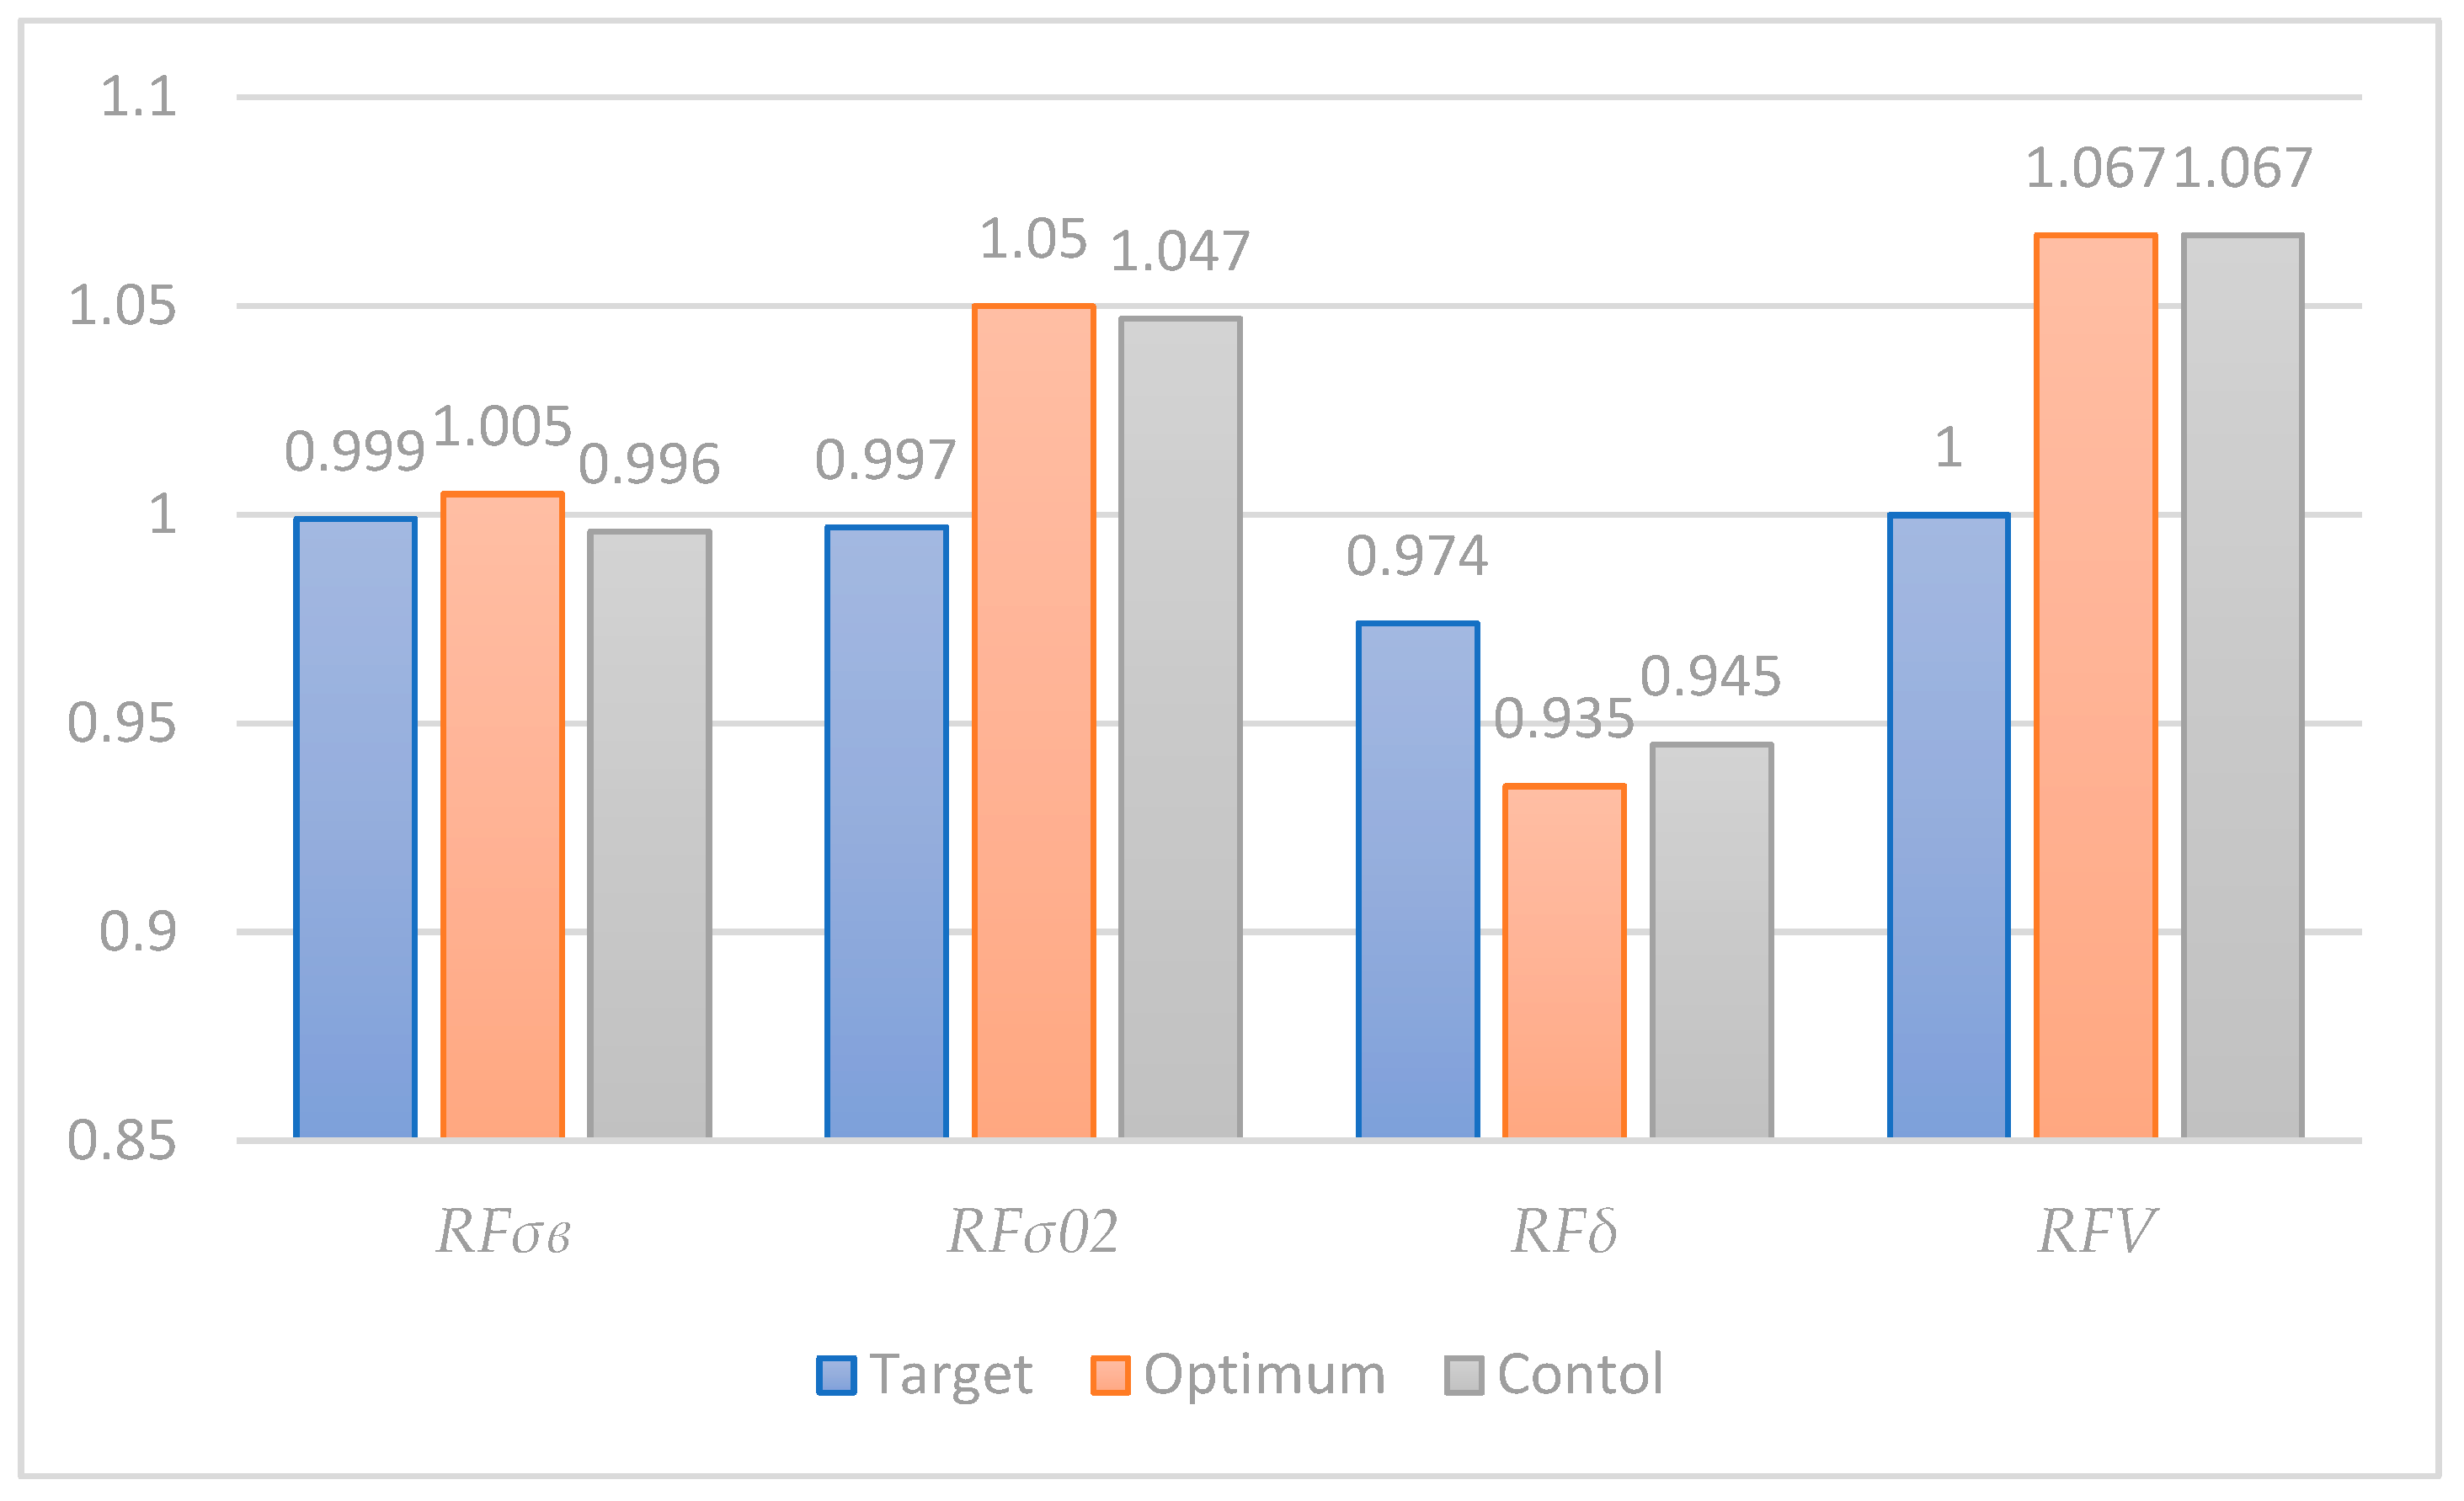
Analysis of the results of verification experiments according to the data in
Table 11 shows that the parameters of the optimized alloying process provide samples with mechanical properties that are not inferior to those obtained using the target process parameters (T), with a tensile strength that exceeds the latter by 5% and a conditional yield strength that exceeds the latter by 5%.
Despite the fact that the ductility of the samples was 4% lower than the ductility of the samples fused at the nominal mode, a 6.7% increase in process productivity was achieved by increasing layer thickness. This fact allows us to state that the optimization objective was achieved.
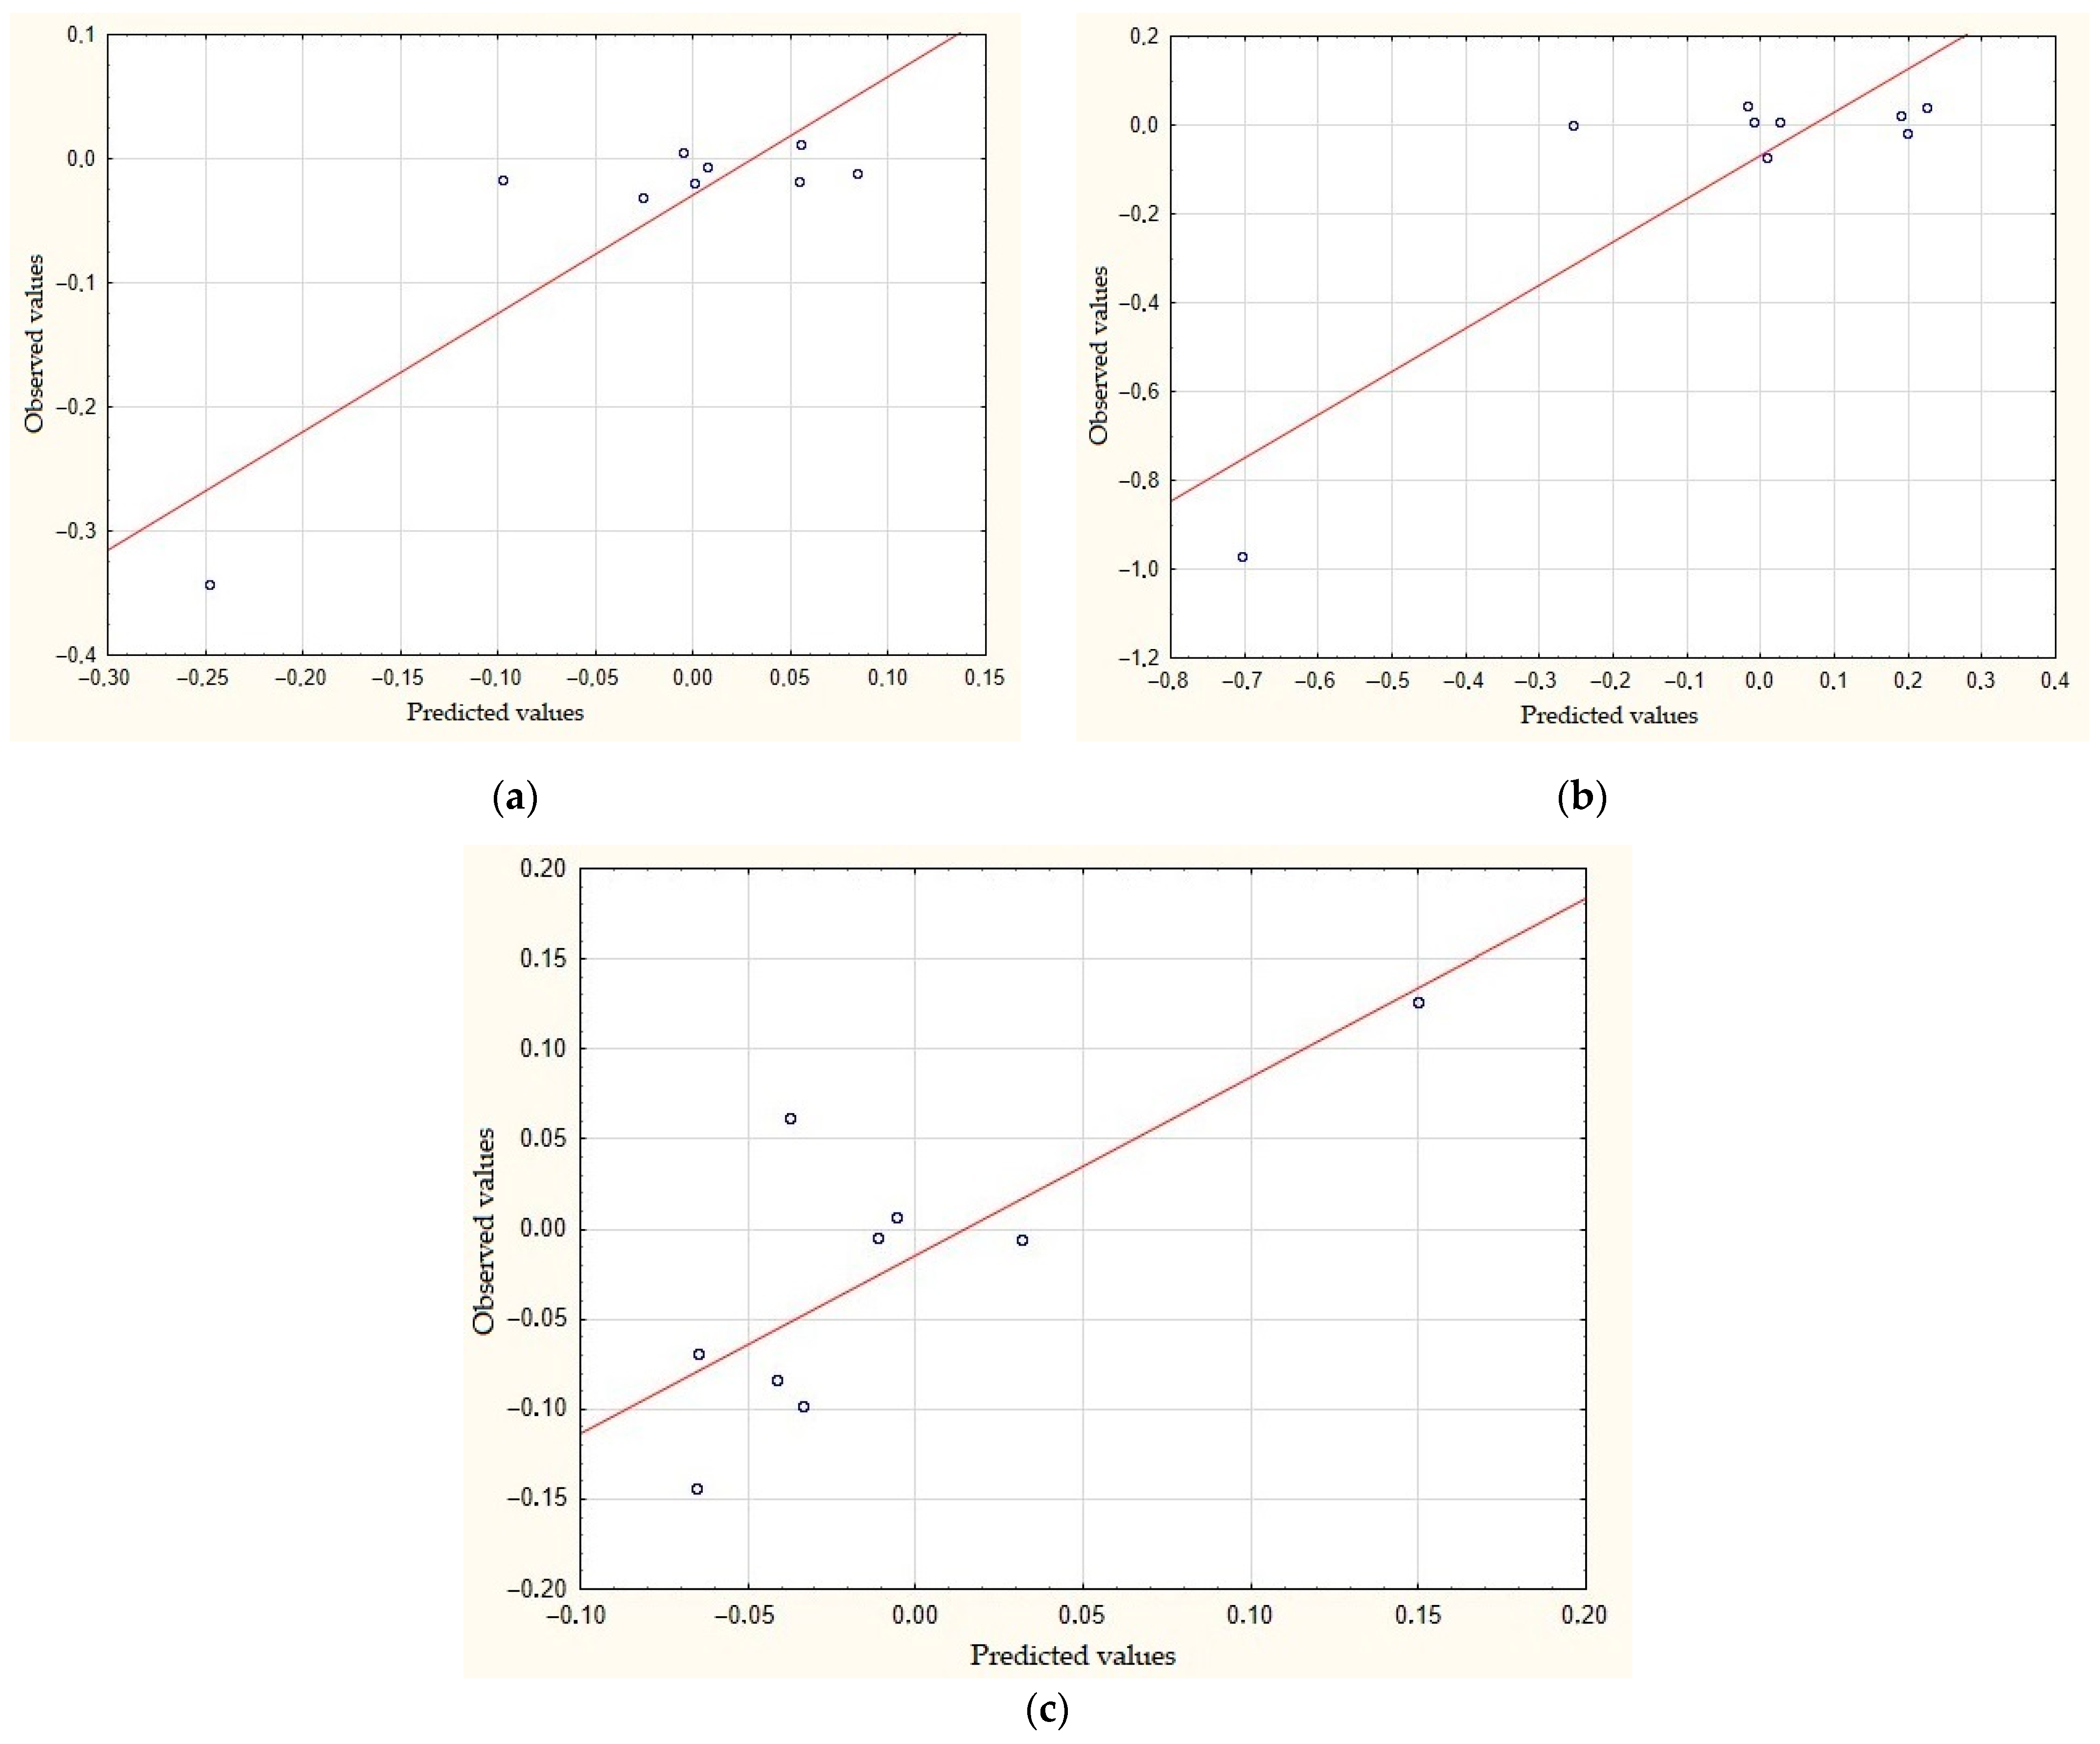
The key result achieved as a result of the optimization is a significant reduction in process variability. Thus, the RMS for tensile strength decreased by nine times, for conditional yield strength by ten times, for relative elongation by two times. The reduction in RMS as a parameter was not included directly in the target function of the optimization process. At the same time, the reward functions, which are defined as logarithms of the shifted margins of safety, are additively included in the target function. If there is an increase in process variability, i.e., a decrease in MS relative to the response for the target process parameters, then the corresponding RF reward function and the target function decrease sharply near zero with negative values of the logarithm in RF.
This can clearly be seen if we consider the
RF dependence plots (21), for which the constants were found from nonequalities (34) in the form of a comparison between the predicted and observed values of dependence (see
Figure 7).
Indeed, according to Taguchi’s calculations of the signal-to-noise (S/N) ratio, the area of technological parameters within the following boundaries corresponds to the area of stable S/N ratio values: power (W) [229–257], laser beam speed (mm/s) [750–800], and scanning step (mm) [0.065–0.09]. The optimized values of the technological parameters fall inside this stable range.
