Article

Anodizing 3D-Printed AlSi10Mg Alloy and Its Fatigue Properties

1
Yamaha Motor Co., Ltd., 2500 Shingai, Iwata 438-8501, Japan
2
Industrial Research Institute of Shizuoka Prefecture, 1-3-3 Shin-miyakoda, Hamana-ku, Hamamatsu 431-2103, Japan
3
OKUNO Chemical Industries Co., Ltd., 1-10-25 Hanaten-Higashi, Tsurumi-ku, Osaka 538-0044, Japan
4
Fundamental Technology for Next Generation Research Institute, Kindai University, 1 Takaya-Umenobe, Higashihiroshima 739-2116, Japan
*
Author to whom correspondence should be addressed.
Metals 2025, 15(9), 1022; https://doi.org/10.3390/met15091022
Submission received: 1 August 2025 / Revised: 2 September 2025 / Accepted: 10 September 2025 / Published: 15 September 2025
(This article belongs to the Section Additive Manufacturing)

Abstract

Two ways of anodizing 3D-printed AlSi10Mg alloy were characterized, and then their fatigue properties were evaluated. Test specimens were fabricated via a laser-powder bed fusion (L-PBF) process followed by machining. Normal and hard anodizing were both conducted in a sulfuric acid bath. The anodized layer was observed using FE-SEM/EDS. Fine Si particles dispersed in the matrix showing web-like patterns were incorporated in the anodized layer. By etching the Si particles away with Keller’s reagent, a characteristic maze-like 3D structure of anodized Al was observed. Then, rotating bending fatigue tests were carried out to evaluate the fatigue strength at 107 cycles. The fatigue strength of the as-machined, normal-anodized and hard-anodized specimens was 106, 100 and 95 MPa, respectively. The fatigue limits were proportional to the surface roughness with higher linearity. By reducing the surface roughness, the fatigue strength of the hard-anodized specimen was improved. This result demonstrates the possibility of improving the fatigue properties of anodized components by reducing their surface roughness. Lastly, a CASS (copper-accelerated acetic acid salt spray) test was conducted, and superior corrosion resistance of the normal- and hard-anodized layers was verified.

1. Introduction

Additive manufacturing, also known as 3D printing, is defined as “the process of joining materials to make parts from 3D model data, usually layer upon layer, as opposed to subtractive manufacturing and formative manufacturing methodologies” (ISO/ASTM 52900:2021). In the area of 3D printing, several kinds of printing methods exist such as powder bed fusion (PBF), Direct Energy Deposition (DED), Binder Jetting (BJT) and so on. Among these printing methods, laser-powder bed fusion (L-PBF) is the most widespread printing process at the current moment. L-PBF can be applied to several kinds of materials such as stainless steels, tool steels, titanium alloys and aluminum alloys. In the aluminum alloy family, Al-10wt%Si-0.4Mg alloy (AlSi10Mg) is the most widely used material for L-PBF.
L-PBF AlSi10Mg alloy is frequently used for lightweight structural components [1,2]. In this use case, higher mechanical properties and reliability are required for the components. Also, corrosion-resistant characteristics are required on some occasions, such as in a (salt) water environment, in which marine products are used. Conventionally, anodizing has been widely applied for casting or forging Al components to enhance corrosion resistance. So, it is quite important to understand the mechanical properties, especially the fatigue properties, of anodized L-PBF AlSi10Mg alloy when the adaptation of L-PBF AlSi10Mg alloy into some actual lightweight components is considered.
Until now, a lot of research works on L-PBF AlSi10Mg alloy were performed from the perspective of its mechanical properties [3,4], process optimization [5,6,7], structural design [8,9] and surface treatment [10,11]. The fatigue properties of L-PBF AlSi10Mg alloy were investigated by many researchers from the perspective of defects [12,13], heat treatments [14,15], surface finish [3,16], building conditions [17,18] and corrosion [19].
Fatigue strength is generally assessed by acquiring the S-N curve, which shows the relationship between stress and fatigue life (stress fatigue) [20]. Stress fatigue is the most common and widely used indicator for the estimation of the fatigue strength of the material. A typical S-N curve can be divided into three zones: a low-cycle fatigue zone, high-cycle fatigue zone and fatigue-limit zone. In the fatigue-limit zone, no failure will occur. However, it is well known that aluminum alloys have no fatigue limit, so the fatigue strength of aluminum alloys is evaluated as the fatigue strength at a specific number of cycles such as 107 cycles [for example ref. [21]. Recently, machine learning (ML) has been applied to estimate the fatigue life of additively manufactured AlSi10Mg alloy, and the results show that ML can estimate the fatigue life with an R2 of about 0.7 [22]. In the future, this kind of estimation methodology will mature, and the accuracy of the estimation will also be improved. However, it will take time for this to become a common estimation tool, as it is not at the current moment.
With regard to the type of stress fatigue test, rotating bending and uniaxial fatigue tests are widely used as common methods. In the case of the rotating bending fatigue test, the stress amplitude is at its maximum at the outer surface of the specimen; therefore, the surface condition has a more significant effect on the fatigue strength. The rotating bending fatigue test is applied in Refs. [3,12,14,18]. On the other hand, the uniaxial test with R = 0.1 is applied in Refs. [13,17], and the uniaxial test with R = −1 is applied in Refs. [15,16].
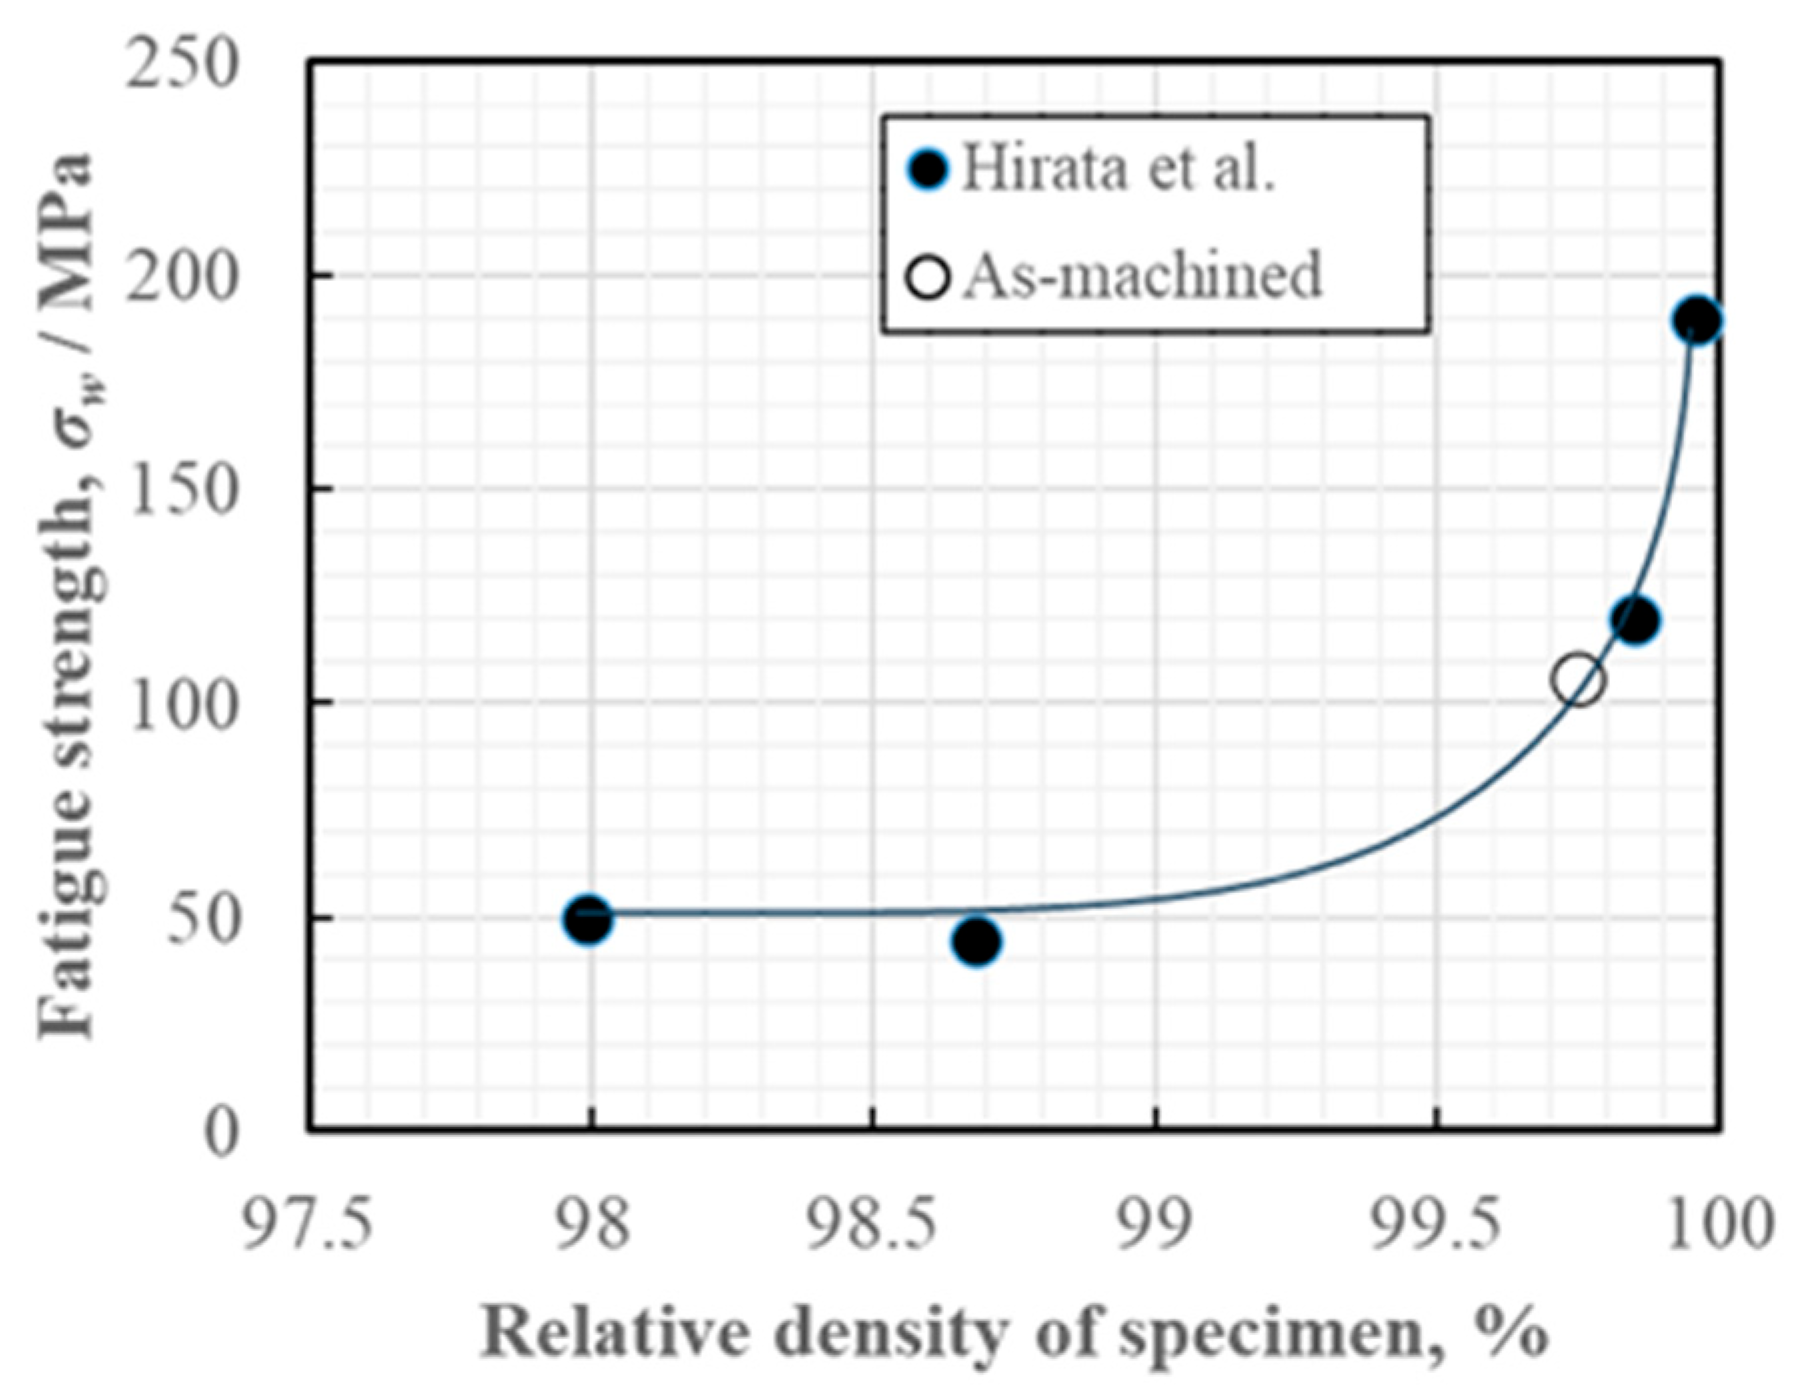
Regarding the effect of defects, it has been revealed that the number and morphology of the defects affect the fatigue strength [12,13]. Hirata et al. [12] investigated the change in fatigue strength when varying the relative density of test specimens by controlling the energy density of the L-PBF process. They revealed that the fatigue strength exponentially decreased from about 190 MPa to about 50 MPa by decreasing the relative density from the over-99.5% range to the 98–97% range. Wu et al. [12] used X-ray CT to measure the morphology and population of defects in fatigue specimens with different build directions (parallel and perpendicular to the build direction). They revealed that the fatigue strength exhibited anisotropic fatigue resistance depending on the build direction (114 MPa parallel and 45 MPa perpendicular) due to the orientation of lack-of-fusion-type defects.
With regard to the surface finish, it was revealed that the surface condition, which corresponds to the surface roughness, affects the fatigue strength. Mower and Long [3] compared the fatigue strength of as-built (surface roughness of Sa = 5 to 15 μm) and mechanically polished (Sa = 1 μm) specimens, and they showed that the fatigue strength of the mechanically polished specimen (90 MPa) was well improved compared to that of the as-built specimen (approximately 50 MPa).
Linder et al. [19] investigated the effect of corrosion on fatigue performance of L-PBF AlSi10Mg alloy using a salt spray cycle test (1% NaCl, pH 6.5–7.1). They compared the fatigue performance of machined and as-built specimens with and without the salt spray cycle test, then revealed that the corrosion pits deteriorated the fatigue performance. But, in the case of the machined specimens, the effect of corrosion on fatigue was not as significant as for the as-printed specimens due to the shallow pits of the machined specimens.
Regarding anodizing L-PBF AlSi10Mg alloy, there are some research works dealing with the anodizing process itself and characteristics of the anodized layer [10,11]. Dallari et al. [10] used hard anodizing to treat L-PBF AlSi10Mg alloy in 190 g/L H2SO4 at 0 °C, varying current density (2.5 and 4.0 A/dm2). Then, they showed that the anodizing layer had a hardness value of about 265 HV regardless of the current density. The hardness value was lower than that of typical cast alloys due to incorporation of soft secondary Si-rich phases in the anodized layer of the L-PBF specimens. Also, they evaluated the corrosion resistance of the anodized specimens using a potentiodynamic polarization technique compared to bare-cast aluminum alloys, then revealed that the anodized specimens showed superior corrosion resistance. Rubben et al. [11] investigated the effect of heat treatments on anodizing behavior. They conducted an artificial aging or a stress release treatment on L-PBF AlSi10Mg alloys followed by normal anodizing with a current density of 1 A/dm2 in 3 M (294 g/L) H2SO4 at room temperature. Through the investigation, they revealed that the microstructure of the as-built (non-heat-treated) condition had cellular aluminum cells surrounded by a continuous fibrous eutectic Si network. On the other hand, the Si network was broken into separate particles with heat treatment at 250 to 300 °C. The continuous Si network of the as-built condition was incorporated in the anodized layer and most of the Si was oxidized during the anodizing process. The separate Si particles of the heat-treated condition were also incorporated in the anodized layer, but the Si particles were oxidized only on the portion facing the oxide front. These characteristics of the metallographic features influenced the final voltage of the anodizing, where as-built > heat-treated. The reason for this is attributable to the higher voltage needed for the oxidation of the Si network.
From these previous works, the various characteristics of L-PBF AlSi10Mg alloy were investigated and clarified from the viewpoints of fatigue and anodizing, respectively. However, research works dealing with the fatigue properties of anodized L-PBF AlSi10Mg alloy have never been seen. Considering practical use cases, the fatigue properties of anodized L-PBF AlSi10Mg alloy are crucial. Therefore, in this study, two kinds of anodizing (normal and hard anodizing) were used to treat L-PBF AlSi10Mg alloy, and the anodized layer was characterized. Then, the fatigue properties of the normal- and hard-anodized layers were evaluated compared to that of an as-machined L-PBF AlSi10Mg alloy. Moreover, corrosion properties of the anodized L-PBF AlSi10Mg alloy were verified in comparison with those of the as-machined one.

2. Materials and Methods

2.1. Material

Disk-atomized AlSi10Mg powder (Toyo Aluminum K.K., Osaka, Japan) was used. The chemical composition is shown in Table 1, and the SEM image of the powder is shown in Figure 1. It shows higher sphericity and lower satellite powders. The percentile values of particle size distribution, D10, D50 and D90, are shown in Table 2, respectively. The median particle size, D50, is about 45 μm. Density values of the AlSi10Mg powder are shown in Table 3. The apparent density (measured value) was 1.44 g/cm3. Then, a packing density value of 53.9% was calculated by dividing the apparent density by the true density of AlSi10Mg alloy, 2.67 g/cm3.

2.2. Test Specimen

For fabrication of test specimens, a laser-powder bed fusion (L-PBF)-type 3D printer (SLM280, Nikon SLM Solutions, Estlandring, Luebeck, Germany), was used. In order to determine printing parameters, small cubes (10 × 10 × 10 mm) were fabricated under several energy densities E (J/mm3), using the following equation consisting of laser power P (W), scan speed v (mm/s), layer thickness t (mm) and hatch distance w (mm).
E = P/(vtw)
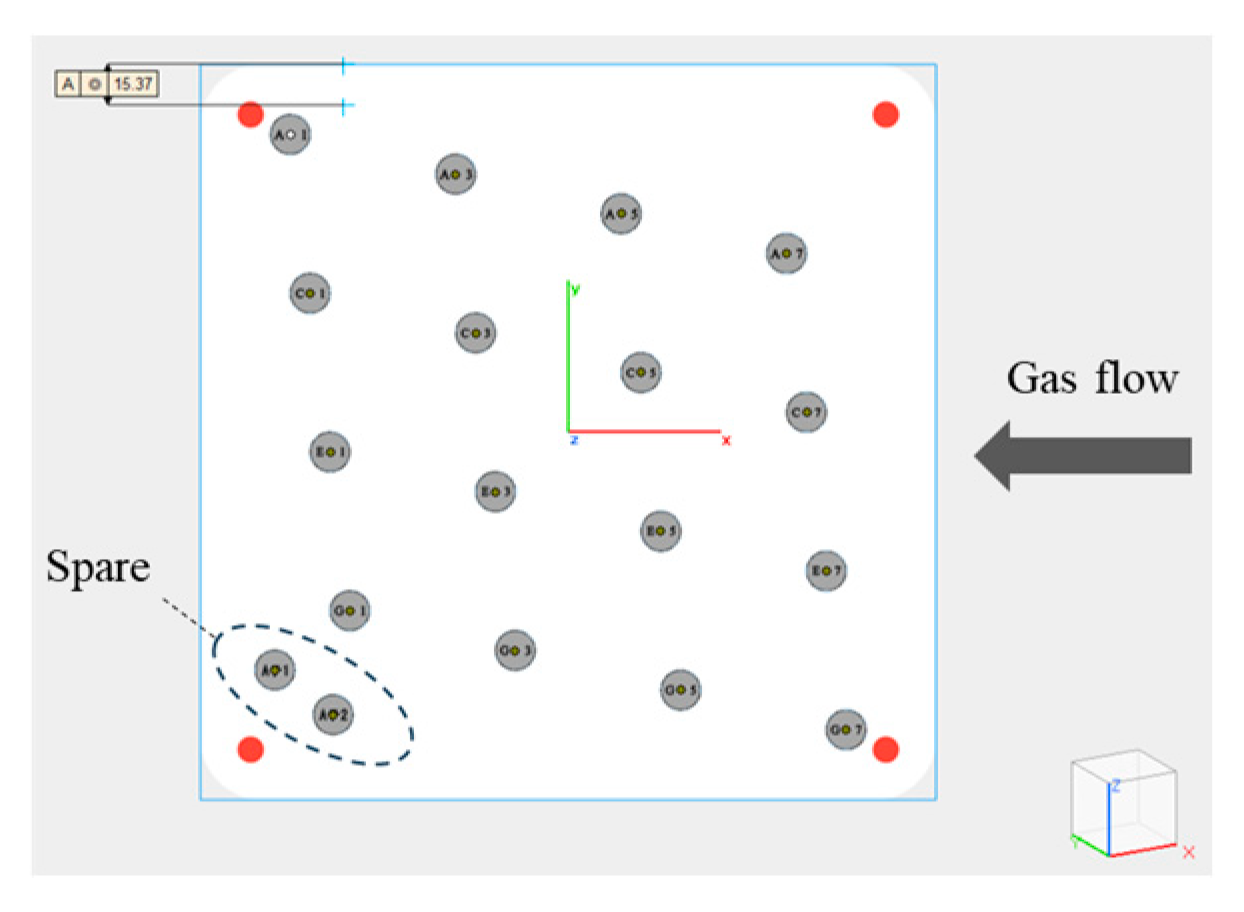
By changing these parameters, the energy density was exclusively optimized for a relative density. Consequently, the appropriate printing parameters keeping the relative density above 99.5% were determined, as shown in Table 4, and the resultant energy density was 34.4 J/mm3. At this time, the build plate temperature was kept at 150 °C and the atmosphere in the build chamber was N2. Under these parameters, round bars of ϕ15 × 95 mm were fabricated as materials for machining. The building direction was along with the longitudinal direction of the bars, as shown in Figure 2. The arrangement of the bars on a build plate is shown in Figure 3. Sixteen bars and two spares were built in a batch. The bars were arranged not to interfere with each other’s gas flow. These bars were cut from the build plate without any heat treatment and then machined to the test specimen shown in Figure 4. To verify internal quality, relative density of the test specimen was measured using the Archimedes method. Also, residual stress was measured on 15 points of the outer surface of the specimen using X-ray diffraction (XRD) before and after machining. Regarding the residual stress of the anodized layer, a substrate curvature method can be used to measure the residual stress of an anodized layer on a thin Al plate or film. However, it is difficult to measure using XRD because anodic oxide is primarily amorphous alumina. Therefore, the residual stress of the anodized layer was not measured in this study.

2.3. Anodizing

Two types of anodizing, normal anodizing and hard anodizing, with sulfuric acid were used to treat the test specimens. The anodizing process consists of three steps, degreasing, anodizing and sealing. The specimens were rinsed with de-ionized water between each process step. The detailed treatment conditions of Anodize 1 (normal anodizing) and Anodize 2 (hard anodizing) are listed in Table 5, respectively. Prior to anodizing, the test specimens were degreased with weak alkaline solutions (TOP ALCLEAN 101, OKUNO CHEMICAL INDUSTRIES, Osaka, Japan). In the anodizing, 180 g/L sulfuric acid solution was used as an electrolyte in both processes, but the major difference in the treatment conditions between Anodize 1 and 2 was bath temperature. In the case of Anodize 2, the bath temperature was kept around 5 °C, compared to 20 °C for Anodize 1, in order to form a hard-anodized layer. The anodizing treatment was performed under a constant current (CC) condition and the current density was kept at 1.0 A/dm2. A target layer thickness was set at 20 μm. The anodizing treatment time was adjusted to form 20 μm layer thicknesses in Anodize 1 and 2, respectively. In the case of Anodize 2, an anodized layer growth rate was confirmed by observing the layer thickness by changing the treatment time. Subsequently, the sealing was treated with Ni acetate (TOP SEAL H-298, OKUNO CHEMICAL INDUSTRIES, Osaka, Japan).
After the above-mentioned process, the anodized layer was characterized by following measurements and observations. The anodized layer thickness was measured using an eddy current thickness tester. The hardness of the anodized layer was measured using a Micro-Vickers hardness tester (HM-100, Mitsutoyo Corporation, Kawasaki, Japan) under a 50 gf test load. The hardness was measured 5 times and then averaged.
The surface of the anodized layer was observed with an optical microscope and Scanning Electron Microscope (SEM) (JSM-IT210, JEOL, Tokyo, Japan). The cross-section of the anodized layer was observed with a Field Emission Scanning Electron Microscope (FE-SEM) (JSM-IT800, JOEL, Tokyo, Japan) and the chemical mapping was measured using the Energy-Dispersive X-ray Spectroscopy (EDS) built-in the SEM and FE-SEM.
The surface roughness of Anodize 1 and 2, as well as of the as-machined surface (without anodizing), was measured with a stylus-type surface roughness tester (SURDCOM 1800G, Tokyo Seimitsu, Ichihara-shi, Chiba, Japan) according to JIS B 0601:1994 [23]. The roughness was measured at the center part of the specimen where the bending moment was applied (details are described in Section 2.4). The measurement orientation was aligned with the bending moment (the direction of tensile and compressive stress), most highly influencing the fatigue properties of the specimens.

2.4. Fatigue Test

The fatigue properties of Anodize 1 and 2 and the as-machined specimen were evaluated with an Ono-type rotating bending fatigue testing machine (Shimadzu Corporation, Kyoto-shi, Kyoto, Japan). A schematic illustration of the fatigue testing machine is shown in Figure 5a. An even bending moment is applied on the entire part of the test specimen using a 4-point bending mechanism. Under the bending moment, compressive and tensile stress are generated on the upper and lower part of the test specimen, respectively. The stress distribution in the cross-section of the test specimen is shown in Figure 5b. The maximum stress is generated on the surface, and the stress decreases inward and reaches zero at the center. By rotating the test specimen, the maximum tensile–compressive stress amplitude (stress ratio, R = −1) is applied on the surface of the test specimen.

2.5. Corrosion Test

To evaluate the corrosion properties of Anodize 1 and 2 and the as-machined specimen, a CASS (copper-accelerated acetic acid salt spray) test was conducted. The detailed methods of salt spray test procedure was in accordance with JIS Z2371:2015 [24]. The specimens were kept under the test conditions for 16 h, and then the surface condition of the specimens was observed.

3. Results and Discussion

3.1. Relative Density and Residual Stress

The relative density of 16 pieces of as-machined test specimens was measured. These 16 test specimens were built in a batch of L-PBF, as shown in Figure 3. The average, maximum, minimum and standard deviation (σ) of the measured relative density values are listed in Table 6. A Normal Quantile-Quantile (Q-Q) plot of the relative density is shown in Figure 6. The horizontal axis shows the measured relative density, and the vertical axis shows the expected values in the case where the measured values are in accordance with normal distribution. The expected value is calculated with the inverse function of the probability density function of the normal distribution. The plot shows linearity; therefore, the relative density of the test specimens is in accordance with normal distribution, and the data range of ±3σ is in between 99.67 and 99.82%. From these results, it is considered that the internal quality of the test specimens is stable.
The residual stress before machining (as-built) was as follows: 86.5 MPa (average), 113.0 MPa (max) and 66.5 MPa (min). On the other hand, the residual stress after machining (as-machined) was as follows: 10.4 MPa (average), 38 MPa (max) and −15 MPa (min). The tensile stress observed on the as-built surface was decreased drastically by machining.

3.2. Anodized Layer

3.2.1. Anodized Layer Thickness and Growth Rate

The anodized layer thickness of 16 pieces of Anodize 1 and 2 under the anodizing condition shown in Table 5 was measured, respectively. The average, maximum, minimum and standard deviation (σ) of the measured thickness are shown in Table 7. The thickness values are all in the range of 20 (aimed thickness) ± 1 μm. These specimens were used for fatigue and CASS testing.
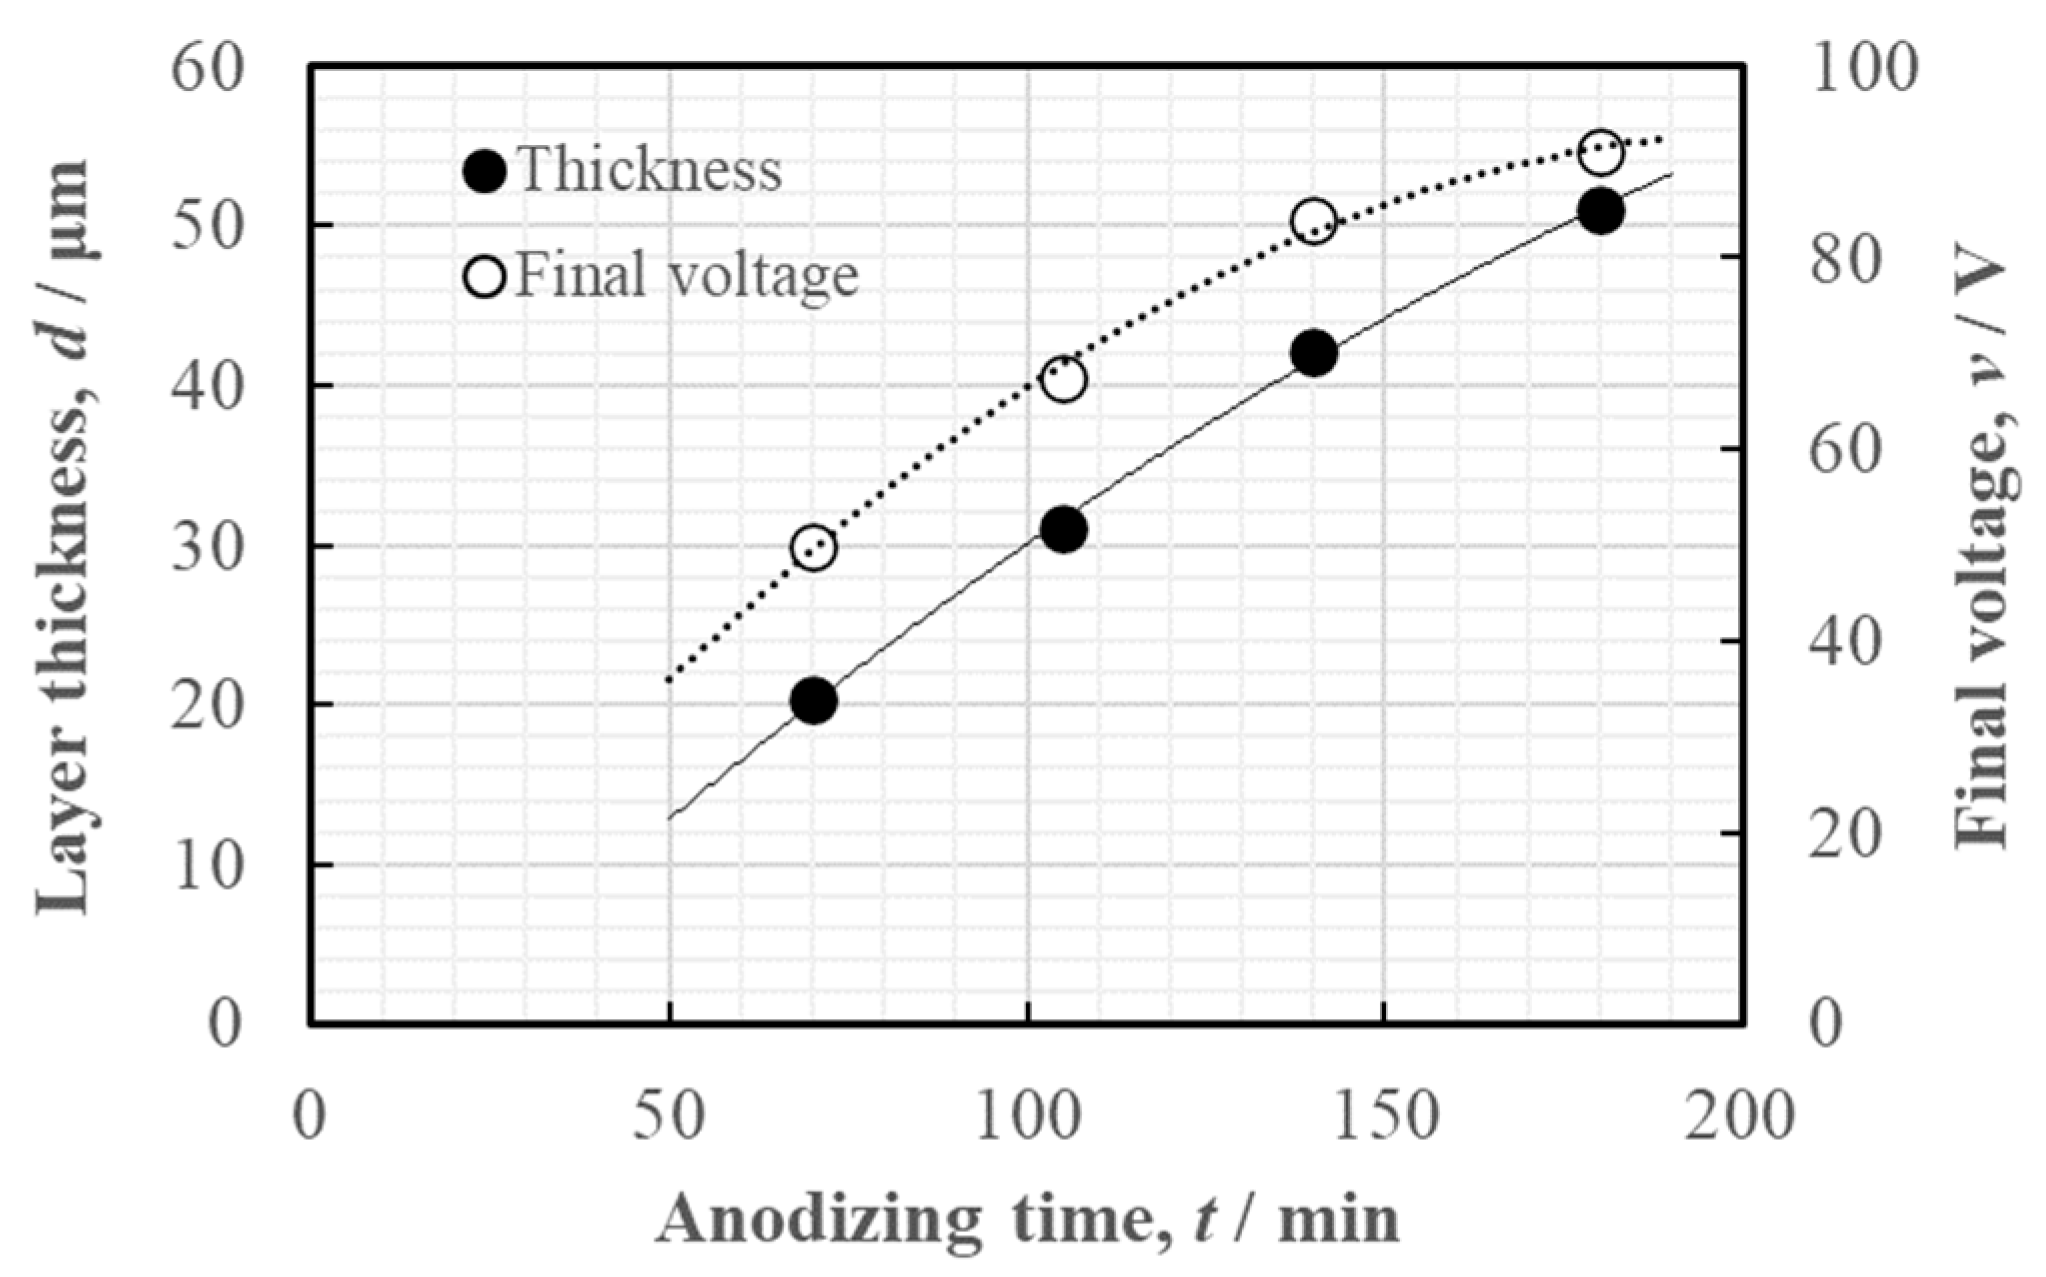
To investigate the growth rate of the anodized layer, the layer thickness was measured by changing the anodizing time under the condition of Anodize 2. The anodizing was treated under CC conditions, so the electrolytic voltage was rising with anodizing time. Figure 7 shows the anodized layer thickness and the final electrolytic voltage as a function of the anodizing time. The layer thickness grows linearly against the anodizing time, and the growth rate of the anodized layer calculated from the slope is 0.29 μm/min. The final electrolytic voltage also rises with the anodizing time and reached about 90 V at 180 min. Generally, Joule heat as a function of current and voltage is generated during the anodizing process, and Joule heat accelerates the chemical dissolution of the anodized layer [25]. However, in this study, the growth rate remains constant even at a higher electrolytic voltage range in which a high amount of Joule heat should be generated during anodizing. It is considered that the chemical dissolution of the anodized layer is not accelerated under the anodizing condition of this study.

3.2.2. Cross-Section of Anodized Layer

The appearance and cross-section of the test specimens are shown in Figure 8. As shown in Figure 8a, the anodized specimens showed a dark gray color due to the Si particles contained in the microstructure of L-PBF AlSi10Mg alloy as well as in the anodizing of conventional Al-Si casting alloys. The anodized layer thickness was more even compared to that of Al-Si casting alloys. In the case of anodizing Al-Si casting alloys, relatively coarse primary and/or eutectic Si crystals interfered with the growth of anodic oxide, resulting in uneven anodized layer formation. Comparatively, in the case of the AlSi10Mg alloy built with the L-PBF process, the Si crystals were super fine, so the Si crystals were incorporated in the anodic oxide layer during the anodizing process, as mentioned in Refs. [10,11]. This led to even anodized layer formation.
SEM micrographs of cross-sections of Anodize 1 and 2 are shown in Figure 9. In both anodized layers, a small and uniform granular structure is observed. The metallographic features of the anodized layer reflect the microstructure of the substrate. To investigate the layer structure, detailed observations and analysis were conducted using FE-SEM/EDS. Figure 10 shows an FE-SEM micrograph and chemical mapping of the cross-section of Anodize 2, which is observed at the boundary region between the anodized layer and AlSi10Mg alloy substrate. The upper part of the micrograph corresponds to the anodized layer. A dark-colored web-like pattern is clearly visible in the anodized layer. This pattern is formed by the segregation of fine Si particles, as shown in the chemical mapping (Si and Si + Al) of Figure 10. Subsequently, the polished specimen was etched with Keller’s reagent (HNO3 + HCl + HF), which is a common reagent for Al metallographic preparation, to etch Si crystals selectively. An FE-SEM micrograph and chemical mapping of the cross-section of etched Anodize 2 is shown in Figure 11. The Si particles dispersed in a web-like pattern in the anodized layer was selectively etched them away; in consequence, the anodized Al structure remained in the anodized layer. However, the Si-rich part in the substrate was hardly etched. In the anodizing process, it is reported that not only the Al phase but also the Si particles dispersed in conventional Al-Si castings are partially oxidized [11]. The Si particles in the L-PBF AlSi10Mg alloy are super fine; therefore, these Si particles are possibly fully oxidized during the anodizing process, consequently forming SiO2. Etching of Si using HF/HNO3 mixtures is widely studied, and it is clarified that the etching of Si proceeds according to the following two-step reaction [26].
3Si + 4HNO3 → 3SiO2 + 4NO + 2H2O
SiO2 + 6HF → H2SiF6 + 2H2O
Initially, Si was oxidized by HNO3, resulting in the formation of SiO2. Subsequently, SiO2 reacted with HF, then, water soluble H2SiF6 was formed. In the etching process of the anodized layer using Keller’s reagent, it is considered that the oxidized fine Si particles (SiO2) react with HF preferentially in the reagent, thereby consuming the HF. This is the reason why the etching reaction of Si particles in the substrate exposed at the polished surface hardly proceeds.
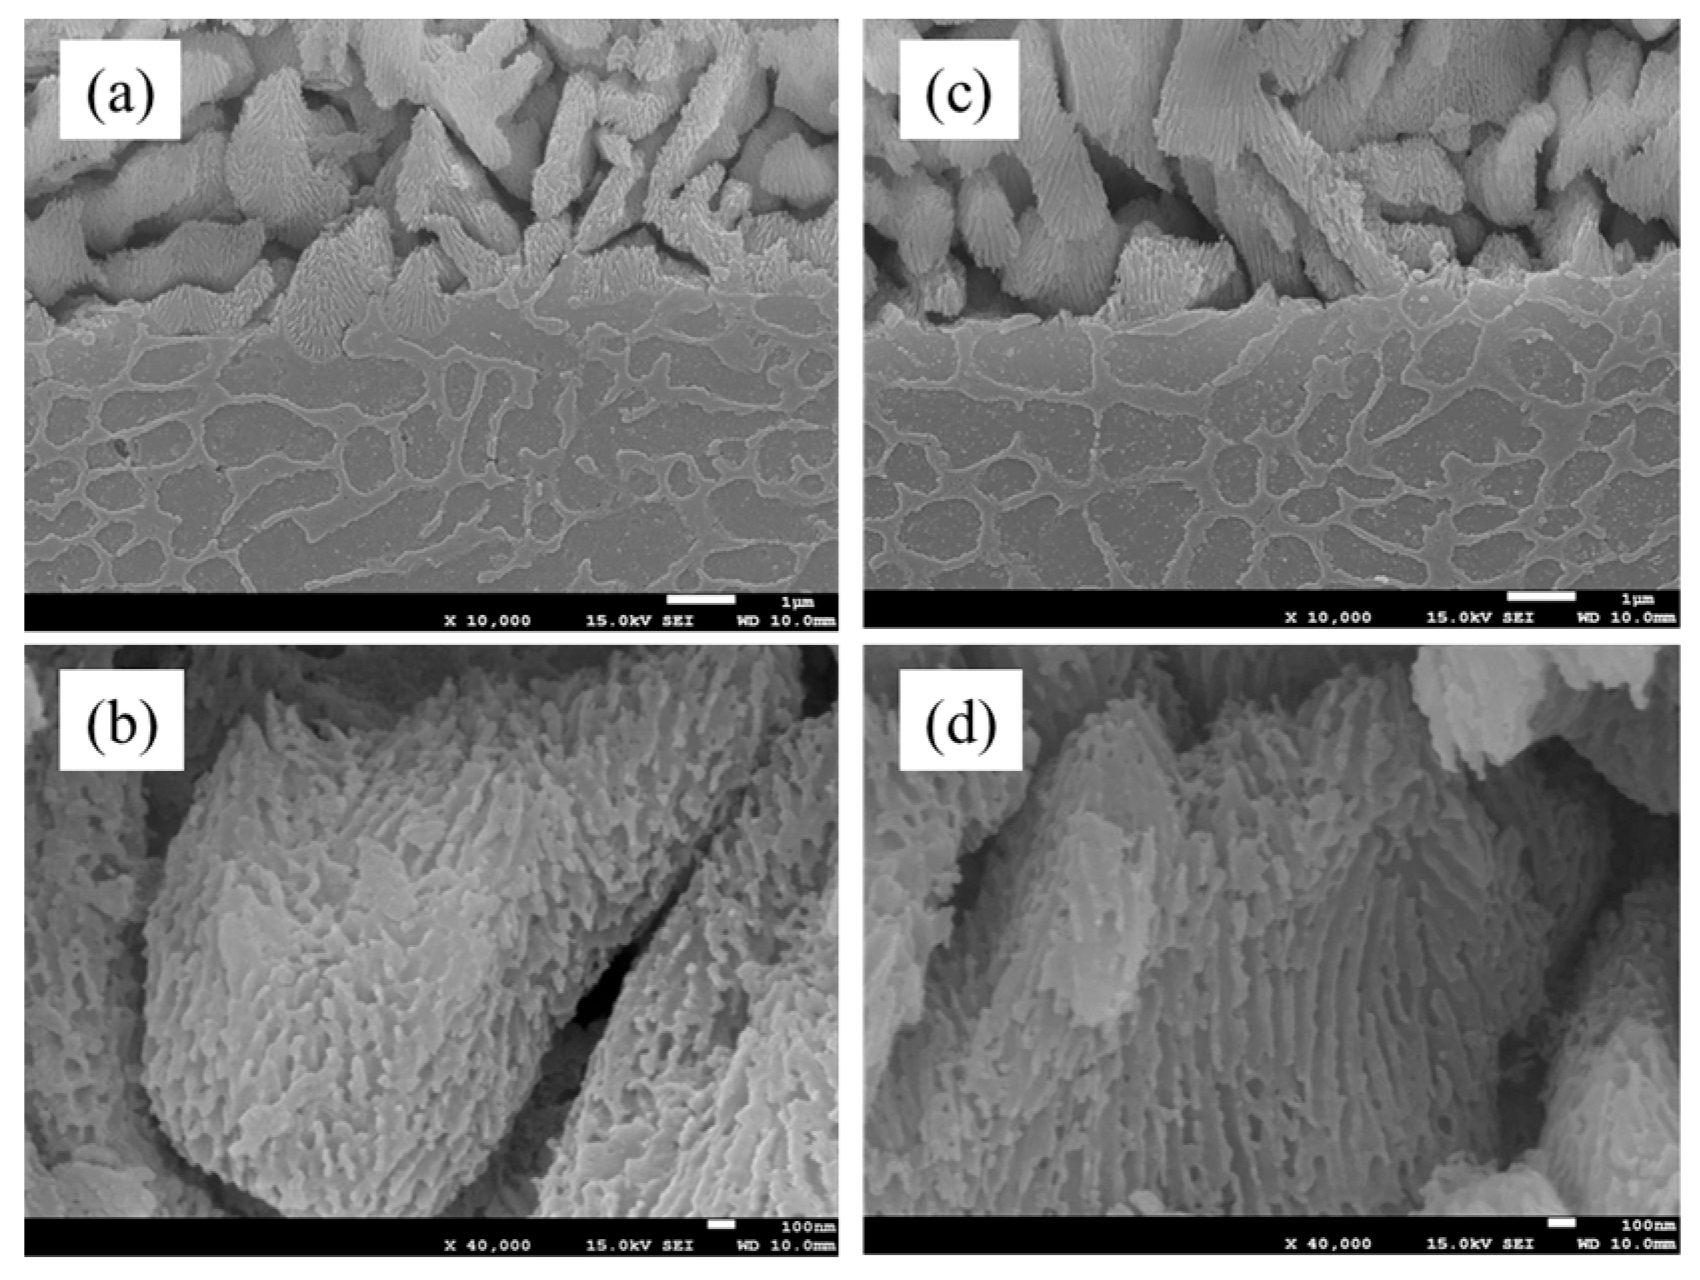
Magnified views of FE-SEM micrographs of etched Anodize 1 and 2 are shown in Figure 12. Regardless of the anodizing bath temperature, the structure of Anodize 1 and 2 seems almost the same. The remaining part of the anodized layer has a maze-like 3D structure. It is considered that the 3D structure corresponds to α-Al phase of L-PBF AlSi10Mg alloy. On the surface of the maze-like 3D structure, a lot of pores were clearly observed. It is considered that this porous structure is in accordance with the Keller–Hunter–Robinson model [27,28,29].

3.2.3. Surface of Anodized Layer

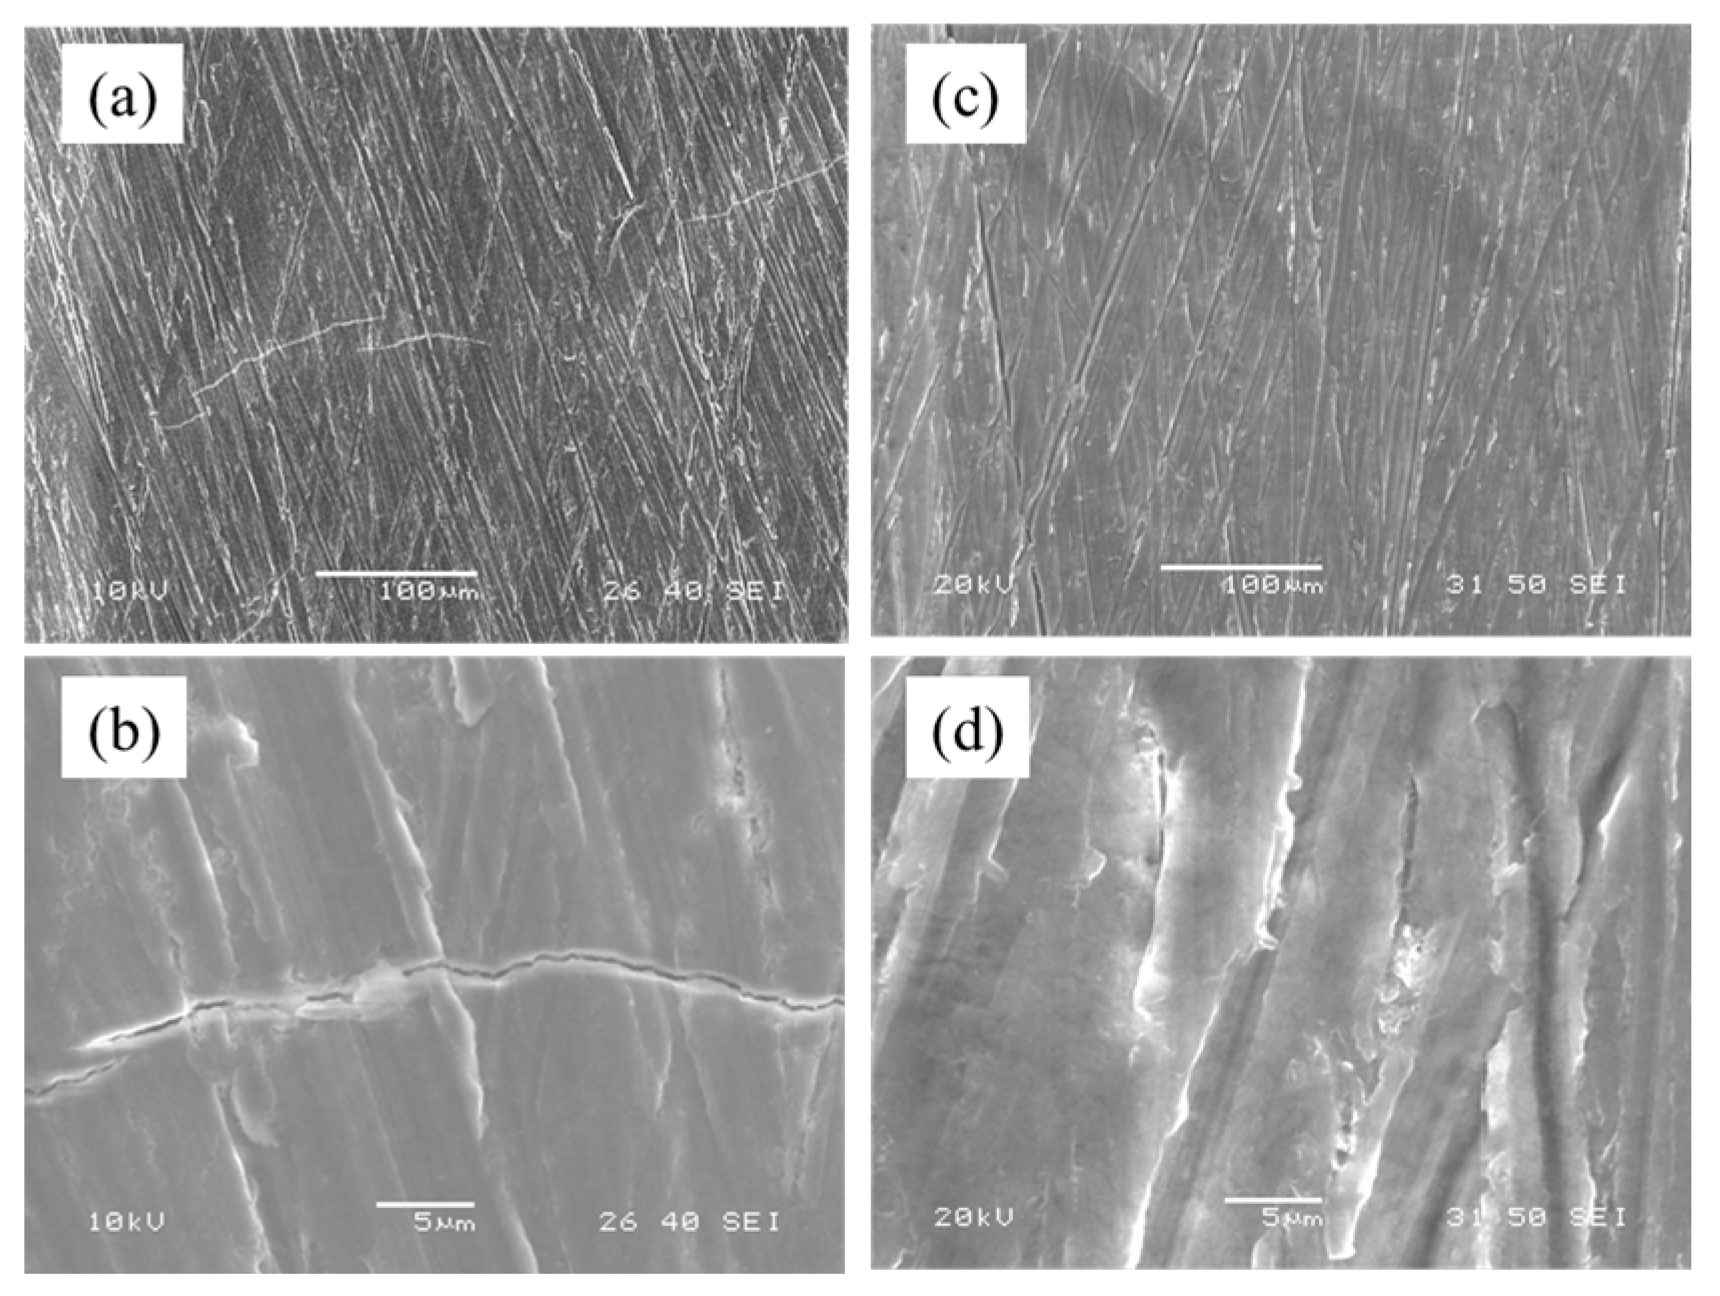
SEM micrographs of the surface of the test specimen are shown in Figure 13. A few hair cracks were observed on Anodize 1 but not on Anodize 2. It is well known that spider web cracks often occur on the anodic oxide surface, especially on the hard anodic oxide surface [30]; however, such kinds of cracks were not observed on the surface of Anodize 1 and 2.
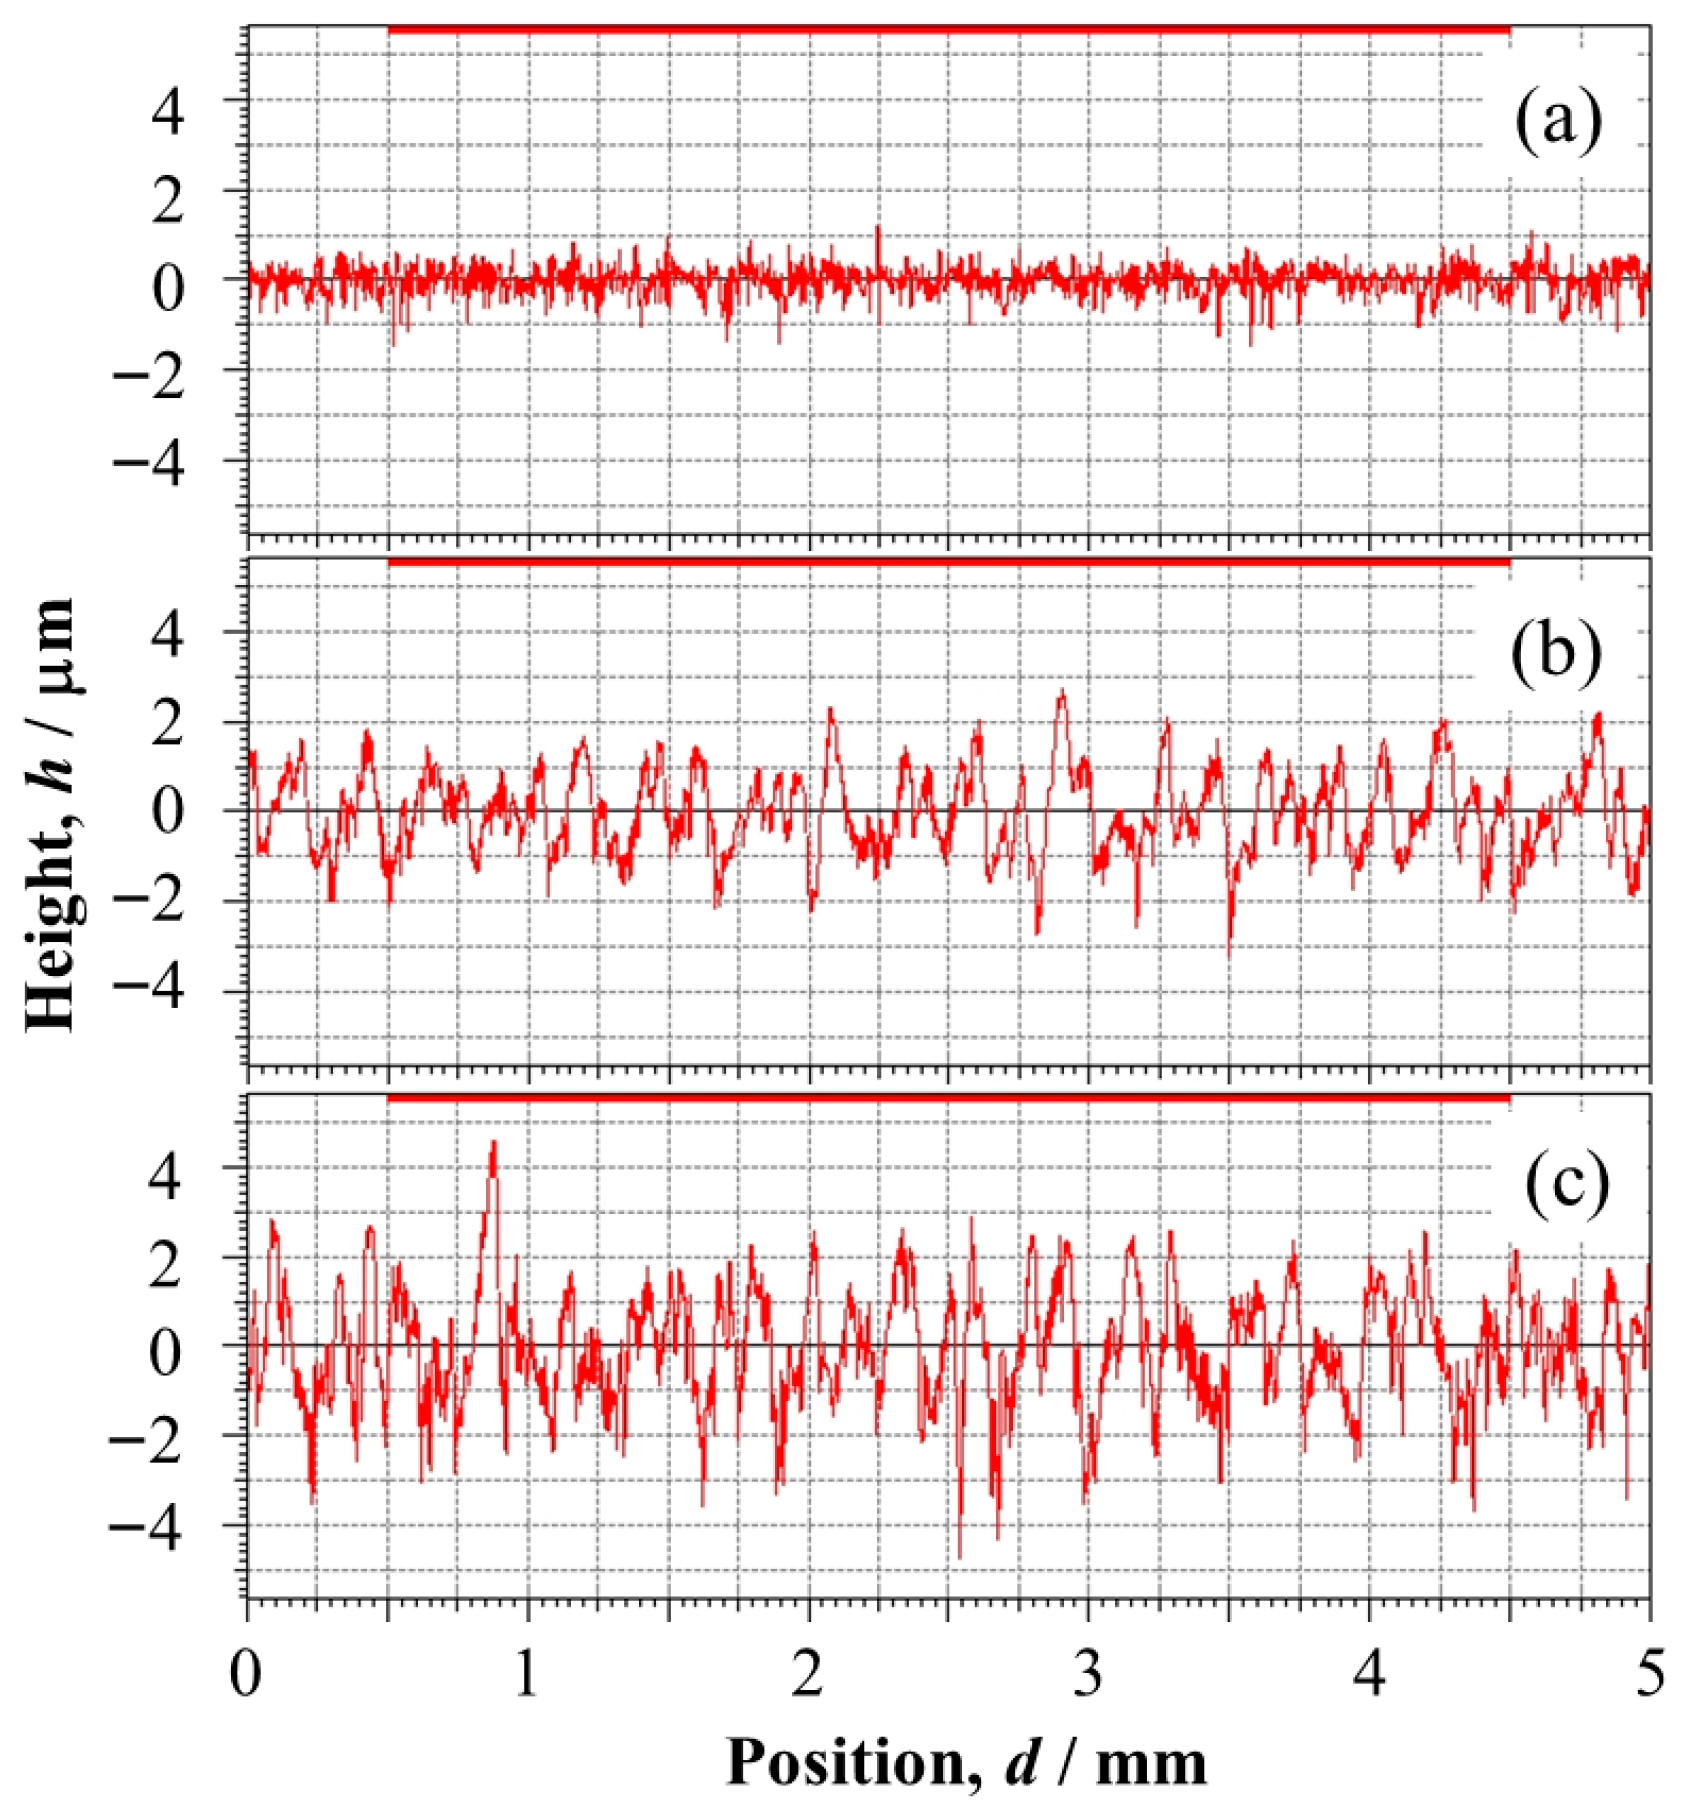
Surface roughness curves and roughness parameters are shown in Figure 14 and Table 8, respectively. As shown in Figure 14, the surface roughness is increased with anodizing even though the substrate of Anodize 1 and 2 is exactly the same as that of the as-machined surface. Comparing Anodize 1 and 2, Anodize 2 is rougher than Anodize 1. All roughness parameter values show the same order, that is, as-machined < Anodize 1 < Anodize 2.

3.2.4. Hardness of Anodized Layer

The hardness of Anodize 1 and 2 is listed in Table 9. In the case of Anodize 2, the hardness reaches 343 +/− 20 HV. Mora-Sanchez et al. [31] anodized AlSi10Mg alloy made by L-PBF in a 200 g/L sulfuric acid solution kept at 0 °C under a 2 A/dm2 CC condition and measured the hardness of the anodized layer using nanoindentation. They then reported the average hardness value was in the 2–3 GPa (approximately 200–300 HV) range. The larger deviation of the hardness value may be attributable to the small indenter of the nanoindentation method. Generally, it is well known that the hardness of the anodized layer corresponds to the pore size (relating to the thickness of the barrier layer) of the hexagonal columnar cell, that is, smaller pores (thicker barrier layer) increase the hardness and vice versa [32]. The barrier layer thickness is proportional to the voltage during anodizing [29]. In the case of Ref. [31], the final voltage reaches 130 V, so the hardness should be harder than that of our study according to the above-mentioned theory. However, the hardness found in Ref. [31] is slightly lower than that of our study. The reason can be thought of as follows. During the anodizing process, not only aluminum oxidation but also chemical dissolution of the pore wall occurs [29]. This chemical dissolution is an endothermic reaction, so the dissolution of the pore wall is accelerated with rising temperature of the anodized layer. Also, Joule heat is generated in the anodized layer according to the following equation consisting of Joule heat Q (J), voltage V (V), current I (A) and time t (s).
Q = VIt
In the case of Ref. [31], the higher voltage and current generated a much Joule heat, and this resulted in a decrease in the hardness. In this study, a lower voltage and current density prevent excessive Joule heat generation. As a result, a higher hardness was obtained.

3.3. Fatigue Property

3.3.1. Rotating Bending Fatigue Test Result

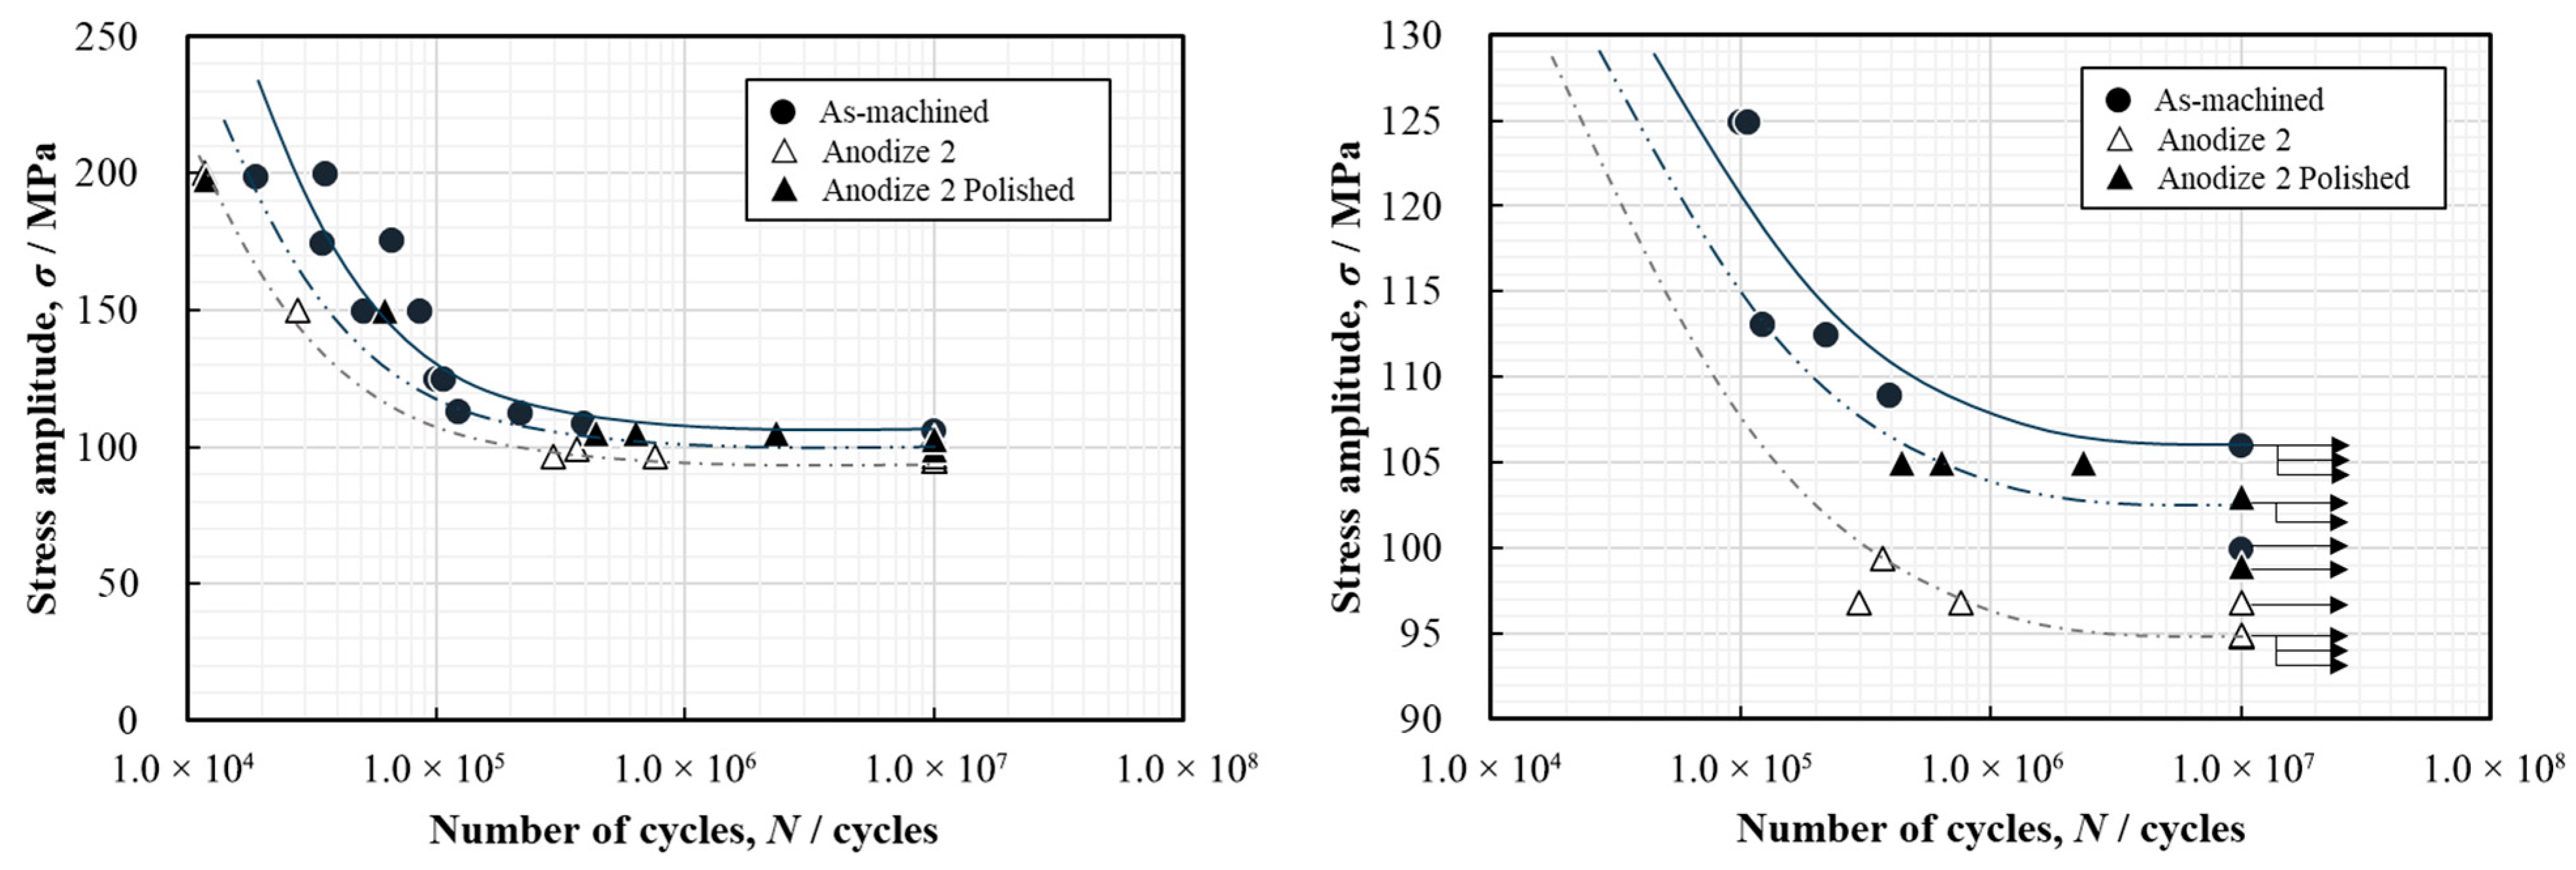
S-N curves of the as-machined and Anodize 1 and 2 specimens are shown in Figure 15. The fatigue strength at 107 cycles of the as-machined specimens was 106 MPa. Previously, several researchers investigated the fatigue strength of L-PBF AlSi10Mg alloy using a rotary bending fatigue testing machine [3,12,14,18]. Mower et al. [3] evaluated the fatigue strength of stress-relieved (300 °C 2 h) net-shape specimens with and without surface polishing, and they revealed that the fatigue strength at 107 cycles was improved from about 50 MPa to about 90 MPa by surface polishing (Sa = 1.5 μm). The fatigue strength of the surface-polished specimen was 15% lower than that of our current study. Even though Sa = 1.5 μm and Ra = 0.235 μm cannot be compared directly, this difference in fatigue strength may be attributed to the surface roughness. Lehner et al. [14] evaluated the effect of residual stress on fatigue strength by applying different heat treatments (as-built, stress relief and T6). The obtained fatigue strength at 107 cycles was as-built = 40 MPa, stress relief = 55 MPa and T6 = 70 MPa, and the corresponding residual stress was 115, 8.7 and −43 MPa, respectively. From these results, the influence of residual stress was revealed. The fatigue strength itself is lower than that of our study. This can be attributed to the surface roughness of the specimens (Sz = 107 μm), which was not machined. Fini et al. [18] evaluated the effect of a combination of build direction (0, 45, 90°), heat treatment (non-heat-treated, T6, stress relief) and surface finish (shot peening, fine blasting, Lapping) on fatigue strength at 106 cycles. The obtained fatigue strength was in the range between 10 and 60 MPa. These values are much lower than those of our study. The reason might come from the condition of internal defects. Although a lot of research has been presented, it is difficult to compare their results directly because the test conditions differ depending on the research.
Hirata et al. [12] investigated the change in fatigue strength when varying the relative density of test specimens by controlling energy density, as well as the relationship between the relative density and the fatigue strength at 107 cycles. The test condition was much the same as this study, so the fatigue strength of the as-machined specimens (106 MPa) can be compared directly. The fatigue strength of Ref. [12] is shown as solid circles in Figure 16. The fatigue strength exponentially decreases with decreasing the relative density from the over-99.5% range to the 98–97% range. The fatigue strength and the relative density of the as-machined specimen is also plotted with an open circle on Figure 16. The as-machined result is well aligned with the tendency. It is probable that the relative density is one of the dominant factors to determine the fatigue strength because the relative density relates closely to internal defects.
In Figure 15, S-N curves of Anodize 1 and 2 are also shown, and their fatigue strength at 107 cycles is 100 and 95 MPa, respectively. The fatigue strength of these anodized specimens is lower than that of the as-machined specimen. Previously, there have been many research works dealing with the relationship between anodizing and fatigue [32,33,34,35,36,37]. Fatigue properties around 107 cycles of wrought Al alloys such as 6082 Al alloy [32], 2618 Al alloy [34] and 7010 Al alloy [35] have been investigated, and these research works showed that an anodized layer deteriorated the fatigue properties, attributing to the brittleness of the anodized layer resulting in crack formation. Sadeler [36] and Nakamura et al. [37] investigated the fatigue properties of a long-life regime (108–109 cycles) of 2014 Al alloy and Al-10%Si-4Cu cast Al alloy, respectively, and showed that the effect of the anodized layer on fatigue properties depended on the stress level, and the fatigue strength was slightly improved by the anodized layer. At the same time, around 107 cycles, these investigations also showed that the anodized layer slightly deteriorates the fatigue strength, attributing to a crack that occurred on the surface of the anodized layer.
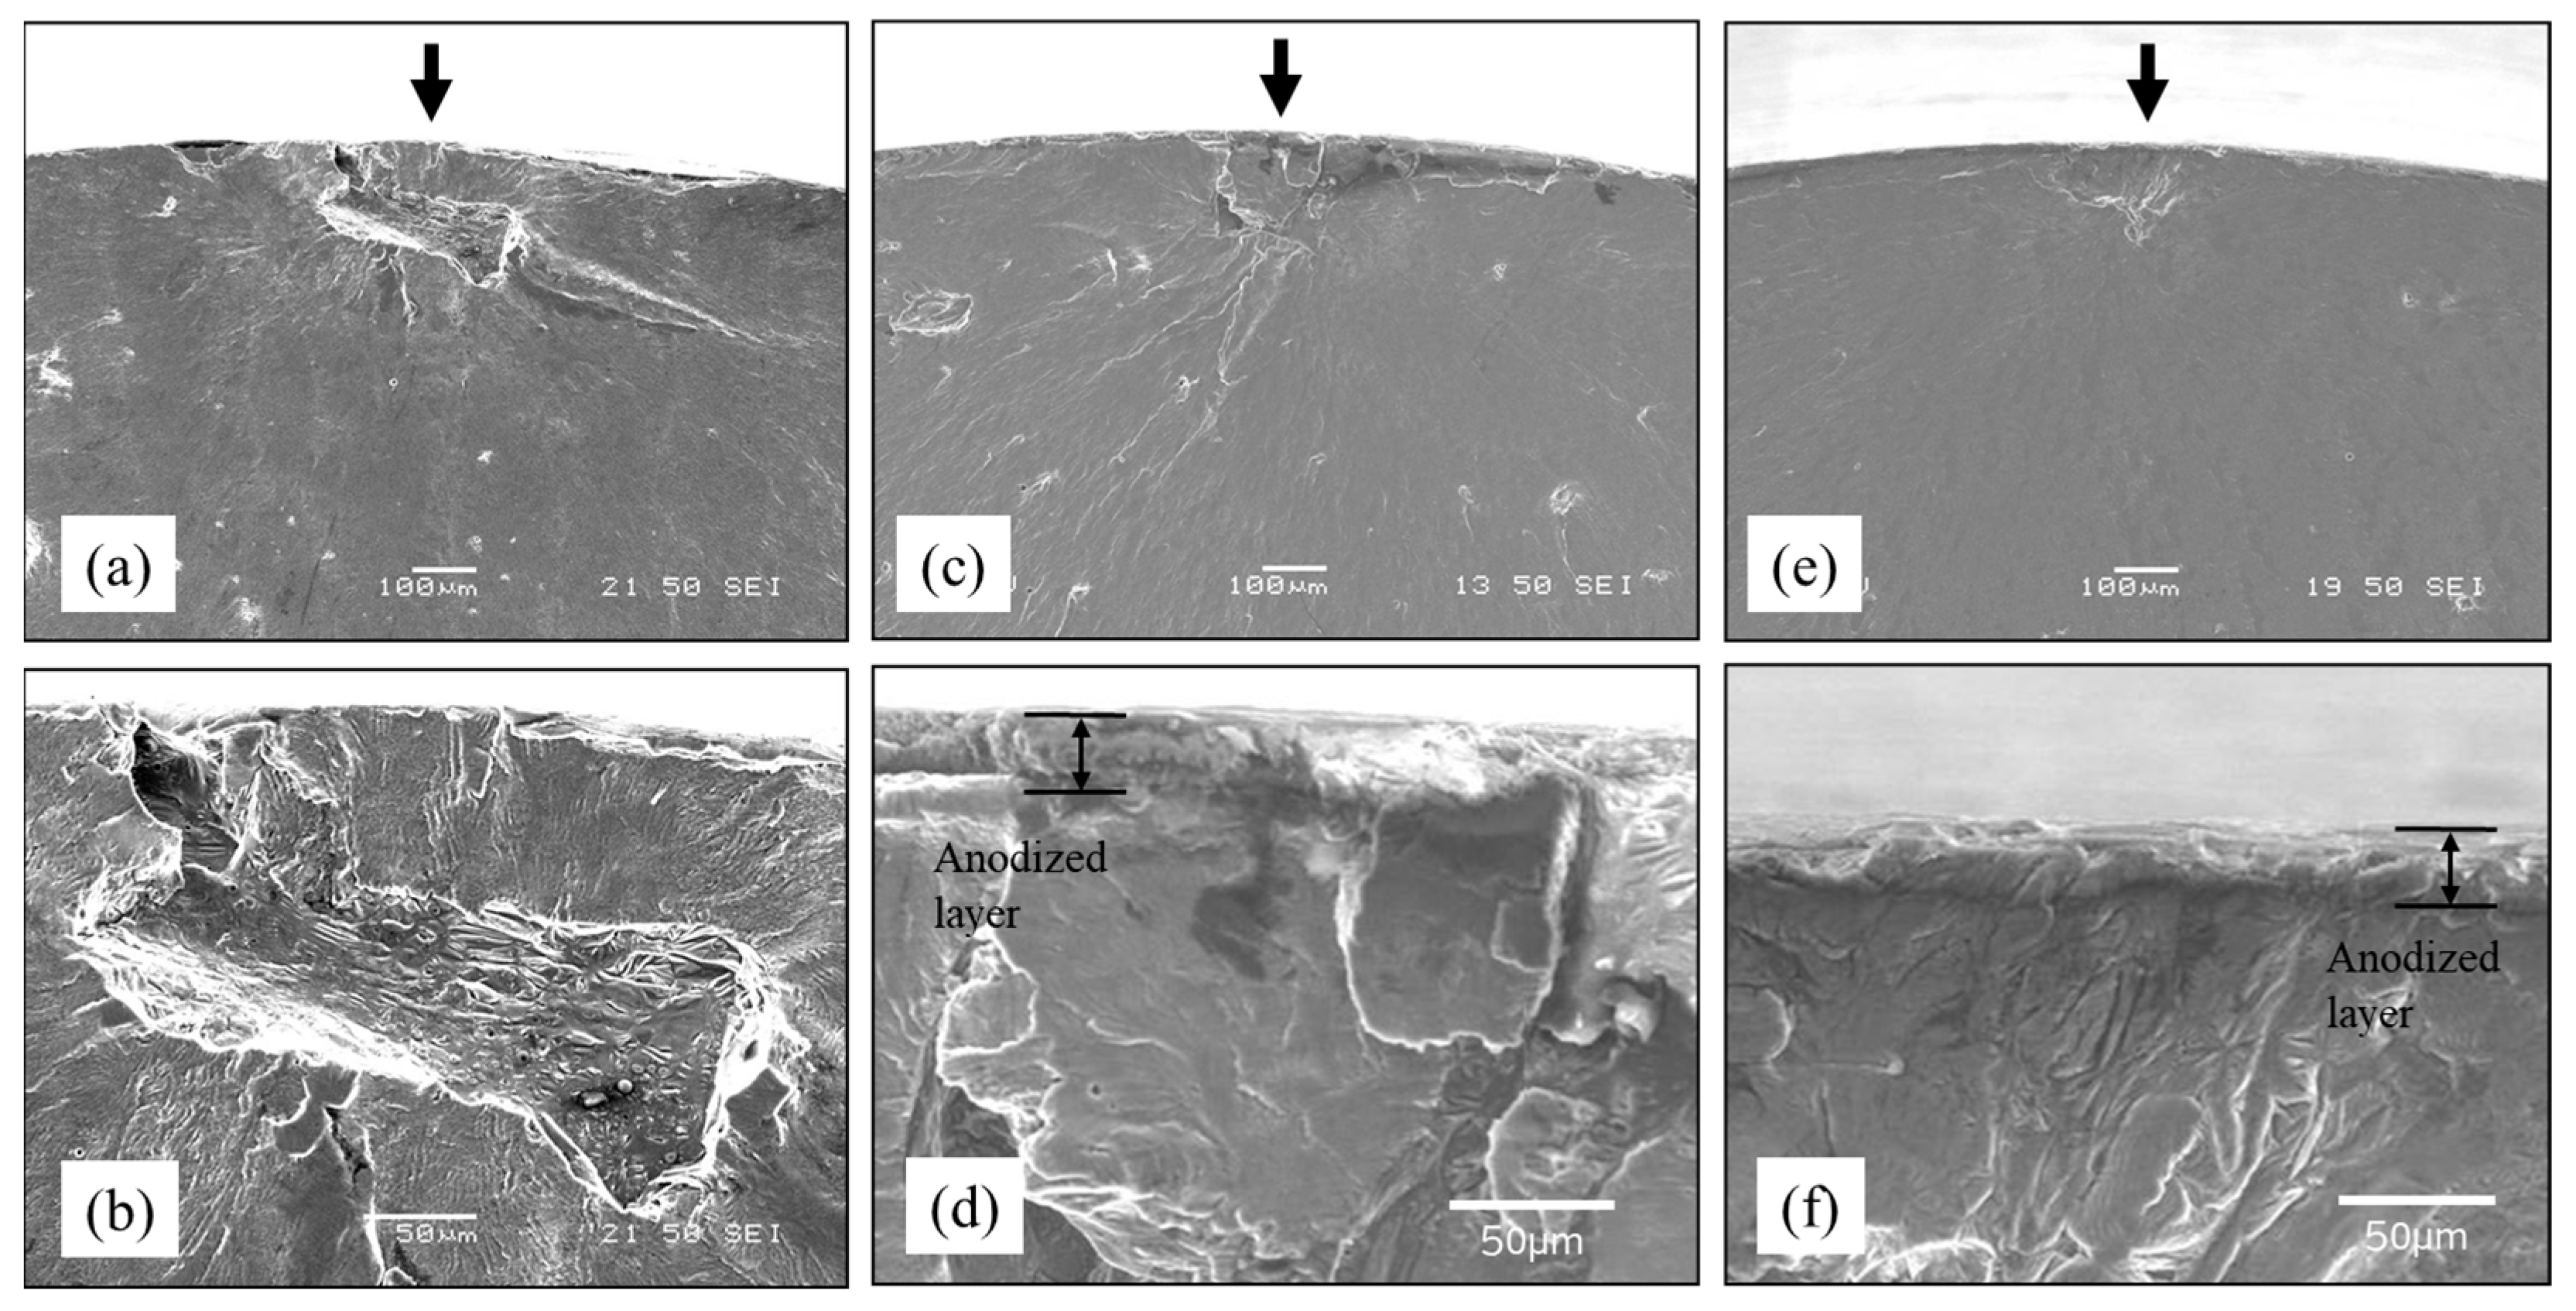
However, in this study, no significant cracks in the anodized layer were observed on the outer and fracture surfaces. But defects of substrate were observed at beneath the fatigue initiation points of not only the as-machined specimens but also Anodize 1 and 2, as shown in Figure 17. The size of the defects is much larger than in the anodized layer.
As mentioned above, the fatigue characteristics of L-PBF AlSi10Mg alloy were investigated by many researchers from the perspectives of Refs. [12,13,14,15,16,17,18]. Among these factors, the size and number of internal defects influence fatigue strength, and it was revealed that the fatigue strength decreased when decreasing the relative density of the specimen [12]. However, in this study, the L-PBF process and pre- and post-process are exactly the same except for anodizing. So, it is hard to explain the difference in the fatigue properties in this study from the above-mentioned perspectives.
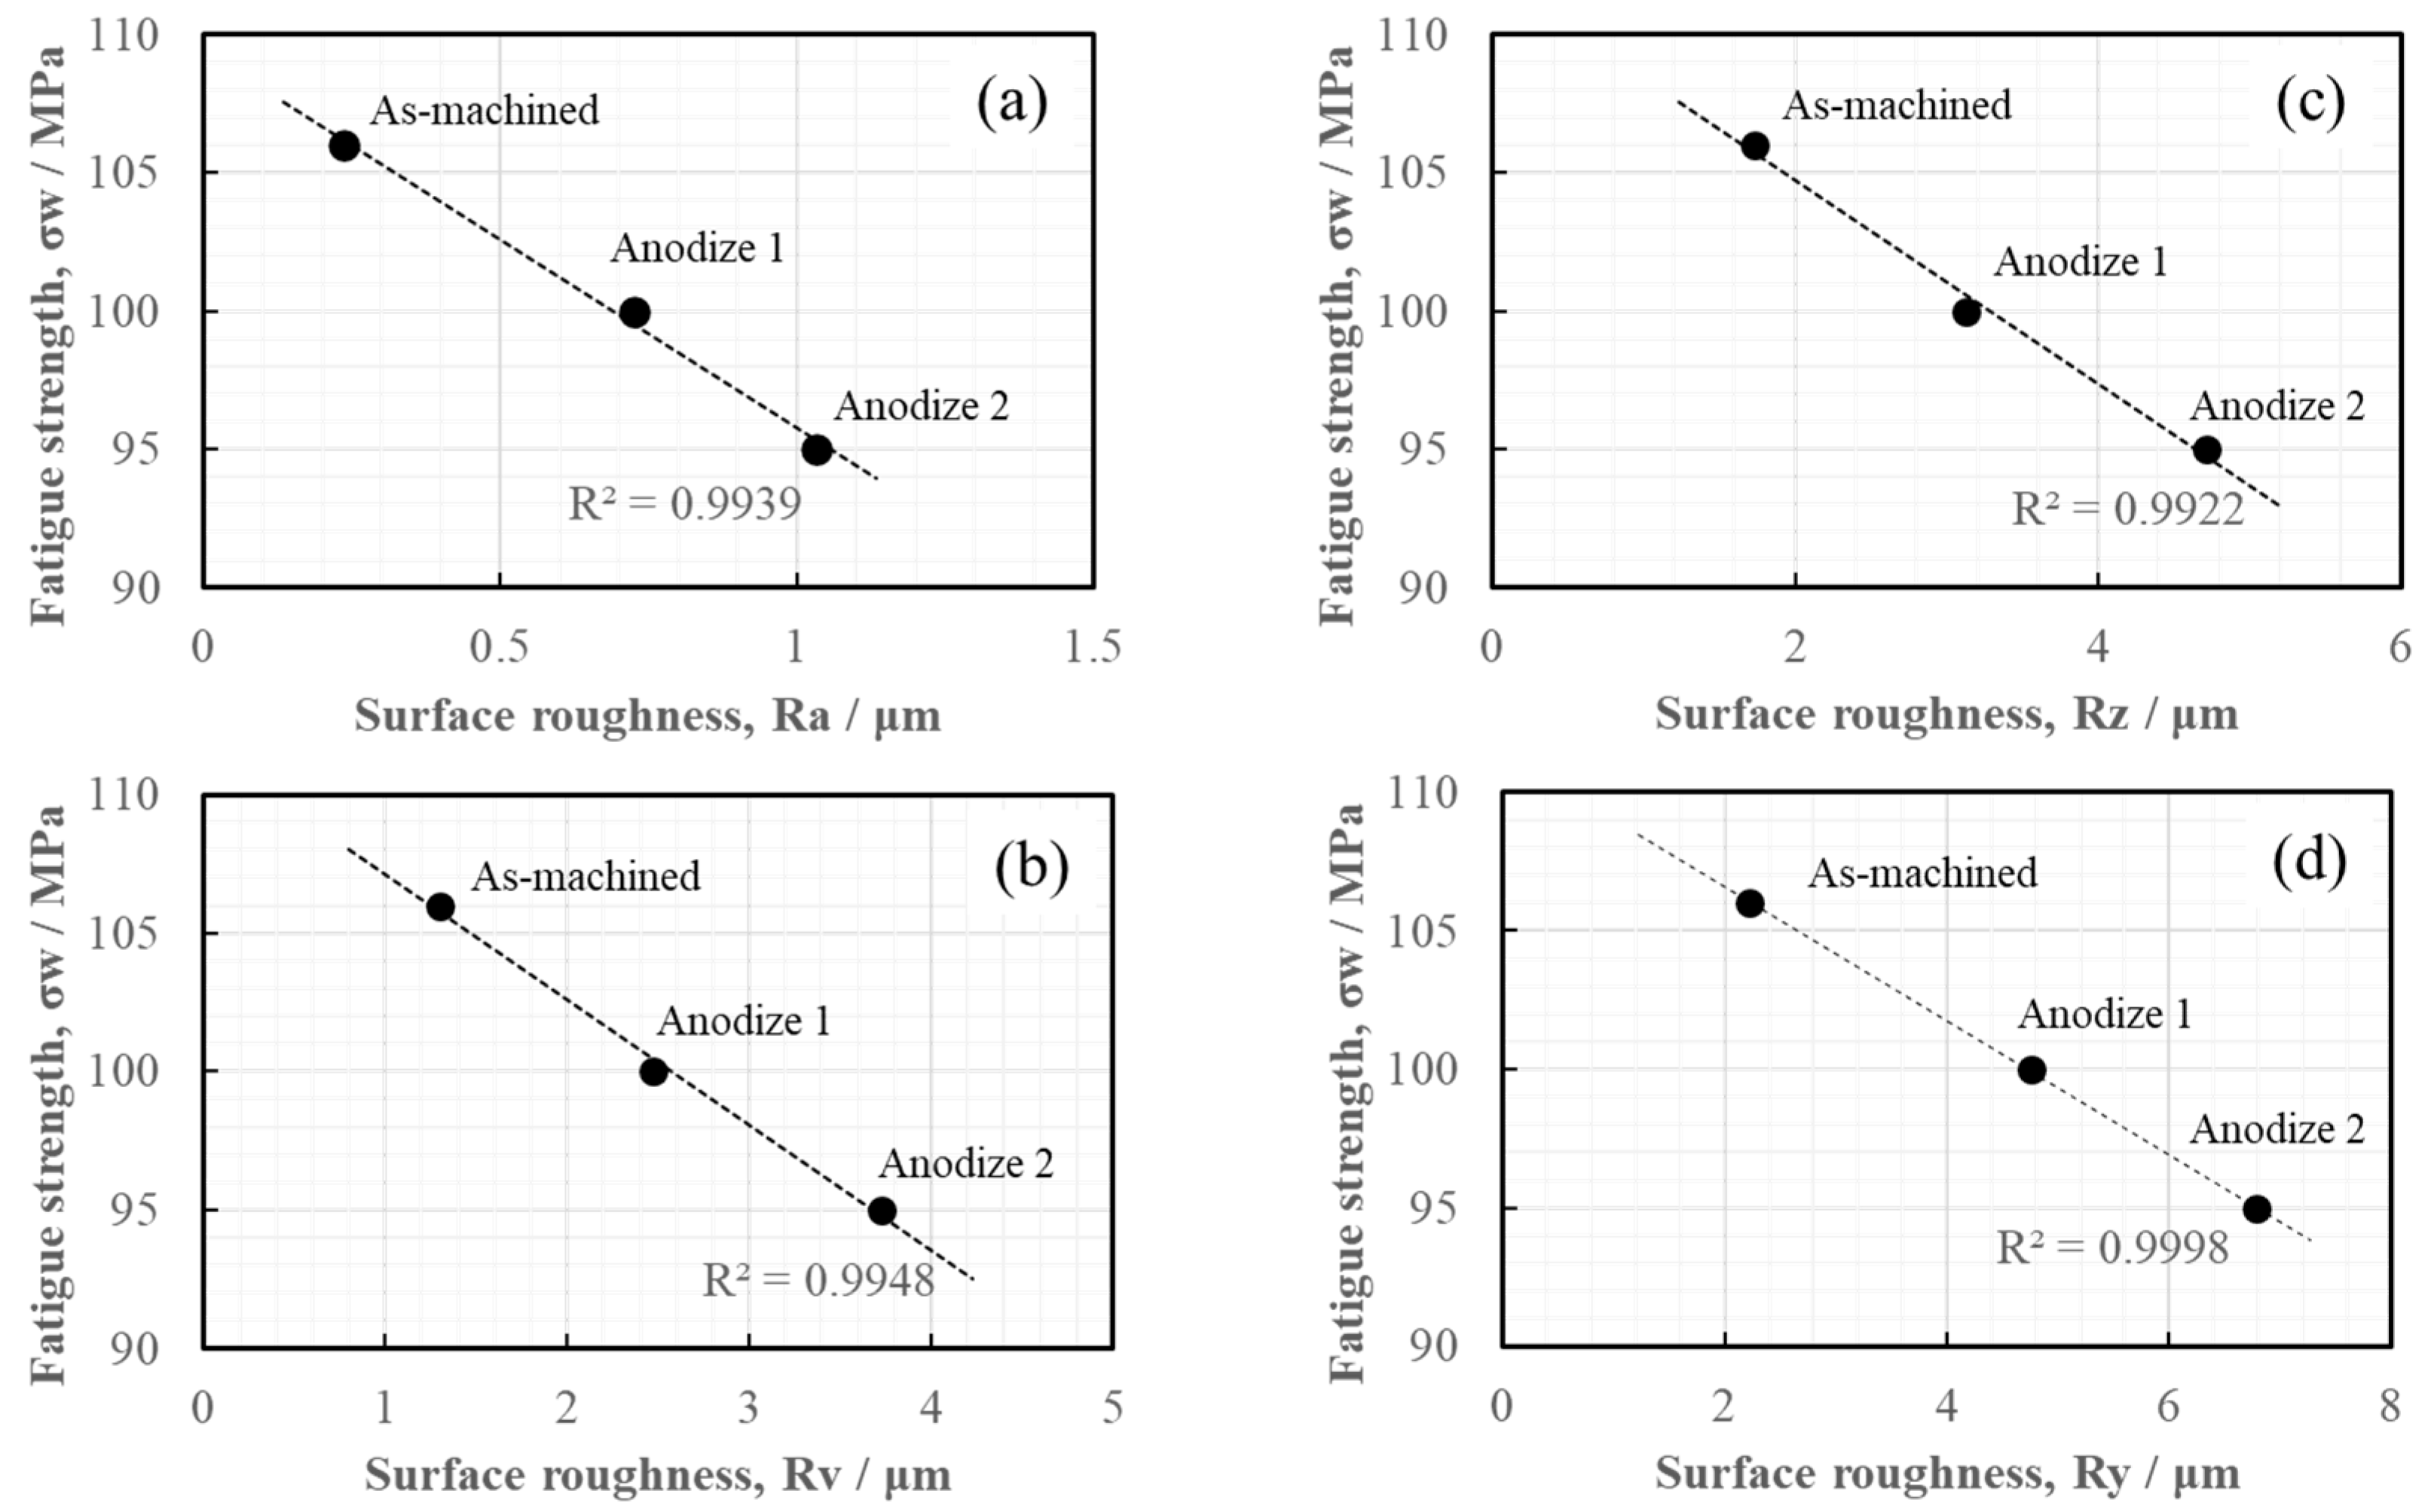
Besides the perspectives shown above, the effect of surface roughness on the fatigue life of L-PBF AlSi10Mg alloy was investigated by several researchers [38,39,40,41]. These investigations reported that surface roughness, especially residual intrusions or notches, acted as a stress raiser and initiated cracks, resulting in the reduction in fatigue life. In this study, the surface roughness was increased with anodizing, as shown in Figure 14 and Table 8, even though the substrate was exactly the same as the as-machined surface, as mentioned before. The relationship between surface roughness parameters and fatigue life at 107 cycles is depicted in Figure 18. These graphs show higher linearity with R2 > 0.99.

3.3.2. Improvement in Fatigue Properties by Smoothing the Surface

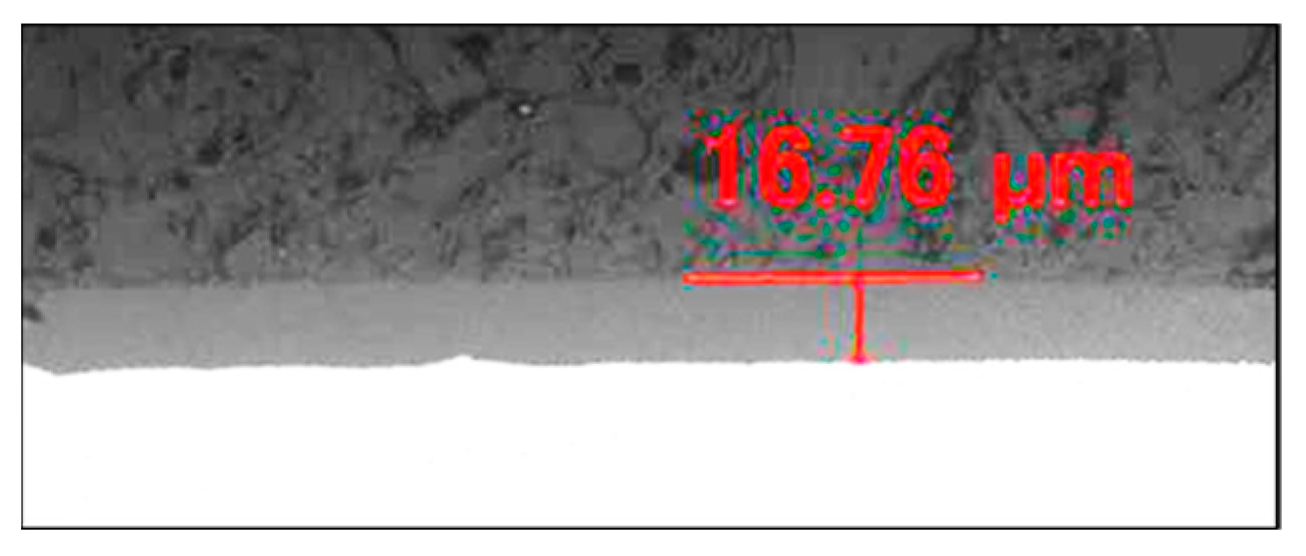
From the above-mentioned discussion, it is suggested that the surface roughness seemingly influences fatigue strength. If so, the fatigue strength of Anodize 2 can be improved by reducing the surface roughness of the specimen. To verify this hypothesis, surface-polished specimens of Anodize 2 were prepared by polishing the thicker Anodize 2 layer around 40 μm, aiming down to 20 μm. The surface roughness curve and the roughness parameters are shown in Figure 19 and Table 10, respectively. And the cross-section of the polished Anodize 2 is shown in Figure 20. The remaining anodized layer was around 17 μm. Then, the rotating bending fatigue property of the polished Anodize 2 was evaluated. The test result is shown in Figure 21. The fatigue strength at 107 cycles of the polished Anodize 2 was 103 MPa, which is 3% lower than that of the as-machined specimen, but 8% improved compared to that of Anodize 2. To confirm the effect of surface roughness reduction, the plot of the polished Anodize 2 is added onto Figure 18, as shown in Figure 22. From this result, it is considered that the reduction in the surface roughness is effective for the improvement in fatigue strength. However, the fatigue strength of the polished Anodize 2 is slightly lower than that of the as-machined specimen; even the surface roughness is smaller. This gap suggests that there are other detrimental factors besides surface roughness. Regarding residual stress, it was not possible to measure the residual stress of the anodized specimens itself in this study. It is known that the anodized layer has a tensile residual stress measured with the substrate curvature method [42], but it was also reported that the influence of the tensile residual stress of the anodized layer on the overall fatigue life was minor [33]. In order to clarify the total fatigue phenomena of anodized layer, other factors must be derived from the characteristics of anodic oxide itself. But, at this moment, it is concluded that the surface roughness is one of the dominant factors to determine the fatigue strength of the anodized components.

3.4. Corrosion Property

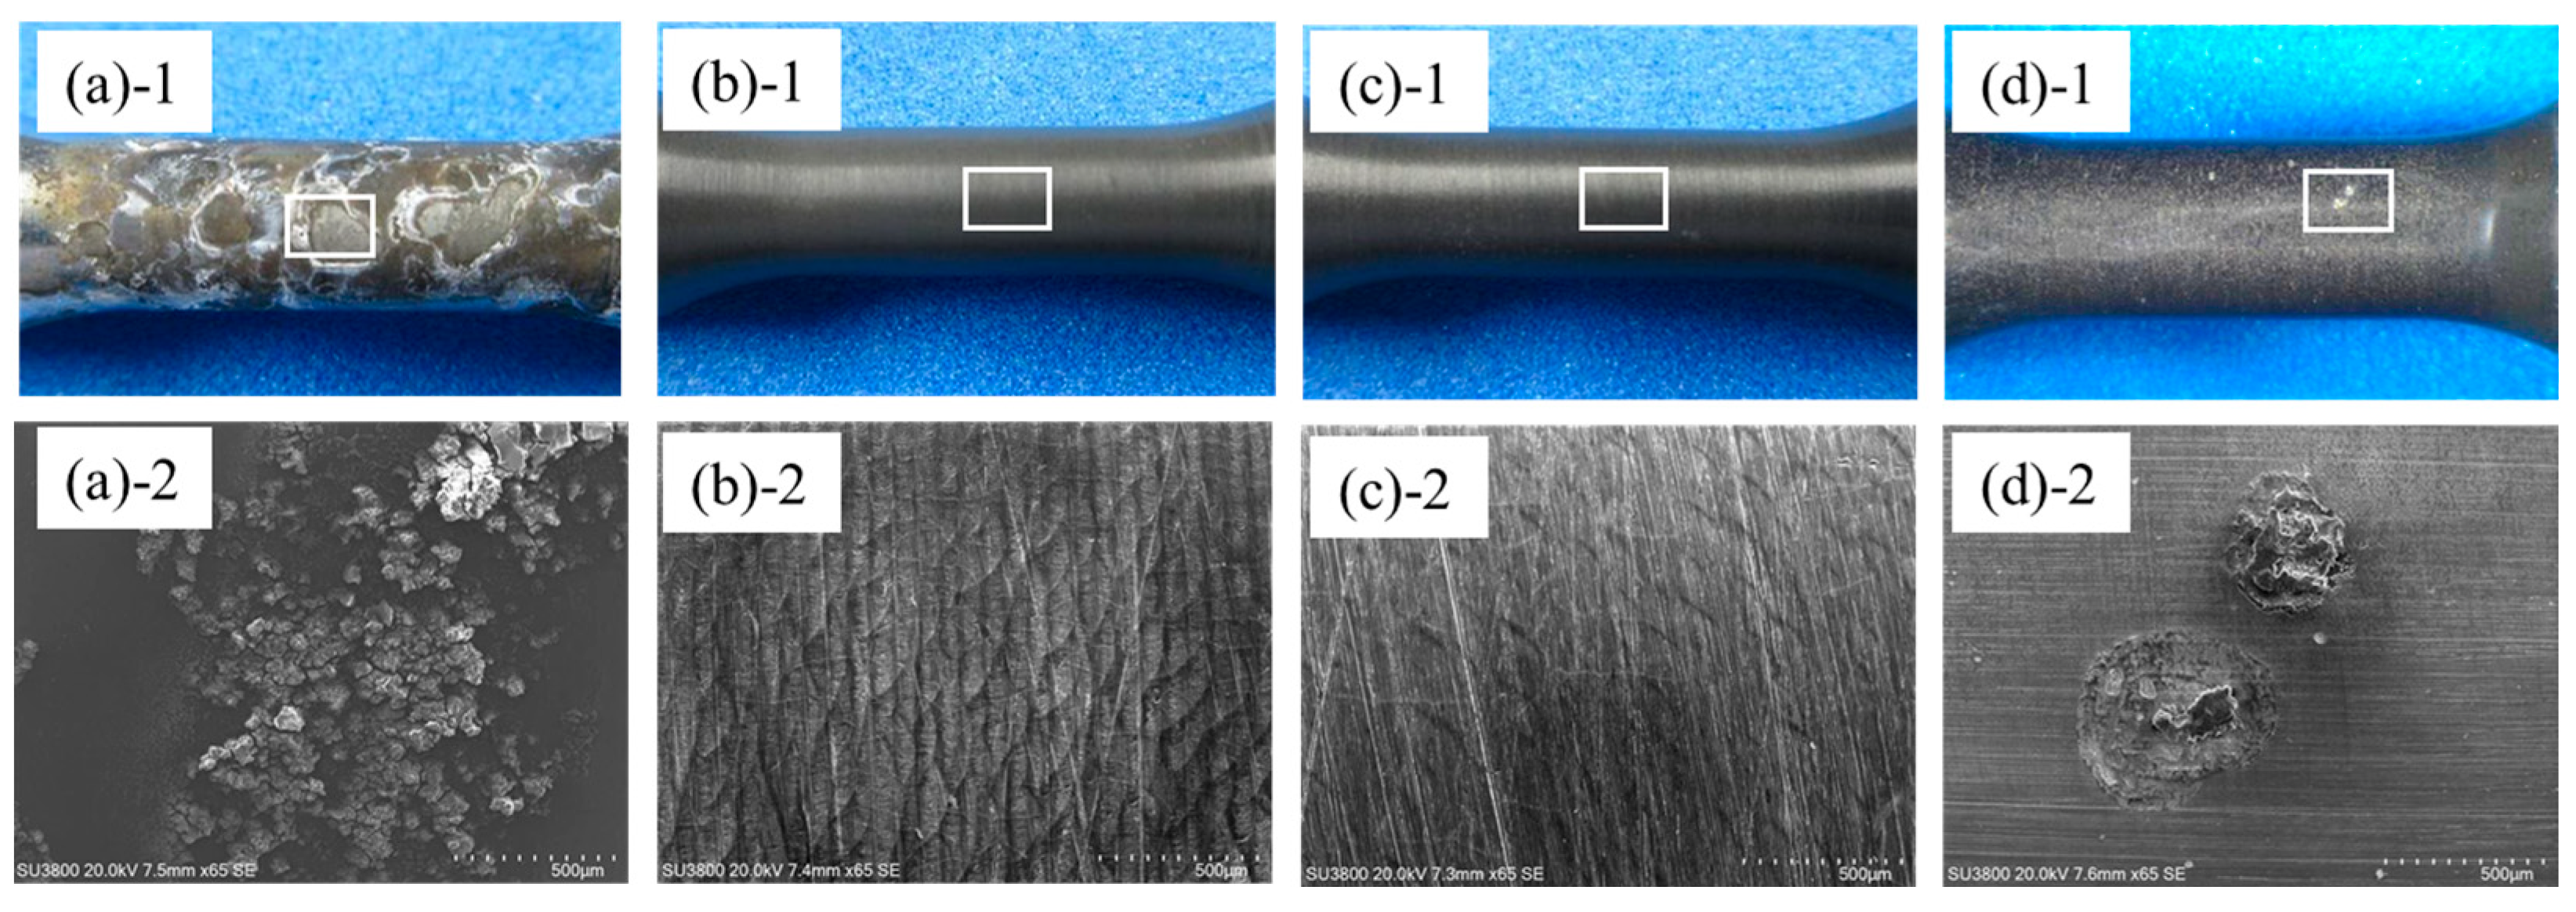
Corrosion of L-PBF AlSi10Mg alloy has been widely investigated, and a comprehensive review has also been presented [43]. According to this review, several kinds of corrosion can occur on the L-PBF AlSi10Mg alloy, such as uniform corrosion, pitting corrosion, intergranular corrosion and stress corrosion cracking. The corrosion properties found through the CASS test results of the as-machined, Anodize 1 and 2 and polished Anodize 2 specimens are shown in Figure 23. On the as-machined specimen, as shown in Figure 23a, severe uniform corrosion occurred. Generally, a thin natural oxide layer typically ranging from 1 to 10 nm in thickness covers the aluminum alloy surface. This natural oxide layer is relatively stable within a pH range of 4–9, but this stability is deteriorated in highly acidic or alkaline environments [43]. In the CASS test, the pH value of the solution is maintained between pH 3.1 and pH 3.3, as stated in JIS-Z2371:2015. The uniform corrosion observed on the as-machined specimen is attributed to a deterioration of the surface natural oxide layer in a highly acidic environment. Also, uniform dispersion of super fine Si diminishes the potential difference between Al and Si and accelerates uniform corrosion, preventing pitting and selective corrosion.
On the other hand, no corrosion was observed on the Anodize 1 and 2 specimens, as shown in Figure 23b,c. Ideal anodic oxide coatings have hexagonal columnar cells consisting of a thick porous outer layer and a thin compact inner barrier layer, as depicted in Ref. [27], which is the so-called Keller–Hunter–Robinson model. The pores are oriented perpendicular to an aluminum substrate located at the center of the cell. The barrier layer is located at the pore base between the porous layer and the substrate. The thickness of the barrier layer and that of the hexagonal cell is determined by anodization voltage. The anodized oxide layer of pure alumina is relatively stable except in high- and low-pH environments, but the anodic oxide coating of aluminum alloys is not composed only of pure alumina but includes alloying elements and compounds in the anodizing layer, resulting in deterioration of corrosion resistance [44]. Therefore, the sealing process is crucial for ensuring the corrosion resistance of the anodic oxide layer of aluminum alloys, and a lot of sealing procedures have been investigated such as H2O sealing, nickel fluoride (NiF2) sealing, nickel acetate (Ni(CH3COO)2) sealing, sodium acetate (NaCH3COO) sealing, cerium acetate (Ce(CH3COO)3) sealing, cerium nitrate (Ce(NO3)3) sealing, cerium chloride (CeCl3) sealing and so forth [45]. Among these, nickel acetate sealing is the most well-known procedure for the anodic oxide layer to enhance corrosion resistance [46]. In the nickel acetate sealing process, nickel hydroxide (Ni(OH)2) and boehmite (AlOOH) are co-deposited in the pore, as shown in the following reactions.
Ni2+ + 2OH → Ni(OH)2
Al2O3 + H2O → 2AlOOH
These compounds close or seal the pore so that it prohibits corrosive media from penetrating into the pore; subsequently, the corrosion resistance is improved. In the case of Anodize 1 and 2, nickel acetate sealing is effective for preventing the corrosion of the anodic oxide layer.
On the other hand, a pitting corrosion was slightly observed on the polished Anodize 2, as shown in Figure 23d. In general, the pitting corrosion of aluminum alloy is initiated by the local breakdown of a passive film formed on the aluminum alloy [43]. The anodizing process is a thickening process of the passive film by electrochemical reaction between the electrolyte and aluminum substrate. As mentioned before, the anodic oxide film consists of a thick porous outer layer and a thin inner barrier layer. In a case without any sealing, corrosive media penetrate into the bottom of the pore and attack the barrier layer. In such an occasion, pitting corrosion occurs on the anodic oxide film [47]. The polished Anodize 2 process involves forming a hard anodic oxide film around 40 μm thick on the specimen, sealing it with nickel acetate, and then polishing the surface layer of the anodic oxide film down to a thickness of around 20 μm to reduce the surface roughness. Figure 24 shows the Ni distribution in the cross-section of the anodized layers before and after CASS tests. In the case of Anodize 1 and 2, a thinner Ni layer was detected at the surface of the anodized layer even after the CASS tests. On the other hand, in the case of the polished Anodize 2, the sealed layer was partially removed, and as a result, the open pores were exposed in this polishing process. This led to the pitting corrosion of the polished Anodize 2.

4. Conclusions

Normal and hard anodizing were employed to treat 3D-printed AlSi10Mg alloy and then the anodized layers were characterized and the fatigue and corrosion properties investigated. As a result, the following conclusions were derived.
Uniform anodized layers were formed on the L-PBF AlSi10Mg alloy in the cases of both the normal and hard anodizing process. Both anodized layers consisted of an anodized maze-like α-Al 3D structure and web-like dispersed super fine Si particles. The surface roughness was in the following order: as-machined < normal anodizing < hard anodizing.
By anodizing, the fatigue strength at 107 cycles was decreased slightly compared to that of the as-machined specimen. And the fatigue strength after hard anodizing was lower than that after normal anodizing. By polishing the hard-anodized layer’s surface, the fatigue strength was much improved. It is considered that the surface roughness is one of the dominant factors in fatigue strength, but it is also suggested that other surface properties such as hardness, brittleness and so forth need to be taken into account.
It was revealed that the normal- and hard-anodized layers on L-PBF AlSi10Mg alloy had superior anti-corrosion resistance compared to as-machined L-PBF AlSi10Mg alloy.

Author Contributions

Conceptualization, H.K. (Hirotaka Kurita) and H.K. (Hideki Kyogoku); methodology, S.T., K.H. and K.W.; validation, K.M., K.S., K.W., S.T. and C.T.; formal analysis, H.K. (Hirotaka Kurita); investigation, H.K. (Hirotaka Kurita), S.T. and C.T.; resources, K.W., S.T. and K.H.; data curation, H.K. (Hirotaka Kurita), K.M., K.S. and C.T.; writing—original draft preparation, C.T., K.M., K.S., H.K. (Hirotaka Kurita) and H.K. (Hideki Kyogoku); writing—review and editing, H.K. (Hideki Kyogoku); visualization, H.K. (Hirotaka Kurita); supervision, H.K. (Hirotaka Kurita); project administration, H.K. (Hirotaka Kurita), S.T. and K.H. All authors have read and agreed to the published version of the manuscript.

Funding

This research received no external funding.

Data Availability Statement

The original contributions presented in this study are included in the article material. Further inquiries can be directed to the corresponding author.

Conflicts of Interest

Author Hirotaka Kurita, Kazunori Matsushima, Koji Satsukawa and Keita Watanabe were employed by the company Yamaha Motor Co., Ltd.; Author Chika Tanaka and Kenji Hara were employed by the company OKUNO Chemical Industries Co., Ltd. The remaining authors declare that the research was conducted in the absence of any commercial or financial relationships that could be construed as a potential conflict of interest.

References

  1. McMahon, M. Aluminium Additive Manufacturing: How a new generation of alloys will fuel industry growth. Metal AM 2024, 10, 107–123. [Google Scholar]
  2. McMahon, M.; Williams, N. BMW Group: Laying the foundations for the application of metal Additive Manufacturing in the automotive industry. Metal AM 2024, 10, 131–147. [Google Scholar]
  3. Mower, T.M.; Long, M.J. Mechanical behavior of additive manufactured, powder-bed laser-fused materials. Mater. Sci. Eng. A 2016, 651, 198–213. [Google Scholar] [CrossRef]
  4. Martin, J.H.; Yahata, B.D.; Hundley, J.M.; Mayer, J.A.; Schaedler, T.A.; Pollock, T.M. 3D printing of high-strength aluminum alloys. Nature 2017, 549, 365–369. [Google Scholar] [CrossRef]
  5. Liu, S.; Zhu, H.; Peng, G.; Yin, J.; Zeng, X. Microstructure prediction of selective laser melting AlSi10Mg using finite element analysis. Mater. Des. 2018, 142, 319–328. [Google Scholar] [CrossRef]
  6. Minkowitz, L.; Arneitz, S.; Effertz, P.S.; Armancio-Filho, S.T. Laser-powder bed fusion process optimization of AlSi10Mg using extra trees regression. Mater. Des. 2023, 227, 111718. [Google Scholar] [CrossRef]
  7. Gao, C.; Tang, H.; Zhang, S.; Mao, Z.; Bi, Y.; Rao, J.-H. Process optimization for Up-Facing Surface Finish of AlSi10Mg Alloy Produced by Laser Powder Bed Fusion. Metals 2022, 12, 2053. [Google Scholar] [CrossRef]
  8. Han, Q.; Gu, H.; Soe, S.; Setchi, R.; Lacan, F.; Hill, J. Manufacturability of AlSi10Mg overhang structures fabricated by laser powder bed fusion. Mater. Des. 2018, 160, 1080–1095. [Google Scholar] [CrossRef]
  9. Nagamoto, H.; Kobayashi, K.; Fujita, H. Stiffness optimization process using topology optimization techniques and lattice structures. In Proceedings of the 26th Small Powertrains and Energy Systems Technology Conference, Hyogo, Japan, 31 October–3 November 2022; p. 2022-32-0078. [Google Scholar]
  10. Dallari, E.; Bononi, M.; Pola, A.; Tocci, M.; Veronesi, P.; Giovanardi, R. Pulsed Current Effect on the Hard Anodizing of an AlSi10Mg Aluminum Alloy Obtained via Additive Manufacturing. Surfaces 2023, 6, 97–113. [Google Scholar] [CrossRef]
  11. Rubben, T.; Revilla, R.T.; De Graeve, I. Effect of heat treatments on the anodizing behavior of additive manufactured AlSi10Mg. J. Electrochem. Soc. 2019, 166, C42–C48. [Google Scholar] [CrossRef]
  12. Hirata, T.; Kimura, T.; Nakamoto, T. Effect of Internal Pores on Fatigue Properties in Selective Laser Melted AlSi10Mg Alloy. Mater. Trans. 2022, 63, 1013–1020. [Google Scholar] [CrossRef]
  13. Wu, Z.; Wu, S.; Bao, J.; Qian, W.; Karabal, S.; Sun, W.; Withers, P. The effect of defect population on the anisotropic fatigue resistance of AlSi10Mg alloy fabricated by laser powder bed fusion. Int. J. Fatigue 2021, 151, 106317. [Google Scholar] [CrossRef]
  14. Lehner, P.; Blinn, B.; Beck, T. Improving the Defect Tolerance and Fatigue Strength of AM AlSi10Mg. Adv. Eng. Mater. 2023, 25, 2201855. [Google Scholar] [CrossRef]
  15. Roveda, I.; Serrano-Munoz, I.; Haubrich, J.; Requena, G.; Nadia, M. Investigation on the fatigue strength of AlSi10Mg fabricated by PBF-LB/M and subjected to low temperature heat treatments. Mater. Des. 2024, 244, 113170. [Google Scholar] [CrossRef]
  16. Sausto, F.; Tezzele, C.; Beretta, S. Analysis of Fatigue Strength of L-PBF AlSi10Mg with Different Surface Post-Processes: Effect of Residual Stresses. Metals 2022, 12, 898. [Google Scholar] [CrossRef]
  17. Brandão, A.D.; Gumpinger, J.; Gschweitl, M.; Seyfert, C.; Hofbauer, P.; Ghidini, T. Fatigue Properties Of Additively Manufactured AlSi10Mg—Surface Treatment Effect. Procedia Struct. Integr. 2017, 7, 58–66. [Google Scholar] [CrossRef]
  18. Fini, S.; Croccolo, D.; De Agostinis, M.; Olmi, G.; Paiardini, L.; Scapecchi, C.; Mele, M. Fatigue response of AlSi10Mg by laser powder bed fusion: Influence of build orientation, heat, and surface treatments. Prog. Addit. Manuf. 2024, 10, 1385–1403. [Google Scholar] [CrossRef]
  19. Linder, C.; Vucko, F.; Ma, T.; Proper, S.; Dartfelt, E. Corrosion-Fatigue Performance of 3D-Printed (L-PBF) AlSi10Mg. Materials 2023, 16, 5694. [Google Scholar] [CrossRef]
  20. Zhang, L.; Jiang, B.; Zhang, P.; Yan, H.; Xu, X.; Liu, R.; Tang, J.; Ren, C. Methods for fatigue-life estimation: A review of the current status and future trends. Nanotechnol. Precis. Eng. 2023, 6, 025001. [Google Scholar] [CrossRef]
  21. Lee, J.; Park, S.-Y.; Choi, B.-H. Evaluation of Fatigue Characteristics of Aluminum Alloys and Mechanical Components Using Extreme Value Statistics and C-Specimens. Metals 2021, 11, 1915. [Google Scholar] [CrossRef]
  22. Srinivasan, D.V.; Moradi, M.; Komninos, P.; Zarouchas, D.; Vassilopoulos, A.P. A generalized machine learning framework to estimate fatigue life across materials with minimal data. Mater. Des. 2024, 246, 113355. [Google Scholar] [CrossRef]
  23. JIS B0601:1994; Geometrical Product Specifications (GPS)-Surface Roughness-Definitions and Parameters. Japanese Standards Association: Minato-ku, Tokyo, Japan, 1994.
  24. JIS Z2371:2015; Corrosion Tests in Artificial Atmospheres-Salt Spray Test. Japanese Standards Association: Minato-ku, Tokyo, Japan, 2015.
  25. Chernyakova, K.; Tzaneva, B.; Vrublevsky, I.; Videkov, V. Effect of Aluminum Anode Temperature on Growth Rate and Structure of Nanoporous Anodic Alumina. J. Electrochem. Soc. 2020, 167, 103506. [Google Scholar] [CrossRef]
  26. Robbins, H.; Schwartz, B. Chemical Etching of Silicon I. The System HF, HNO3 and H2O. J. Electrochem. Soc. 1959, 106, 505–508. [Google Scholar] [CrossRef]
  27. Keller, F.; Hunter, M.S.; Robinson, D.L. Structural Features of Oxide Coatings on Aluminum. J. Electrochem. Soc. 1953, 100, 411–419. [Google Scholar] [CrossRef]
  28. Iwai, M.; Kikuchi, T. Fabrication of unique porous alumina films with extremely high porosity and an ultra-flat barrier layer by anodizing aluminum in sodium metaborate. Electrochim. Acta 2021, 399, 139440. [Google Scholar] [CrossRef]
  29. Schneider, M.; Fürbeth, W. Anodizing—The pore makes the difference. Mater. Corros. 2022, 73, 1752. [Google Scholar] [CrossRef]
  30. Maejima, M. Causes of Cracks in Aluminum Anodic Oxide Coating. J. Alum. Finish. Soc. Kinki 2018, 310, 7–12. (In Japanese) [Google Scholar]
  31. Mora-Sanchez, H.; del Olmo, R.; Rams, J.; Torres, B.; Mohedano, M.; Matykina, E.; Arrabal, R. Hard Anodizing and Plasma Electrolytic Oxidation of an Additively Manufactured Al-Si alloy. Surf. Coat. Technol. 2021, 420, 127339. [Google Scholar] [CrossRef]
  32. Zhang, P.; Zuo, Y. Effects of pore parameters on performance of anodic film on 2024 aluminum alloy. Mater. Chem. Phys. 2019, 231, 9. [Google Scholar] [CrossRef]
  33. Winter, L.; Lampke, T. Fatigue Resistance of an Anodized and Hardanodized 6082 Aluminum Alloy Depending on the Coating Thickness in the High Cycle Regime. Adv. Eng. Mater. 2023, 25, 2300394. [Google Scholar] [CrossRef]
  34. Malek, B.; Chaussumier, M.; Mabru, C. Effect of anodization and loading on fatigue life of 2618-T851 aluminum alloy. Int. J. Fract. 2022, 240, 209–220. [Google Scholar] [CrossRef]
  35. Shahzad, M.; Chaussumier, M.; Chieragatti, R.; Mabru, C.; Rezai-Aria, F. Influence of Anodizing Process on Fatigue Life of Machined Aluminium Alloy. Procedia Eng. 2010, 2, 1015–1024. [Google Scholar] [CrossRef]
  36. Sadeler, R. Effect of a commercial hard anodizing on the fatigue property of a 2014-T6 aluminium alloy. J. Mater. Sci. 2006, 41, 5803–5809. [Google Scholar] [CrossRef]
  37. Nakamura, Y.; Sakai, T.; Hirano, H.; Chandran, K.S.R. Effect of alumite surface treatments on long-life fatigue behavior of a cast aluminum in rotating bending. Int. J. Fatigue 2010, 32, 621–626. [Google Scholar] [CrossRef]
  38. Nasab, M.H.; Giussani, A.; Gastaldi, D.; Tirelli, V.; Vedani, M. Effect of Surface and Subsurface Defects on Fatigue Behavior of AlSi10Mg Alloy Processed by Laser Powder Bed Fusion (L-PBF). Metals 2019, 9, 1063. [Google Scholar] [CrossRef]
  39. Strauß, L.; Pang, G.A.; Löwisch, G. Fatigue life prediction of additively manufactured AlSi10Mg based on surface roughness and residual stress. Fatigue Fract. Eng. Mater. Struct. 2024, 47, 4465–4477. [Google Scholar] [CrossRef]
  40. Afroz, L.; Qian, M.; Forsmark, J.; Li, Y.; Easton, M.; Das, R. Fatigue life of laser powder bed fusion (L-PBF) AlSi10Mg alloy: Effects of surface roughness and porosity. Prog. Addit. Manuf. 2025, 10, 2423–2441. [Google Scholar] [CrossRef]
  41. Du Plessis, A.; Beretta, S. Killer notches: The effect of as-built surface roughness on fatigue failure in AlSi10Mg produced by laser powder bed fusion. Addit. Manuf. 2020, 35, 101424. [Google Scholar] [CrossRef]
  42. Alwitt, R.S.; Xu, J.; McClung, R.C. Stresses in Sulfuric Acid Anodized Coatings on Aluminum. J. Electrochem. Soc. 1993, 140, 1241–1246. [Google Scholar] [CrossRef]
  43. Laieghi, H.; Kvvssn, V.; Butt, M.M.; Ansari, P.; Salamci, M.U.; Patterson, A.E.; Salamci, E. Corrosion in laser powder bed fusion AlSi10Mg alloy. Eng. Rep. 2024, 6, e12984. [Google Scholar] [CrossRef]
  44. Martinez-Viademonte, M.P.; Abrahami, S.T.; Hack, T.; Burchardt, M.; Terryn, H. A Review on Anodizing of Aerospace Aluminum Alloys for Corrosion Protection. Coatings 2020, 10, 1106. [Google Scholar] [CrossRef]
  45. Ofoegbu, S.U.; Fernandes, F.A.O.; Pereira, A.B. The Sealing Step in Aluminum Anodizing: A Focus on Sustainable Strategies for Enhancing Both Energy Efficiency and Corrosion Resistance. Coatings 2020, 10, 226. [Google Scholar] [CrossRef]
  46. Jo, H.; Lee, S.; Kim, D.; Lee, J. Low Temperature Sealing of Anodized Aluminum Alloy for Enhancing Corrosion Resistance. Materials 2020, 13, 4904. [Google Scholar] [CrossRef]
  47. De Sousa Araujo, J.V.; Milagre, M.X.; Zhou, X.; Costa, I. An assessment of pitting corrosion in anodized aluminum alloys: It might not be what it seems. Mater. Corros. 2023, 75, 599–613. [Google Scholar] [CrossRef]
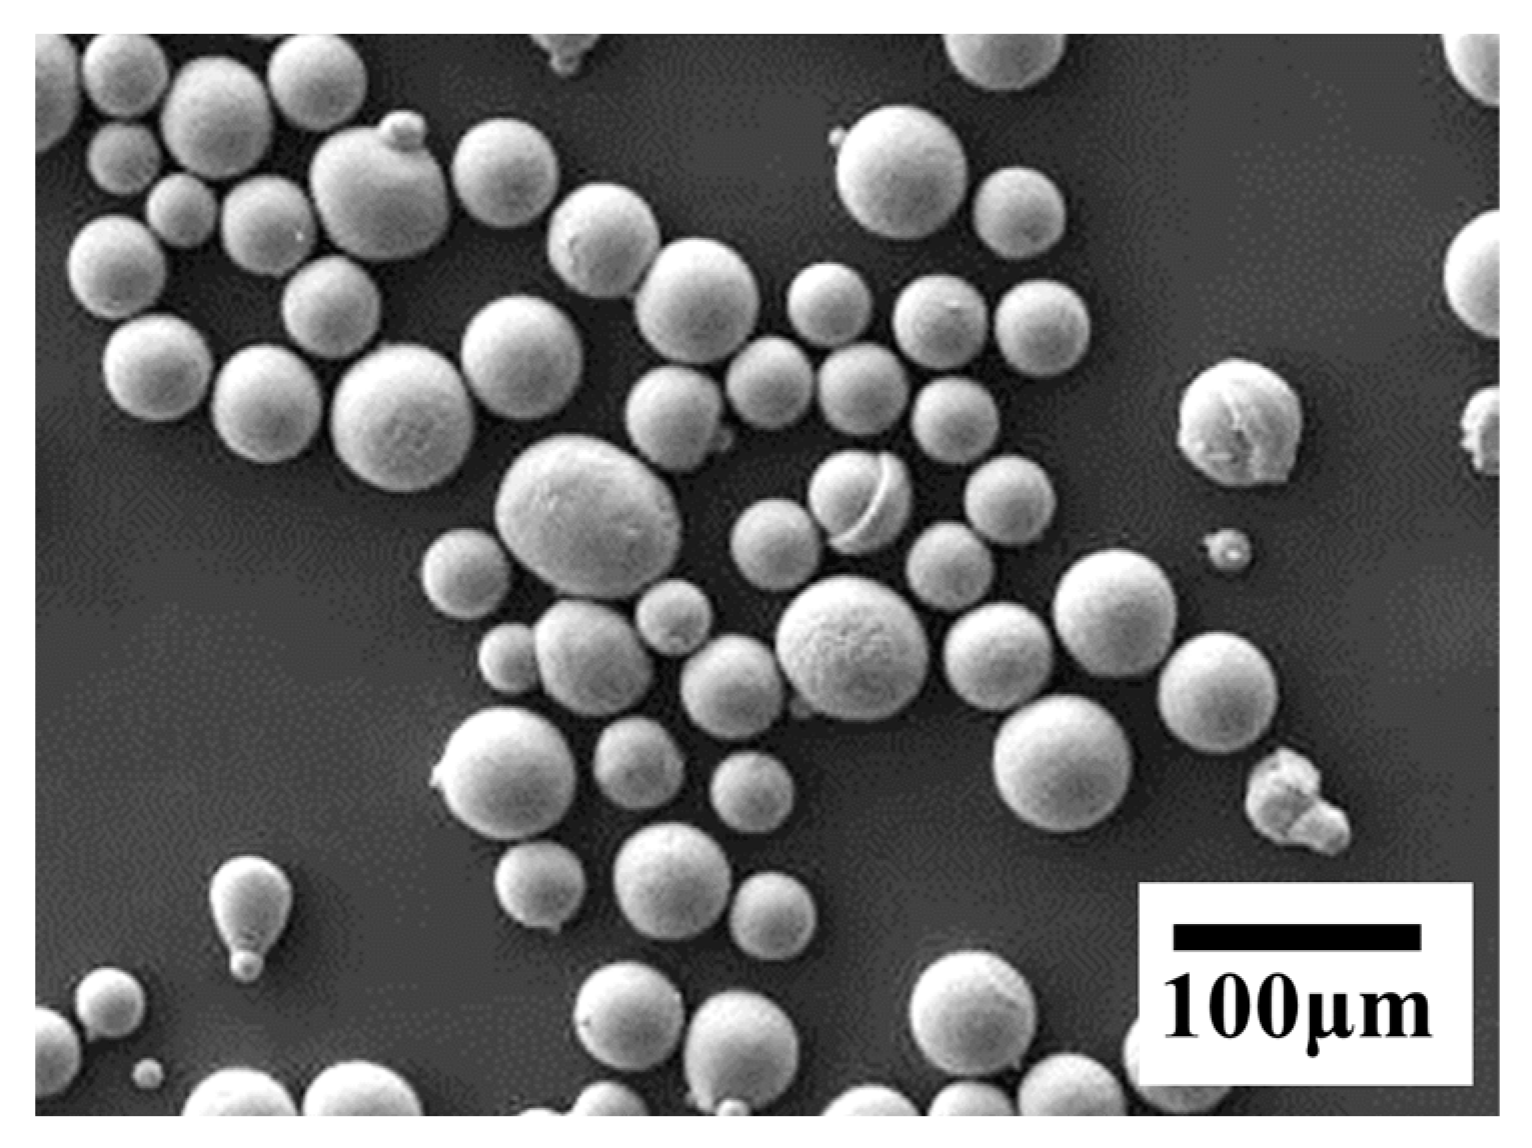
Figure 1. Appearance of disk-atomized AlSi10Mg powder.
Metals 15 01022 g001
Figure 2. Building direction of test bar.
Metals 15 01022 g002
Figure 3. Arrangement of test bars on a build plate.
Metals 15 01022 g003
Figure 4. Geometry of test specimen (mm).
Metals 15 01022 g004
Figure 5. Ono-type rotating bending fatigue testing machine. (a) Schematic illustration of rotating bending fatigue testing machine. (b) Stress occurred on a test specimen by bending moment.
Metals 15 01022 g005
Figure 6. Normal Q-Q (Quantile-Quantile) plot of relative density. Relationship between measured relative density and expected value of relative density.
Metals 15 01022 g006
Figure 7. Anodized layer thickness and final electrolytic voltage as a function of anodizing time.
Metals 15 01022 g007
Figure 8. As-anodized test specimens. (a) Appearance of as-anodized test specimens. Upper: Anodize 1. Lower: Anodize 2. (b) Cross-section of Anodize 1. (c) Cross-section of Anodize 2.
Metals 15 01022 g008
Figure 9. SEM micrograph of cross-section of anodized layer. (a) Anodize 1; (b) Anodize 2.
Metals 15 01022 g009
Figure 10. FE-SEM micrograph and chemical mapping of the cross-section of Anodize 2. Specimen is in its as-polished (no etched) condition. (Lower side: matrix; upper side: anodized layer).
Metals 15 01022 g010
Figure 11. FE-SEM micrograph and chemical mapping of the cross-section of Anodize 2. Specimen is etched with Keller’s reagent. (Lower side: matrix; upper side: anodized layer).
Metals 15 01022 g011
Figure 12. Magnified FE-SEM micrograph of the cross-section of Anodize 1 and 2. (a,b): Anodize 1; (c,d): Anodize 2. Scale bars correspond to 1 mm. (a,c): Lower side: matrix; upper side: anodized layer. (b,d): Anodized layer.
Metals 15 01022 g012
Figure 13. SEM micrograph of the surface of Anodize 1 and 2. (a,b): Anodize 1; (c,d): Anodize 2.
Metals 15 01022 g013
Figure 14. Surface roughness curves. (a): As-machined; (b): Anodize 1; (c): Anodize 2.
Metals 15 01022 g014
Figure 15. Rotating bending fatigue test result. (Left): Global view of S-N curve. (Right): Magnified view of around 107 fatigue limits.
Metals 15 01022 g015
Figure 16. Effect of relative density of L-PBF AlSi10Mg alloy on fatigue strength. The data shown in the solid circles is adapted from Ref. [12]. The open circle is the data of the as-machined specimen.
Metals 15 01022 g016
Figure 17. SEM micrograph of fracture surface neighboring initiation point shown by arrows. (a,b): As-machined. Fractured at 3.90 × 10⁵ cycles loaded with 109 MPa. (c,d): Anodize 1. Fractured at 2.20 × 10⁶ cycles loaded with 103 MPa. (e,f): Anodize 2. Fractured at 7.58 × 10⁵ cycles loaded with 97 MPa.
Metals 15 01022 g017
Figure 18. The relationship between surface roughness and fatigue strength at 107 cycles. (a): Ra; (b): Rv; (c): Rz; (d): Ry.
Metals 15 01022 g018
Figure 19. Surface roughness curves. (a): Polished Anodize 2; (b): Anodize 2, same as Figure 14c.
Metals 15 01022 g019
Figure 20. Cross-section of polished Anodize 2.
Metals 15 01022 g020
Figure 21. Rotating bending fatigue test results of polished Anodize 2 specimens compared to those of as-machined and Anodize 2 specimens. Left: Global view of S-N curve. Right: Magnified view of around 107 fatigue limits.
Metals 15 01022 g021
Figure 22. The effect of surface roughness reduction on fatigue strength at 107 cycles. (a): Ra; (b): Rv; (c): Rz; (d): Ry.
Metals 15 01022 g022
Figure 23. Appearance of test specimens after 16 h of CASS test. (a)-1, 2: As-machined; (b)-1, 2: Anodize 1; (c)-1, 2: Anodize 2; (d)-1, 2: polished Anodize 2.
Metals 15 01022 g023
Figure 24. Distribution on Ni in cross-section of anodized layer before and after CASS test. Ni is concentrated in the portion indicated by allows.
Metals 15 01022 g024
Table 1. Chemical composition of AlSi10Mg alloy (mass %).
SiMgFeTi, Mn, Ni, Cu, ZnAl
10.000.360.090.01Bal.
Table 2. Particle size distribution (μm).
D10D50D90
27.6844.8764.83
Table 3. Density of AlSi10Mg powder.
Apparent Density
(g/cm3)
Packing Density
(%)
1.4453.9
True density: 2.67 g/cm3.
Table 4. Three-dimensional printing parameters.
3D PrinterSLM280 (Nikon SLM Solutions)
Laser power650 W
Scan speed1850 mm/s
Layer thickness60 μm
Hatch distance0.17 mm
Focus−4 mm
Plate temperature150 °C
AtmosphereN2
Table 5. Detailed treatment conditions of Anodize 1 and Anodize 2.
Anodize 1
ProcessChemicalsConcentrationTemperatureTreatment timeCurrent Density
(Voltage)
DegreasingTOP ALCLEAN 101 (EDCM)
Weak Alkaline type
30 g/L60 °C2 minN/A
AnodizingH2SO4180 g/L20 ± 1 °C85 min1.0 A/dm2
(15–35 V)
SealingTOP SEAL H-298
Ni Acetate type
40 mL/L92 °C30 minN/A
Anodize 2
ProcessChemicalsConcentrationTemperatureTreatment timeCurrent Density
(Voltage)
DegreasingTOP ALCLEAN 101 (EDCM)
Weak Alkaline type
30 g/L60 °C2 minN/A
AnodizingH2SO4180 g/L5 ± 1 °C70 min1.0 A/dm2
(35–50 V)
SealingTOP SEAL H-298
Ni Acetate type
40 mL/L92 °C30 minN/A
Table 6. Relative density (%).
Average99.75
Maximum99.78
Minimum99.69
σ0.02
Table 7. Anodized layer thickness (μm).
Anodize 1Anodize 2
Average19.7520.30
Maximum20.6421.13
Minimum19.0419.11
σ0.590.76
Table 8. Surface roughness (μm).
ParameterAs-MachinedAnodize 1Anodize 2
Ra0.2350.7251.033
Rz1.7283.1274.711
Rv1.3002.4713.726
Ry2.2284.7636.799
S15.32930.35332.874
Standard: JIS B 0601: 1994 [23]. Ra: Arithmetic average roughness. Rz: Ten-point average roughness. Rv: Maximum valley depth. Ry: Maximum height. S: Average spacing of local peaks.
Table 9. Hardness of anodized layer (HV).
Anodize 1Anodize 2
Average285343
Maximum297367
Minimum265324
Table 10. Surface roughness of Polished Anodize 2 (μm).
ParameterPolished Anodize 2
Ra0.097
Rz0.454
Rv0.397
Ry0.705
S22.110
Standard: JIS B 0601: 1994 [23]. Ra: Arithmetic average roughness. Rz: Ten-point average roughness. Rv: Maximum valley depth. Ry: Maximum height. S: Average spacing of local peaks.
Disclaimer/Publisher’s Note: The statements, opinions and data contained in all publications are solely those of the individual author(s) and contributor(s) and not of MDPI and/or the editor(s). MDPI and/or the editor(s) disclaim responsibility for any injury to people or property resulting from any ideas, methods, instructions or products referred to in the content.