Abstract
In the present paper, impedance spectroscopy was employed to study the corrosion and anodic oxidation of stainless steel (AISI 316L at 280 °C/9 MPa) in contact with the boron-free primary coolant of a small modular reactor at two levels of KOH concentration. Analysis of impedance spectra with a distribution of relaxation times revealed contributions from the oxide layer and its interface with the coolant. Glow-Discharge Optical Emission Spectroscopy (GDOES) was used to estimate the thickness and elemental composition of the formed oxides. A quantitative interpretation of the impedance data using the Mixed-Conduction Model allowed us to estimate the kinetic and transport parameters of oxide growth and dissolution, as well as iron dissolution through oxide. The film thicknesses following exposure agreed with ex-situ analyses. The obtained corrosion and release rates were used for comparison with laboratory and industrial data in nominal pressurized water reactor primary coolants.
1. Introduction
Small modular reactors (SMRs) have been used since the 1960s to power nuclear submarines and as neutron sources, and their science and engineering have developed accordingly [1,2]. In the past decade, they have emerged as a viable alternative to conventional Generation III fission reactors, which continue to grow in size and power, leading to increased costs and longer construction periods.
Due to their compact design, modern SMRs feature several safety-oriented passive or inherent engineering solutions. Some models are designed to be placed underground to increase resistance to threats due to impact [2,3]. The main contemporary challenges in the mass production of SMRs are related to difficulties in licensing and increased costs per MW, which means they are not yet a viable option as a clean energy technology. Innovative designs to improve overall stability are likely to influence material degradation processes, impacting the structural integrity, support simplicity, and service life of reactor components. In this context, changes in reactor design may lead to void swelling replacing irradiation-assisted stress corrosion cracking (IASCC) as the main localized degradation mode of internals. The embrittlement mechanism of the reactor vessel could also be altered because of compact design features. Furthermore, alternative configurations of key component parts need additional research and development projects despite the relatively minor changes in material selection and production technologies for both reactor internals and steam generator tubing [3,4,5,6,7]. A range of studies on material degradation in SMR primary water chemistry have been published in recent years [8,9,10,11,12,13,14,15]. These works emphasized oxide film structure and morphology, the release of soluble products during the corrosion of stainless steels (used as reactor cladding and/or internals), and nickel-based alloy 690 (a prospective steam generator tubing material) [8,9,10], and the dynamics of corrosion and oxide formation on compatible materials [11,12]. In addition, a few studies have envisaged the prospective use of titanium alloys as an alternative to stainless steels [13,14,15]. However, in situ electro-chemical methods have not been employed to investigate the corrosion mechanisms of pressurized water reactor (PWR) internals (such as AISI 316L) and steam generator tubing alloys (such as alloy 690) in advanced boron-free chemistry, which is expected to prevail for the primary circuit of SMRs.
In an attempt to fill this knowledge gap, the purpose of our on-going project is to assess the oxide film formation mechanism and the kinetics of the general corrosion of AISI 316L stainless steel as a function of alkali concentration, as well as the addition of dissolved hydrogen and Zn in boron-free conditions. The present paper presents and discusses the results for AISI 316L in two coolants with different KOH contents. These concentrations were chosen as analogous to those at the middle and end of the power cycle in Russian-designed PWRs (Water–Water Energy Reactors; WWERs). First, a detailed description of the chemical and electrochemical conditions is given. Second, the results of electrochemical impedance spectroscopy (EIS) measurements taken during steel exposure to the coolants for up to 168 h are discussed in relation to the corrosion rates. To estimate the stability of the material under further oxidation, the steel was polarized to several potentials more positive than the free corrosion potential at the end of exposure. Glow-Discharge Optical Emission Spectroscopy (GDOES) was used to estimate the thickness and in-depth composition of the oxides formed at the corrosion potential. Quantitative interpretation of EIS data was achieved via the Mixed-Conduction Model for Oxide Films (MCM) [16] to estimate the kinetic parameters of oxide formation and the release of soluble products. Based on the experimental and calculation results, preliminary conclusions about the general corrosion mechanism of AISI 316L as a representative reactor internal are drawn, and future research directions are outlined.
2. Materials and Methods
Sheets of 1.2 mm-thick commercial AISI 316L were cut as corrosion samples and used as working electrodes (typical area 0.4–0.6 cm2). The GDOES analysis of the average composition at three spots and at a depth of 30 μm is presented in Table 1. Pretreatment of the working electrodes featured degreasing with acetone, mechanical abrasion with grade-2400 emery paper, and drying in hot air.

Table 1.
Average composition of the steel as estimated by GDOES at a depth of 30 μm.
A three-electrode flow-through cell of 316 L (volume ca. 0.1 dm3) located in a hot part of a laboratory-made re-circulation loop (Figure 1) was used for the electrochemical measurements.
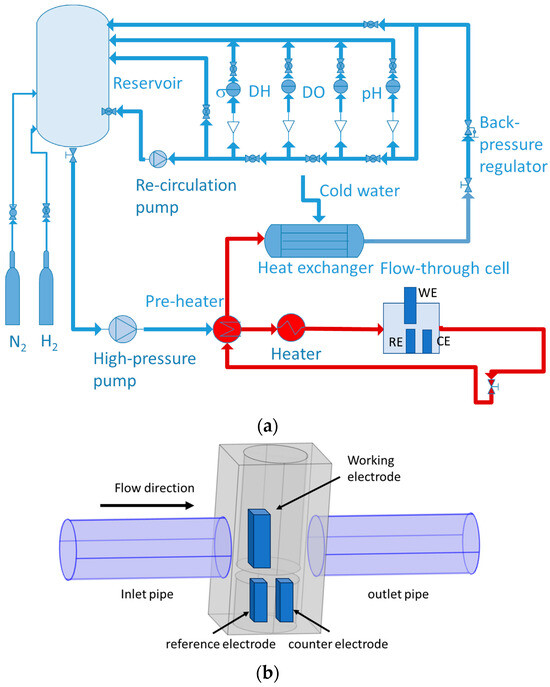
Figure 1.
Re-circulation loop (a) with a flow-through cell (b). WE-working electrode (AISI 316L), RE—reference electrode, CE—counter electrode.
Pre-oxidation of internal loop surfaces in 12 mg kg−1 KOH at 280 °C for 168 h was performed to produce a protective layer and minimize the release of soluble corrosion products, as checked using chemical analysis. A Pt plate (99.9%, Goodfellow) played the role of a counter electrode. A Pd sheet (99.9%, Goodfellow) polarized with a current density of −60 µA cm−2 against another Pt plate was employed as a reversible hydrogen reference electrode (RHE). All potentials in this study were recalculated to the standard hydrogen electrode (SHE) scale. Electrolytes composed of 3 or 6 mg kg−1 (0.053 or 0.106 mmol kg−1) KOH, pH 6.8, and 7.2 at 280 °C (denoted as low-K and high-K) were continuously circulated through the cell at a flow rate of 2 dm3 h−1, resulting in an estimated linear fluid velocity of 1 cm s−1.
To ensure a dissolved oxygen level below 0.31 µmol kg−1, the electrolytes were continuously purged with N2 (99.999%). The measurement temperature of 280 ± 1 °C at a pressure of 9.50 ± 0.01 MPa was reached after 2–2.5 h. After stabilization of the open circuit potential (ca. 1 h), EIS measurements commenced and continued for up to 140 h. A 10,030 Compactstat (Ivium, Eindhoven, the Netherlands), operating in floating mode and driven by IviumSoft 4.9 software, was employed for all electrochemical measurements. A zero-dc current mode was chosen for EIS, with an amplitude of 10 µA (rms) at a frequency range of 1.1 kHz–0.1 mHz. Data at frequencies higher than 1 kHz were dominated by electrolyte resistance and were not included. Measurements of several spectra with amplitudes between 2 and 10 µA ensured the linearity of EIS. Causality was verified via a Kramers–Kronig compatibility test using the measurement model and associated software [17]. Following exposure, to investigate the stability of the passive layer under anodic oxidation, the samples were polarized up to a potential 0.5 V more positive than the open-circuit potential. Reproducibility of ±1% by impedance magnitude and ±3° by phase angle was reached by conducting all measurements at least three times.
Complex non-linear fitting of impedance data to the transfer function of the proposed model using a Levenberg–Marquardt algorithm was performed on an Origin Pro platform (OriginLab, Northampton, MA, USA). Each dataset was statistically weighted.
A GDA750HR instrument (Spectruma Analytik, Hof, Germany) produced elemental profiles of the samples after exposure using an anode 2.5 mm in diameter and a polychromator (focal length 750 mm, grating 2400 channels mm−1). Typical measurement parameters were 950 V and 9 mA at a pressure of 3 hPa. Certified reference materials chosen to cover the constituent elements of stainless steels in the relevant concentration ranges were used in a calibration procedure run before each profile acquisition.
3. Experimental Results
3.1. Open-Circuit Potential vs. Time, Current vs. Potential, and EIS Measurements During Exposure
The open-circuit potential (OCP) of AISI 316L was found to increase logarithmically with time after an induction period, indicating passivation of the steel in both studied chemistries (Figure 2). In the high-K regime, the passivation started earlier (at ca. 20 h), but the final stable potential of −0.70 ± 0.02 V was reached after ca. 100 h in both media.
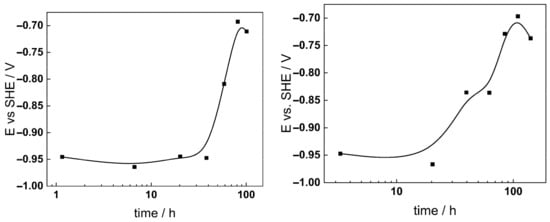
Figure 2.
Corrosion potential vs. time during exposure of AISI 316L to 3 (left) and 6 mg kg−1 KOH (right) at 280 °C.
The values of the OCP after 168 h of exposure, as shown in an E-pH diagram of Fe-Cr-Ni-H2O at 280 °C/9 MPa (Figure 3), indicate that the stable corrosion product was probably chromite (FeCr2O4) with some incorporated Ni (0), as observed for similar steels in the pressurized water reactor B-K-Li primary chemistry [16]. Several recent works support the predictions of the E-pH diagram using SEM/EDS and TEM characterization of PWR oxides on 316L featuring an inner layer with a composition close to (Fe, Ni)Cr2O4 and an outer layer composition close to NiFe2O4 [18,19,20,21,22].
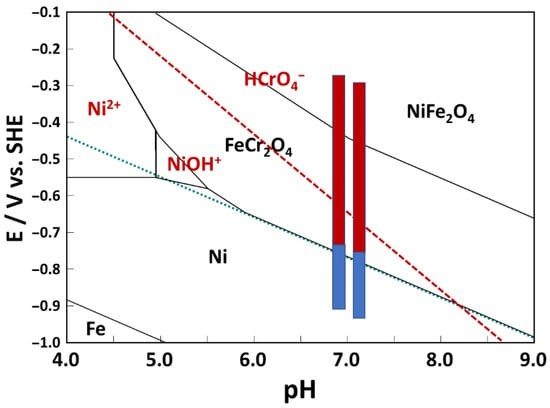
Figure 3.
Electrochemical conditions during exposure at open circuit (blue) and anodic polarization (red) in 3 (left vertical line) and 6 mg kg−1 KOH (right vertical line) are shown in an E-pH diagram for the Fe-Cr-Ni-H2O system at 280 °C (total Fe and total Ni concentration 0.1 µmol kg−1, total Cr concentration 0.01 µmol kg−1).
Figure 4 shows the current vs. potential curves constructed using the current values at the end of pretreatment before each EIS measurement in the anodic direction. An increase of current density followed by a maximum was observed at −0.5 V in the low-K and −0.75 V in the high-K coolant, likely due to the higher pH of the latter (7.2 vs. 6.8 at 280 °C). As indicated by the E-pH diagram, this maximum could be associated with a passive–transpassive transition via the formation of soluble Cr (VI), followed by secondary passivation by a nickel-iron oxide. Indeed, the intersection of the stability line of HCrO4− with the anodic polarization range roughly coincided with the increase in current, whereas the final anodic polarization potential was in the stability region of NiFe2O4.
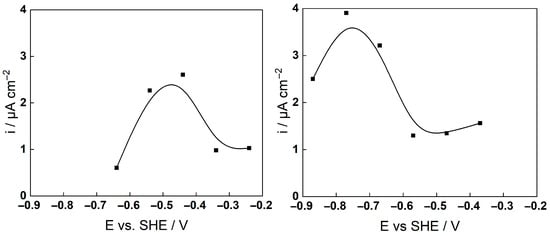
Figure 4.
Current-potential curves during anodic polarization of AISI 316L after 140 h exposure to 3 (left) and 6 mg kg−1 KOH (right) at 280 °C.
Figure 5, Figure 6, Figure 7 and Figure 8 show the electrochemical impedance spectra during both OCP exposure and anodic polarization in the studied primary coolants. Preliminary analysis of the spectra revealed that the impedance magnitude at f→0 (|Z|f=0, associated with the polarization resistance, i.e., the inverse of the corrosion rate) increased slowly over time and stabilized at 60–70 h in low-K and at 40–50 h in high-K chemistry. This increase is associated with the growth of the passive oxide. For longer durations, a small decrease of |Z|f→0 was usually observed, followed by a final stabilization at 140 ± 5 h.
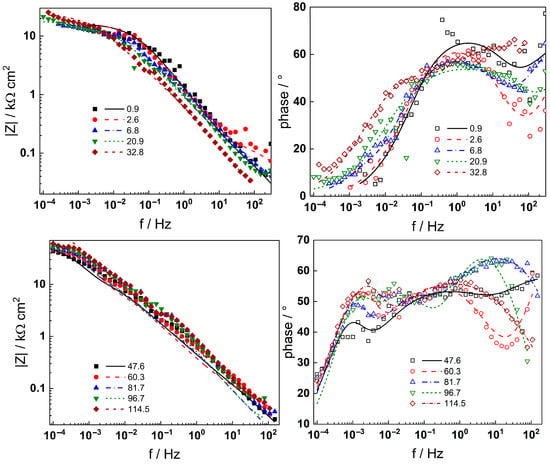
Figure 5.
Electrochemical impedance spectra of AISI 316L in 3 mg kg−1 KOH at 280 °C during different exposure durations (h) at the open circuit potential. Left column—impedance magnitude vs. frequency, right column—phase shift vs. frequency. Points—experimental values, lines—best-fit calculation with the transfer function described in the text.
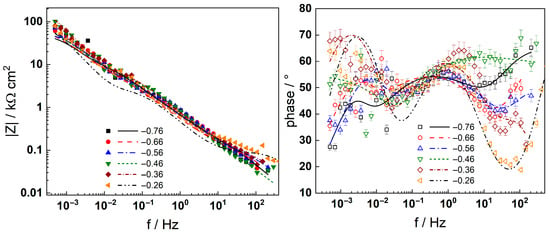
Figure 6.
Electrochemical impedance spectra of AISI 316L in 3 mg kg−1 KOH at 280 °C during anodic polarization at different potentials (V). Left column—impedance magnitude vs. frequency, right column—phase shift vs. frequency. Error bars in the phase angle plots show the reproducibility of the measurements at each potential. Points—experimental values, lines—best-fit calculation with the transfer function described in the text.
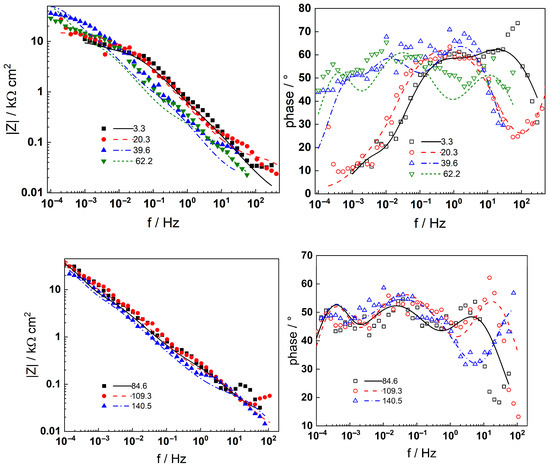
Figure 7.
Electrochemical impedance spectra of AISI 316L in 6 mg kg−1 KOH at 280 °C during different times of exposure (h) at the open circuit potential. Left column—impedance magnitude vs. frequency, right column—phase shift vs. frequency. Points—experimental values, lines—best-fit calculation with the transfer function described in the text.
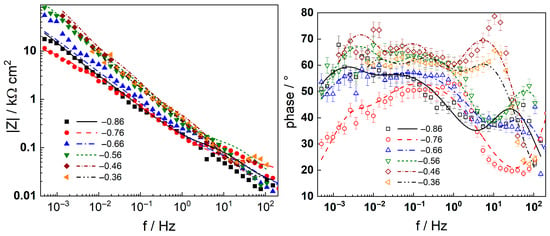
Figure 8.
Electrochemical impedance spectra of AISI 316L in 6 mg kg−1 KOH at 280 °C during anodic polarization at different potentials (V). Left column—impedance magnitude vs. frequency, right column—phase shift vs. frequency. Error bars in the phase angle plots show the reproducibility of the measurements at each potential. Points—experimental values, lines—best-fit calculation with the transfer function described in the text.
In-depth analysis of the impedance spectra using a distribution of relaxation times (DRT) method [23] enabled the detection of four processes with distinct characteristic frequencies, corresponding to the electronic properties of a barrier sublayer (at the highest frequencies), a two-step charge transfer reaction at the oxide/coolant interface (at intermediate frequencies), and the solid state transport of two types of species through the barrier layer (at low frequencies), respectively. The eventual presence of an outer oxide layer that represents a conductive oxide constituted of discrete particles was assumed to have made no contribution to the impedance response, as shown in previous work [16].
Neither the number of processes nor their characteristic frequencies were significantly influenced by the KOH concentration, indicating no qualitative changes in the corrosion reactions. During anodic polarization of the steel after a week of exposure, the |Z|f=0 was found to increase significantly at potentials above the current peak (Figure 3); i.e., the secondary passive layer also represented a barrier to corrosion. No additional processes were detected by DRT calculations in the entire range of potentials studied, indicating no qualitative alterations of the reaction mechanism. It is worth mentioning that the noise level was somewhat higher in the measurements at anodic polarization, but the reproducibility of the measurements stayed in the same range as indicated by the error bars shown in the phase angle–frequency plots (Figure 6 and Figure 8).
3.2. Thickness and Composition of the Oxide Films
Figure 9 and Figure 10 illustrate the GDOES depth profiles of the oxides after 168 h of exposure to the respective chemistries. Both atomic concentrations and normalized cation contents vs. depth are presented.
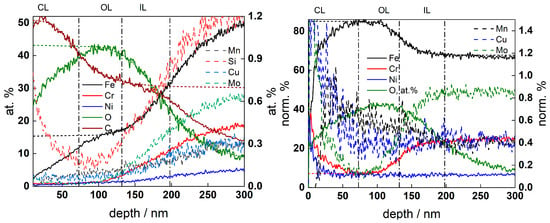
Figure 9.
GDOES depth profiles of oxide film on AISI 316L after exposure to 3 mg kg−1 KOH at 280 °C for 168 h. Left—atomic concentration vs. depth, right—concentration of metallic constituents normalized to total metal concentration (atomic concentration of O shown for comparison). CL-contamination layer, OL- outer layer, IL—inner layer. Sigmoidal fits of the O and Fe profiles (left) and Cr and Fe profiles (right) are shown with short-dashed lines.
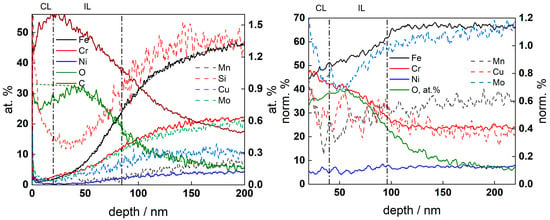
Figure 10.
GDOES depth profiles of oxide film on AISI 316L after exposure to 6 mg kg−1 KOH at 280 °C for 168 h. (Left) atomic concentration vs. depth, (right) concentration of metallic constituents normalized to total metal concentration (atomic concentration of O shown for comparison). CL-contamination layer, IL—inner layer. Sigmoidal fits of the O and Fe profiles (left) shown with short-dashed lines.
A bi-layer oxide was present in the low-K chemistry, in agreement with the general expectations for such corrosion products [16]. The position of the oxide/alloy interface was estimated by averaging the sigmoidal fits of the Fe and O atomic concentration depth profiles, whereas the inner/outer oxide boundary was estimated by averaging the sigmoidal fits of normalized Cr and Fe content profiles. The inner layer contained as much Cr as the matrix, whereas the outer layer was primarily composed of Fe with some Ni and Mn. The Mo content in the oxide was lower than that in the alloy substrate, indicating preferential dissolution of that component. Conversely, the oxide formed in high-K chemistry was found to be thinner without evidence of an outer layer, and Cr was significantly enriched in the oxide. These features suggested a more efficient steel passivation in the high-K chemistry.
4. Calculation Results and Discussion
The newest version of the Mixed-Conduction Model transfer function [22], which explicates the hydrogen reaction as a two-step charge-transfer process, was employed to interpret the impedance data. The sequence of reactions considered in the model is as follows:
Kroger–Vink notation for the ionic and electronic defects was used in the above sequence.
The reaction mechanism led to a total impedance function given by
The impedance function can be visualized by the equivalent circuit shown in Figure 11.
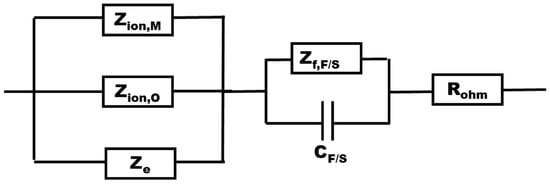
Figure 11.
Equivalent circuit of the transfer function derived from the Mixed-Conduction Model.
In the above equations, kO and kM (mol cm−2 s−1) are the rate constants of oxide formation and metal oxidation at the alloy/oxide interface, k2O and k2M (cm s−1) represent the rate constants of the filling of oxygen vacancies and the ejection of interstitial cations at the oxide/coolant interface, and k±iH (i = 1,2) represents the rate constants of the two-step hydrogen reaction at the same interface (in mol cm−2 s−1 except for k-2H with a dimension of cm s−1). All these rate constants depend exponentially on the potential drop at the respective interface, as expected according to general electrochemical kinetics. Further, De, DO, and DM (cm2 s−1) are the diffusivities of electronic carriers, oxygen, and cation vacancies, E is the field strength in the oxide (V cm−1), β is the concentration of surface sites available for adsorption (mol cm−2), is the concentration of hydrogen in the coolant (taken as 10−6 mol cm−3), L0 is the initial oxide thickness (assumed to be 3 nm), and Vm,M,O is the molar volume of the oxide (46.5 cm3 mol−1 for FeCr2O4). The capacitance Csc corresponds to the depletion layer capacitance in the semiconductor oxide phase, whereas CF/S is the double layer capacitance at the oxide–coolant interface generalized as a constant phase element (CPE) as in previous works [16,22].
Complex non-linear least-squares fitting of the impedance data to the transfer function was used to obtain estimates of the kinetic and transport parameters. To decrease the number of free parameters, all the transfer coefficients of the steps involved in the hydrogen reaction were assumed to be equal to 0.5. The ability of the model to reproduce the impedance response for all the studied conditions is illustrated in Figure 5, Figure 6, Figure 7 and Figure 8 with solid lines. The dependencies of kinetic and transport parameters on time and potential are presented in Figure 12, Figure 13, Figure 14 and Figure 15 as a function of coolant chemistry. The values of parameters that are independent of time and/or potential are presented in Table 2.
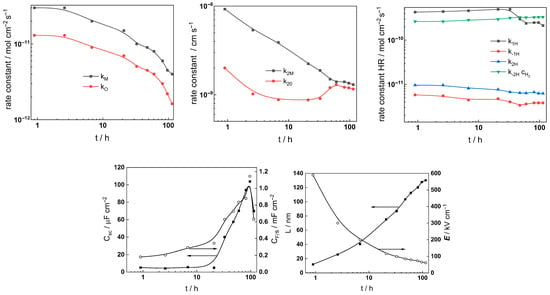
Figure 12.
Parameters of the transfer function used to describe the EIS results as a function of exposure time of AISI 316L to 3 mg kg−1 KOH at 280 °C.
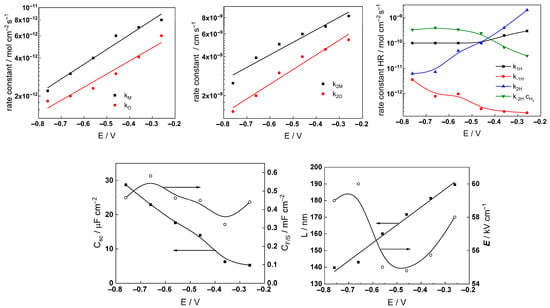
Figure 13.
Parameters of the transfer function used to describe the EIS results as a function of applied potential of AISI 316L to 3 mg kg−1 KOH at 280 °C.
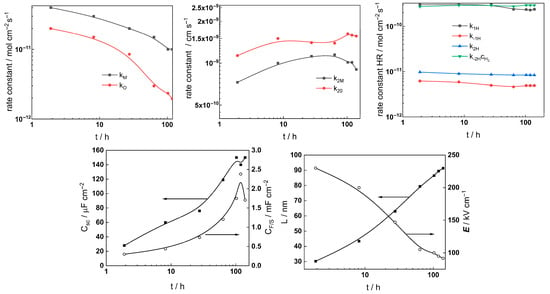
Figure 14.
Parameters of the transfer function used to describe the EIS results as a function of exposure time of AISI 316L to 6 mg kg−1 KOH at 280 °C.
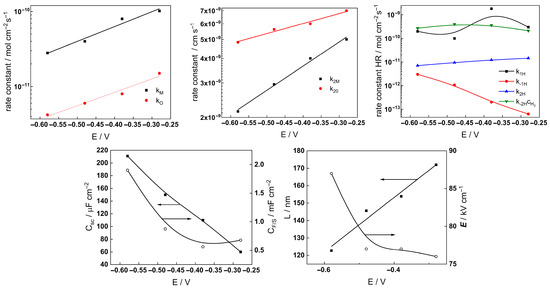
Figure 15.
Parameters of the transfer function used to describe the EIS results as a function of applied potential of AISI 316L in 6 mg kg−1 KOH at 280 °C.

Table 2.
Model parameters independent of coolant chemistry.
The following conclusions can be drawn from the parameter values:
- Most parameter values stabilized after 40–70 h of exposure. The differences between the kinetic and transport parameters for the steel in the two concentrations of KOH were small, indicating that the corrosion and oxidation rates were similar.
- The rate constants of both oxide formation (kO) and metal oxidation (kM) decreased with exposure duration, which reflected the effect of increasing oxide thickness, according to the first two equations in (2). The respective rate constants of the filling of oxygen vacancies (k2O) and the ejection of interstitial cations (k1M) at the outer interface decreased with time in the low-K regime and were quasi-independent of time in the high-K regime. This indicated no significant evolution of the kinetics at that interface, i.e., once again, more efficient passivation in the high-K solution. It is important to mention that the steady-state values of the rate constants were comparable to those we estimated earlier in B-K-Li chemistry pertinent to the middle and end of a respective power cycle [16].
- All the rate constants depend exponentially on potential, as expected from the model (first two equations in (2)). The low values (0.1–0.2) of the transfer coefficients are found to be typical for passive films on metals due to the similarity of the initial and transition states of the rate-limiting step [24].
- A slow increase over time is observed for both the space charge capacitance (Csc) and the double layer capacitance (CF/S). The increase in Csc could be due to an accumulation of interstitial cations at the film/coolant interface playing the role of electron donors and thus decreasing the space charge width. The increase in the double layer capacitance towards values characteristic of a faradaic pseudo-capacitance, on the other hand, could be related to the accumulation of intermediates of the hydrogen evolution/oxidation reaction during exposure [25].
- Conversely, anodic polarization following exposure causes both Csc and CF/S to decrease with potential. The decrease in Csc is tantamount to an n-type semiconductor behavior, i.e., a transformation of the oxide from a conducting type to an n-type semiconducting type with increased applied potential. On the other hand, the decrease in CF/S may be due to a smaller contribution of the intermediates of the hydrogen reactions to the capacitance at the anodic potentials [25].
- The rate constants of the hydrogen reactions exhibit less pronounced time dependence compared to the rate constants of passivation and corrosion. They also reach stable values after 60–80 h and are barely influenced by KOH concentration. This is expected given the small variations in oxide thickness and composition, even if the high-temperature pH of the two solutions varies from 6.8 to 7.2 (the rates of water reduction and hydrogen evolution at constant potential are expected to primarily depend on pH). It is worth mentioning that the kinetic parameters of hydrogen reactions vary under anodic polarization, in agreement with the different electronic properties of the oxide in these conditions.
- The field strength in the oxide decreases with exposure and reaches stable values after ca. 80 h of exposure, whereas the film thickness–time dependence obeys a direct logarithmic law in accordance with the model assumptions. The thickness values at the end of exposure are similar to those estimated by GDOES for the inner layer (in 3 mg kg−1 KOH) and the whole layer (in 6 mg kg−1 KOH). Thus, the two methods are in good quantitative agreement. In addition, the field strength does not change significantly upon anodic polarization; accordingly, the film thickness increases linearly with the applied potential, as predicted by the model for an oxide growth at constant field strength.
- It is important to mention that the values of the kinetic and transport parameters estimated in this study are comparable to those obtained for AISI 316L in simulated WWER chemistry, especially those in the middle of a power cycle (0.6 g kg−1 B as H3BO3 and 6 mg kg−1 K as KOH) [16]. This means that regardless of the higher pH of the boron-free coolant used in the present investigation (7.2 vs. 6.1), the oxidation and corrosion behavior of the steel in the two environments is not dissimilar, indicating that the material can be successfully used as an internal in SMRs.
Further, the obtained results can be used to quantitatively compare the extent of corrosion (oxide film formation) and corrosion release (dissolution of metal through the oxide to generate soluble products) in the simulated SMR water chemistry to data from literature measured in the nominal PWR or WWER primary coolants [26,27,28,29]. According to the model, subject to the assumption that the transfer coefficients αO = αM, the rate of dissolution of the metal through the oxide is expressed as:
The solution of this differential equation subject to the condition of zero release at t = 0 leads to an equation for cation release (mol cm−2):
To compare with existing data, the equation is transformed to the mass of dissolved Fe (g cm−2):
AFe is the atomic mass of Fe (55.85 g mol−1). A comparison between the time dependence of the film thickness and the release rate estimated from the present results combined with the literature data is presented in Figure 16. It can be concluded that both the film thickness and the corrosion release in the simulated SMR coolant with higher KOH content are comparable with data in the nominal PWR and WWER coolants, indicating that the general corrosion of AISI 316L is not increased. Further investigations of the effect of dissolved hydrogen and the addition of zinc on oxidation and corrosion release in such chemistry are in progress and will be communicated soon.
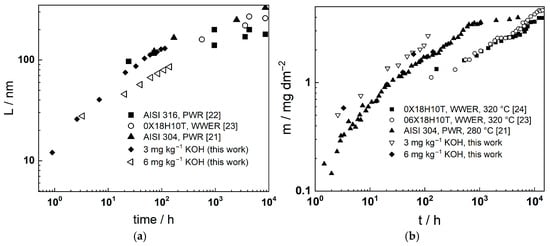
Figure 16.
Comparison of oxide thickness—time (a) and corrosion release—time curves (b) estimated from the present data at the two KOH concentration levels to experimental data for compatible steels in WWER and PWR primary coolants. Adapted from refs. [21,22,23,24].
5. Conclusions
The present project studied the electrochemical reactions of AISI 316L during free corrosion and anodic polarization in boron-free low- and high-K primary water chemistry in the context of small modular reactors. The main conclusions from the experimental results and calculations are summarized as follows:
- The combination of in situ electrochemical measurements and ex situ analytical techniques enabled the estimation of the oxidation and corrosion release rates of AISI 316L in simulated primary SMR coolants at the operating temperature.
- It can be concluded that the oxidation and corrosion rates are determined by the interfacial reactions, as well as the solid-state transport in the inner layer of the oxide.
- A bi-layer oxide was formed on the steel in the low-K regime, with an inner layer tentatively identified as FeCr2O4 and an outer layer as FeNi2O4. In the high-K regime, a single-layer oxide enriched in Cr was obtained, indicating more efficient alloy passivation.
- The steel’s oxidation mechanism was quantitively described by the Mixed-Conduction Model. Depending on the exposure duration and the applied potential, there were no significant differences in the estimated kinetic and transport parameters between the boron–free potassium and the boron–potassium–lithium primary water chemistries. Further investigations covering the effects of temperature and dissolved hydrogen are needed to evaluate the general extent of the predictive ability of the modeling procedure.
- Regarding the industrial implications of the present study, it falls in line with earlier findings of research by several companies in demonstrating that a transition from B-K-Li to boron-free K primary chemistry will not lead to enhanced uniform corrosion or oxide formation on reactor internals such as stainless steels.
- Further experiments on the effect of adding Zn to the coolant, as well as dissolved hydrogen concentration, on the behavior of AISI 316L in similar conditions are in progress and will be reported soon.
Author Contributions
Conceptualization, M.B. and I.B.; methodology, M.B.; validation, I.B. and V.K.; formal analysis, I.B.; investigation, V.K.; resources, M.B.; data curation, V.K.; writing—original draft preparation, I.B.; writing—review and editing, M.B.; visualization, V.K. All authors have read and agreed to the published version of the manuscript.
Funding
This research was funded by the National Recovery and Resilience Plan of the Republic of Bulgaria (grant number: BG-RRP-2.004-0002 (BiOrgaMCT). Electrochemical measurements were performed using equipment from the National Scientific Infrastructure “Energy Storage and Hydrogen Energy” (ESHER, contract DO1-160/28.08.18).
Data Availability Statement
The original contributions presented in this study are included in the article. Further inquiries can be directed to the corresponding author.
Conflicts of Interest
The authors declare no conflicts of interest.
References
- Ingersoll, D.T.; Carelli, M.D. (Eds.) Handbook of Small Modular Nuclear Reactors; Elsevier Woodhead Publishing: Cambridge, UK, 2021. [Google Scholar]
- Zhang, Z.; Jiang, J. On load-following operations of small modular reactors (review). Prog. Nucl. Energy 2024, 173, 105274. [Google Scholar] [CrossRef]
- Ricotti, M.E.; Fomin, R.V. Small modular reactors, Chapter 5. In Nuclear Reactor Technology Development and Utilization; Ud-Din Khan, S., Nakhabov, A., Eds.; Elsevier: Amsterdam, The Netherlands, 2020; pp. 187–210. [Google Scholar]
- Ok Kang, H.; Lee, B.J.; Lim, S.G. Light water SMR development status in Korea. Nucl. Eng. Des. 2024, 419, 112966. [Google Scholar] [CrossRef]
- Lee, J.I. Review of Small Modular Reactors: Challenges in Safety and Economy to Success. Korean J. Chem. Eng. 2024, 41, 2761–2780. [Google Scholar] [CrossRef]
- Tan, S.; Cheng, S.; Wang, K.; Liu, X.; Cheng, H.; Wang, J. The development of micro and small modular reactor in the future energy market. Front. Energy Res. 2023, 11, 1149127. [Google Scholar] [CrossRef]
- Feenstra, P.; Tapping, R.; Turner, C.; Horn, D.; Pettigrew, M.J.; Yetisir, M. Postulated degradation mechanisms of steam generator tubing in water-cooled small modular reactors. In Proceedings of the 40th Annual Conference of the Canadian Nuclear Society and 45th Annual CNS/CNA Student Conference Virtual Conference, Toronto, ON, Canada, 6–9 June 2021. [Google Scholar]
- Shim, H.-S.; Jeon, S.-H.; Hur, D.H. Corrosion and Release Behaviors of Stainless Steel 316L in Boron-Free Primary Coolant, paper 187. In Proceedings of the Transactions of the Korean Nuclear Society Autumn Meeting, Gyeongju, Republic of Korea, 26–27 October 2023. [Google Scholar]
- Choi, W.; Baek, S.H.; Lim, D.S.; Son, Y.; Kim, Y.-J.; Bahn, C.B. Electrochemical Behavior of i-SMR Structural Materials in Simulated Soluble Boron-free KOH or LiOH Environments, paper 365. In Proceedings of the Transactions of the Korean Nuclear Society Spring Meeting, Jeju, Republic of Korea, 18–19 May 2023. [Google Scholar]
- Shim, H.-S.; Jeon, S.-H.; Kim, J.S.; Hur, D.H. Corrosion Behaviors of Alloy 690 Steam Generator Tubes in Boron-Free Primary Coolant, paper 469. In Proceedings of the Transactions of the Korean Nuclear Society Spring Meeting, Jeju, Republic of Korea, 18–19 May 2023. [Google Scholar]
- Park, J.; Lim, S.-Y.; Jeon, S.-H.; Kim, J.-S.; Oh, J.-M.; Shim, H.-S. A Study on Accelerated Corrosion Rate of Stainless Steel Type 630 with Increasing Temperature of B-free Alkaline Coolant. Trans. Korean Soc. Press. Vessel. Pip. 2024, 20, 49–55. [Google Scholar]
- Gao, P.; Li, Y.; Zhu, W.; Qiu, J.; Bai, Z.; Wang, Q.; Ding, S. Dynamic oxide film evolution and corrosion mechanisms of 308L stainless steel in simulated SMR environments. Corros. Sci. 2025, 248, 112804. [Google Scholar] [CrossRef]
- Zhao, Y.; Xu, Q.; Chai, L.; Wang, H.; Hu, C.; Xiao, J.; Zhou, T.; Xiong, R.; Liu, X. Corrosion behavior of TA16 titanium alloy during long-term exposure in simulated water environment of small modular reactor. J. Mater. Sci. Technol. 2023, 27, 6558–6567. [Google Scholar] [CrossRef]
- Zhao, Y.; Wang, H.; Meng, F.; Wang, L.; Xu, Q.; Zhou, T.; Wu, J. Formation of hydrogen resistant oxides of titanium alloy in water corrosion environment. J. Mater. Res. Technol. 2024, 33, 7293–7302. [Google Scholar] [CrossRef]
- Zhao, Y.; Wang, H.; Zhong, S.; Chai, L.; Xu, Q.; Zhou, T. Characteristics of oxide films on TA16 alloy after long-term exposure in simulated secondary circuit water environment of small modular reactor. J. Mater. Res. Technol. 2024, 33, 4569–4576. [Google Scholar] [CrossRef]
- Bojinov, M.; Betova, I.; Karastoyanov, V.; Avdeev, G. Corrosion of Stainless Steel in Simulated Nuclear Reactor Primary Coolant—Experiments and Modeling. Materials 2024, 17, 1148. [Google Scholar] [CrossRef]
- You, C.; Zabara, M.; Orazem, M.; Ulgut, B. Application of the Kramers–Kronig Relations to Multi-Sine Electrochemical Impedance Measurements. J. Electrochem. Soc. 2020, 167, 20515. [Google Scholar] [CrossRef]
- Dumerval, M.; Perrin, S.; Marchetti, L.; Sennour, M.; Jomard, F.; Vaubaillon, S.; Wouters, Y. Effect of implantation defects on the corrosion of 316L stainless steels in primary medium of pressurized water reactors. Corros. Sci. 2016, 107, 1–8. [Google Scholar] [CrossRef]
- Deng, P.; Peng, Q.; Han, E.-H.; Ke, W.; Sun, C.; Jiao, Z. Effect of irradiation on corrosion of 304 nuclear grade stainless steel in simulated PWR primary water. Corros. Sci. 2017, 127, 91–100. [Google Scholar] [CrossRef]
- Boisson, M.; Legras, L.; Andrieu, E.; Laffont, L. Role of irradiation and irradiation defects on the oxidation first stages of a 316L austenitic stainless steel. Corros. Sci. 2019, 161, 108194. [Google Scholar] [CrossRef]
- Shen, Z.; Du, D.; Zhang, L.; Lozano-Perez, S. An insight into PWR primary water SCC mechanisms by comparing surface and crack oxidation. Corros. Sci. 2019, 148, 213–227. [Google Scholar] [CrossRef]
- Bojinov, M.; Saario, T.; Ge, Y.; Chang, L.; Que, Z. Effect of hydrogen on electrochemical behavior of additively manufactured 316L in pressurized water reactor primary water. Corros. Sci. 2023, 224, 111557. [Google Scholar] [CrossRef]
- Wan, T.; Saccoccio, M.; Chen, C.; Ciucci, F. Influence of the Discretization Methods on the Distribution of Relaxation Times Deconvolution: Implementing Radial Basis Functions with DRTtools. Electrochim. Acta 2015, 184, 483–499. [Google Scholar] [CrossRef]
- Sharifi-Asl, S.; Taylor, M.; Lu, Z.; Engelhardt, G.; Kursten, B.; Macdonald, D.D. Modeling of the electrochemical impedance spectroscopic behavior of passive iron using a genetic algorithm approach. Electrochim. Acta 2013, 102, 161–173. [Google Scholar] [CrossRef]
- Yoo, H.D.; Jang, J.H.; Ka, B.H.; Rhee, C.K.; Oh, S.M. Impedance analysis for hydrogen adsorption pseudocapacitance and electrochemically active surface area of Pt electrode. Langmuir 2009, 25, 11947–11954. [Google Scholar] [CrossRef]
- Lister, D.H.; Davidson, R.D.; McAlpine, E. The Mechanism and Kinetics of Corrosion Product Release from Stainless Steel in Lithiated High-Temperature Water. Corros. Sci. 1987, 32, 113–140. [Google Scholar] [CrossRef]
- Betova, I.; Bojinov, M.; Karastoyanov, V.; Kinnunen, P.; Saario, T. Estimation of kinetic and transport parameters by quantitative evaluation of EIS and XPS data. Electrochim. Acta 2010, 55, 6163–6617. [Google Scholar]
- Krasnorutskyy, V.; Petelguzov, I.; Grytsyna, V.; Zuyok, V.; Tretyakov, M.; Rud, R.; Slabospytska, O.; Ishchenko, N.; Svichkar, N.; Slaboslitskaya, E.A.; et al. Corrosion of stainless steels in conditions simulating primary coolant of WWER-1000. Phys. Radiat. Damage Radiat. Mater. Sci. Ser. 2011, 97, 80–87. [Google Scholar]
- Krasnorutskyy, V.; Petelguzov, I.; Grytsyna, V.; Zuyok, V.; Tretyakov, M.; Rud, R.; Slabospytska, O.; Ishchenko, N.; Svichkar, N. Corrosion of Stainless Steels and Zirconium Alloys in WWER-1000 Model Coolant with Addition of Zn and Al. J. Mater. Sci. Appl. 2016, 2, 10–17. [Google Scholar]
Disclaimer/Publisher’s Note: The statements, opinions and data contained in all publications are solely those of the individual author(s) and contributor(s) and not of MDPI and/or the editor(s). MDPI and/or the editor(s) disclaim responsibility for any injury to people or property resulting from any ideas, methods, instructions or products referred to in the content. |
© 2025 by the authors. Licensee MDPI, Basel, Switzerland. This article is an open access article distributed under the terms and conditions of the Creative Commons Attribution (CC BY) license (https://creativecommons.org/licenses/by/4.0/).