Article

Impact of Multiple-Laser Processing on the Low-Cycle Fatigue Behaviour of Laser-Powder Bed Fused AlSi10Mg Alloy

The University of Sheffield Advanced Manufacturing Research Centre North-West, Blackburn BB2 7HP, UK
*
Author to whom correspondence should be addressed.
Metals 2025, 15(7), 807; https://doi.org/10.3390/met15070807
Submission received: 30 May 2025 / Revised: 4 July 2025 / Accepted: 16 July 2025 / Published: 18 July 2025
(This article belongs to the Special Issue Processing, Microstructure and Properties of Aluminium Alloys)

Abstract

Multi-laser processing is increasingly adopted in laser powder bed fusion (L-PBF) to improve productivity and enable the fabrication of larger components, but its impact on part quality and performance remains a critical concern. This study investigates the microstructure, tensile properties, and fatigue performance of components fabricated by L-PBF using single- and multiple-laser configurations. Both strategies were evaluated under varying layer thicknesses and gas flow conditions with optimized process parameters. Microstructural analysis revealed defects such as lack-of-fusion, porosity and microcracks in multiple-laser builds with reduced gas flow. However, the density and microhardness results showed negligible differences between single and multiple-laser builds. Tensile testing indicated that single-laser builds exhibited superior strength and ductility, whereas multiple-laser builds demonstrated reduced performance due to localized defects such as lack-of-fusion and microcracks. Low-cycle fatigue testing results showed that optimized multiple-laser strategies could achieve performance comparable to that of single-laser builds while improving productivity. The results also revealed that the gas flow becomes more pronounced with multiple-laser processing, where more spatter is generated due to the interactions of the lasers in a small scan area, and that reduced gas flow leads to fatigue degradation due to increased defect density. The results from this study clearly highlight the importance of gas flow, laser overlap, border optimization, and defect mitigation strategies in producing multiple-laser produced components with mechanical properties and fatigue performance comparable to those of single-laser produced L-PBF components.

1. Introduction

Additive manufacturing (AM) has lately become a significant alternative manufacturing technique in many industries, offering the ability to produce complex geometries with stringent tolerances, competitive costs, and material properties comparable to those achieved through conventional methods [1,2]. Among the major AM technologies, laser powder bed fusion (L-PBF) has reached a high level of maturity in recent years. This advancement is supported by extensive research and its widespread adoption in demanding sectors such as aerospace and defence. A key factor driving its growth is the broad range of compatible materials, including aluminium [3,4], cobalt, copper, iron, nickel, and titanium alloys—with ongoing research continually expanding this selection. In addition, the rise of L-PBF is primarily attributed to the design flexibility and material efficiency it offers compared to conventional manufacturing and other AM methods [5,6].
Aluminium alloys are extensively used in L-PBF due to their favourable strength-to-weight ratio, processability, and cost-efficiency, facilitating the fabrication of complex geometries with adequate mechanical performance and reduced lead times [7]. Al-Si based alloys, mainly AlSi10Mg, which are commonly used for casting because of their low shrinkage, have been receiving wide attention in L-PBF thanks to their low susceptibility to hot cracking during solidification, which enhances the processability [8]. Low density, weldability and corrosion resistance of the alloy are the other factors supporting their wide research and implementation potential with the L-PBF technology [9].
One of the most important results of the wider adoption of various materials in L-PBF has been the increase in expectations from the process, particularly in terms of improved process efficiency and industrial demand for larger build volumes. Parameter optimization was employed in the initial studies to enhance productivity by optimizing laser scan speed, hatch spacing, laser power, and layer thickness [10,11], and further research led to the advancements in hardware, including the adoption of multi-laser systems [12]. However, the use of multiple lasers has significantly impacted process dynamics, primarily due to the need for changes in gas flow to manage the increased spatter and plume generated when multiple lasers operate simultaneously [13]. Another major challenge has become maintaining the thermal stability of the build chamber, as the simultaneous use of multiple lasers introduces higher heat input per layer [14]. Additionally, coordinating multiple lasers on the same build plate poses difficulties in sequencing their operation to prevent adverse effects on material properties caused by plume interference, laser interactions, and overlap areas caused by multi-beam stitching [15]. As a result, the primary challenge lies in the control, optimization, and synchronization of multi-laser systems specifically in the multi-beam stitching areas, to achieve material properties comparable to those produced by single-laser systems.
The influence of multi-laser systems on the consistency of build properties and reliability of machine performance in L-PBF builds has been investigated by several studies. Zhang et al. compared the mechanical properties, defects, and microstructures of AlSi10Mg parts produced using single- and multi-laser strategies with regions where multiple-laser stitching is applied [16]. The study showed comparable results for the tensile properties between the two strategies, indicating the effectiveness of multi-laser processing, albeit with the presence of small pores in the stitching areas. A different study on AlSi10Mg also reported similar results, with the YS and UTS of multi-laser scan areas falling within 5% of the values obtained from single-laser scans [17]. However, tests on specimens taken from higher sections of the built parts showed decreases in YS of up to 25% for single-lasers and 35% for multiple lasers, due to microstructural differences. Another study showed similar outputs in terms of changes in material properties, as differences were observed in grain orientation, along with decreases in elongation at break of up to 10% when multiple-laser scanning was utilised [18].
Apart from tensile properties such as yield strength and ultimate tensile strength, the fatigue performance of such components remains a critical concern, especially for safety-critical applications. A recent review reported that process-induced defects, such as lack-of-fusion porosity, surface roughness, and residual stresses, significantly reduce fatigue resistance compared to conventionally manufactured counterparts [19]. It was also demonstrated that the presence of surface and sub-surface defects in as-built AlSi10Mg specimens substantially limits high-cycle fatigue life, which can be moderately improved through surface machining or shot peening [20]. The role of internal defects has a strong correlation with porosity distribution and fatigue crack initiation in L-PBF components [21]. The effect of build orientation and post-processing also has a major influence, as it was noted that horizontal orientations and heat treatments improved fatigue strength through microstructural homogenization and stress relief [22]. Collectively, these findings underscore the sensitivity of L-PBF fatigue behaviour to manufacturing conditions and justify the need for a systematic investigation into how factors such as laser strategy, layer thickness, and gas flow affect cyclic mechanical performance. Fatigue and creep properties could also be affected when using multiple lasers, as related processing variables like the stitching affect the microstructures and defect formations [15,23]. The use of multiple lasers influences the microstructure and grain size, while yielding similar or even enhanced creep life and rate [24]. However, recent reports have shown that stress-controlled fatigue properties with stitching are comparable to those observed under single-laser scan conditions [25].
While multi-laser processing is increasingly implemented in L-PBF to enhance build rates and scalability, its effects—particularly laser-to-laser interactions in the stitching areas and variations in scanning strategies such as laser assignment strategy, time delays or coordinated scanning to avoid thermal interference—introduce complex thermal histories that can significantly influence part integrity and performance. Although prior research has examined microstructural and mechanical implications, comprehensive studies on the strain-controlled fatigue behaviour of multi-laser fabricated aluminium alloys are notably limited. Accordingly, this study presents a systematic comparison between single- and multiple-laser L-PBF AlSi10Mg components, with a focus on correlating processing conditions to microstructural characteristics, tensile response, and low-cycle fatigue performance. The study aimed to evaluate the mechanical properties of multiple-laser produced components in comparison with single-laser produced components, as multiple lasers are known to significantly increase productivity but could lead to detrimental effects.

2. Manufacturing Methodology
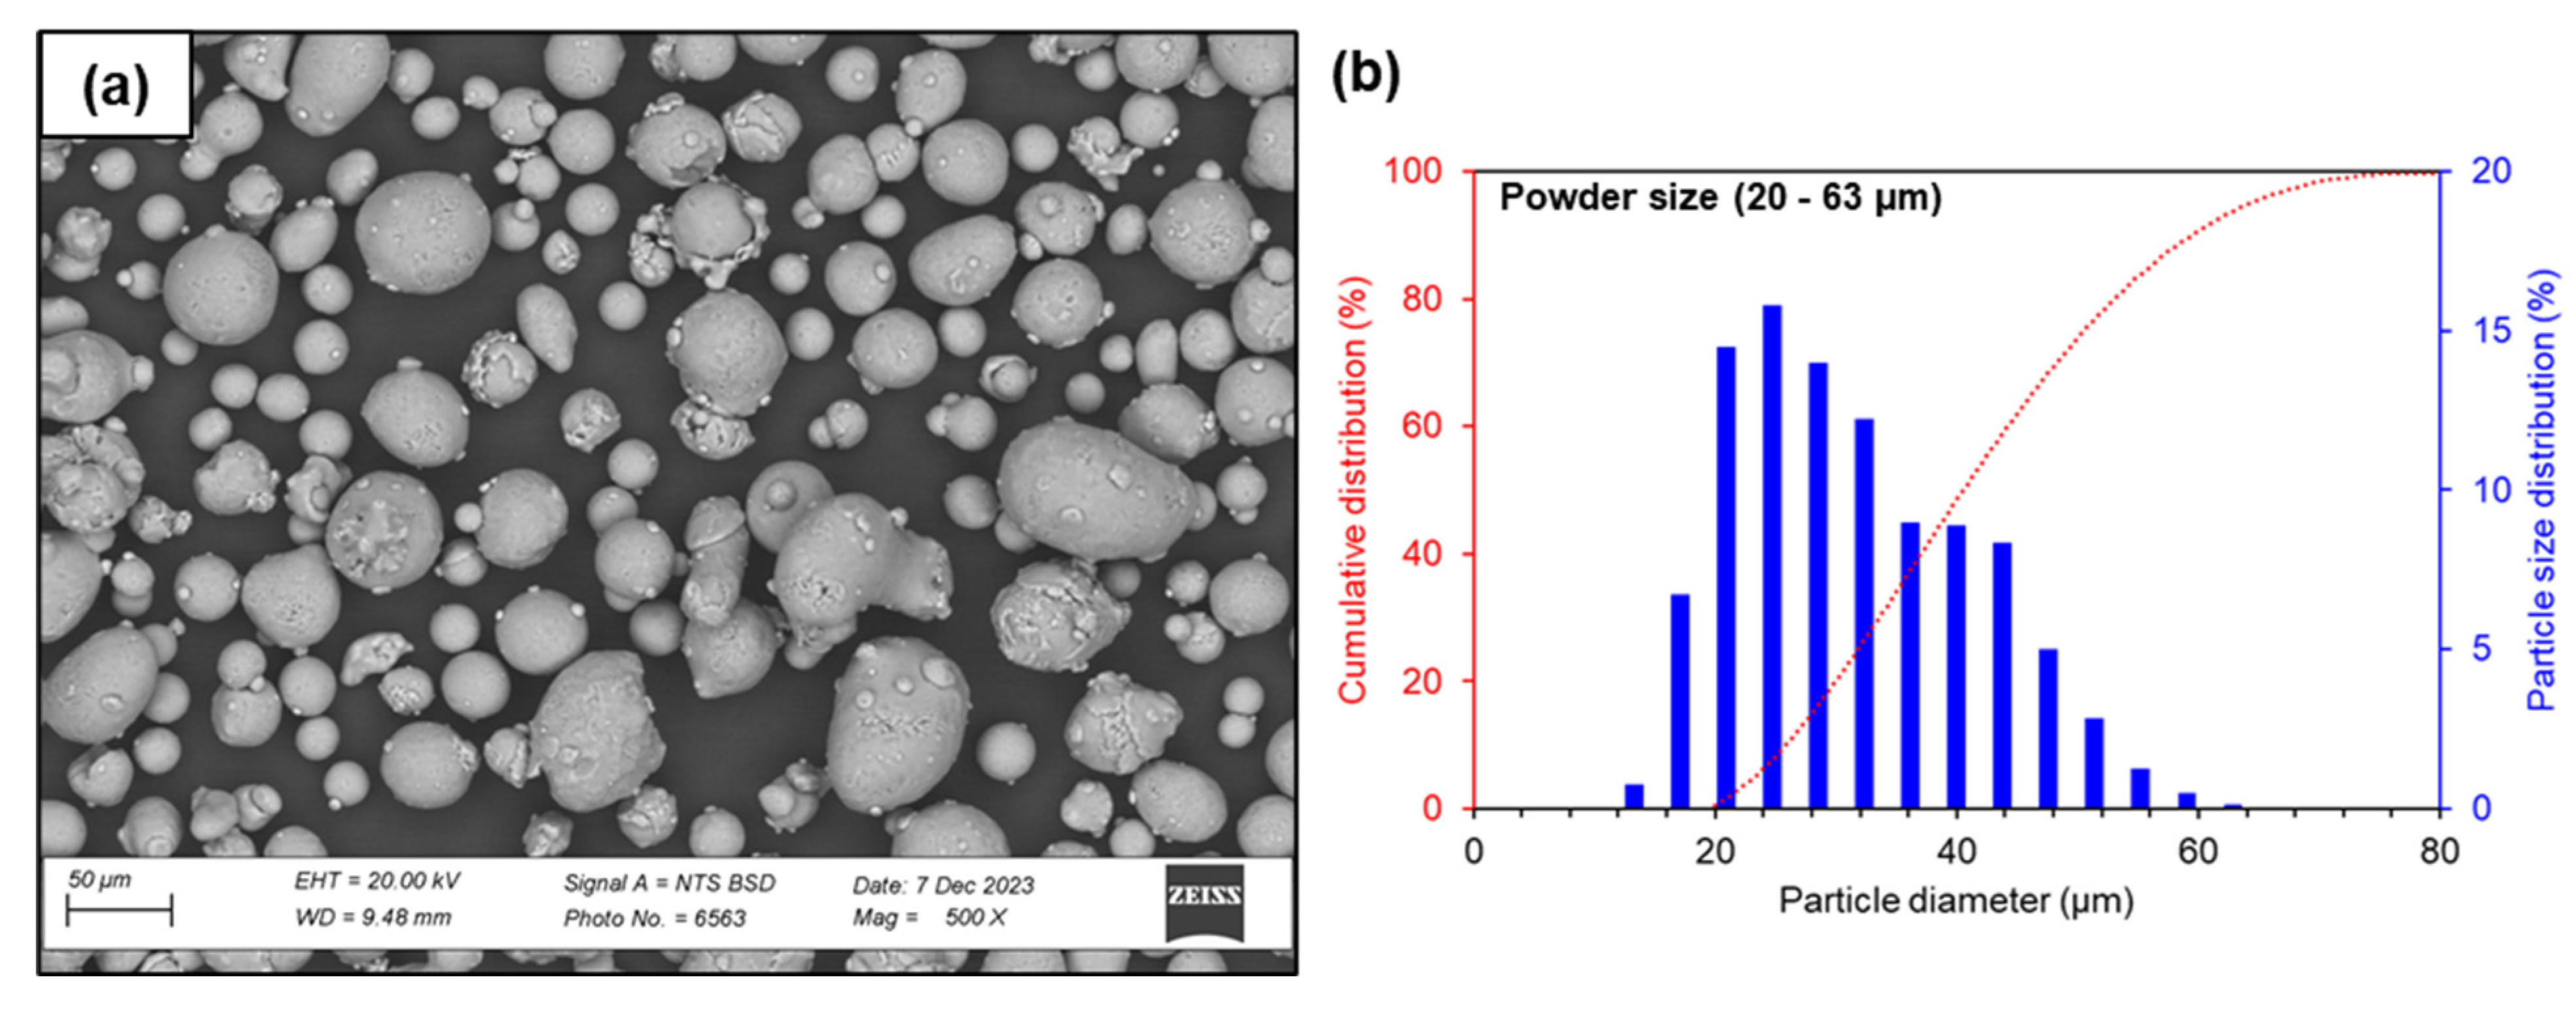
2.1. Material

AlSi10Mg alloy powders were used in this study. The powder contained both spherical and elongated particles, as shown in Figure 1a. The shape observations were typical of those of any powder manufactured using the gas atomization technique. The particle size distribution (PSD) ranged from 20 to 63 µm, as shown in Figure 1b, with D10 = 26.8 µm, D50 = 41.1 µm, and D90 = 62.4 µm.
The alloy composition taken from the supplier datasheet is shown in Table 1. The presence of Mg and Si in the alloy strengthens the alloy with the Mg2Si precipitation naturally or through heat treatment.

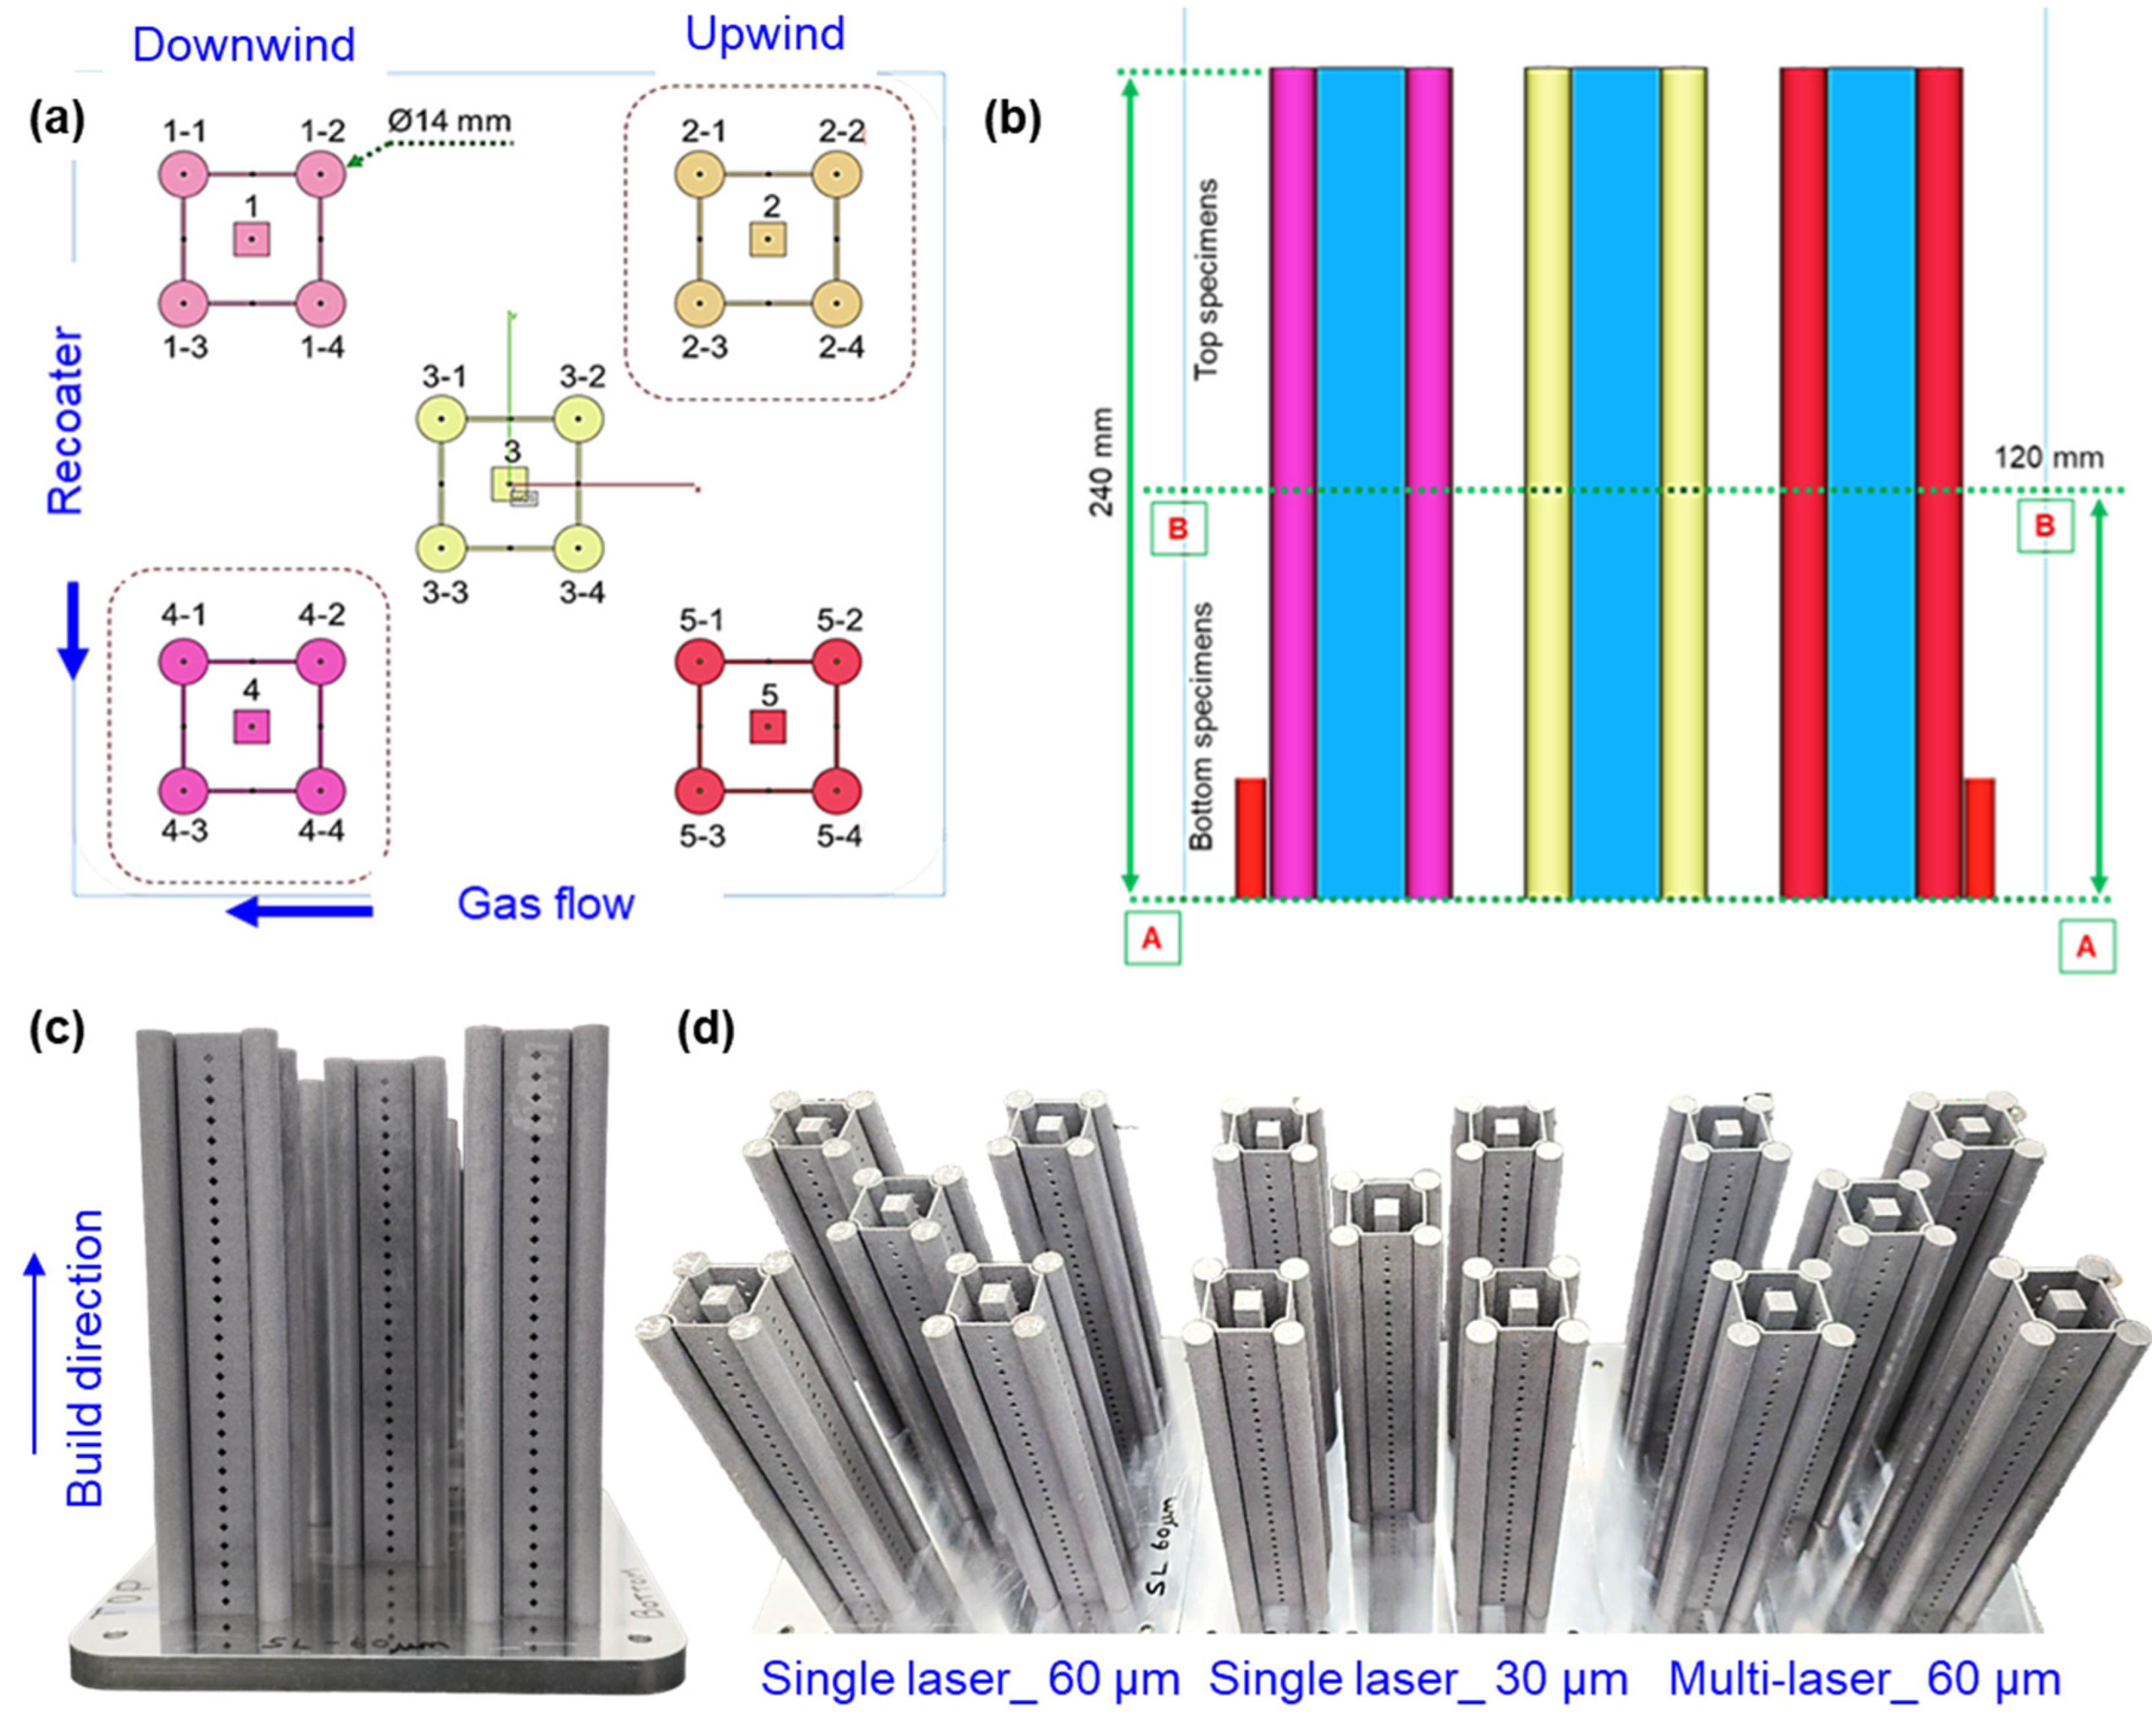
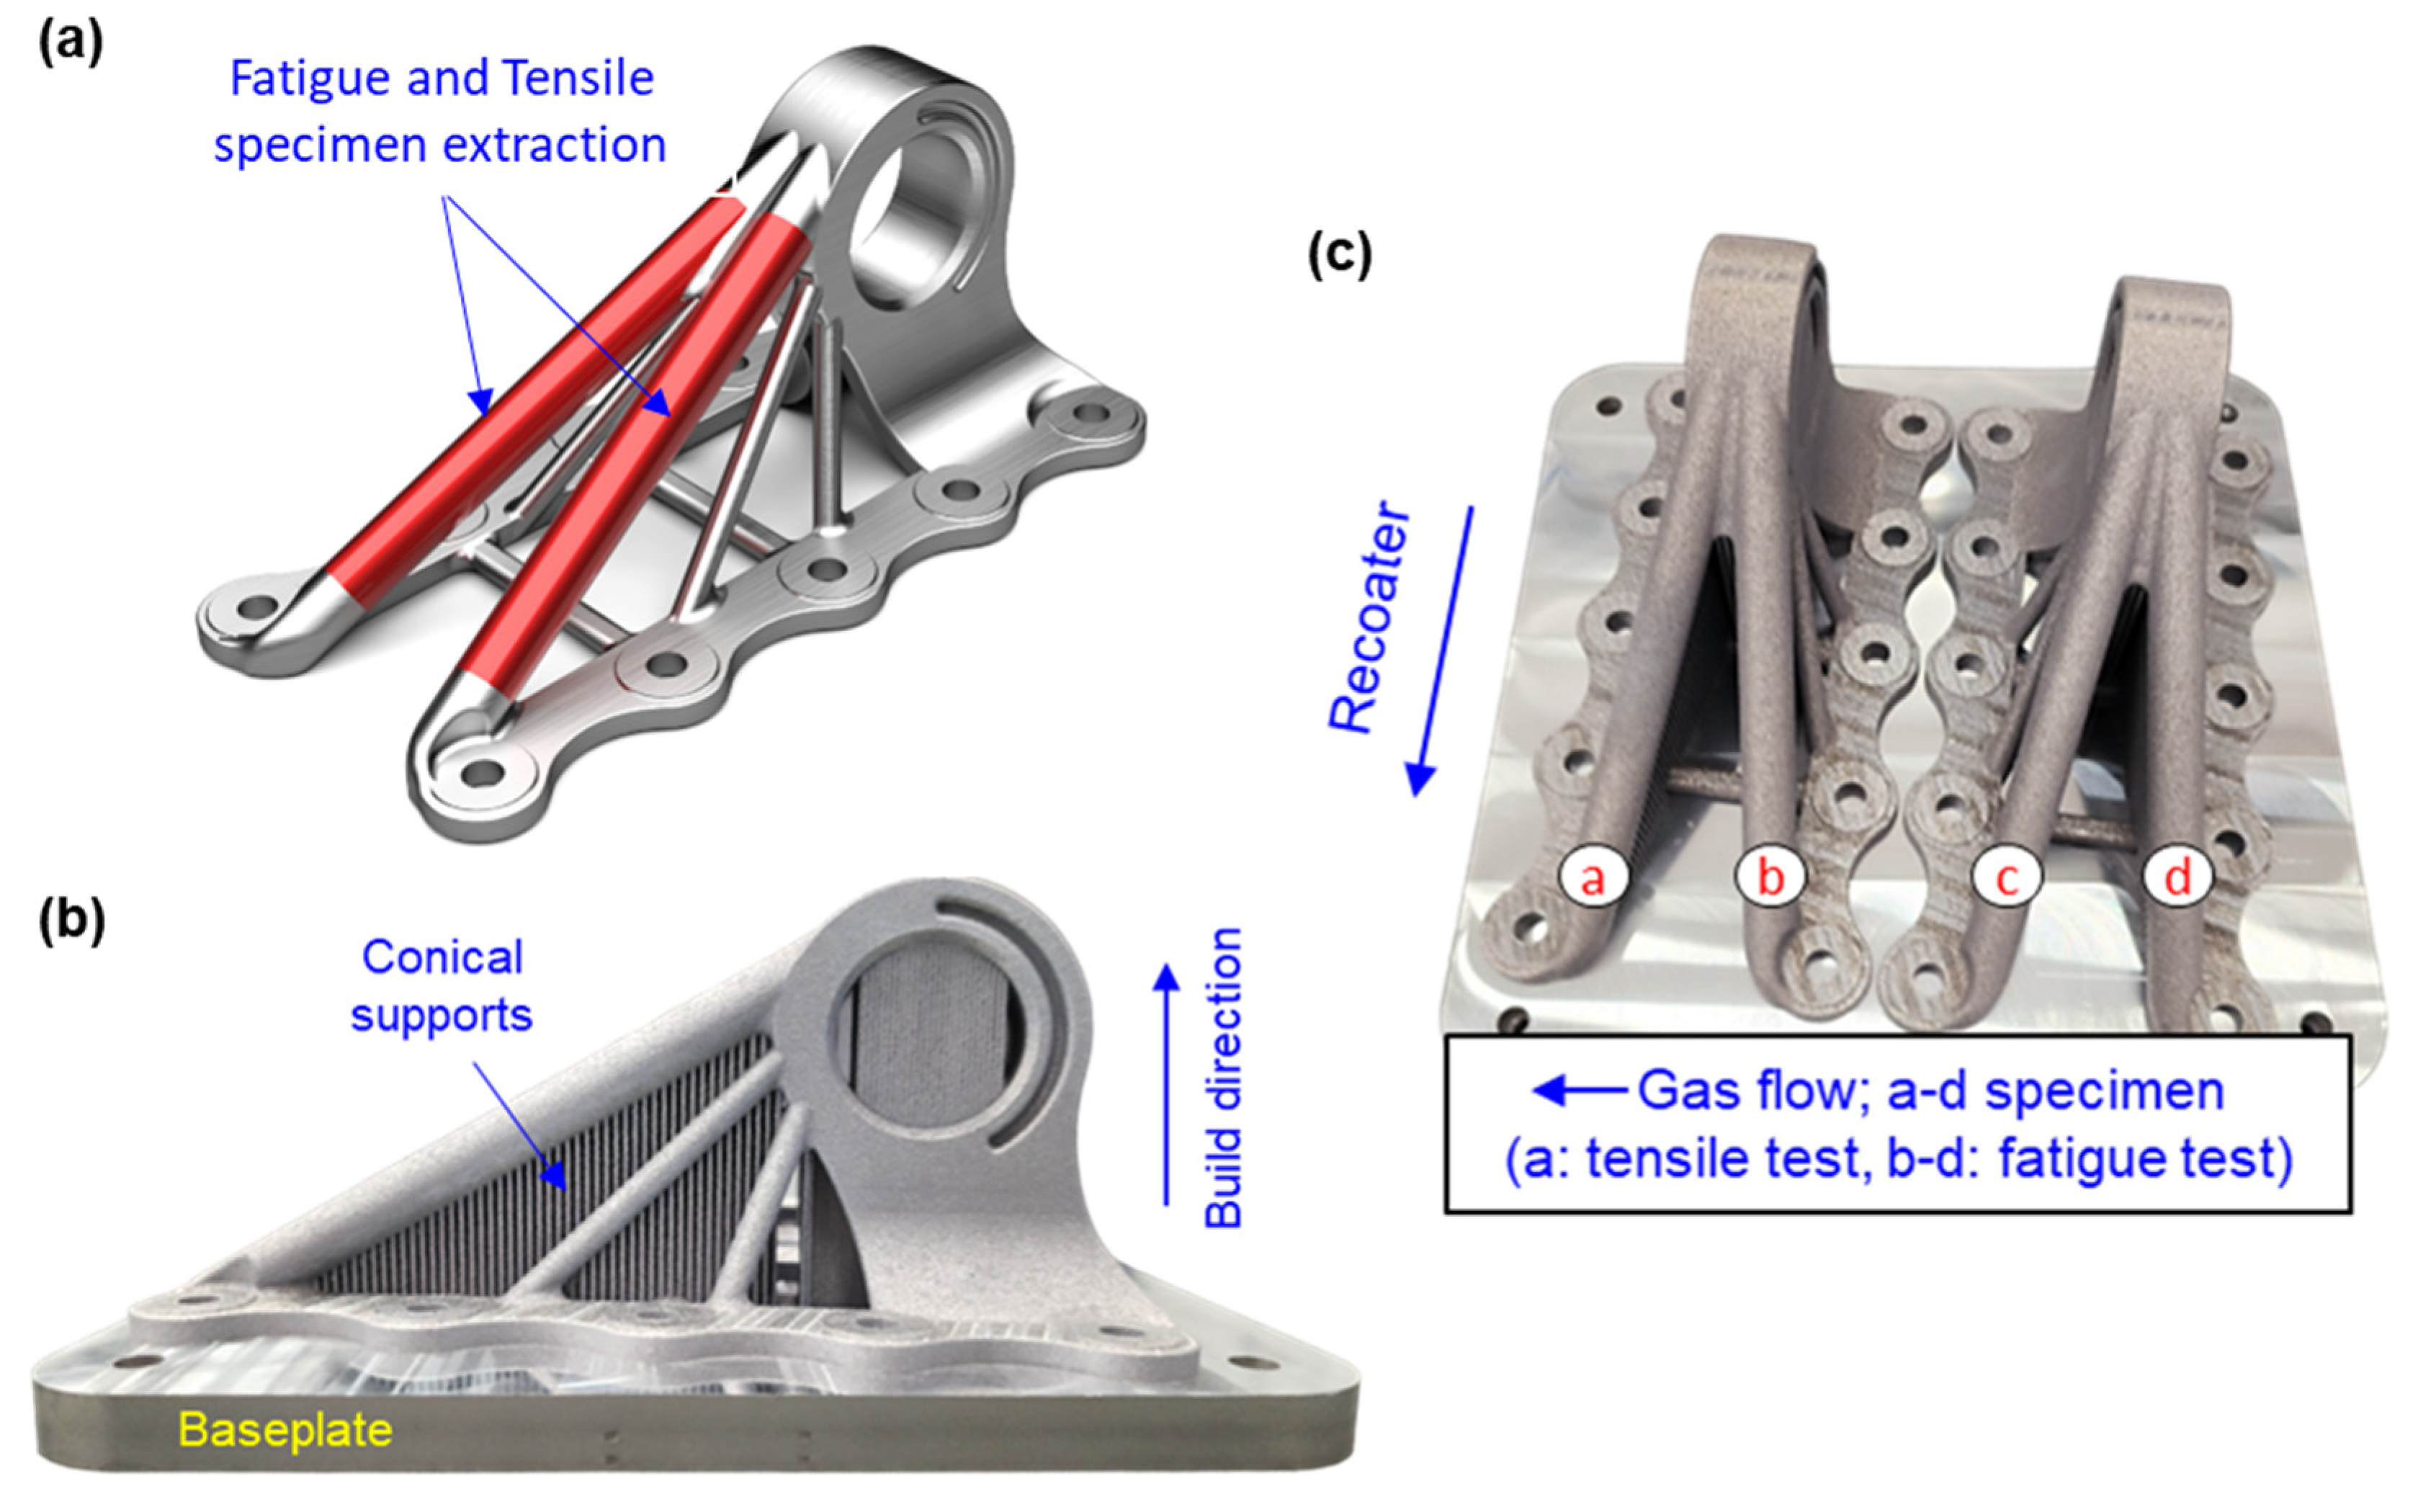
2.2. Laser Powder Bed Fusion of Specimens and Components

The manufacturing methodology involves selective melting of metal powder layers using a high-powered and focused laser beam. As shown in Figure 2a, specimens were strategically arranged on the build plate considering the gas flow and re-coater directions to assess variations in process conditions. In L-PBF, gas flow and re-coater movement significantly impact part quality across the build plate. The unidirectional gas flow removes spatter and condensates, but samples positioned downstream may experience greater spatter accumulation, affecting porosity and surface quality. Similarly, the re-coater spreads powder in a fixed direction, and slight inconsistencies in powder layer thickness can occur between the start and end of the recoating path. These spatial variations can lead to differences in density, microstructure, and mechanical properties across different build locations. Therefore, positional effects linked to gas flow and re-coater dynamics must be considered during the analysis. Specimens were extracted from the top and bottom 120 mm sections of the builds. Upwind and downwind specimen placements (relative to gas flow) help analyse the influence of spatter and melt pool dynamics on mechanical properties and fatigue performance. Figure 2b presents the front view of the specimens, indicating different configurations: single- and multiple-laser builds with 30 µm and 60 µm layer thicknesses. The A-A and B-B sectional lines represent the bottom and middle plane of the specimens. The specimens were removed from the baseplate at section A-A, and the mid-plane B-B at 120 mm was taken as the reference to extract tensile and fatigue specimens from the top and bottom zones, respectively. The built specimens as shown in Figure 2c were 240 mm tall with a diameter of 14 mm (considering the machining allowance to extract tensile and fatigue specimens). The thin walls connecting the cylindrical specimens were 1.5 mm thick and were added to provide stability for the 240 mm tall cylindrical bars. These were also included to create additional laser scanning area, resulting in more spatter during multiple-laser builds without excessive material wastage. The inner square rods of 15 mm × 15 mm (cross-sectional area 225 mm2) were included to investigate the density, microhardness, and microstructure effects. Figure 2d shows the isometric view of specimens built using single- and multiple-laser configurations. This experimental setup facilitates a comparative analysis to understand process parameter influences, build consistency, and mechanical performance across different laser configuration conditions.
To understand whether specimen testing sufficiently captures the evolution of the mechanical properties and fatigue performance, a bracket geometry as shown in Figure 3 was manufactured, leveraging multiple lasers for enhanced productivity. As illustrated in Figure 3a, fatigue and tensile specimens were extracted from critical regions of the component to evaluate the mechanical properties under different loading conditions. The side view in Figure 3b highlights the presence of conical support structures used for overhanging features. Figure 3c presents an isometric view of the manufactured components, with specimens numbered 1 to 4 to indicate their specific locations relative to the re-coater and gas flow directions. The mechanical properties from this component would be benchmarked against the witness specimens shown in Figure 2 built using single- and multiple-laser strategies to understand how well the mechanical properties of witness specimens relate to the actual component.
Table 2 shows the specimen nomenclature and the related build conditions in this study. The following specimen nomenclature will be followed throughout this article.

2.3. Laser Allocation and Scan Pattern

The laser strategy employed in this study is illustrated in Figure 4, which compares single-laser and multiple-laser strategies. As shown in Figure 4a,b, the single-laser strategy involves allocating one laser to all specimens, with a stripe scan pattern and two contour borders surrounding each area to be scanned. This approach ensures a consistent melt pool with limited thermal gradients but results in longer build times due to the use of a single beam for all parts. In contrast, the multiple-laser strategy (Figure 4c,d) assigns individual lasers to specific specimen regions, facilitating parallel processing.
The process parameters used in this study are provided in Table 3. This setup utilizes a stripe scan strategy with stripe width of 3 mm and three contour borders, enhancing dimensional precision at the part edges. Additionally, a laser hatch overlap (stitching zone) of 150 µm is introduced between adjacent laser scan fields to mitigate defects such as lack of fusion or thermal mismatch at the overlap zones. The use of multiple lasers with 150 µm stitching aims to optimize productivity while maintaining consistent material quality across the entire build area.

3. Characterization Methodology

3.1. Density, Microhardness, and Microstructure

Square bars #2 and #4 shown in Figure 2 are used for the density measurement, microhardness testing, and microstructure analysis. The density, microhardness, and microstructure analyses were performed at various locations on specimens #2 (upwind) and #4 (downwind), as illustrated in Figure 5. The sample surfaces were mechanically ground using a P1200 grit sandpaper before performing Archimedes’ density measurement. Mechanical grinding was performed on the surfaces to eliminate the effect of surface tension. Three density measurements were performed, and average values were considered for comparison. Ten Vicker’s indentations were performed on the Y-Z plane (along the build height) of the samples, and average hardness values were computed and used for analysis.

3.2. Profile and Areal Surface Texture Measurements

Both qualitative and quantitative analyses were performed on as-built cylindrical rods from group #2 and group #4 (as shown in Figure 2) to characterize the surface conditions. The surface morphology of the as-built specimens, after machining and grinding, was analysed using a digital microscope (VHX-1000, Keyence, Osaka, Japan). Next, profile and areal surface texture characterizations were performed on the samples. A large area of 12.5 mm × 2.5 mm, as shown in Figure 6, was measured per ISO 21920 [26] with a cut-off λ c = 8 mm to extract Ra (arithmetic mean deviation of the assessed profile) and Rz (maximum height of profile). Next, areal surface texture parameters Sa (arithmetic mean height) and Sz (maximum height) of the as-built surface were extracted without any filters to consider both the short (loose powders, balling melts) and long wavelength (stair-stepping) defects arising from the L-PBF process.

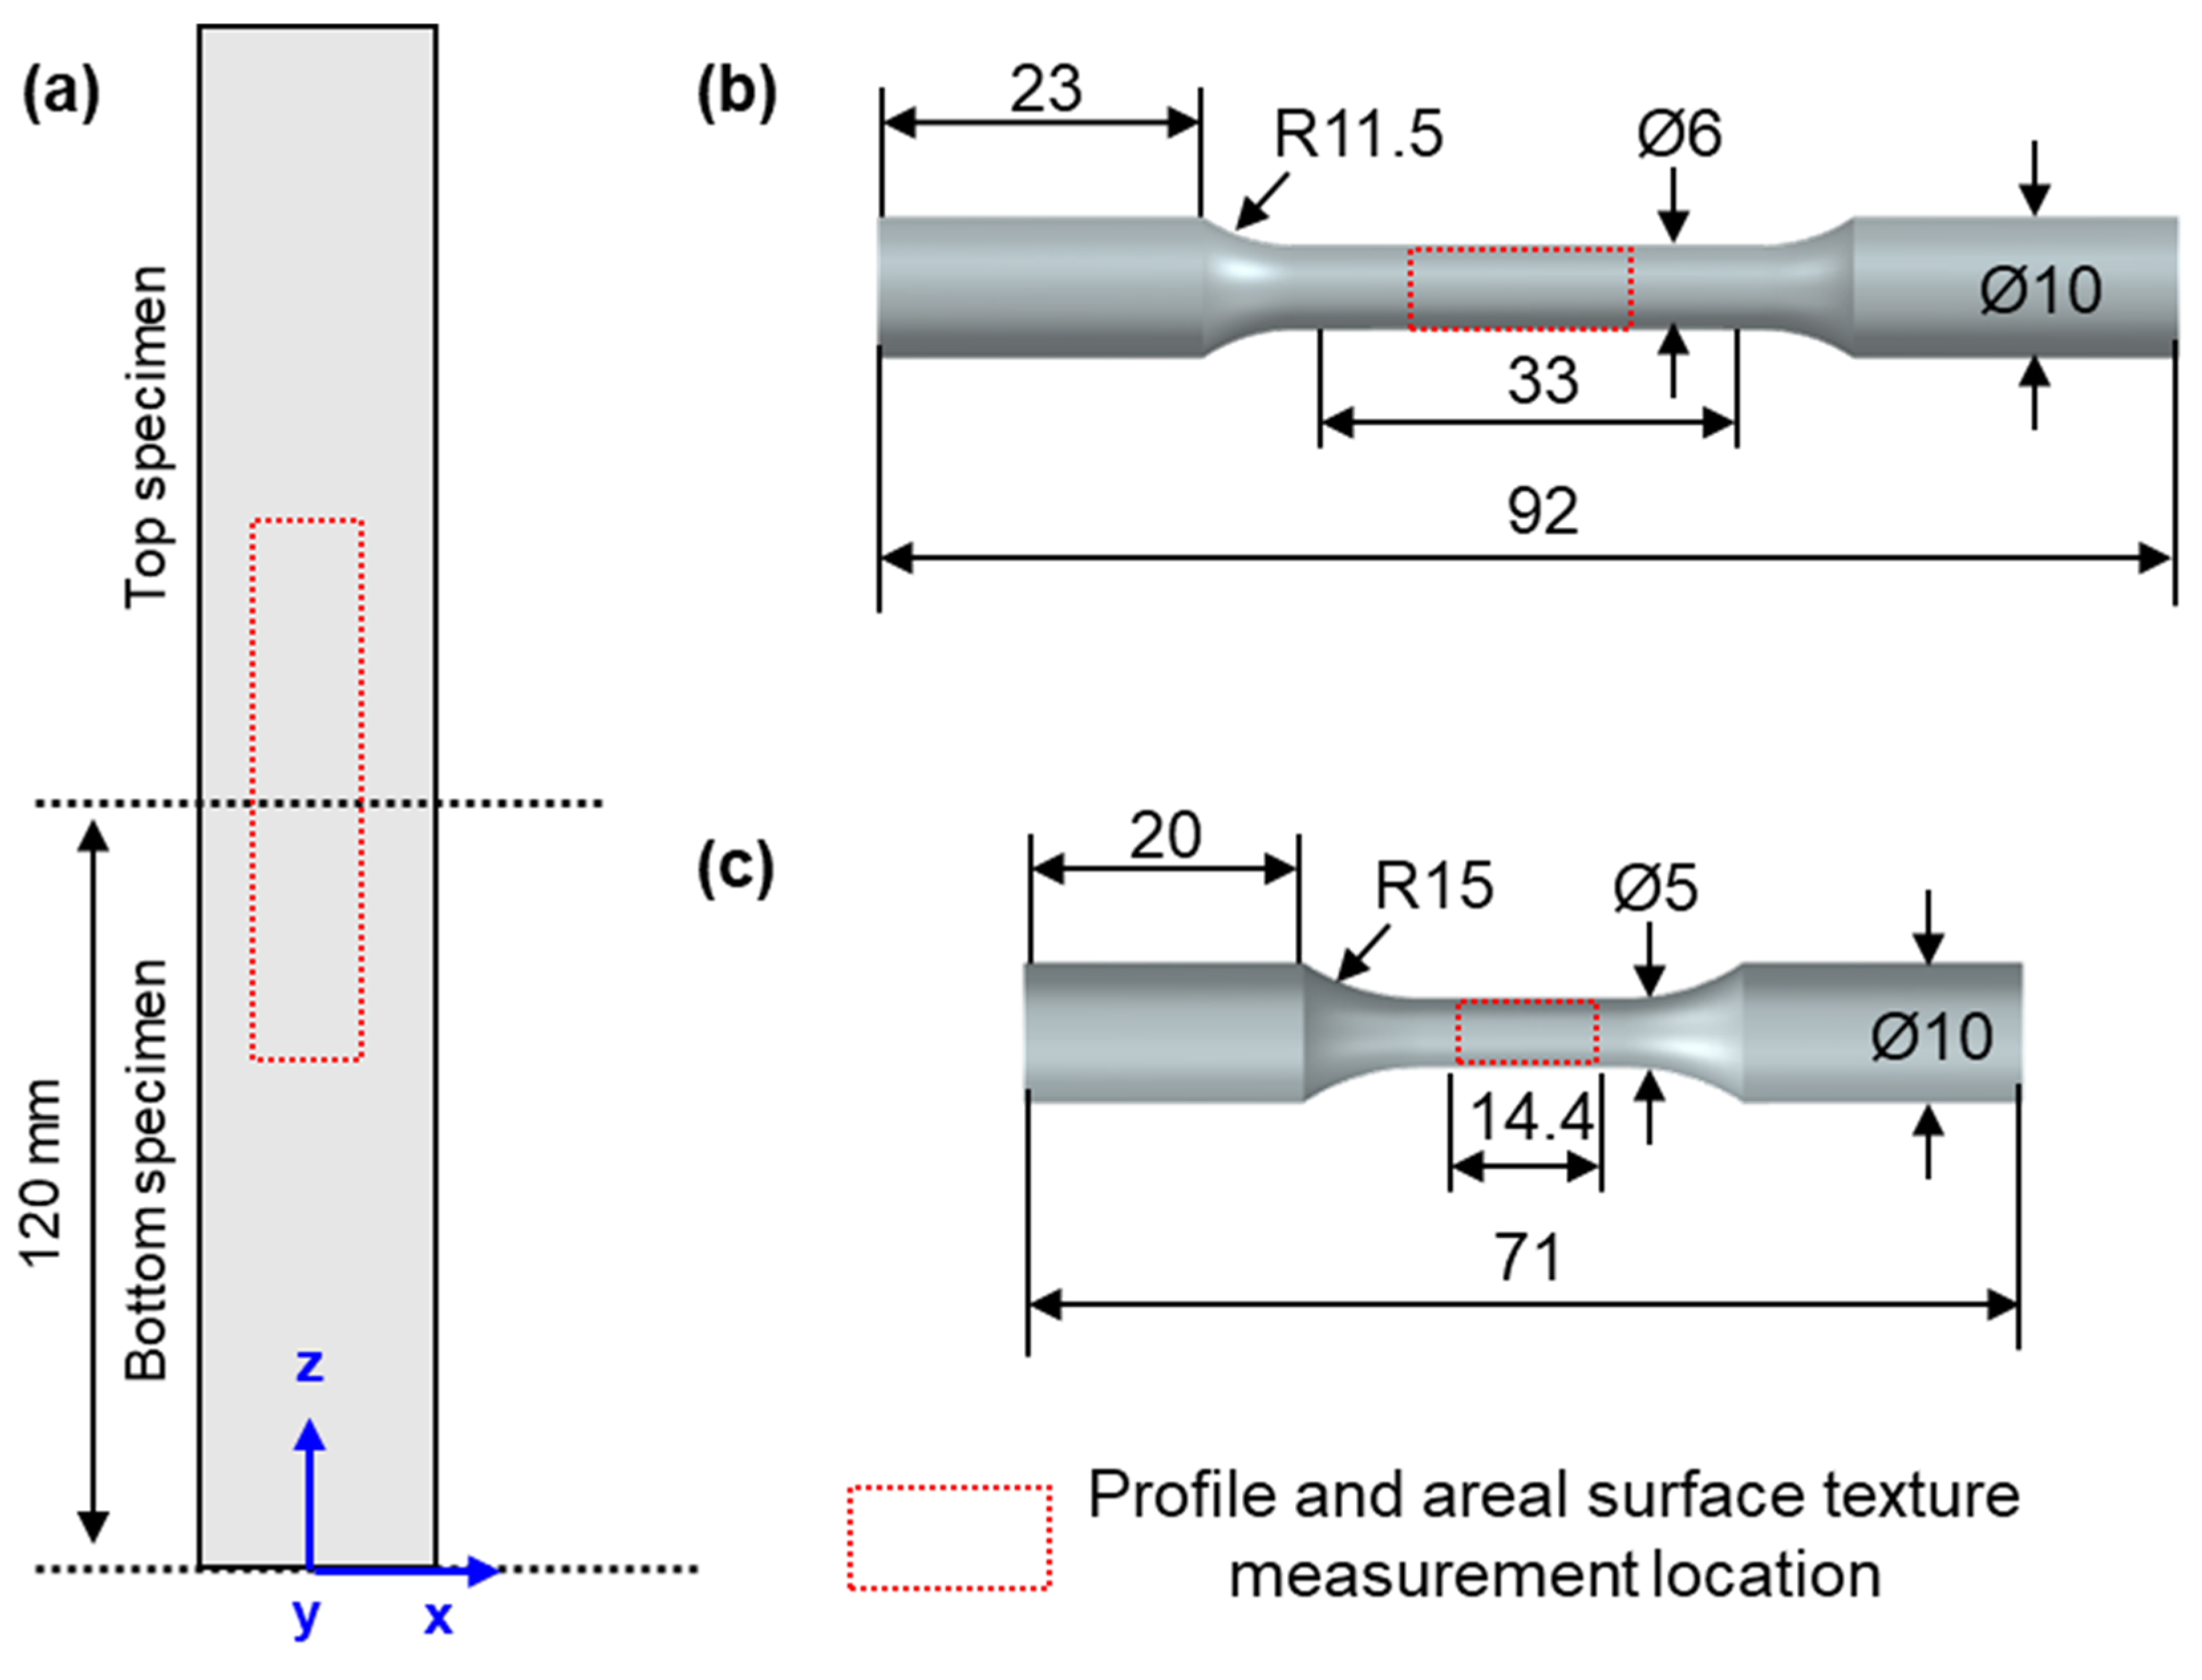
3.3. Mechanical Properties: Tensile and Strain-Controlled Fatigue

Tensile and low-cycle strain-controlled fatigue tests were performed on both single- and multi-laser built specimens. The samples were machined (turning) and tensile tested as shown in Figure 6b per ASTM E8 [27] at a strain rate of 0.5 mm/min using an Instron UTS 5982 (Norwood, MA, USA). A 0.2% offset method was applied to extract the yield strength (YS). Next, low-cycle strain-controlled fatigue tests were performed per ASTM E606 [28]. The samples were machined and mechanically ground in the longitudinal direction to ensure uniform surface conditions. The strain amplitude was fixed at 0.5%, and all the samples were tested at a stress ratio of ε m i n ε m a x = 1 with a frequency of 5 Hz (it was ensured that a stable hysteresis loop was achieved, and the specimen self-heating effect, if any, was insignificant during these tests). The results of single- and multiple-laser built specimens were compared with multiple-laser built components. Top and bottom specimens machined from cylindrical rods 2-4 and 4-4 from each build were used for tensile, and rods 2-1, 2, 3 and 4-1, 2, 3 were used for fatigue tests, as shown in Figure 2. Averages of top and bottom specimens in the upwind and downwind zones were calculated for comparative analysis of the results.

4. Experimental Results

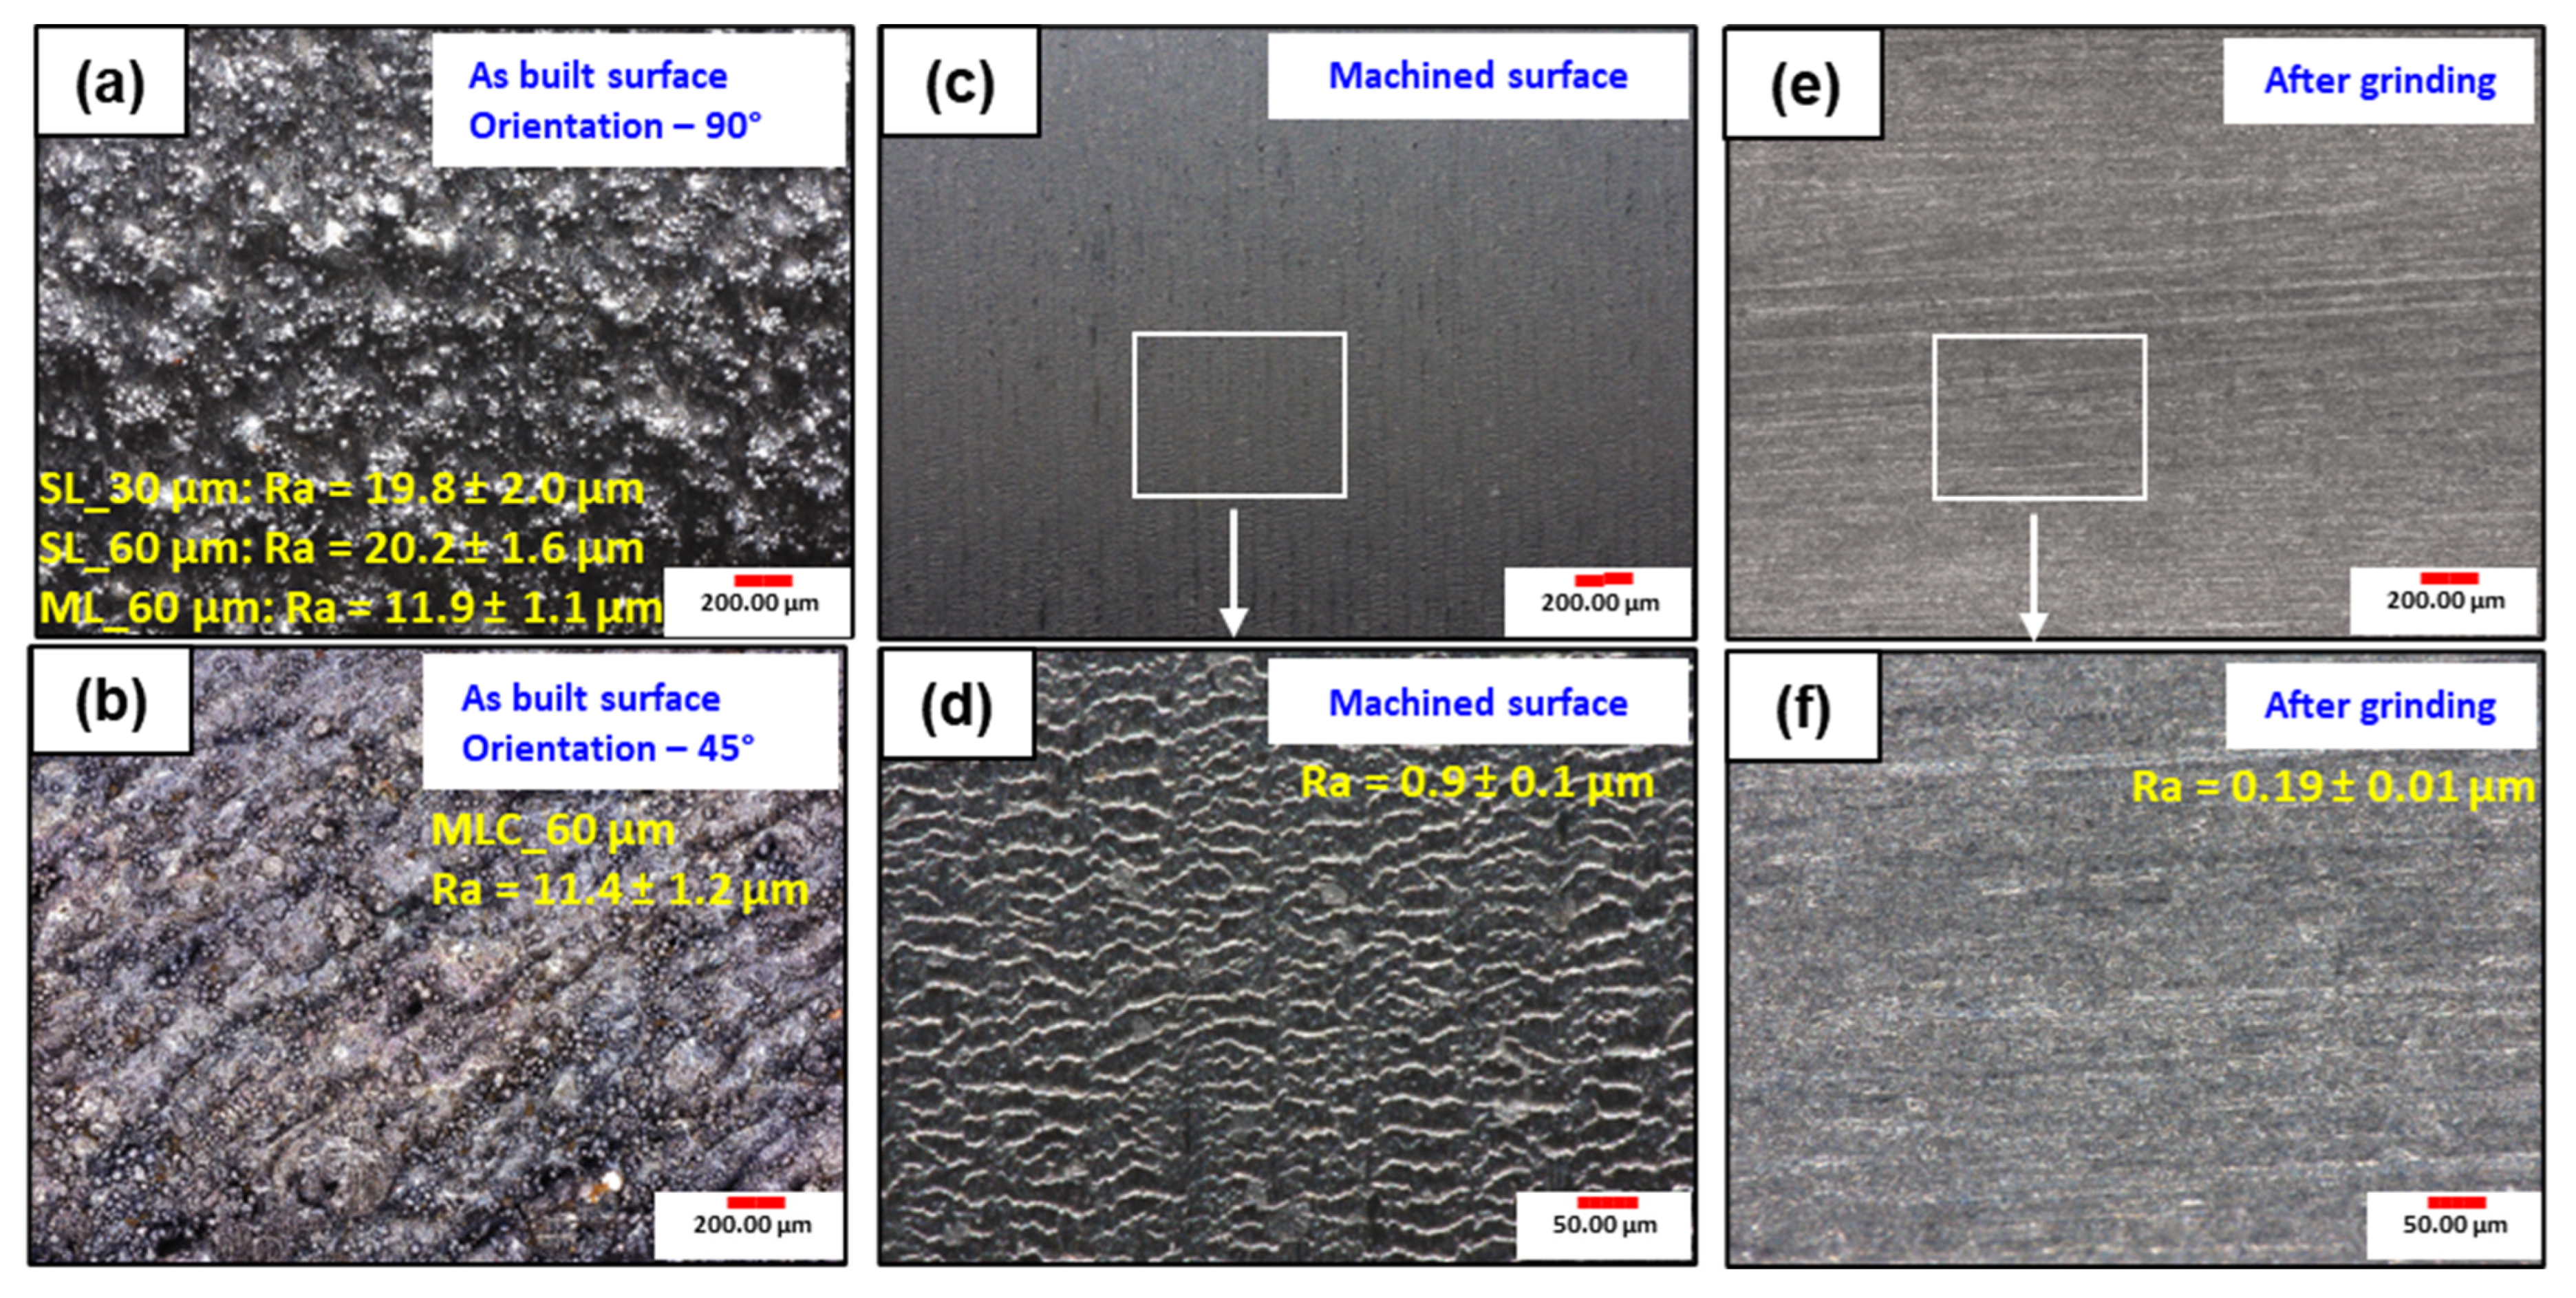
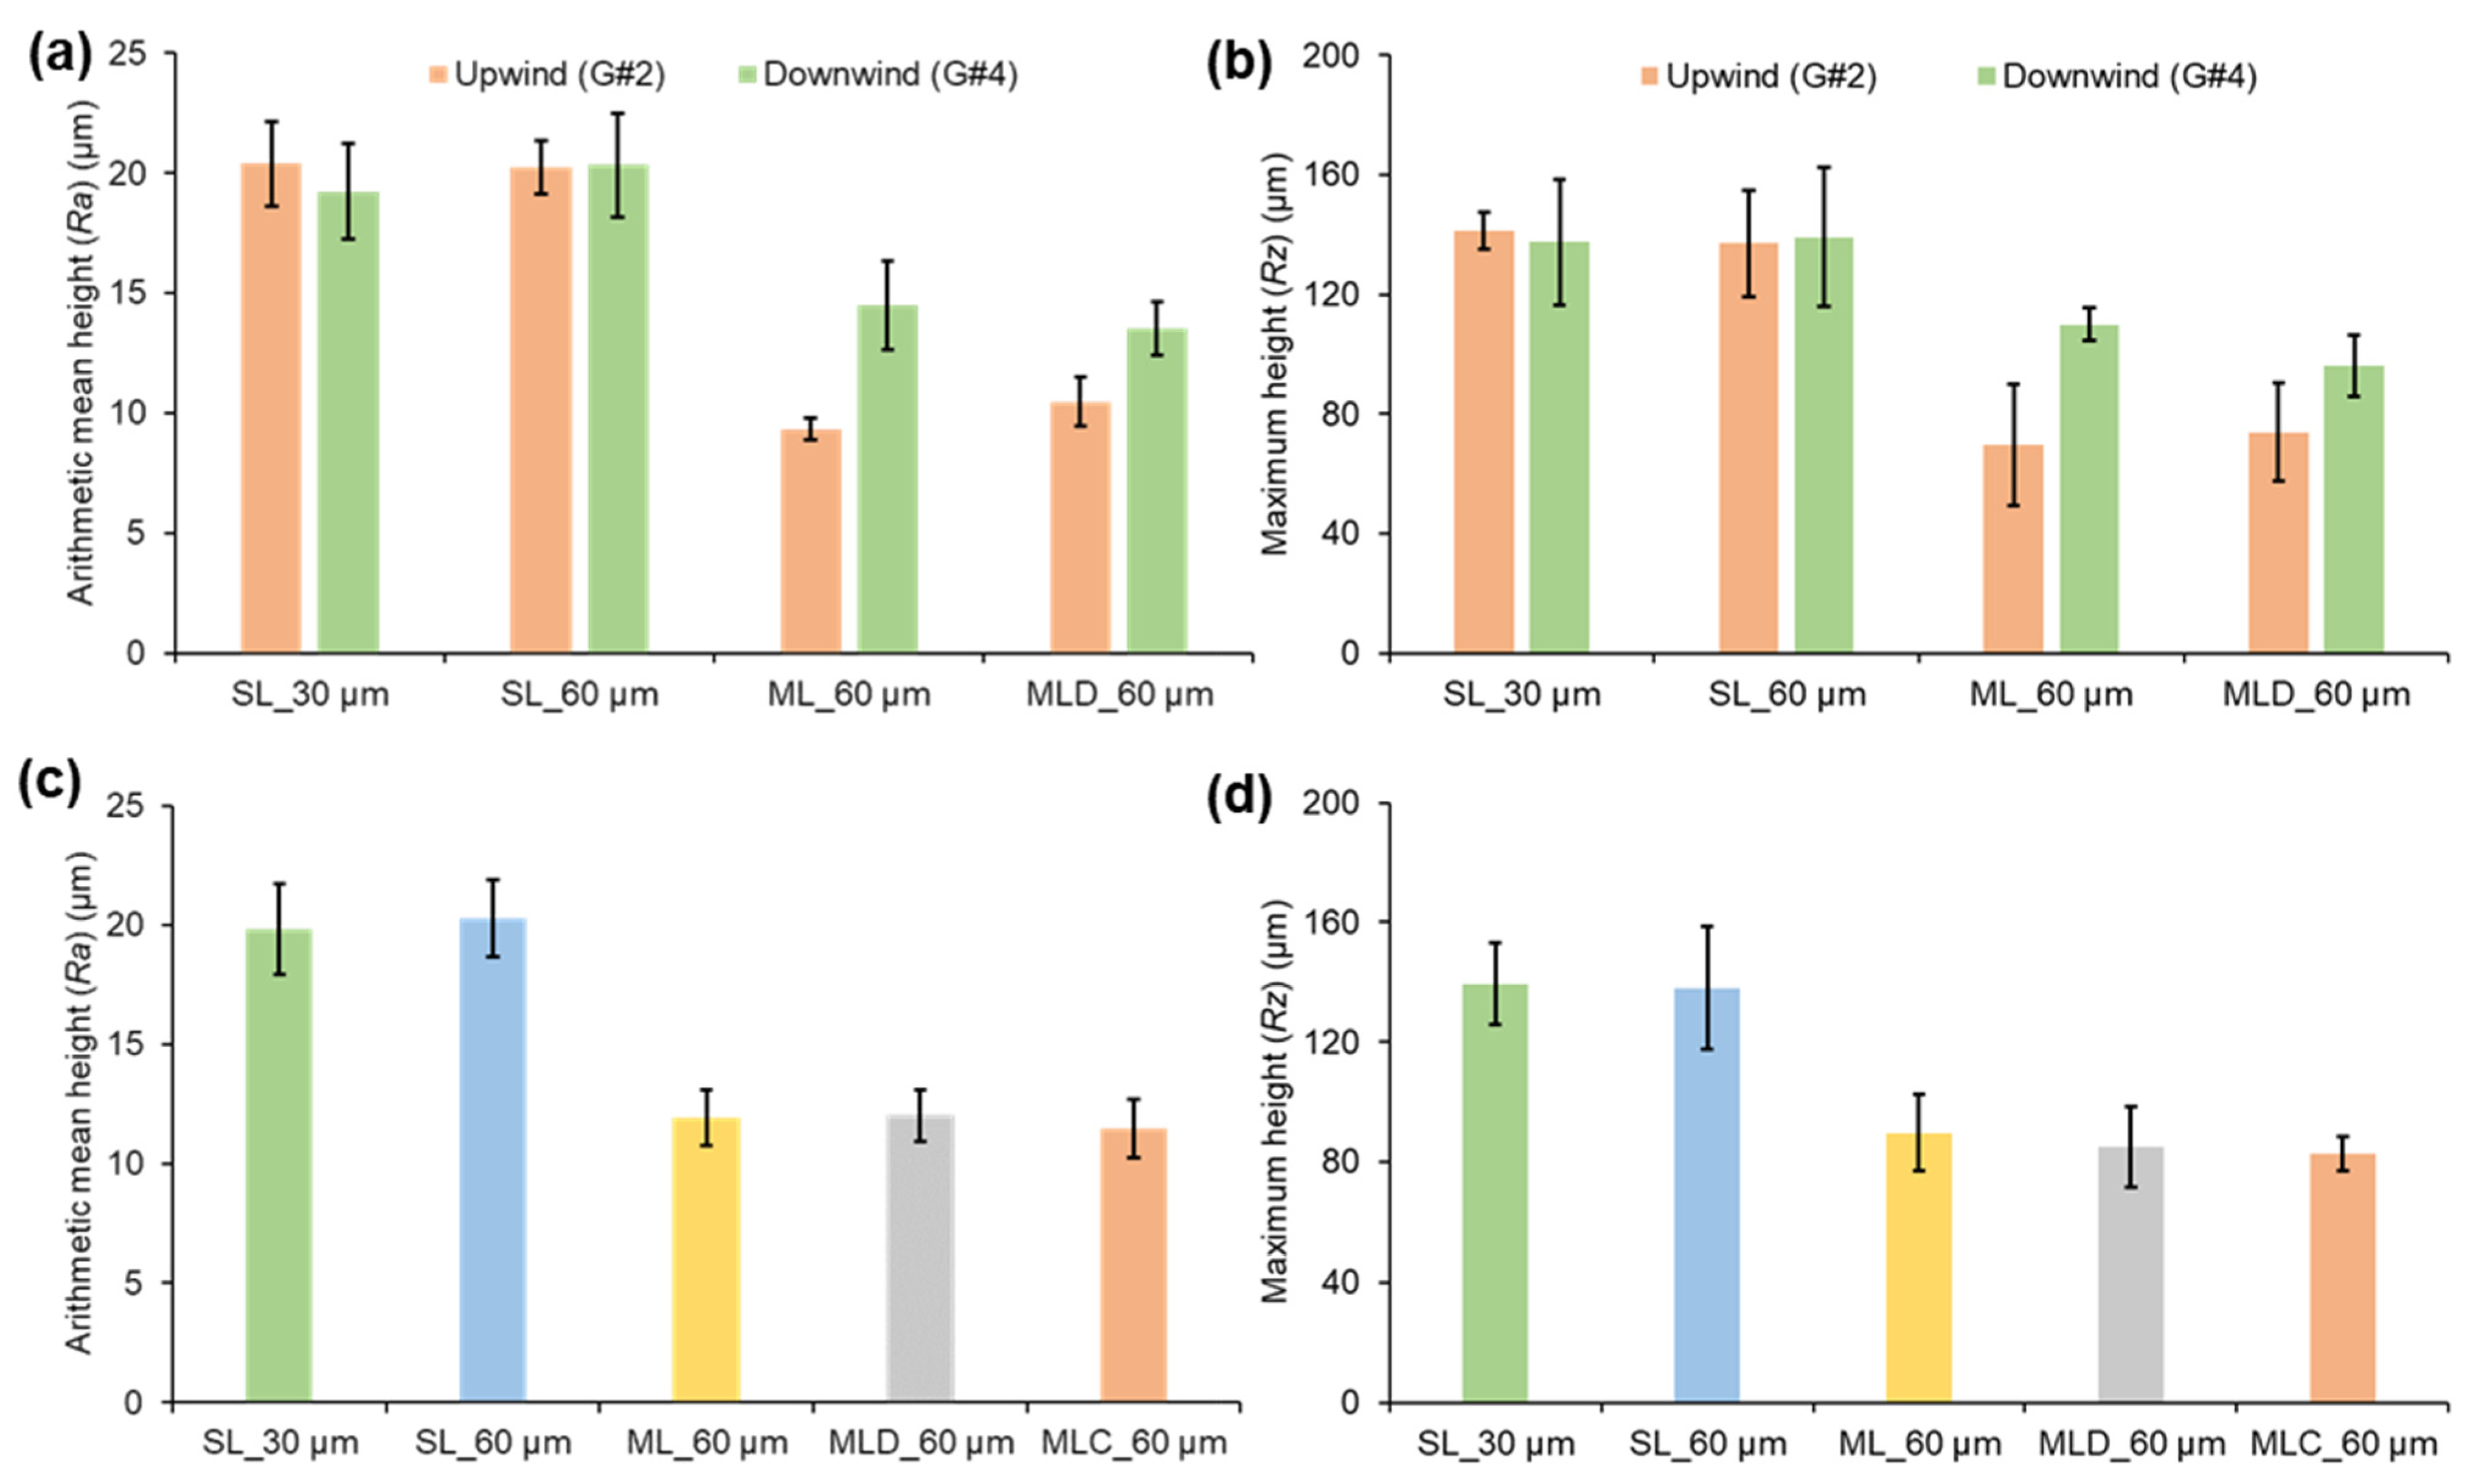
4.1. Profile and Areal Surface Texture

The surface morphology of L-PBF manufactured AlSi10Mg components is shown in Figure 7. In the as-built condition (Figure 7a,b), a rough surface was observed with prominent texture, numerous spherical particles, and partially melted powder adhered to the surface, particularly pronounced at a 90° orientation due to the stair-stepping effect. Figure 7b, which depicts a 45° orientation, still shows significant roughness but with less loose powders and balling melts and elongated features, reflecting the influence of layer orientation and the anisotropic nature of the process. These variations underscore the dependence of surface quality on build angle, affecting surface finish and post-processing requirements. After machining, as shown in Figure 7c,d, a significant reduction in surface roughness was observed as expected, with most adhered particles removed (2 mm thickness machined), and surface irregularities smoothed out. The magnified view in Figure 7d reveals fine parallel grooves on the order of 20–30 µm width from the machining process, indicating a smoother surface but retaining microscale machining marks. Figure 7e,f show the surface after grinding, where the process further refines the machined surface, smoothing out previous machining marks and reducing surface roughness. The magnified view in Figure 7f reveals a more uniform texture with fine, almost indistinguishable features per ASTM E606 [28] as needed for fatigue testing specimens.
The profile surface texture measurements of single- and multiple-laser built specimens in the upwind (group #2) and downwind (group #4) zones are shown in Figure 8. The roughness of single-laser specimens was 17.5–22.5 µm (Ra), while multiple-laser specimens had significantly lower Ra < 10 µm in the upwind and 14.5 µm in the downwind zone. Overall, single-laser built specimens had ~28% higher roughness than multiple-laser specimens. The low roughness values observed in multiple-laser builds are attributed to the border scanning parameters. A similar difference was noticed in the Rz values: single-laser built specimens had Rz values of 120–160 µm, and multiple-laser built specimens had a roughness of 50–85 µm in the upwind and 100–110 µm in the downwind zone. However, as shown in Figure 8b, there was no noticeable difference in the multiple-laser built specimens with decreased gas flow of 150 m3/h compared to 190 m3/h. The average values combining the upwind and downwind zone specimens were calculated and plotted in Figure 8c,d to compare against the multi-laser builds.
The surface topography analysis reveals significant variations in roughness across different laser configurations and post-processing conditions. As seen in Figure 9a,b, the single-laser builds of 30 µm and 60 µm layer thickness exhibited relatively higher surfaces compared to multiple-laser configurations with 60 µm layer thickness (Figure 9c), decreased gas flow (Figure 9d), and components (Figure 9e) with increased peak-to-valley distance of >200 µm, while the multiple-laser built specimens with modified contour parameters showed reduced peak-to-valley values of <150 µm. The impact of gas flow reduction is particularly evident in Figure 9d, where decreased flow leads to increased surface irregularities, likely due to spatter redeposition and inconsistent melt pool solidification. The post-processing steps significantly refined surface characteristics, as demonstrated by the tensile specimen after machining in Figure 9f and the fatigue specimen after grinding in Figure 9g, both of which exhibited substantially reduced roughness. These findings emphasize the need for optimized contour, gas flow strategies, and finishing techniques to enhance the surface quality of multi-laser L-PBF components.

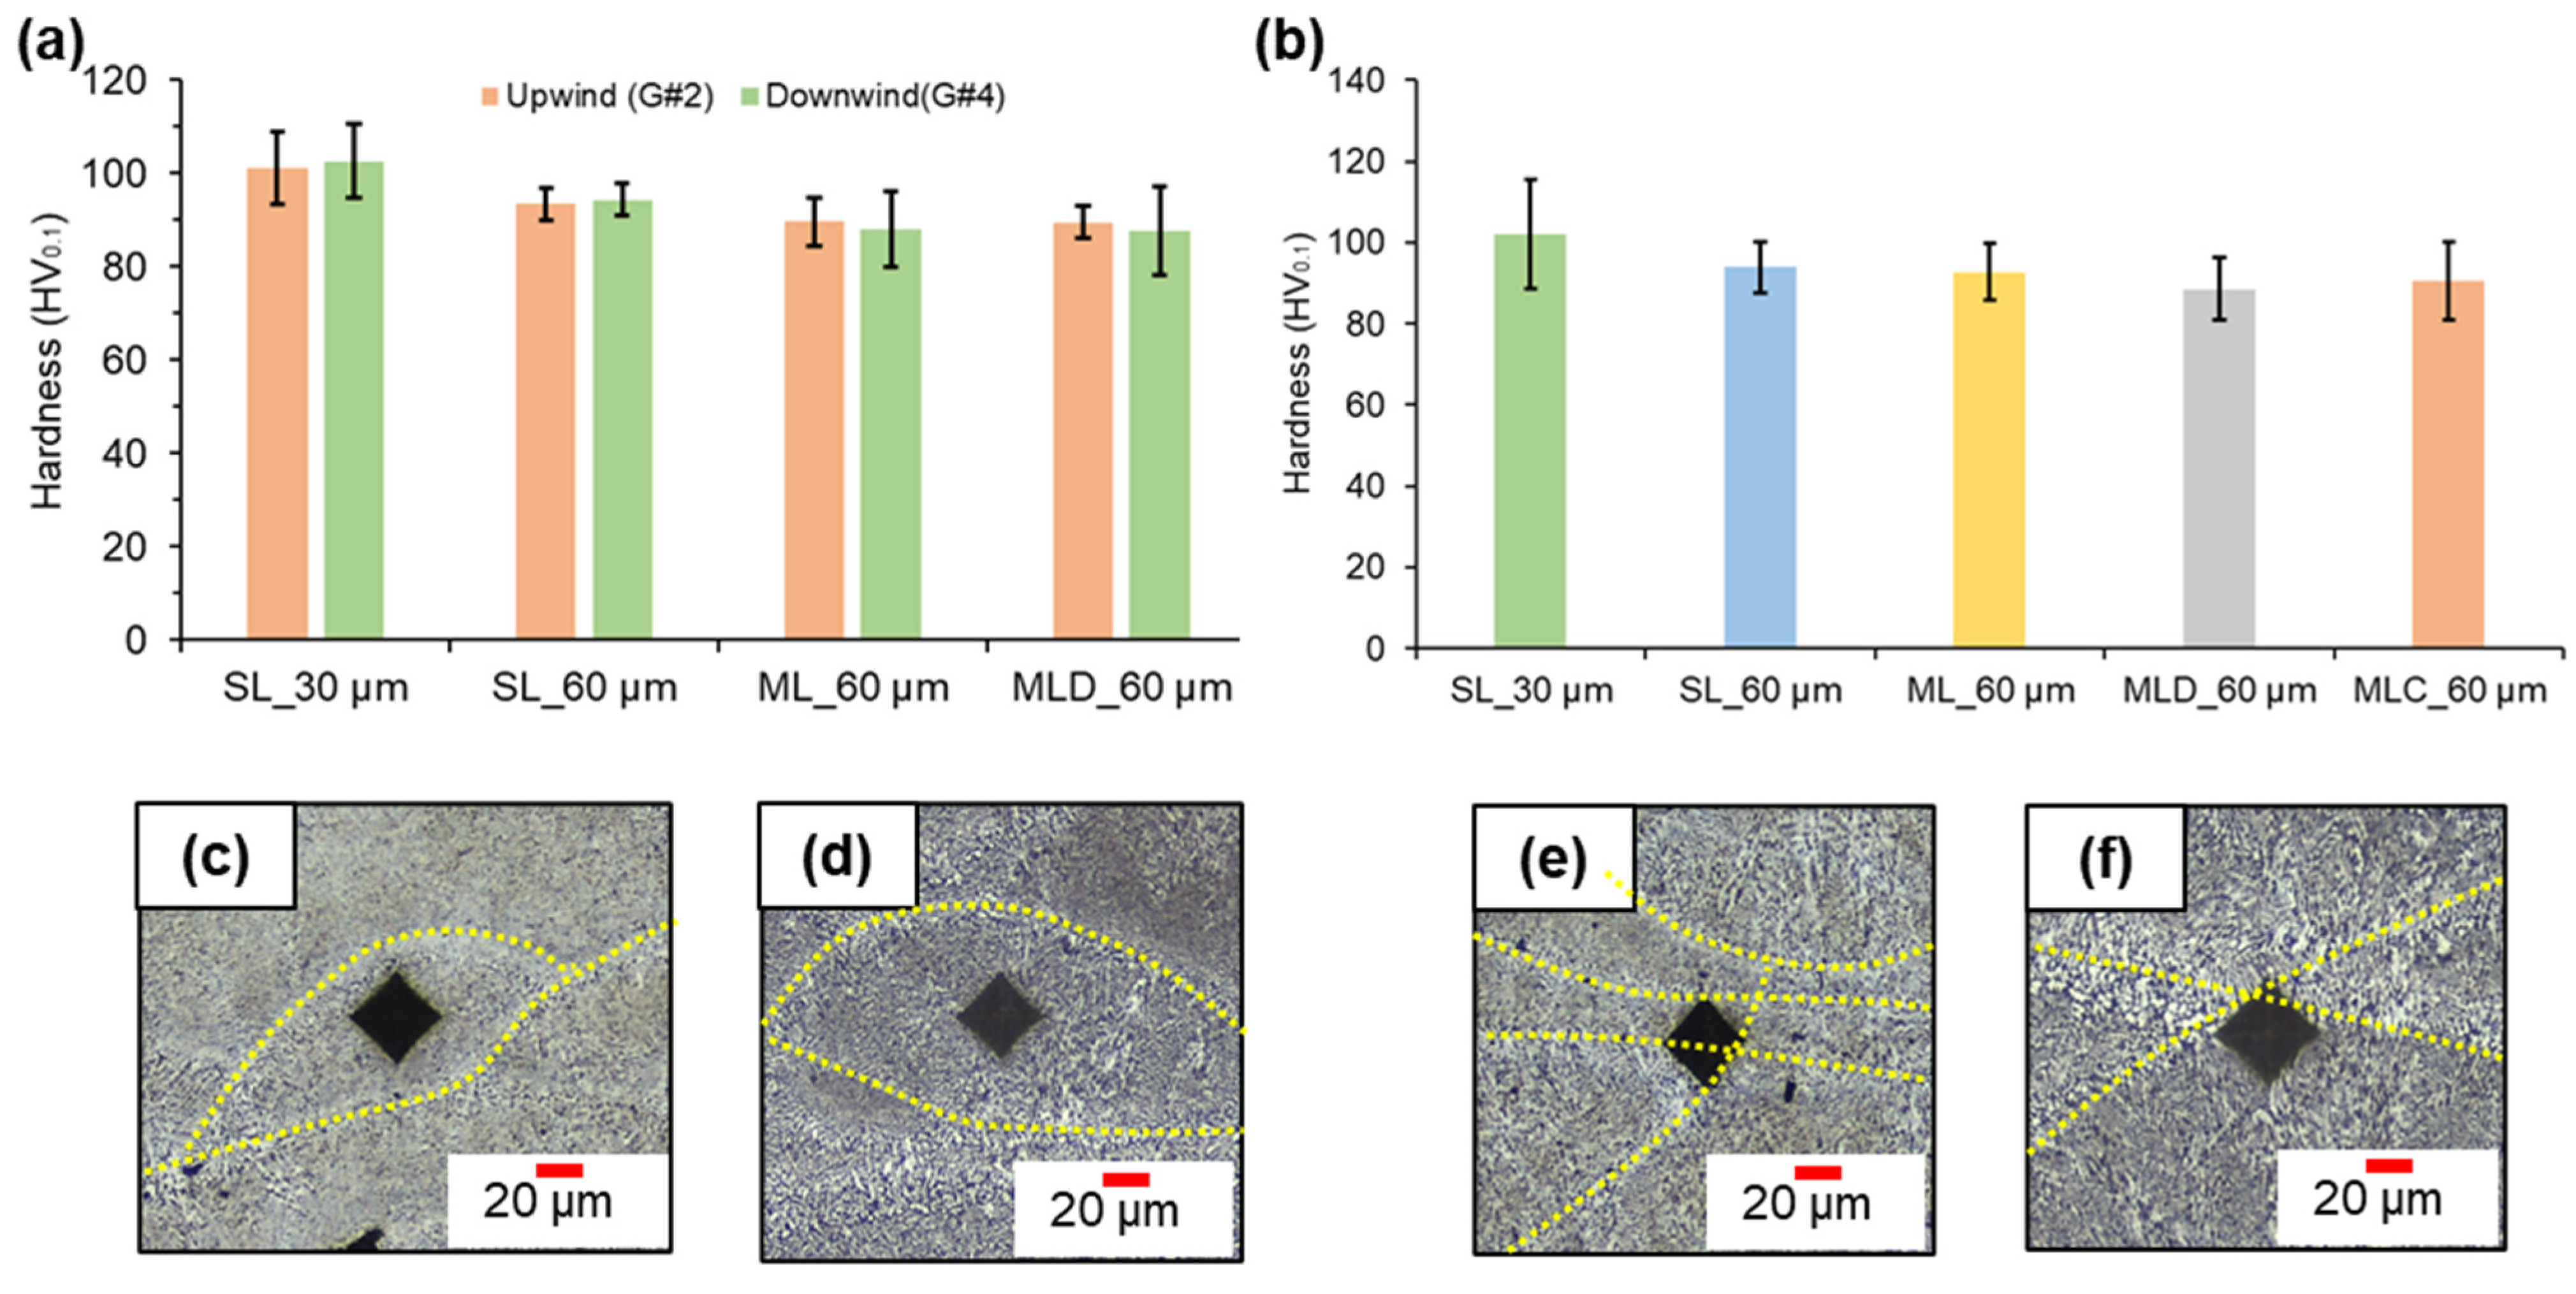
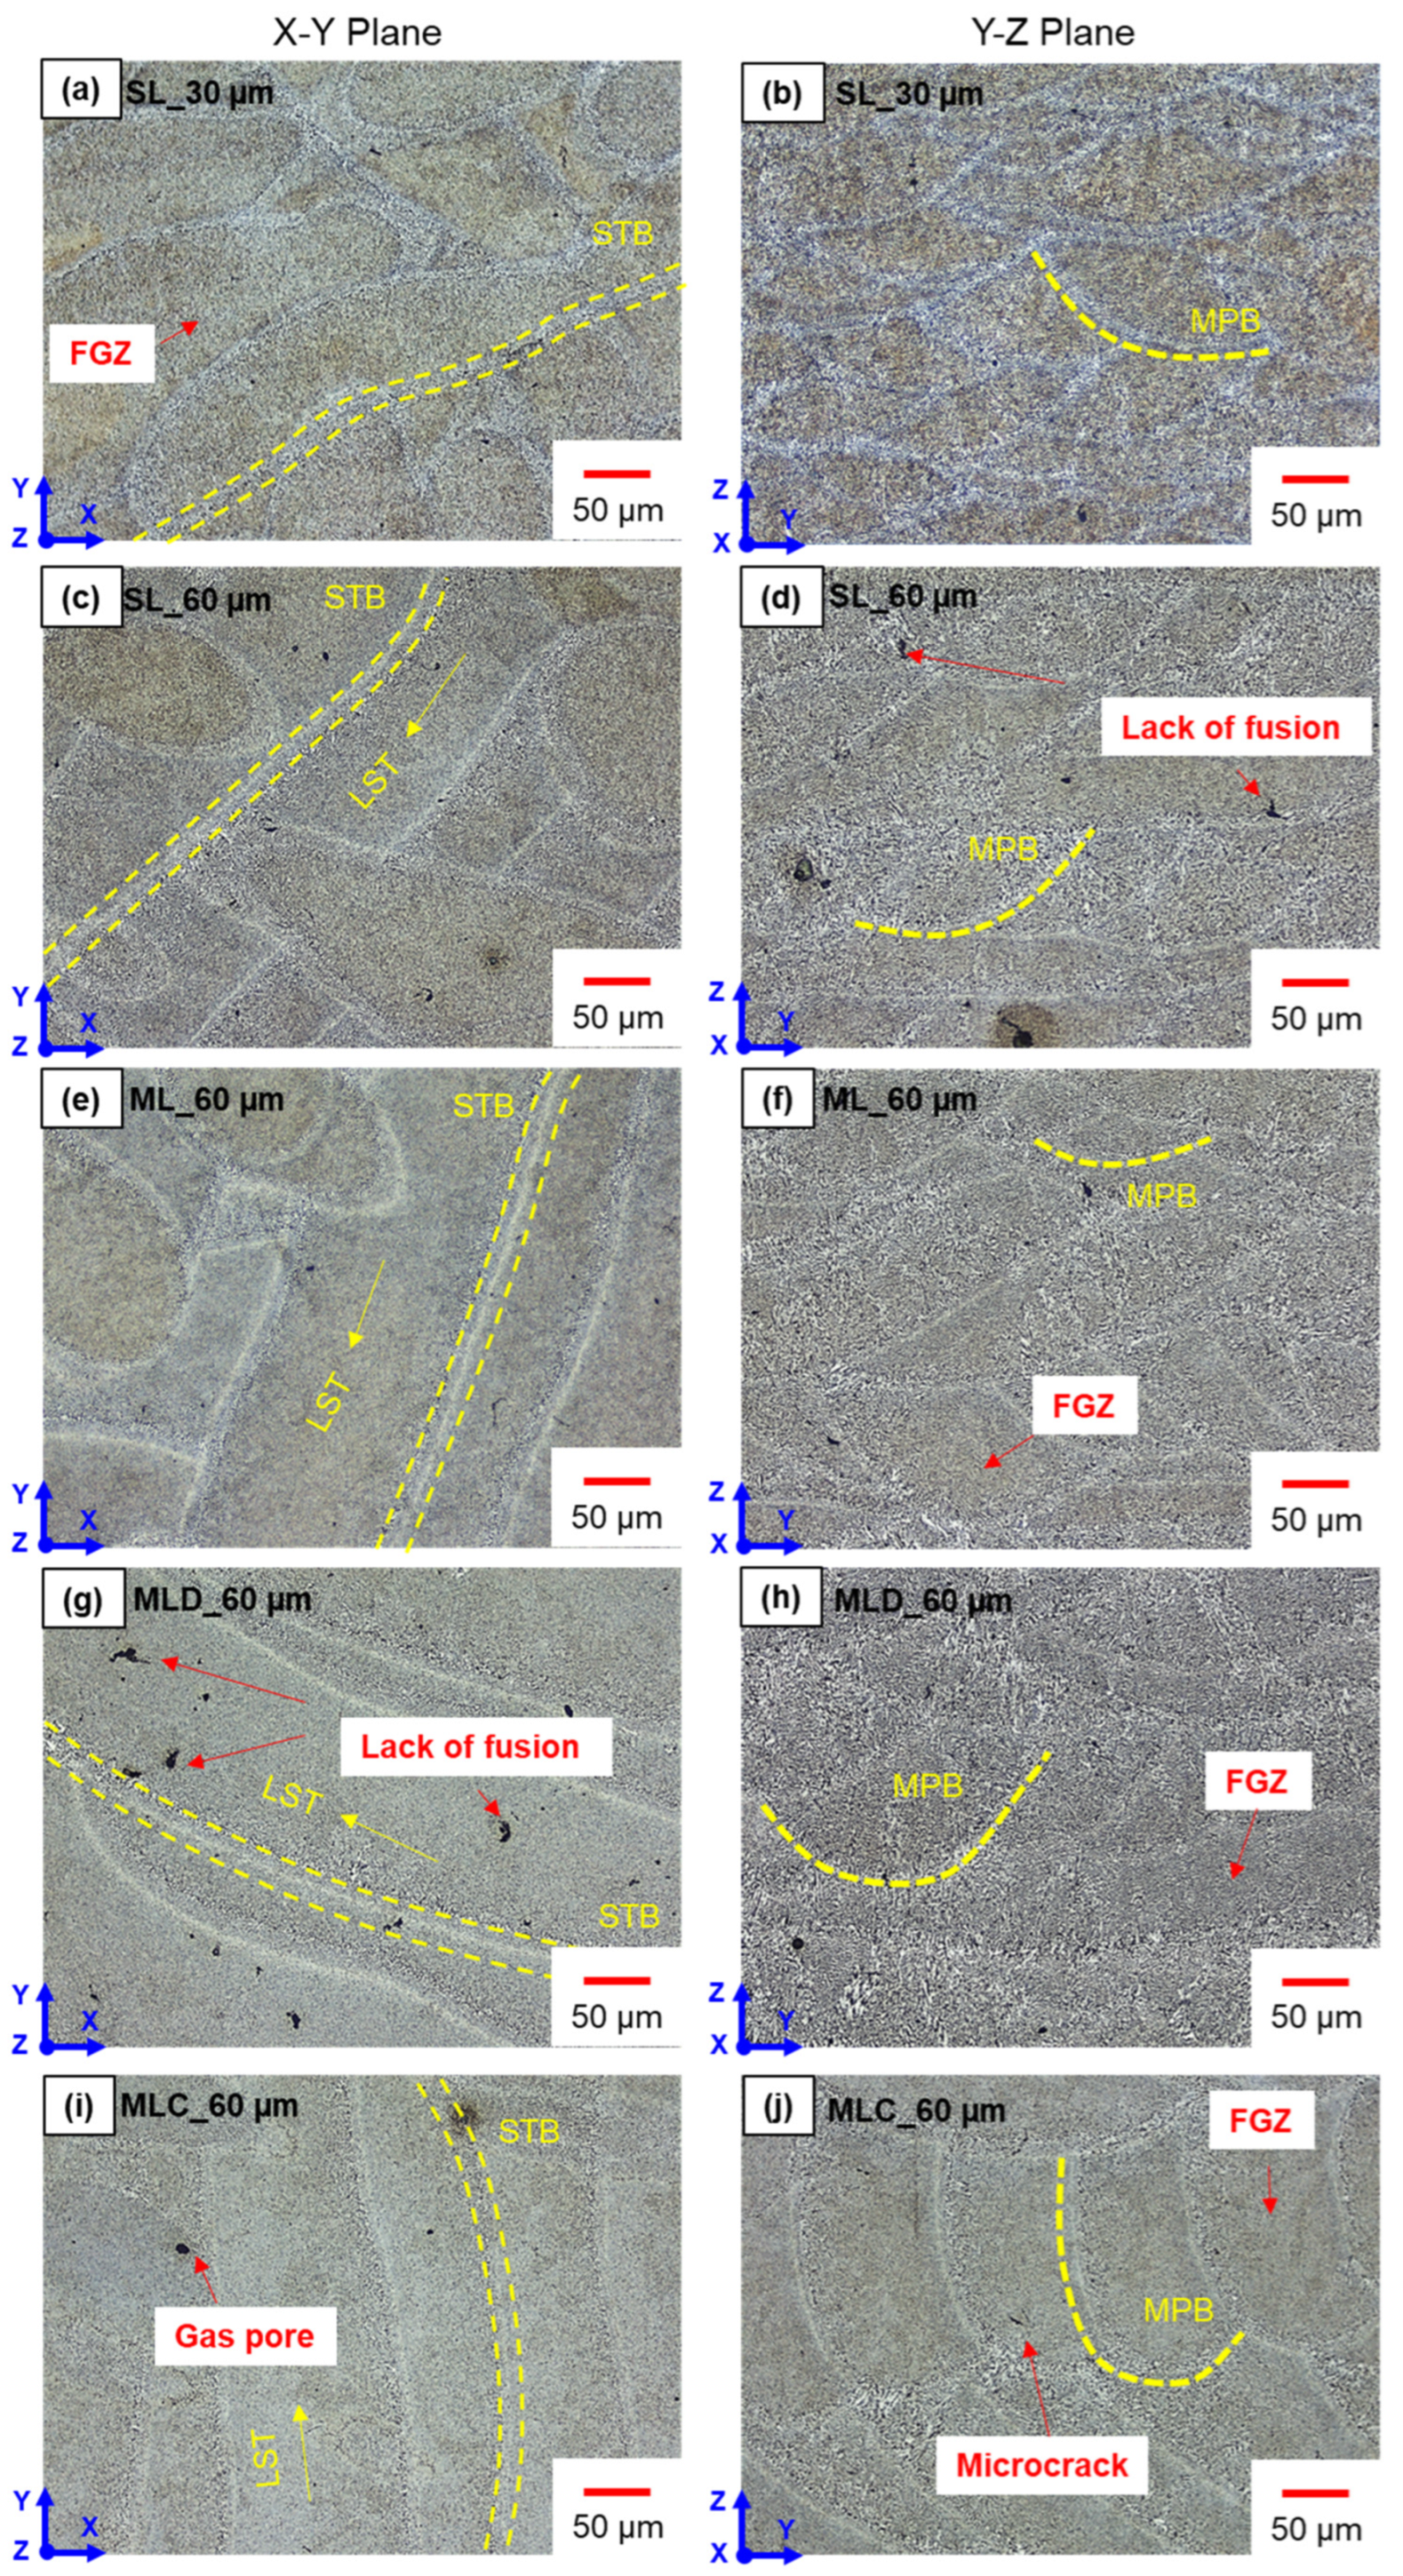
4.2. Density, Hardness, and Microstructure

The Archimedes density results are shown in Figure 10. The density values indicate that both single- and multiple-laser processing achieve high material consolidation, with minor variations across different conditions. The density values are negligible across the upwind (group #2) and downwind (group #4) specimens considering the standard deviation. While single-laser specimens at 30 µm and 60 µm layer thicknesses show consistent density, multiple-laser configurations (MLD_60 µm, MLC_60 µm) exhibit higher average values, likely due to optimized laser overlap and enhanced melt pool stability. However, the high standard deviations are due to gas porosity and lack-of-fusion identified during defect analysis shown in Figure 10c–e. The effects of density change on the tensile and fatigue properties are discussed in Section 4.3.
The microhardness measurements shown in Figure 11a,b highlight the influence of single- and multiple-laser processing on the hardness distribution in the specimens. Overall, hardness values remain relatively consistent (90–100 HV) across different processing conditions, indicating uniform material properties. However, marginal reductions (~10%) in hardness are observed in multiple-laser configurations compared to single-laser builds, potentially due to variations in thermal gradients and microstructural evolution. Average scan time per layer is 35.1 s for single-laser compared to 9.675 s for multi-laser builds. This significant difference leads to heat accumulation as the build height is increased. This is an important factor influencing even the manufacturability of overhang structures when no supports are used.
The micrographs in Figure 11c–f provide insights into hardness distribution across different microstructural regions. Indentations within fine-grain zones (Figure 11c,d) show higher hardness due to finer Si particle dispersion, while indentations on grain boundaries (Figure 11e,f) exhibit slight reductions, likely due to a softer α-Al matrix region. The relatively lower hardness in multiple-laser builds may be attributed to thermal fluctuations induced by overlapping laser beams, leading to coarsening of the microstructure. Despite these differences, the hardness values across all conditions remain within 10% deviations.
The microstructural analysis shown in Figure 12 reveals significant differences between single- and multiple-laser built samples, influenced by scanning strategy, thermal gradients, and gas flow conditions. Single-laser built samples (Figure 12a–d) exhibit well-defined melt pool boundaries (MPB), fine-grained zones (FGZ), and scan track boundaries (STB), indicative of controlled heat input and solidification. However, occasional lack-of-fusion defects noticed in Figure 12d at higher layer thicknesses (60 µm) could be due to fluctuations in energy input. Moreover, the laser scan track (LST) directions can be understood from the microstructure across the X-Y plane.
Multiple-laser built samples with 60 µm layer thickness (ML_60 µm) using standard processing parameters (Figure 12e,f) did not show significant deviations in microstructure compared to single-laser built specimens. Next, multiple-laser built samples (Figure 12i,j) showed increased microstructural variations, with distinct MPBs and FGZs. When gas flow was reduced (Figure 12g,h), a pronounced presence of lack-of-fusion defects was observed, likely due to insufficient cooling. Additionally, gas pores (Figure 12i) and microcracks (Figure 12j) were detected in multiple-laser built components, indicating localized thermal stresses and imperfect fusion at laser overlap zones. Despite these variations, multiple-laser built samples still maintained well-defined thermal bands and feature sizes comparable to those of single-layer builds. The presence of larger melt pools in multiple-laser components (Figure 12i,j) was due to the directional effects of the specimen extracted, as shown in Figure 3.

4.3. Mechanical Properties

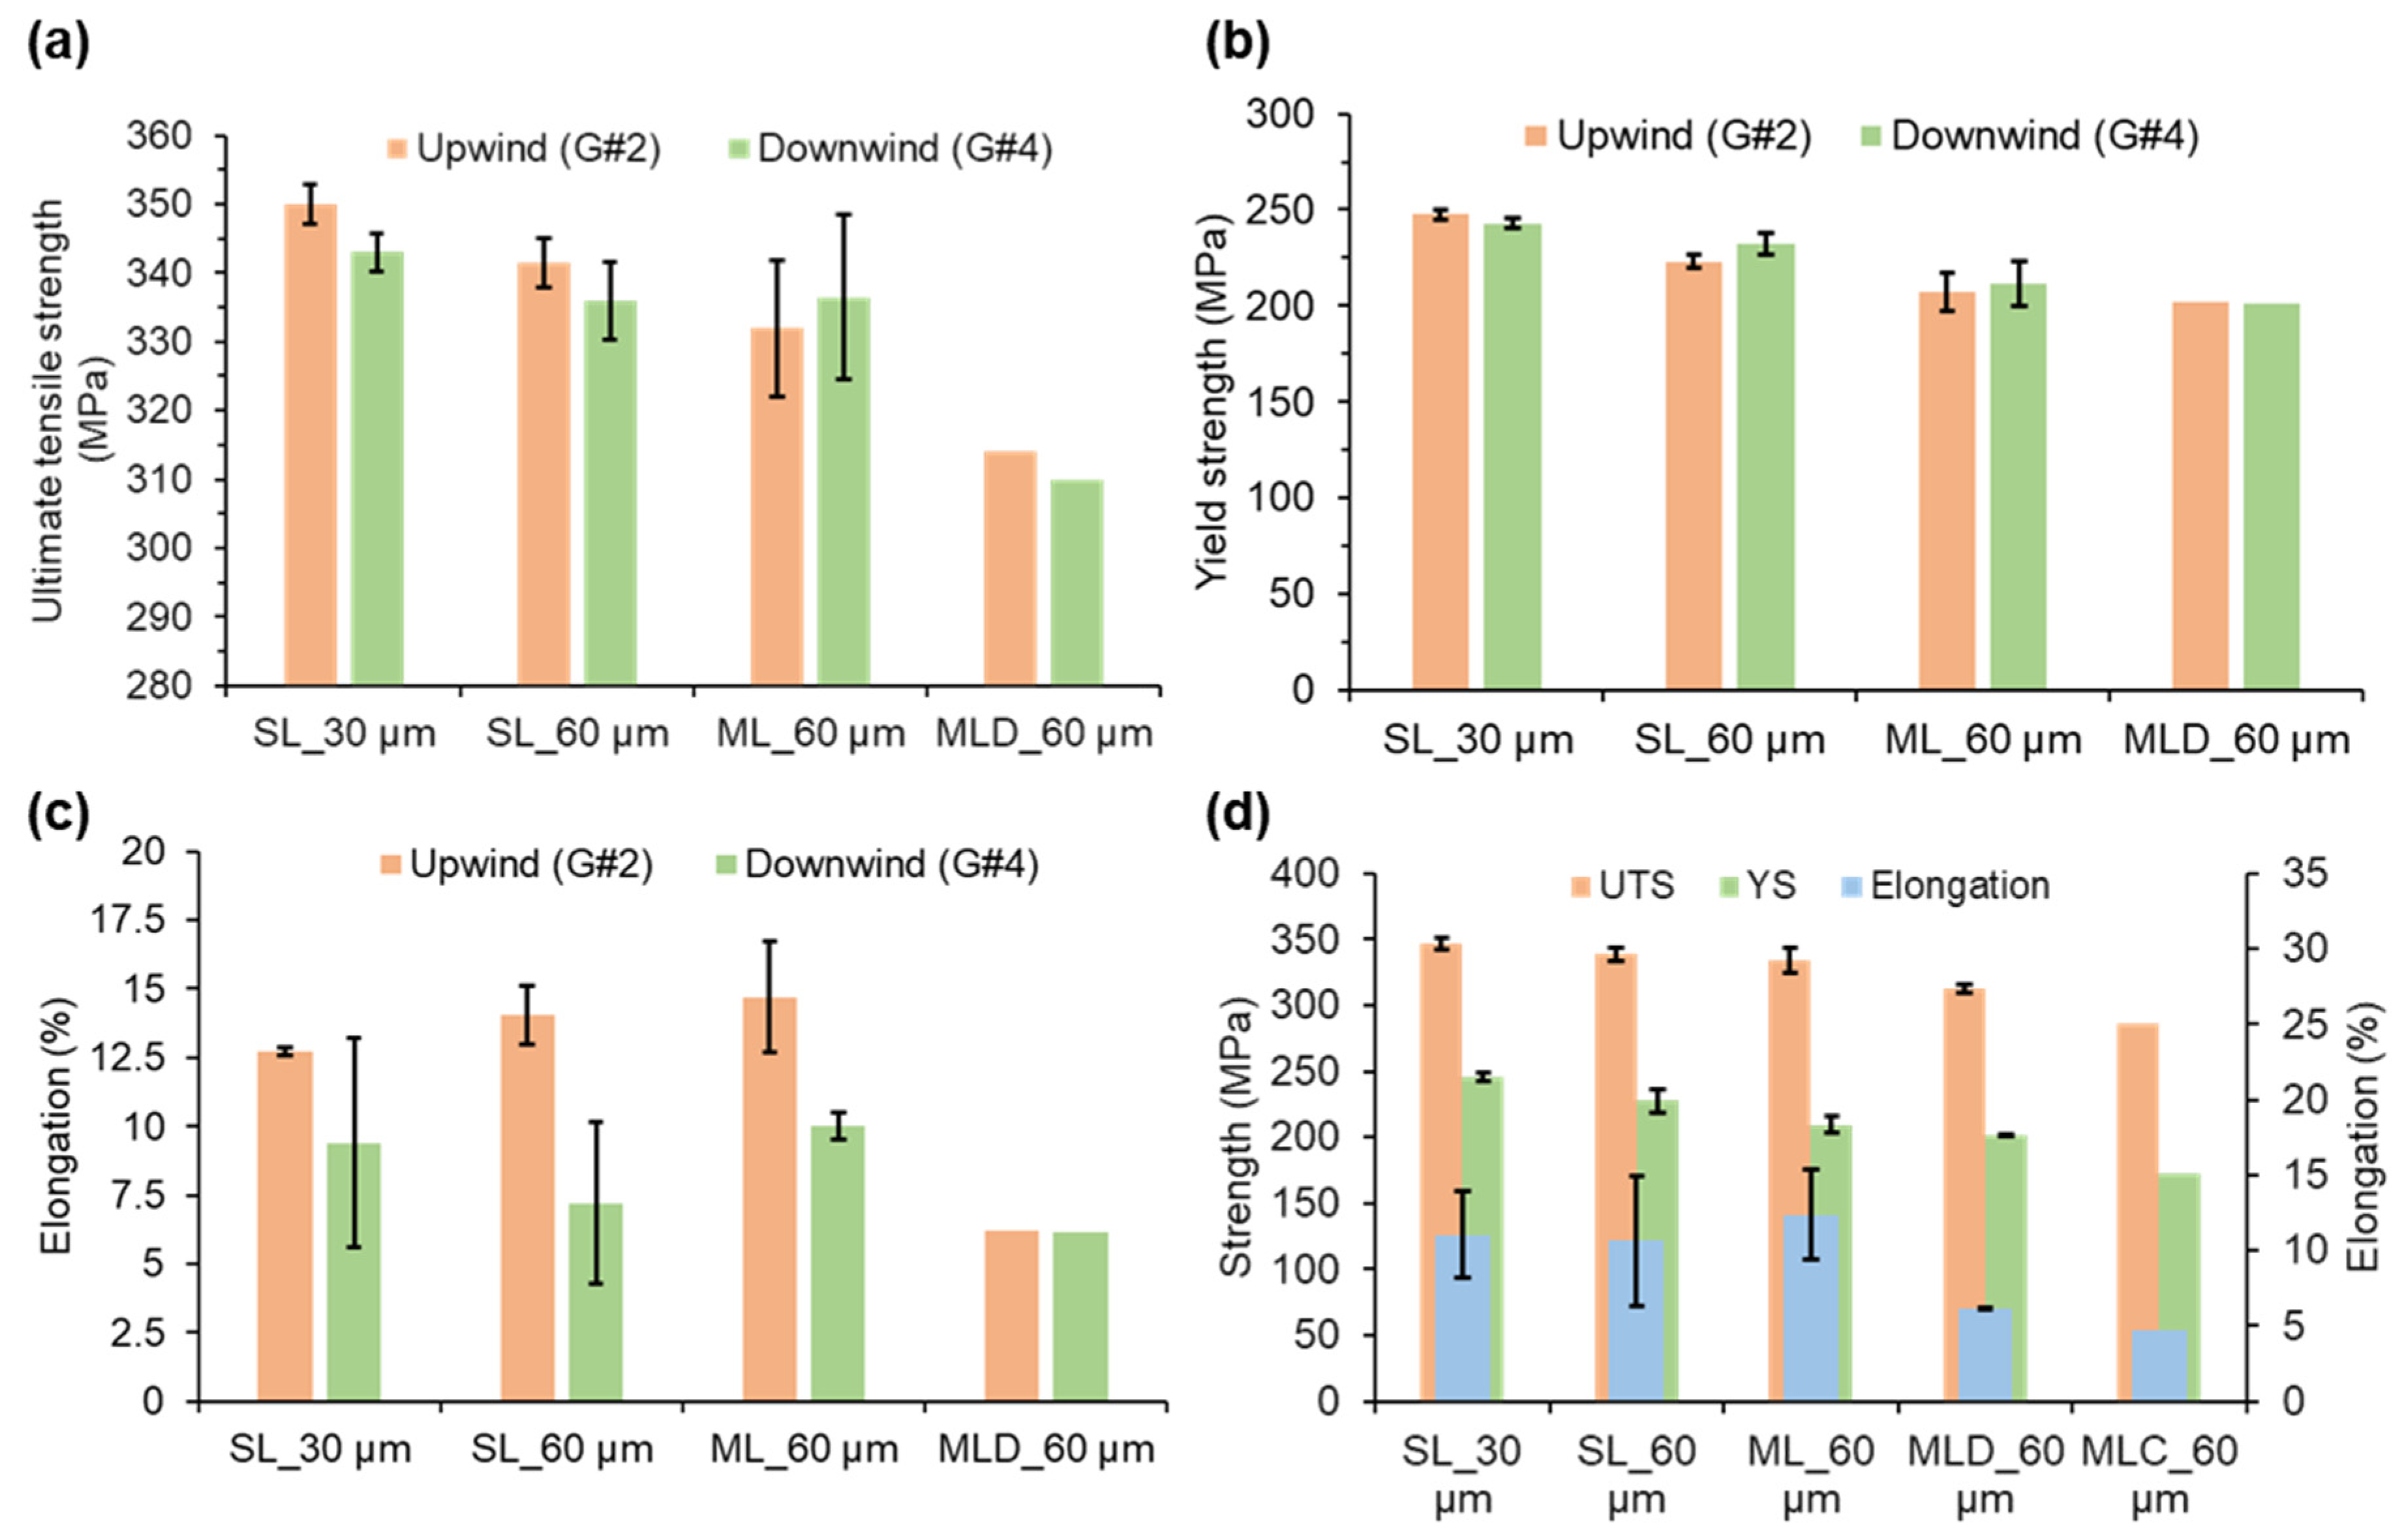
4.3.1. Tensile Properties

The tensile results are presented in Figure 13. The results show the effects of laser configuration on the mechanical performance of the samples. Samples fabricated using the single-laser strategy at a 30 µm layer thickness exhibit the highest ultimate tensile strength (UTS) of 345–350 MPa and yield strength (YS) of 240–250 MPa, along with good ductility, indicating optimal process stability and fine microstructure compared to the reference values in the material data sheet provided by the machine manufacturer. Interestingly, the difference between group #2 (upwind) and group #4 (downwind) specimens in Figure 13a–c highlights the impact of build location and gas flow direction on tensile properties. In most cases, group #2 samples showed higher average UTS and YS, suggesting more uniform build conditions in the upwind region (closer to the inlet).
Considering the overall results shown in Figure 13d, as the layer thickness increases to 60 µm in single-laser configuration, a marginal decrease (<2.5%) in UTS and elongation is observed, likely due to reduced cooling rates and coarser microstructures. Multiple-laser builds at 60 µm layer thickness show slightly lower (~3.5%) UTS and YS compared to single-laser builds but still maintain reasonable ductility—particularly in group #2 (upwind) specimens. However, under reduced gas flow conditions (MLD_60 µm), both strength and elongation drop significantly, as seen in the lowest UTS and YS values (~10%) across all groups. This reduction is attributed to the increased presence of process-induced defects such as lack-of-fusion and porosity, which act as stress concentrators and compromise mechanical integrity. The tensile properties of the specimens extracted from the multiple-laser component build showed considerably low UTS and YS because of the orientation in which the structures were aligned with respect to the baseplate (only one specimen was tested in this condition; therefore, no standard deviation values are provided). Overall, while multiple-laser build strategies offer potential for improved productivity, they require tighter process control—especially gas flow management—to achieve tensile properties comparable to those of single-laser built samples, especially when multiple lasers interact with each other in a relatively small scan area.

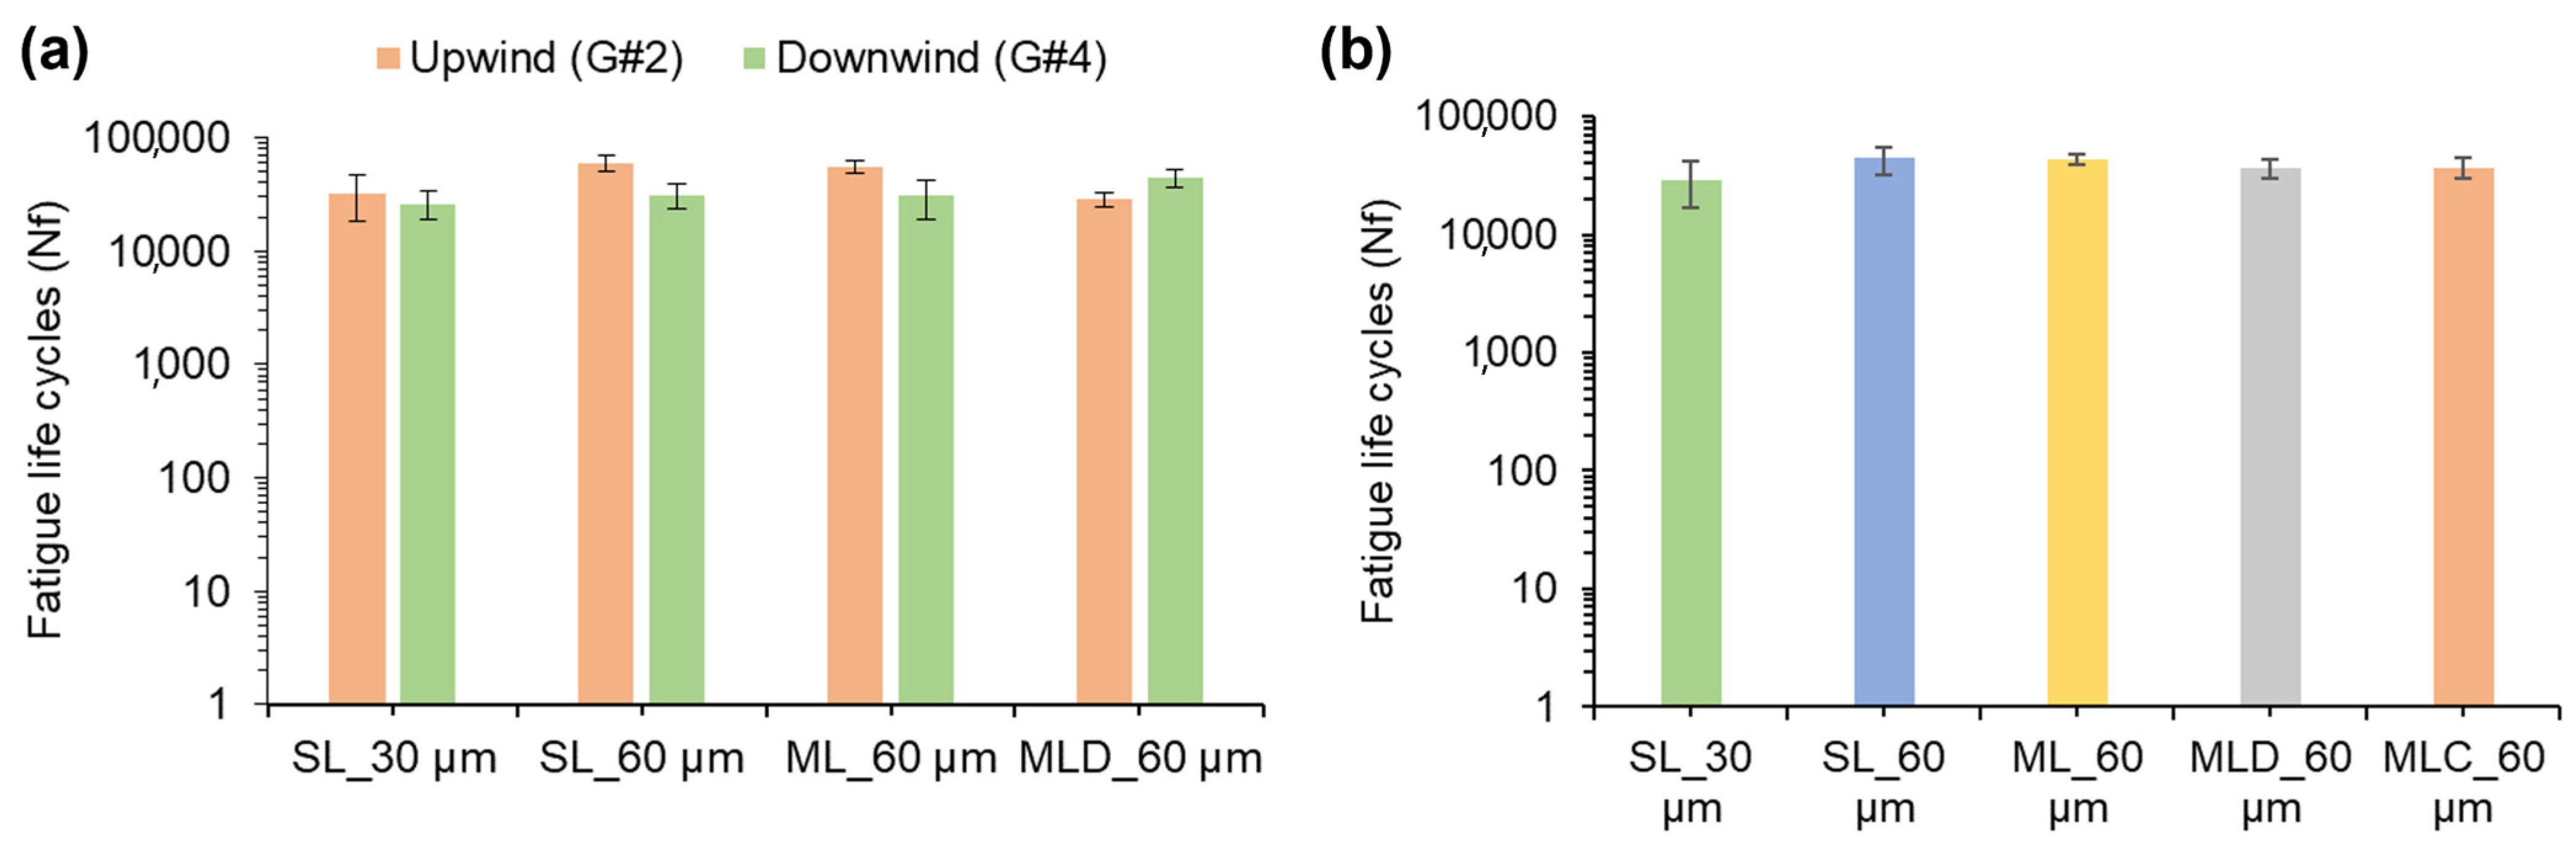
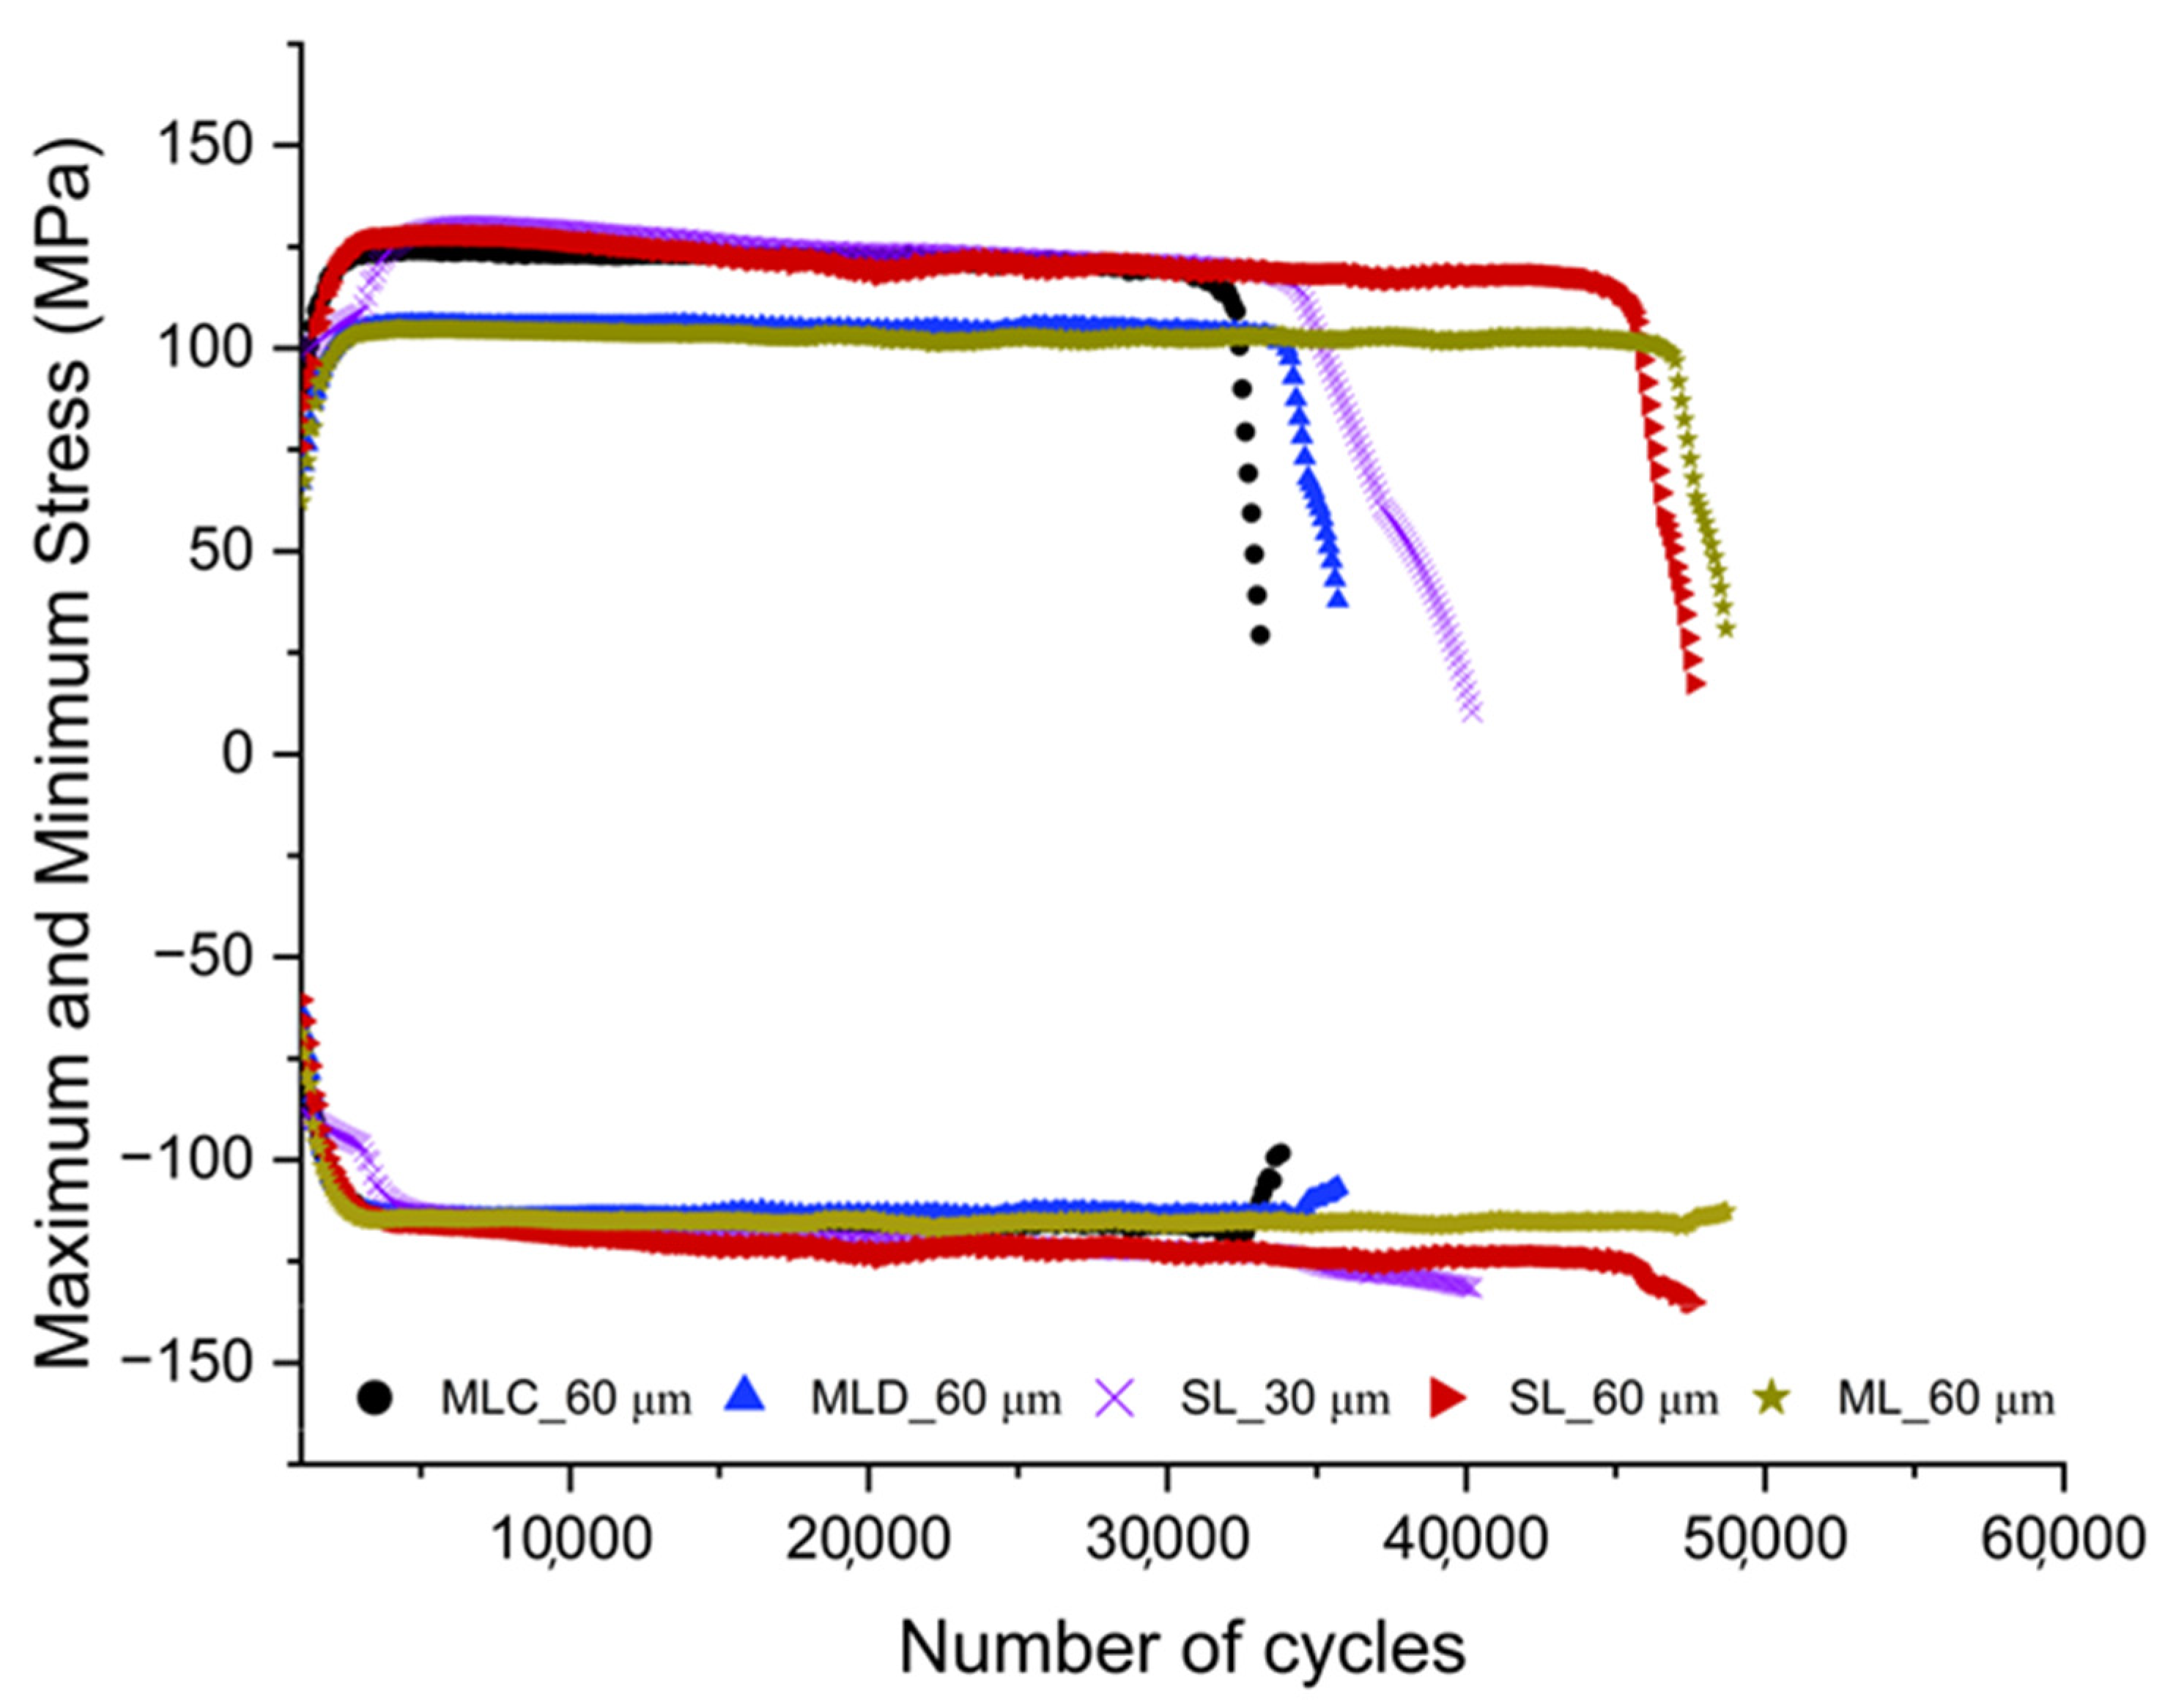
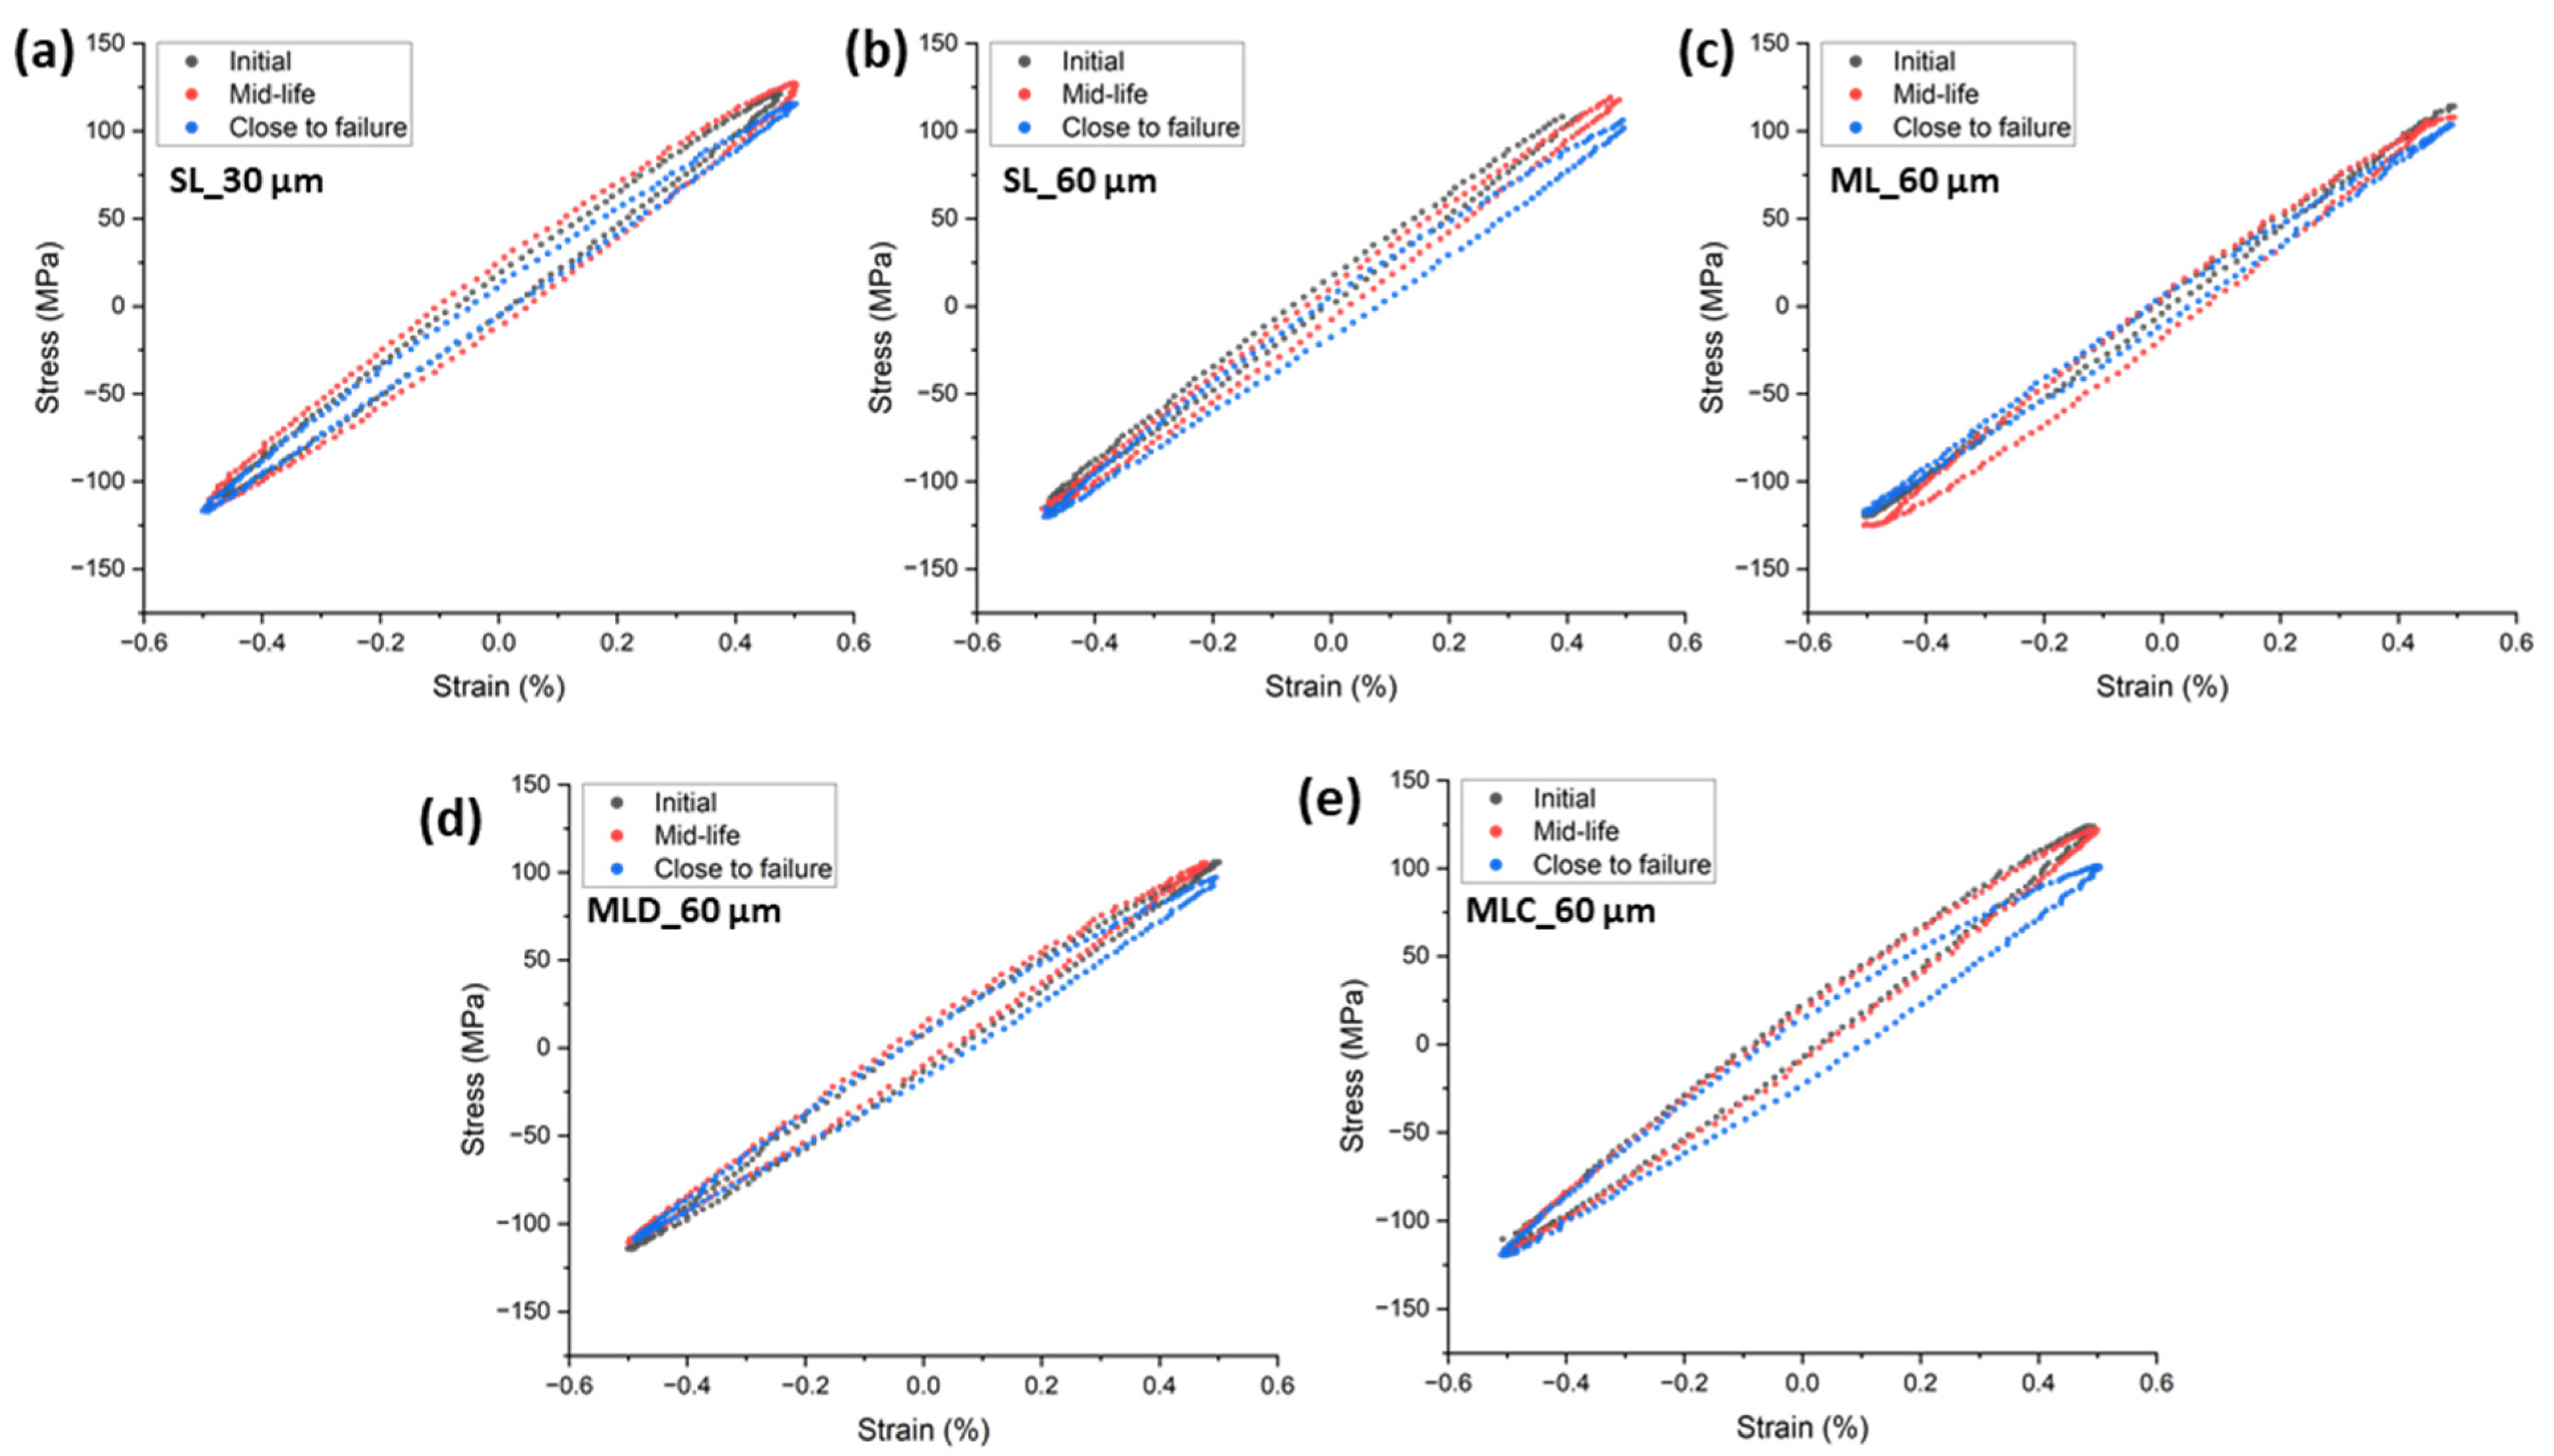
4.3.2. Fatigue Properties

The fatigue life results in Figure 14 indicate that build location (upwind vs. downwind) had marginal impact on fatigue performance, suggesting that gas flow direction influences cyclic behaviour under the test conditions for low-cycle strain-controlled fatigue. Single-laser builds at 30 µm layer thicknesses exhibit the lowest fatigue life of <20,000 cycles, while single- and multiple-laser builds at 60 µm show comparable fatigue life (~30,000 cycles), demonstrating that well-optimized multi-laser strategies can maintain fatigue performance. The reduction in fatigue cycles with 30 µm layer thickness could be potentially due to the increased number of layers leading to a higher number of stress concentration zones. Overall, in most cases, the upwind specimens had marginally higher average fatigue life cycles compared to downwind specimens. Next, the reduced gas flow in multiple-laser builds (MLD_60 µm) leads to a decline in average fatigue life (~15% lower) due to increased porosity and lack-of-fusion defects, which act as crack initiation sites. In this case, contrary to the other cases, the downwind specimens had higher fatigue life compared to upwind specimens (MLD_60 µm in Figure 14a). This reiterates that the decreased gas flow is insufficient to move the spatter particles from the upwind to the downwind zones. Due to this fact, the downwind specimens that experienced less/no spatter showed higher fatigue performance compared to the upwind specimens. On the other hand, when standard gas flow of 190 m3/h was maintained, multiple-laser components (MLC_60 µm) retained competitive fatigue performance, suggesting that careful process control can mitigate defect-related fatigue degradation.

5. Discussion

Table 4 summarizes the fatigue test results for AlSi10Mg specimens fabricated under five distinct build conditions. Each condition varies in either laser strategy, layer thickness, or process gas flow rate. The stress values represent the stabilized maximum and minimum stresses at half-life (Nf/2), derived from the hysteresis loops. Among the tested conditions, the SL_30 µm samples showed the highest maximum stress at half-life (127.2 ± 16.6 MPa) but the lowest average fatigue life (29,250 ± 12,630 cycles). The elevated stress could be due to finer microstructures or higher surface stress concentrations, which tend to accelerate crack initiation under cyclic loading. The SL_60 µm and ML_60 µm samples, both built at 60 µm layer thickness, demonstrated reduced stress amplitudes and improved fatigue lives (~44,000 cycles), suggesting that coarser layers combined with effective thermal management (especially in the multiple-laser case) may enhance fatigue resistance. The MLD_60 µm sample, produced with decreased gas flow, showed slightly reduced fatigue life (36,633 ± 7203 cycles), likely due to sub-optimal gas shielding or increased porosity, especially in the bottom regions of the build from which all tested specimens were extracted. Notably, the MLC_60 µm specimens fabricated as part of a component-level build were oriented 45° to the baseplate and showed relatively high tensile stress at half-life (123.9 ± 6.0 MPa) yet maintained a competitive fatigue life (36,933 ± 7250 cycles). The elevated stress may be attributed to orientation-induced anisotropy or loading effects on inclined microstructures. However, the 45° orientation could have distributed the applied strain more uniformly across the melt pool boundaries, potentially delaying the onset of localized plasticity or crack formation.
Figure 15 illustrates the evolution of maximum tensile and compressive stresses over the fatigue life of selected L-PBF AlSi10Mg specimens processed using single- and multiple-laser build strategies. A consistent trend across most specimens is that the tensile stress exhibits gradual degradation over life, while the compressive stress remains relatively stable. This asymmetry highlights the tension-dominated fatigue degradation mechanism in AlSi10Mg. The asymmetric behaviour is commonly reported in previous studies [29,30]. The microstructural defects and lack-of-fusion pores as presented in Figure 12 are inherent in L-PBF builds. These act as stress concentrators that are preferentially activated under tension, leading to progressive crack initiation and propagation. In contrast, compressive loading suppresses further crack opening or growth, thus preserving compressive load-carrying capacity over cycles.
Some specimens (MLC_60 µm and MLD_60 µm) showed early and sharp reductions in peak tensile stress, indicating a rapid damage accumulation possibly due to unfavourable melt track defects or larger inherent defect populations. On the other hand, specimens like ML_60 µm and SL_60 µm maintained higher tensile stresses until final cycles, demonstrating comparatively better fatigue resistance, potentially due to more uniform microstructures or fewer critical flaws.
Notably, in all specimens, the stress dropped significantly only in the final ~5–10% of life, corresponding with macrocrack growth and imminent failure. This sharp decline suggests that most of the fatigue life is spent in crack initiation and early propagation stages. The observed variations in tensile peak stress across build strategies are likely from differences in residual stress, defect populations, and microstructural anisotropy inherent to each build [31]. The consistent compressive stress response also highlights the insensitivity of compression-dominated fatigue behaviour to such defects, owing to crack closure mechanisms and the suppression of tensile-driven damage propagation.
The hysteresis loops at early, mid, and close to failure stages are plotted in Figure 16. These align with the corresponding peak tensile and compressive stress evolution plots shown in Figure 15 and Table 4. Similarly to previous studies on L-PBF AlSi10Mg, the first stable cycle was considered for the initial comparison [32]. Across all samples, a consistent asymmetry is observed between the tensile and compressive responses as fatigue progresses. Specifically, the upper (tensile) portion of the loops exhibits a gradual reduction in peak stress with increasing fatigue life, while the lower (compressive) portion remains relatively unchanged. These observations are similar to those in recent reports on low-cycle fatigue [33,34]. Furthermore, the observed reduction in hysteresis width at later life stages in some samples (SL_30 µm and ML_60 µm) suggests cyclic softening due to plastic deformation and strain localization. The cyclic softening behaviour noticed in the tensile region is a commonly reported phenomenon in low-cycle fatigue of L-PBF components and conventional aluminium alloys [35,36,37]. The variation across each condition also highlights the sensitivity of L-PBF AlSi10Mg to process parameters, influencing fatigue crack initiation resistance. Overall, the loop asymmetry and tensile-side degradation reflect the intrinsic fatigue response of AM AlSi10Mg alloys, governed by crack-sensitive microstructures, tension-favoured defect activation, and limited damage under compression. Collectively, the hysteresis and stress evolution data demonstrate that cyclic softening is a dominant fatigue mechanism, with degradation primarily occurring in the tensile regime.

6. Conclusions

This study provides a comprehensive evaluation of laser powder bed fused AlSi10Mg components manufactured under single- and multiple-laser configurations. The major findings from this study are as follows:
  • Multiple-laser builds with modified border parameters achieved a 34% reduction in surface roughness (Ra and Rz) compared to single-laser builds.
  • The density and microhardness of multiple-laser specimens showed a negligible difference (<10%) compared to single-laser builds.
  • Multiple-laser builds at 60 µm exhibited marginally lower (~3.5%) tensile properties compared to single-laser builds at 60 µm layer thickness. This was due to reduced porosity and better microstructural consistency in single-laser builds.
  • Multiple-laser builds with decreased gas flow exhibited up to 10% lower UTS and YS due to several lack-of-fusion and porosity defects. The findings indicate that multiple-laser strategies with improper gas flow management can lead to defect accumulation, negatively impacting mechanical properties. Microstructural examination confirmed these process-related issues under decreased gas flow conditions.
  • Interestingly, the fatigue performance of single- and multiple-laser built specimens and components was comparable (<15% differences) under the tested conditions, suggesting that well-controlled and optimized process parameters for multiple-laser builds can retain fatigue performance.
  • Average scan time per layer was 35.1 s for single-laser compared to 9.675 s for multiple-laser builds. This shows that multiple lasers significantly improve productivity while achieving comparable mechanical properties.
Overall, the study underscores the critical role of gas flow, laser stitching in beam overlap areas, and border optimization in minimizing defects and enhancing mechanical performance. Future work should focus on post-processing techniques to ensure the mechanical property reliability of multi-laser L-PBF manufacturing for high-performance applications.

Author Contributions

Conceptualization, E.Y. and J.H.; Methodology, A.P.N., A.H. and O.P.; Validation, E.B.T.; Formal analysis, A.P.N. and A.S.; Investigation, A.P.N. and E.B.T.; Writing—original draft, A.P.N., E.B.T. and E.Y.; Writing—review & editing, A.H., A.S., O.P., E.Y. and J.H.; Supervision, E.Y.; Funding acquisition, E.Y. and J.H. All authors have read and agreed to the published version of the manuscript.

Funding

This research was funded by AMRC Membership Funding under ABG-23-375 Multiple lasers for increased productivity (MULTIPRO) project.

Data Availability Statement

The original contributions presented in this study are included in the article. Further inquiries can be directed to the corresponding author.

Acknowledgments

The authors of the study would like to acknowledge the support of the Renishaw additive manufacturing team (Ben Collins, Ben Snell, and Ravi Aswathanarayanaswamy) for sharing their knowledge on using multiple lasers.

Conflicts of Interest

The authors declare no conflicts of interest.

References

  1. Nagalingam, A.P.; Shamir, M.; Tureyen, E.B.; Sharman, A.R.C.; Poyraz, O.; Yasa, E.; Hughes, J. Recent progress in wire-arc and wire-laser directed energy deposition (DED) of titanium and aluminium alloys. Int. J. Adv. Manuf. Technol. 2025, 136, 2035–2073. [Google Scholar] [CrossRef]
  2. Nagalingam, A.P.; Gopasetty, S.K.; Wang, J.; Yuvaraj, H.K.; Gopinath, A.; Yeo, S.H. Comparative fatigue analysis of wrought and laser powder bed fused Ti-6Al-4V for aerospace repairs: Academic and industrial insights. Int. J. Fatigue 2023, 176, 107879. [Google Scholar] [CrossRef]
  3. Poyraz, O.; Lou, S.; Molyneux, A.; Liu, Y.; Liu, W.; Yasa, E.; Hughes, J. Understanding the laser powder bed fusion surface quality for CP1 aluminum alloy. In Proceedings of the 2024 ASPE-EUSPEN Summer Topical Meeting: Advancing Precision in Additive Manufacturing, Golden, CO, USA, 15–19 July 2024; pp. 57–62. [Google Scholar]
  4. Nagalingam, A.; Poyraz, O.; Warren, J.; Shamir, M.; Yasa, E.; Hughes, J. In-Situ Melt Pool Monitoring to Optimize Laser Powder Bed Fusion of Scalmalloy®. In Proceedings of the 2024 International Solid Freeform Fabrication Symposium, Austin, TX, USA, 11–14 August 2024; pp. 1264–1274. [Google Scholar]
  5. Chowdhury, S.; Yadaiah, N.; Prakash, C.; Ramakrishna, S.; Dixit, S.; Gupta, L.R.; Buddhi, D. Laser powder bed fusion: A state-of-the-art review of the technology, materials, properties & defects, and numerical modelling. J. Mater. Res. Technol. 2022, 20, 2109–2172. [Google Scholar] [CrossRef]
  6. Nyamekye, P.; Lakshmanan, R.; Tepponen, V.; Westman, S. Sustainability aspects of additive manufacturing: Leveraging resource efficiency via product design optimization and laser powder bed fusion. Heliyon 2024, 10, e23152. [Google Scholar] [CrossRef] [PubMed]
  7. Wang, X.; Zhang, D.; Li, A.; Yi, D.; Li, T. A Review on Traditional Processes and Laser Powder Bed Fusion of Aluminum Alloy Microstructures, Mechanical Properties, Costs, and Applications. Materials 2024, 17, 2553. [Google Scholar] [CrossRef] [PubMed]
  8. Kumar Ramavajjala, A.; Dandekar, T.R.; Khatirkar, R.K.; Joshi, C.; Chouhan, R.N.; Agnihotri, A. A review on the correlation between microstructure, heat treatment and mechanical properties of additively manufactured AlSi10Mg by LPBF. Crit. Rev. Solid State Mater. Sci. 2024, 50, 239–274. [Google Scholar] [CrossRef]
  9. Gong, J.; Wei, K.; Liu, M.; Song, W.; Li, X.; Zeng, X. Microstructure and mechanical properties of AlSi10Mg alloy built by laser powder bed fusion/direct energy deposition hybrid laser additive manufacturing. Addit. Manuf. 2022, 59, 103160. [Google Scholar] [CrossRef]
  10. Schwerz, C.; Schulz, F.; Natesan, E.; Nyborg, L. Increasing productivity of laser powder bed fusion manufactured Hastelloy X through modification of process parameters. J. Manuf. Process. 2022, 78, 231–241. [Google Scholar] [CrossRef]
  11. Khaimovich, A.; Balyakin, A.; Oleynik, M.; Meshkov, A.; Smelov, V. Optimization of Process Parameters for Powder Bed Fusion Additive Manufacturing Using a Linear Programming Method: A Conceptual Framework. Metals 2022, 12, 1976. [Google Scholar] [CrossRef]
  12. McConnell, S.; Tanner, D.; Kourousis, K.I. Productivity improvement opportunities for metal powder bed fusion technologies: A systematic literature review. Rapid Prototyp. J. 2024, 30, 231–246. [Google Scholar] [CrossRef]
  13. He, C.; Ramani, K.S.; Okwudire, C.E. An intelligent scanning strategy (SmartScan) for improved part quality in multi-laser PBF additive manufacturing. Addit. Manuf. 2023, 64, 103427. [Google Scholar] [CrossRef]
  14. Raut, R.; Ball, A.K.; Basak, A. Temperature distribution prediction in laser powder bed fusion using transferable and scalable graph neural networks. arXiv 2024, arXiv:2407.13838. [Google Scholar]
  15. Yin, J.; Wang, D.; Wei, H.; Yang, L.; Ke, L.; Hu, M.; Xiong, W.; Wang, G.; Zhu, H.; Zeng, X. Dual-beam laser-matter interaction at overlap region during multi-laser powder bed fusion manufacturing. Addit. Manuf. 2021, 46, 102178. [Google Scholar] [CrossRef]
  16. Zhang, C.; Zhu, H.; Hu, Z.; Zhang, L.; Zeng, X. A comparative study on single-laser and multi-laser selective laser melting AlSi10Mg: Defects, microstructure and mechanical properties. Mater. Sci. Eng. A 2019, 746, 416–423. [Google Scholar] [CrossRef]
  17. Cerri, E.; Ghio, E.; Bolelli, G. Effect of the Distance from Build Platform and Post-Heat Treatment of AlSi10Mg Alloy Manufactured by Single- and Multi-Laser Selective Laser Melting. J. Mater. Eng. Perform. 2021, 30, 4981–4992. [Google Scholar] [CrossRef]
  18. Xie, Y.; Teng, Q.; Muyu, S.; Zhang, Z.; Wei, Y.; Cai, C.; Wei, Q. The role of overlap region width in multi-laser powder bed fusion of Hastelloy X superalloy. Virtual Phys. Prototyp. 2022, 18, e2142802. [Google Scholar] [CrossRef]
  19. Jiang, Z.; Sun, J.; Berto, F.; Wang, X.; Qian, G. Fatigue and Fracture Behavior of AlSi10Mg Manufactured by Selective Laser Melting: A Review. Phys. Mesomech. 2023, 26, 367–390. [Google Scholar] [CrossRef]
  20. Hamidi Nasab, M.; Giussani, A.; Gastaldi, D.; Tirelli, V.; Vedani, M. Effect of Surface and Subsurface Defects on Fatigue Behavior of AlSi10Mg Alloy Processed by Laser Powder Bed Fusion (L-PBF). Metals 2019, 9, 1063. [Google Scholar] [CrossRef]
  21. Ch, S.R.; Raja, A.; Jayaganthan, R.; Vasa, N.J.; Raghunandan, M. Study on the fatigue behaviour of selective laser melted AlSi10Mg alloy. Mater. Sci. Eng. A 2020, 781, 139180. [Google Scholar] [CrossRef]
  22. Wu, Z.; Wu, S.; Bao, J.; Qian, W.; Karabal, S.; Sun, W.; Withers, P.J. The effect of defect population on the anisotropic fatigue resistance of AlSi10Mg alloy fabricated by laser powder bed fusion. Int. J. Fatigue 2021, 151. [Google Scholar] [CrossRef]
  23. Wei, K.; Li, F.; Huang, G.; Liu, M.; Deng, J.; He, C.; Zeng, X. Multi-laser powder bed fusion of Ti–6Al–4V alloy: Defect, microstructure, and mechanical property of overlap region. Mater. Sci. Eng. A 2021, 802, 140644. [Google Scholar] [CrossRef]
  24. Sanchez, S.; Hyde, C.J.; Ashcroft, I.A.; G.A., R.; Clare, A.T. Multi-laser scan strategies for enhancing creep performance in LPBF. Addit. Manuf. 2021, 41, 101948. [Google Scholar] [CrossRef]
  25. Advanced, User-Centric, Multi-Laser Stitching Strategies. 2023. Available online: https://www.linkedin.com/pulse/get-facts-multi-laser-stitching-validation-performance-geadditive/ (accessed on 15 July 2025).
  26. ISO 21920-3:2021; Geometrical Product Specifications (GPS)—Surface Texture: Profile—Part 3: Specification Operators. European Committee for Standardization: Brussels, Belgium, 2021.
  27. ASTM E8/E8M-11; Standard Test Methods for Tension Testing of Metallic Materials. ASTM International: West Conshohocken, PA, USA, 2011.
  28. ASTM E606-92; Standard Practice for Strain—Controlled Fatigue Testing. ASTM International: West Conshohocken, PA, USA, 2004.
  29. Chen, L.; Wang, C.; Wu, W.; Liu, Z.; Stoica, G.M.; Wu, L.; Liaw, P.K. Low-Cycle Fatigue Behavior of an As-Extruded AM50 Magnesium Alloy. Metall. Mater. Trans. A 2007, 38, 2235–2241. [Google Scholar] [CrossRef]
  30. Petráš, R.; Škorík, V.; Polák, J. Thermomechanical fatigue and damage mechanisms in Sanicro 25 steel. Mater. Sci. Eng. A 2016, 650, 52–62. [Google Scholar] [CrossRef]
  31. Strauß, L.; Löwisch, G. Effect of Residual Stress, Surface Roughness, and Porosity on Fatigue Life of PBF-LB AlSi10Mg. In Lectures Notes on Advanced Structured Materials 2; Altenbach, H., Hitzler, L., Johlitz, M., Merkel, M., Öchsner, A., Eds.; Springer Nature: Cham, Switzerland, 2024; pp. 275–290. [Google Scholar]
  32. Baig, S.; Ghiaasiaan, R.; Shao, S.; Shamsaei, N. Tensile and fatigue behaviors of additively manufactured AlSi10Mg: Effect of solutionizing and aging heat treatments. Fatigue Fract. Eng. Mater. Struct. 2023, 46, 2662–2680. [Google Scholar] [CrossRef]
  33. Georgantzia, E.; Vardanega, P.J.; Kashani, M.M. Modelling low-cycle fatigue behaviour of structural aluminium alloys. Bull. Earthq. Eng. 2025, 23, 1737–1758. [Google Scholar] [CrossRef]
  34. Douglas, R.; Beard, W.; Barnard, N.; Lee, S.; Shao, S.; Shamsaei, N.; Jones, T.; Lancaster, R. The influence of energy density on the low cycle fatigue behaviour of laser powder bed fused stainless steel 316L. Int. J. Fatigue 2024, 181, 108123. [Google Scholar] [CrossRef]
  35. Xi, J.; Hu, Y.; Xing, H.; Han, Y.; Zhang, H.; Jiang, J.; Nikbin, K. The Low-Cycle Fatigue Behavior, Failure Mechanism and Prediction of SLM Ti-6Al-4V Alloy with Different Heat Treatment Methods. Materials 2021, 14. [Google Scholar] [CrossRef] [PubMed]
  36. Bai, Y.; Gong, Q.; Zhou, X.; Babacan, N.; Guan, S. Low-cycle fatigue testing and microstructure of high strength-ductility structural steel materials. Low-Carbon Mater. Green Constr. 2024, 2, 1. [Google Scholar] [CrossRef]
  37. Badaruddin, M.; Zulhanif; Supriadi, H. Low Cycle Fatigue Properties of Extruded 6061-T6 Aluminum Alloy. J. Phys. Conf. Ser. 2019, 1198, 032002. [Google Scholar] [CrossRef]
Figure 1. AlSi10Mg powders used in the study. (a) Surface morphology of virgin powder and (b) particle size distribution of the powders.
Metals 15 00807 g001
Figure 2. Specimens manufactured using powder bed fusion. (a) Top view of the baseplate showing the gas flow, recoating direction and specimen groups, (b) front view of the specimens showing the locations of top and bottom specimens, (c) actual specimens after printing, and (d) isometric view of the single- and multiple-laser built specimens.
Metals 15 00807 g002
Figure 3. Specimens manufactured using powder bed fusion. (a) A bracket geometry illustrating the location of tensile and fatigue specimen extraction, (b) side view of the multiple-laser built component with build direction and support structures, (c) isometric view of the multiple-laser built component and location of specimen extraction.
Metals 15 00807 g003
Figure 4. Laser allocation strategy. (a) Single laser allocated to all the specimens, (b) single laser stripe-scan strategy with two borders, (c) multiple lasers allocated to each specimen, and (d) multiple-laser stripe scan strategy with three borders and laser overlap of 150 µm.
Metals 15 00807 g004
Figure 5. Locations of density, microhardness, and microstructure analyses.
Metals 15 00807 g005
Figure 6. Location of characterization tests. (a) Profile and areal surface texture measurement locations in as-built specimen, (b) tensile and (c) fatigue specimen dimensions with locations of surface texture measurements. (All dimensions are in mm).
Metals 15 00807 g006
Figure 7. Surface texture of (a) as-built 90°, (b) as-built 45°, (c) machined, (d) surface undulations after machining, (e) grinding, and (f) unidirectional axial surface lay on fatigue specimens.
Metals 15 00807 g007
Figure 8. Surface roughness values from single- and multiple-laser build conditions. (a) Arithmetic mean height, (b) maximum height (values for upwind and downwind specimens are plotted separately), (c) arithmetic mean height, and (d) maximum height comparison of single- and multiple-laser built specimens. (The error bars represent the standard deviation of the upwind and downwind specimens).
Metals 15 00807 g008
Figure 9. Surface topography analysis of (a) SL_30 µm, (b) SL_60 µm, (c) ML_60 µm, (d) MLD_60 µm, (e) MLC_60 µm, (f) tensile specimen surface after machining, and (g) fatigue specimen surface after grinding.
Metals 15 00807 g009
Figure 10. Archimedes density comparison of (a) upwind and downwind specimens (error bars represent the standard deviation in the measurements), (b) single- and multiple-laser builds (error bars represent standard error of upwind and downwind specimens), (c) lack of fusion, (d) gas porosity, and (e) un-sintered powder defects observed under optical analysis.
Metals 15 00807 g010
Figure 11. Vickers microhardness comparison of (a) upwind and downwind specimens (error bars represent the standard deviation in the measurements), (b) single- vs. multiple-laser builds (errors bars represent standard error of upwind and downwind specimens), (c,d) hardness indentations within the fine grain zone, and (e,f) hardness indentation on the grain boundaries.
Metals 15 00807 g011
Figure 12. Microstructure of (a,b) single-laser_30 µm, (c,d) single-laser_60 µm, (e,f) multiple-laser_60 µm, (g,h) multiple-laser_60 µm decreased gas flow, (i,j) multiple-laser built component_60 µm.
Metals 15 00807 g012
Figure 13. Tensile properties of the single- and multiple-laser specimens. (a) Ultimate tensile strength, (b) yield strength, (c) elongation results of upwind and downwind specimens (only bottom specimen was tensile tested in MLD_60 µm condition, hence no standard deviation), and (d) tensile property comparison of single- vs. multiple-laser build condition (errors bars represent standard error of upwind and downwind specimens). There are no upwind and downwind specimens in the MLC_60 µm condition, hence no error bars.
Metals 15 00807 g013
Figure 14. Fatigue properties of single- and multiple-laser specimens. (a) Fatigue life cycle comparison of upwind and downwind specimens (error bars represent the standard error of multiple specimens tested in each condition) and (b) fatigue property comparison of single- vs. multiple-laser built configurations (error bars represent the standard error of combined upwind and downwind specimens).
Metals 15 00807 g014
Figure 15. Evolution of peak tensile and compressive stresses during strain-controlled fatigue testing for various test conditions.
Metals 15 00807 g015
Figure 16. Hysteresis loops for selected L-PBF AlSi10Mg samples at initial (black), mid-life (red), and close to failure (blue) fatigue cycles. (a) SL_30 µm, (b) SL_60 µm, (c) ML_60 µm, (d) MLD_60 µm, and (e) MLC_60 µm.
Metals 15 00807 g016
Table 1. AlSi10Mg alloy composition.
ElementSnPbCuNiMnZnTiFeMgSiAl
Mass (%)<0.02<0.02<0.05<0.05<0.10<0.10<0.15<0.250.2–0.49–11Bal
Table 2. Build variation and specimen nomenclature.
S No.Specimen
Nomenclature
Build ConditionsNo. of Specimens Tensile TestedNo. of Specimens Fatigue Tested
1SL_30 µmSingle-laser (SL), 30 µm layer thickness, 190 m3/h gas flow.Total: 4 (Top and bottom specimens machined from cylindrical rods 2-4 and 4-4 in Figure 2)Total: 12 (Top and bottom specimens machined from six cylindrical rods 2-1,2,3 and 4-1,2,3 in Figure 2)
2SL_60 µmSingle-laser (SL), 60 µm layer thickness, 190 m3/h gas flow.Total: 4 (Top and bottom specimens machined from cylindrical rods 2-4 and 4-4 in Figure 2)Total: 12 (Top and bottom specimens machined from six cylindrical rods 2-1,2,3 and 4-1,2,3 in Figure 2)
3ML_60 µmMultiple laser (ML), 60 µm layer thickness, 190 m3/h gas flow.Total: 4 (Top and bottom specimens machined from cylindrical rods 2-4 and 4-4 in Figure 2)Total: 12 (Top and bottom specimens machined from six cylindrical rods 2-1,2,3 and 4-1,2,3 in Figure 2)
4MLD_60 µmMultiple laser decreased gas flow (MLD), 60 µm layer thickness, 150 m3/h gas flow. (NOTE: build height was restricted to 120 mm. Hence, only bottom specimens are tested.)Total: 2 (Bottom specimens machined from cylindrical rods 2-4 and 4-4 in Figure 2)Total: 6 (Bottom specimens machined from six cylindrical rods 2-1,2,3 and 4-1,2,3 in Figure 2)
5MLC_60 µmMultiple laser component (MLC), 60 µm layer thickness, 190 m3/h gas flow.Total: 1 (Specimen machined from location a in Figure 3)Total: 3 (Specimen machined from locations b, c, and d in Figure 3)
Table 3. Laser scan parameters and strategy.
S No.Build
Configuration
Layer Thickness (µm)Power (W)Hatch Overlap (µm)No. of Borders Point Delay (µs)Stitching Overlap of Lasers (µm)
1Single laser30350301500N/A
2Single laser605001202N/AN/A
3Multiple laser (Quad)605001203N/A150
Table 4. Maximum and minimum stress, number of cycles to failure in fatigue tests.
S No.Specimen
Nomenclature
Build ConditionMaximum Stress at Half-Life (Nf/2) (MPa)Minimum Stress at Half-Life (Nf/2)
(MPa)
Average Number of Cycles to Failure in Each Tested Condition (Nf)
1SL_30 µmSingle-laser (SL), 30 µm layer thickness, 190 m3/h gas flow.127.2 ± 16.6−111.7 ± 12.329,250 ± 12,630
2SL_60 µmSingle-laser (SL), 60 µm layer thickness, 190 m3/h gas flow.119.1 ± 11.3−116.6 ± 8.544,045 ± 11,539
3ML_60 µmMultiple-laser (ML), 60 µm layer thickness, 190 m3/h gas flow.106.03 ± 24.7−119.5 ± 10.343,620 ± 5058
4MLD_60 µmMultiple-laser decreased gas flow (MLD), 60 µm layer thickness, 150 m3/h gas flow. (NOTE: Build height was restricted to 120 mm. Hence, only bottom specimens are tested.)105.23 ± 20.0−110.6 ± 9.436,633 ± 7203
5MLC_60 µmMultiple-laser component (MLC), 60 µm layer thickness, 190 m3/h gas flow.123.89 ± 6.0−113.0 ± 8.536,933 ± 7250
Disclaimer/Publisher’s Note: The statements, opinions and data contained in all publications are solely those of the individual author(s) and contributor(s) and not of MDPI and/or the editor(s). MDPI and/or the editor(s) disclaim responsibility for any injury to people or property resulting from any ideas, methods, instructions or products referred to in the content.

