Article

Fracture Initiation in Aluminum Alloys Under Multiaxial Loading at Various Low Strain Rates

1
Department of Mechanical Engineering, Şırnak University, Şırnak 73000, Türkiye
2
Institute of Mechanics and Mechatronics, Vienna University of Technology, 1060 Vienna, Austria
*
Author to whom correspondence should be addressed.
Metals 2025, 15(7), 785; https://doi.org/10.3390/met15070785
Submission received: 9 May 2025 / Revised: 2 July 2025 / Accepted: 8 July 2025 / Published: 11 July 2025

Abstract

The initiation of ductile fractures in medium-strength AW5754 and high-strength AW6082 aluminum alloys at different quasi-static strain rates and under multiaxial stress states was investigated through a series of tensile tests using various specimen geometries. The sensitivity of the stress triaxiality locus to variations in the loading rate was examined for these two aluminum alloy families. Fractographic and elemental analyses were also conducted via SEM and EDS. Numerical simulations based on the finite element method (FEM) were performed using ABAQUS/Standard to determine the actual stress triaxialities and the equivalent plastic strains at fracture. The numerical approach was validated by comparing the simulation results with the experimental findings. These simulations facilitated the generation of a stress triaxiality locus through a curve-fitting process. Among the considered fitting functions, an exponential function was selected as it provided the most accurate relation between the equivalent plastic strain at fracture and the corresponding stress state across different strain rates. The results reveal different strain rate dependencies for the two alloys within a very low strain rate range. The resulting stress triaxiality loci provide a valuable tool for predicting fracture strains and for more accurately evaluating stress states. Overall, the findings of this study significantly advance the understanding of the fracture initiation behavior of aluminum alloys under multiaxial loading conditions and their sensitivity to various quasi-static loading rates.

1. Introduction

Estimating the initiation of a fracture within engineering structures that are subjected to complex multiaxial loading conditions is crucial for designers and engineers [1,2]. The mathematical models developed for these purposes should be simulated using accurate material properties. The determination of relevant material properties and the observation of ductile fracture behavior are typically conducted using standard tensile tests, which are the most commonly employed classic engineering experiments.
While determining uniaxial fracture strain through standard tensile tests using simple specimens is relatively straightforward, predicting multiaxial fracture behavior based on these tests presents considerable challenges [3,4]. This complexity arises due to the intricate interactions between multiple stress components, material heterogeneity, and the varying deformation mechanisms under multiaxial loading conditions [5]. Additionally, the sensitivity and high cost of the experiments, the selection of appropriate specimen geometries, and especially the post-processing of results further increase the complexity of such problems [6]. However, solving this issue is of critical importance for accurately determining the fracture behavior of structures operating under multiaxial loading conditions, particularly when considering the effect of strain rates.
The influence of the strain rate on the fracture behavior of engineering structures is also a critical topic that researchers must consider [7]. Numerous studies have investigated the significant effects of varying strain rates on fracture behavior, particularly when comparing very high and very low strain rates (e.g., [8,9,10,11,12,13]). Notably, even slight variations at very low loading rates can lead to pronounced differences in certain materials. In this context, the need to understand how the multiaxial fracture behavior of aluminum alloys changes with slight variations in the loading rate, particularly at very low strain rates, constitutes the primary motivation for this study.
The fracture strain obtained from standard tensile test specimens at a given loading rate may not accurately reflect the behavior under multiaxial loading conditions [14]. Therefore, establishing a stress triaxiality locus [15] is crucial to provide comprehensive insights into fracture strain as a function of the material’s multiaxial stress state. To construct this locus, fracture points corresponding to different specimen geometries and loading conditions are identified, and fitting curves are derived through these points. De-pending on the specific case, the fracture points are typically determined from uniaxial or biaxial tensile or compressive test measurements [16,17].
To obtain a comprehensive triaxiality locus, experiments covering a range of stress states [15] at a constant strain rate are required. However, conducting tests for all data points within the locus can be an expensive process. Therefore, the existing literature suggests performing a minimum of four tests—such as uniaxial tension, pure shear, combined shear–tension, and notched specimens—and fitting the results to derive the locus curve [18].
Several researchers have investigated the application of stress-triaxiality-based approaches to steel materials. For example, in [16], a damage model was specifically developed and applied to steel, highlighting the critical role of stress triaxiality in capturing failure behavior. Similarly, ref. [19] explored the influence of triaxiality in the context of a panel simulation using structural steel S235JR. Although the study was limited to a constant strain rate, it emphasized the relevance of incorporating triaxiality into damage evaluations. In [20], a newly developed plasticity and failure model was validated across various materials, including 4340 steel and Q235, demonstrating the versatility of triaxiality-based formulations in characterizing fracture behavior in steels.
Cast aluminum alloys present additional complexities due to their microstructural heterogeneity and porosity. The study in [21] examined the influence of production methods—specifically sand mold versus metal mold casting—on the stress triaxiality locus of cast aluminum alloys. Further refinement of the fracture models for cast aluminum was carried out in [22], which calibrated the fracture locus of AlSi10 alloy under different loading conditions. Additionally, ref. [23] analyzed stress triaxiality in AC4CH-T6 cast aluminum alloy at constant strain rate conditions, providing critical data for modeling fracture initiation in industrial cast components.
In aluminum alloys, the stress triaxiality–fracture strain relationship has been explored through both experimental and numerical approaches. A comprehensive study in [15] focused on 2024-T351 aluminum alloy, presenting both compressive and tensile parts of the triaxiality locus. The study also introduced a novel specimen configuration for pure shear testing and utilized finite element models to support the experimental findings. Furthermore, Peng et al. [24] investigated the effect of the strain rate on the fracture behavior in 6005 aluminum alloy, particularly in the low-stress triaxiality regime, revealing notable strain rate sensitivity even under quasi-static conditions. The plasticity and fracture model proposed in [20] was also applied to other wrought aluminum alloys such as 6061-T6 and 2024-T351, enabling a broad comparison of the deformation and failure characteristics across materials. Arslan and Haskul analyzed the stress triaxiality of AW5754 aluminum alloy through quasi-static tensile tests without considering variations in the strain rate [25]. Hong et al. [26] investigated the deformation and fracture behavior of 6061 aluminum alloy under varying stress triaxialities and examined the fracture mechanisms of tensile specimens. The influence of various stress states on the forming process and the strength of clinch–rivet joints made from AW5754 and AW6082 was studied in [27]. Ductile damage prediction for aluminum during cold forming was evaluated and compared with different damage models in [28]. The stress–strain behaviors of 6xxx and 7xxx series aluminum alloys were examined over a broad strain rate range in [29], where no significant rate sensitivity was observed in the 6xxx alloys, while moderate rate sensitivity was found in the 7xxx alloys. The mechanical properties of 6082 and 7108 aluminum alloys at high strain rates were analyzed in [8], showing precipitation hardening and low strain rate sensitivity. Further studies on the effect of the stress state on the plastic behavior and ductile fracture of aluminum 5083 alloy were presented in [30], while the mechanical behavior of two variants of 5754 was examined using modified shear tests in [31]. The dynamic and fracture behavior of 6005 aluminum alloy under various stress rates and states was investigated in [24]. A new dual-stage loading test method was developed to determine the forming limits at the fracture points in the nonlinear deformation paths of aluminum alloy 6K21-T4 sheets [32]. In [33], a model that includes the sensitivity of ductile failure to stress triaxiality and the Lode angle was developed, taking into account the anisotropy effects. Lee et al. [34] investigated the plastic deformation and ductile damage behavior of aluminum alloy 2024 experimentally and numerically. In the study, the plastic deformation characterization of the material was performed by uniaxial tension and balanced biaxial compression tests, and the ductile fracture behavior was analyzed by using notched plane tension and plane shear tests. A comprehensive review of the emergence of stress triaxiality and Lode angle in the context of solid and damage mechanics is presented [35]. The plastic deformation and ductile damage behavior of aluminum alloy 2024 were investigated using micromechanics-based models [36]. To benchmark and calibrate the fracture models, Muñoz et al. [37] performed a systematic evaluation of seven uncoupled ductile fracture models using a wide experimental dataset and highlighted the importance of covering a broad range of stress triaxiality and Lode parameters during the calibration. While their focus was on model comparison using 2024-T351 aluminum and DP600 steel, the methodological insights on calibration strategy and test diversity are also relevant for the present study. The sensitivity of Al6082-T6 aluminum alloy to factors like strain rate, heat treatment, and notch profiles is explored in [38], with the findings showing increased yield stress and tensile strength at higher strain rates. In this study, the effects of the strain rate on the tensile properties of aluminum alloys were systematically investigated. The experiments were conducted at strain rates of 0.0001, 0.001, 0.01, and 0.1 s−1 for different specimen geometries, and several important findings were obtained. However, further investigation is still needed because even small variations within the very low strain rate range (around 10−4s−1) can significantly affect the stress triaxiality behavior and fracture characteristics. A more focused examination of this narrow range could reveal additional sensitivities that are not yet fully understood and clarified. Moreover, capturing these effects would improve the accuracy of the stress triaxiality–fracture strain locus and provide more detailed input for the calibration of damage models, particularly under the quasi-static conditions relevant for industrial simulations.
While the effects of strain rate on ductile damage evolution have been widely studied, the existing research predominantly compares high and low strain rates, often overlooking the quasi-static regime under multiaxial stress states. However, in many industrial applications, it is essential to define the equivalent plastic strain at fracture as a function of stress triaxiality and strain rate, even under nominally static conditions. Commercial finite element (FE) software often requires this input for accurate damage initiation predictions. Yet, a significant data gap remains for many materials at very low strain rates, making it difficult to calibrate damage initiation models reliably. In particular, understanding how the equivalent plastic strain at fracture varies with the strain rate for a given stress triaxiality factor is crucial for defining a more accurate and reliable material input for FE-based damage modeling. This study addresses this critical gap by systematically investigating the sensitivity of medium-strength AW5754 and high-strength AW6082 aluminum alloys—commonly used in vehicle components—to subtle variations in the quasi-static loading rate. The findings provide essential data for modeling ductile fracture initiation under near-static conditions and contribute to the development of more robust and realistic damage models for industrial applications.
In this study, particular attention is given to strain rates of 2 × 10⁻⁴ s−1 and 4 × 10⁻⁴ s−1. While the range between these values may seem narrow, such quasi-static loading conditions are commonly encountered in metal forming, joining processes, cyclic fatigue analysis, and long-duration reliability assessments (e.g., slow creep or static overload scenarios). In these applications, even small variations in the strain rate can influence the equivalent plastic strain at fracture, thereby impacting the failure predictions and the overall component performance. From a theoretical perspective, investigating this sensitivity supports the development of a more accurate stress triaxiality–fracture strain locus, which is essential for calibrating ductile damage models in finite element simulations. Practically, this knowledge enhances the predictive reliability of crash simulations, sheet metal forming operations, and lifetime assessments for components subjected to low but non-negligible loading rates.
The primary focus of the current study is on generating the triaxiality locus and examining the effect of the strain rate on the onset of fracture. Specifically, this study targets low strain rates, particularly within the quasi-static loading range, and focuses exclusively on the tensile region of the triaxiality locus. The study aims to explore the sensitivity of the stress triaxiality locus to variations in the loading rate for these two types of aluminum alloy. A similar strategy was adopted by Lee et al. [39], who used AI-assisted simulations to assess the processability of Co–Cr–Mo lattices, even though their focus was on additively manufactured structures.
To achieve the objectives of this study, uniaxial tensile tests at two distinct strain rates are performed using five different types of test specimens with varying geometries. The experimental data obtained are used to identify the initial fracture locations, establish correlations with the corresponding loads, and validate the finite element (FE) simulation results. Based on these test results, FE models are developed to determine data points for fracture strain and the stress triaxiality factor [40]. Subsequently, these data points are used in a curve-fitting process to generate stress triaxiality loci for the materials.

2. Stress Triaxiality Locus

The primary objective of establishing a stress triaxiality locus in this study is to quantify the relationship between the stress state and fracture strain for the investigated aluminum alloys under quasi-static loading conditions. This locus enables the identification of how the fracture strain varies with triaxiality, which is essential for calibrating and improving damage initiation models in finite element simulations. It provides valuable input data for predicting material failure more accurately in industrial applications such as forming, crashworthiness, and durability analysis.
The triaxiality locus provides detailed insights into how the initiation of a material’s fracture changes under different stress conditions. This locus, which graphically correlates the equivalent plastic strain to fracture with the stress triaxiality factor, is a valuable tool for understanding material fracture behavior across a wide range of stress states [41]. The stress triaxiality factor (η) is defined as [18]
η = σ m σ e q . ,
where σ m and σ e q denote the mean and von Mises equivalent stresses, respectively, and are given by
σ m = σ 1 + σ 2 + σ 3 3 ,
σ e q = σ 1 σ 2 2 + σ 2 σ 3 2 + σ 3 σ 1 2 2 ,
where σ 1 σ 3 are the principal stresses. On the other hand, the equivalent plastic strain to fracture for the corresponding stress triaxiality factor can be determined through experimental results and the use of the developed FE modeling.
A sample of the stress fracture locus is given in Figure 1. The figure illustrates different regions on the locus, each corresponding to a unique stress state. Within these regions, the fracture points for various specimen geometries and loading conditions are identified, and curves are fitted through these points. The fracture points are determined based on uniaxial or biaxial tensile or compressive test measurements specific to each case.

3. Experiment and Simulation Methods
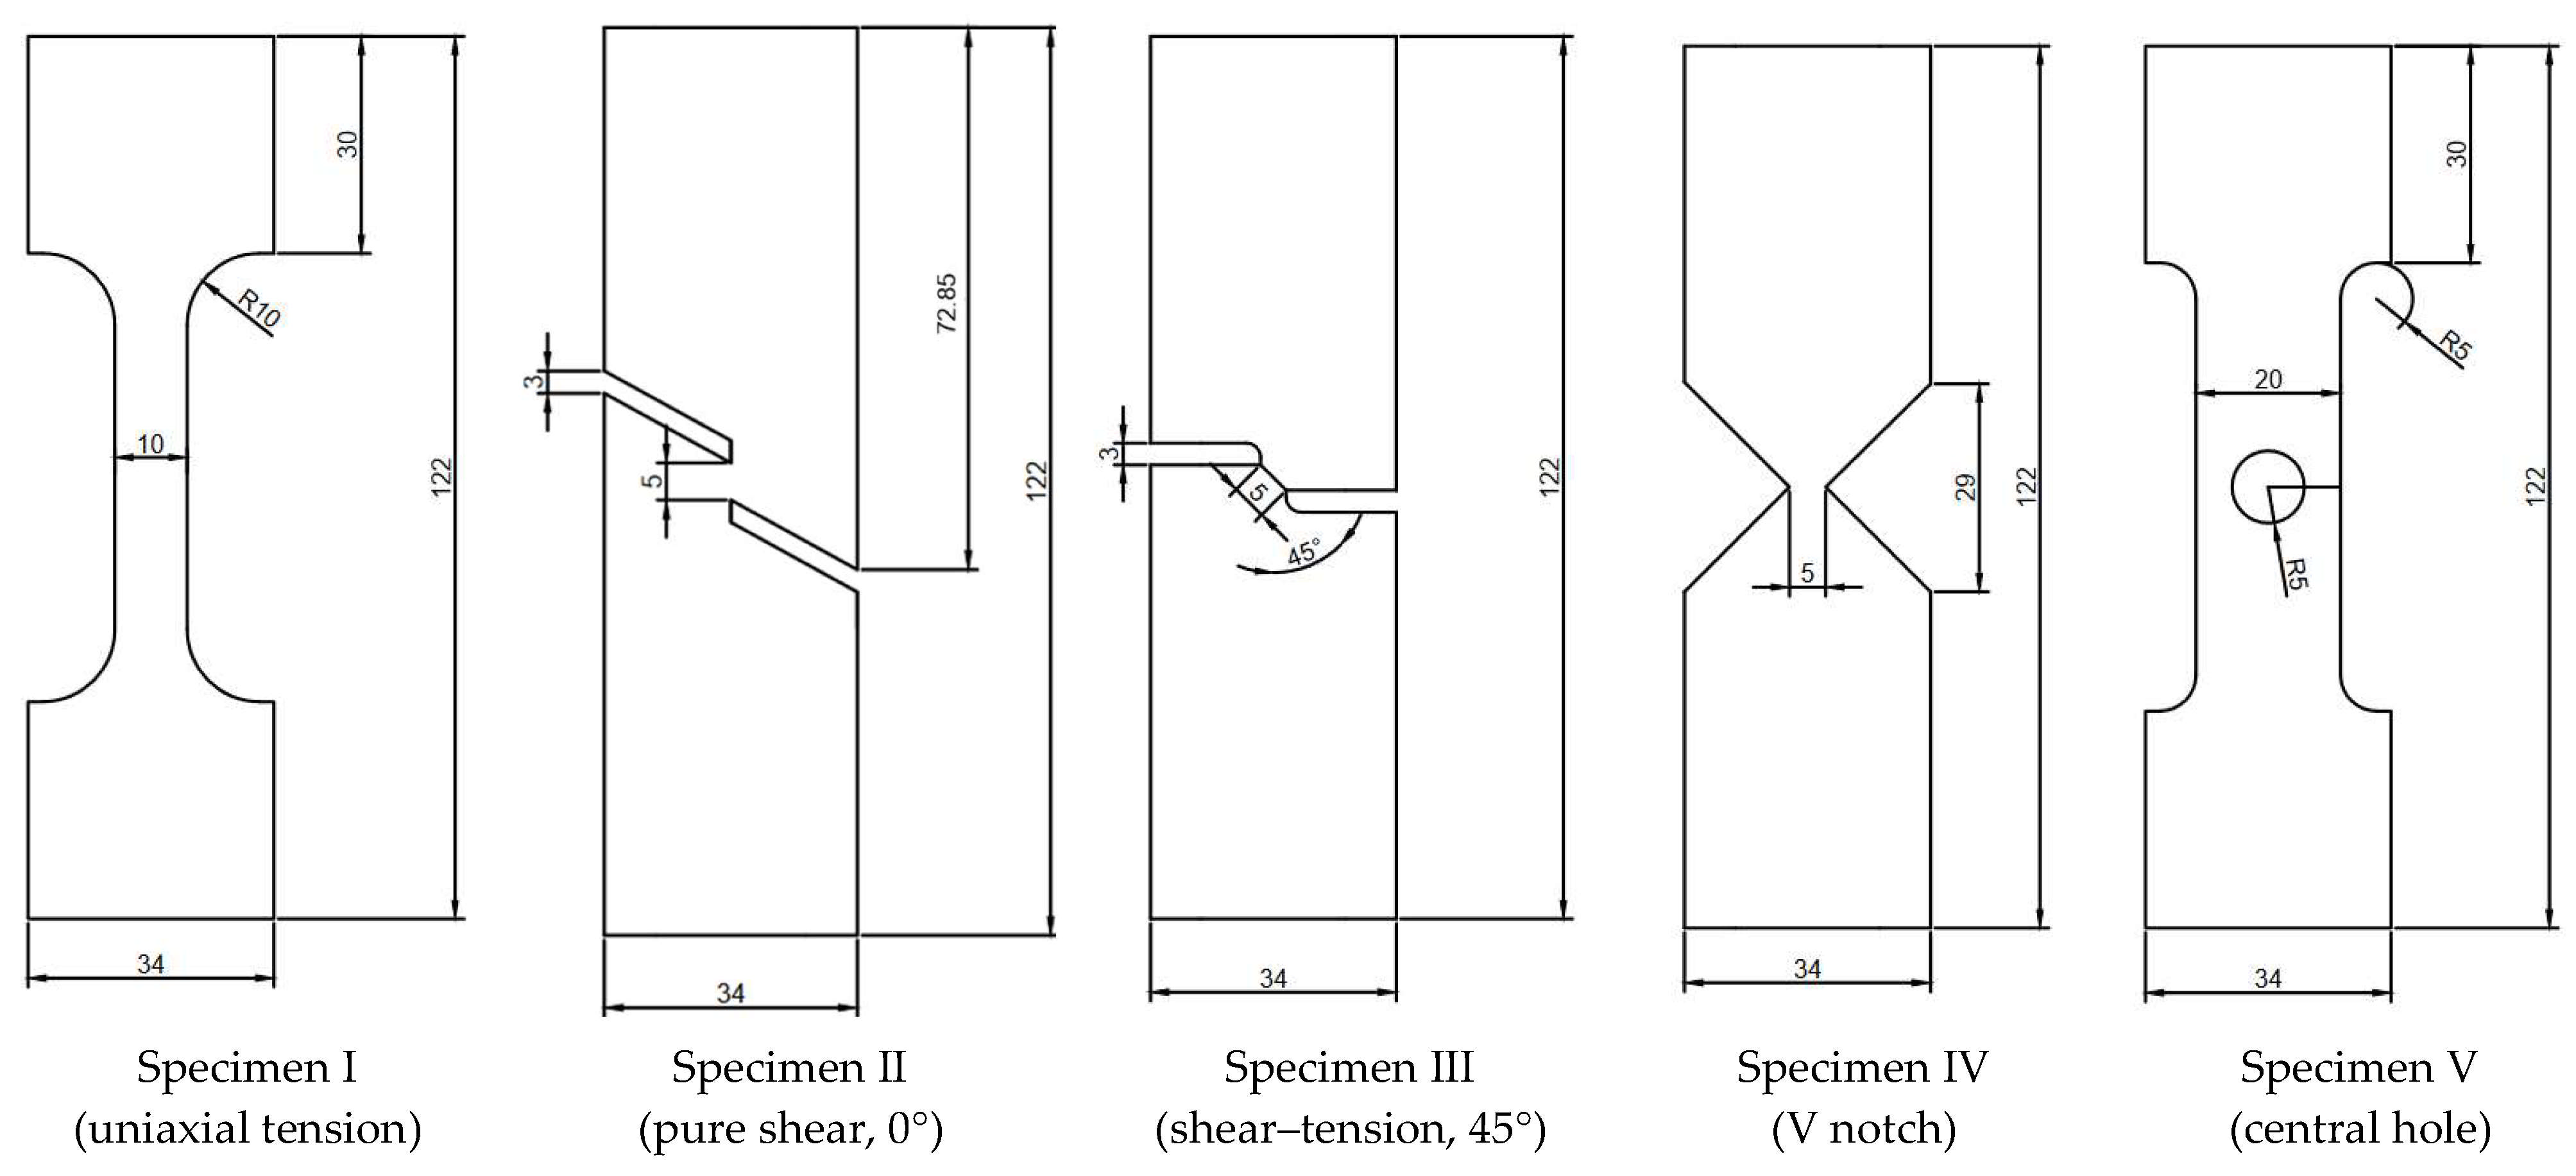
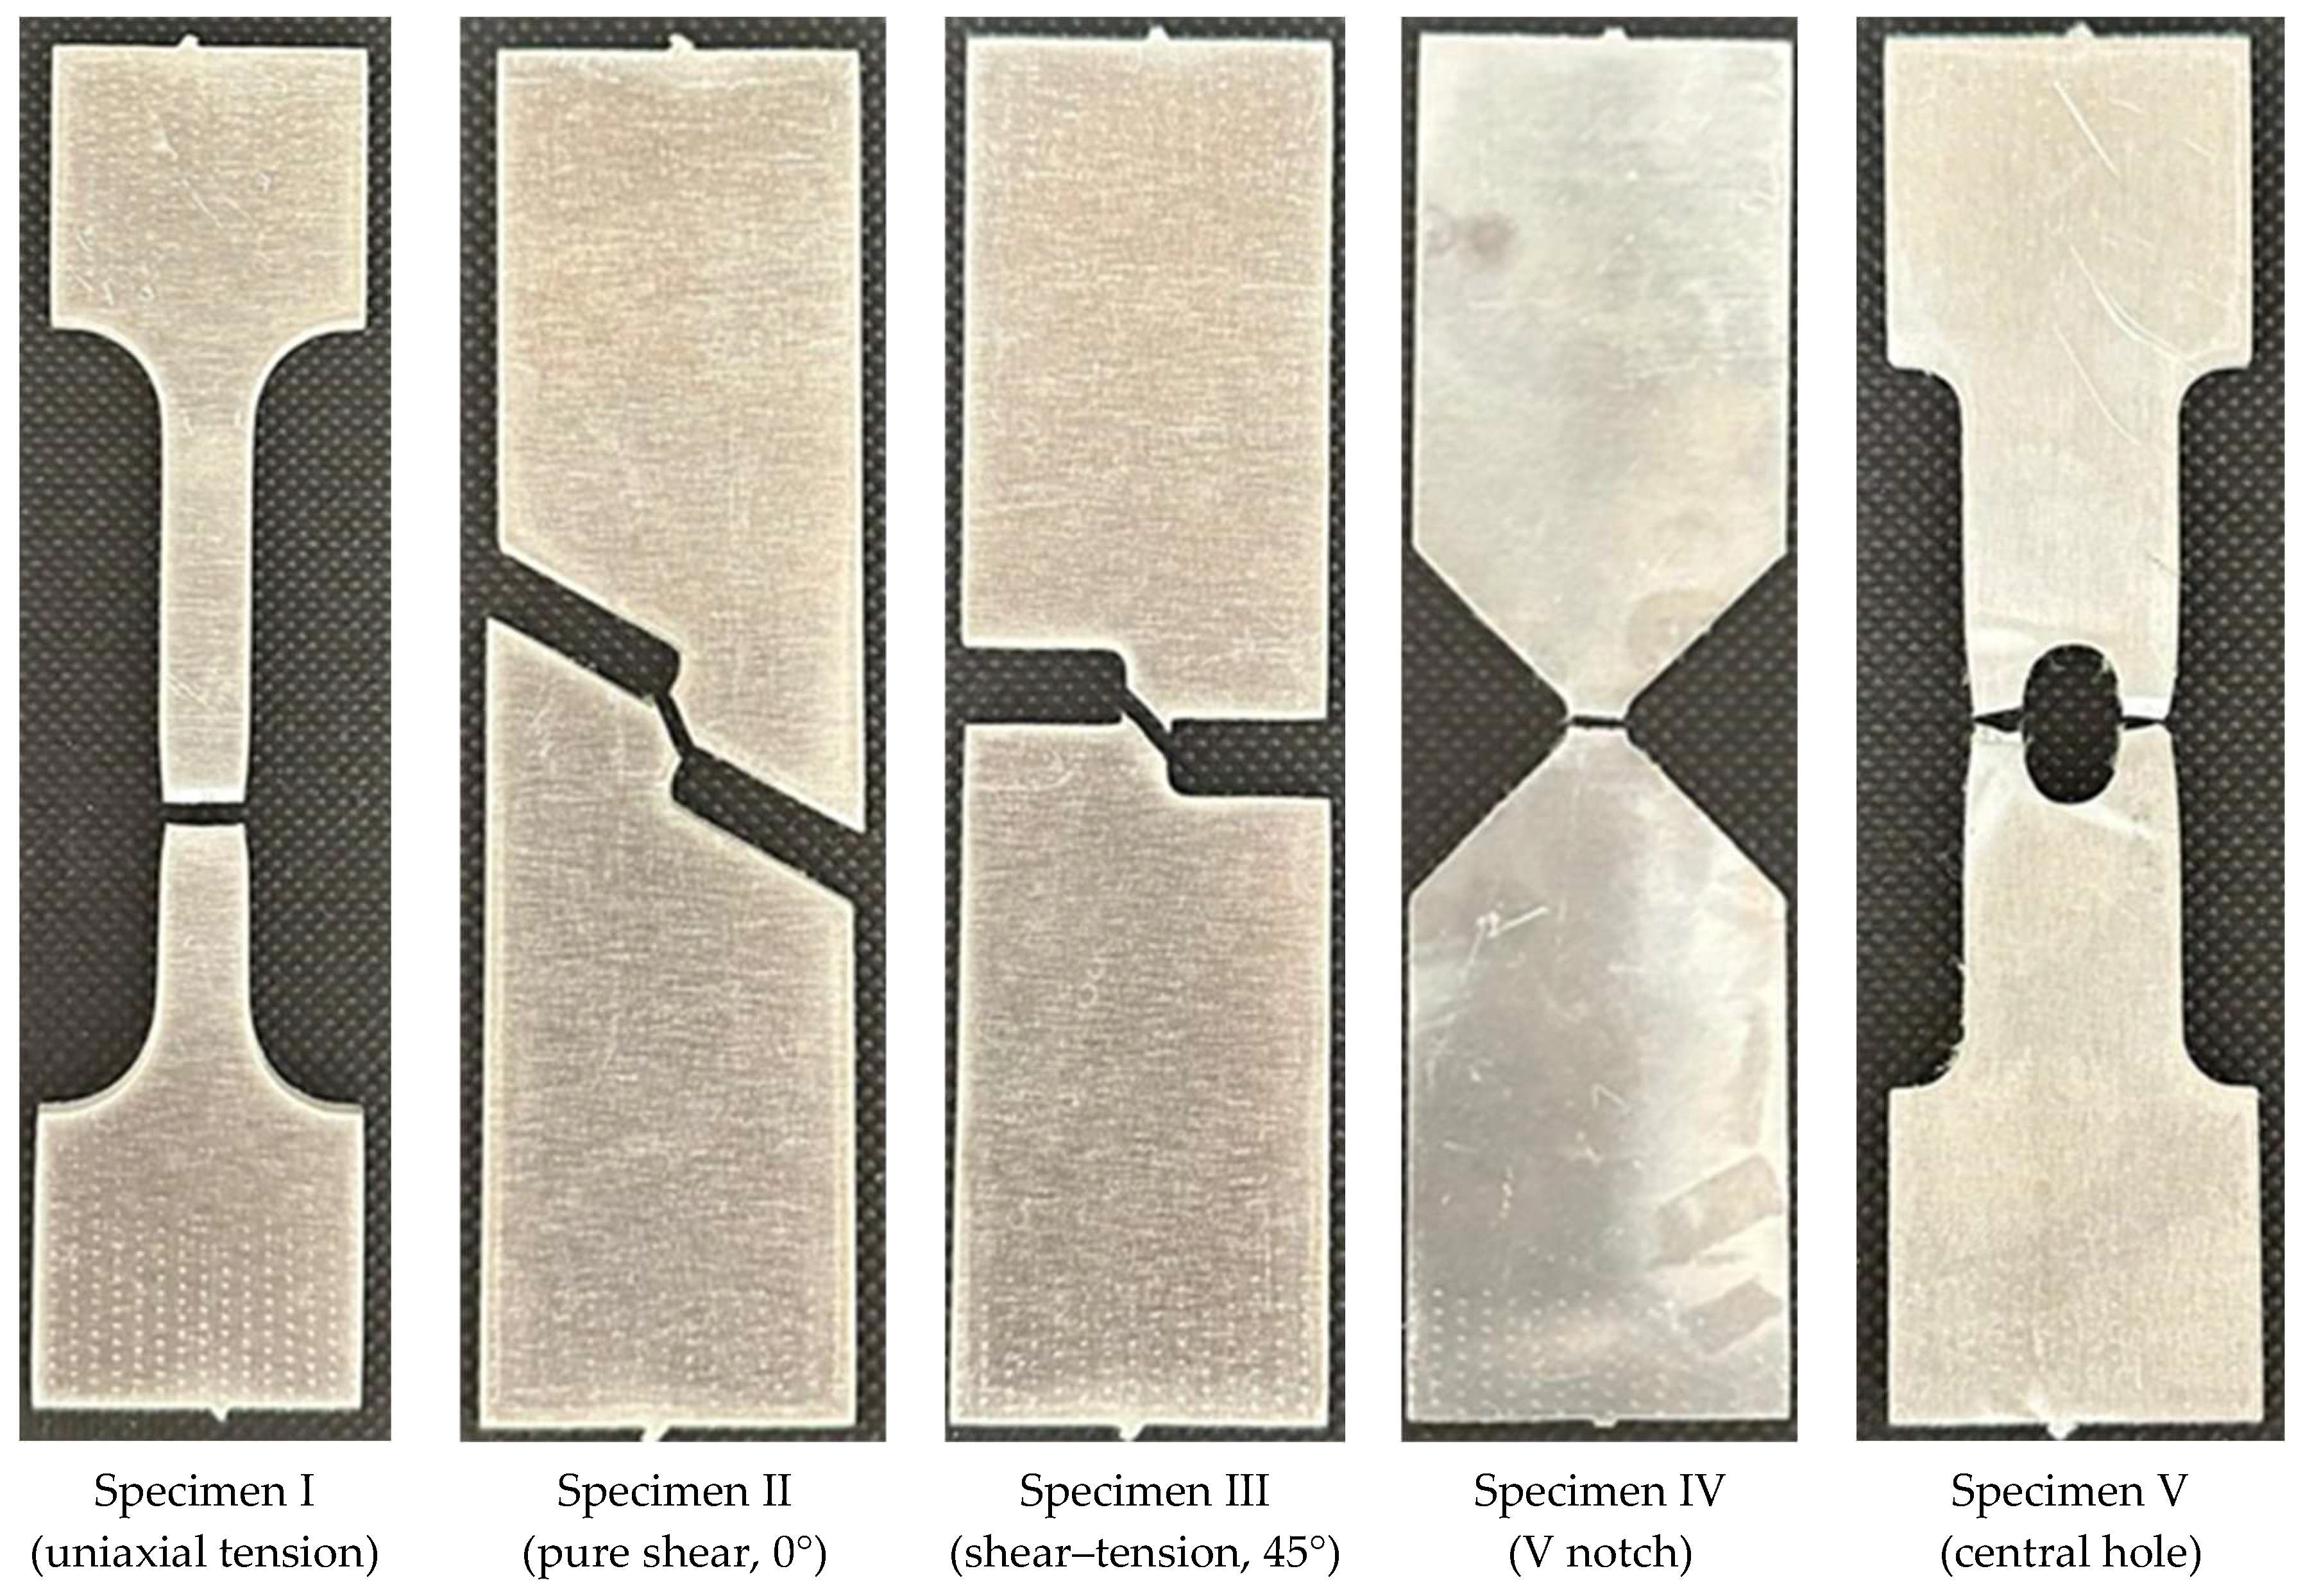
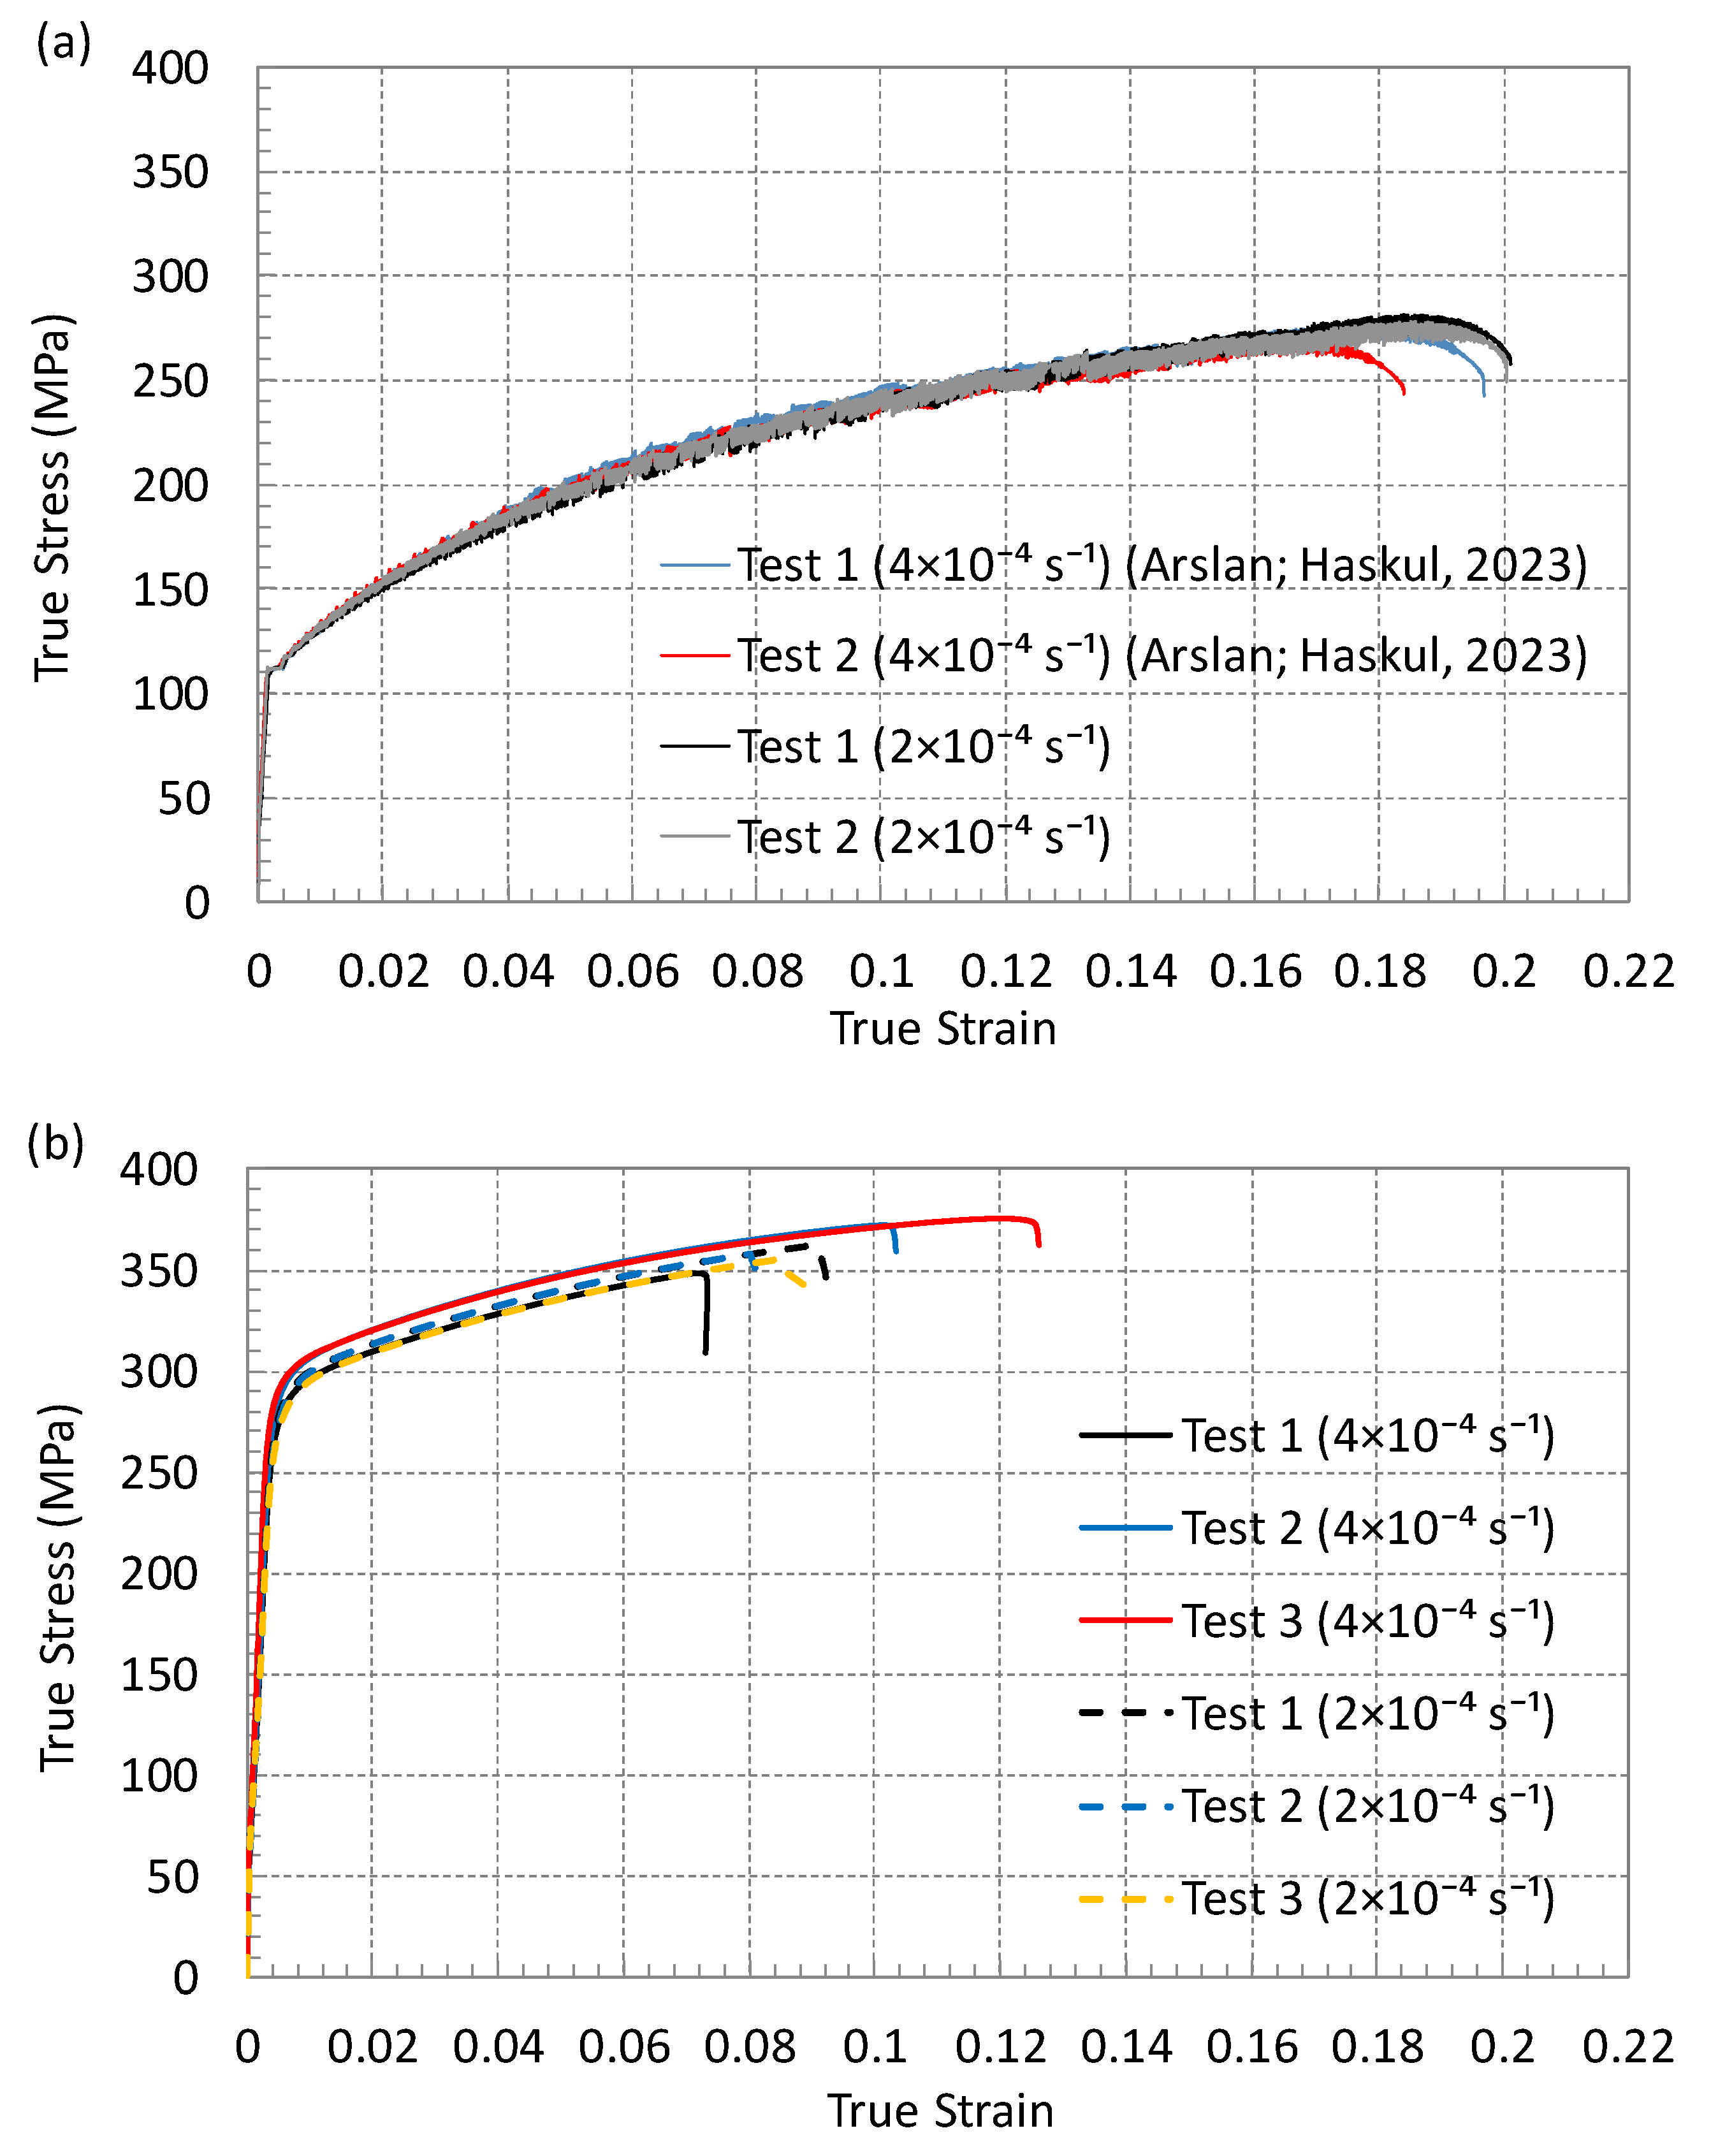
3.1. Experiment

Experiments using various specimen geometries were conducted to collect essential data for analysis and to support the development of the finite element (FE) model. The elastic and hardening behaviors of the AW5754 and AW6082 aluminum alloys, particularly on fracture strain values, were evaluated through tensile tests performed at different strain rates. Two or three repeated tests were carried out under identical loading conditions to ensure the reliability of the results. The specimens with rectangular cross-sections were prepared with similar dimensions, featuring a total length of 122 mm, a width of 34 mm, and thicknesses of 3 mm (for AW5754) and 1.5 mm (for AW6082). The geometries and dimensions of all specimens are illustrated in Figure 2. These specimens were specifically designed to capture the tensile region of the stress triaxiality locus. Specimen I was used for uniaxial tension testing at a low triaxiality. Specimen II was used to identify pure shear behavior and represents a triaxiality close to zero, while Specimen III represents combined tension–shear loading at an intermediate triaxiality. Specimen IV, a V-notch specimen, was used to determine the fracture strain value in the high-triaxiality region, while Specimen V, a central hole specimen, also contributed to the high-triaxiality range (see also Figure 1).
These tensile tests were conducted at two very low loading speeds. The gauge length was adjusted to ensure identical strain rates for all specimens, resulting in applied strain rates of 2 × 10⁻⁴ s−1 and 4 × 10⁻⁴ s−1 for each specimen. These loading speeds are considered representative of quasi-static loading conditions [42]. A Shimadzu testing machine was used to apply an axial tensile load, and the deformations at critical points on each specimen were measured using extensometers. During the tests, loading was applied until the complete fracture of each specimen, as the analysis specifically focused on the fracture strain and the corresponding stress state. The fractured AW5754 specimens (tested at a strain rate of 2 × 10⁻⁴ s−1) and AW6082 specimens (tested at a strain rate of 4 × 10⁻⁴ s−1) are shown in Figure 3 and Figure 4, respectively, as a sample.
To evaluate the repeatability of the mechanical tests, we performed two to three repetitions for each specimen geometry and strain rate condition. For each set of repeated tests, the mean values, standard deviation, and coefficient of variation for key parameters such as fracture strain and maximum force were calculated. Due to the large volume of data, the detailed results are not presented here. However, the coefficient of variation (CV) for most specimen types remained below 5%, indicating good repeatability. Higher CV values (e.g., >10%) were observed in the cases with very low fracture strains or complex stress states, such as Specimens III–V of AW6082 at a strain rate of 2 × 10⁻⁴ s−1. In such cases, the average values from repeated tests were used for the analysis.
True stress and logarithmic strain values were calculated only for Specimen I, corresponding to the standard tensile test specimen, and are shown in Figure 5. Figure 5a presents the results for AW5754 at two different loading rates, with two repeated tests conducted for each rate. Figure 5b shows the results for AW6082, with three repeated tests for each of the two loading rates. For ease of comparison, the same axis scale is used in both figures. These plots also enable the determination of the modulus of elasticity and yield stress for each case. Additionally, the fracture point can be identified at the end of the loading phase in these figures. The test results further contribute to defining the stress–plastic strain relationship by capturing the hardening behavior of the alloys. The material data derived from the plastic regions of these tests were used in all FE simulations, including those for other specimen types. It is important to note that, while a true stress–strain curve can be obtained for Specimen I, calculating the stresses and strains for the deformed geometries of the other specimen types without FE modeling is challenging. Therefore, force–displacement curves (measured between extensometers) are plotted for Specimens II–V in later on. These data are employed to validate the FE models and to identify fracture points in the respective specimens. To avoid repetition, these data are presented in Section 3.5 as part of the comparison with the FE simulation results.

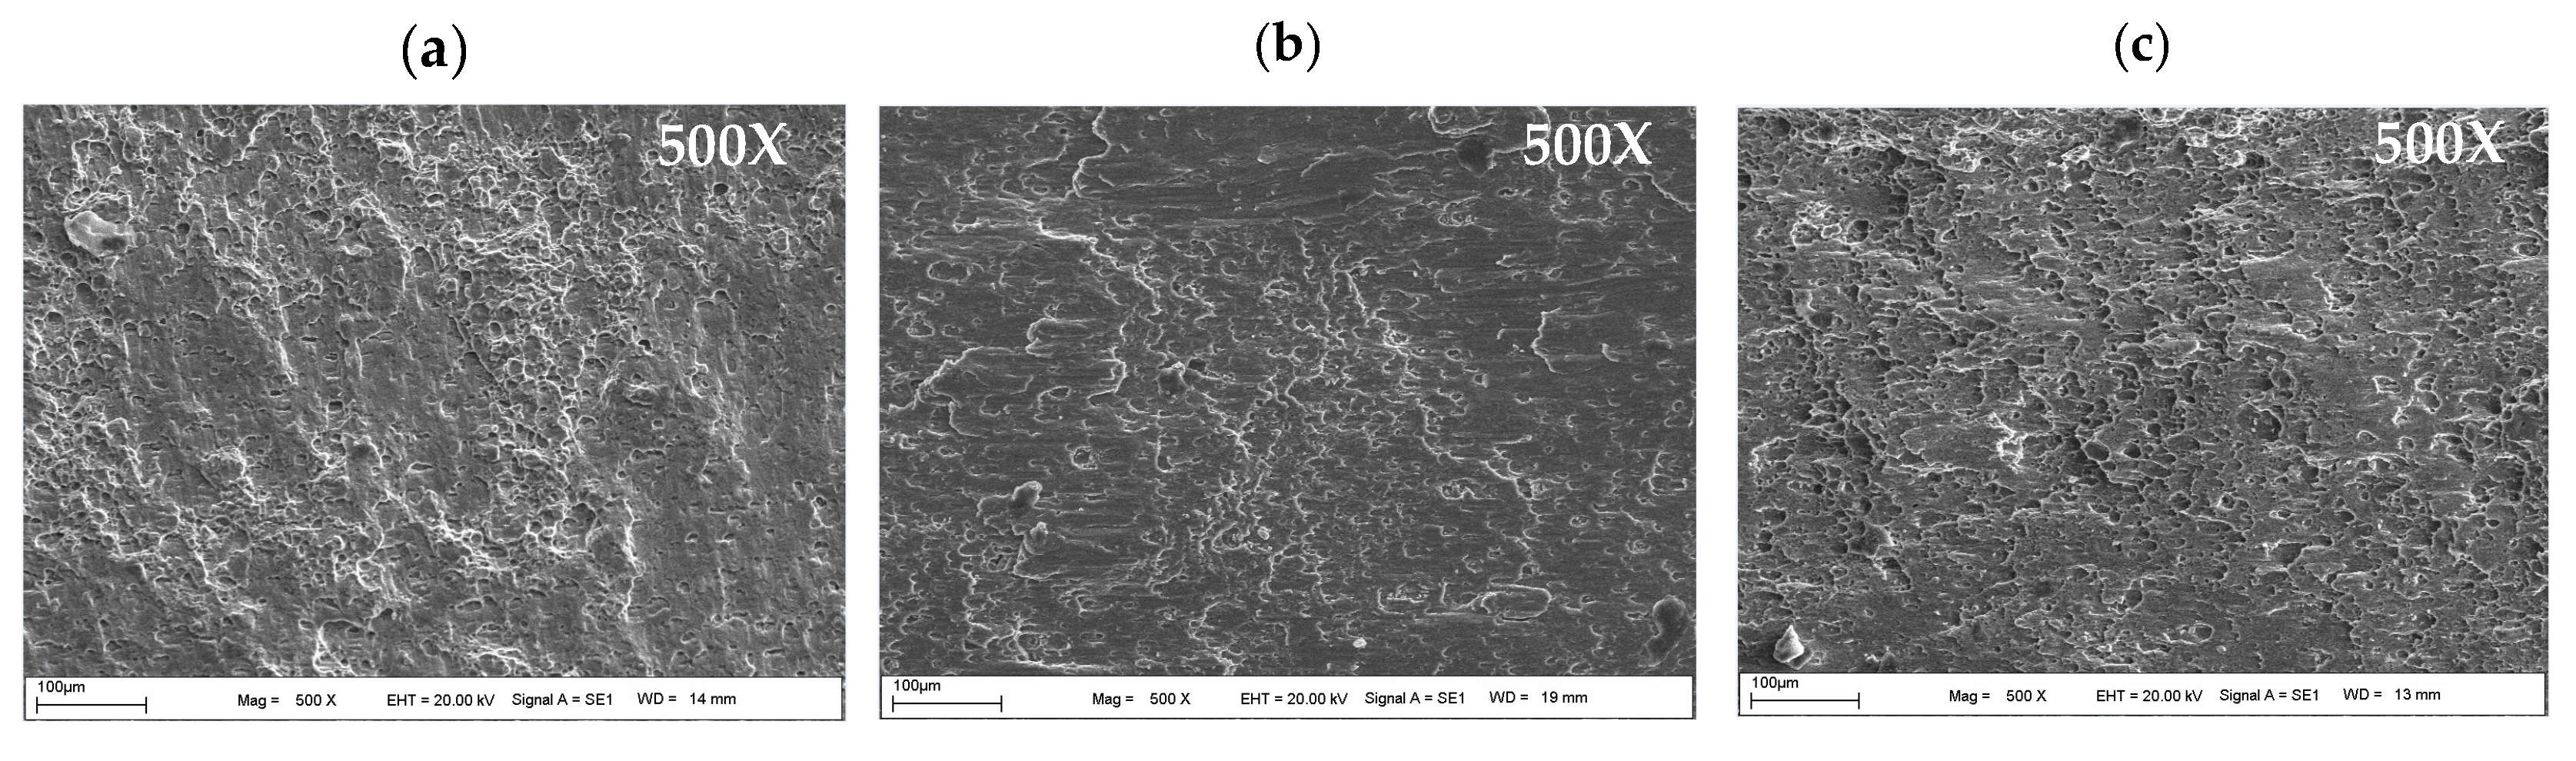
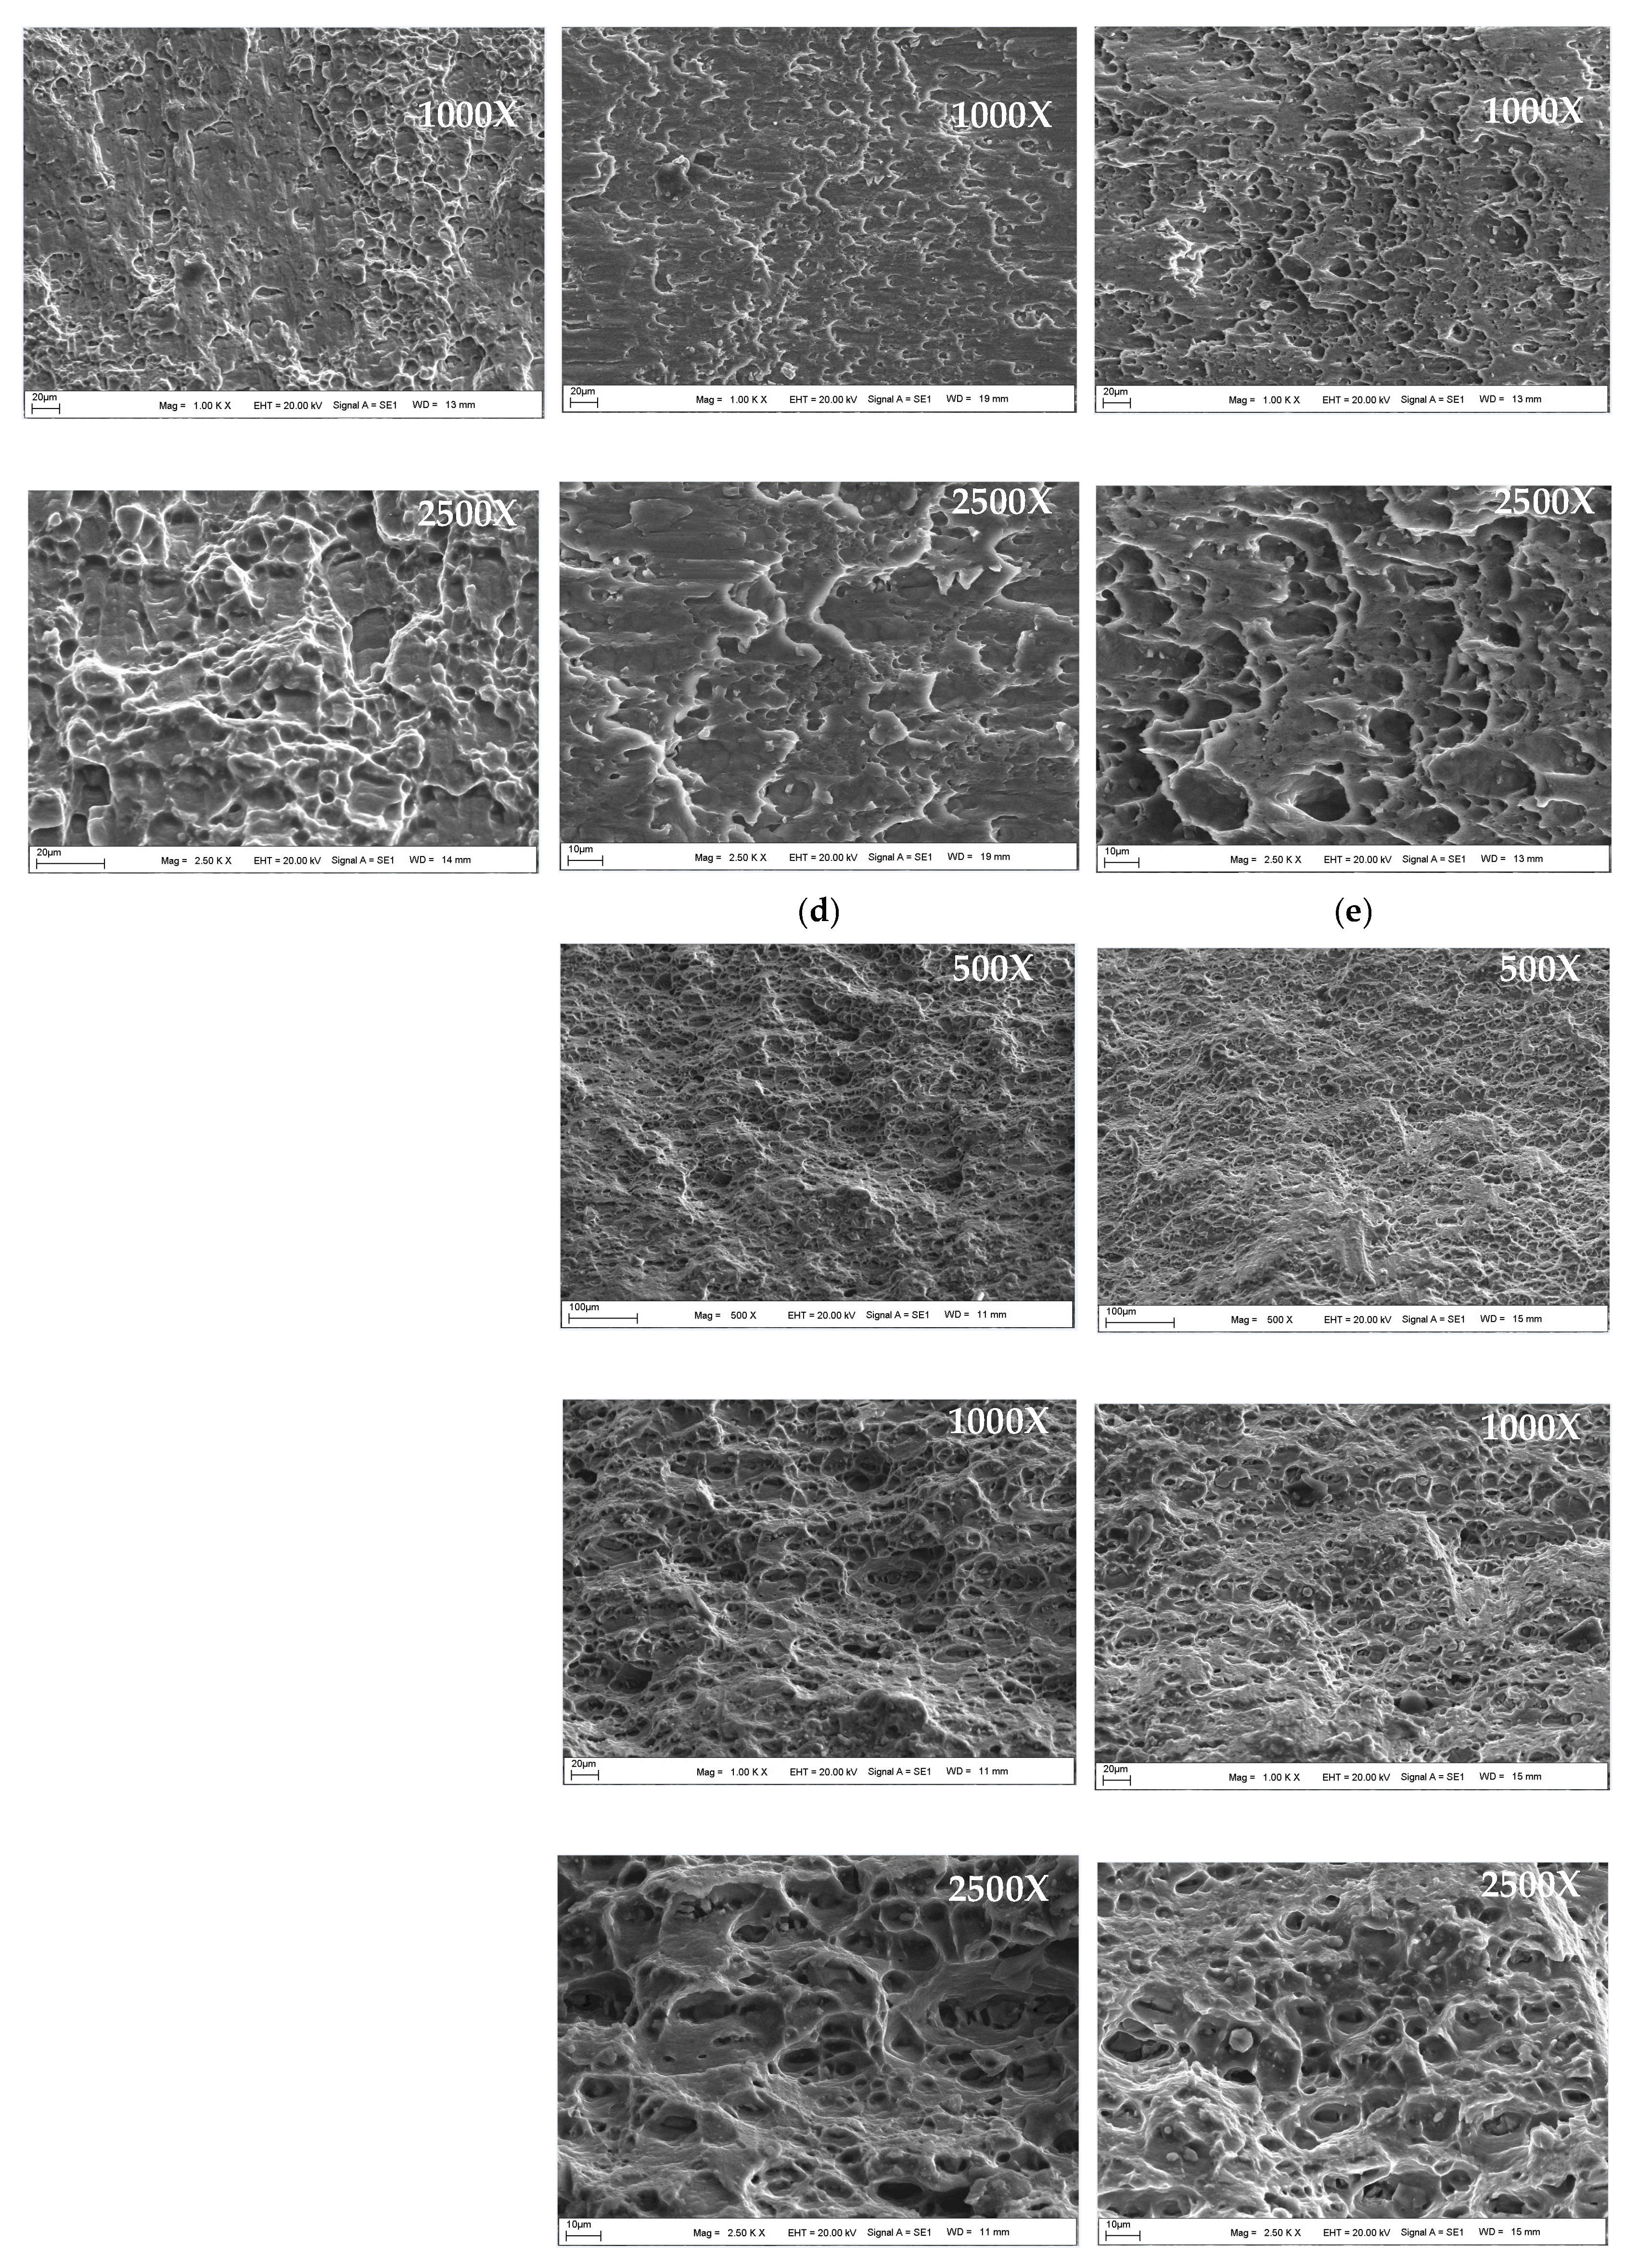
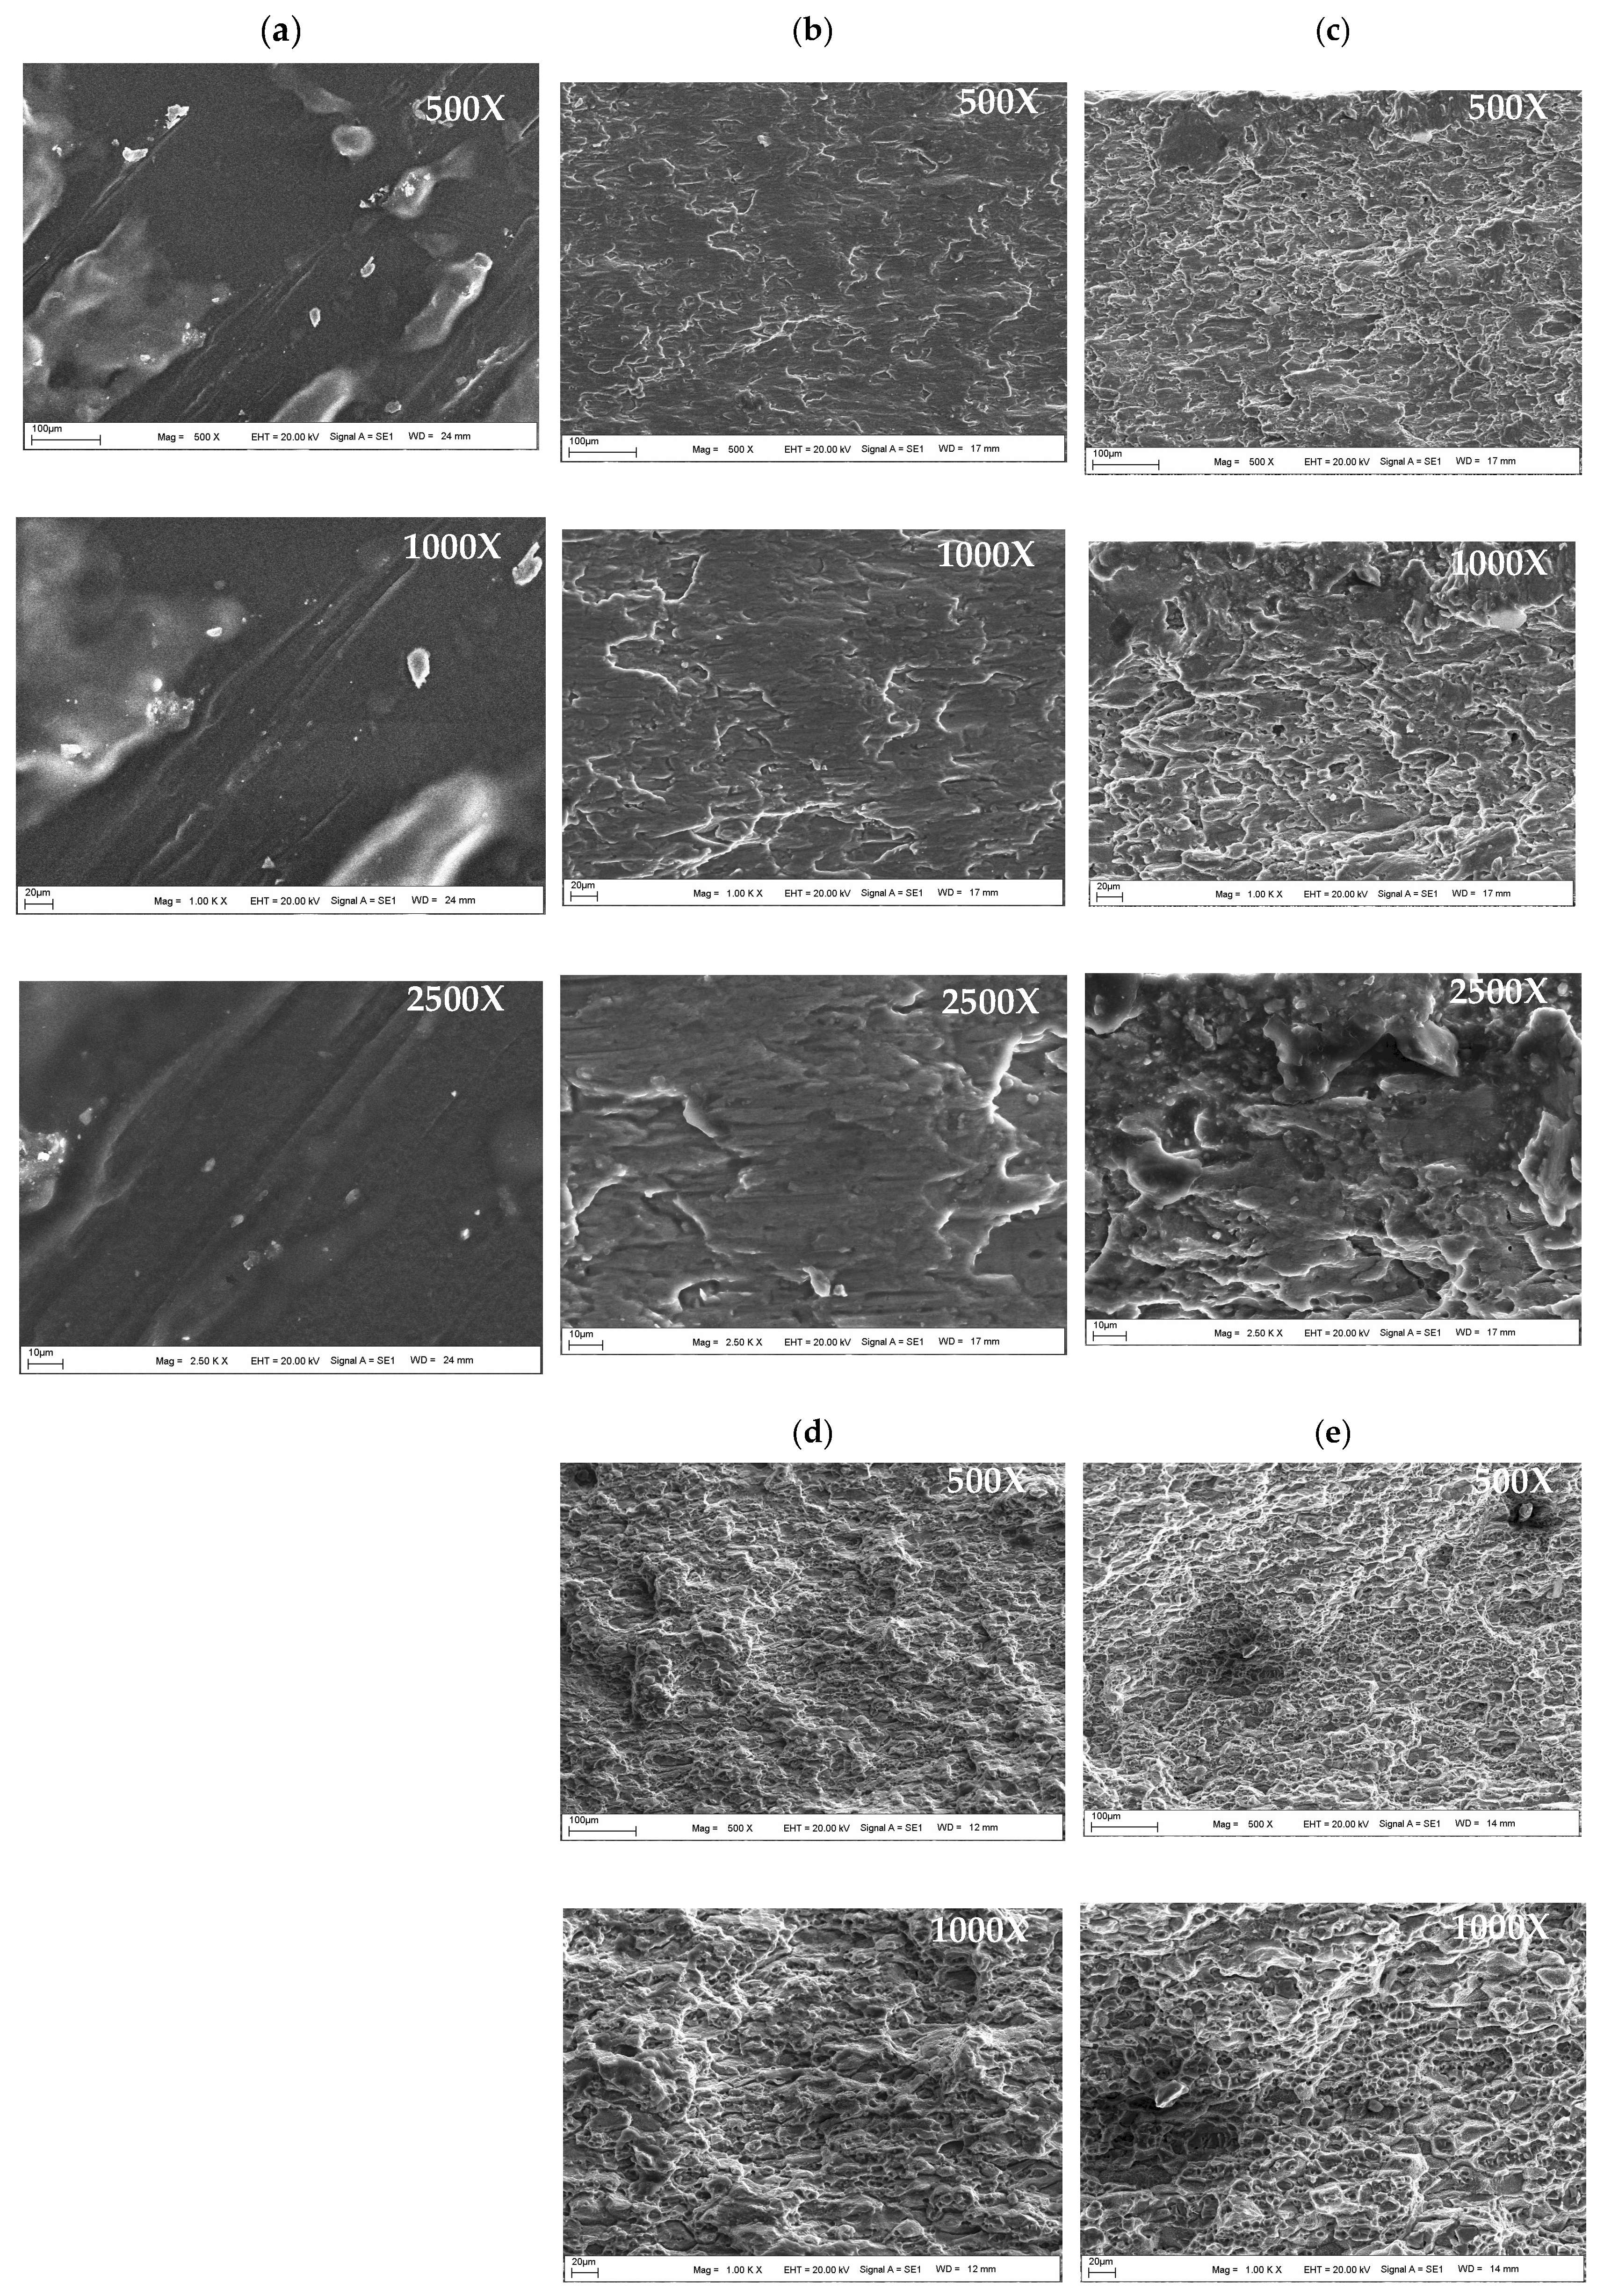
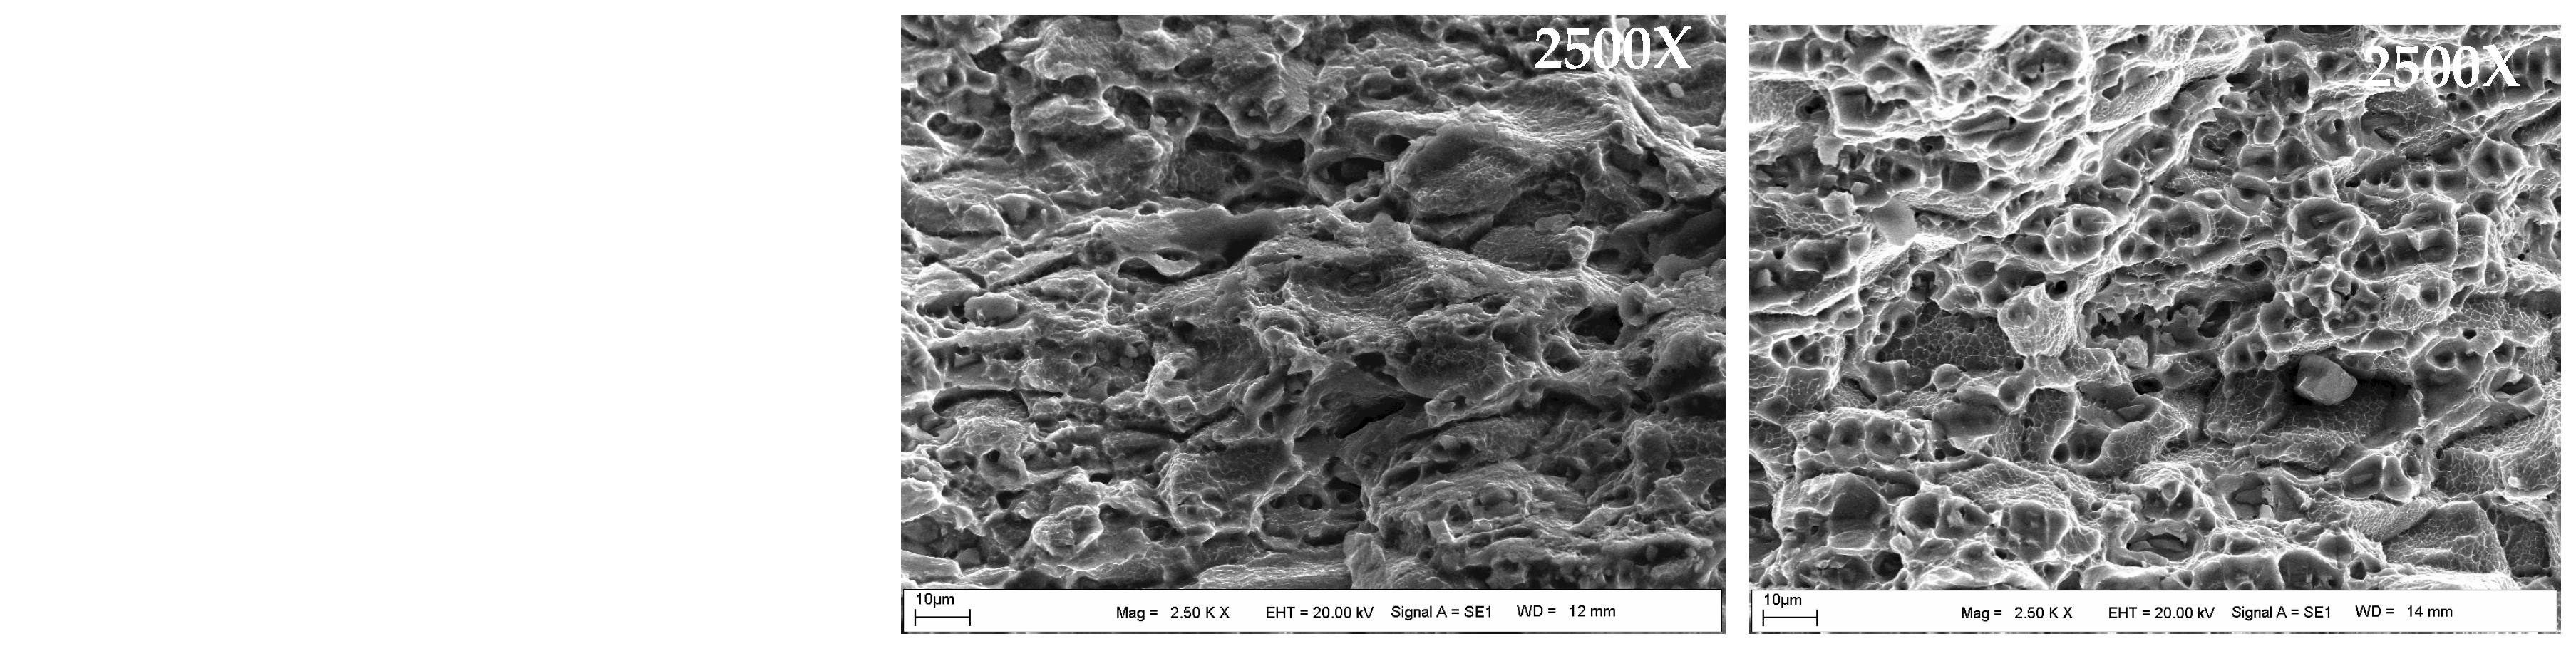
3.2. Fractographic Analysis

Fractographic analysis was performed on specimens of the AW5754 and AW6082 alloys to investigate their fracture mechanisms and surface morphologies under various notch geometries. Selected fracture surfaces of the specimens were examined using scanning electron microscope (SEM) images, which were captured at three different magnifications (500×, 1000×, and 2500×). The results are presented in Figure 6 and Figure 7 as representative samples.
The fracture surfaces of the AW5754 alloy, from Sample I through Sample V, are presented in Figure 6 at three different magnifications. Figure 6a shows a large number of dimples and voids on the surface, representing typical ductile fracture behavior. The fracture resulted from void nucleation, growth, and coalescence. This indicates that the material has high deformability under tension and tends to fracture slowly and in a controlled manner. Figure 6b presents a fracture surface formed under pure shear force. A wavy surface running parallel to the maximum shear stress and a distinct shear band in the center are observed. This morphology reflects localized plastic deformation, where microscopic cracks gradually coalesce, leading to fracture. In Figure 6c, the fracture surface of Specimen III contains both dimple structures and shear planes, indicating that the fracture occurred under combined tension and shear. The presence of localized plastic deformation areas reveals a transitional fracture mode, which is critical for understanding the material’s behavior under mixed loading conditions. Figure 6d shows dimples of varying diameters formed due to a high stress concentration at the notch root. This morphology again reflects ductile fracture, with the variation in dimple size attributed to microstructural differences. As shown in Figure 6e, the fracture initiated symmetrically from the edge of the circular hole and produced a homogeneous surface. The regular distribution of deep, large dimples indicates slow and stable crack propagation.
Figure 7a shows bright and smooth structures on the fracture surface, along with microcracks at the edges of Specimen I of AW6082. This indicates that the material fractured suddenly, without sufficient plastic deformation under tensile loading. The energy absorption capacity of the material is low. Figure 7b presents a fracture surface under shear force, featuring distinct shear bands and localized deformation zones. However, the absence of dimples suggests low ductility behavior. In Figure 7c, both brittle regions (flat surfaces) and traces of local plastic deformation are visible. This reflects the fracture behavior of the material under mixed loading conditions and suggests that a complex fracture surface formed due to stress concentration effects. Figure 7d shows cracks along the grain boundaries with shiny, smooth surfaces, indicating grain boundary decohesion. Figure 7e displays pores on the surface and thin, sharp edges around them. These features support the presence of micro segregations and intermetallic phases that may act as crack initiation regions.

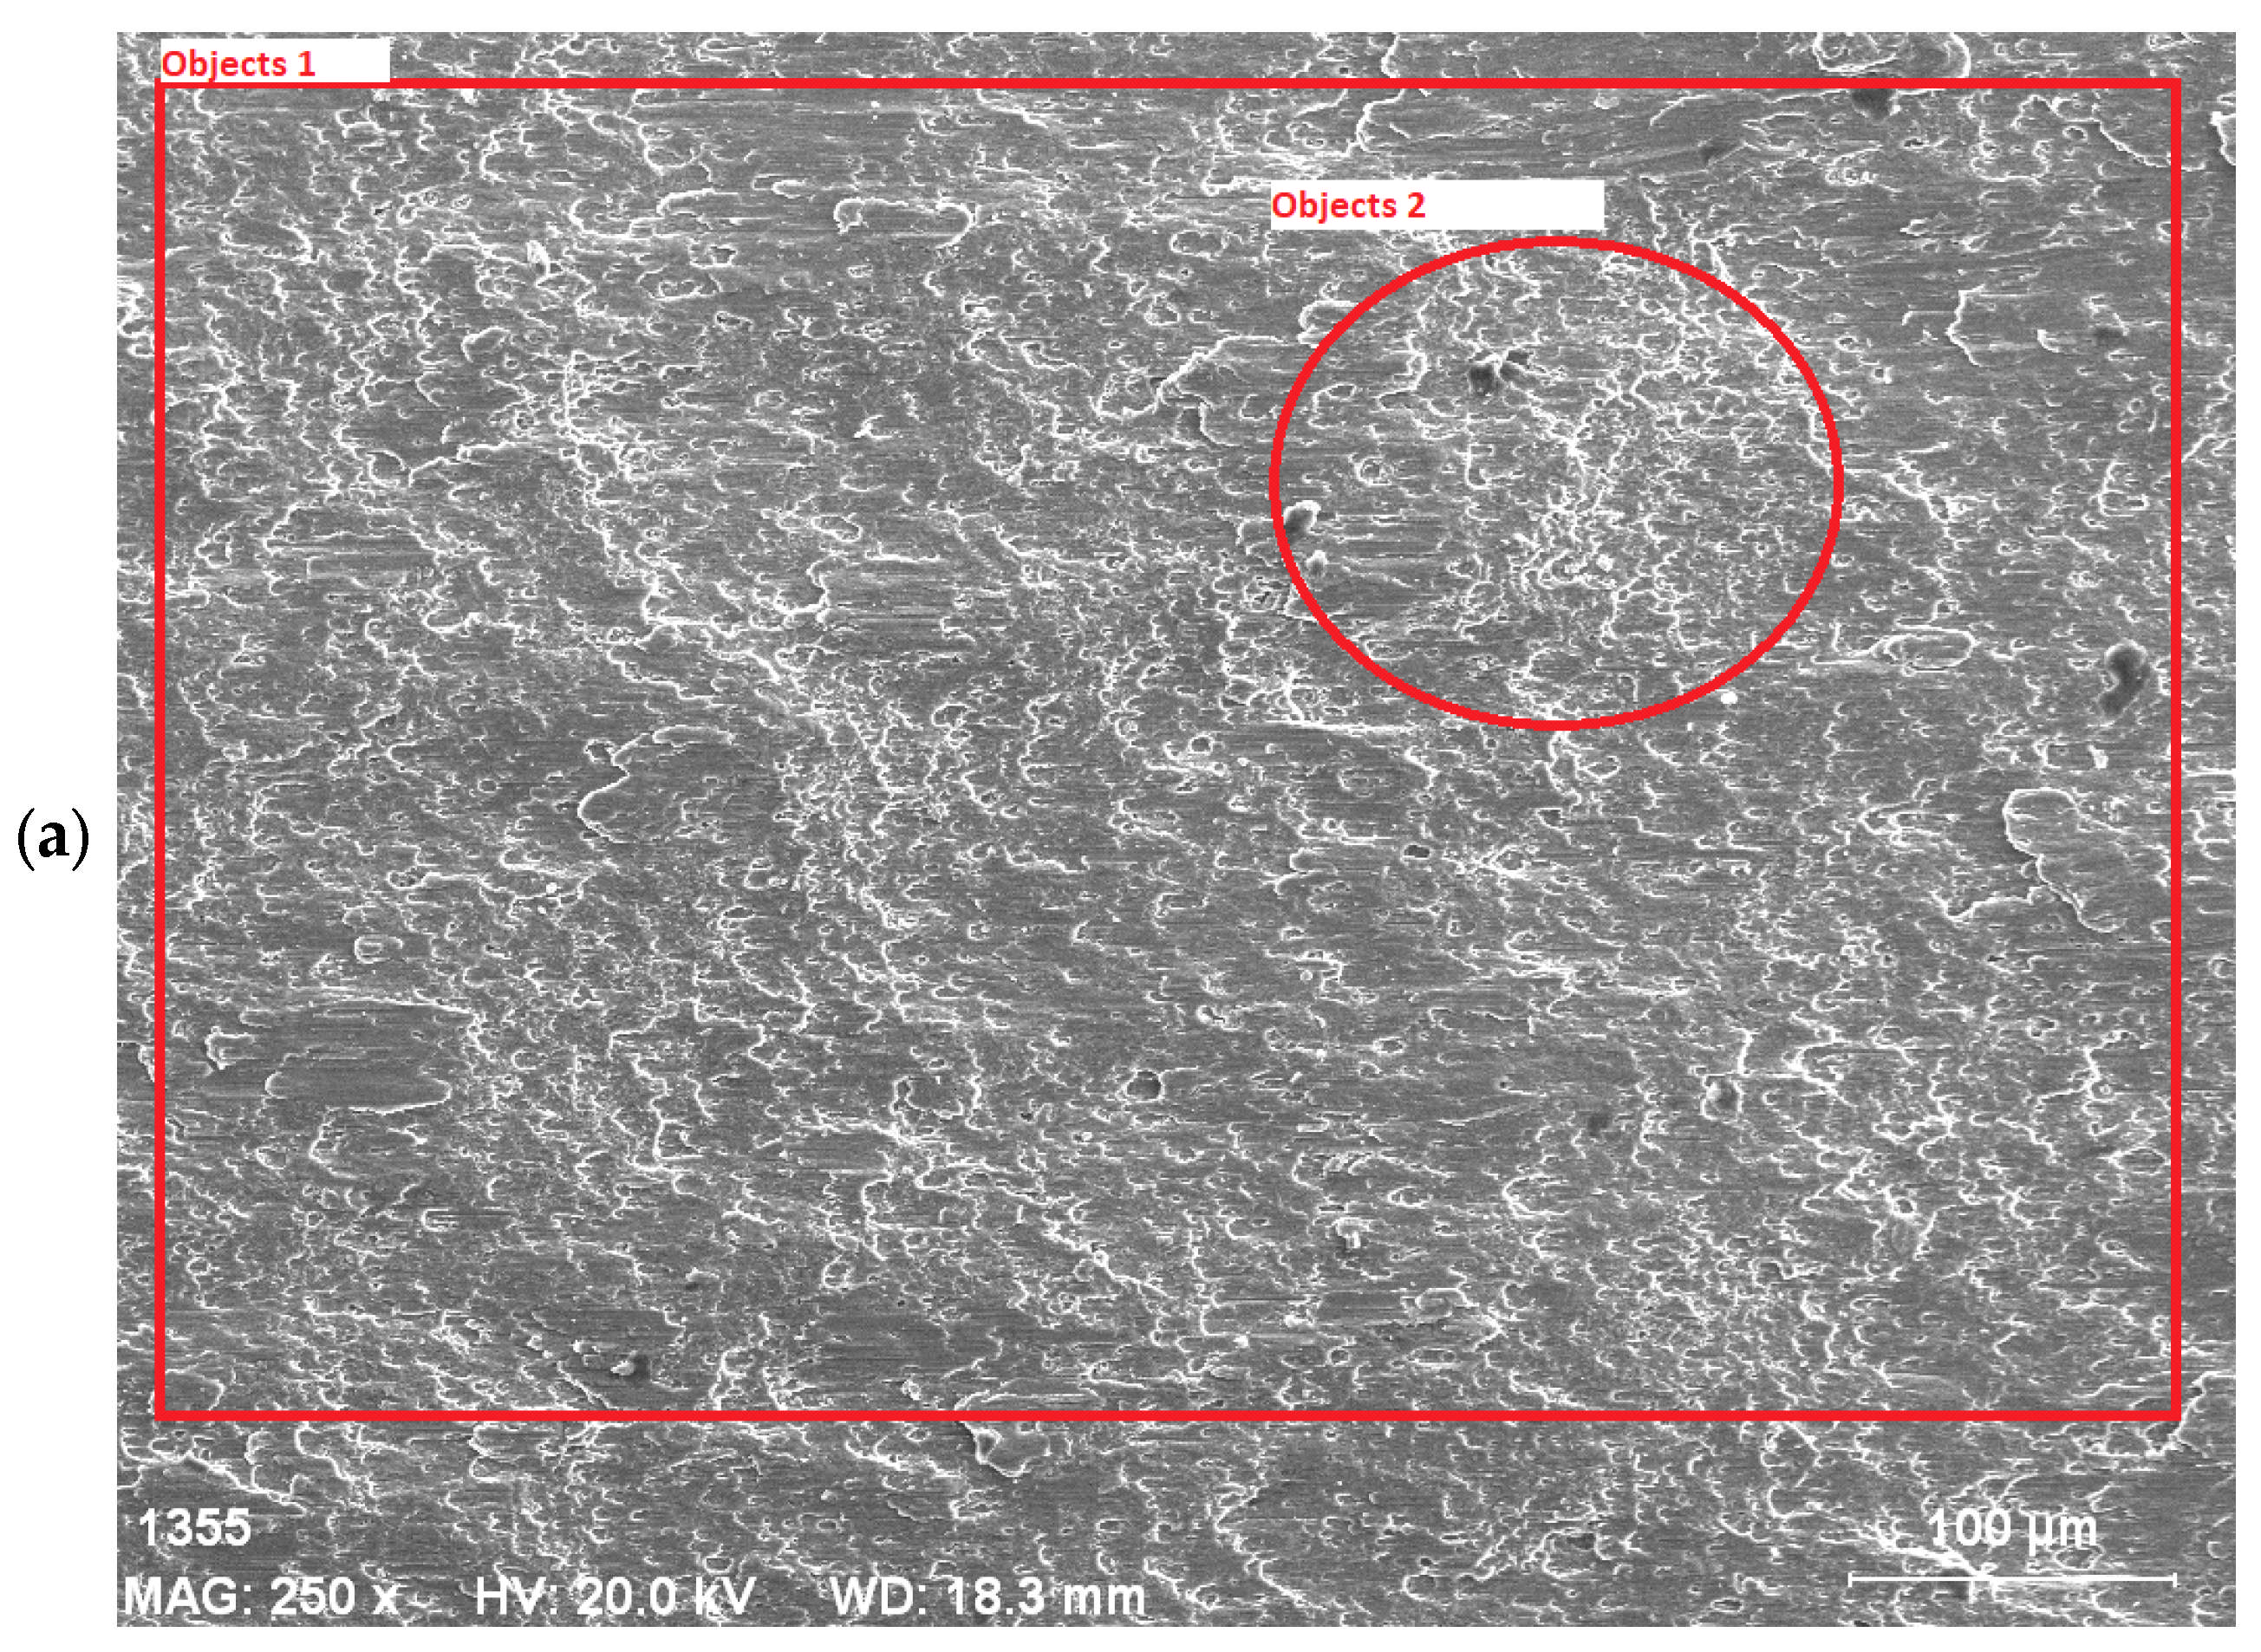
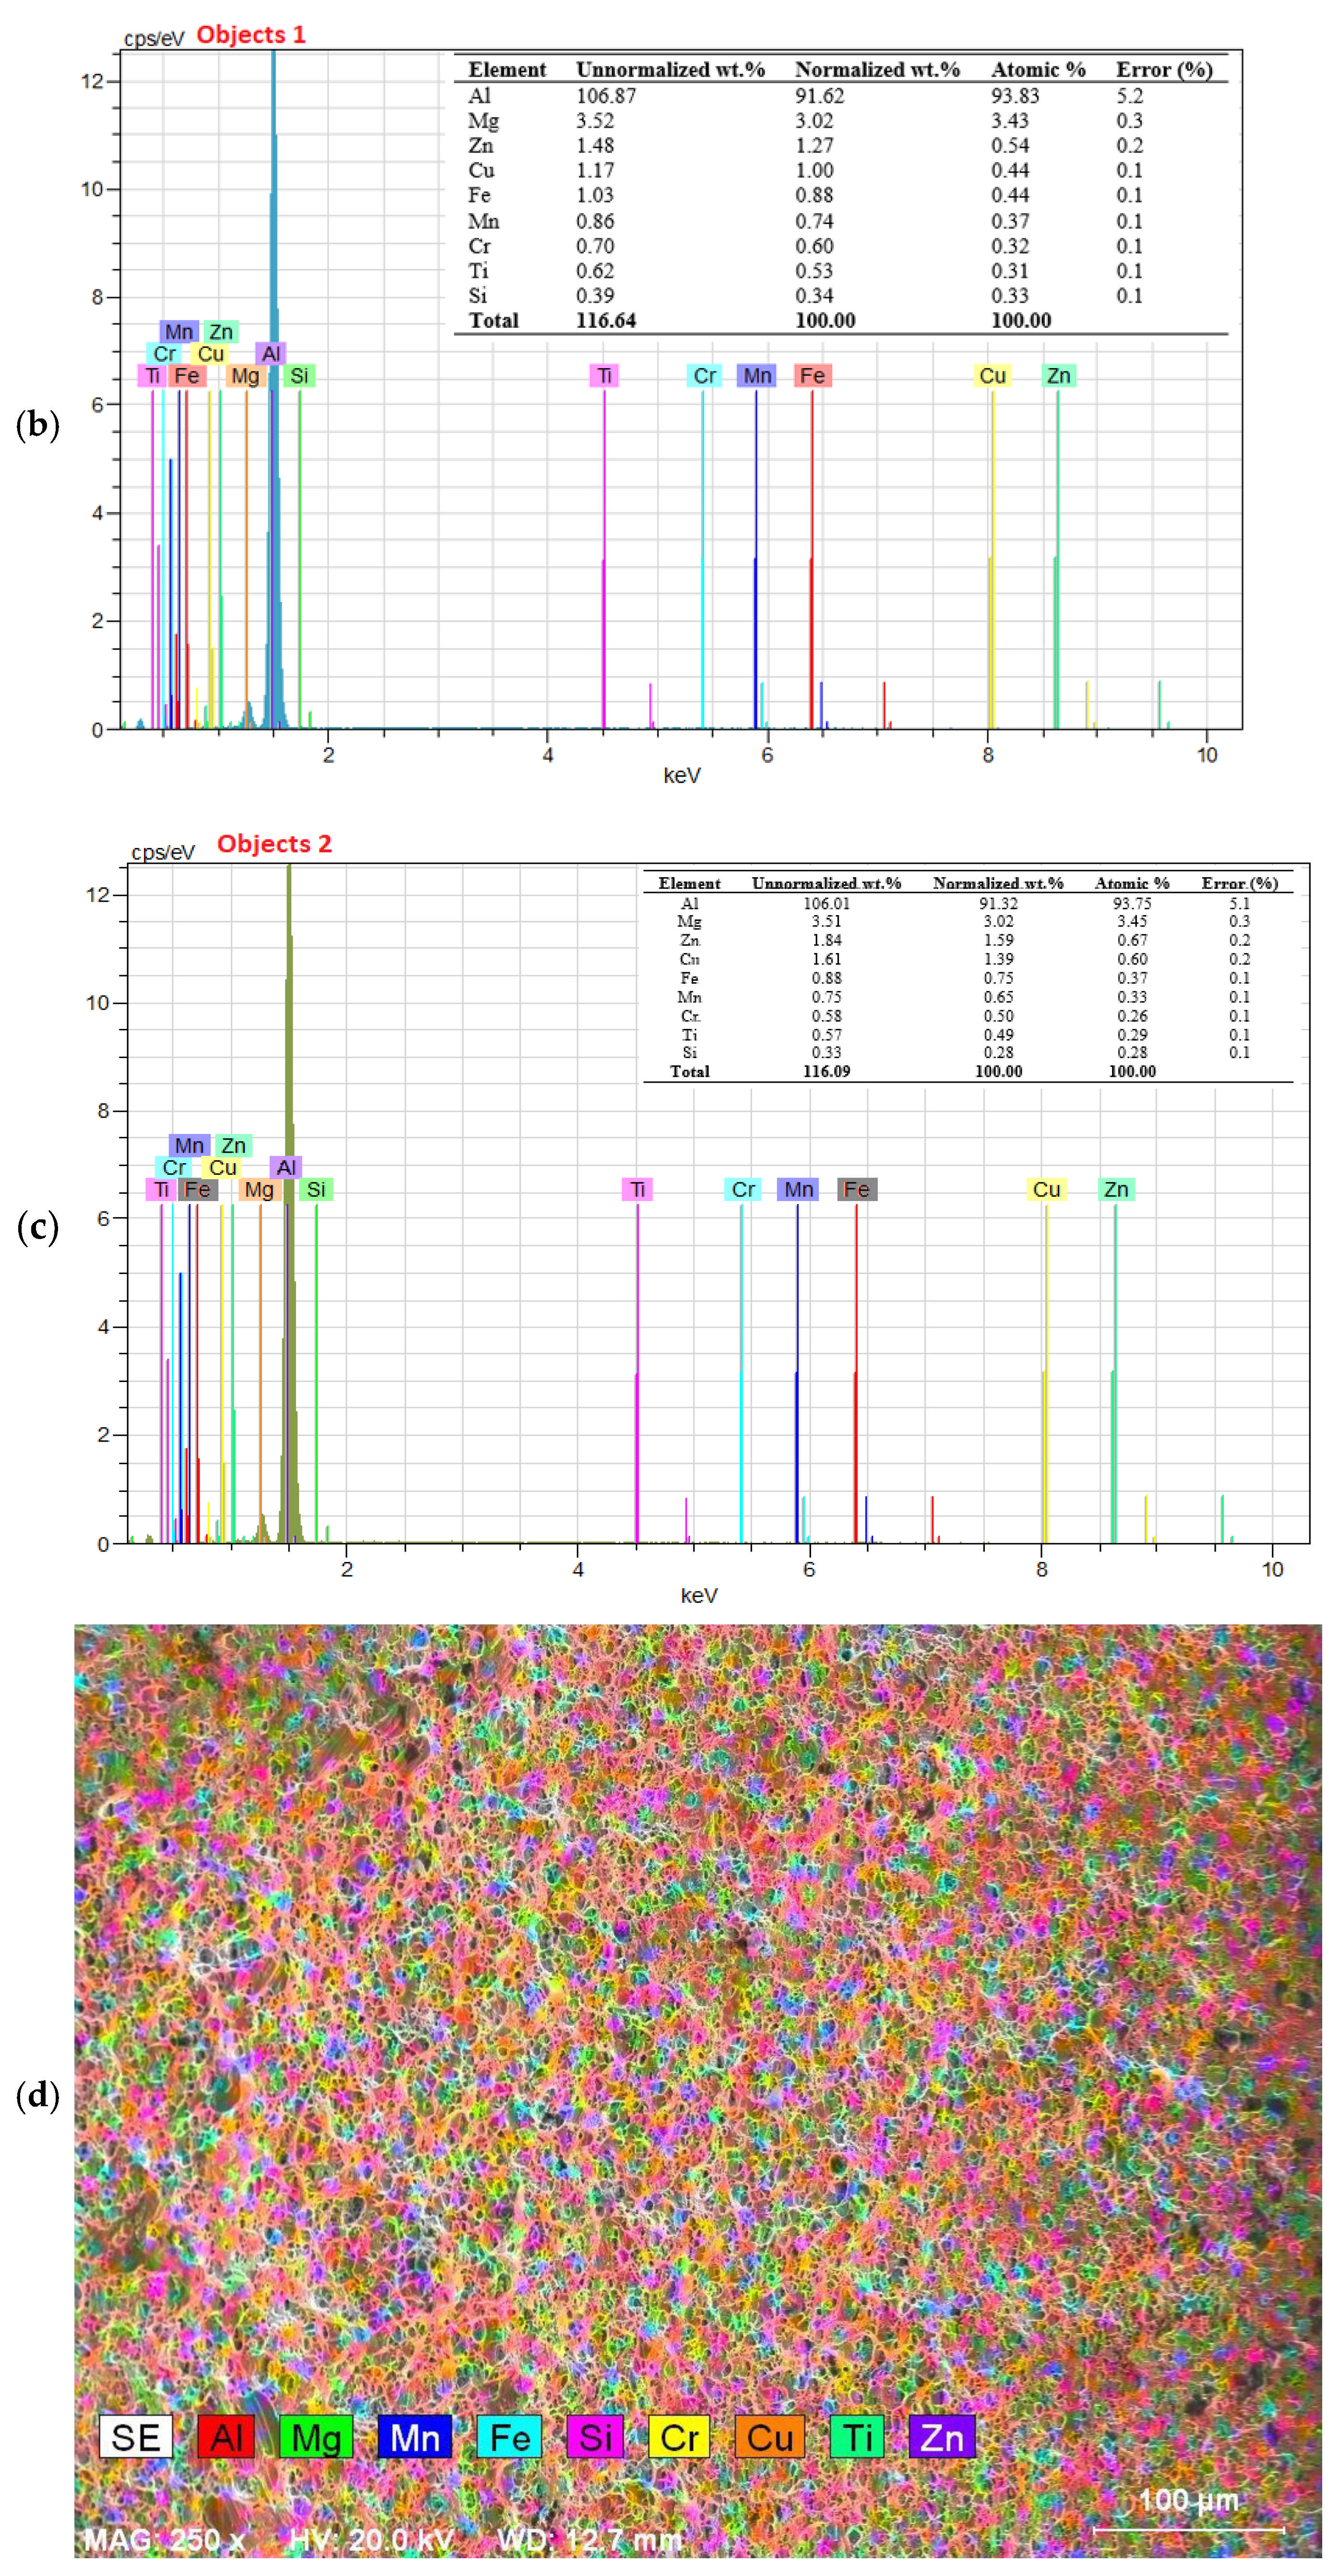
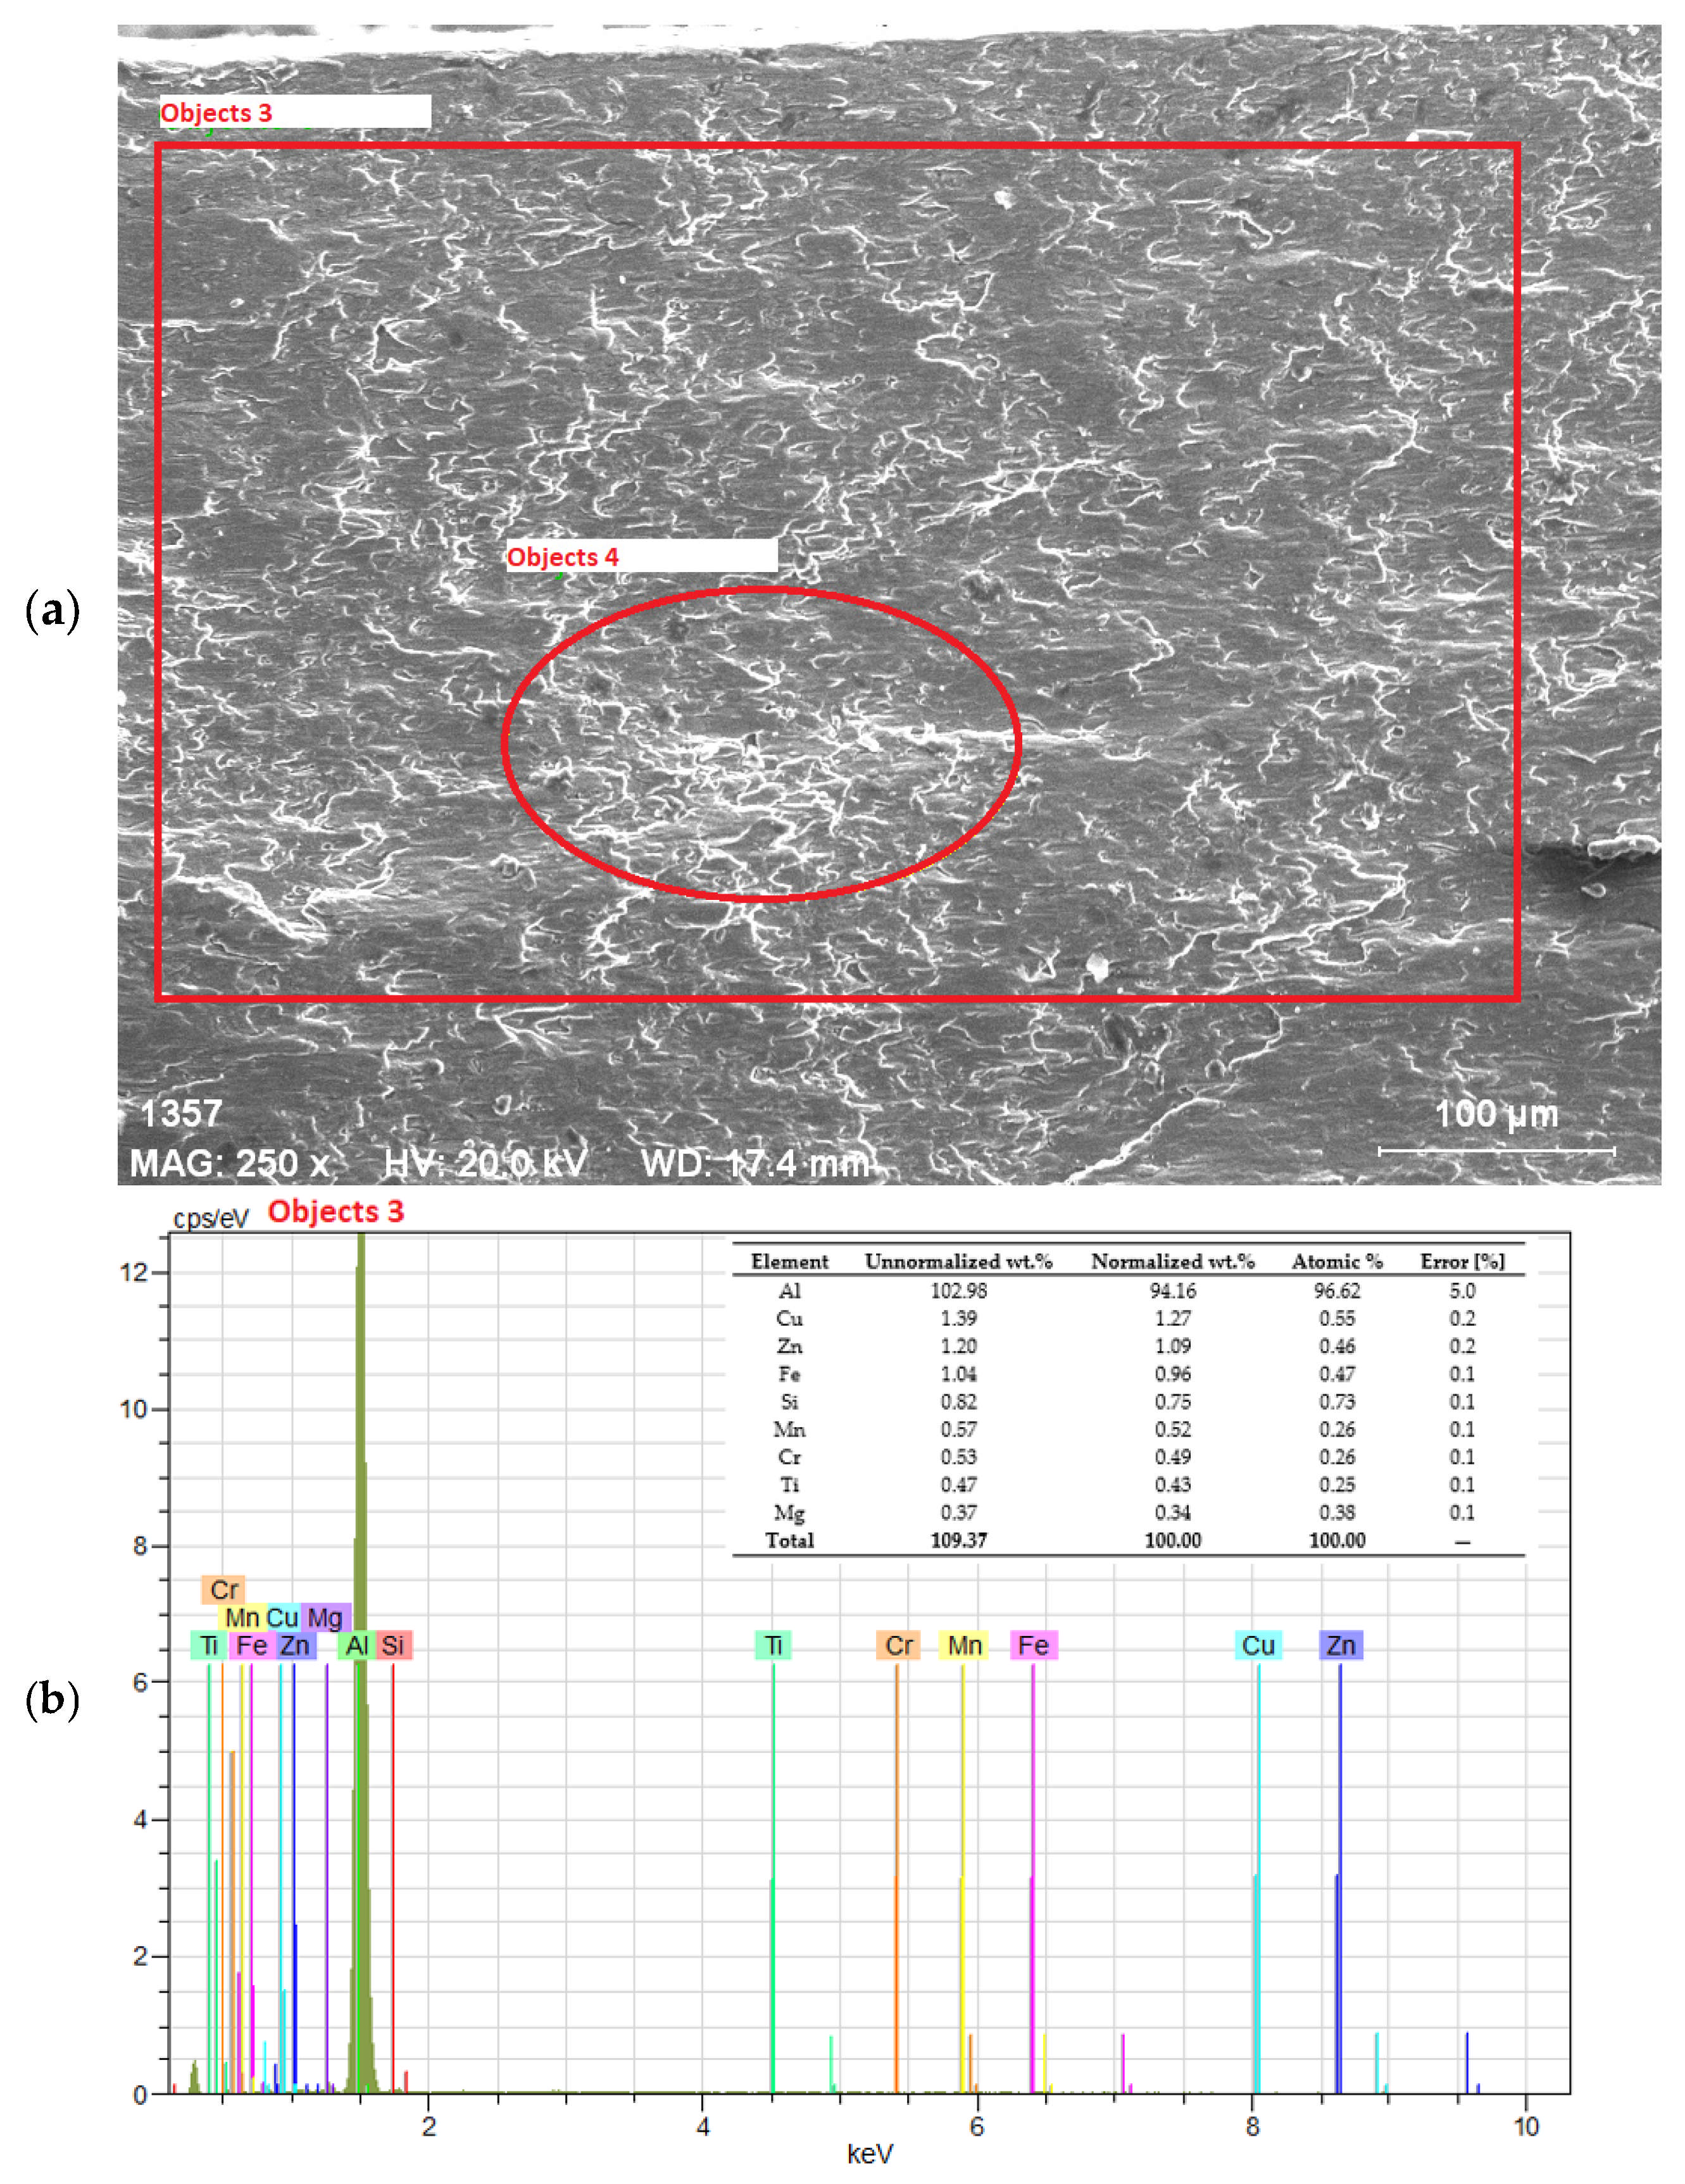
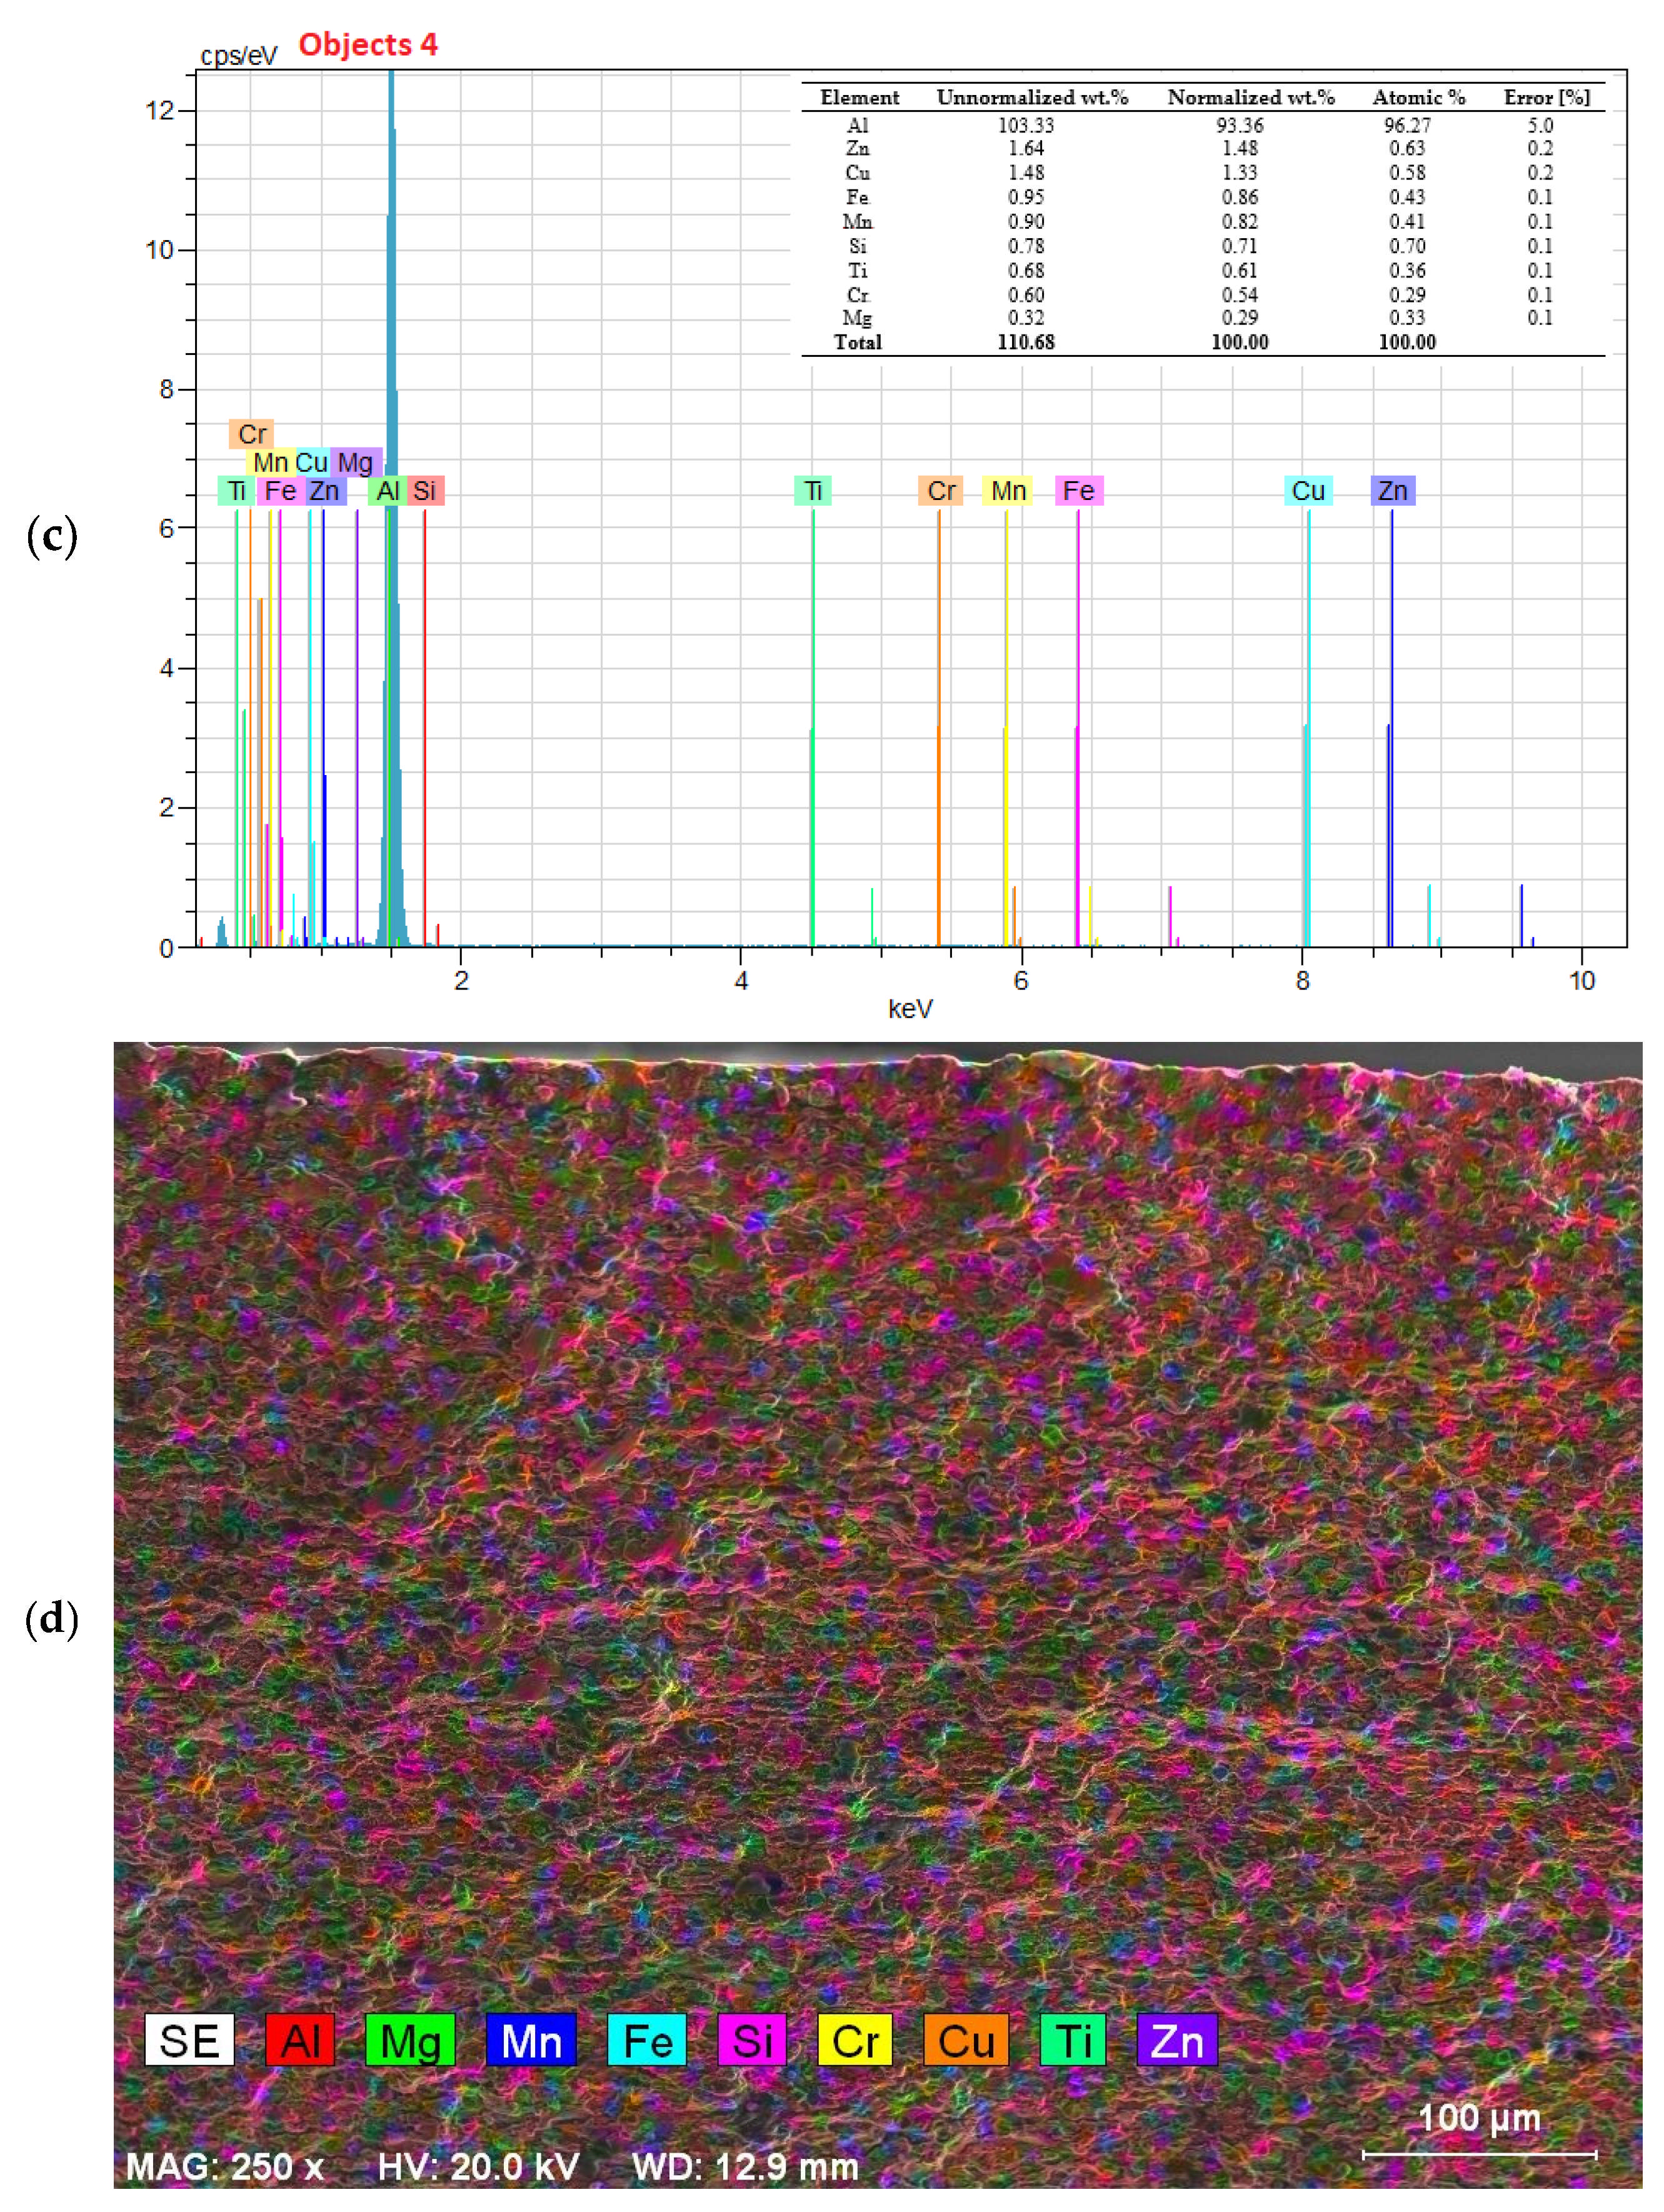
3.3. SEM-EDS Analysis and Elemental Characterization

To support the fractographic analysis, comprehensive SEM–EDS investigations were performed on selected fracture surfaces of the AW5754 and AW6082 specimens. The analysis included SEM imaging, point analyses, EDS spectra, and elemental mapping, as shown in Figure 8 and Figure 9.
In the EDS analysis of the AW5754 alloy (see Figure 8), it was determined that the matrix was largely composed of aluminum (Al) (91.6%). Magnesium (Mg), which was detected at a rate of approximately 3.0%, indicates the presence of Mg2Si precipitates in the alloy. These precipitates play an important role in improving the mechanical properties. Low amounts of iron (Fe) and silicon (Si) elements were also observed in the EDS spectra. In general, it is seen that Mg and Al are distributed homogeneously in the elemental distribution maps. This shows that the ductile fracture behavior is supported by microstructural homogeneity.
The EDS analysis of the AW6082 is presented in Figure 9. While the AW6082 alloy contains 94.2% aluminum, the presence of approximately 1.3% copper (Cu) is remarkable. This amount can cause the formation of Al2Cu intermetallic phases. The inhomogeneous distribution of Cu and Fe elements was observed in the EDS maps.

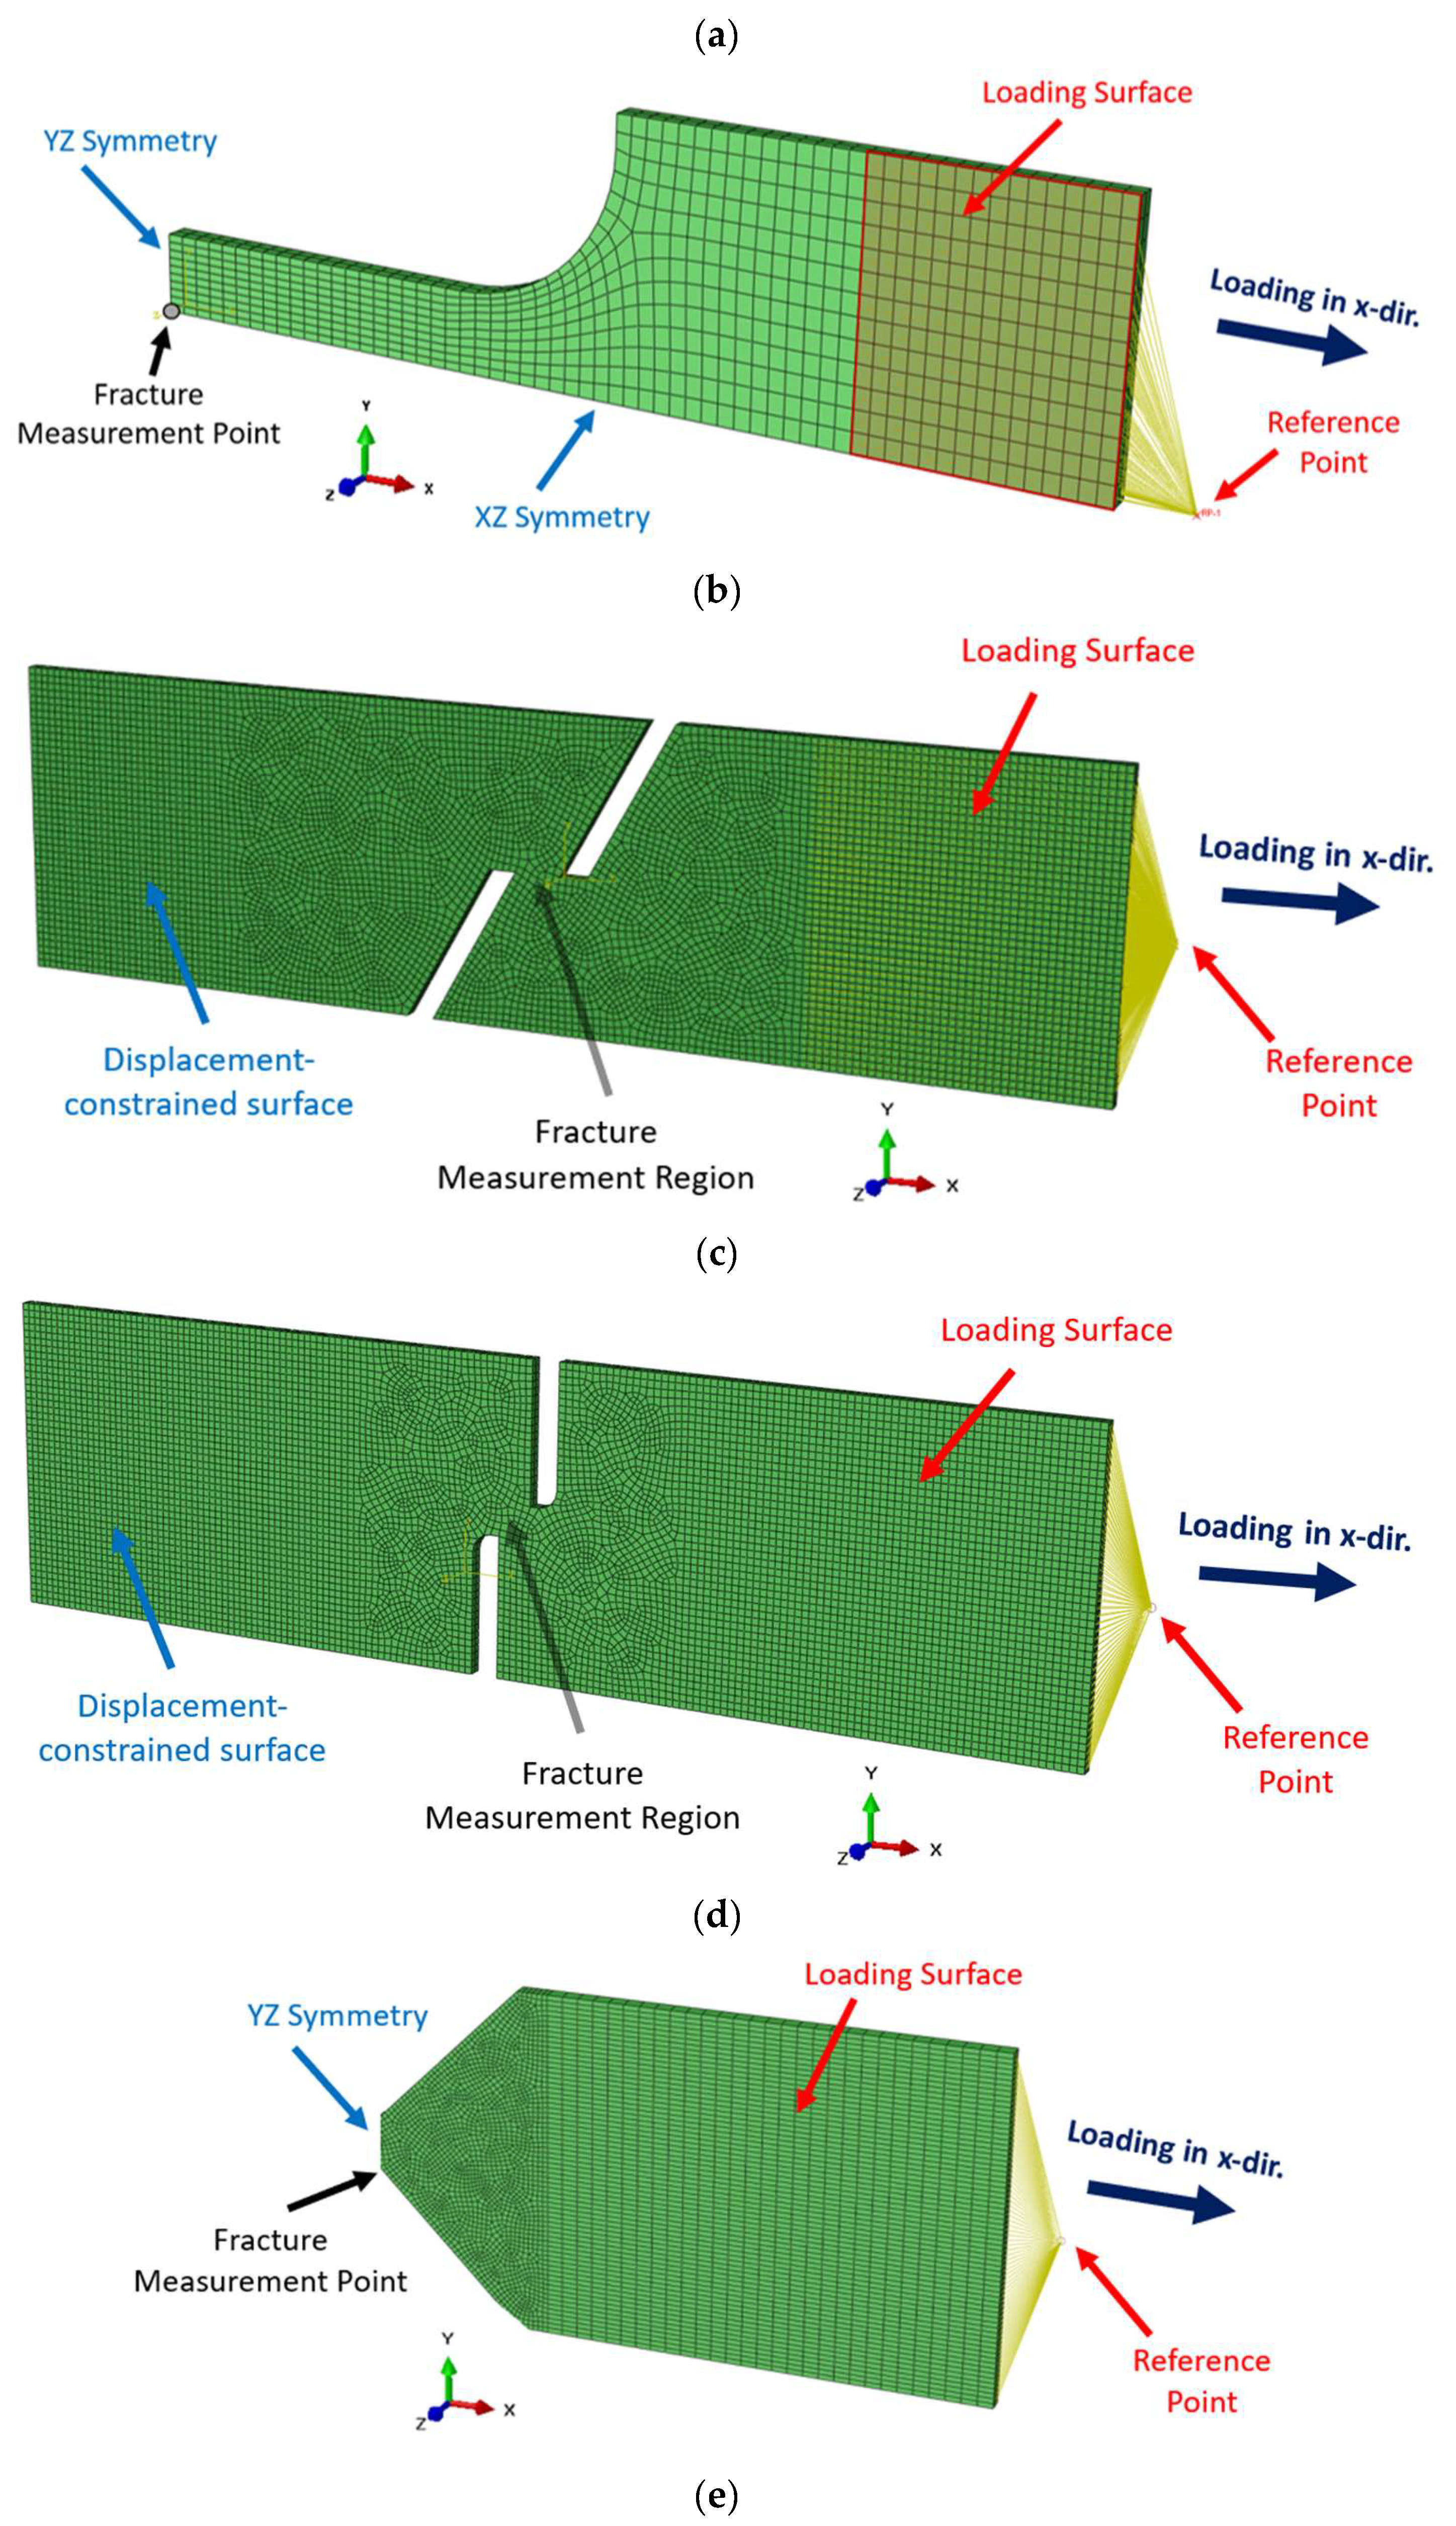
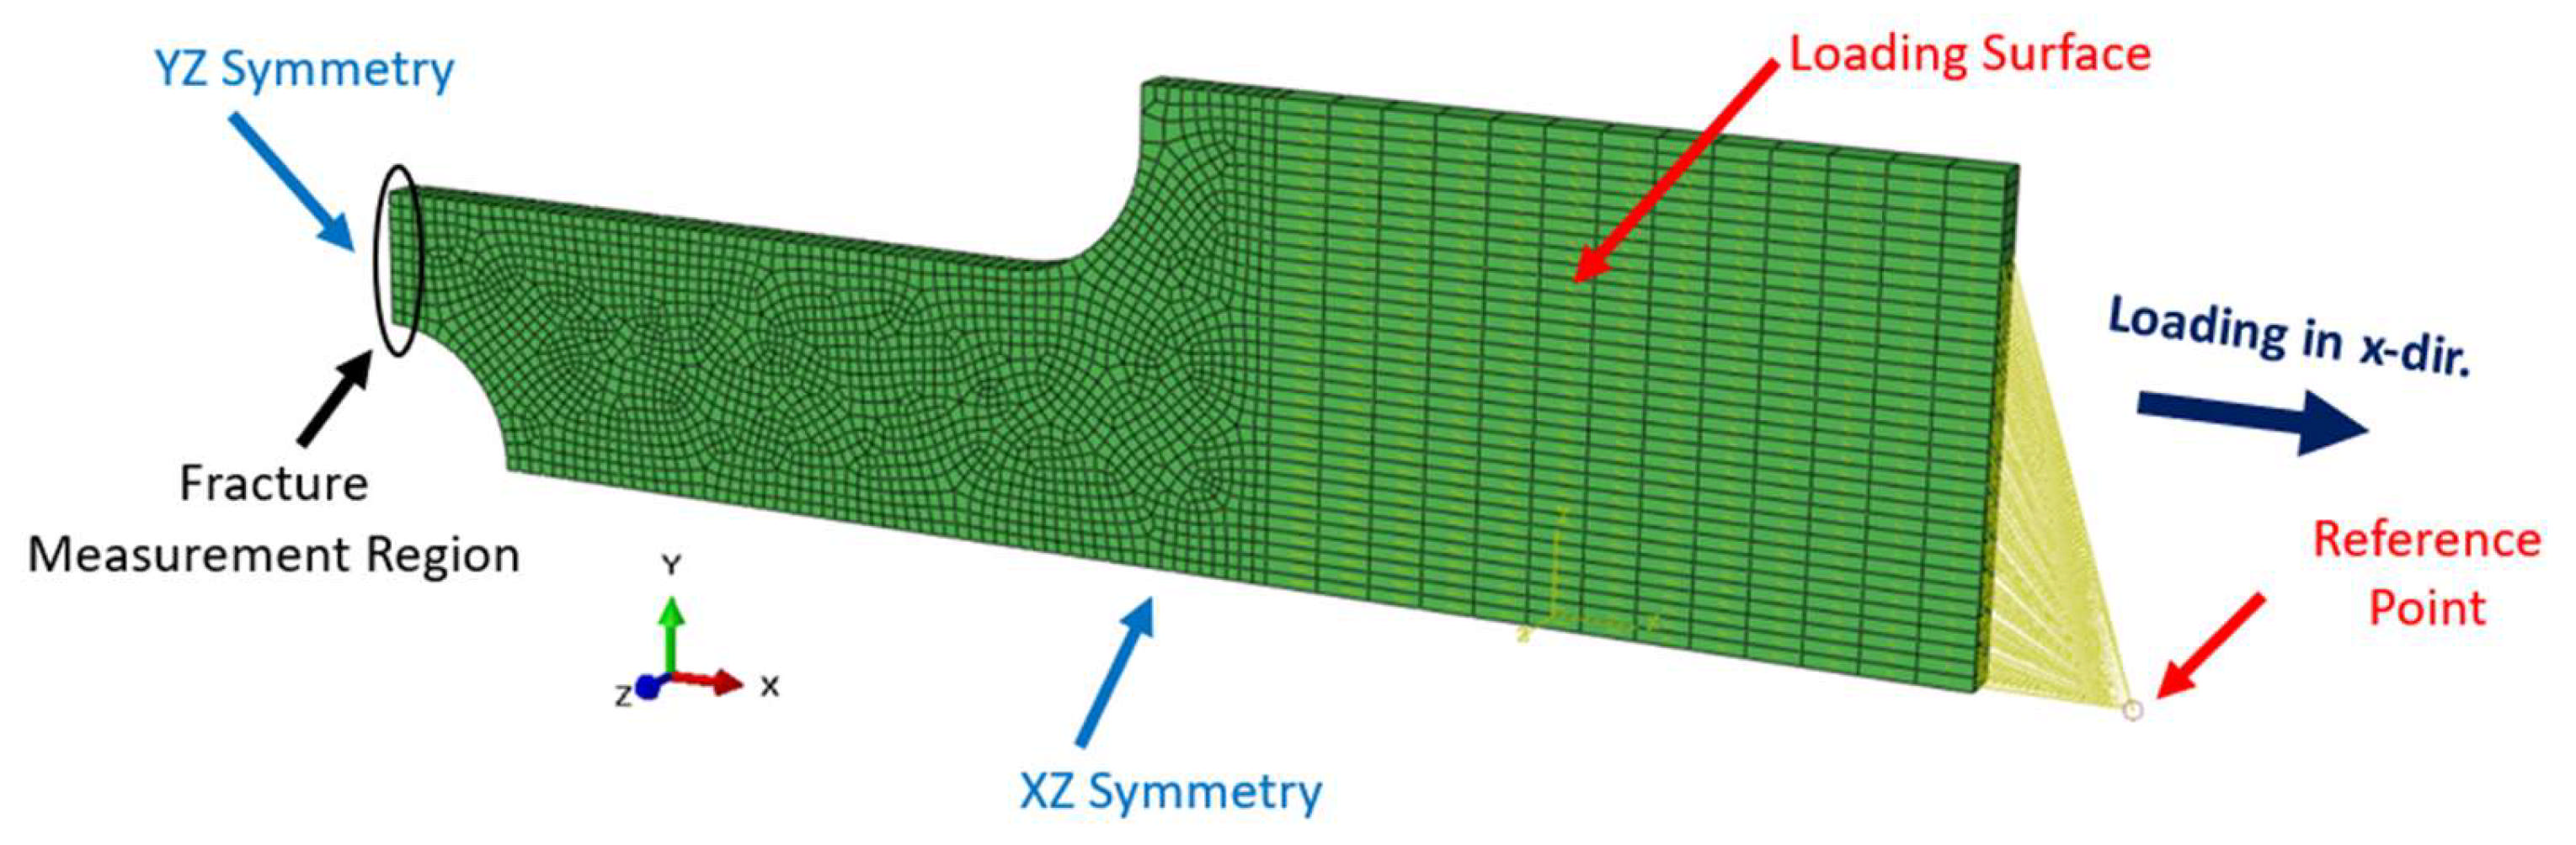
3.4. Finite Element Models

It is essential to determine the equivalent plastic strain at fracture and the evolution of the stress triaxiality factor in order to define the triaxiality locus of the material. Although initial values for these parameters can be theoretically estimated for simple specimen types using certain assumptions [24], a more accurate and realistic representation re-quires finite element (FE) analysis due to the highly nonlinear deformation behavior of the material under multiaxial loading, particularly beyond the onset of necking. FE models for each specimen type and loading scenario were developed in ABAQUS [43]. The accuracy of these models was first validated by a comparison with the corresponding test results. Once validated, the models were used to compute the equivalent plastic strain at fracture and the associated stress triaxiality factor at the regions where the fractures initiated.
The FE model calculated the stress triaxiality factor at each node using Equations (1)–(3). The equivalent plastic strain is a scalar measure of accumulated plastic deformation based on the von Mises yield criterion. It provides a single value that reflects the overall magnitude of plastic deformation by integrating the deviatoric components of the plastic strain tensor [43]. This quantity is computed incrementally as
ε p = 2 3 ε i j p ε i j p ,
where ε i j p denotes the components of the plastic strain increment tensor [43]. The total equivalent plastic strain is then obtained by accumulating this quantity over all increments. The equivalent plastic strain at fracture and the corresponding stress triaxiality factor were estimated by correlating the experimentally identified fracture initiation points with the same loading conditions in the FE simulations.
Figure 10a–e presents the FE models for Specimens I–V. The reference points shown in the figures represent the control nodes of the models, through which a monotonically increasing axial displacement was applied along the x-direction. These points were kinematically coupled to the loading surfaces, which simulated the contact interface between the specimen and the grips of the tensile testing machine used in the experiments. This coupling ensures a uniform distribution of the applied displacement across the surface. Additionally, identifying the fracture measurement point—which indicates the location where the fracture initiates—is critical for each specimen type. The triaxiality factor and equivalent plastic strain at fracture were calculated at these measurement regions in the FE analysis.
For all specimens, the FE models were constructed using a three-dimensional eight-node linear brick element with reduced integration and hourglass control (C3D8R) in ABAQUS. This element type provides a good balance between computational efficiency and numerical accuracy, particularly for problems involving large deformations. The reduced integration scheme minimizes the computational cost, while the hourglass control helps prevent the numerical instabilities typically associated with under-integrated elements [44].
A mesh convergence analysis was performed by testing element sizes ranging from 1.0 mm to 0.25 mm for all specimen types. The convergence behavior of key quantities—such as equivalent plastic strain and stress triaxiality—was evaluated together with the corresponding CPU times. Relative errors were calculated by using the 0.25 mm mesh as the reference. Although the results were extracted from the same physical location, the node numbers differed due to variations in the mesh density. This process was repeated for multiple nodes and various response variables. As a representative example (for Specimen II), a comparison is presented in Table 1. The results confirmed that a mesh size of 0.5 mm provides a satisfactory balance between accuracy and computational efficiency.
For Specimens I, IV, and V (Figure 10a, 10d, and 10e, respectively), symmetric models were used to improve the computational efficiency, as these specimens exhibit one or two planes of symmetry, which are indicated in the figures. For the remaining specimens (II and III), the surfaces on which the displacement constraints were applied are also highlighted.
The elastic modulus, yield stress, and nonlinear hardening behavior of the materials were defined for all specimen types based on the data shown in Figure 5a,b, which were originally obtained from tests on Specimen I. It should be noted that the developed FE models do not incorporate a damage model and, as such, are unable to predict the onset of fracture. Consequently, the fracture initiation points were determined through experimental data and used as the termination criteria for the simulations.
Various output parameters were extracted during the simulations, as will be discussed in the following section. As an illustrative example, Figure 11a–e shows the distributions of equivalent plastic strain at the time of fracture, determined based on the corresponding experimental results.

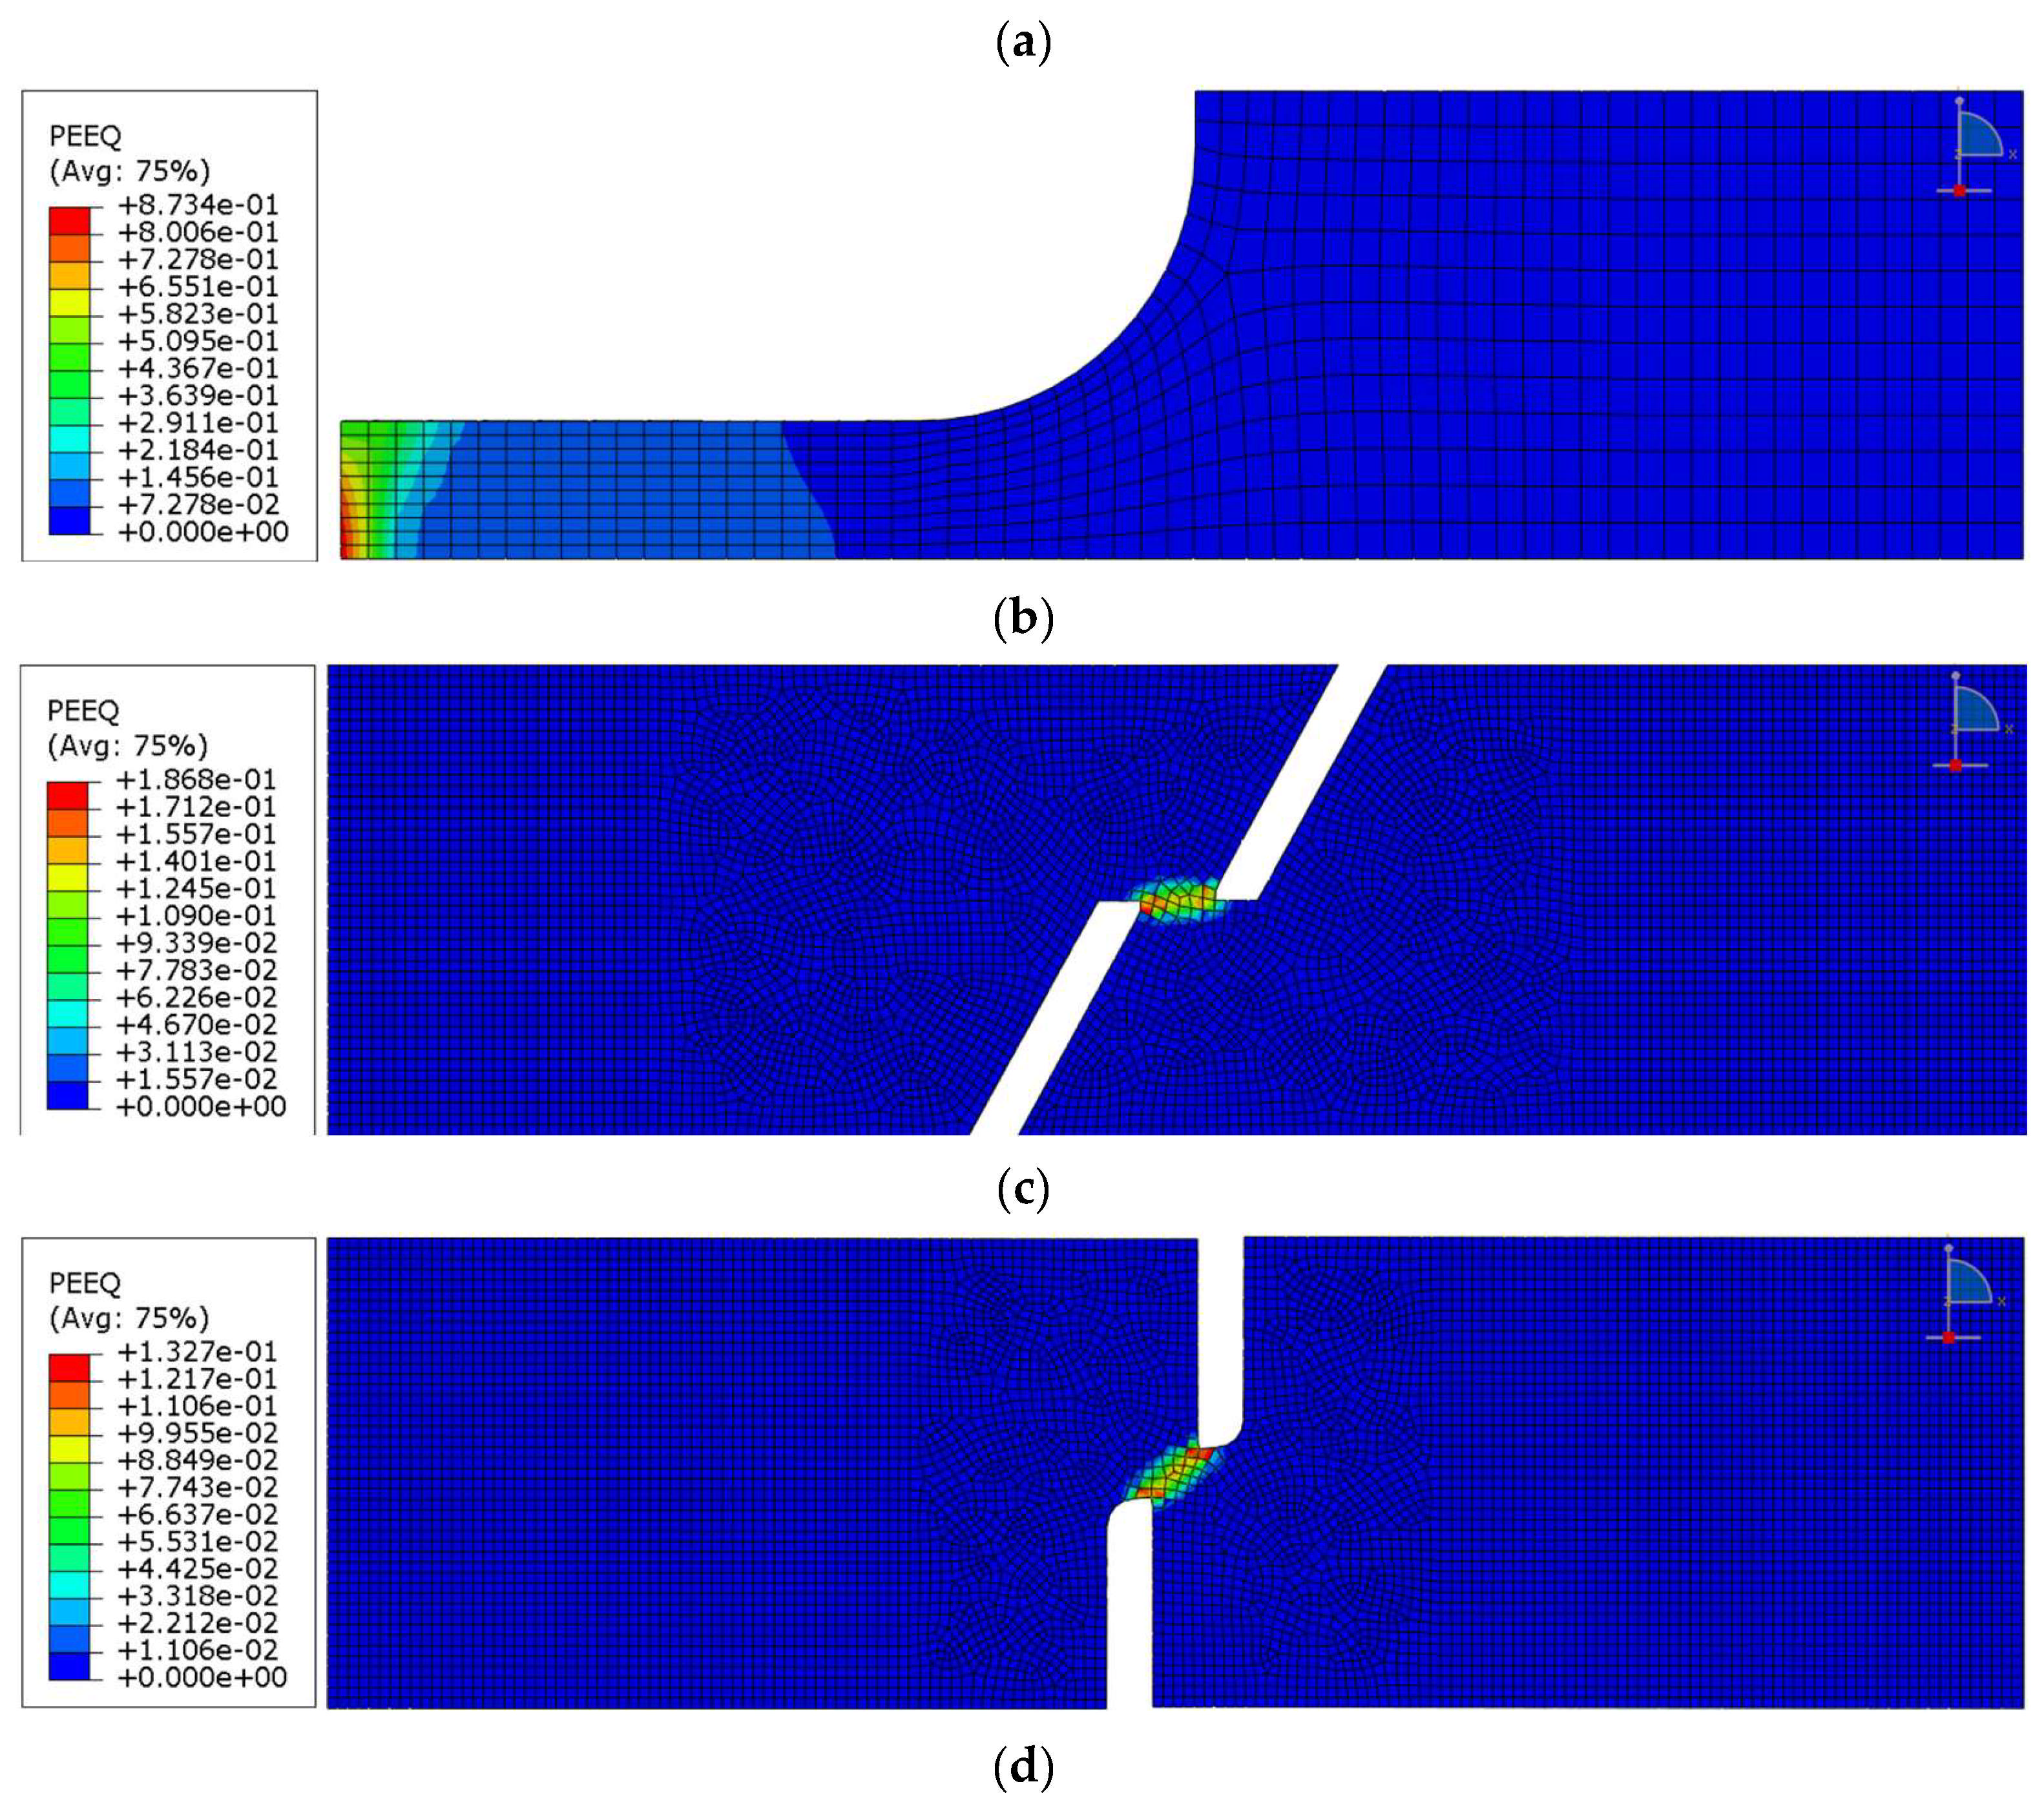
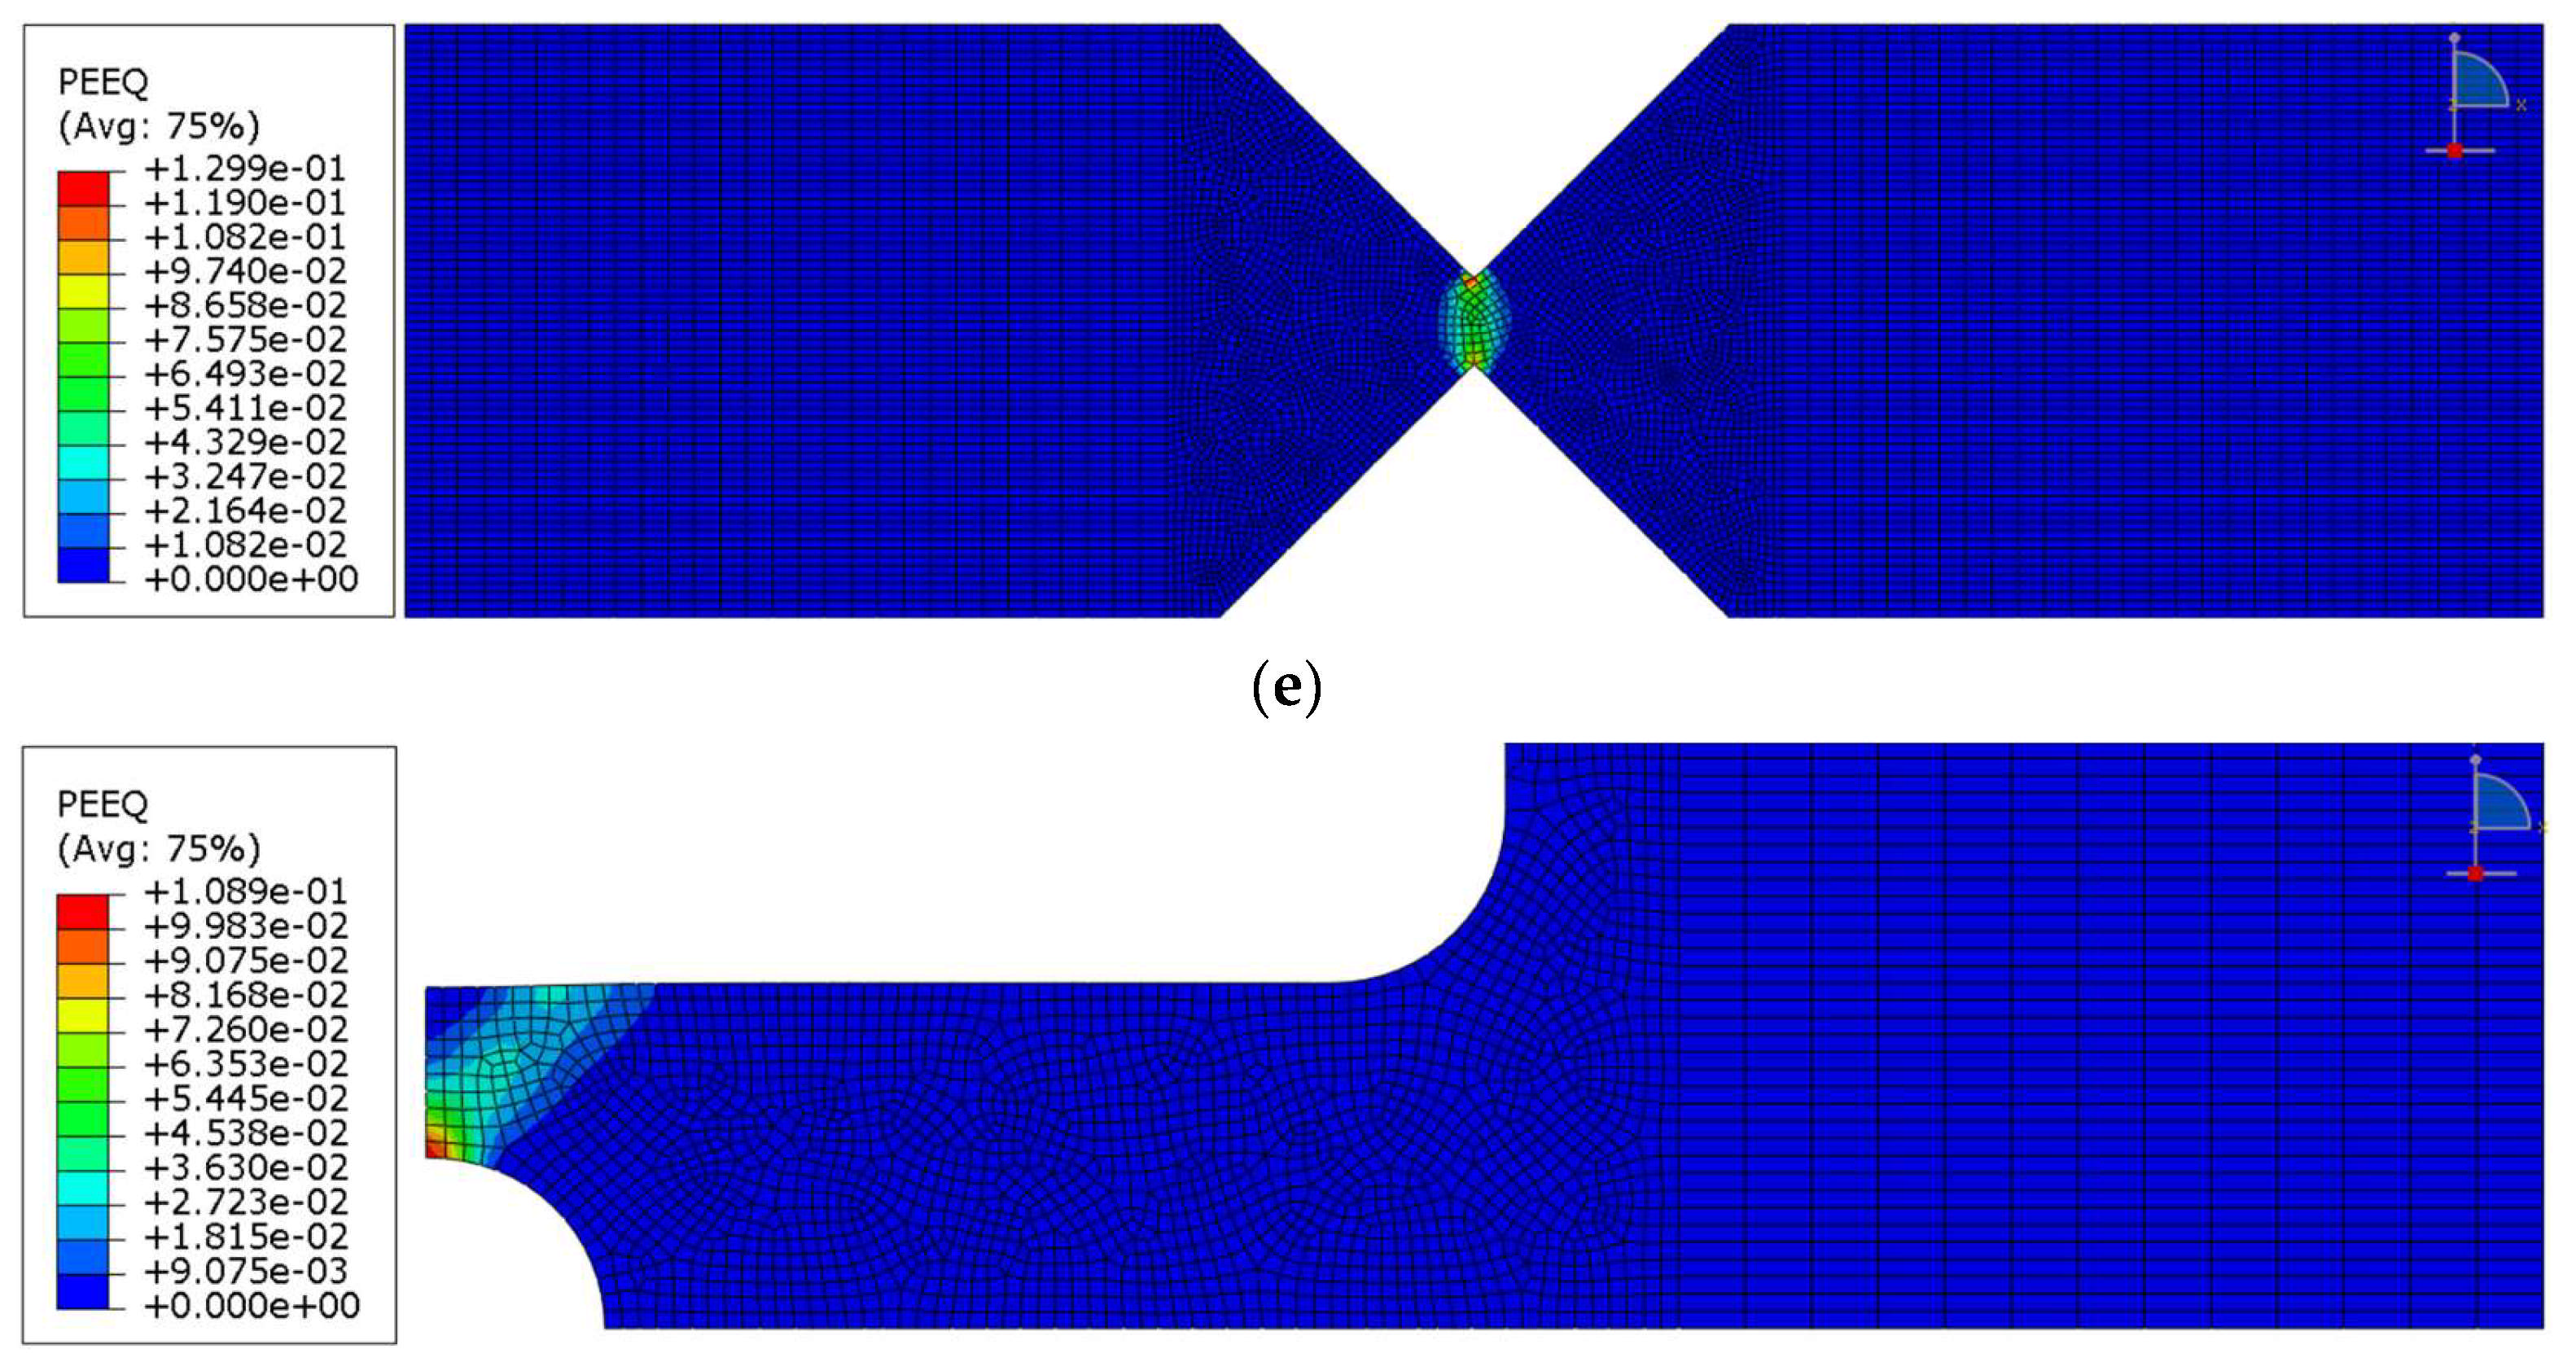
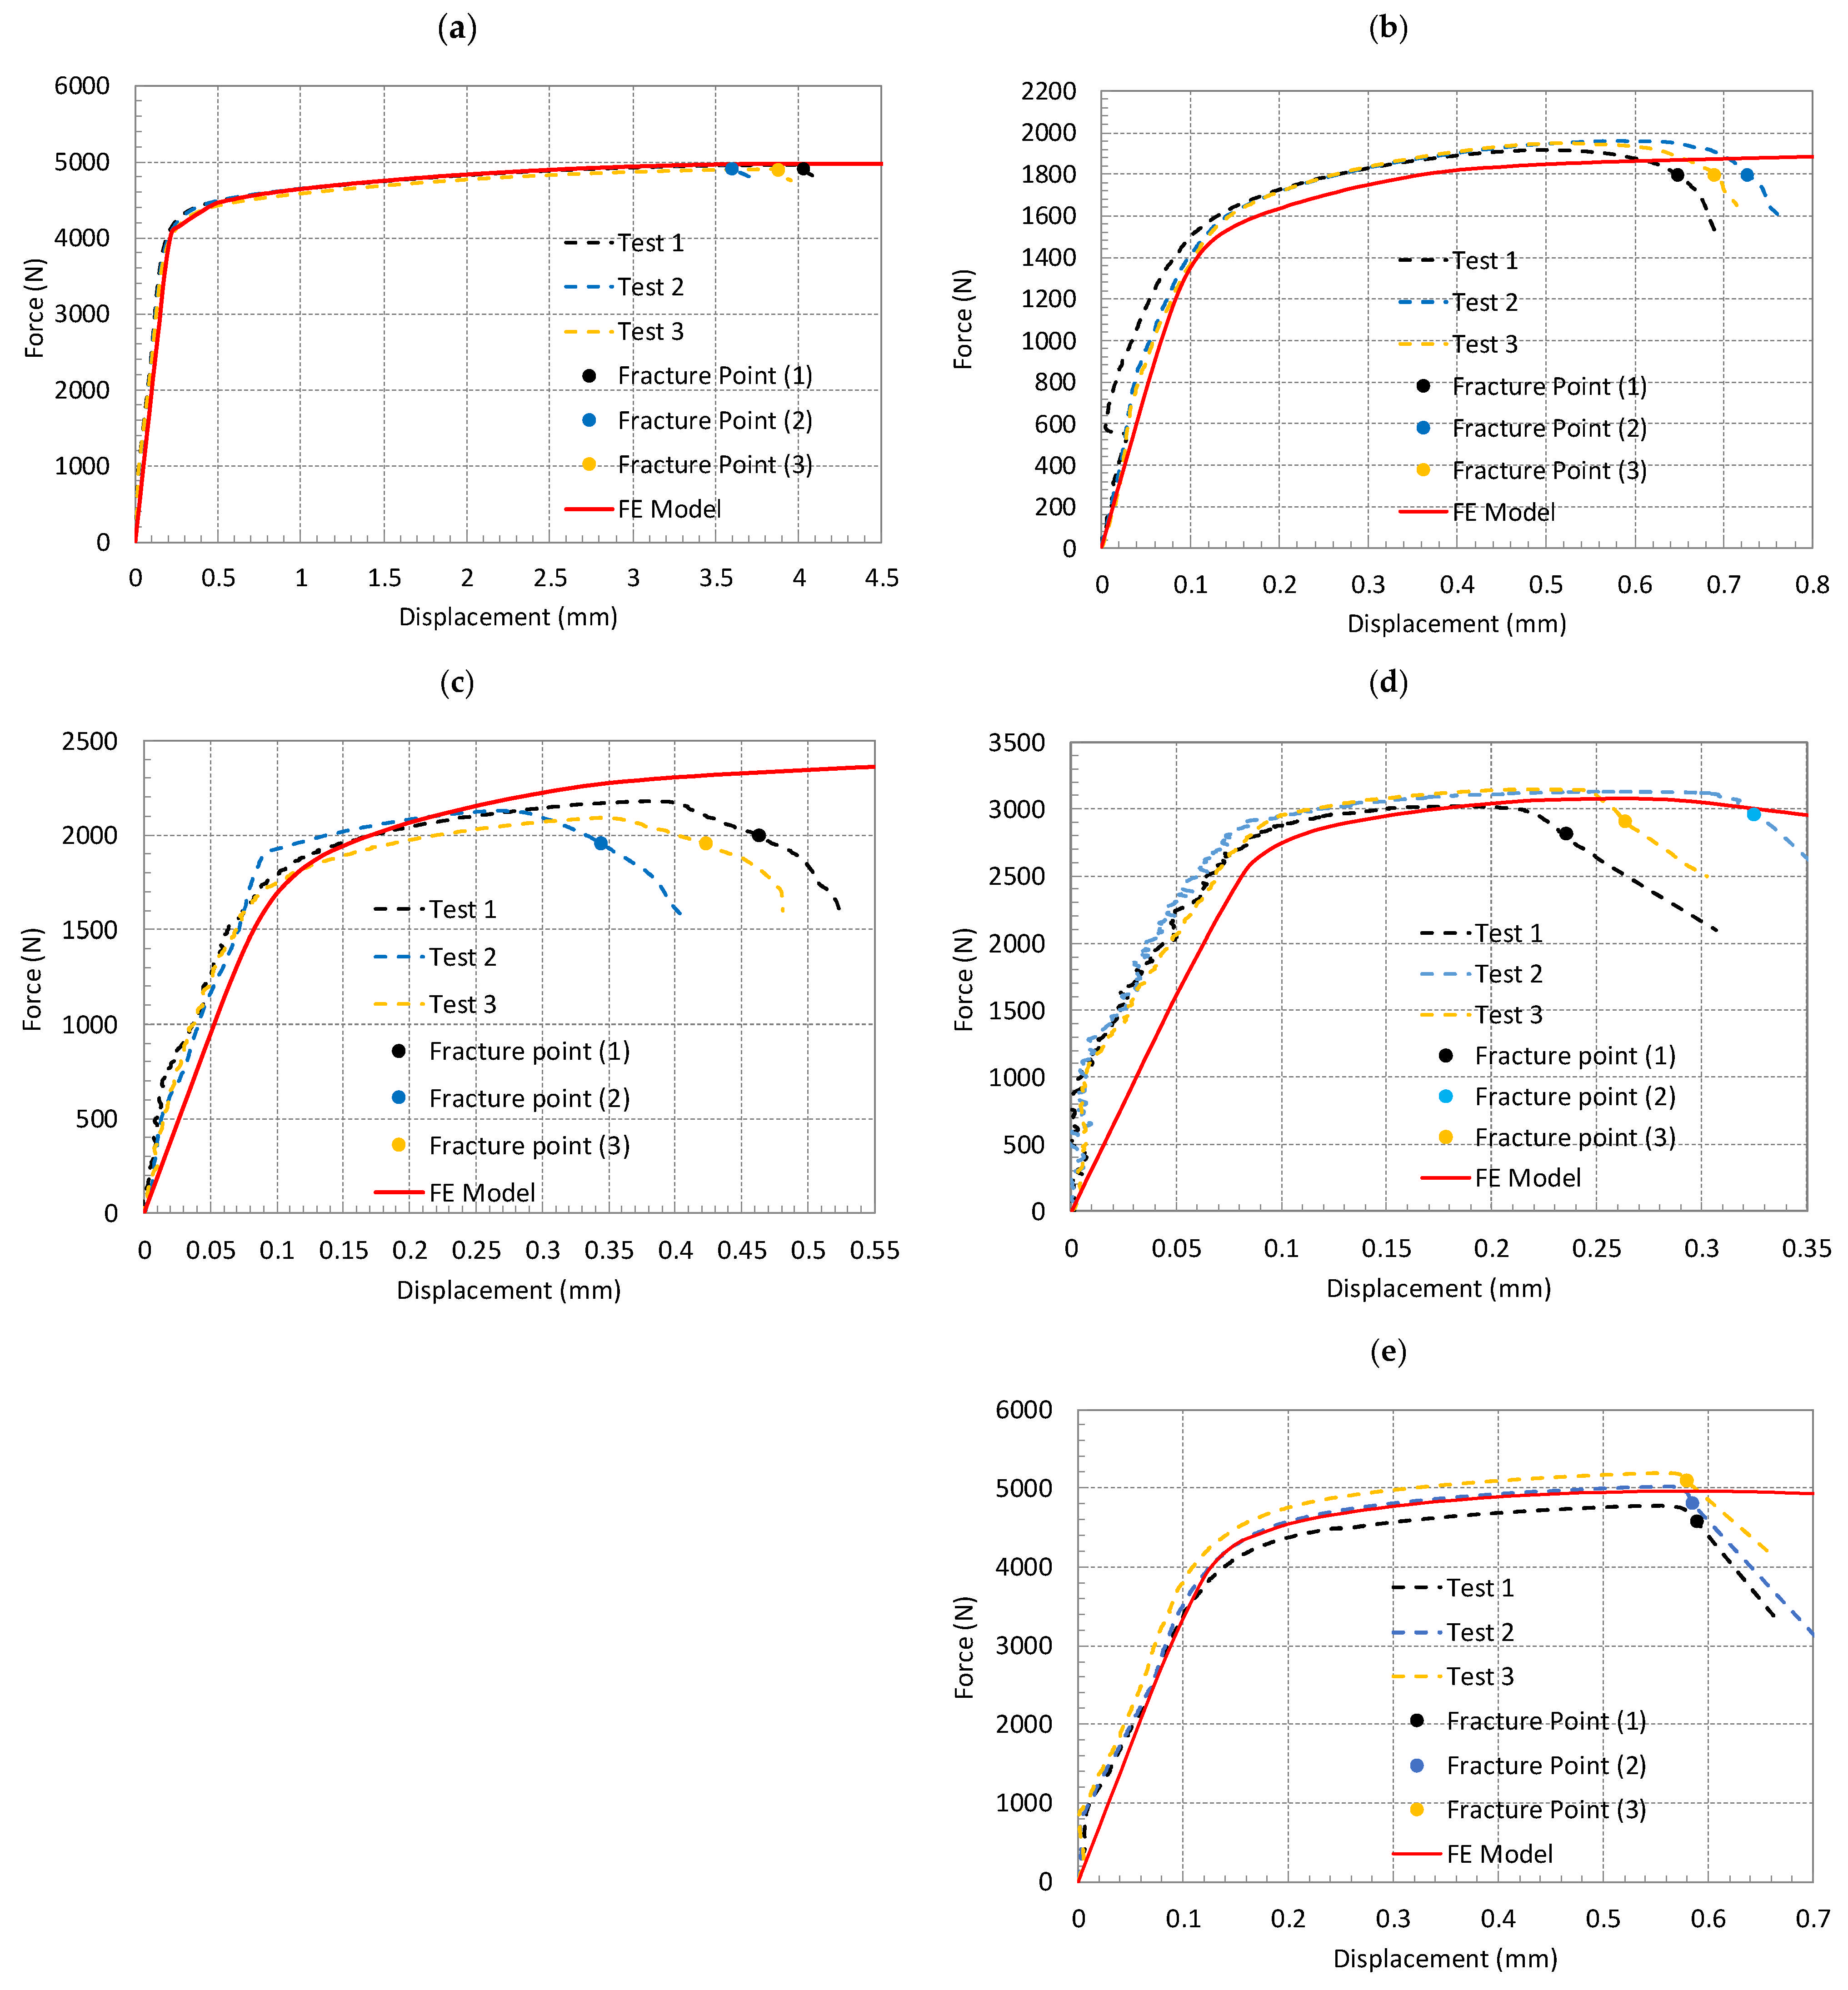
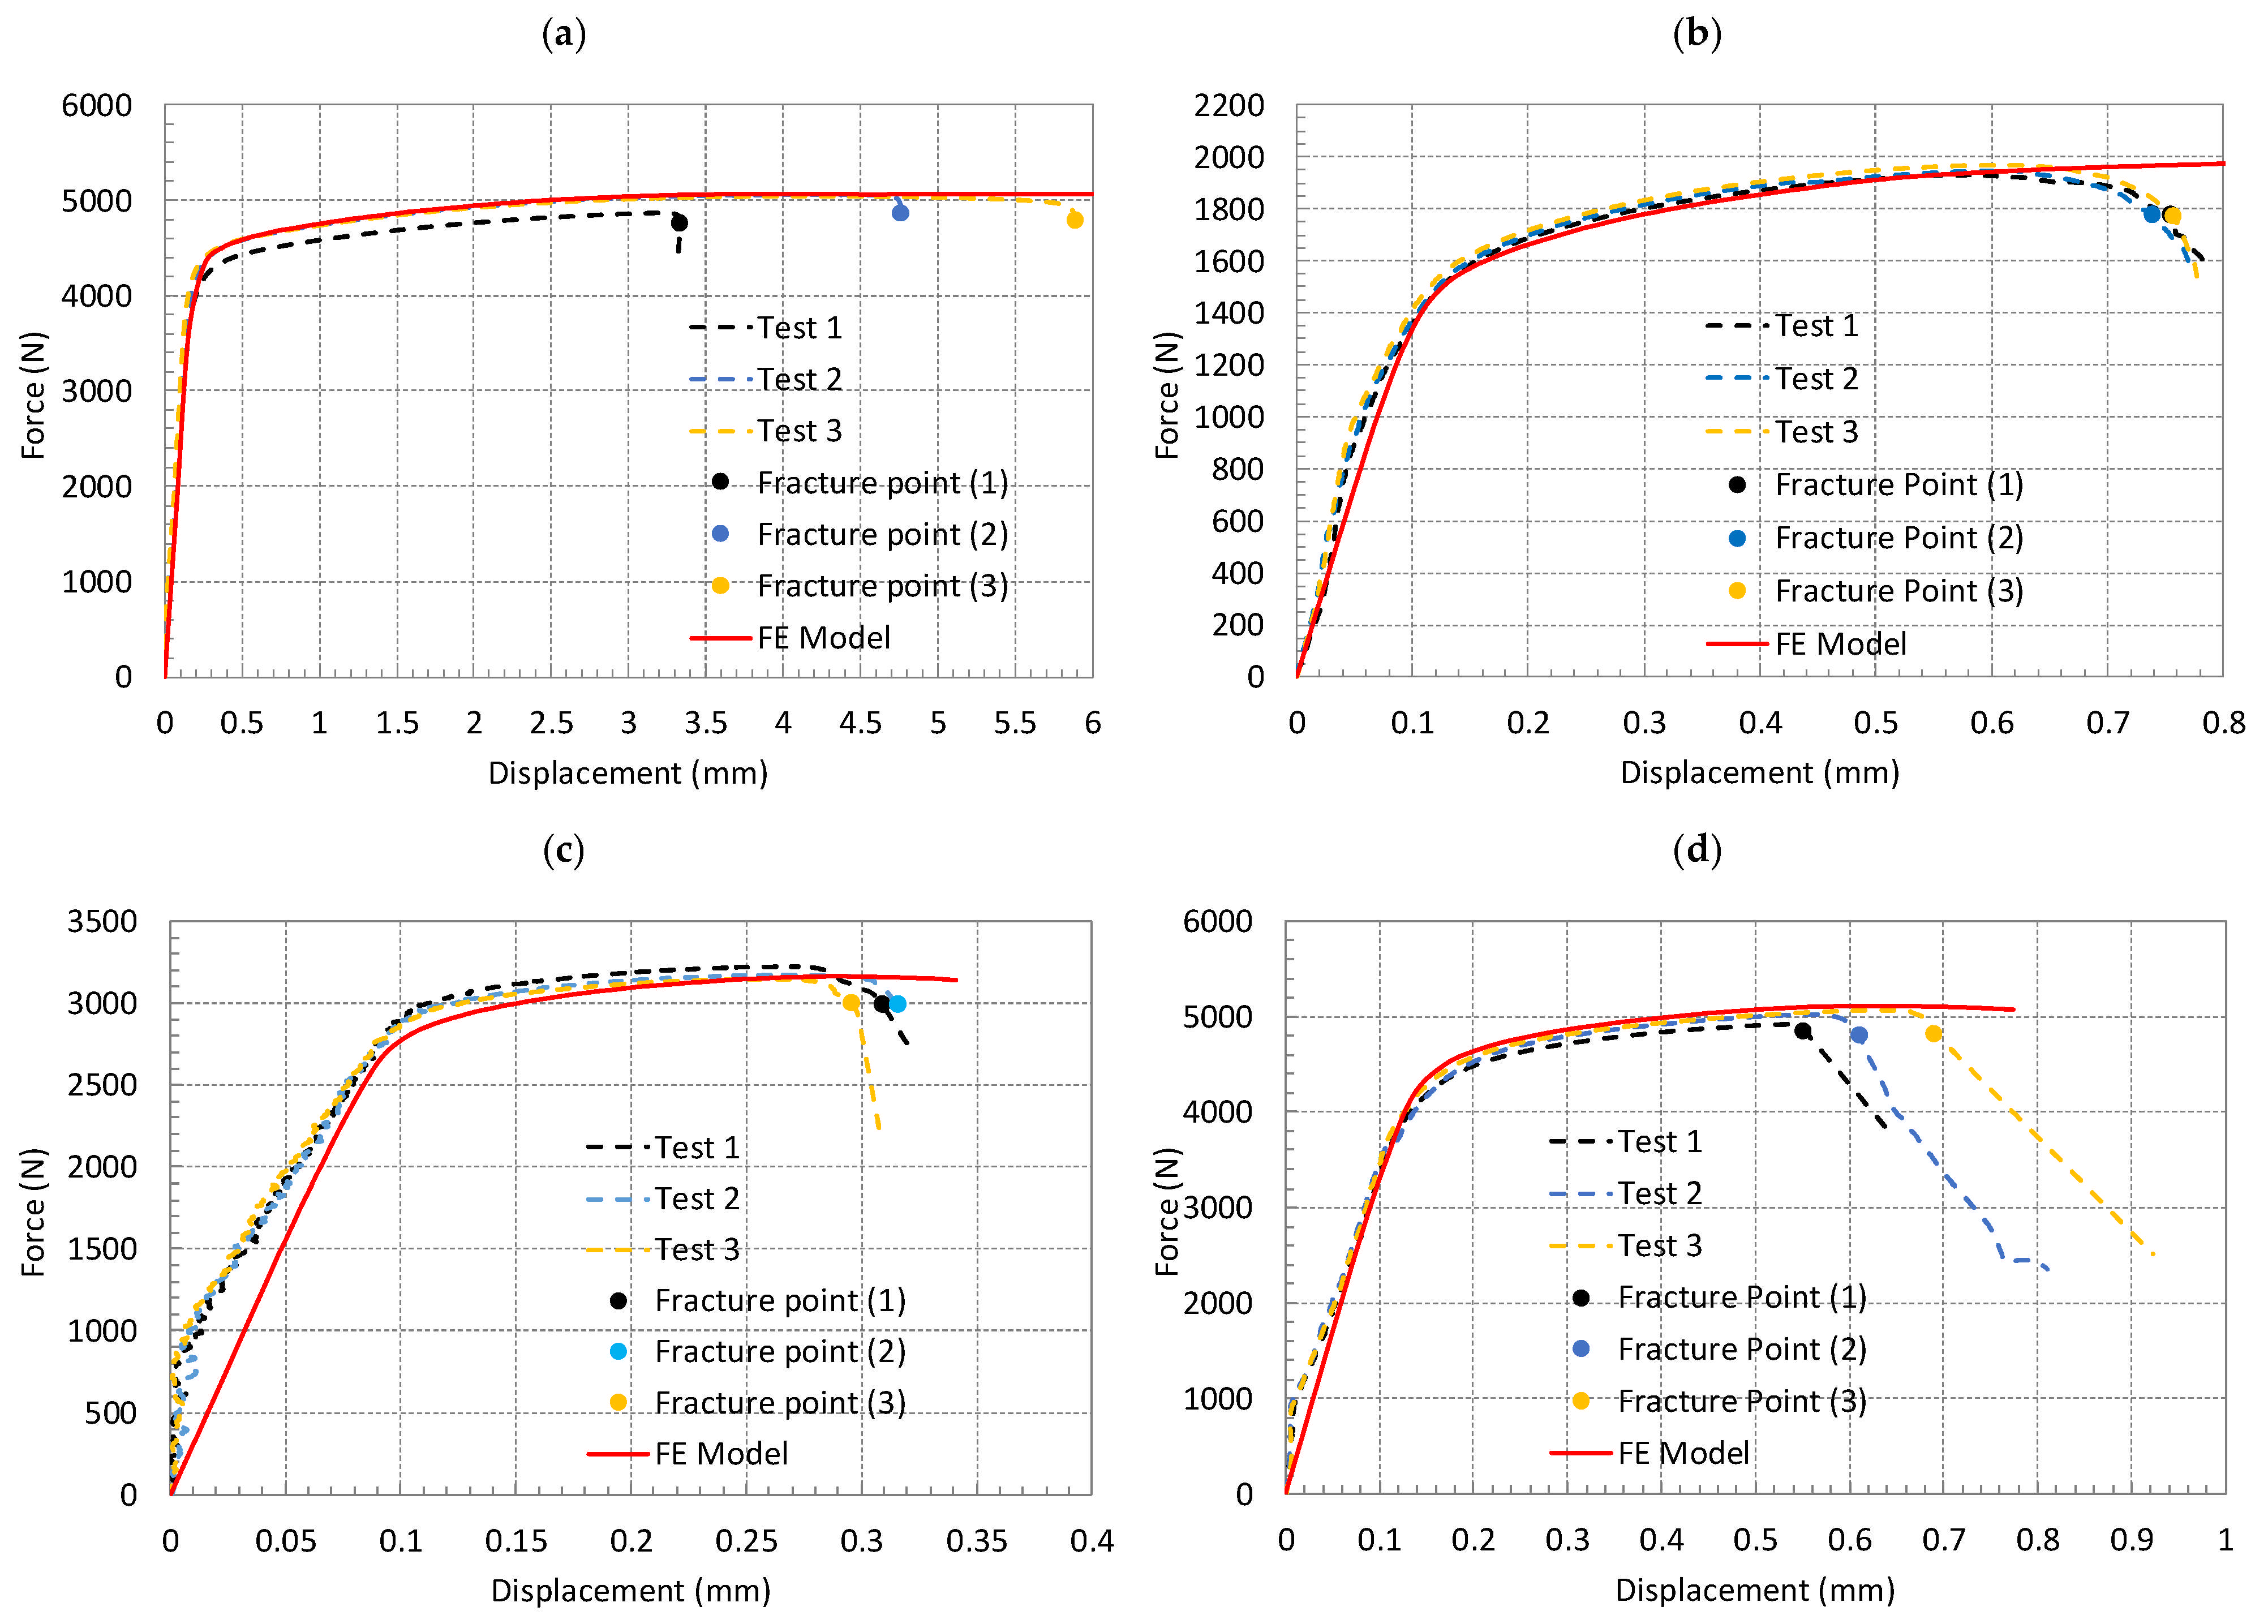
3.5. FE Simulation Validation and Fracture Initiation

Finite element (FE) simulations were performed, and the resulting force–displacement curves were compared with the experimental data, as shown in Figure 12, Figure 13 and Figure 14. These figures correspond to the material AW5754 tested at 2 × 10⁻⁴ s−1 and the material AW6082 tested at 2 × 10⁻⁴ s−1 and 4 × 10⁻⁴ s−1. A similar comparison for AW5754 at 4 × 10⁻⁴ s−1 has already been presented in [25]; therefore, it is not repeated here. In each figure, the dashed lines represent the experimental data, while the solid lines correspond to the FE simulation results. It should also be noted that the experimental results for Specimen III of AW6082 at 4 × 10⁻⁴ s−1 were excluded due to a noticeable misalignment and asymmetric deformation observed during testing. These issues led to inconsistent strain localization and non-uniform fracture development, which deviated significantly from the expected behavior under the intended loading conditions. Hence, the recorded data could not be considered reliable for a comparative evaluation with the FE simulations.
The experimental force–displacement data reflect the force applied and the axial de-formation measured by the extensometer. In the FE models, the displacements were extracted from the same locations as those used in the experiments to ensure a direct and meaningful comparison. These simulation results are plotted alongside the experimental data in the figures.
Overall, the FE simulations show good agreement with the experimental results, confirming the validity of the models. However, for Specimens III and IV, the agreement is slightly less accurate under certain loading conditions. This discrepancy is believed to result from the more complex geometry and stress triaxiality distributions in these specimens, which make the fracture behavior more challenging to simulate with high reliability. It is also important to emphasize that the current FE models do not incorporate any damage formulation; therefore, they are incapable of predicting the onset of fracture. Instead, the fracture initiation points were identified experimentally, and these locations were used as the termination criteria in the simulations. Following this validation, the FE models were utilized to establish the relationship between the equivalent plastic strain at fracture and the corresponding stress triaxiality factor.

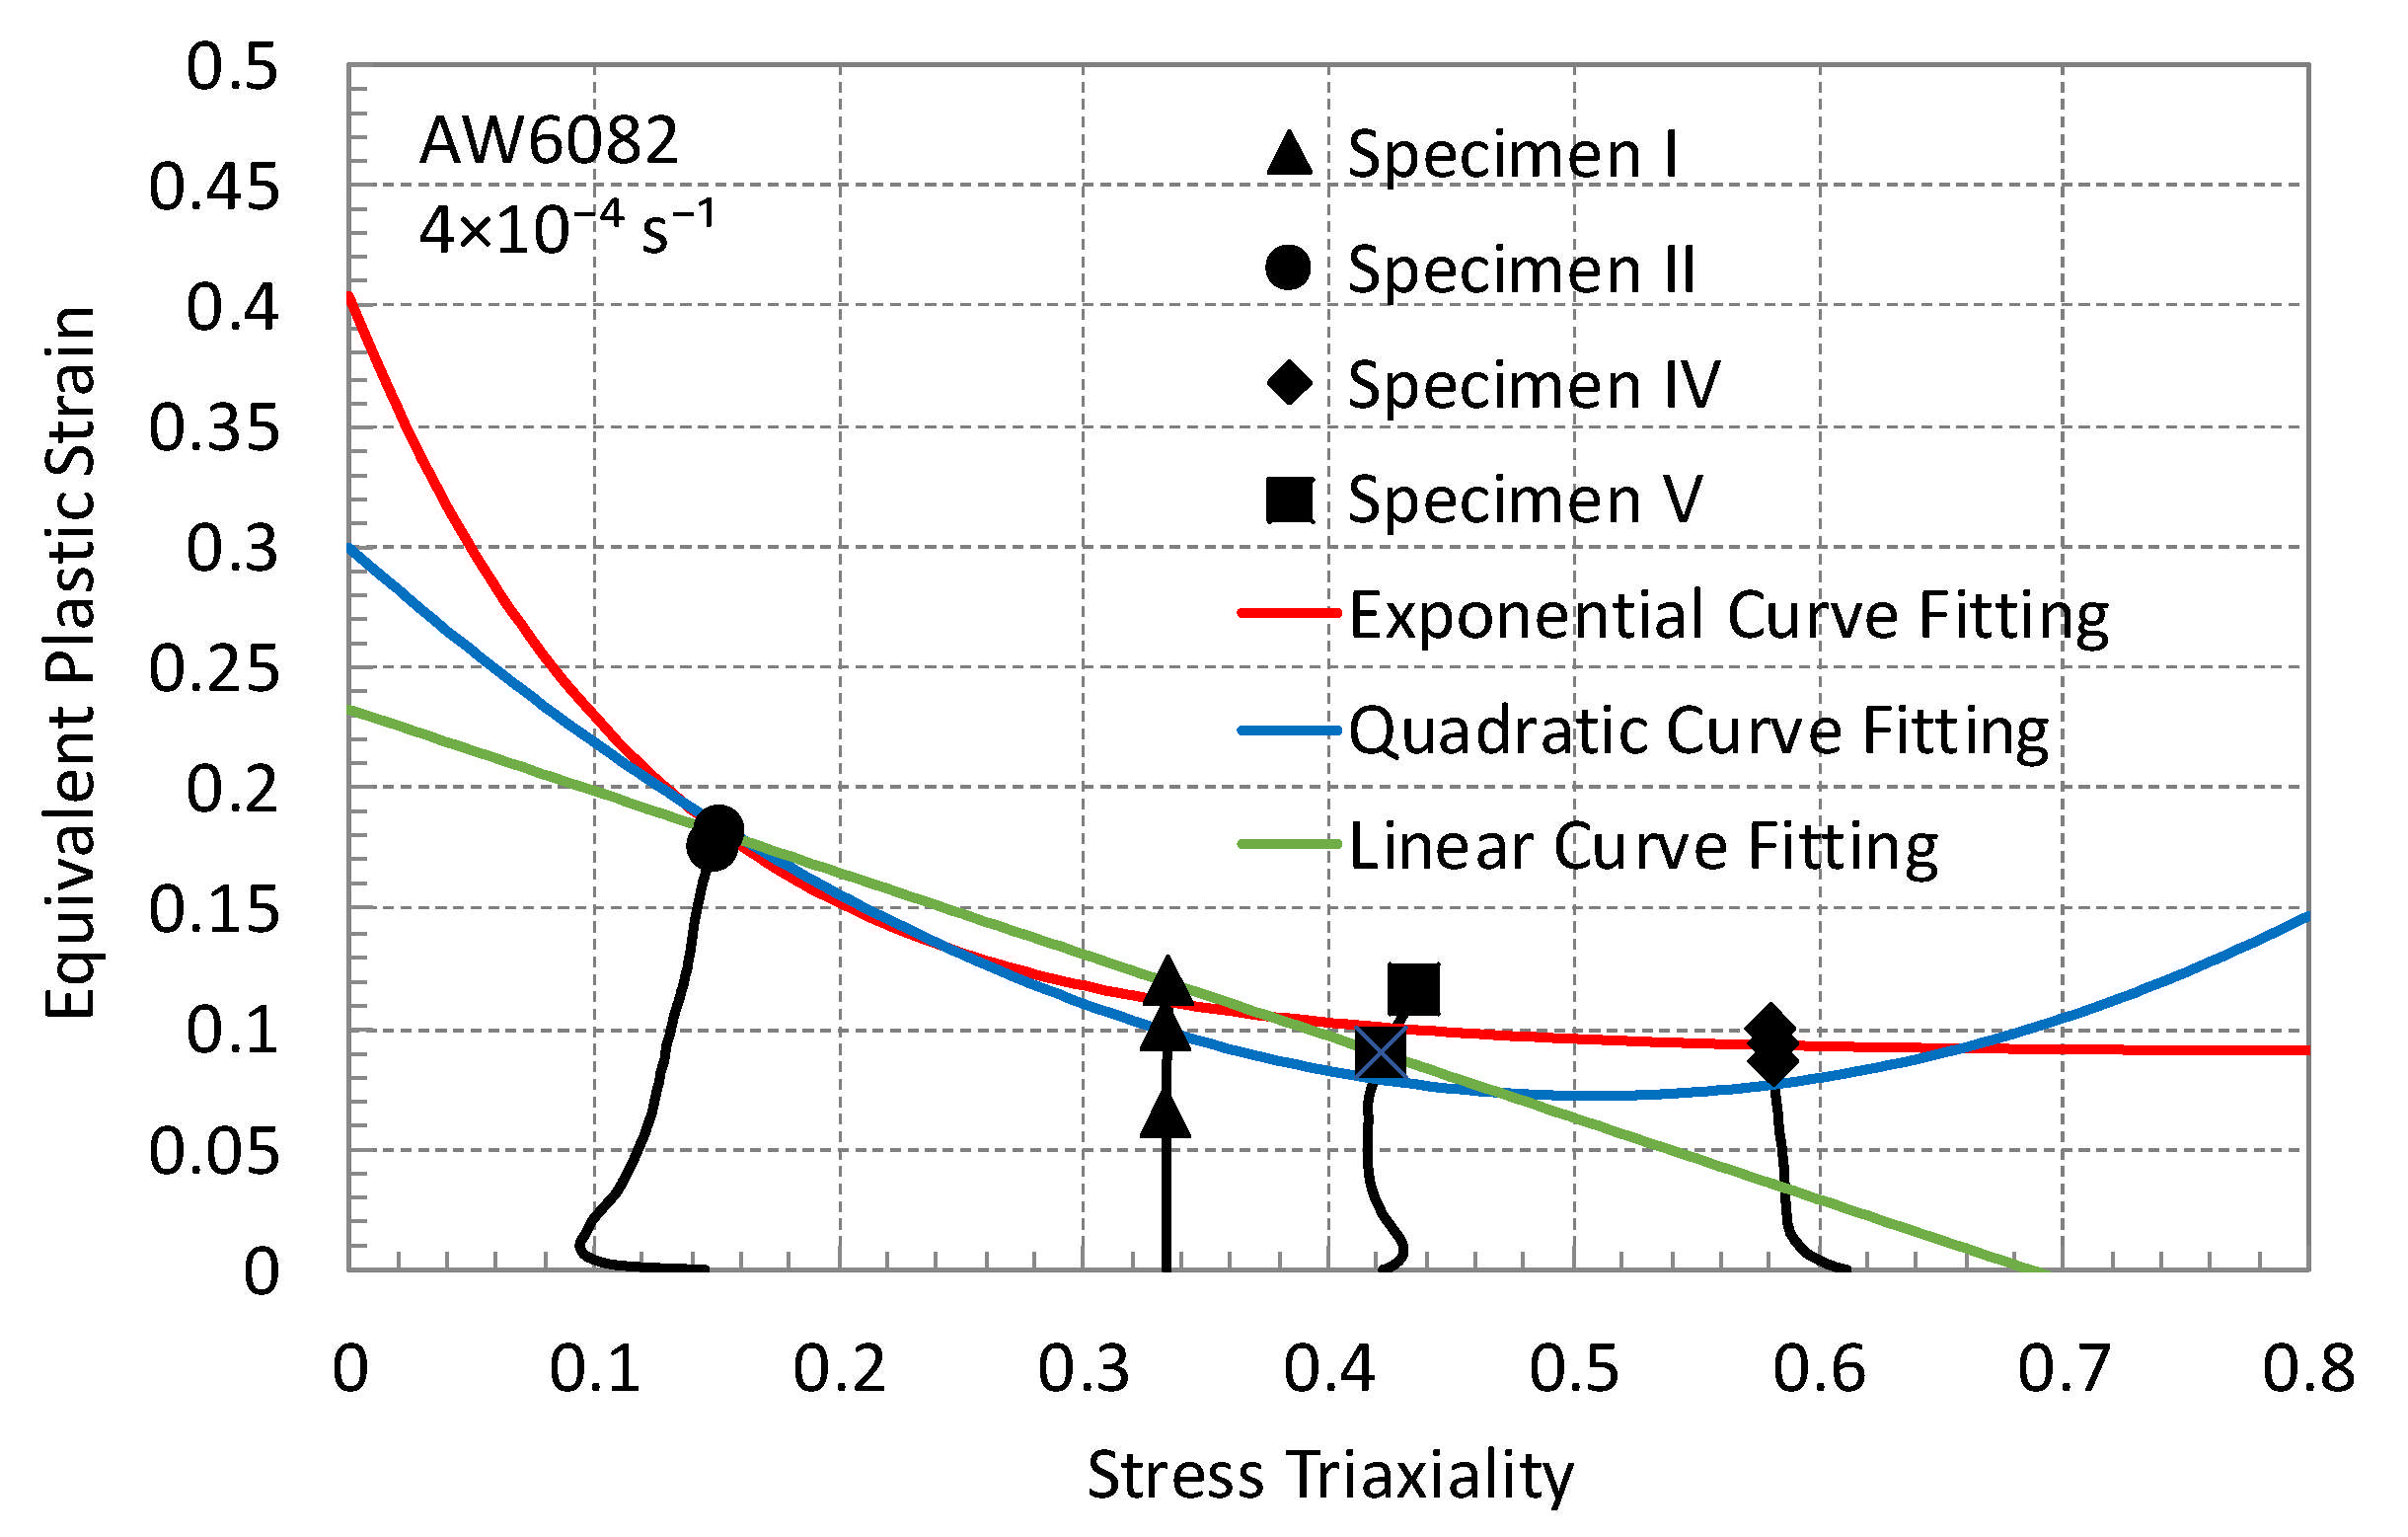
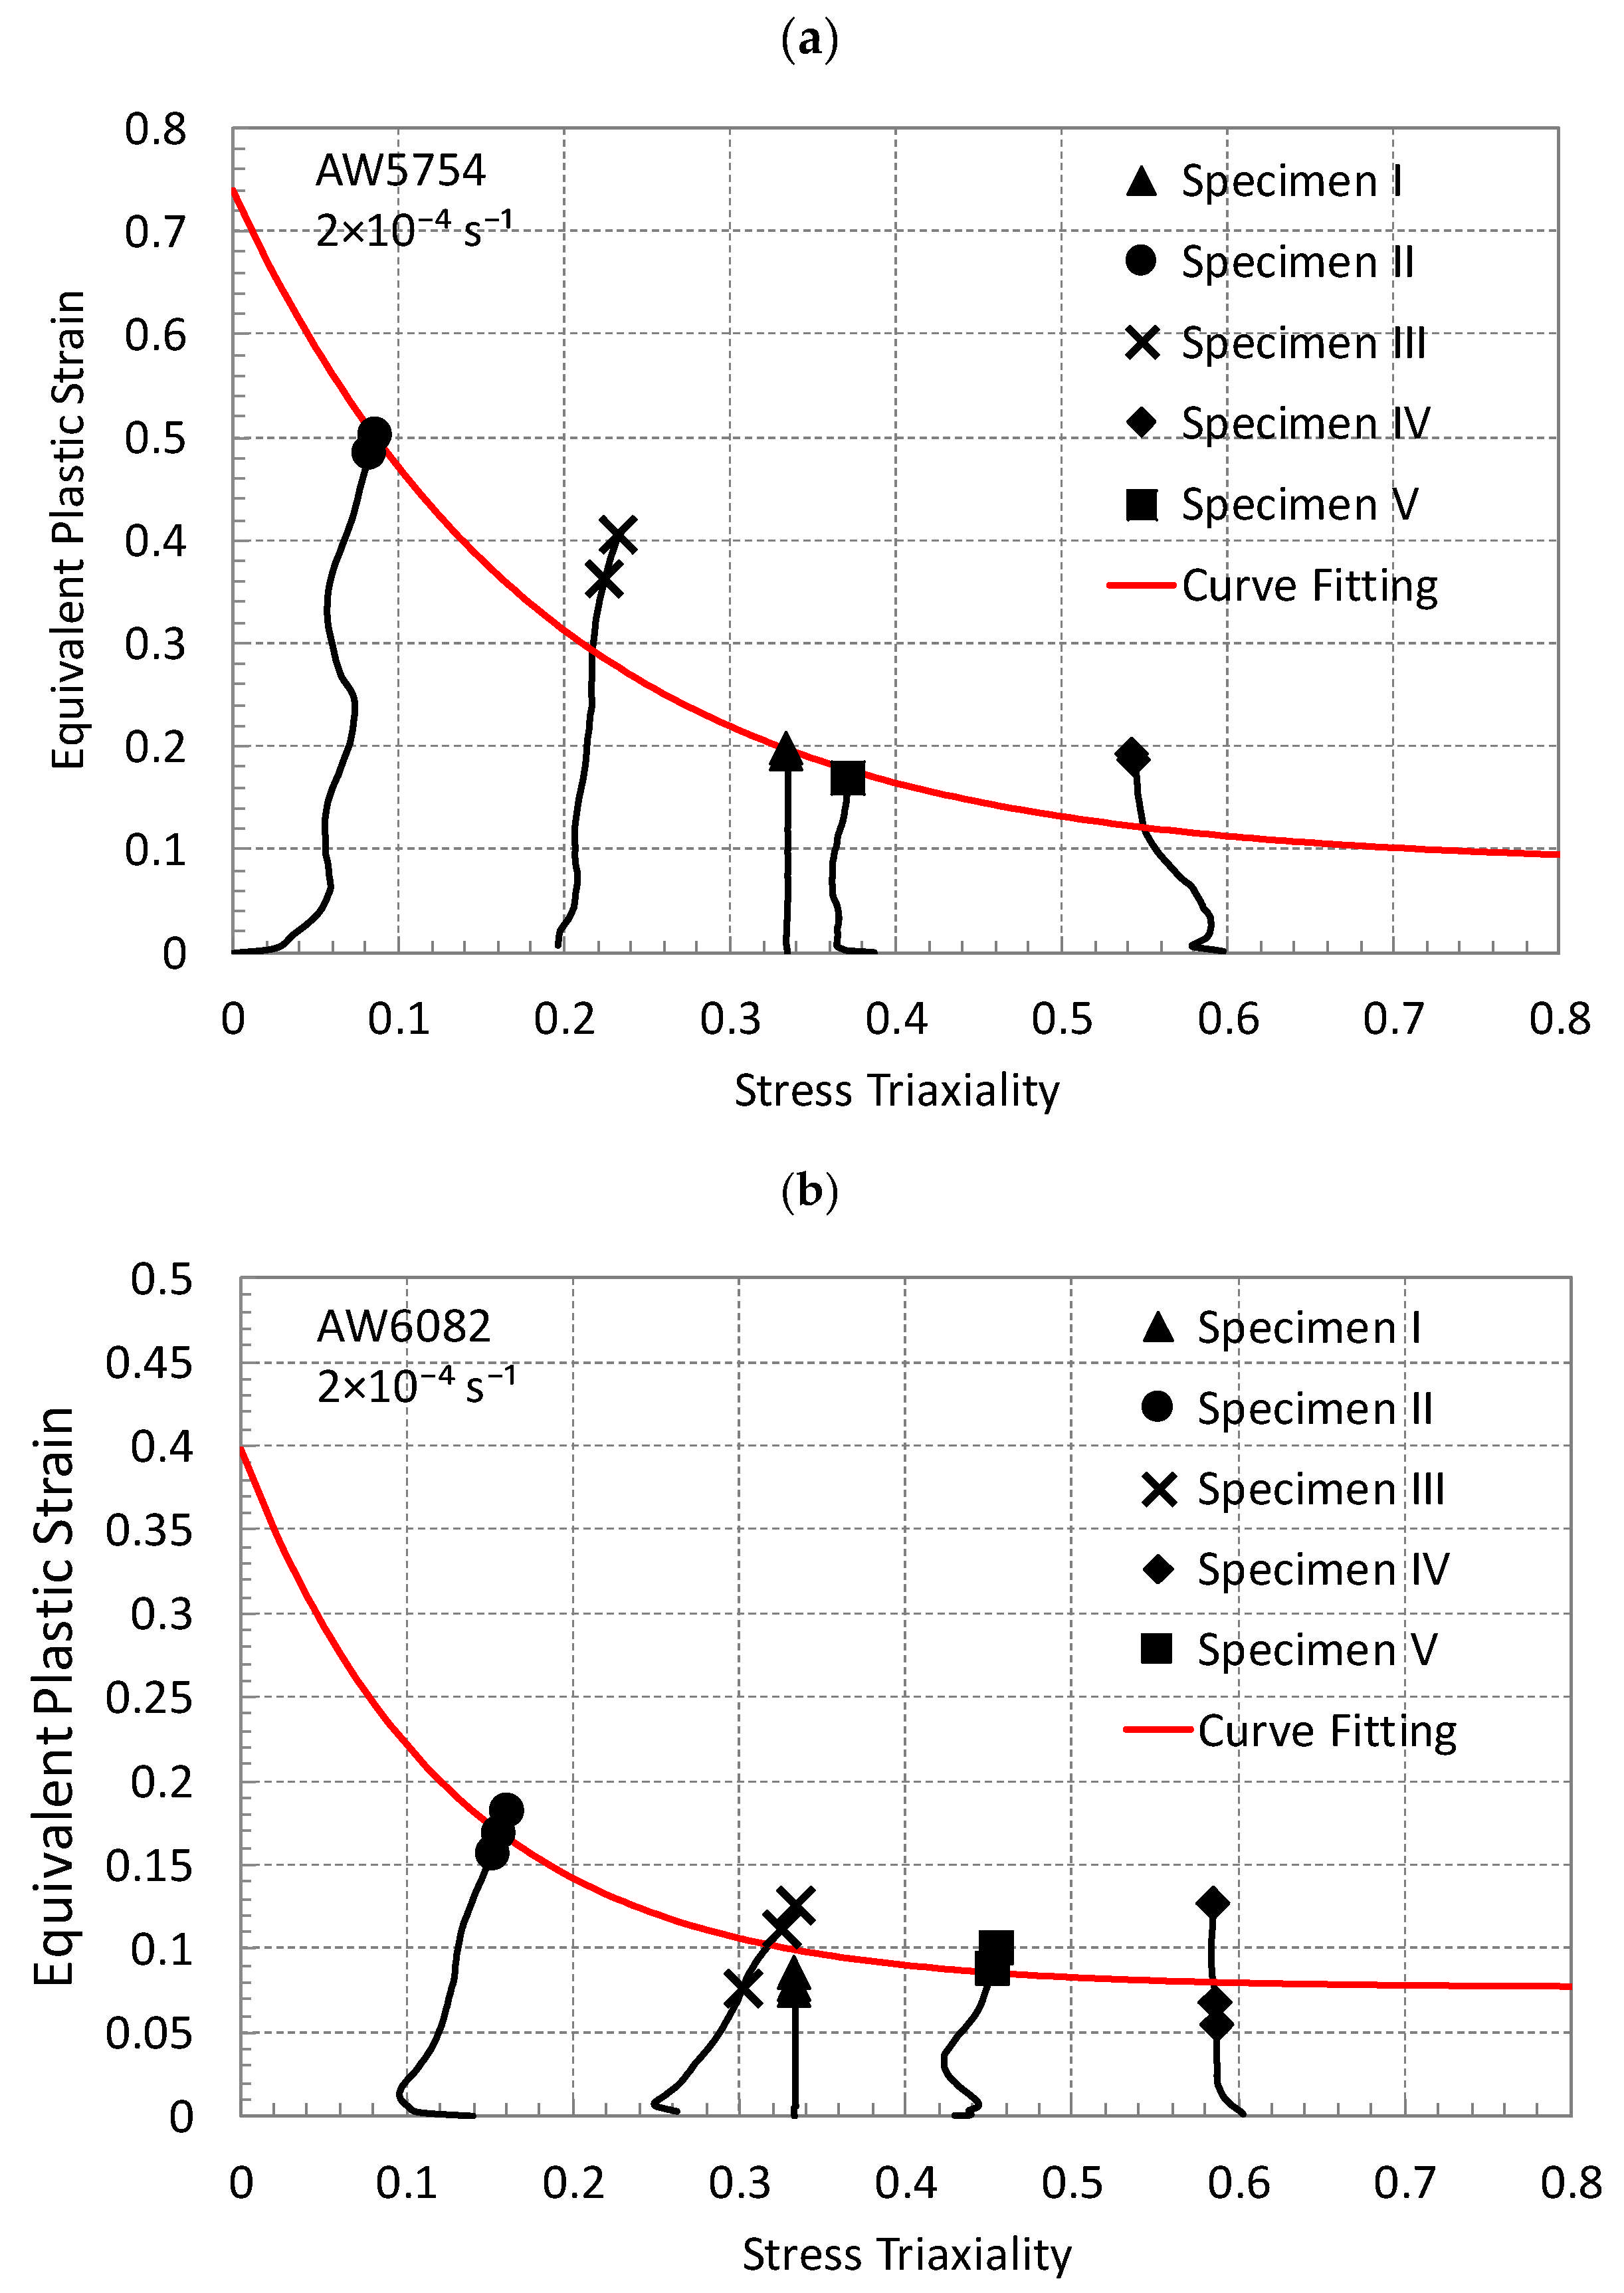
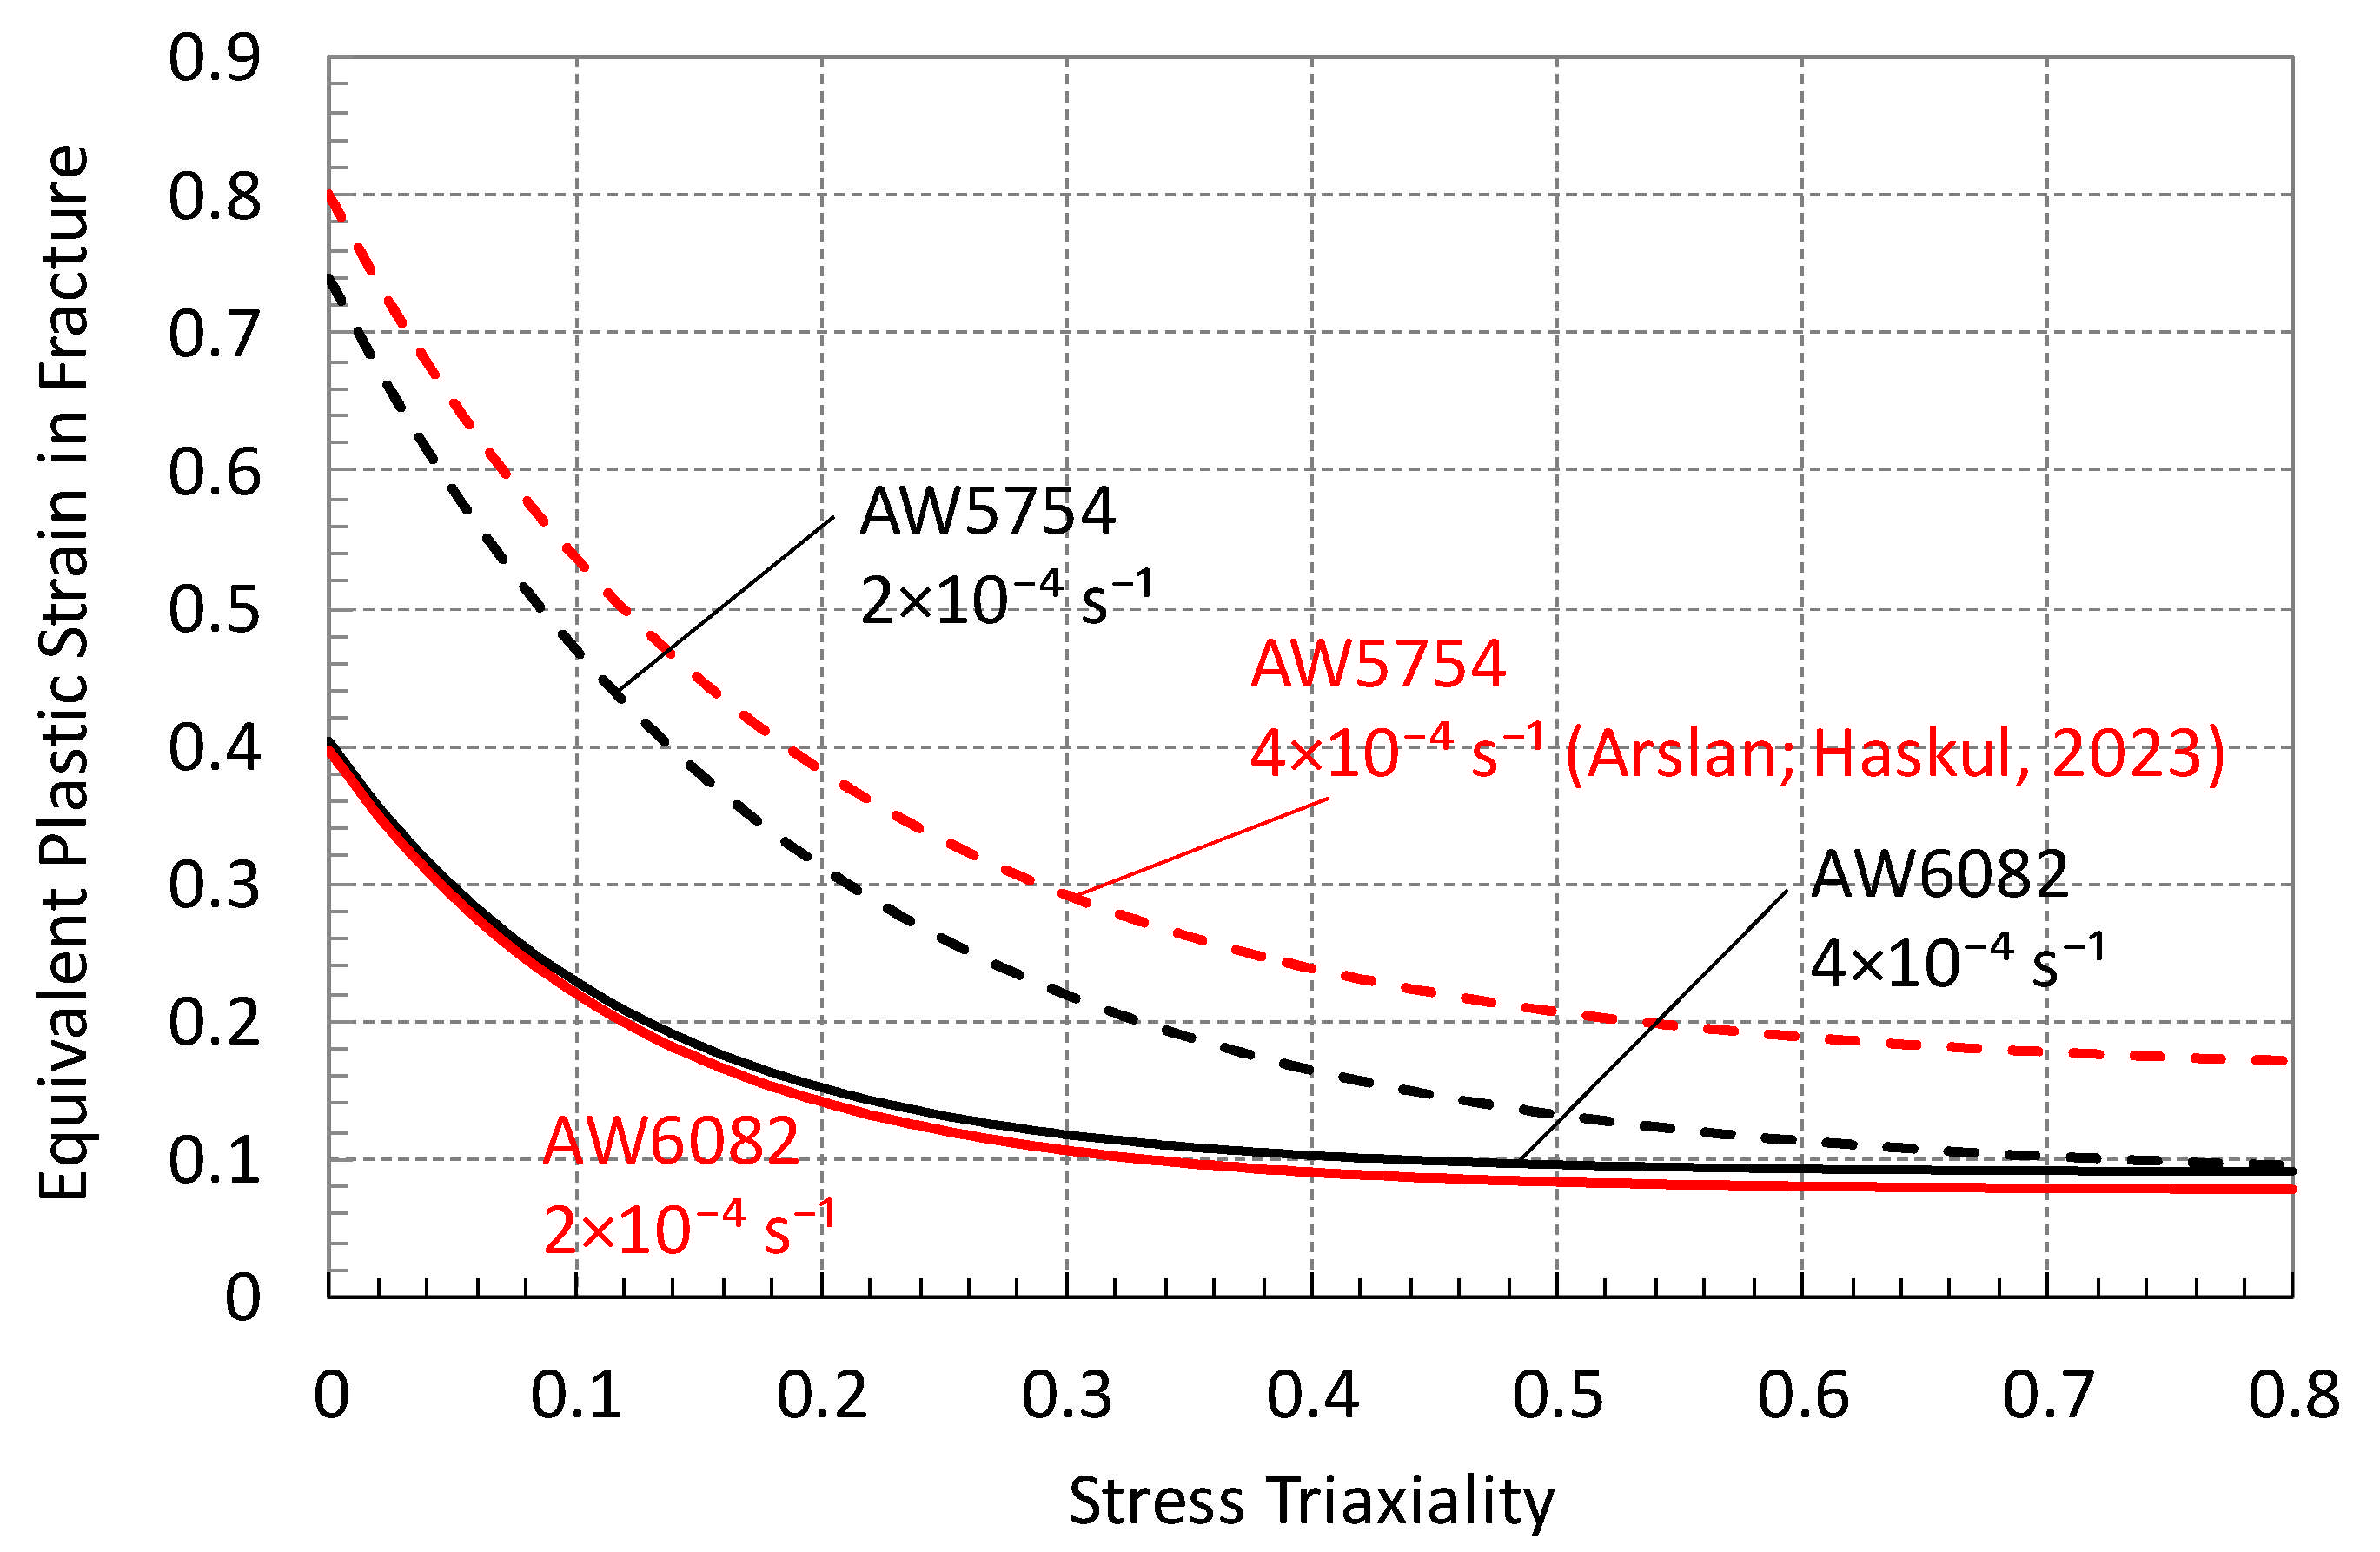
4. Determination of Triaxiality Loci

After validating the FE models, they were used to determine the equivalent plastic strain at fracture and the corresponding stress triaxiality factor. This was achieved by utilizing the test results—particularly the experimentally observed fracture initiation points, as shown in Figure 12, Figure 13 and Figure 14—in conjunction with the finite element simulations. The evolution of the equivalent plastic strain and stress triaxiality for each specimen type was tracked in the FE models up to the experimentally determined fracture points, allowing for the accurate extraction of the corresponding values. Based on this, the calculated simulation results, including the equivalent plastic strains and stress triaxiality factors, are presented in Figure 15 and Figure 16a,b for AW6082 (at 4 × 10⁻⁴ s−1), AW5754 (at 2 × 10⁻⁴ s−1), and AW6082 (at 2 × 10⁻⁴ s−1). In addition, this relationship for AW5754 at 4 × 10⁻⁴ s−1 is provided in [25].
To develop a continuous curve representing the triaxiality locus, the fracture points for each specimen were subjected to a curve-fitting procedure. The fracture points shown in Figure 15 and Figure 16 were used in the fitting process to express the equivalent plastic strain at fracture ε p f as a function of the stress triaxiality factor η . Numerous mathematical functions have been proposed in the literature for fitting such data and obtaining the triaxiality locus [18,23,45]. In this study, three different functions, which are linear
ε p f = K 1 + K 2   η ,
parabolic
ε p f = C 1 + C 2   η + C 3   η 2 ,
and exponential
ε p f = D 1 + D 2   e D 3   η ,
were selected to determine the most appropriate fitting approach and to evaluate the differences among them. The constants K 1 ,   K 2 ,   C 1 ,   C 2 ,   C 3 ,   D 1 ,   D 2 ,   and D 3 were determined by minimizing the total error between the fitted curve and the experimental fracture data points.
An illustrative example of this fitting procedure is presented in Figure 15 for AW6082 under a strain rate of 4 × 10⁻⁴ s−1, comparing the curves obtained from the three fitting functions. In the figure, the black markers represent the experimental fracture initiation points used in the fitting, while the solid red line denotes the fitted exponential function, the solid blue line represents the parabolic fit, and the solid green line corresponds to the fitted linear function. For this specific material and loading condition, the fitting errors were approximately 4.5% for the linear function, 3.3% for the parabolic function, and 2.3% for the exponential function. When applied to other materials and loading conditions, all three functions were assessed, and it was concluded that the exponential function consistently provided the best fit—although the difference from the parabolic function was relatively small.
The final exponential curve representing the triaxiality locus is also shown as a solid red line in Figure 16a,b for AW5754 and AW6082 at a strain rate of 2 × 10⁻⁴ s−1. It should be emphasized that the choice of fitting function is inherently influenced by the material’s behavior and its characteristic response under varying loading conditions.
Finally, the stress triaxiality loci obtained for the different strain rates of AW5754 (dashed lines) and AW6082 (solid lines) are compared in Figure 17. This figure clearly illustrates the relationship between the strain rate and the fracture behavior of the two materials under multiaxial loading conditions. Comparing the stress triaxiality loci of both aluminum alloys indicates that AW5754 generally exhibits higher equivalent plastic strain values at fracture compared to AW6082 across most of the stress triaxiality range. For both materials, an increase in the strain rate leads to a higher equivalent plastic strain required for fracture initiation. However, this increase is more pronounced for AW5754, indicating a higher strain rate sensitivity compared to AW6082. It should be emphasized that all tests and simulations were conducted within the quasi-static strain rate regime.

5. Conclusions

This study aimed to develop stress triaxiality loci to investigate the fracture initiation behavior under multiaxial loading for medium-strength (AW5754) and high-strength (AW6082) aluminum alloys, using experimental data and finite element (FE) simulations. The resulting loci were used to examine the strain rate sensitivity of the fracture behavior in these two types of aluminum alloy under very low loading rate conditions. To achieve this, uniaxial tensile tests were conducted on five distinct specimen geometries at two quasi-static loading rates. The experimental results were used to determine the critical load at fracture initiation, extract the necessary material parameters, and validate the corresponding FE simulations. Following validation, the equivalent plastic strain and stress triaxiality factor at fracture were extracted from the simulations. To construct continuous triaxiality curves, three different fitting functions—linear, quadratic, and exponential—were evaluated. After comparing the resulting curves across different strain rates, the exponential function was selected as it provided the best agreement with the experimental fracture data.
The exponential fitting function provides a good representation of the relationship between the equivalent plastic strain at fracture and the stress triaxiality factor for both materials. In the region of low-stress triaxiality factor ( η < 0.33 ), which corresponds to shear-dominated loading conditions, both alloys show relatively high equivalent plastic strain values at fracture. As the triaxiality factor increases toward tension-dominated conditions ( η > 0.33 ), the equivalent plastic strain decreases exponentially, which aligns with the established theories of ductile fracture.
The comparison of the stress triaxiality loci for both aluminum alloys reveals that AW5754 generally exhibits higher equivalent plastic strain at fracture than AW6082 across most of the stress triaxiality range. Even under quasi-steady-state loading conditions, slight variations in the strain rate can influence the fracture behavior of these materials to varying degrees. Both medium- and high-strength aluminum alloys can demonstrate increased resistance to fracture with rising loading rates. However, under loading conditions near the quasi-static regime, high-strength aluminum alloys exhibit very low strain rate sensitivity in the variation of equivalent plastic strain at fracture under multiaxial stress states. In contrast, medium-strength alloys show a more pronounced strain rate sensitivity in their fracture initiation behavior.
Under quasi-static loading, the AW5754 and AW6082 alloys exhibit distinct strain rate sensitivities. AW5754, a strain-hardened Al–Mg alloy, shows more pronounced sensitivity, as its equivalent plastic strain at fracture varies noticeably with the strain rate. This is due to the dominance of dislocation motion and strain hardening, where the limited dislocation recovery at higher strain rates enhances hardening. In contrast, AW6082, a precipitation-hardened Al–Mg–Si alloy, displays relatively stable fracture behavior across the same range. Its strength relies on precipitates that obstruct dislocations, which remain largely unaffected under quasi-static conditions.
The stress triaxiality loci developed in this study serve as valuable tools for predicting fractures in structures made of AW5754 and AW6082 aluminum alloys subjected to complex loading conditions. These findings enhance the understanding of fracture behavior in aluminum alloys under multiaxial loading at quasi-steady-state strain rates and provide essential data for the development and calibration of damage models for these materials.

Author Contributions

Conceptualization, E.A.; methodology, M.H. and E.A.; software, E.A.; validation, M.H.; resources, M.H.; writing—original draft, E.A.; writing—review & editing, M.H. All authors have read and agreed to the published version of the manuscript.

Funding

This study is financially supported by Sirnak University (under the project number 2022.FNAP.06.05.02). Open access funding was provided by TU Wien.

Data Availability Statement

The original contributions presented in this study are included in the article. Further inquiries can be directed to the corresponding author.

Acknowledgments

The authors acknowledge the TU Wien Library for financial support through its Open Access Funding Program.

Conflicts of Interest

The authors declare no conflicts of interest.

References

  1. Foti, P.; Razavi, N.; Fatemi, A.; Berto, F. Multiaxial fatigue of additively manufactured metallic components: A review of the failure mechanisms and fatigue life prediction methodologies. Prog. Mater. Sci. 2023, 137, 101126. [Google Scholar] [CrossRef]
  2. Rolfe, S.T.; Barsom, J.M. Fracture and Fatigue Control in Structures: Applications of Fracture Mechanics; ASTM International: West Conshohocken, PA, USA, 1977. [Google Scholar]
  3. Jones, D.R.; Ashby, M.F. Engineering Materials 2: An Introduction to Microstructures and Processing, 4th ed.; Butterworth-Heinemann: Oxford, UK; Waltham, MA, USA, 2012. [Google Scholar]
  4. Trzepieciński, T.; Najm, S.M.; Oleksik, V.; Vasilca, D.; Paniti, I.; Szpunar, M. Recent developments and future challenges in incremental sheet forming of aluminium and aluminium alloy sheets. Metals 2022, 12, 124. [Google Scholar] [CrossRef]
  5. Baral, M.; Korkolis, Y.P. Ductile fracture under proportional and non-proportional multiaxial loading. Int. J. Solids Struct. 2021, 210, 88–108. [Google Scholar] [CrossRef]
  6. Lian, Y.; Wu, F.; Zhao, Q.; Han, Y.; Wang, B. Multiaxial failure behavior and fatigue life prediction of unidirectional composit laminates. Compos. Sci. Technol. 2024, 247, 110430. [Google Scholar] [CrossRef]
  7. Cui, J.; Wang, S.; Wang, S.; Li, G.; Wang, P.; Liang, C. The effects of strain rates on mechanical properties and failure behavior of long glass fiber reinforced thermoplastic composites. Polym. 2019, 11, 2019. [Google Scholar] [CrossRef]
  8. Oosterkamp, L.D.; Ivankovic, A.; Venizelos, G. High strain rate properties of selected aluminium alloys. Mater. Sci. Eng. A 2000, 278, 225–235. [Google Scholar] [CrossRef]
  9. Ma, H.; Huang, L.; Tian, Y.; Li, J. Effects of strain rate on dynamic mechanical behavior and microstructure evolution of 5A02-O aluminum alloy. Mater. Sci. Eng. A 2014, 606, 233–239. [Google Scholar] [CrossRef]
  10. Chen, X.; Peng, Y.; Peng, S.; Yao, S.; Chen, C.; Xu, P. Flow and fracture behavior of aluminum alloy 6082-T6 at different tensile strain rates and triaxialities. PLoS ONE 2017, 12, e0181983. [Google Scholar] [CrossRef]
  11. Sharma, S.M.; Mishra, K.; Rodriguez, O.; Whittington, W.R.; Allison, P.; Bhat, S.P.; Gokhale, A.M.; Thadhani, N.N. Effects of Strain Rate on Mechanical Properties and Fracture Mechanisms in a Dual Phase Steel. In Dynamic Behavior of Materials, Volume 1: Proceedings of the 2017 Annual Conference on Experimental and Applied Mechanics, Indianapolis, IN, USA, 12–15 June 2017; Springer International Publishing: Berlin/Heidelberg, Germany, 2018; pp. 209–216. [Google Scholar]
  12. Zhou, J.; Hayden, M.; Gao, X. An investigation of the strain rate and temperature effects on the plastic flow stress and ductile failure strain of aluminum alloys 5083-H116, 6082-T6 and a 5183 weld metal. Proc. Inst. Mech. Eng. C 2013, 227, 883–895. [Google Scholar] [CrossRef]
  13. Li, P.; Siviour, C.R.; Petrinic, N. The effect of strain rate, specimen geometry and lubrication on responses of aluminium AA2024 in uniaxial compression experiments. Exp. Mech. 2009, 49, 587–593. [Google Scholar] [CrossRef]
  14. Brünig, M.; Brenner, D.; Gerke, S. Stress state dependence of ductile damage and fracture behavior: Experiments and numerical simulations. Eng. Fract. Mech. 2015, 141, 152–169. [Google Scholar] [CrossRef]
  15. Bao, Y.; Wierzbicki, T. On fracture locus in the equivalent strain and stress triaxiality space. Int. J. Mech. Sci. 2004, 46, 81–98. [Google Scholar] [CrossRef]
  16. Kõrgesaar, M. The effect of low stress triaxialities and deformation paths on ductile fracture simulations of large shell structures. Mar. Struct. 2019, 63, 45–64. [Google Scholar] [CrossRef]
  17. Mehari, Z.A.; Han, J. Numerical prediction of ductile fracture during the partial heating roll forming process of DP980. Int. J. Fract. 2022, 234, 97–112. [Google Scholar] [CrossRef]
  18. Asadi, M.; Haji Aboutalebi, F.; Poursina, M. A comparative study of six fracture loci for DIN1623 St12 steel to predict strip tearing in a tandem cold rolling mill. Arch. Appl. Mech. 2021, 91, 1859–1878. [Google Scholar] [CrossRef]
  19. Kõrgesaar, M.; Romanoff, J.; Remes, H.; Palokangas, P. Experimental and numerical penetration response of laser-welded stiffened panels. Int. J. Impact Eng. 2018, 114, 78–92. [Google Scholar] [CrossRef]
  20. Zhou, L.; Wen, H. A new dynamic plasticity and failure model for metals. Metals 2019, 9, 905. [Google Scholar] [CrossRef]
  21. Mae, H.; Teng, X.; Bai, Y.; Wierzbicki, T. Comparison of ductile fracture properties of aluminum castings: Sand mold vs. metal mold. Int. J. Solids Struct. 2008, 45, 1430–1444. [Google Scholar] [CrossRef]
  22. Fraccaroli, L.; Mastrone, M.N.; Concli, F. Calibration of the fracture locus of an AlSi10 aluminum alloy. In High Performance and Optimum Design of Structures and Materials IV; Hernandez, S., De Wilde, W.P., Sejnoha, M., Eds.; WIT Press: Southampton, UK, 2020; pp. 3–10. [Google Scholar]
  23. Mae, H.; Teng, X.; Bai, Y.; Wierzbicki, T. Ductile fracture locus of AC4CH-T6 cast aluminium alloy. Arch. Comput. Mater. Sci. Surf. Eng. 2009, 1, 100–105. [Google Scholar]
  24. Peng, Y.; Chen, X.; Peng, S.; Chen, C.; Li, J.; Liu, G. Strain Rate-Dependent Constitutive and Low Stress Triaxiality Fracture Behavior Investigation of 6005 Al Alloy. Adv. Mater. Sci. Eng. 2018, 1, 2712937. [Google Scholar] [CrossRef]
  25. Arslan, E.; Haskul, M. Fracture behavior prediction of a high-strength aluminum alloy under multiaxial loading. In Proceedings of the 9th World Congress on Mechanical, Chemical, and Material Engineering, London, UK, 6–8 August 2023; pp. 143–151. [Google Scholar]
  26. Hong, T.; Ding, F.; Chen, F.; Zhang, H.; Zeng, Q.; Wang, J. Study on the fracture behaviour of 6061 aluminum alloy extruded tube during different stress conditions. Crystals 2023, 13, 489. [Google Scholar] [CrossRef]
  27. Mucha, J.; Kaščák, Ľ.; Witkowski, W. Research on the influence of the AW 5754 aluminum alloy state condition and sheet arrangements with AW 6082 aluminum alloy on the forming process and strength of the Clinch Rivet joints. Materials 2021, 14, 2980. [Google Scholar] [CrossRef] [PubMed]
  28. Amer, M.; Shazly, M.; Mohamed, M.; Hegazy, A.A. Ductile damage prediction of AA 5754 sheet during cold forming condition. J. Mech. Sci. Technol. 2020, 34, 4219–4228. [Google Scholar] [CrossRef]
  29. Chen, Y.; Clausen, A.H.; Hopperstad, O.S.; Langseth, M. Stress–strain behaviour of aluminium alloys at a wide range of strain rates. Int. J. Solids Struct. 2009, 46, 3825–3835. [Google Scholar] [CrossRef]
  30. Gao, X.; Zhang, T.; Hayden, M.; Roe, C. Effects of the stress state on plasticity and ductile failure of an aluminum 5083 alloy. Int. J. Plast. 2009, 25, 2366–2382. [Google Scholar] [CrossRef]
  31. Kang, J.; Wilkinson, D.S.; Wu, P.D.; Bruhis, M.; Jain, M.; Embury, J.D.; Mishra, R.K. Constitutive behavior of AA5754 sheet materials at large strains. J. Eng. Mater. Technol. 2008, 130, 031004. [Google Scholar] [CrossRef]
  32. Wang, Z.J.; Zheng, L.H.; Wang, Z. Characterization of Forming Limits at Fracture for Aluminum Alloy 6K21-T4 Sheets in Non-Linear Strain Paths Using a Biaxial Tension/Shear Loading Test. Int. J. Mech. Sci. 2020, 184, 105672. [Google Scholar] [CrossRef]
  33. Ganjiani, M.; Homayounfard, M. Development of a Ductile Failure Model Sensitive to Stress Triaxiality and Lode Angle. Int. J. Solids Struct. 2021, 225, 111066. [Google Scholar] [CrossRef]
  34. Zong, S.; Chen, Q.; Guo, X.; Liu, W.; Zhang, J. Micromechanics-Based Modified Ductile Fracture Criterion for Extruded Aluminum Alloys under Multi-Axial Loading. Adv. Struct. Eng. 2025, 27, 13694332251340727. [Google Scholar] [CrossRef]
  35. Algarni, M.; Ghazali, S.; Zwawi, M. The Emerging of Stress Triaxiality and Lode Angle in Both Solid and Damage Mechanics: A Review. Mech. Solids 2021, 56, 787–806. [Google Scholar] [CrossRef]
  36. Lee, J.; Bong, H.J.; Park, H.; Kim, D. Micromechanics-Based Modeling of Plastic and Ductile Fracture of Aluminum Alloy 2024-O. Eng. Fract. Mech. 2022, 261, 108213. [Google Scholar] [CrossRef]
  37. Nouira, M.; Oliveira, M.C.; Khalfallah, A.; Alves, J.L.; Menezes, L.F. Comparative fracture prediction study for two materials under a wide range of stress states using seven uncoupled models. Eng. Frac. Mech. 2023, 279, 108952. [Google Scholar] [CrossRef]
  38. Sagar, S.; Singh, N.K.; Maurya, N.S. Strain rate behaviour and notch sensitivity of Aluminium 6082-T6 alloy under tensile loads. UPB Sci. Bull. Series B 2023, 85, 202–212. [Google Scholar]
  39. Park, S.J.; Heogh, W.; Yang, J.; Kang, S.; Jeong, W.; Lee, H.; Jang, T.S.; Jung, H.D.; Jahazi, M.; Han, S.C.; et al. Meta-structure of amorphous-inspired 65.1 Co28. 2Cr5. 3Mo lattices augmented by artificial intelligence. Adv. Compos. Hybrid Mater. 2024, 7, 224. [Google Scholar] [CrossRef]
  40. Andrade, F.; Conde, S.; Feucht, M.; Helbig, M.; Haufe, A. Estimation of stress triaxiality from optically measured strain fields. In Proceedings of the 12th European LS-DYNA Conference, Koblenz, Germany, 14–16 May 2019. [Google Scholar]
  41. Bridgman, P.W. Studies in Large Plastic Flow and Fracture: With Special Emphasis on the Effects of Hydrostatic Pressure; Harvard University Press: Cambridge, MA, USA, 1964. [Google Scholar]
  42. ASTM International. Committee E-28 on Mechanical Testing. In Standard Test Methods for Tension Testing of Metallic Materials; ASTM international: West Conshohocken, PA, USA, 2021. [Google Scholar]
  43. Dassault Systèmes. ABAQUS 2022 Documentation; Dassault Systèmes Simulia Corp.: Providence, RI, USA, 2022. [Google Scholar]
  44. Lapidus, L.; Pinder, G.F. Numerical Solution of Partial Differential Equations in Science and Engineering; John Wiley & Sons: New York, NY, USA, 1982. [Google Scholar]
  45. Abushawashi, Y.; Xiao, X.; Astakhov, V. A novel approach for determining material constitutive parameters for a wide range of triaxiality under plane strain loading conditions. Int. J. Mech. Sci. 2013, 74, 133–142. [Google Scholar] [CrossRef]
Figure 1. A sample of the stress triaxiality locus for a ductile material. Reprinted with permission from ref. [25]. 2023 Arslan, E.; Haskul, M.
Metals 15 00785 g001
Figure 2. Geometry and dimensions (in mm) of the specimen types used in the experiments. Reprinted with permission from ref. [25]. 2023 Arslan, E.; Haskul, M.
Metals 15 00785 g002
Figure 3. AW5754 specimens after testing at a strain rate of 2 × 10⁻⁴ s−1.
Metals 15 00785 g003
Figure 4. AW6082 specimens after testing at a strain rate of 4 × 10⁻⁴ s−1.
Metals 15 00785 g004
Figure 5. True stress–strain curves for Specimen I of (a) AW5754 (Adapted with permission from Ref. [25]. 2023 Arslan, E.; Haskul, M.) and (b) AW6082 at different loading speeds.
Metals 15 00785 g005
Figure 6. SEM fractographic images of AW5754 specimens for three different levels of magnification for Specimens (a) I, (b) II, (c) III, (d) IV, and (e) V.
Metals 15 00785 g006aMetals 15 00785 g006b
Figure 7. SEM fractographic images of AW6082 specimens for three different levels of magnification for Specimens (a) I, (b) II, (c) III, (d) IV, and (e) V.
Metals 15 00785 g007aMetals 15 00785 g007b
Figure 8. SEM images with marked point analysis locations, corresponding EDS spectra, and elemental mapping of AW5754 Specimen I: (a) SEM with point analysis, (b) EDS spectra of objects 1, (c) EDS spectra of objects 2, and (d) elemental maps.
Metals 15 00785 g008aMetals 15 00785 g008b
Figure 9. SEM images, EDS point analysis, spectra, and elemental distribution maps of AW6082 Specimen I: (a) SEM with marked points, (b) EDS spectra objects 3, (c) EDS spectra objects 3, and (d) elemental maps.
Metals 15 00785 g009aMetals 15 00785 g009b
Figure 10. FE models for specimens (a) I, (b) II, (c) III, (d) IV, and (e) V.
Metals 15 00785 g010aMetals 15 00785 g010b
Figure 11. Equivalent plastic strain distribution in FE models at the estimated damage (for AW6082 at 2 × 10⁻⁴ s−1) for specimens (a) I, (b) II, (c) III, (d) IV, and (e) V.
Metals 15 00785 g011aMetals 15 00785 g011b
Figure 12. Comparison of test data and FE simulations at defined fracture points for (a) Specimen I, (b) Specimen II, (c) Specimen III, (d) Specimen IV, and (e) Specimen V for AW5754 at 2 × 10⁻⁴ s−1.
Metals 15 00785 g012
Figure 13. Comparison of test data and FE simulations at defined fracture points for (a) Specimen I, (b) Specimen II, (c) Specimen III, (d) Specimen IV, and (e) Specimen V for AW6082 at 2 × 10⁻⁴ s−1.
Metals 15 00785 g013
Figure 14. Comparison of test data and FE simulations at defined fracture points for (a) Specimen I, (b) Specimen II, (c) Specimen IV, and (d) Specimen V for AW6082 at 4 × 10⁻⁴ s−1.
Metals 15 00785 g014
Figure 15. Comparison of curve-fitting functions for the triaxiality locus of AW6082 at 4 × 10⁻⁴ s−1.
Metals 15 00785 g015
Figure 16. Change of equivalent plastic strain with stress triaxiality factor and curve fitting for the triaxiality locus for (a) AW5754 at 2 × 10⁻⁴ s−1 and (b) AW6082 at 2 × 10⁻⁴ s−1.
Metals 15 00785 g016
Figure 17. Comparison of stress triaxiality locus for AW5754 and AW6082 at different strain rates. Adapted with permission from Ref. [25]. 2023 Arslan, E.; Haskul, M.
Metals 15 00785 g017
Table 1. Mesh convergence and computation time analysis.
Element Size (mm)NodeStress TriaxialityRelative
Error (%)
Equivalent Plastic StrainRelative
Error (%)
Computation Time (s)
0.25194,9210.367898-0.237044-14,444
0.3577,0170.3713020.930.2474074.372473.4
0.525,1340.3742081.720.2517596.21386.90
0.7577440.3889265.720.2694813.6871.8
1.034080.3964687.770.30587129.0426.8
Disclaimer/Publisher’s Note: The statements, opinions and data contained in all publications are solely those of the individual author(s) and contributor(s) and not of MDPI and/or the editor(s). MDPI and/or the editor(s) disclaim responsibility for any injury to people or property resulting from any ideas, methods, instructions or products referred to in the content.

