Abstract
Additive manufacturing techniques, such as laser-based powder bed fusion of metals (PBF-LB/M), have now gained high industrial and academic interest. Despite its design flexibility and the ability to fabricate intricate components, LPBF has not yet reached its full potential, partly due to the challenges associated with microstructure control. The precise manipulation of the microstructure in LPBF is a formidable yet highly rewarding endeavor, offering the capability to engineer components at a local level. This work introduces an innovative parallelized Cellular Automaton (CA) framework for modeling the evolution of the microstructure during the LPBF process. LPBF involves remelting and subsequent nucleation followed by crystal growth during solidification, which complicates and burdens microstructure simulations. In this research, a novel approach to nucleation seeding and crystal growth is implemented, focusing exclusively on the final stages of melting and solidification, enhancing the computational efficiency by 30%. This approach streamlines the simulation process, making it more efficient and effective. The developed model was employed to simulate the microstructure of an austenitic advanced high-strength steel (AHSS). The model was validated by comparing the simulation results qualitatively and quantitatively with the experimental data obtained under the same process parameters. The predicted microstructure closely aligned with the experimental findings. Simulations were also conducted at varying resolutions of CA cells, enabling a comprehensive study of their impact on microstructure evolution. Furthermore, the computational efficiency was critically evaluated.
1. Introduction
Additive manufacturing (AM) has been defined as “a process of joining materials to make objects from 3D model data, usually layer upon layer, as opposed to subtractive manufacturing methodologies” [1]. Initially considered as a rapid prototyping tool [2], in the last decades, AM has gained significant attention both from industry and academic researchers, mostly due to its freedom of design [3]. In recent years, metal additive manufacturing (MAM) has experienced a surge in popularity and has been the subject of extensive research in, among others, the automotive, aerospace, and biomedical sectors [4,5,6]. Laser powder bed fusion (LPBF) is one of the most commonly used MAM techniques, in which a near-net-shaped component is manufactured layer-by-layer using a high-quality laser as an energy source [7,8]. Components manufactured through the LPBF technique frequently exhibit notably distinct microstructures, leading to distinct mechanical properties in comparison to those produced through conventional manufacturing methods [9,10]. At the same time, unlike conventional manufacturing technologies, the LPBF technique allows for a local tailoring of microstructures. This capability makes LPBF a powerful tool for producing components with unique and tailored mechanical properties. Therefore, understanding the mechanisms governing the microstructure evolution during LPBF is a topic of immense importance to finally control the properties and performance of additively manufactured components via microstructure control. However, various complex phenomena associated with LPBF, such as rapid solidification, high thermal gradients, phase transformations, residual stresses, etc., make it challenging and time-consuming to study the microstructure formation experimentally. Additionally, LPBF involves numerous process variables, namely, laser power, scan speed, hatch distance, and layer thickness, that result in a vast parameter space, which renders it almost impossible to conduct comprehensive experimental studies [11]. To amend this situation, computer simulations can provide a viable alternative for exploring the different phenomena and conducting parameter studies on microstructure evolution and, by extension, resulting materials’ properties. For this aim, various modeling techniques, such as the kinetic Monte Carlo (KMC) [12,13,14], the Phase Field (PF) [15], and the Cellular Automaton (CA) models [16,17,18], have been utilized to investigate the microstructure development in LPBF. These models have different applications and limitations. For instance, the PF model allows simulating nucleation, grain and dendritic growth, and permits, as well, the consideration of local chemistry effects like segregation and phase transformation [12,19]. The PF model is limited, however, by the size of the maximum representative volume element (RVE) that can be considered, owing to the very intensive memory and computer power utilization of the model. The spatial resolution of phase-field models ranges from nano- to micrometers, and hence, it is able to resolve dendritic structures excellently but also grain structures, depending on the phenomena explored in the model [20]. However, owing to the fine discretization needed in the model, simulations are usually restricted to 2D and/or limited in size [12,21,22]. In turn, the kinetic Monte Carlo (KMC) model, a stochastic method, is computationally less expensive and thus applicable over larger domain sizes, extending into millimeters. This model has shown excellent computational performance, but it does not directly account for thermodynamics or integrate the material’s crystallographic texture that has to be set once the simulations have been completed, usually using sampling algorithms to match experimental observations [12]. Cellular Automaton methods seem to strike an optimal balance between computational resources utilization and the level of detail needed in simulating microstructure evolution in LPBF, especially in combination with PF methods or experimental characterization for determining the local chemistry and its effect on the evolution of the microstructure.
The CA modeling technique consists of a nucleation model that is usually probabilistic in nature and a deterministic crystal growth model. The CA model can predict microstructure evolution during the process under consideration and the crystallographic orientations, along with the physics of nucleation and growth of the crystals. The nucleation model is formulated on the probability of new crystals forming at specific features of the material by specific mechanisms that are usually modeled from experimental observations. For example, in recrystallization [23,24,25,26,27,28,29], a phenomenon that has been frequently simulated using the CA model [26,30,31] and shares some similarities with solidification since nucleation and growth of crystals is involved, nuclei may originate at shear bands, at grain boundaries, in the bulk of grains, etc. The probability of formation of the nuclei at the distinctive features is not equal and depends on the pre-processing of the material and on the material’s properties. During solidification in LPBF, nucleation is also preferred at preexisting surfaces, such as already solidified material (epitaxial nucleation), but also at interfaces between the powder and the melt and at surfaces of particles/inclusions. By contrast, nucleation in the melt is, owing to the high work of nucleation, exceedingly rare. For these reasons, it is important to understand the mechanisms of formation to be able to formulate an accurate nucleation model. In turn, the growth models must reproduce the kinetics of growth of the different nucleated crystals under the action of the driving force, which is, in this case of LPBF, the local thermal gradient at the solid/liquid interface, which is dominated by the thermal flow from the melt pool to the substrate. Generally, in solidification, there are certain orientations that dominate the growth, and thus, oriented growth is expected. Rappaz and Gandin [32] were the first to propose a CA technique to model the evolution of the microstructure in 2D during solidification in casting processes. Following this initial work, the same authors went on to develop both 2D and 3D CA models, coupled with finite element (FE) simulations to include local temperature (both spatial and temporal) information [33,34,35]. Their coupled Cellular Automaton Finite Element (CAFE) model utilized a finite element method (FEM) to solve heat and mass transfer equations, providing each CA cell with the local temperature field at each time step. Furthermore, to account for dendritic growth, these authors considered octahedral crystal growth. Based on this model, other researchers have utilized the CAFE method for modeling the evolution of grain growth during PBF-LB/M [16,21,22,36,37,38,39] and in direct energy deposition (DED) [40]. For instance, Zinoviev et al. [41] have studied the evolution of the grain structure during LPBF with a 2D CA method. Moreover, Koepf et al. [18,21] used a 3D CA method for predicting the grain structure in electron beam powder bed fusion. In their work, Koepf et al. used a CA cell size of 10 µm and were able to correctly simulate the grain structure of Inconel 718. The effectiveness of the CA model in microstructure modeling is constrained by the size of the individual cells [42]. For an effective model, the size of CA cells should be smaller than the dendrite arm spacing in order to include the branching of the dendritic network [42]. A cell size of 50 µm is sufficient in the case of casting (aluminum-silicon alloy), as found out by Gandin et al. [34]. In the case of MAM, particularly LPBF, the size of the CA cells can pose a problem due to the rapid solidification and temperature gradient that occur during the process. This leads to the formation of very fine solidification structures, characterized by dimensions that can diminish to mere micrometers or extend into the sub-micrometer domain [43]. Therefore, for accurately modeling microstructure evolution in LPBF, it is critical to use a CA model with in the micrometer range. However, this fine size of the CA cells can significantly increase the computational load required for the simulation. Moreover, LPBF is subjected to repeated remelting and solidification of the subsequent layers. Based on the process parameters, a volume as high as 80% undergoes remelting throughout the entire process [44]. This implies that during microstructure simulation, CA cells undergo multiple cycles of melting and solidification before culminating in a final microstructure. Such iterative processes significantly increase the computational load, directly influencing the simulation’s computational time. Previous CA models in the literature have predominantly focused on addressing the computational load associated with fine cell sizes. Researchers, such as Lian et al. [42] and Kirubel et al. [45], have implemented parallelization techniques to reduce the computational load arising due to the large number of CA cells. However, no efforts have been made to account for the computational redundancy arising from the repeated remelting cycles during LPBF.
In this contribution, we present an enhancement to the efficiency of the CA model by managing the computational redundancy inherent in the remelting process. The key innovation of the model lies in its capability to manage the redundant computational load. The introduced CA model adopts a novel strategy, tracking back in time the temperature profile of the cells and concentrating solely on the final melting of the cells, thereby removing redundancies and enhancing the robustness of the simulation. This framework effectively streamlines the simulation, minimizing the redundant nucleation and crystal growth processes during remelting and solidification. Additionally, the CA model coupled with FE simulations of the temperature field for LPBF is parallelized using the message-passing interface (MPI) to allow for large computational domains. The present CA model incorporates a detailed stochastic nucleation mechanism and a physics-based kinetic growth mechanism for the crystal growth during solidification of the molten pool. The accuracy and efficiency of the proposed CA are demonstrated with a validation study. For the validation, the microstructure of an austenitic advanced high-strength steel (AHSS) was simulated and compared with the experimentally obtained microstructure, both quantitatively and qualitatively. Experimental specimens were fabricated on an Aconity Mini L-PBF machine (Aconity-3D GmbH, Herzogenrath, Germany).
2. The Accelerated Cellular Automaton Model
The CA is a mathematical model that relies on a predetermined set of deterministic and/or probabilistic rules to determine the spatial and temporal evolution of a physical system [46]. Among numerous applications [47,48], the CA model has been used to simulate the microstructure evolution in metallic materials [12], like in, for example, recrystallization [24,27,49], solidification [50], and grain growth [51]. In 3D CA modeling, a representative volume element (RVE) is discretized into voxels (cells) that are characterized by a state variable and usually contain information on the structure of the neighborhood. In this study, variable-size cells are used to divide the spatial domain. These cells represent the smallest volume possible in the model and must be (much) smaller than the expected average grain size of the microstructure and smaller than or on the same order of magnitude as the smallest feature of the microstructure that must be explicitly represented. As such, the cell size can be chosen to increase or decrease the resolution of the model, depending on these factors and the conditions imposed onto the system to be simulated. In this study, the CA simulations were performed using two cell sizes, which are 0.8 µm and 2 µm. These values were selected to assess the impact of spatial resolution on grain morphology prediction and to allow comparison with the experiment. For the interactions between cells, a Moore first-order neighborhood [52] has been considered. The CA cells in the model can have three state variables, namely, phase (solid/liquid/gas), temperature, and a unique index used to associate a cell with a specific grain, which, in turn, contains information on the crystallographic orientation of the grain. A representation of such a discretization adapted for the simulation of microstructure in LPBF is presented in Figure 1.
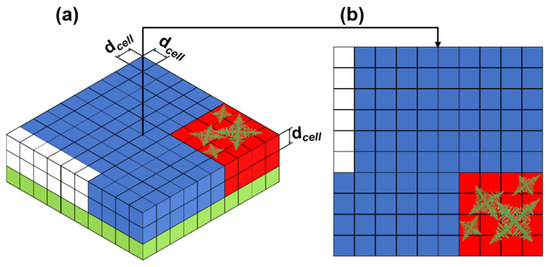
Figure 1.
(a) The 3D CA representation: green, blue, red, and white represent solidified, liquid, growing, and powder cells, respectively. Each cell stores its state (S), temperature (T), crystallographic orientation (O), and the unique index (I); (b) 2D representation of the CA grid with 4 growing grains.
The current CA model distinguishes itself from other CAs used in AM by its distinctive approach for considering remelting and solidification, which is inherent to LPBF. The present CA operates in a way that only active (solidifying) cells are considered at each time step. The performance of the CA model depends on the amount of solid/liquid (or generally transformed/untransformed) interface per time step, whose maximum has been found to occur at approximately 50% of the volume fraction of the transformed/solidified phase [49]. In LPBF, remelting is an inherent phenomenon wherein, depending on the process parameters, a volume ranging from 10% to 80% undergoes remelting throughout the entire process [44]. As a result, the performance of the model suffers from the non-continuous evolution of the transformed volume fraction since remelting events essentially reset the system to a previous state. Furthermore, these events must be explicitly implemented by shuffling memory algorithms whose performance is well-known to be low [53]. The proposed CA model in this contribution, on the other hand, has a distinctive approach for considering remelting and solidification during LPBF. This allows enhancing the speed of the CA model for faster and more efficient simulations while maintaining accuracy and reliability. For this aim, the temporal thermal field of the CA cells has been used to define the conditions (temperature and time) at which a cell will, with absolute certitude, solidify without further remelting. Figure 2 illustrates the schematic framework designed to prevent redundancy resulting from remelting in LPBF. It depicts an RVE at different time steps. In this image, solidified cells are shown in green, liquid state cells in blue, and red cells signify growing cells with activated/solidifying nuclei. The hatched cells, on the other hand, are designated for remelting at the next time interval, rendering them unavailable for nucleation and crystal growth at time < (where is the instantaneous time and is the time after which the temperature of a cell will not exceed the liquidus temperature). The cells whose temperature exceeds the liquidus temperature of the material more than once are designated as re-melted cells. All such cells will be available for a nucleation event or crystal growth only at time , after which it does not melt. The time for each cell is computed using its temperature history curve. Such a temperature history profile for a cell marked with “R” in Figure 2 is presented in Figure 3. In Figure 3, it can be seen that this cell melts twice, first at time and then again at time . Therefore, in the present framework, this particular cell will be part of the simulation only at a time greater than , thereby avoiding any redundant nucleation and crystal growth. Once a certain nucleation time for the cells has been determined, the cells are categorized according to this time in time series lists that are defined by discretizing the total simulation time in intervals smaller than the time needed for a laser track to complete its displacement. The interval of a time series is defined by a range . The simulation is accelerated by considering, in a time step, only the active/solidifying cells and nuclei cells within lists in which the current simulation time lies between and . The basic algorithm is shown in Algorithm 1, where the main execution loops are explained.

Figure 2.
Schematic representation of the framework for avoiding redundancy because of remelting in LPBF: (a) RVE representing the growth of dendrites at a time tn−1: green cells are solidified, blue cells are liquid state, hatched cells will be re-melted at next time interval and, therefore, are not available for nucleation and crystal growth, red cells are growing cells with activated nuclei; (b) RVE representing the cells after complete solidification at time ti (ti > tn−1), where black cells represent the cells that were melted at tn−1 and will be melted again at tn (tn > ti > tn−1) and were never activated in the previous time step; (c) RVE of the cells at time tn, where several cells have melted again and were activated based on their respective temperature profile.
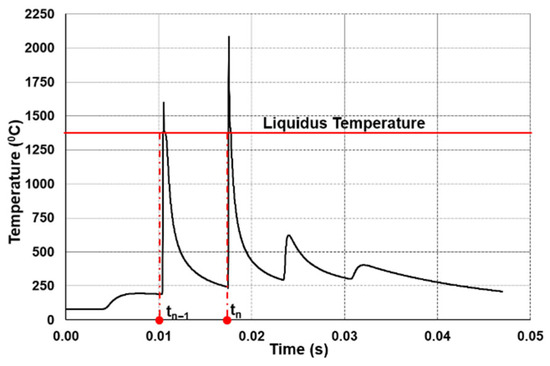
Figure 3.
Temperature-time profile of cell R in Figure 2: this cell melts twice during the process, namely at tn−1 and tn.
Apart from this algorithm, the two major characteristics of the model are nucleation and crystal growth, as discussed in the upcoming sections. Furthermore, considering the limitation posed by the dependence of CA models on memory-shuffling algorithms and the availability of computer memory, the authors have implemented an MPI-based parallelism approach, which is discussed in the later sections. This approach is in line with the reported findings that modern parallel computer architectures can significantly overcome memory-related constraints [24].
| Algorithm 1: Set Minimum Nucleation Time | |||
| input cells in, respectively, the directions with , temperature profile of size , where is the last entry of the discretized profile stored incrementally with time; the first entry, corresponding to list nucleation sites of size , where each site in is a cell of containing its position , melting temperature .
output cells | |||
| /*Iterate list of nucleation sites*/ | |||
| for to do | |||
| ; | |||
| ; /* for cell */ | |||
| /*Iterate backwards temperature profile of cell */ | |||
| for to do | |||
| ; | |||
| if then | |||
| ; | |||
| break; | |||
| end | |||
| end | |||
| end | |||
2.1. Nucleation
According to experiments conducted on the LPBF process, during solidification, columnar and equiaxed grains [36] are observed, appearing in different proportions depending on the processing parameters. The origin of these grains is different. To begin with, nucleation occurs preferentially at the fusion line [54] owing to a lower work of nucleation at preexisting solid–liquid interfaces. This type of nucleation is usually referred to as epitaxial nucleation in the literature [54,55]. Whereas epitaxial growth refers to the process where, once a solidification front is established, the solid phase expands by the attachment of atoms to the existing solid phase without the need for a new nucleus to form [56]. In the present, we refer to epitaxial nucleation as the nucleation of crystals that will grow by the mechanism of epitaxial growth. We note that nucleation events are also possible at the solid–liquid interface of epitaxially growing grains. These nuclei will usually have an orientation close [57] to that of the parent crystal, deviating only by some small misorientation owing to the introduction of crystal defects during solidification. Because the growth advantage of the parent grain is inherited, these nuclei are expected to grow epitaxially as well. For these reasons, nucleation of crystals at the substrate–liquid interface that successfully overcomes the stage of competitive growth and at the solid–liquid interface of epitaxial growing grains is termed as epitaxial nucleation [54]. Grains nucleated by this mechanism usually grow in a columnar fashion, but other morphologies are also possible depending on factors such as the temperature gradient and solidification front velocity. By contrast, nucleation in the melt also can occur away from the fusion line, which is referred to as bulk nucleation. Since these grains experience a more homogenous temperature environment with a uniform undercooling, they can grow equiaxially and can co-exist along with the columnar grains. Whereas these two nucleation mechanisms are intrinsic to LPBF [22,42,54], other mechanisms, such as nucleation at the powder liquid interface, at precipitates, inclusions, and inoculants, can also contribute to the microstructure formation. Nevertheless, only the two former mechanisms were found to be relevant in the alloy studied. The relative occurrence of the nucleation mechanisms depends, as aforementioned, on the processing conditions and influences the final grain morphology, grain size, grain size distribution, and crystallographic texture of a fabricated specimen. While the nuclei originated at the epitaxial often leads to columnar grains wherein the bulk nucleation typically halts the columnar growth and promotes equiaxed grains [54]. To account for these mechanisms, the current study adopts a heterogeneous nucleation approach. The proposed CA model considers that nucleation can occur both on the surface of the newly generated layers (epitaxial nucleation) and within the bulk of the liquid phase (bulk nucleation). Both the nucleation mechanisms are independent of each other, and the total number of sites of nucleation is predetermined using Equations (1) and (2) [42].
where is the total number of bulk nucleation sites, is the total number of surface nucleation sites, V is the total volume, S is the total surface area, and (m−3) and (m−2) are volume and surface nucleation density input parameters, respectively. The nucleation number density and in this study have been estimated using experimental data. While direct experimental data on 3D microstructures are challenging to obtain, the nucleation number densities were qualitatively estimated based on available 2D microstructure data and obtained grain morphologies. For bulk nucleation, the grain count was obtained by dividing the simulation domain volume by the volume of representative spherical grains, using the average experimentally observed grain diameter. For surface nucleation, a similar approach was applied using 2D grain size data to estimate nuclei per unit area. Experimental grain densities were determined by analyzing and processing EBSD data. This approach has been previously employed by Lian and Lin [22,42]. At the core of this nucleation process lies a stochastic identification of nucleation sites, a procedure driven by the assessment of nucleation probabilities. As such, unique random nucleation sites are chosen within the RVE. For considering bulk nucleation, the pool of cells that can be chosen corresponds to all cells in the liquid state, whereas for heterogeneous nucleation, only the cells in contact with pre-existing surfaces are selected. These randomly selected sites are subsequently evaluated based on a probability function. The likelihood of nucleation for a given cell is determined by its local undercooling, which conforms to a Gaussian distribution as shown in Equation (3). A site earns the status of a nucleation site only if the calculated probability () exceeds a certain probability . This probability is generated using a random number generator function within the simulation algorithm.
where is the probability of the nucleation, is the standard deviation of the probability function, is the mean nucleation undercooling, and is the local thermal undercooling given by the following:
where is the instantaneous local temperature of the cell, and is the liquidus temperature. It must be noted that the values of the parameters are different for bulk nucleation and surface nucleation. These parameters employed for the implementation of stochastic nucleation are presented in Table 1. Upon selection, a nucleation site remains inactive until the local thermal undercooling surpasses a predefined critical value . The assignment of to each nucleation site follows a Gaussian distribution, expressed in Equation (5):
where is the assigned critical undercooling for the ith cell, and and are the solidus and liquidus temperatures, respectively.

Table 1.
Nucleation parameters utilized in the simulation.
2.2. Crystal Growth and Crystallographic Orientation
In the solidification simulations, the chosen nuclei are activated once the local undercooling surpasses the critical threshold value , as explained in Section 2.1. Once the selected nucleation site is activated, the cell is assigned with a unique index number along with a crystallographic orientation, and the cell grows as per the kinetic growth model.
2.2.1. Crystallographic Orientations of the Nuclei
The crystallographic textures in metals develop based on one or more of the following mechanisms [58]: (a) solidification texture mechanism; (b) deformation texture mechanism; (c) re-crystallization texture mechanism; or (d) transformation texture mechanism. In the PBF-LB/M process, texture development primarily occurs through the solidification texture mechanism [59,60], which may be altered via solid-state phase transformations during cooling (mechanism (d)), as in martensitic steels [61]. The initial orientation of the crystal nuclei during solidification in LPBF has a determining effect on the final texture of the components [62]. In LPBF, crystals nucleating at the surface of the melt pool (epitaxial nucleation) have the preferred crystallographic direction such that their direction <100> (d100) aligns with the direction of maximum thermal gradient [62]. Furthermore, in the case of LPBF, the local thermal gradient direction often deviates from the macroscopic build direction due to the shape of the melt pool that facilitates an inclined solid–liquid interface [59,63]. Therefore, in the present model, the crystallographic orientations of the nucleation sites are chosen with consideration of the above-mentioned factors. For grains originating in the bulk, random orientations following the algorithm introduced by Kuffner [64] (Algorithm 2) in quaternion representation are assigned to the nuclei. In turn, epitaxial nuclei inherit the orientation of the substrate/interface on which they initially form. For this reason, the first layer of grains that solidify often has a texture similar to that of the substrate [65]. Within this initial layer, competitive growth takes place [54], and grains with growth advantages start dominating the microstructure as grain growth sets in and solidification proceeds further. In cubic metals, growth occurs preferentially along the <100> crystallographic direction. In LPBF, preferential growth does not depend solely on the crystallographic orientation of nuclei since the driving force for solidification, that is, the thermal gradient, determinedly influences crystal growth. Depending on the processing parameters, usually further growth results in the formation of columnar grains and determines the texture of the material. To assign the orientations of nuclei originating epitaxially, the direction of the thermal gradient at nucleation sites is first determined as
where is a normal vector in the same direction as the gradient, and represents the gradient of the temperature field. At a given nucleation site with coordinates , the direction of the maximum gradient is determined as follows: . Crystallographic orientations whose <100> (d100) axes are aligned with having a maximum deviation of 5° are sampled randomly and assigned to epitaxial nuclei. The growth algorithm for the dendrites in the present CA model is based on the decentered octahedron algorithm developed by Gandin et al. [66]. This algorithm causes primary dendrites to preferentially grow along the six half-diagonals of an octahedron, as shown in Figure 4 (see Ref. [67]).
| Algorithm 2: Generate Uniform Random Quaternion |
| input: None Data: Pseudo-random generator function: auxiliary variables:. |
| ; |
| ; |
| ; |
| ; |
| ; |
| return |
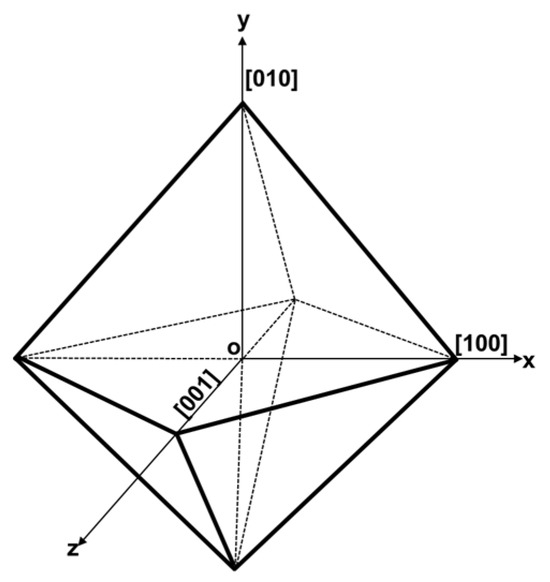
Figure 4.
A regular octahedron depicting the preferential growth direction of the primary dendrites.
2.2.2. Kinetic Growth Model
The growth of the nucleated grains is controlled by the dendrite growth kinetics, where the rate of growth is considered a function of its undercooling [66]. The undercooling ) comprises four different components:
where is the thermal undercooling and is defined as the difference between the liquidus temperature and the cell temperature, is the constitutional undercooling that is associated with the difference in composition of elements between the solid phase and the liquid phase at the solid–liquid interface, and is kinetic undercooling associated with the transport of atoms from the solid phase to the liquid and vice versa. Finally, is the curvature undercooling originating due to the formation of the solid–liquid interface during solidification [50]. LPBF is subjected to a high thermal gradient, and therefore, in the present model, crystal growth is considered a function of the total thermal undercooling only [68], and hence, Equation (7) can be further reduced to the following:
The thermal undercooling can also be expressed using the dimensionless number [69], given by the following:
where is the latent heat, and is the specific heat. The dimensionless thermal undercooling can again be presented using the Ivantsov relation [68,69,70,71]:
wherein, is the Ivantsov function, is the exponential integral function, and is the Peclet number. When it comes to the thermal field, the Peclet number is given by the following:
where is the growth rate of the solid–liquid interface. R is the tip radius of the dendrite and is the thermal diffusivity. Using Equations (9)–(11), the undercooling can be expressed as follows:
In order to further resolve Equation (12) in and , the stability criterion given by Trivedi [72] and Kurz and Fisher [73] is utilized. Their reduced stability criterion, which considers only the thermal undercooling, can be expressed as follows:
where is the Gibbs–Thomson coefficient. Using Equations (10), (12), and (13), the growth rate can be expressed in terms of undercooling, and this growth model is often termed as Lipton–Glicksman–Kurz (LGK) model [69]. To reduce the computational effort, the LKG model was fitted to a third-degree polynomial shown in Equation (14) after being determined numerically using the same procedure as in Ref. [69].
where and are the curve fitting parameters as shown in Figure 5 and are identified by calculating the at different given s.
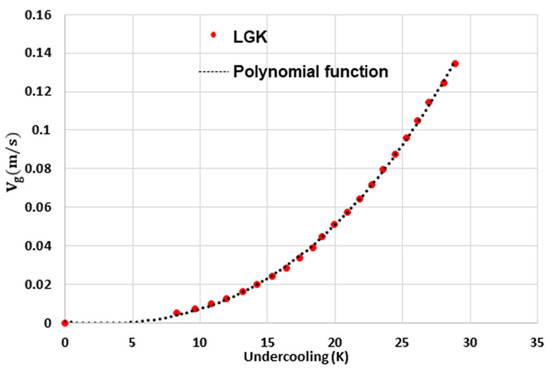
Figure 5.
Growth kinetics of X30Mn21 dendritic tip calculated using the LGK model and fitted with 3rd ordered polynomial function.
2.3. Coupling of Finite Element Method and Cellular Automaton
To simulate the temperature of the cells in the automaton, the temperature field is obtained independently by carrying out FEM simulations using the ABAQUS FEM solver [74]. In these thermal simulations, the laser heat source was implemented in the DFLUX user subroutine as a moving Gaussian profile. The absorptivity coefficient was set to 0.41, which is a typical value reported in the literature for Nd:YAG laser sources [75]. The absorptivity determines the fraction of the nominal laser power effectively absorbed by the powder bed surface and thus directly influences the resulting temperature field. Owing to the limitations and scopes of the respective models, the FEM and CA models have different mesh sizes and time steps. The mesh of the CA is governed by the dendrite-arm spacing and is finer; it is, therefore, superimposed on the FEM mesh as represented in Figure 6a. At each time-step of the CA simulation, the temperature of the CA cell is interpolated from nodes of the FEM simulation. The time step for the CA is chosen such that the crystal growth never exceeds 0.2 times the cell size:
where is the CA’s cell size, is the growth rate (m/sec), and the max function ensures the maximum growth rate is considered within the simulation domain. This approach ensures that the time steps are adaptive, adjusting their resolution ( based on the undercooling of the cells. For all simulations presented in this work, the time step () was computed dynamically using Equation (15), ensuring that the maximum interface growth per time increment did not exceed 20% of the cell dimension. This adaptive time stepping was applied consistently for all CA cell size configurations. The employed time step for the CA simulation is finer than the one used in the FEM simulation for determining the temperature field. Therefore, for determining the nodal temperature of the cell at a specific time between two adjacent time steps in the FEM simulation, as a first approximation, a linear interpolation technique was used:
where the subscripts n and n−1 represent the current and the previous time steps of the FEM domain, is any time such that , and is the temperature of the pth node at . Thereafter, the temperature of a CA cell is computed by performing a trilinear interpolation of the temperature of the corresponding neighboring nodes of the CA cell, as represented in Figure 6b. The temperature of any CA cell is given by the following:
where is the interpolated temperature of ith cell of the CA at any time j, is the temperature field vector of the 8 nearest neighbors (see Figure 6b), and Q is the distance vector related to the ith cell. For a detailed implementation of the interpolation technique, readers are referred to [76].
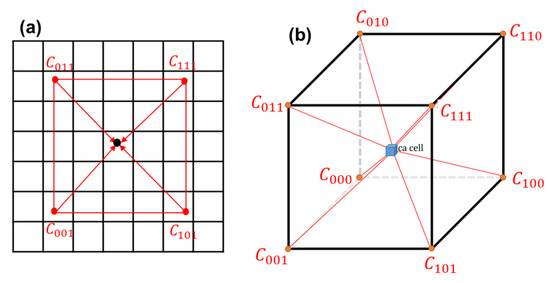
Figure 6.
(a) Coarser FEM mesh overlapping fine mesh of CA; (b) schematic representation of the tri-linear interpolation technique.
2.4. Parallelization Technique
In Section 2, the limitations of CA models due to their reliance on memory-shuffling algorithms were discussed. Evidently, these limitations hamper performance based on the available computing device memory. Furthermore, simulation of microstructure evolution in LPBF requires considering large simulation domains to represent the microstructural features caused by the melt pools that often extend beyond the microscopic scale. It is noted also that physically faithful simulations of microstructure phenomena require large RVEs and the consideration of numerous microstructure features/grains to overcome the initial transient caused by departing from initial setups off equilibrium [77]. For these reasons, parallelized models are not only recommended but also necessary. To overcome this challenge, a static domain decomposition strategy within a parallel computing architecture was applied. In this approach, the RVE domain is partitioned into multiple sub-domains, the number of which corresponds to the assigned processors for parallel computing. By evenly distributing the simulation workload among these processors, each one performs its computations independently. Communication between processors, which is needed to guarantee the contiguity of the RVE, is achieved by the MPI to exchange data. Figure 7 illustrates this strategy, with the digital interface acting as a boundary to separate the subdomains.
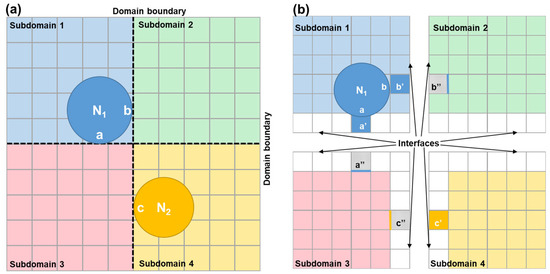
Figure 7.
(a) RVE domain decomposed into 4 subdomains, dashed lines represent the subdomain boundaries, subdomain 1 and subdomain 4 contain active nuclei N1 and N2, a, b, and c represent the cells via which the nuclei touch the boundary. (b) When nuclei encounter the subdomain boundaries, the digital interface stores the required information (a′, b′, and c′) and transmits the corresponding information (a″, b″, c″) to the respective subdomain to continue nuclei growth.
This interface ensures that each processor is aware of its designated portion of the overall domain, thereby preventing interference with other processors’ computations. Communication and exchange of necessary information between neighboring subdomains occur through this interface, as depicted in Figure 7b. For a clearer understanding, we present a simplified example in Figure 7, where the entire computing domain was divided into four subdomains, each separated by a digital domain boundary. Subdomains 1 and 4 are initially seeded with one nucleus each. As these nuclei grow and encounter the boundary of their respective subdomains, critical growth-related information is stored in the interfaces. Later, this information is communicated to the corresponding subdomains, allowing the growth to continue seamlessly. Overall, employing the static domain decomposition strategy within the parallel computing architecture addresses the memory limitations of CA and facilitates efficient and reliable large-scale simulations. The basic structure of the program is exemplified in Figure 8 by its flowchart.
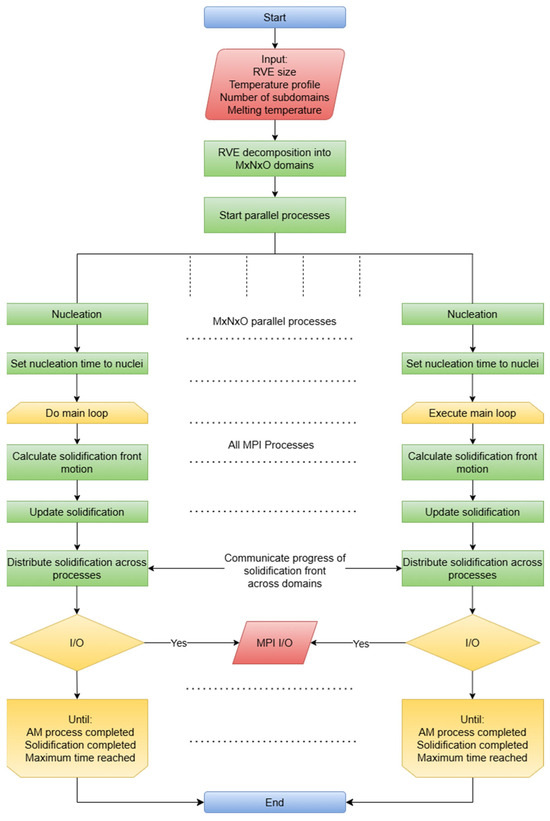
Figure 8.
Program flowchart where processes are started in parallel. Data are globally shared before domain subdivision. Once parallel execution begins, all tasks are performed locally with communication exchanges occurring periodically. Execution continues until the AM process ends, or the full melting of the powders and solidification are completed, or the maximum user-defined maximum solidification time is reached.
3. Results and Discussions
For validating the developed CA model, a set of simulations was performed, and the obtained results were compared with experiments. In particular, simulated grain morphologies, grain size, and texture were compared qualitatively and quantitatively. The test material for this assessment was a single-phase austenitic (fcc) advanced high-strength steel (AHSS), namely X30Mn21. The specifics of the simulation and the experiments, including laser power, scan speed, layer thickness, and hatch distances (HDs), are outlined in Table 2. LPBF process parameters were the same for the simulations and the experiments. The process parameters, including the layer thickness, laser power, and hatch distance, were selected based on the available literature for LPBF processing of austenitic steels [74,78]. These parameters promote sufficient melt pool overlap and layer bonding, thereby contributing to dense parts and influencing the development of the resulting grain structure. For the sake of simplicity, in the present study, no rotation between the layers was applied, whereas a bidirectional scan strategy in each layer was employed. The crystal growth rate for the simulations was computed as per Equation (14). The polynomial coefficients and relating the thermal undercooling and crystal growth were identified to be (m/(sK3)) and (m/(sK2)), respectively, and were derived using the thermo-physical properties of X30Mn21 reported in Table 3.

Table 2.
LPBF process parameters.

Table 3.
Thermo-physical properties of X30Mn21 [74,79,80,81].
The simulations were conducted using two distinct CA cell sizes, namely. 0.8 µm and 2 µm, to evaluate the effect of the cell size on the accuracy of the simulations. Experimental cubical (10 mm × 10 mm × 10 mm) specimens were fabricated using an Aconity Mini L-PBF machine (Aconity-3D GmbH, Herzogenrath Germany). The specimens were cut perpendicular to the scan direction (SD) for the microstructural analysis. The resulting cross-section was polished to prepare it for electron backscatter diffraction (EBSD) measurements. EBSD measurements were performed on a GeminiSEM field emission gun (Carl Zeiss AG, Oberkochen, Germany). Finally, to characterize the crystallographic texture from both experiments and simulation, the MTEX toolbox (version 5.10.2) within MATLAB (version R2024b) was utilized [82]. Finally, Paraview [83] was utilized for rendering the 3D grain structure obtained with the CA simulation.
3.1. Experimental Analysis
The microstructure of the specimen obtained experimentally is presented in Figure 9a. Additionally, the inverse pole figures (IPFs) and pole figures for the specimen are presented in Figure 10 and Figure 11, respectively. The EBSD mapping in Figure 9a exhibits a “crystallographic lamellar microstructure” (CLM) [84], wherein grains of two different orientations, in this case <100> and <101>, alternate. While most grains displayed an elongated shape along the build direction and aligned with the <101> crystallographic direction, the grains at the centerline of the melt pool adopted the <100> orientation. This behavior can be attributed to the fact that, during solidification in the LPBF process, grains tend to align with the crystallographic orientation that corresponds to the maximum thermal gradient [59]. The nuclei that originated at the centerline of the melt pool, wherein the melt pool has the lowest curvature with the thermal gradient perpendicular to build direction, adopt the <100> crystallographic orientation [59]. In contrast, neighboring grains experience a thermal gradient inclined by approximately 25° from the build direction, which leads them to adopt the <101> crystallographic orientation [74]. From Figure 10, it is evident that the specimen has a strong <101> texture parallel to the build direction. Furthermore, Figure 9a also reveals the presence of equiaxed grains along the centerline of the laser scan. This is a commonly observed feature in the LPBF process due to more homogeneous thermal dissipation. The centerline of the melt pool is often subjected to a low G/R ratio, where G is the thermal gradient and R is the solidification rate. This low G/R ratio promotes the formation of equiaxed grains along the centerline of the melt pool [43]. The average grain size, expressed in terms of the equivalent sphere diameter, was determined to be 11.81 (±18.49) µm for the specimen. The distribution of grain sizes and the grain aspect ratio of the specimen are visually presented in Figure 12 and Figure 13, respectively.
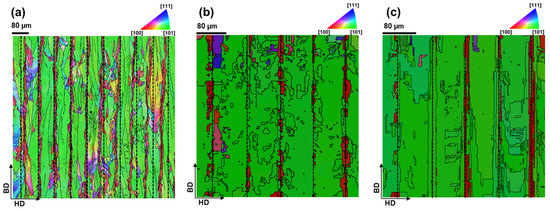
Figure 9.
EBSD map of the X30Mn21 sample obtained (with color-coding according to the inverse pole figure taking BD as reference axis): (a) experimentally; (b) CA simulation with CA cell size of dcell = 2 µm; (c) CA simulation with CA cell size of dcell = 0.8 µm.

Figure 10.
IPF obtained for X30Mn21: (a) experimentally; (b) with CA simulation with cell size of dcell = 2 µm; (c) with CA simulation with cell size of dcell = 0.8 µm.
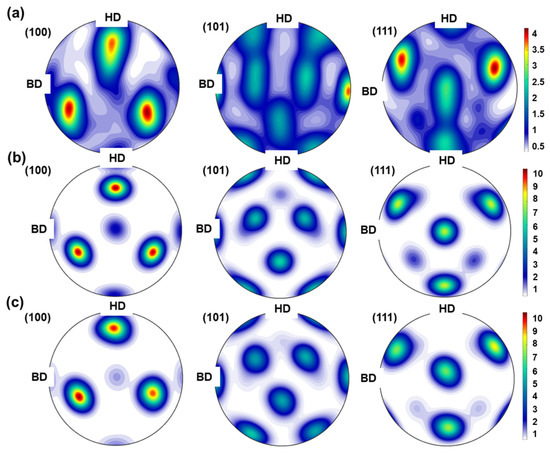
Figure 11.
Pole figures <100>, <101>, and <111> crystallographic direction for: (a) specimen fabricated with LPBF; (b) CA simulation with CA cell size of dcell = 2 µm; (c) CA simulation with CA cell size of dcell = 0.8 µm.
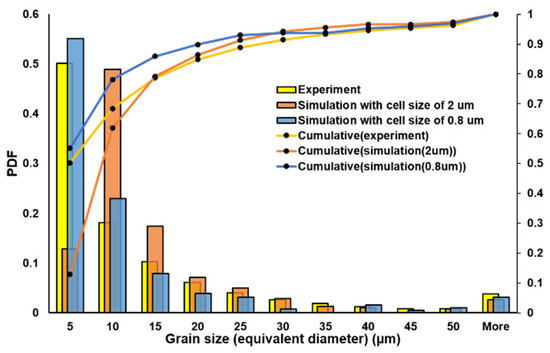
Figure 12.
Histogram of grain size distribution obtained from experiments and CA simulations using different cell sizes.
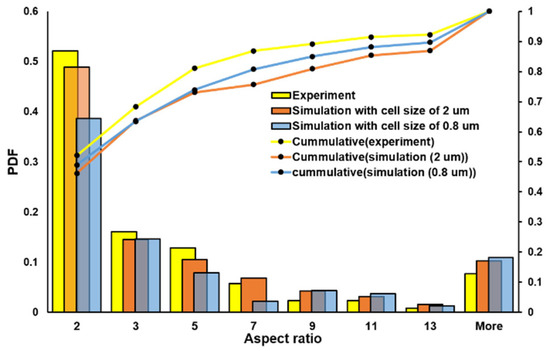
Figure 13.
Histogram of aspect ratio distribution obtained from experiments and CA simulations using different cell sizes.
3.2. CA Simulation Analysis
CA simulations have been performed based on the model described in Section 2. Figure 14a,b presents the simulated grain morphology at two different cell resolutions of 2 µm and 0.8 µm. For the cross-sectional analysis and comparison with the experiments, the grain structure was generated for Section 1-1 and Section 2-2 (see Figure 14). Section 1-1 corresponds to the simulated grain morphology with a cell size of 2 µm, while Section 2-2 represents the simulated grain morphology with a smaller cell size of 0.8 µm. It is important to note that both sections were located at the same position within the simulation domain. The respective grain structure is presented in Figure 9. The resulting IPF and pole figures of the simulations are illustrated in Figure 10 and Figure 11, respectively. In all cases (experimental and simulated), the IPF reported in Figure 10 indicates a texture along <101>. The CA simulation of the LPBF process, with a cell size of 0.8 µm and 2 µm, estimated an average grain size of 10.11 µm (±18.7) µm and 12.65 µm (±15.69 µm), respectively. The grain size distribution and the aspect ratio distribution obtained from the simulation are presented in Figure 12 and Figure 13, respectively.
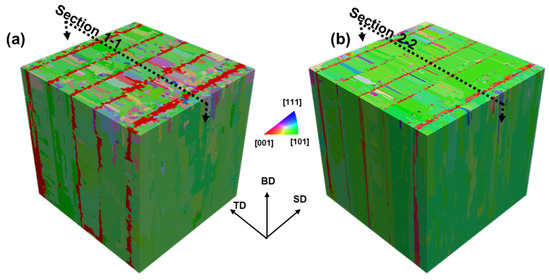
Figure 14.
Isometric view of the simulated grain structure at different CA cell sizes: (a) 2 µm and (b) 0.8 µm.
The microstructure observed in Figure 9a from experimental data reveals elongated grains, forming a columnar morphology. Figure 10a, displaying the IPF plot, and Figure 11a, illustrating the pole figures, provide robust evidence of a pronounced <101> texture along the build direction (BD). Such a microstructure is commonly encountered in LPBF [85]. This texture formation can also be attributed to the fact that the thermal gradient in this set up was not parallel but inclined to the build direction [74]. Because of this inclination, the crystals would have taken such orientations that align the crystal along with the build direction during nucleation [62], in this case <101>-oriented grains, thereby developing the aforementioned texture. The CA simulations, displayed in Figure 9b,c, effectively predict the morphological characteristics of X30Mn21 alloys and capture the predominant texture. However, discrepancies are observed in the detailed reproduction of the crystallographic lamellar microstructure. While the simulated grains in the centerline grow predominantly along the BD, not all exhibit the experimental <100> orientation along the centerline. This deviation is likely due to the stochastic nucleation approach employed in the current CA model, where the nucleation sites were chosen randomly. This stochastic placement likely contributed to the incomplete reproduction of the experimentally observed CLM. Moreover, the grain size distribution and aspect ratio, as shown in Figure 12 and Figure 13, respectively, indicate that over 80% of the grains possess an equivalent sphere diameter of less than 20 µm and an aspect ratio below seven. Additionally, the micrograph highlights the presence of equiaxed grains, particularly along the centerline of the hatch line. This occurrence can be attributed to rapid solidification near the centerline [86]. The presented optimized CA for the LPBF model appears to effectively predict microstructure evolution and associated texture. A qualitative comparison of the experimentally obtained and simulated microstructure in Figure 9 reveals striking similarities between the simulations (both with 0.8 µm and with 2 µm) and the experimental results. Furthermore, the grain size distribution and aspect ratio distribution obtained through simulations and experiments exhibit a consistent pattern (see Figure 12). Moreover, the experimental specimen yields an average grain size of 11.81 µm, closely aligned with the prediction from simulations. Specifically, the simulation with a cell size of 0.8 µm predicts a grain size of 10.11 µm, while the simulation with a cell size of 2 µm prognosticates a grain size of 12.65 µm. It is worth noting that decreasing the cell resolution results in an increased average grain size. In fact, the increase in CA cell size from 0.8 µm to 2 µm corresponds to an approximately 30% increase in average grain size. In fact, the cell size influences the resolution of grain growth simulation, and the smallest possible grain size in a CA simulation is limited by its cell size. A larger CA cell size means a coarser simulation grid, which can lead to larger calculated grain sizes as the model may fail to capture the very fine grains that form in LPBF because of rapid solidification and high cooling rate [42,43]. The experimental grain size distribution has 50% of grains having a size less than or equal to 5 µm (see Figure 12). While the CA simulation with 0.8 µm was able to predict this distribution, the simulation with 2 µm fails to capture accurately the presence of fine grains. However, this discrepancy diminishes as the grain size increases. Therefore, it becomes evident that increasing the cell size tends to overlook the presence of fine equiaxed grains, underscoring the importance of choosing an appropriately fine CA cell size to accurately capture the microstructural features. Interestingly, irrespective of the cell sizes, the CA simulation was able to predict the aspect ratio distribution of the grains correctly.
To have a statistical comparison between the experimentally obtained microstructure and the simulated microstructure, the pair correlation function (PCF), g(r), was generated. The PCF quantifies the likelihood of finding two structures at a specific distance compared to a random distribution [87,88], which can be used to provide insights into the spatial arrangement of grains. Figure 15 shows a rapid decay of g(r) near the origin for indicating that morphological features, i.e., grains are close to each other in the region near to origin. The consistency in PCF trend between experiments and simulations presented in Figure 15 underlines the effectiveness of the CA model in capturing the essential characteristics of the microstructural evolution process. However, with 2 µm, we observe slight deviations from the experimental curve. This discrepancy could be attributed to the fact that the coarser simulation fails to capture the smaller grains, as indicated by the grain size distribution (see Figure 12). This results in a divergence in the PCF over larger distances. In contrast, the close agreement between the experimental PCF and the finer simulation with 0.8 µm demonstrates the predictive power of the present CA model in accurately capturing the microstructure.
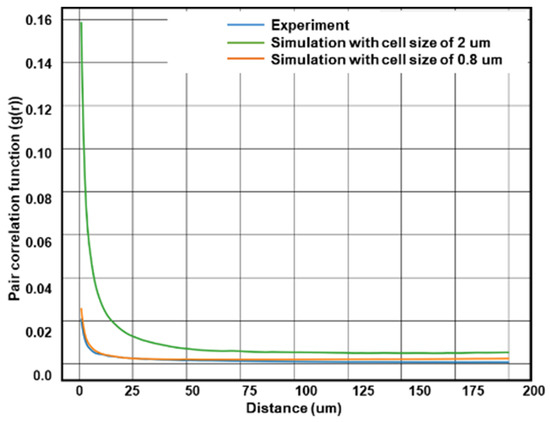
Figure 15.
Pair correlation functions (PCFs) of microstructures obtained by simulation and experiment.
Furthermore, it is noteworthy that both the experimental findings and the simulations consistently converge when it comes to texture analysis as well. The simulations, performed with varying CA cell dimensions, consistently predict a prominent <101> texture, as depicted in Figure 10 and Figure 11. This outcome closely aligns with experimental data. For a better comparison between the experimental texture and the simulated texture, the respective pole figures of experimental results and simulated results were subtracted, and differential pole figures were generated. The resulting pole figures are presented in Figure 16. From Figure 16, it appears that, while the main texture components of the pole figure obtained in experiments align with the simulations, there are subtle divergences in the crystallographic orientations. Specifically, the simulated PFs have additional random texture components, which are not visible in the experiments. This is attributed to the fact that, in simulations, bulk nucleated crystals were allowed to have any random orientation. If such a nucleus experiences a strong temperature gradient resulting in a large driving force, it will be able to grow, albeit less frequently than <101> grains that experience preferred conditions because they are better aligned with the thermal gradient. It is noted that the simulated low intensity of off <101> grains substantiates that in the whole RVE, and these orientations are rare. Depending on the pattern strategies and physical conditions of additive manufacturing processes, other orientations may also appear as long as they experience growth advantages either from their crystallographic orientation or because they experience a high driving force [59,65,89]. Because of this, the CA model was able to predict the <101> texture along the BD as observed in the experiments, but with a slight addition of random components. Overall, statistically, the developed CA model was able to predict the texture of the experimentally produced specimens.
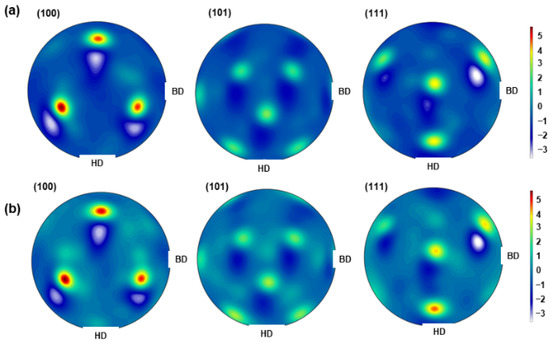
Figure 16.
Pole figures subtraction of: (a) CA simulation with cell size of 2 um and experiment; (b) CA simulation with cell size of 0.8 µm and experiment.
3.3. Efficiency of the Cellular Automaton Model and Simulation Setup
To evaluate the effectiveness of parallelization on the presented CA model, a CA simulation using a CA cell size of 0.8 µm was performed with a varying number of computational processes. The process and simulation parameters are detailed in Table 2 and Table 3, respectively. With a total of CA cells, the computational time, and the parallel efficiency with respect to the number of processors were studied and are presented in Figure 17. A significant increase in simulation speed of up to 40% was observed by doubling the number of processors from one to two. However, a further increase in the number of processors did not result in a proportional simulation speed. This leads to a drop in the efficiency of each processor, as indicated in Figure 17. Specifically, efficiency dropped from 80% with two processors to 50% with six processors. This decline of efficiency could be attributed to the spatial division within the simulation domain among the processors, which potentially led to load imbalances within the processors. Each processor has its own domain and becomes activated only when the cells within it become activated. However, when it comes to LPBF, not all the domains are activated simultaneously. They wait for their respective melting times. Consequently, processors may idly wait during these intervals, leading to uneven workload distribution. Some processors may carry heavier loads than others at certain points, resulting in suboptimal utilization of resources and decreased overall efficiency [42]. Moreover, the presented parallelized CA model has an innovative approach to manage the remelting in LPBF, which aims to reduce the computation load. The CA model is effective in reducing the simulation time. Considering the time of simulation and number of CA cells, simulation time per CA cell comes out to be 1.04 µmin, which is approximately 30% less than that reported in the literature under similar conditions [42]. This increment in performance is crucial for simulating the microstructure at the part scale, where millions or even billions of additional CA cells would be involved. Moreover, it is worth noting that the performance of the model may be further improved depending on specific parameters, such as an increase in remelting volume. This suggests promising potential of the presented model for even greater efficiency enhancements under varying conditions.
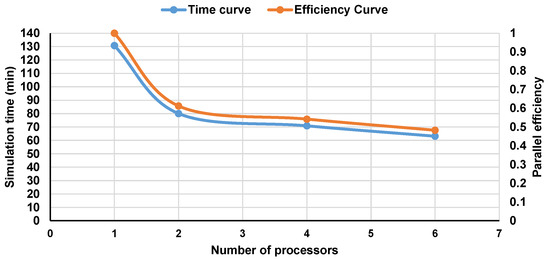
Figure 17.
Computational time and the efficiency of parallelization of the 3D CA model.
4. Conclusions
In this study, we introduced an optimized parallelized Cellular Automaton (CA) model coupled with Finite Element (FE) temperature simulations to predict microstructure evolution in the additive manufacturing process LPBF. This work was developed to present a novel algorithm tailored for LPBF, specifically aimed at addressing the computational redundancy arising from repeated remelting and re-solidification events, which is an inherent and computationally intensive aspect of the process. By focusing only on the final solidification stage of each CA cell based on its thermal history, the model effectively reduces unnecessary calculations while maintaining accuracy.
This comprehensive CA framework accounts for both bulk and epitaxial nucleation mechanisms. To validate the model’s accuracy, X30Mn21 AHSS specimens were fabricated, and the resulting microstructure and texture were analyzed. The simulations, performed using two distinct CA cell sizes, showed excellent agreement with experimental results. Simulations, performed using two distinct CA cell sizes, showed excellent agreement with the experimental results. The study also highlights the influence of CA cell size on the simulated microstructure: increasing cell size did not significantly affect the simulated texture but led to an overestimation of the average grain size due to missed equiaxed grains. Quantitatively, the average grain sizes predicted by the simulations showed deviations relative to the experiments, particularly the simulation with a 0.8 µm cell size underestimated the average grain size by approximately 14%, while the 2 µm cell size slightly overestimated it by approximately 7%. The aspect ratio distributions also demonstrated close correspondence, with more than 80% of grains in both simulation and experiment exhibiting aspect ratios below seven, and overall differences in frequency distributions remaining within 10%. These results further support the predictive capability of the proposed CA model.
Due to the efficient remelting handling, the proposed model is at least 30% faster than conventional CA models used for LPBF. Furthermore, the use of MPI-based parallelization significantly increased simulation speed, which is particularly important for simulating large microstructures. However, we observed that the current static domain decomposition strategy can lead to processor inefficiencies due to load imbalances. To overcome this, future work should explore dynamic domain decomposition or adaptive parallelization techniques to further improve performance.
Nevertheless, a limitation of the present study is that the Cellular Automaton model is based on a mesoscale framework, which inherently lacks the resolution and physical fidelity required to capture fine dendritic structures and solute segregation patterns. However, capturing such sub-grain features would be possible by coupling this CA approach with Phase Field models. This represents an important direction for future work as well. Furthermore, while the current framework was implemented on single-phase austenitic steel, extending the model to multi-phase alloys is indeed feasible, and the model can even be extended to include precipitation by coupling the presented efficient CA model with precipitation models, which remained under the scope of future work. Finally, while the model shows strong predictive capabilities under the tested conditions, its robustness and broader applicability will be explored under different process parameters and material systems in future work. This will further demonstrate the versatility and scalability of the presented CA framework for LPBF microstructure simulation.
Author Contributions
Conceptualization, C.H. and L.A.B.-M.; Methodology, C.H. and L.A.B.-M.; Software, A.S. and L.A.B.-M.; Validation, A.S.; Formal analysis, A.S.; Investigation, A.S.; Writing—original draft, A.S.; Writing—review and editing, C.H. and L.A.B.-M.; Supervision, C.H. and L.A.B.-M.; Project administration, L.A.B.-M.; Funding acquisition, L.A.B.-M. All authors have read and agreed to the published version of the manuscript.
Funding
This project received funding from the European Union’s Horizon 2020 research and innovation programme under the Marie Skłodowska-Curie grant agreement No 956401 XS-Meta and from the European Research Council (ERC) under the European Union’s Horizon Europe research and innovation program (grant agreement No. 101077977 HeteroGenius4D).
Data Availability Statement
The original contributions presented in this study are included in the article. Further inquiries can be directed at the corresponding author.
Acknowledgments
CH acknowledges the support of the German Federal Ministry of Education and Research within the NanoMatFutur project “MatAM—Design of additively manufactured high-performance alloys for automotive applications” (project ID 03XP0264). We thank the support provided by the EXPLOR HPC Center of the University of Lorraine for our project 2019EXTXX1184.
Conflicts of Interest
The authors declare no conflict of interest.
References
- Yakout, M.; Elbestawi, M.; Veldhuis, S.C. A Review of Metal Additive Manufacturing Technologies. Solid State Phenom. 2018, 278, 1–14. [Google Scholar] [CrossRef]
- Singh, A.; Singh, H. Metal Additive Manufacturing: From History to Applications. In Innovations in Additive Manufacturing; Khan, M.A., Jappes, J.T.W., Eds.; Springer International Publishing: Cham, Switzerland, 2022; pp. 3–32. [Google Scholar] [CrossRef]
- Frazier, W.E. Metal additive manufacturing: A review. J. Mater. Eng. Perform. 2014, 23, 1917–1928. [Google Scholar] [CrossRef]
- Bajaj, P.; Hariharan, A.; Kini, A.; Kürnsteiner, P.; Raabe, D.; Jägle, E.A. Steels in additive manufacturing: A review of their microstructure and properties. Mater. Sci. Eng. A 2020, 772, 138633. [Google Scholar] [CrossRef]
- Schwab, H.; Prashanth, K.G.; Löber, L.; Kühn, U.; Eckert, J. Selective Laser Melting of Ti-45Nb Alloy. Metals 2015, 5, 686–694. [Google Scholar] [CrossRef]
- Vafadar, A.; Guzzomi, F.; Rassau, A.; Hayward, K. Advances in metal additive manufacturing: A review of common processes, industrial applications, and current challenges. Appl. Sci. 2021, 11, 1213. [Google Scholar] [CrossRef]
- Sames, W.J.; List, F.A.; Pannala, S.; Dehoff, R.R.; Babu, S.S. The metallurgy and processing science of metal additive manufacturing. Int. Mater. Rev. 2016, 61, 315–360. [Google Scholar] [CrossRef]
- Singh, A.; Caprio, L.; Previtali, B.; Demir, A.G. Processability of pure Cu by LPBF using a ns-pulsed green fiber laser. Opt. Laser Technol. 2022, 154, 108310. [Google Scholar] [CrossRef]
- Trevisan, F.; Calignano, F.; Lorusso, M.; Pakkanen, J.; Aversa, A.; Ambrosio, E.P.; Lombardi, M.; Fino, P.; Manfredi, D. On the Selective Laser Melting (SLM) of the AlSi10Mg Alloy: Process, Microstructure, and Mechanical Properties. Materials 2017, 10, 76. [Google Scholar] [CrossRef]
- Song, B.; Zhao, X.; Li, S.; Han, C.; Wei, Q.; Wen, S.; Liu, J.; Shi, Y. Differences in microstructure and properties between selective laser melting and traditional manufacturing for fabrication of metal parts: A review. Front. Mech. Eng. 2015, 10, 111–125. [Google Scholar] [CrossRef]
- Yap, C.Y.; Chua, C.K.; Dong, Z.L.; Liu, Z.H.; Zhang, D.Q.; Loh, L.E.; Sing, S.L. Review of selective laser melting: Materials and applications. Appl. Phys. Rev. 2015, 2, 041101. [Google Scholar] [CrossRef]
- Körner, C.; Markl, M.; Koepf, J.A. Modeling and Simulation of Microstructure Evolution for Additive Manufacturing of Metals: A Critical Review. Metall. Mater. Trans. A Phys. Metall. Mater. Sci. 2020, 51, 4970–4983. [Google Scholar] [CrossRef]
- Zhang, Y.; Xiao, X.; Zhang, J. Kinetic Monte Carlo simulation of sintering behavior of additively manufactured stainless steel powder particles using reconstructed microstructures from synchrotron X-ray microtomography. Results Phys. 2019, 13, 102336. [Google Scholar] [CrossRef]
- Rodgers, T.M.; Madison, J.D.; Tikare, V. Simulation of metal additive manufacturing microstructures using kinetic Monte Carlo. Comput. Mater. Sci. 2017, 135, 78–89. [Google Scholar] [CrossRef]
- Lee, K.-H.; Yun, G.J. Prediction of melt pool dimension and residual stress evolution with thermodynamically-consistent phase field and consolidation models during re-melting process of SLM. Comput. Mater. Contin. 2021, 66, 87–112. [Google Scholar] [CrossRef]
- Ao, X.; Xia, H.; Liu, J.; He, Q. Simulations of microstructure coupling with moving molten pool by selective laser melting using a cellular automaton. Mater. Des. 2020, 185, 108230. [Google Scholar] [CrossRef]
- Yang, J.; Yu, H.; Yang, H.; Li, F.; Wang, Z.; Zeng, X. Prediction of microstructure in selective laser melted Ti–6Al–4V alloy by cellular automaton. J. Alloys Compd. 2018, 748, 281–290. [Google Scholar] [CrossRef]
- Koepf, J.A.; Gotterbarm, M.R.; Markl, M.; Körner, C. 3D multi-layer grain structure simulation of powder bed fusion additive manufacturing. Acta Mater. 2018, 152, 119–126. [Google Scholar] [CrossRef]
- Eiken, J.; Böttger, B.; Steinbach, I. Multiphase-field approach for multicomponent alloys with extrapolation scheme for numerical application. Phys. Rev. E-Stat. Nonlinear Soft Matter Phys. 2006, 73, 066122. [Google Scholar] [CrossRef]
- Samy, V.P.N.; Schäfle, M.; Brasche, F.; Krupp, U.; Haase, C. Understanding the mechanism of columnar–to-equiaxed transition and grain refinement in additively manufactured steel during laser powder bed fusion. Addit. Manuf. 2023, 73, 103702. [Google Scholar] [CrossRef]
- Koepf, J.A.; Soldner, D.; Ramsperger, M.; Mergheim, J.; Markl, M.; Körner, C. Numerical microstructure prediction by a coupled finite element cellular automaton model for selective electron beam melting. Comput. Mater. Sci. 2019, 162, 148–155. [Google Scholar] [CrossRef]
- Lian, Y.; Gan, Z.; Yu, C.; Kats, D.; Liu, W.K.; Wagner, G.J. A cellular automaton finite volume method for microstructure evolution during additive manufacturing. Mater. Des. 2019, 169, 107672. [Google Scholar] [CrossRef]
- Kühbach, M.; Gottstein, G.; Barrales-Mora, L. A statistical ensemble cellular automaton microstructure model for primary recrystallization. Acta Mater. 2016, 107, 366–376. [Google Scholar] [CrossRef]
- Kühbach, M.; A Barrales-Mora, L.; Gottstein, G. A massively parallel cellular automaton for the simulation of recrystallization. Model. Simul. Mater. Sci. Eng. 2014, 22, 075016. [Google Scholar] [CrossRef]
- Hesselbarth, H.; Göbel, I. Simulation of recrystallization by cellular automata. Acta Metall. Mater. 1991, 39, 2135–2143. [Google Scholar] [CrossRef]
- Shankar, G.; Raguraman, S.; Barrales-Mora, L.A.; Suwas, S. Development of Recrystallization Texture in Commercially Pure Titanium: Experiments and Simulation. JOM 2020, 72, 4559–4573. [Google Scholar] [CrossRef]
- Schäfer, C.; Pomana, G.; Mohles, V.; Gottstein, G.; Engler, O.; Hirsch, J. Recrystallization modeling of AA8XXX alloys with cellular automata considering recovering kinetics. Adv. Eng. Mater. 2010, 12, 131–140. [Google Scholar] [CrossRef]
- Haase, C.; Kühbach, M.; Barrales-Mora, L.A.; Wong, S.L.; Roters, F.; Molodov, D.A.; Gottstein, G. Recrystallization behavior of a high-manganese steel: Experiments and simulations. Acta Mater. 2015, 100, 155–168. [Google Scholar] [CrossRef]
- Haase, C.; Barrales-Mora, L.A. Influence of deformation and annealing twinning on the microstructure and texture evolution of face-centered cubic high-entropy alloys. Acta Mater. 2018, 150, 88–103. [Google Scholar] [CrossRef]
- Shankar, G.; Gayatri, V.; Barrales-Mora, L.A.; Suwas, S. Evolution of recrystallization texture in medium to low stacking fault energy alloys: Experiments and simulations. Int. J. Plast. 2024, 172, 103827. [Google Scholar] [CrossRef]
- Shankar, G.; Sanandiya, S.; Barrales-Mora, L.A.; Suwas, S. Evolution of recrystallization texture in nickel-iron alloys: Experiments and simulations. Philos. Mag. 2023, 103, 1787–1827. [Google Scholar] [CrossRef]
- Rappaz, M.; Gandin, C.-A. Probabilistic modelling of microstructure formation in solidification processes. Acta Metall. Mater. 1993, 41, 345–360. [Google Scholar] [CrossRef]
- Gandin, C.-A.; Rappaz, M. A coupled finite element-cellular automaton model for the prediction of dendritic grain structures in solidification processes. Acta Metall. Mater. 1994, 42, 2233–2246. [Google Scholar] [CrossRef]
- Gandin, C.-A.-A.; Desbiolles, J.L.; Rappaz, M.; Thevoz, P. A three-dimensional cellular automation-finite element model for the prediction of solidification grain structures. Metall. Mater. Trans. A 1999, 30, 3153–3165. [Google Scholar] [CrossRef]
- Gandin, C.-A.; Schaefer, R.; Rappax, M. Analytical and numerical predictions of dendritic grain envelopes. Acta Mater. 1996, 44, 3339–3347. [Google Scholar] [CrossRef]
- Shi, R.; Khairallah, S.A.; Roehling, T.T.; Heo, T.W.; McKeown, J.T.; Matthews, M.J. Microstructural control in metal laser powder bed fusion additive manufacturing using laser beam shaping strategy. Acta Mater. 2020, 184, 284–305. [Google Scholar] [CrossRef]
- Zinovieva, O.; Zinoviev, A.; Patel, M.; Molotnikov, A.; Easton, M. Modelling grain refinement under additive manufacturing solidification conditions using high performance cellular automata. Mater. Des. 2024, 245, 113248. [Google Scholar] [CrossRef]
- Mohebbi, M.S.; Ploshikhin, V. Simulation of primary particle development and their impact on microstructural evolution of sc-modified aluminum alloys during additive manufacturing. Metals 2021, 11, 1056. [Google Scholar] [CrossRef]
- Mohebbi, M.S.; Ploshikhin, V. Implementation of nucleation in cellular automaton simulation of microstructural evolution during additive manufacturing of Al alloys. Addit. Manuf. 2020, 36, 101726. [Google Scholar] [CrossRef]
- Staroselsky, A.; Voytovych, D.; Acharya, R. Prediction of Ni-based alloy microstructure in wire arc additive manufacturing from cellular automata model. Comput. Mater. Sci. 2024, 233, 112721. [Google Scholar] [CrossRef]
- Zinoviev, A.; Zinovieva, O.; Ploshikhin, V.; Romanova, V.; Balokhonov, R. Evolution of grain structure during laser additive manufacturing. Simulation by a cellular automata method. Mater. Des. 2016, 106, 321–329. [Google Scholar] [CrossRef]
- Lian, Y.; Lin, S.; Yan, W.; Liu, W.K.; Wagner, G.J. A parallelized three-dimensional cellular automaton model for grain growth during additive manufacturing. Comput. Mech. 2018, 61, 543–558. [Google Scholar] [CrossRef]
- Wang, J.; Wu, W.J.; Jing, W.; Tan, X.; Bi, G.J.; Tor, S.B.; Leong, K.F.; Chua, C.K.; Liu, E. Improvement of densification and microstructure of ASTM A131 EH36 steel samples additively manufactured via selective laser melting with varying laser scanning speed and hatch spacing. Mater. Sci. Eng. A 2019, 746, 300–313. [Google Scholar] [CrossRef]
- Fu, C.H.; Guo, Y.B. Three-Dimensional Temperature Gradient Mechanism in Selective Laser Melting of Ti-6Al-4V. J. Manuf. Sci. Eng. Trans. ASME 2014, 136, 061004. [Google Scholar] [CrossRef]
- Teferra, K.; Rowenhorst, D.J. Optimizing the cellular automata finite element model for additive manufacturing to simulate large microstructures. Acta Mater. 2021, 213, 116930. [Google Scholar] [CrossRef]
- Ding, R.; Guo, Z.X. Microstructural modelling of dynamic recrystallisation using an extended cellular automaton approach. Comput. Mater. Sci. 2002, 23, 209–218. [Google Scholar] [CrossRef]
- Ghosh, M.; Kumar, R.; Saha, M.; Sikdar, B.K. Cellular automata and its applications. In Proceedings of the 2018 IEEE International Conference on Automatic Control and Intelligent Systems (I2CACIS), Shah Alam, Malaysia, 20 October 2018; pp. 52–56. [Google Scholar] [CrossRef]
- Duc, P.; Bournaud, F.; Masset, F. Astrophysics A top-down scenario for the formation. Astron. Astrophys. 2004, 814, 803–814. [Google Scholar] [CrossRef][Green Version]
- Villa, E.; Rios, P.R. On modelling recrystallization processes with random growth velocities of the grains in materials science. Image Anal. Stereol. 2012, 31, 149–162. [Google Scholar] [CrossRef]
- Li, J.; Zhou, X.; Brochu, M.; Provatas, N.; Zhao, Y.F. Solidification Microstruc-ture Simulation of Ti-6Al-4V in Metal Additive Manufacturing: A Review. Addit. Manuf. 2020, 31, 100989. [Google Scholar] [CrossRef]
- Murata, K.; Fukui, C.; Sun, F.; Chen, T.-T.; Adachi, Y. Simulation of Abnormal Grain Growth Using the Cellular Automaton Method. Materials 2024, 17, 138. [Google Scholar] [CrossRef]
- Reiter, C.A. Cyclic cellular automata in 3D. Chaos Solitons Fractals 2011, 44, 764–768. [Google Scholar] [CrossRef]
- Li, Y.; Pandis, I.; Mueller, R.; Raman, V.; Lohman, G. NUMA-aware algorithms: The case of data shuffling. In Proceedings of the CIDR 2013—6th Biennial Conference on Innovative Data Systems Research, Asilomar, CA, USA, 6–9 January 2013. [Google Scholar]
- Li, X.; Tan, W. Numerical investigation of effects of nucleation mechanisms on grain structure in metal additive manufacturing. Comput. Mater. Sci. 2018, 153, 159–169. [Google Scholar] [CrossRef]
- Kou, S. Welding Metallurgy; Wiley: Hoboken, NJ, USA, 2002. [Google Scholar] [CrossRef]
- SYao, S.-W.; Liu, T.; Li, C.-J.; Yang, G.-J.; Li, C.-X. Epitaxial growth during the rapid solidification of plasma-sprayed molten TiO2 splat. Acta Mater. 2017, 134, 66–80. [Google Scholar] [CrossRef]
- Kenty, J.L.; Hirth, J.P. Epitaxy and heterogeneous nucleation theory. Surf. Sci. 1969, 15, 403–424. [Google Scholar] [CrossRef]
- SSuwas, S.; Ray, R.K. Crystallographic Texture of Material; Springer: London, UK, 2014. [Google Scholar] [CrossRef]
- Hagihara, K.; Nakano, T. Control of Anisotropic Crystallographic Texture in Powder Bed Fusion Additive Manufacturing of Metals and Ceramics—A Review. JOM 2021, 74, 1760–1773. [Google Scholar] [CrossRef]
- DebRoy, T.; Wei, H.L.; Zuback, J.S.; Mukherjee, T.; Elmer, J.W.; Milewski, J.O.; Beese, A.M.; Wilson-Heid, A.; De, A.; Zhang, W. Additive manufacturing of metallic components—Process, structure and properties. Prog. Mater. Sci. 2018, 92, 112–224. [Google Scholar] [CrossRef]
- Turnali, A.; Motaman, S.A.H.; Chang, Y.; Böttger, B.; Serafeim, A.; Sayk, L.; Peter, N.J.; Richter, S.; Schwedt, A.; Höges, S.; et al. Evolution of microstructural heterogeneities in additively manufactured low-alloy steel. Addit. Manuf. 2023, 78, 103859. [Google Scholar] [CrossRef]
- de Morais, W.A.; Landgraf, F.J.G. Crystallographic texture configured by laser powder bed fusion additive manufacturing process: A review and its potential application to adjust mechanical properties of metallic products. Tecnol. Em Metal. Mater. Mineração 2023, 20, e2802. [Google Scholar] [CrossRef]
- Haase, C.; Tang, F.; Wilms, M.B.; Weisheit, A.; Hallstedt, B. Combining thermodynamic modeling and 3D printing of elemental powder blends for high-throughput investigation of high-entropy alloys—Towards rapid alloy screening and design. Mater. Sci. Eng. A 2017, 688, 180–189. [Google Scholar] [CrossRef]
- Kuffner, J.J. Effective sampling and distance metrics for 3D rigid body path planning. In Proceedings of the IEEE International Conference on Robotics and Automation, New Orleans, LA, USA, 26 April–1 May 2004; pp. 3993–3998. [Google Scholar] [CrossRef]
- Yang, M.; Wang, L.; Yan, W. Phase-field modeling of grain evolutions in additive manufacturing from nucleation, growth, to coarsening. npj Comput. Mater. 2021, 7, 56. [Google Scholar] [CrossRef]
- Zinoviev, A.; Zinovieva, O.; Ploshikhin, V.; Romanova, V.; Balokhonov, R. On the numerical simulation of the microstructural evolution induced by laser additive manufacturing of steel products. AIP Conf. Proc. 2016, 1785, 040097. [Google Scholar] [CrossRef]
- Gandin, C.-A.; Rappaz, M. A 3D Cellular Automaton algorithm for the prediction of dendritic grain growth. Acta Mater. 1997, 45, 2187–2195. [Google Scholar] [CrossRef]
- Dezfoli, A.R.A.; Hwang, W.-S.; Huang, W.-C.; Tsai, T.-W. Determination and controlling of grain structure of metals after laser incidence: Theoretical approach. Sci. Rep. 2017, 7, 41527. [Google Scholar] [CrossRef] [PubMed]
- Lipton, J.; Glicksman, M.E.; Kurz, W. Dendritic growth into undercooled alloy metals. Mater. Sci. Eng. 1984, 65, 57–63. [Google Scholar] [CrossRef]
- Huang, Z.; Jia, W.; Wang, H.; Yang, Z.; Li, C.; Liang, J.; Zhong, Y. A new heat source model for selective laser melting simulations based on energy distribution on the powder layer and the surface of substrate. arXiv 2021, arXiv:2106.03482. [Google Scholar] [CrossRef]
- Ivantsov, G. Temperature field around a spherical, cylindrical, and needle-shaped crystal, growing in a pre-cooled melt. Proc. USSR Acad. Sci. 1985, 58, 567–569. Available online: https://ui.adsabs.harvard.edu/abs/1985tfas.rept..567I (accessed on 29 May 2025).
- Trivedi, R. Theory of dendritic growth during the directional solidification of binary alloys. J. Cryst. Growth. 1980, 49, 219–232. [Google Scholar] [CrossRef]
- Kurz, W.; Fisher, D. Dendrite growth at the limit of stability: Tip radius and spacing. Acta Metall. 1981, 29, 11–20. [Google Scholar] [CrossRef]
- Köhnen, P.; Létang, M.; Voshage, M.; Schleifenbaum, J.H.; Haase, C. Understanding the process-microstructure correlations for tailoring the mechanical properties of L-PBF produced austenitic advanced high strength steel. Addit. Manuf. 2019, 30, 100914. [Google Scholar] [CrossRef]
- Suryanarayana, C. Non-Equilizbrium Processing of Materials; Elsevier: Amsterdam, The Netherlands, 1999. [Google Scholar]
- Kang, H.R. Three-Dimensional Lookup Table with Interpolation. In Computational Color Technology; SPIE: Bellingham, WA, USA, 2010; pp. 151–159. [Google Scholar] [CrossRef]
- Mießen, C.; Velinov, N.; Gottstein, G.; Barrales-Mora, L.A. A highly efficient 3D level-set grain growth algorithm tailored for ccNUMA architecture. Model. Simul. Mater. Sci. Eng. 2017, 25, 084002. [Google Scholar] [CrossRef]
- Pauza, J.; Rollett, A. Simulation Study of Hatch Spacing and Layer Thickness Effects on Microstructure in Laser Powder Bed Fusion Additive Manufacturing using a Texture-Aware Solidification Potts Model. J. Mater. Eng. Perform. 2021, 30, 7007–7018. [Google Scholar] [CrossRef]
- Tan, W.; Shin, Y.C. Multi-scale modeling of solidification and microstructure development in laser keyhole welding process for austenitic stainless steel. Comput. Mater. Sci. 2015, 98, 446–458. [Google Scholar] [CrossRef]
- Ansari, P.; Rehman, A.U.; Pitir, F.; Veziroglu, S.; Mishra, Y.K.; Aktas, O.C.; Salamci, M.U. Selective laser melting of 316l austenitic stainless steel: Detailed process understanding using multiphysics simulation and experimentation. Metals 2021, 11, 1076. [Google Scholar] [CrossRef]
- Jonšta, P.; Vlčková, I.; Krišták, L.; Špička, I.; Jonšta, Z. Contribution to the thermal properties of selected steels. Metalurgija 2015, 54, 187–190. [Google Scholar]
- Bachmann, F.; Hielscher, R.; Schaeben, H. Texture analysis with MTEX- Free and open source software toolbox. Solid State Phenom. 2010, 160, 63–68. [Google Scholar] [CrossRef]
- Ahrens, J.; Geveci, B.; Law, C. ParaView: An End-User Tool for Large Data Visualization, Visualization Handbook; Elsevier: Amsterdam, The Netherlands, 2005; ISBN -13 9780123875822. [Google Scholar]
- Sun, S.-H.; Ishimoto, T.; Hagihara, K.; Tsutsumi, Y.; Hanawa, T.; Nakano, T. Excellent mechanical and corrosion properties of austenitic stainless steel with a unique crystallographic lamellar microstructure via selective laser melting. Scr. Mater. 2019, 159, 89–93. [Google Scholar] [CrossRef]
- Yan, F.; Xiong, W.; Faierson, E.J. Grain Structure Control of Additively Manufactured Metallic Materials. Materials 2017, 10, 1260. [Google Scholar] [CrossRef]
- PLiu, P.; Wang, Z.; Xiao, Y.; Horstemeyer, M.F.; Cui, X.; Chen, L. Insight into the mechanisms of columnar to equiaxed grain transition during metallic additive manufacturing. Addit. Manuf. 2019, 26, 22–29. [Google Scholar] [CrossRef]
- Pyrz, R. Correlation of microstructure variability and local stress field in two-phase materials. Mater. Sci. Eng. A 1994, 177, 253–259. [Google Scholar] [CrossRef]
- Gavagnin, E.; Owen, J.P.; Yates, C.A. Pair correlation functions for identifying spatial correlation in discrete domains. Phys. Rev. E 2018, 97, 062104. [Google Scholar] [CrossRef]
- Andreau, O.; Koutiri, I.; Peyre, P.; Penot, J.-D.; Saintier, N.; Pessard, E.; De Terris, T.; Dupuy, C.; Baudin, T. Texture control of 316L parts by modulation of the melt pool morphology in selective laser melting. J. Mater. Process. Technol. 2019, 264, 21–31. [Google Scholar] [CrossRef]
Disclaimer/Publisher’s Note: The statements, opinions and data contained in all publications are solely those of the individual author(s) and contributor(s) and not of MDPI and/or the editor(s). MDPI and/or the editor(s) disclaim responsibility for any injury to people or property resulting from any ideas, methods, instructions or products referred to in the content. |
© 2025 by the authors. Licensee MDPI, Basel, Switzerland. This article is an open access article distributed under the terms and conditions of the Creative Commons Attribution (CC BY) license (https://creativecommons.org/licenses/by/4.0/).