Article

Electrochemical Behavior of the Ni3Al Intermetallic Alloy in Nitrate Salts

by
Daniel Lopez-Dominguez
1,
Nestor Belisario Gomez-Guzman
1,
Cinthya Dinorah Arrieta-Gonzalez
2,
Jonathan de la Vega Olivas
3,
Jose Gonzalo Gonzalez-Rodriguez
1,
Jesus Porcayo-Calderon
3,* and
Jose Guadalupe Chacon-Nava
4,*
1
Centro de Investigacion en Ingenieria y Ciencias Aplicadas (CIICAp), Universidad Autonoma del Estado de Morelos, Av. Universidad 1001, Col. Chamilpa, Cuernavaca 62209, Morelos, Mexico
2
Departamento de Ingeniería Química y Bioquímica, Tecnológico Nacional de Mexico, Instituto Tecnológico de Zacatepec, Calzada Instituto Tecnológico 27, Zacatepec 62780, Morelos, Mexico
3
Departamento de Ingenieria Quimica y Metalurgia, Universidad de Sonora, Hermosillo 83000, Sonora, Mexico
4
Centro de Investigación en Materiales Avanzados (CIMAV), Miguel de Cervantes 120, Complejo Industrial Chihuahua, Chihuahua 31136, Chihuahua, Mexico
*
Authors to whom correspondence should be addressed.
Metals 2025, 15(7), 764; https://doi.org/10.3390/met15070764
Submission received: 15 May 2025 / Revised: 27 June 2025 / Accepted: 3 July 2025 / Published: 7 July 2025
(This article belongs to the Special Issue Properties, Microstructure and Forming of Intermetallics)

Abstract

In this paper, the electrochemical performance of the NiAl intermetallic immersed in the 60% NaNO3-40% KNO3 (wt%) eutectic mixture, also known as Solar Salt, is reported. Mass loss measurements and electrochemical tests evaluate its behavior at different temperatures (300, 400, and 500 °C). Mass loss measurements are performed over 1000 h, and electrochemical tests over 100 h. The mass loss results show that the Ni3Al intermetallic exhibits excellent corrosion resistance under the test conditions. Electrochemical measurements confirm the excellent performance of the Ni3Al intermetallic in molten solar salt in the test temperature range. Experimental observations show that increasing temperature decreases the corrosion resistance of the intermetallic and favors the formation of protective layers of the Al2O3 and NaAlO2 types.

1. Introduction

In recent years, growing pressure to minimize greenhouse gas emissions and address the effects of climate change has catalyzed a global restructuring of the processes associated with energy generation, storage, and utilization. In this context, renewable energy technologies have emerged as essential components of future energy systems. Among them, Concentrated Solar Power (CSP) stands out for its ability not only to harness solar energy but also to store it in the form of thermal energy, enabling electricity generation even during periods when solar irradiance is inadequate or nonexistent. This capability provides a critical advantage over photovoltaic systems by enhancing grid stability and energy dispatchability, thus contributing to energy security and sustainability goals.
As CSP technologies continue to evolve, one of the key areas of innovation lies in the development of improved thermal energy storage (TES) systems, increasing their efficiency and cost-effectiveness. These types of systems are crucial in CSP plants, as they allow for decoupling solar energy collection from electricity generation. Sensible heat storage using molten salts has gained the most attention in thermal energy storage systems due to its relatively low cost, scalability, and operational maturity.
Nitrate-based molten salts (Solar Salt) are the most widely used heat transfer fluid (HTF) due to their low melting point (≈220 °C), thermal stability (up to 565 °C), adequate vapor pressure, and excellent heat capacity, making them a benchmark material in commercial CSP installations [1].
However, despite the operational advantages of molten nitrate salts, a major technological barrier remains: material degradation due to corrosion. CSP systems typically operate at elevated temperatures where molten salts become chemically aggressive, leading to the deterioration of structural and functional materials, particularly those used in tanks, piping, and heat exchangers. While nitrates are generally considered less corrosive than chloride or fluoride salts, their corrosivity becomes significant over long durations and at high temperatures, especially when impurities such as moisture, oxygen, or thermal decomposition products (e.g., nitrites or oxides) are present [2,3,4,5,6,7,8].
Molten salt corrosion is one of the most severe material degradation processes. It occurs when an inorganic salt condenses on a metal surface and remains in a liquid state (ionic electrolyte). In this state, the electrolyte acts as a fluxing agent, dissolving the protective surface layers and preventing their regeneration. As a result, the transport of oxidizing species and metal cations is favored, the formation of protective oxides is not possible, and the corrosion process is accelerated.
Thermal dissociation of Solar Salt has been shown to generate oxygen without requiring the presence of dissolved oxygen in the surrounding atmosphere, allowing cathodic reactions to occur even under inert conditions [7]. This self-oxygenation capacity contributes significantly to the corrosive processes.
The complexity of corrosion processes in the presence of molten salts is greater and different from those occurring in aqueous or gaseous media. Stainless steel-type alloys generally have high corrosion resistance due to their ability to develop a highly stable Cr-based protective film (Cr2O3) on their surface to protect the underlying metal. However, in molten nitrate salts, chromium compounds tend to be soluble, disrupting the formation of a stable passive layer and exposing the metal to continued attack. This results in accelerated oxidation, localized degradation, and reduced mechanical integrity, posing a serious threat to the operational lifespan and safety of CSP infrastructure [2,3,7,9,10,11].
Given these challenges, recent research has focused on identifying and developing alternative materials with enhanced corrosion resistance under molten salt conditions. Alloys capable of forming aluminum oxide (Al2O3) protective layers, such as Fe-Al, Ni-Al, and other Al-rich systems, are promising because Al2O3 has low reactivity and low solubility in molten nitrate salts. This oxide forms a dense, adherent, and continuous layer that significantly reduces ionic diffusion and oxidation kinetics [7,12,13,14,15]. On the other hand, nickel-based alloys are also materials that possess excellent mechanical properties under high temperatures, as well as high corrosion resistance in various corrosive media. This makes them suitable for demanding environments such as CSP systems, molten salt reactors, and supercritical CO2 cycles [4,5,7,16,17,18,19].
Among the potential candidates, intermetallic compounds such as Ni3Al offer a unique combination of beneficial properties. Ni3Al exhibits exceptional high-temperature oxidation resistance, good mechanical strength, and the ability to form stable alumina scales. Unlike traditional Ni-based superalloys, Ni3Al contains a high aluminum content that facilitates the growth of protective Al2O3 layers, while maintaining the structural integrity and corrosion resistance provided by the nickel matrix. These characteristics make Ni3Al a compelling alternative for components exposed to molten nitrate salts at elevated temperatures.
Based on the above, this research focuses on evaluating the electrochemical behavior of the Ni3Al intermetallic alloy when immersed in solar salt under high-temperature conditions representative of CSP operations. The assessment was conducted using a comprehensive approach that included gravimetric analysis over 1000 h of immersion, as well as potentiodynamic polarization curves, open circuit potential (OCP) and polarization resistance (LPR) measurements, and electrochemical impedance spectroscopy (EIS) testing. These techniques allow for a detailed understanding of the corrosion kinetics, oxide layer stability, and potential degradation mechanisms of Ni3Al in a molten nitrate environment.
The results presented provide valuable insights into the performance of Ni3Al as a corrosion-resistant material for CSP systems and similar high-temperature applications. Furthermore, this work contributes to the broader field of materials selection and design for molten salt technologies, supporting the development of more durable and efficient renewable energy systems.

2. Materials and Methods

2.1. Ni3Al Alloy

The intermetallic Ni3Al was obtained in SiO2 crucibles in an argon atmosphere induction furnace. The ingots were prepared by melting stoichiometric quantities of the elements in an induction furnace. Once the molten mixture had melted and become homogenous, it was allowed to cool inside the induction furnace. Samples used in the corrosion tests were cut from the resulting ingots.

2.2. Corrosive Medium

Solar Salt (60% NaNO3-40% KNO3) was the electrolyte used in corrosion studies to simulate the conditions found in solar concentrators [8,20,21,22,23]. The eutectic mixture was prepared from analytical reagent grade NaNO3 and KNO3 (All chemical compounds involved in this work were purchased from Sigma-Aldrich, St. Louis, MO, USA). Salts were kept at 120 °C for 48 h before mixing. Once mixed in the indicated proportions, the salts were pulverized with an agate mortar and maintained at 60 °C until their final use in corrosion tests.

2.3. Gravimetric Tests

Mass loss tests were performed in the temperature range of 300 °C to 500 °C (±3 °C), with a minimum duration of 250 h and a maximum duration of 1000 h, according to the ISO 17245 standard procedure [24]. Four samples were used for each test condition, with three used to determine mass loss and the fourth for surface analysis. The mass change was determined in two stages. In the first stage, at the end of each exposure time, traces of solar salt and soluble corrosion products were removed by immersing the specimens in distilled water at 60 °C. They were then dried in hot air and weighed to record the mass change. The procedure was repeated until a constant weight was reached. The cleaning procedure was repeated until a constant weight was reached (±2%). Subsequently, in the second stage, the specimens, previously cleaned in stage 1, were subjected to a process to remove firmly adhered corrosion products. For this purpose, a solution of 100 mL of HNO3 dissolved in one liter of H2O was used, in accordance with the suggestions of ASTM G31 [25]. The corrosion product removal procedure was repeated several times; the mass loss was determined after each cleaning by weighing the sample until a constant weight was obtained. The final mass loss was calculated according to
m S 0 = m f m i S 0 ,
where mi = initial mass of the sample [mg]; mf = final mass at time t [days]; and S0 = initial area of the sample [cm2].

2.4. Electrochemical Tests

A three-electrode cell was used for electrochemical tests. The Ni3Al alloy was used as the working electrode, and platinum wire as the reference and counter electrodes. A Nicromel wire was spot-welded to the Ni3Al samples. To prevent contact between the Nicromel wires and the molten salt, they were placed in alumina tubes and sealed with ceramic cement.
Once the experimental setup was complete, the electrode assembly was immersed in molten salt (60% NaNO3-40% KNO3) contained in an alumina crucible inside an electric resistance furnace. The electrochemical tests performed included electrochemical impedance spectroscopy, open-circuit potential measurements, linear polarization resistance, and potentiodynamic polarization curves. The test temperatures were 300, 400, and 500 °C, lasting 100 h. Each experiment was carried out in duplicate.
Potentiodynamic polarization was carried out by polarizing the Ni3Al electrode at −300 mV in the cathodic direction and 1000 mV in the anodic direction. The polarization interval was relative to the corrosion potential (Ecorr) using a 1 mV/s scan. It is recognized that potential scan rate has an important role in minimizing the effects of distortion in Tafel slopes and corrosion current density analyses, as previously reported [11]. Although 1mV/s is adopted as a potential scan rate, it is experimentally observed that no distortions are produced or provoked in the experimental curves, and no deleterious effects are verified, as previously reported [11]. The values for Ecorr, icorr, and the anodic and cathodic slopes were obtained from the polarization curves. The open circuit potential (OCP) of the working electrode was recorded at 1 h intervals during the test. Polarization resistance was determined at 1 h intervals during the test within an overpotential range of ±10 mV relative to the open-circuit potential, with a scan rate of 0.1667 mV/s. For EIS measurements, a frequency scan was performed from 100,000 Hz to 0.01 Hz. Equilibrium disturbance was achieved with an AC signal of ±10 mV. Tests were performed using an ACM Instruments-Gill AC potentiostat–galvanostat (ACM Instruments, Cambria, UK).
Morphological analyses and elemental mapping were performed using a JEOL JSM-IT 500 LV scanning electron microscope (JEOL Ltd., Tokyo, Japan) equipped with a Bruker X-Flash 6|30 detector (Bruker Corporation, Billerica, MA, USA) for energy-dispersive X-ray spectroscopy (EDS). The measurement error is around 0.5 at. %.

3. Results and Discussion

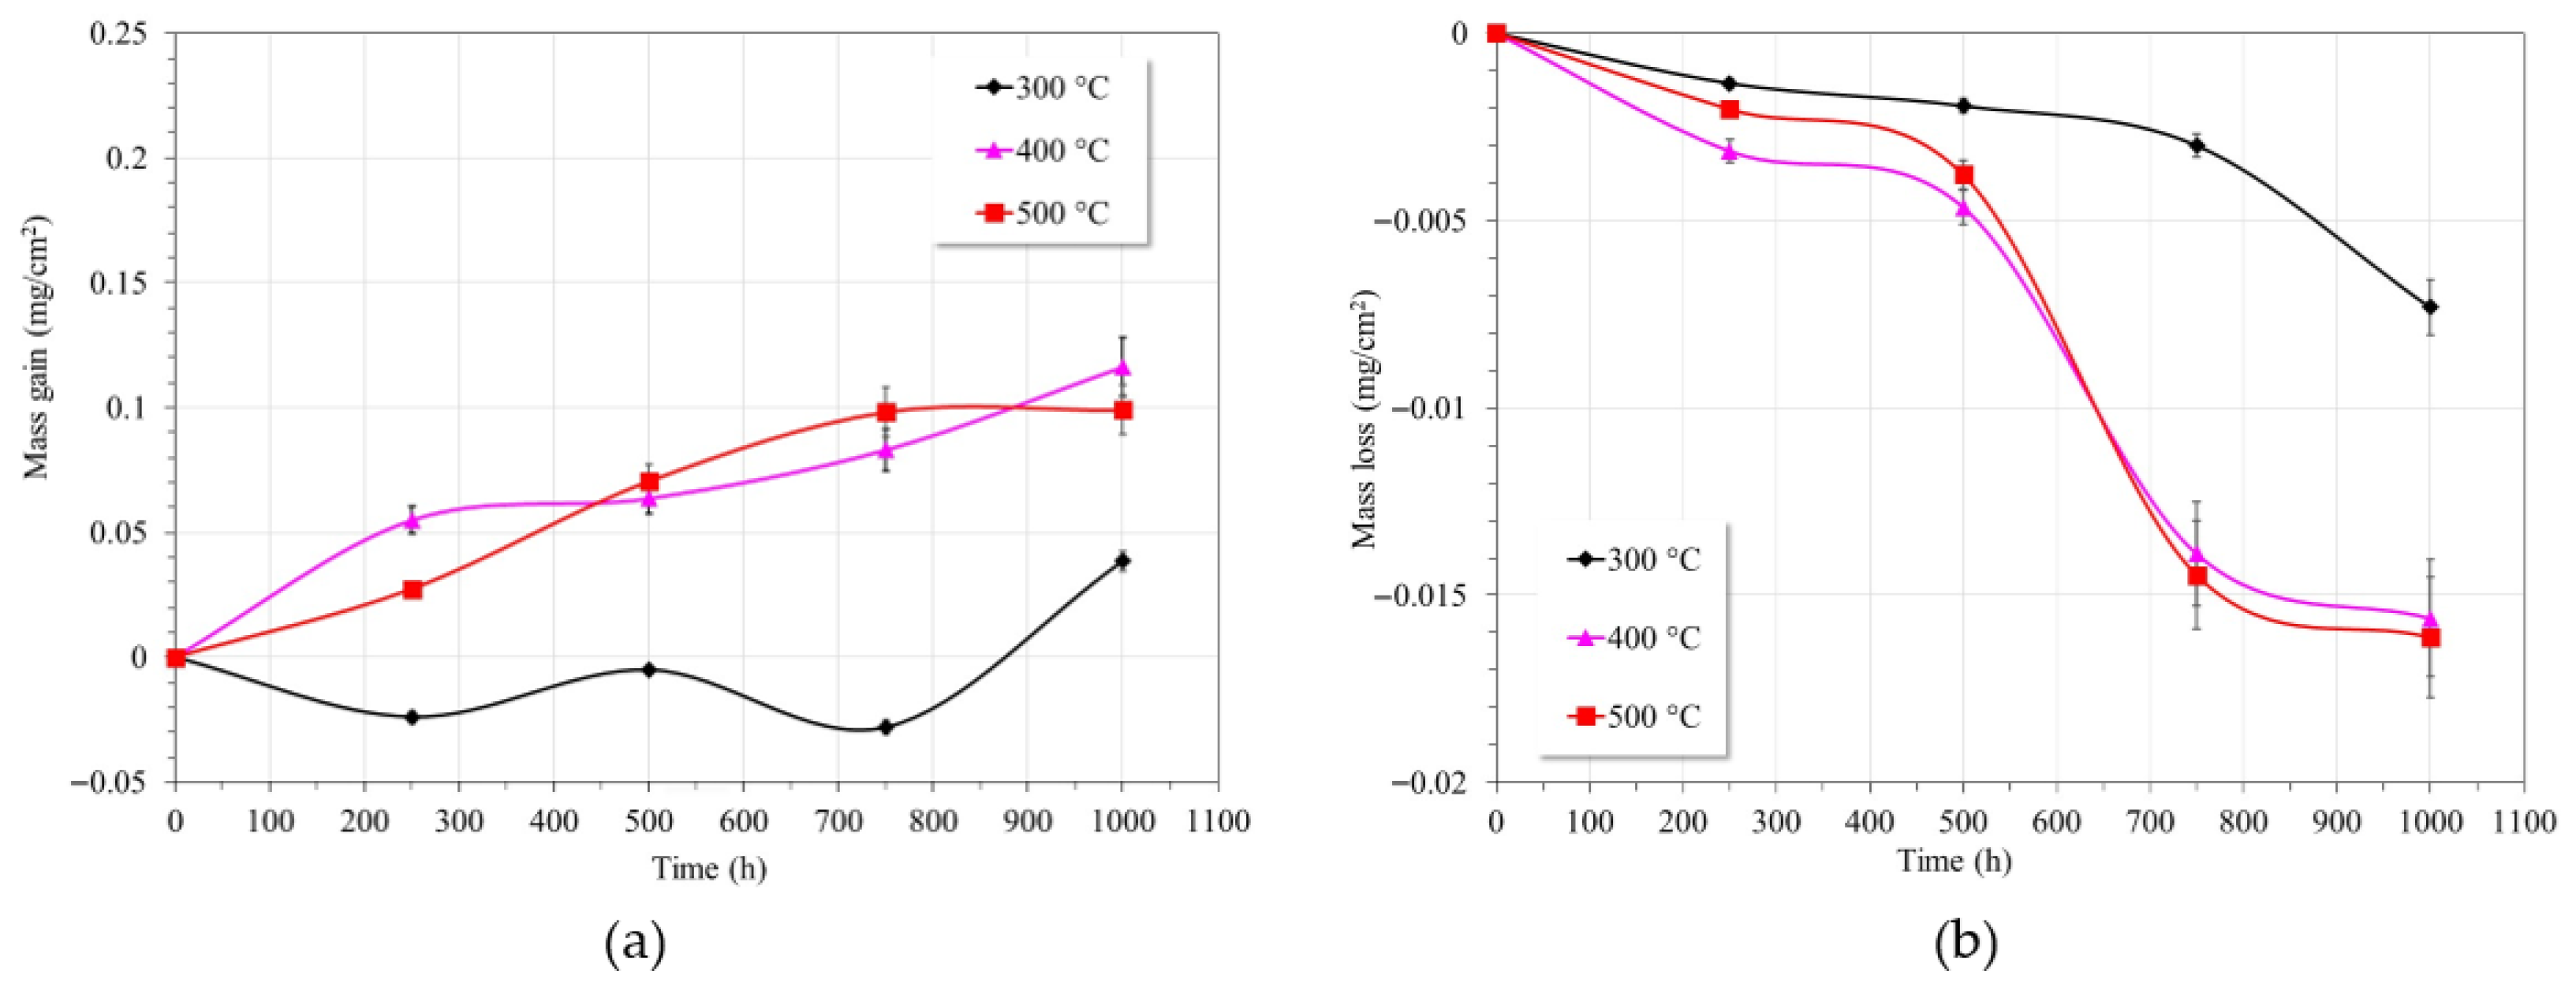
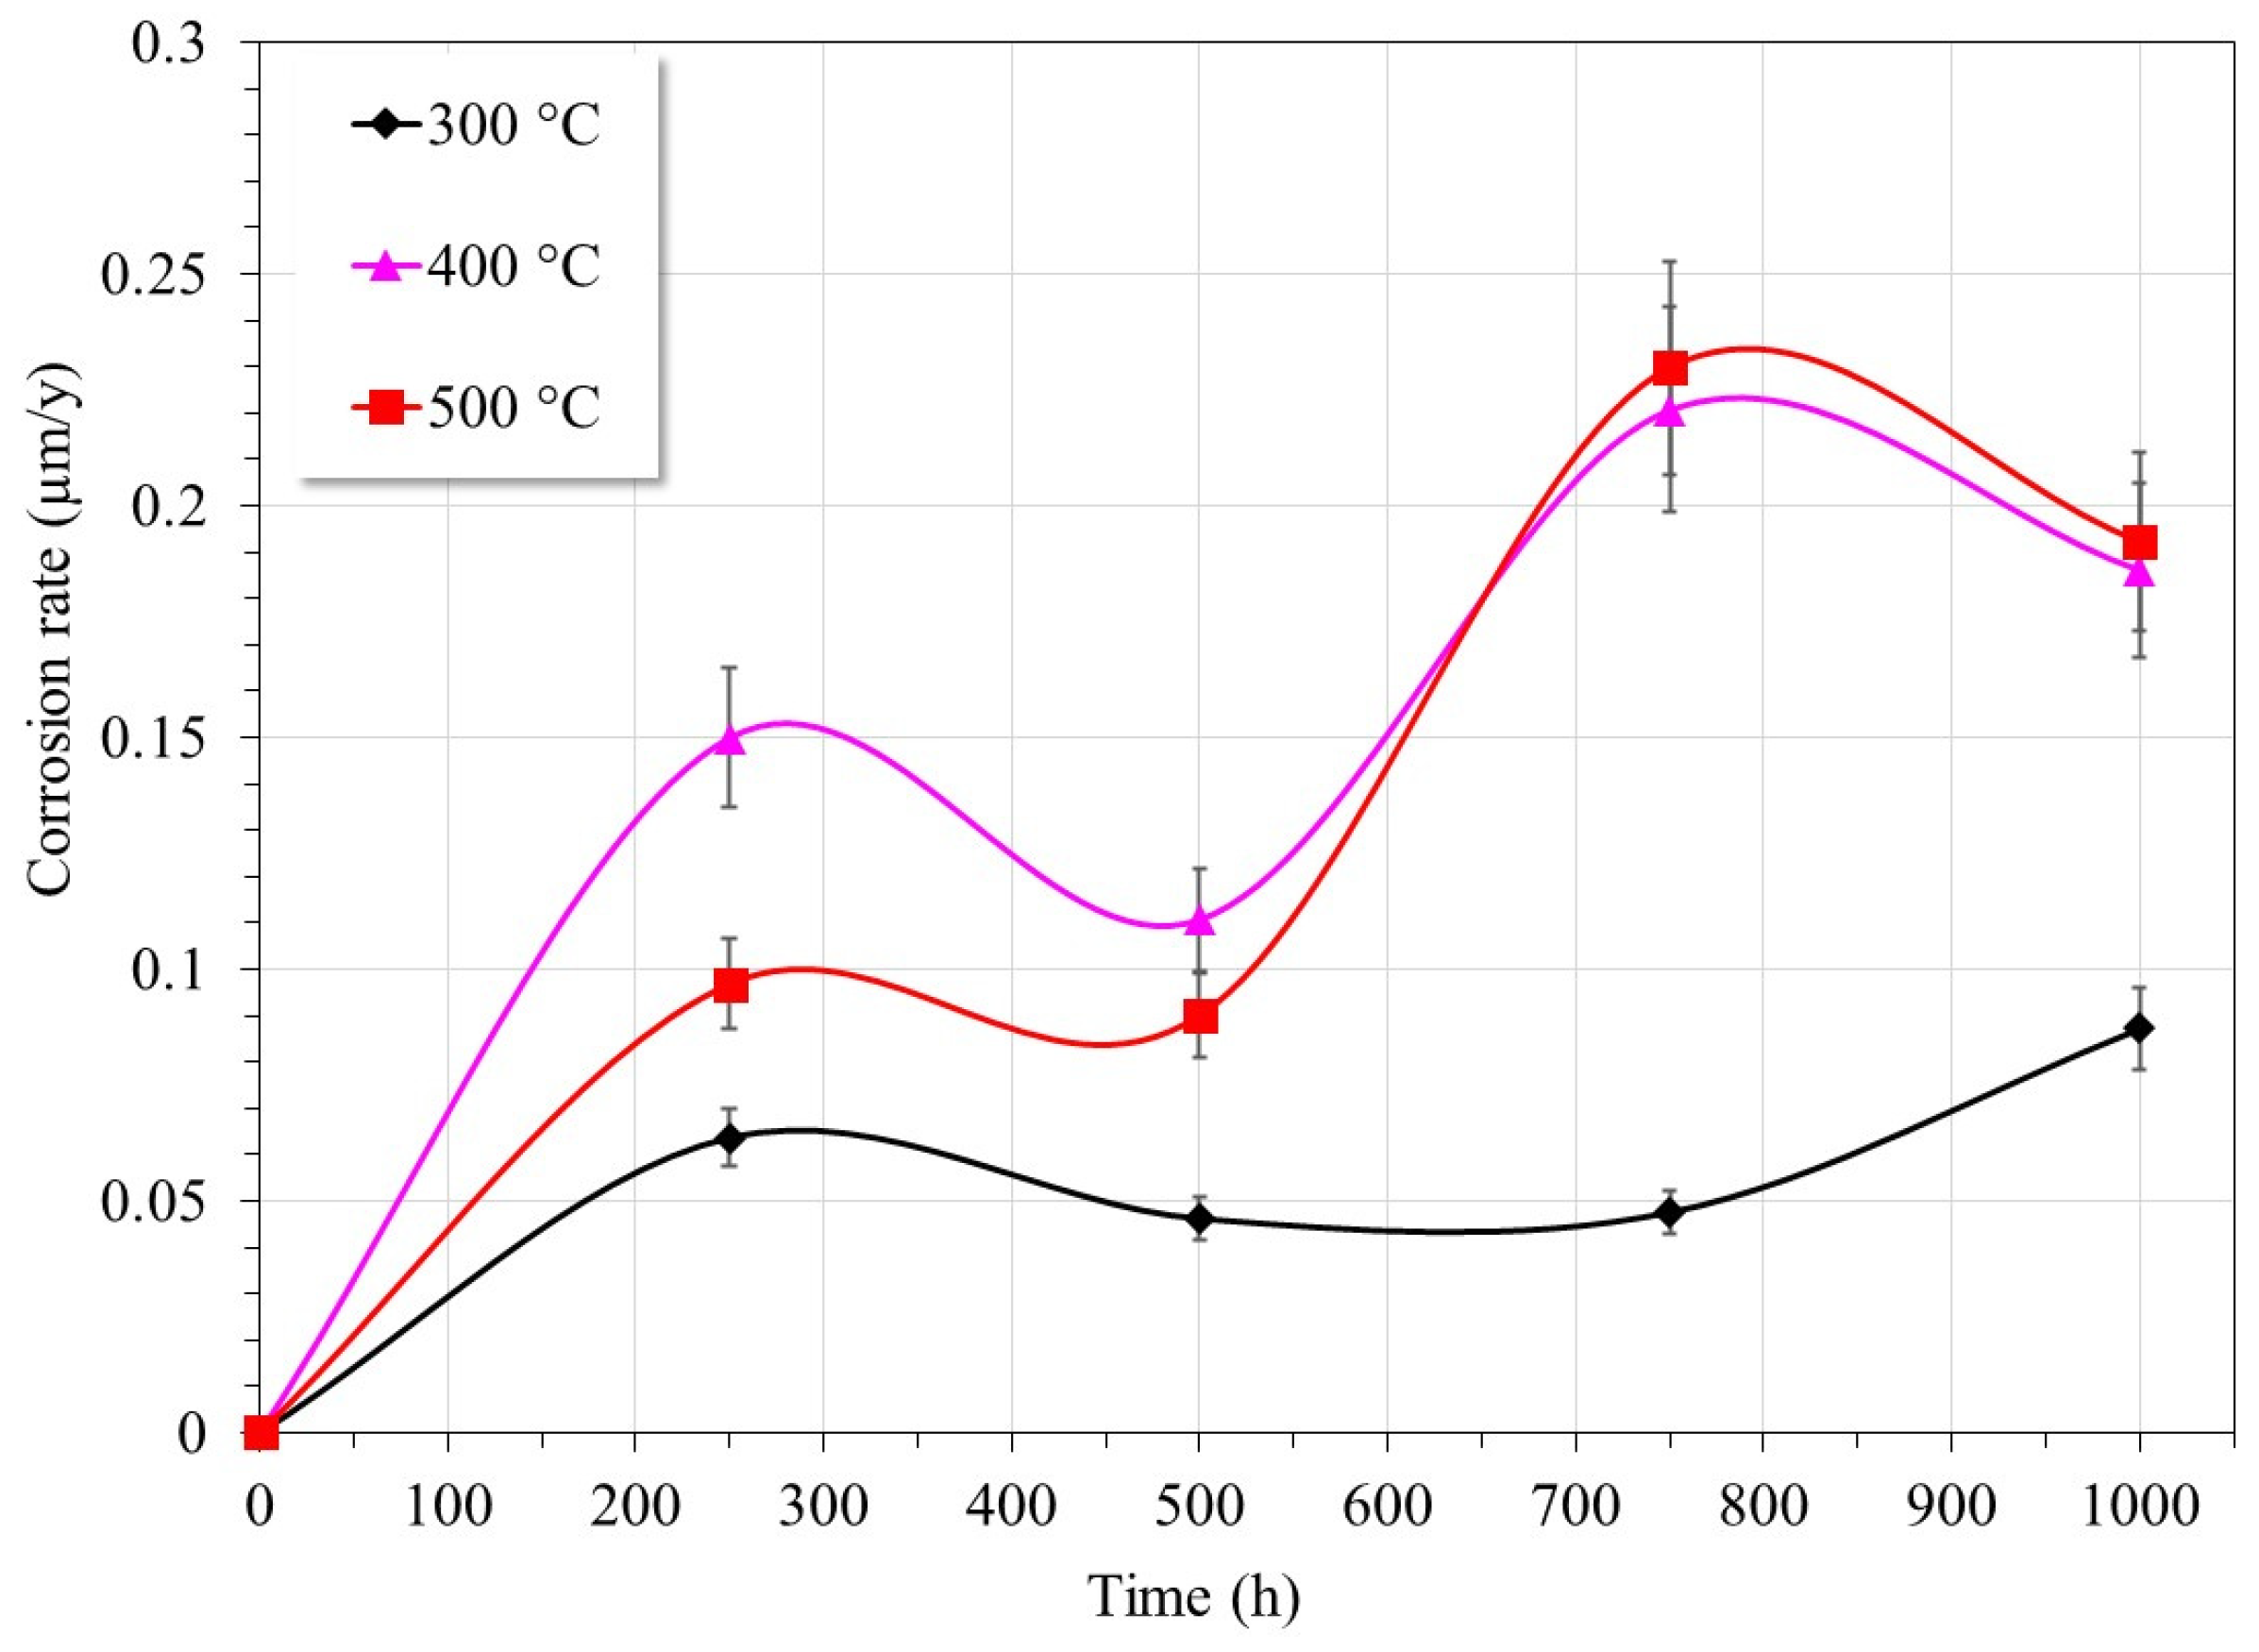
3.1. Gravimetric Tests

The mass change experienced by removing the soluble layers adhered to the metallic surface (Figure 1a) shows that at 300 °C, the Ni3Al intermetallic did not experience an appreciable mass change in the first 750 h and only at the end of the test did it experience a slight mass gain. However, at 400 and 500 °C, the intermetallic showed a constant increase in mass. In both cases, the mass gain was very similar at the end of the test. This suggests the development of a tightly adhered protective layer on the alloy surface.
The increase in mass gain with increasing temperature is due to the greater aggressiveness of the molten salt due to the increase in the decomposition rate of nitrate ions (NO−3) to nitrite ions (NO−2) and oxide ions (O2−) [6,11,26,27]. However, the mass changes observed at 1000 h are like those reported for Ni-Al coatings [28].
The mass loss calculated after removing the layer of corrosion products adhering to the metallic surface (Figure 1b) shows that at 300 °C, the intermetallic showed the lowest mass loss, which increased up to 1000 h. At 400 and 500 °C, in both cases a similar behavior was observed, the mass loss was greater and increased with immersion time. The magnitude of mass loss was very low, due to the alloy’s ability to form a protective layer rich in Al on its surface [29,30,31]. The corrosion rate (μm/year) (Figure 2) was calculated according to [29,30,31]
C R = K · m S 0 · t · ρ ,
where K = 8.76 × 10⁷; ∆m = mass loss [g]; t = immersion time [hours]; and ρ = alloy density, 7.41 g/cm3.
Figure 2 shows that at 300 °C, intermetallic Ni3Al showed an increase in its corrosion rate up to 250 h and subsequently showed stable behavior up to 750 h, and at 1000 h it experienced a slight increase (0.087 µm/year, 5% error). At 400 and 500 °C, similar behavior is observed, with the corrosion rate increasing substantially in the first 250 h and at the end of the test the corrosion rates were 0.18 µm/year at 400 °C and 0.19 µm/year at 500 °C (5% error).
The observed behavior can be attributed to the initial formation of NiO (first 250 h) and the subsequent formation of NaAlO2 and Al2O3 oxides. In oxidizing environments, the initial formation of a NiO-rich layer on the surface of the intermetallic alloy has been described, the proportion of which decreases as the oxidation process progresses until a protective layer rich in Al2O3 is formed, which is thermodynamically more stable [30,32,33,34,35]. At longer times, the Al2O3-rich layer reacts with the molten salt, forming more stable insoluble compounds such as spinel NaAlO2.

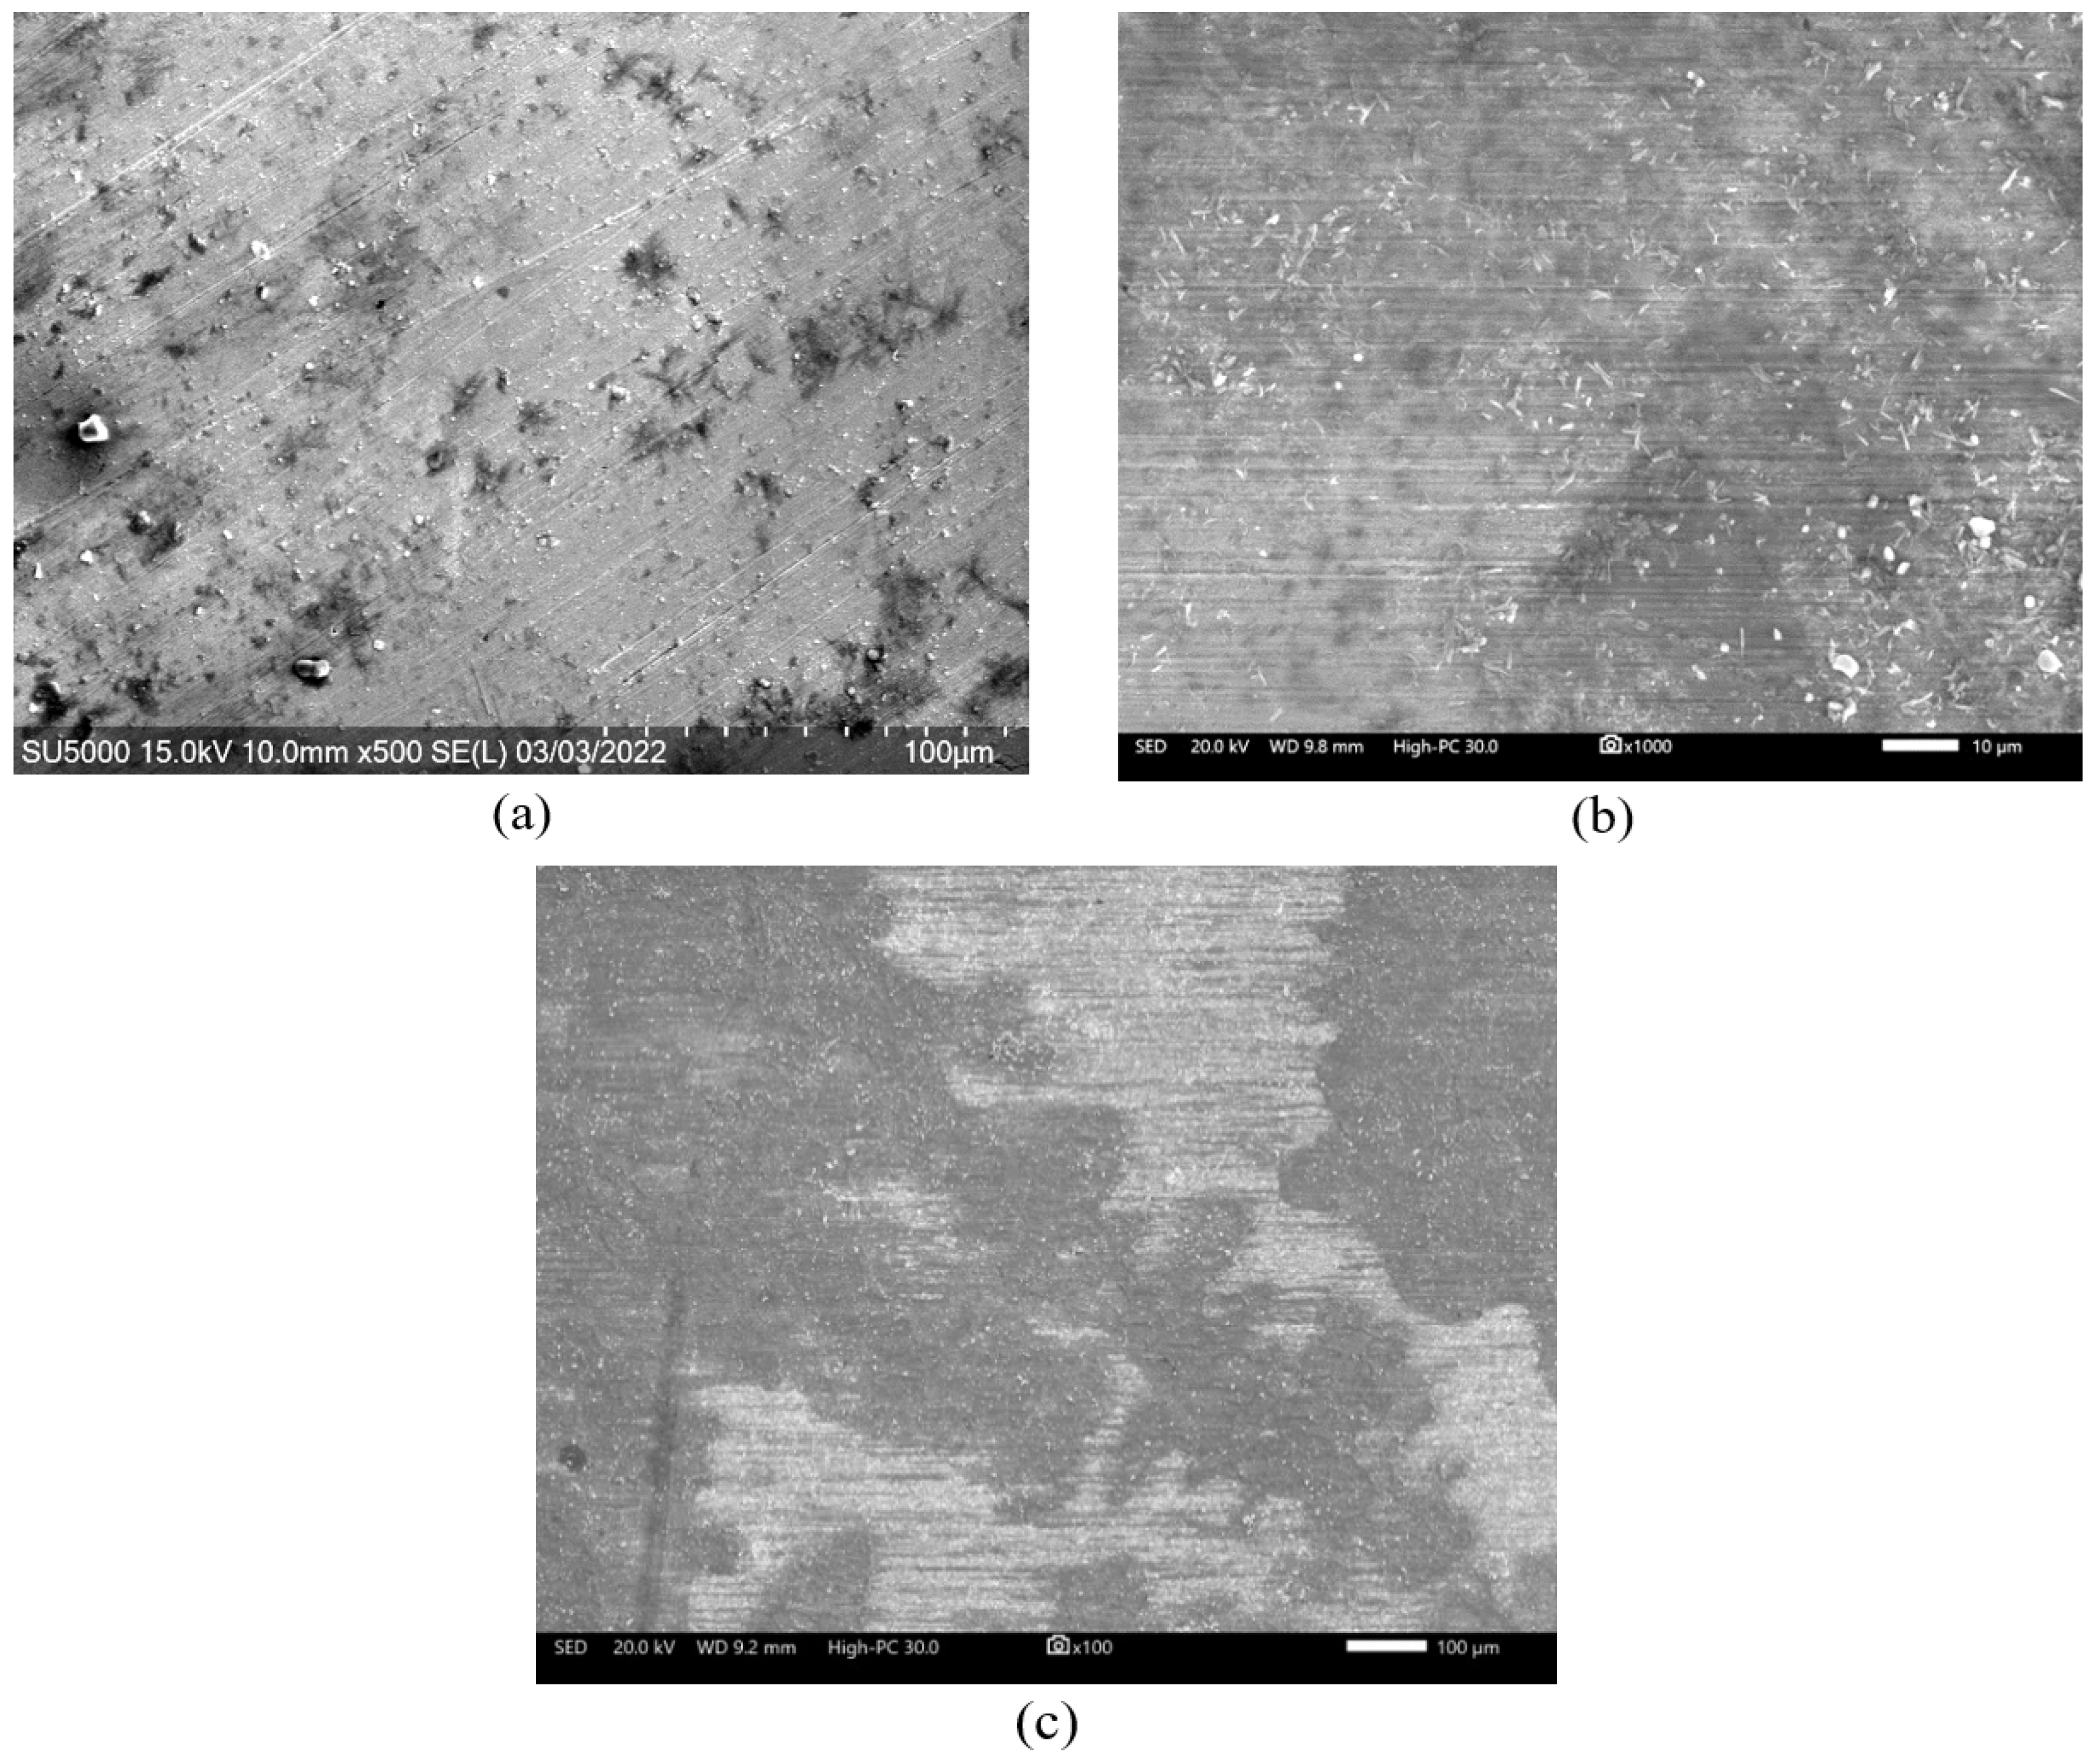
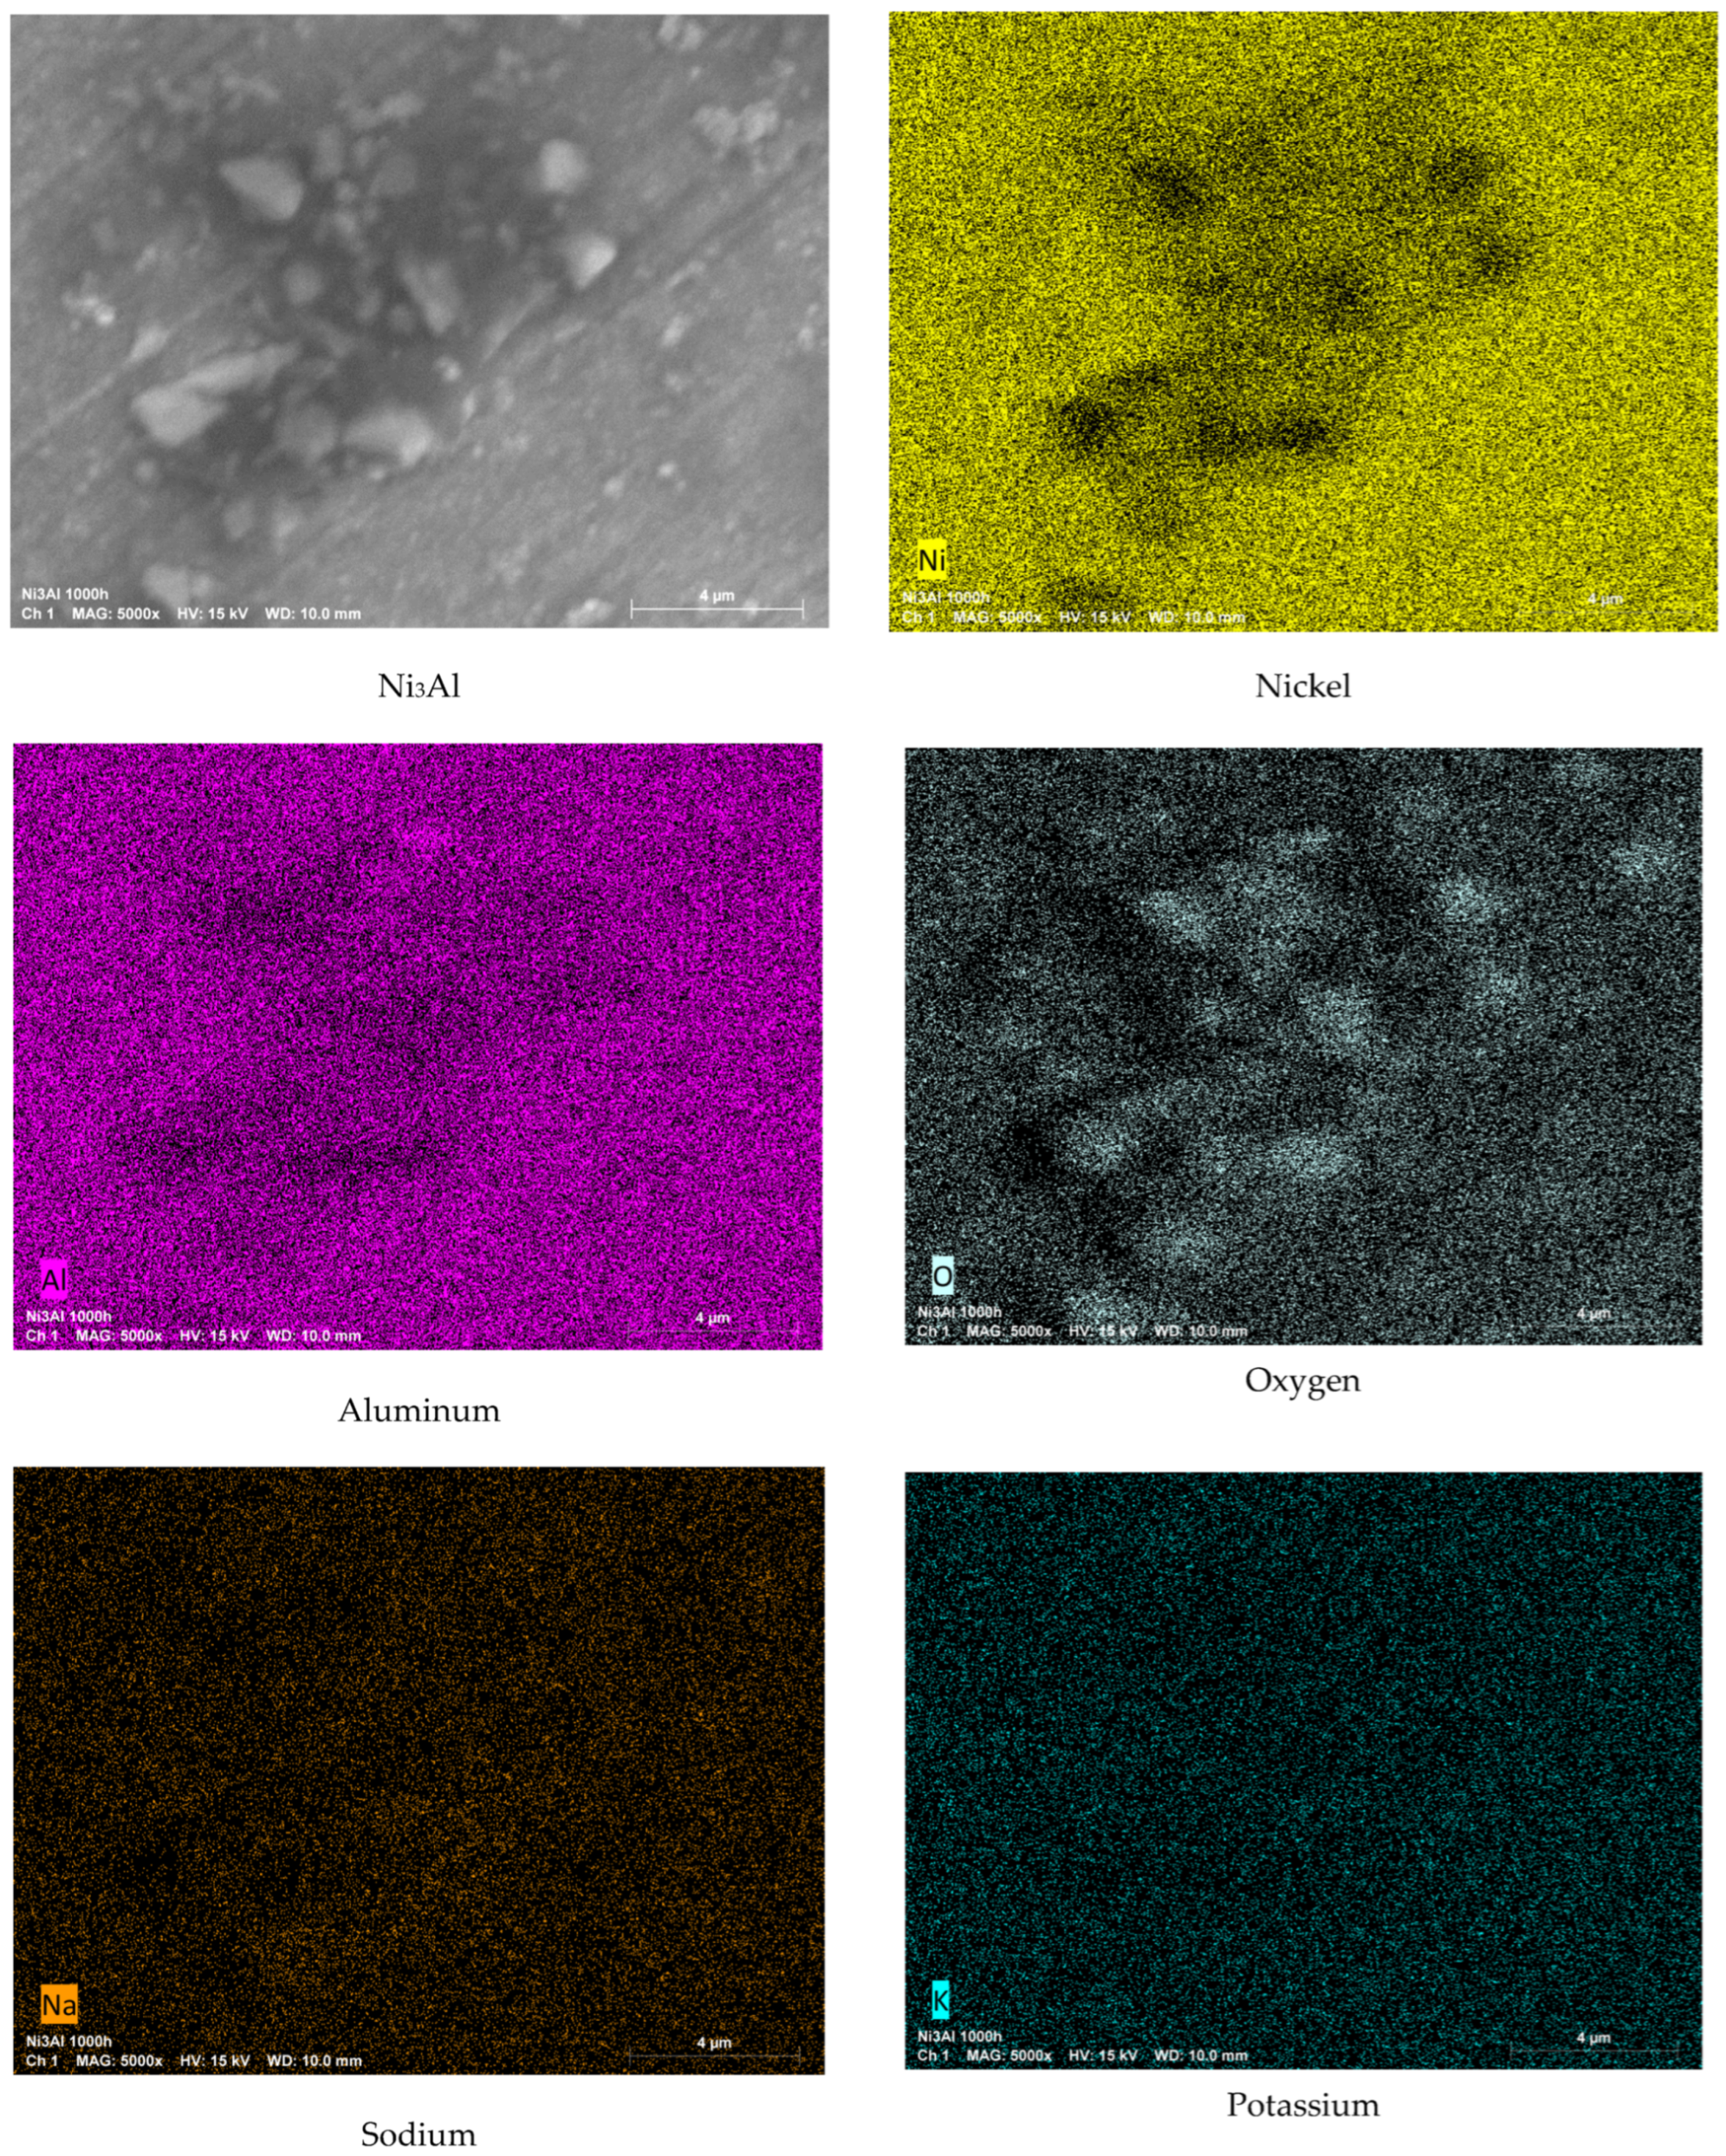
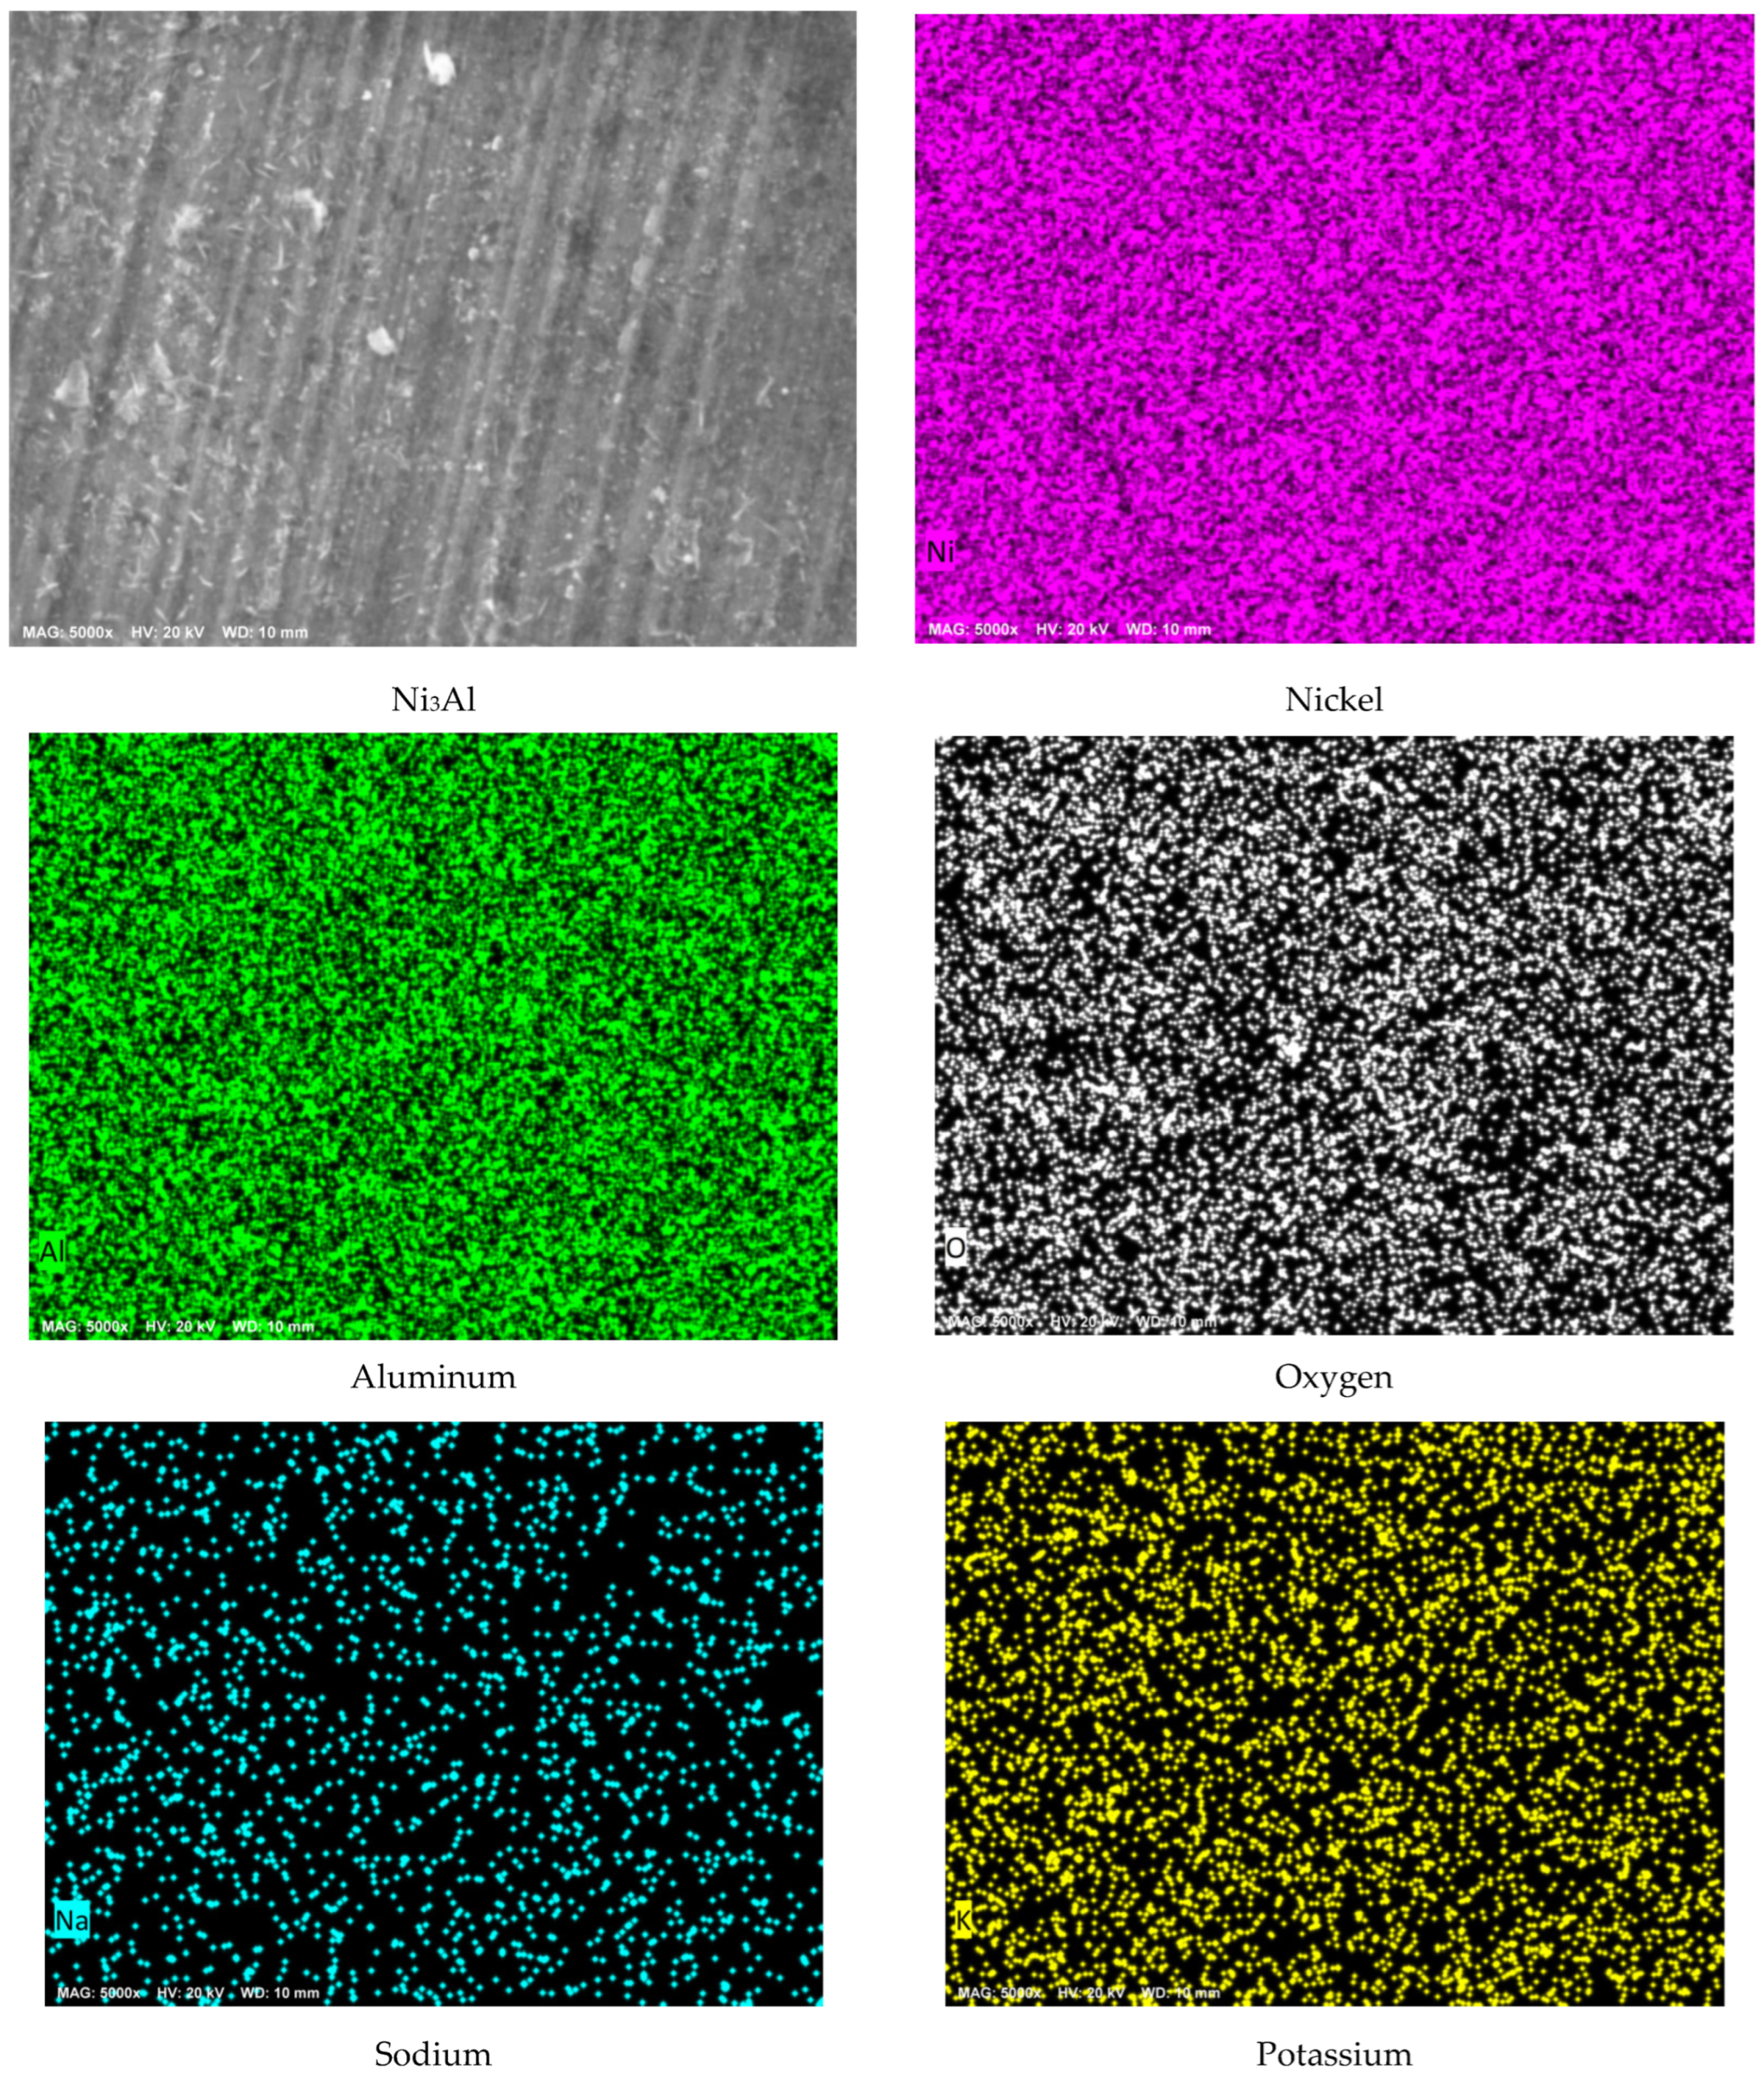
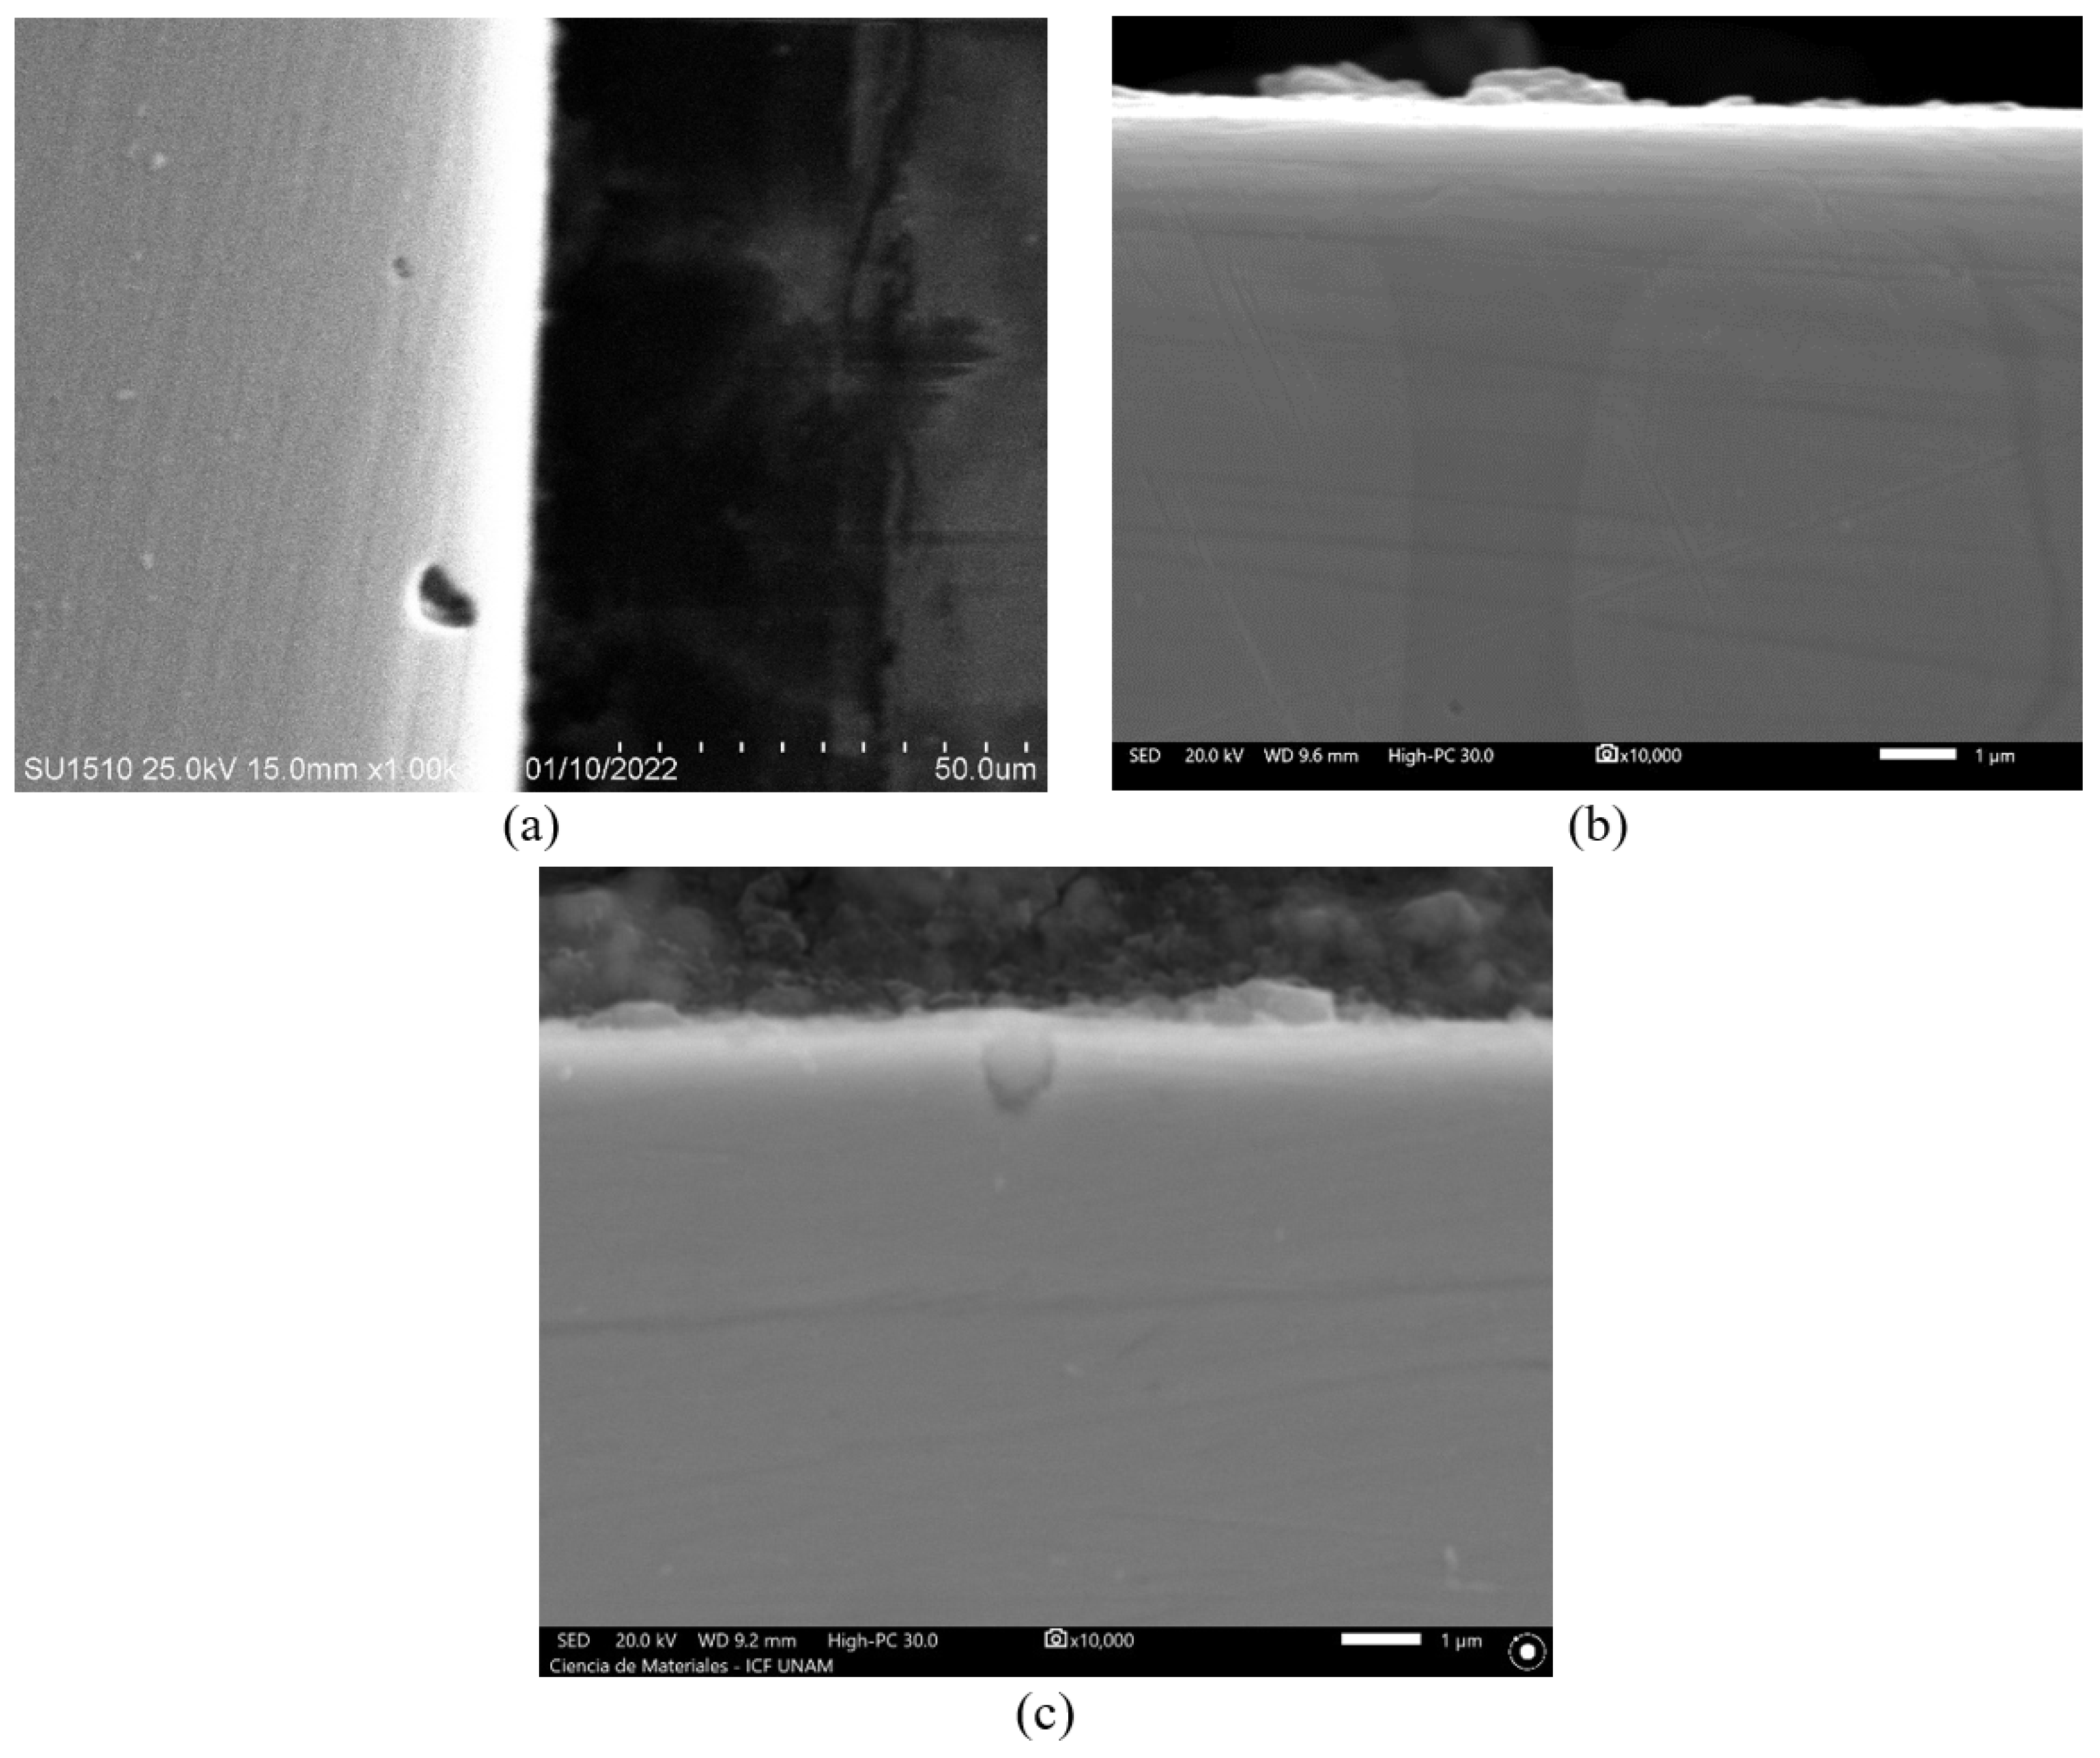
3.2. Surface Analysis by Scanning Electron Microscopy

The surface appearance of the Ni3Al intermetallic at the end of 1000 h of immersion shows (Figure 3) a low level of corrosion products; in all cases, the surface finish marks are visible, which is evidence of the insignificant metallic dissolution experienced by the intermetallic. At 500 °C, a greater accumulation of reaction products (dark areas) was observed. This was mainly observed in the dendritic phases, whose Al content is higher than that of the continuous phase [30].
The surface aspects are consistent with what was observed in the mass gain measurements (Figure 1a), i.e., the presence of corrosion products increases with increasing test temperature; however, the corrosion rate was negligible, since the surface finish marks still persist. Similar behavior has been reported for Ni-Al coatings [36].
Figure 4, Figure 5 and Figure 6 show the element mapping of the surface of the Ni3Al intermetallic exposed to Solar Salt at different test temperatures during 1000 h of immersion. According to elemental mapping, at 300 and 400 °C, the presence of few corrosion products associated with the presence of O, Na, and intermetallic elements is visible. However, at 500 °C, the amount of corrosion products is greater, and it is possible to observe that some corrosion products are composed of Ni-O and Al-O, and others of Al-Na-O. These analyses suggest the formation of oxides of intermetallic elements and the presence of sodium aluminate.
According to elemental mapping, at 300 and 400 °C, the presence of few reaction products adhered to the metal surface is visible, associated with the presence of O, Na, and intermetallic elements. However, at 500 °C, the quantity of corrosion products is greater, and it is possible to observe that some of them are composed of Ni-O and Al-O, and others of Al-Na-O. These analyses suggest the formation of oxides with intermetallic elements and the presence of sodium aluminate. This is discussed in Section 3.7.
In no case was it possible to detect the presence of K associated with any of the intermetallic elements. This is justifiable given that it has been reported that the thermal stability of KNO3 is greater than that of NaNO3, in addition to the fact that the mobility of Na+ is higher than that of K+ due to the difference in their sizes [37].
Figure 7 shows the cross-sectional appearance of the Ni3Al intermetallic immersed in solar salt after 1000 h. In general, in all cases, no significant surface oxide layer adhered to the surface was observed. This is logical given the low mass gain recorded due to its high corrosion resistance. Due to the thin layer of corrosion products formed, reliable X-ray diffraction analysis was not possible, the main signal detected corresponded to the alloy and the corrosion products formed were lost in the background noise.

3.3. Potentiodynamic Polarization Curves

This type of testing is used as an important technique in general corrosion studies to determine the corrosion rate of different alloys in molten salts [38,39,40,41]. The potentiodynamic polarization curve of the intermetallic alloy immersed in molten salts at 300, 400, and 500 °C is shown in Figure 8.
According to the figure, the intermetallic shows active behavior but with a steep slope in its anodic branch. As the test temperature increases, Ecorr shifts to more positive values, and the curves shift to higher current densities. This behavior may be due to the increase in the reaction rate (higher current density) and the formation of a protective layer (shift to higher potentials). Corrosion activity increases with increasing temperature due to an increase in the electrical conductivity of the molten salts and a reduction in their viscosity. This favors the diffusion of active chemical species. Table 1 shows the electrochemical parameters obtained from the polarization curves.
Tafel slopes with values around 100 mV are typical of activation-controlled processes, and that anodic and cathodic slopes with higher values have been associated with processes where mass transfer also controls the corrosion process, resulting in pseudopassive behaviors [38]. The reported corrosion rate values (μm/year) were determined from the icorr values according to ASTM G102 [42]:
C R   μ m y e a r = K   i c o r r E W ρ ,
where K = 3.27 × 10⁻⁶ (μm·g/μA·cm·year); icorr = corrosion current density ((μA/cm2); EW = equivalent weight of the material (dimensionless); and ρ = density of the material (g/cm3). The equivalent weight was determined according to
E W = W i n i f i ,
where fi = mass fraction of component i of the alloy; Wi = atomic weight; and ni = valence.
According to the composition of Ni3Al, the mass fraction of Al is 0.1329 and that of Ni is 0.8671 and the density of the material is 7.35 g/cm3. Based on these values, the calculated equivalent weight is 22.64. Based on the reported values, it is observed that at temperatures below 500 °C, the degradation rate does not vary significantly, but at 500 °C, an increase of an order of magnitude is observed. An increase in the corrosion rate from 400 °C is expected since according to its equilibrium constant, above that temperature, the concentration of aggressive species increases exponentially [11,27,43,44,45].
K = N O 2 P O 2 1 / 2 N O 3 ,

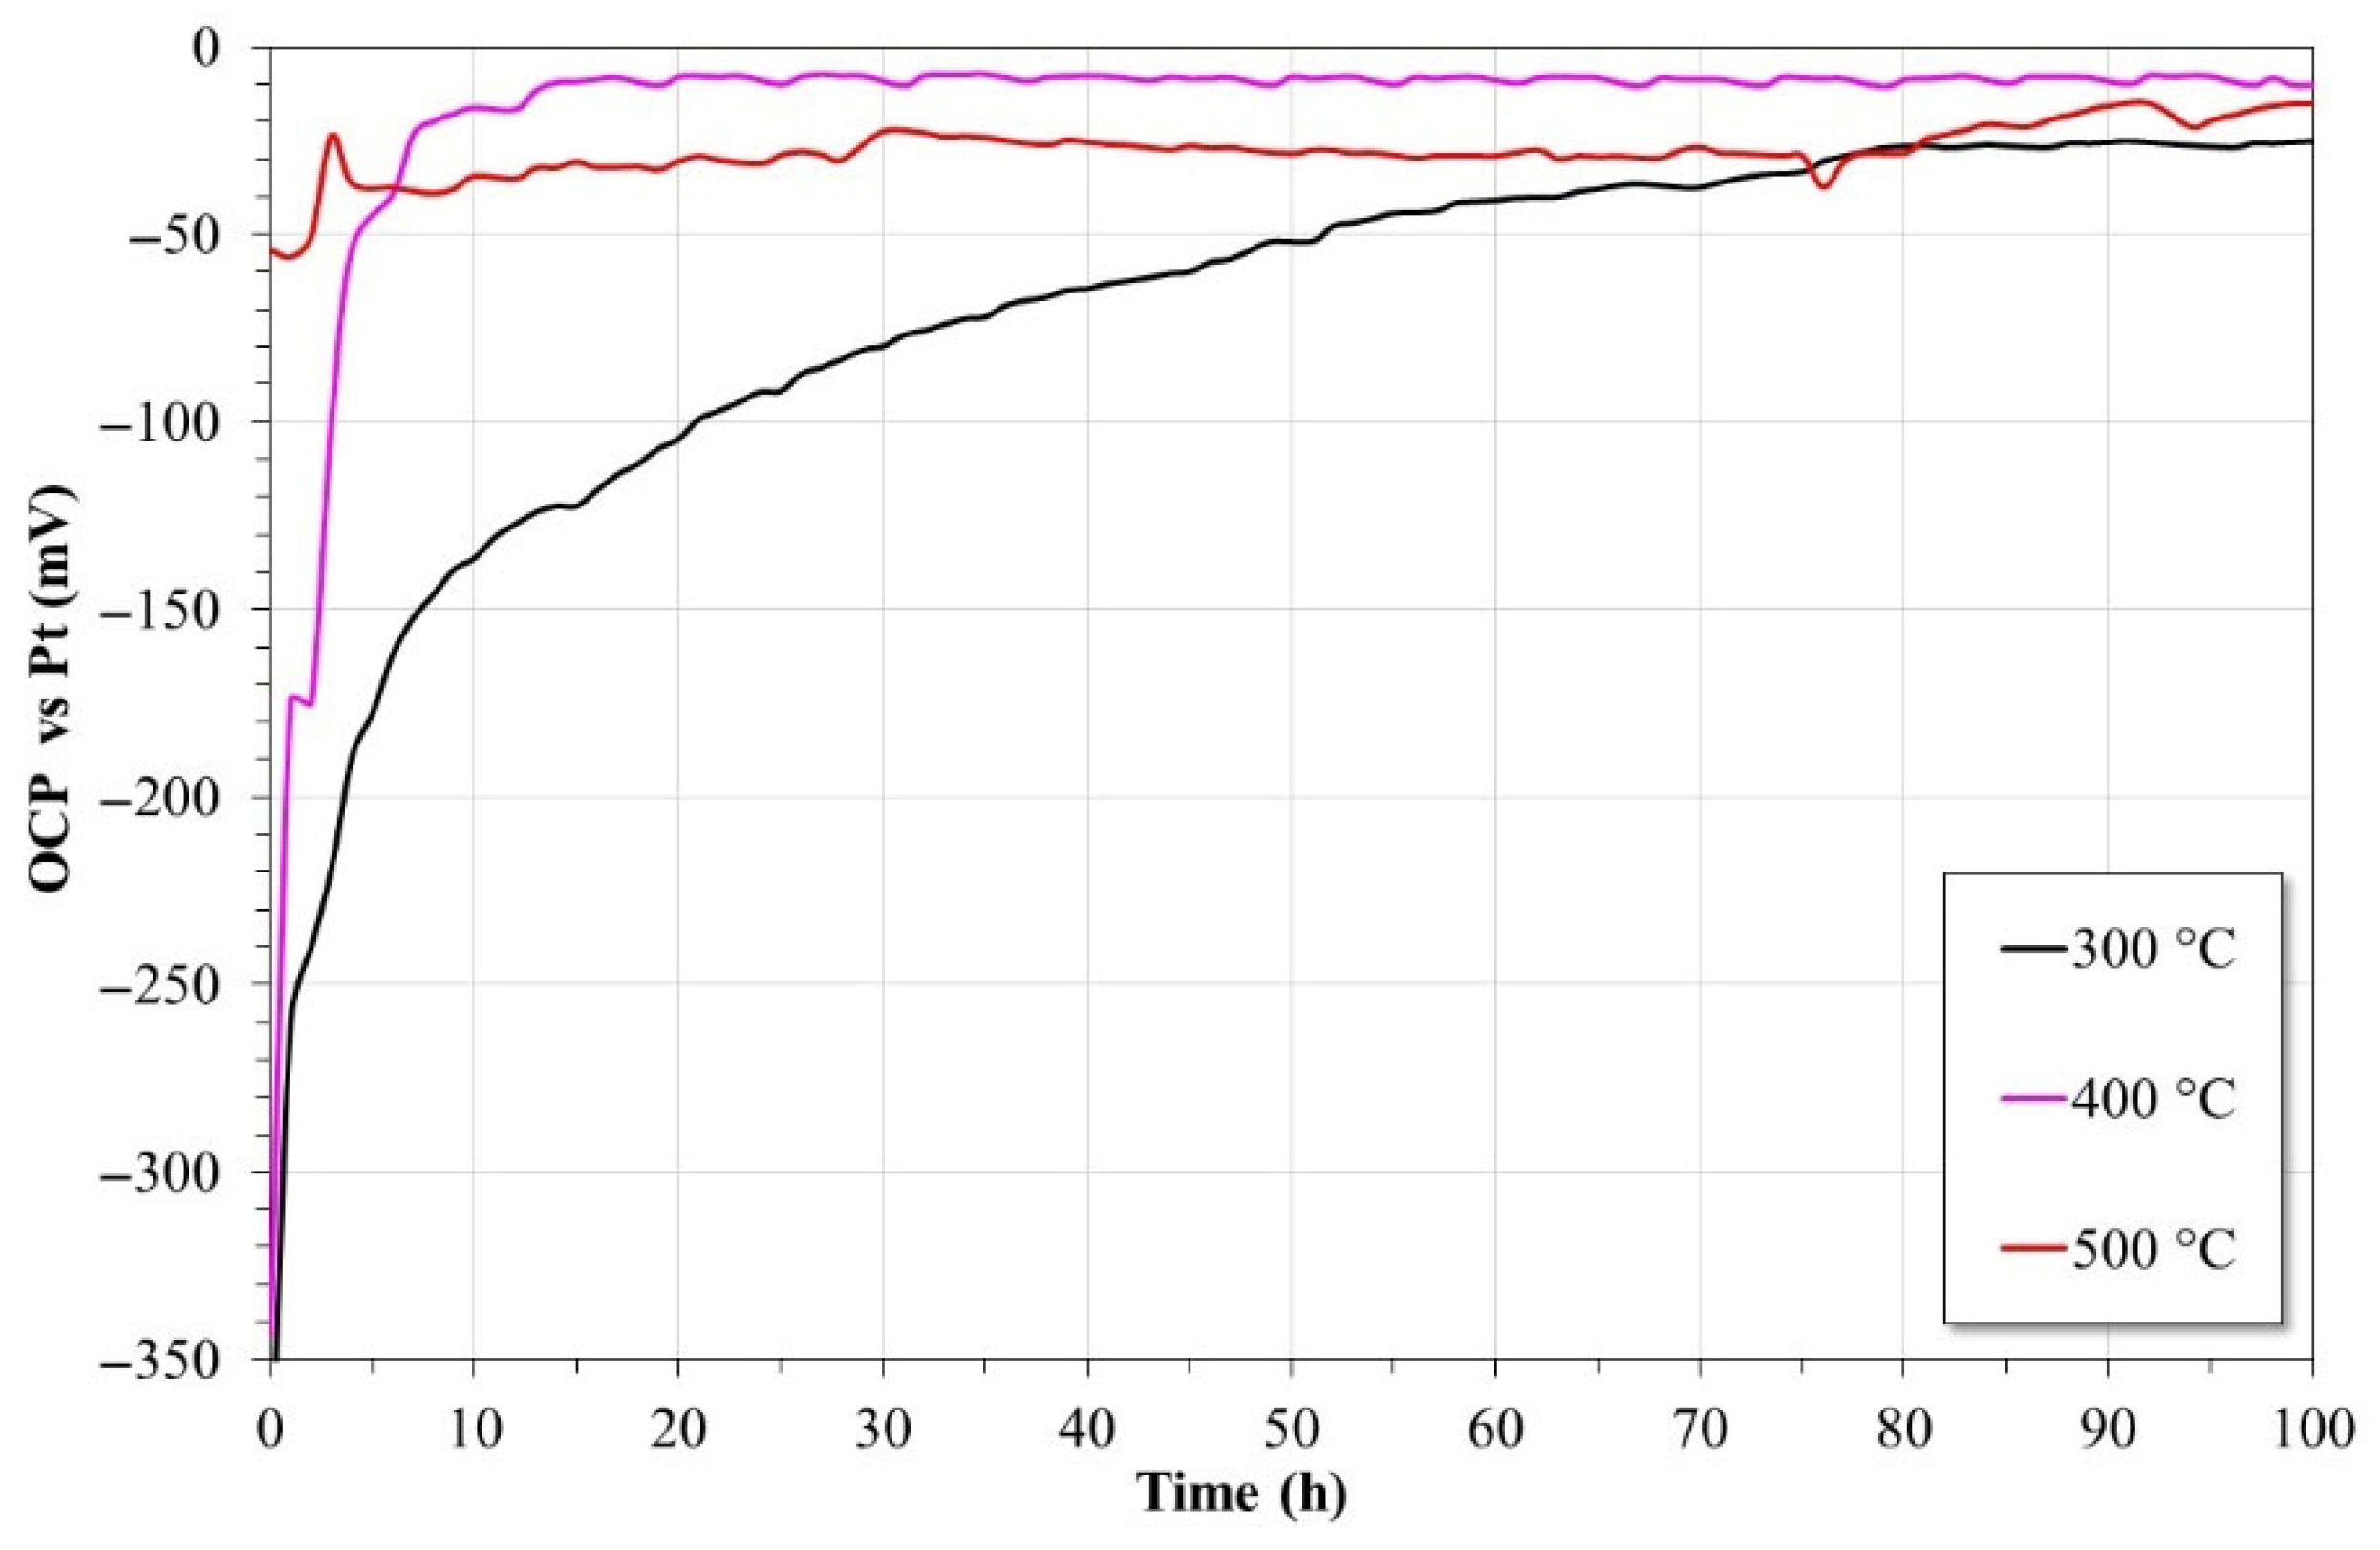
3.4. Open Circuit Potential (OCP)

When the equilibrium potential of an electrochemical cell is undisturbed, the potential of the working electrode relative to the reference electrode is known as the OCP. The OCP is also known as the zero-current potential or resting potential [38]. Analyzing the variation in the OCP with time provides insight into some aspects of the kinetics and mechanism of degradation processes; for example, the growth, stability, or dissolution of the passive layer or anodic film [27,46]. Figure 9 shows the variation in the open-circuit potential of the Ni3Al alloy immersed in molten salt as a function of temperature and immersion time.
At 300 °C, up to 75 h of immersion, a constant increase in OCP values is observed. Subsequently, the alloy reached a steady state around −25 mV. This trend reflects the continuous formation of a protective layer on the intermetallic surface. At 400 °C, an abrupt increase in OCP values was detected during the first 7 h of immersion, followed by a steady-state behavior around −10 mV. However, at 500 °C, at the start of the test (2 h), a slight increase in OCP values was observed, which subsequently showed a quasi-steady state around −15 to −30 mV. The observed behavior indicates that the intermetallic tended to form a passive layer on its surface at all test temperatures.
In general, the observed trend in the OCP values is related firstly to the oxidation process experienced by the alloy, which increases with temperature, and this allows the formation of the passive film. It is clearly observed that the pseudo-steady state is reached faster at 500 °C than at 300 °C. During this process of formation and thickening of the passive film, simultaneous processes of species adsorption, oxide dissolution, and changes in the concentration of metal ions and oxygen occur, which are reflected in the fluctuations of the OCP values [16]. These factors favor the advance of the diffusion layers that alter the surface activity as the electrolyte penetrates through the porosity of the passive layer [47].

3.5. Linear Polarization Resistance (LPR)

Figure 10 shows the evolution of Rp values as a function of time for Ni3Al in solar salt over a period of 100 h. At 300 and 400 °C, the intermetallic showed Rp values above 10,000 Ohm/cm2, suggesting high corrosion resistance. At 500 °C, the intermetallic alloy showed quasi-stationary behavior at the beginning of the test (24 h) and subsequently a slight decrease in its Rp values until 70 h, then showing an abrupt drop and observing again a quasi-stationary behavior until the end of the test. The observed trend is associated with a dissolution process of the passive layer and the attempt of the alloy to regenerate it [48,49]. The trend in Rp values observed at 300 and 400 °C suggests the formation of a protective layer (Al2O3) that minimizes the metallic dissolution of the intermetallic Ni3Al [7]. At 500 °C, the decrease in Rp values can be associated with the increase in the aggressiveness of the eutectic mixture due to the decomposition of the nitrate ion (NO3), which causes an increase in the concentration of aggressive species [11,27,43,44,45].

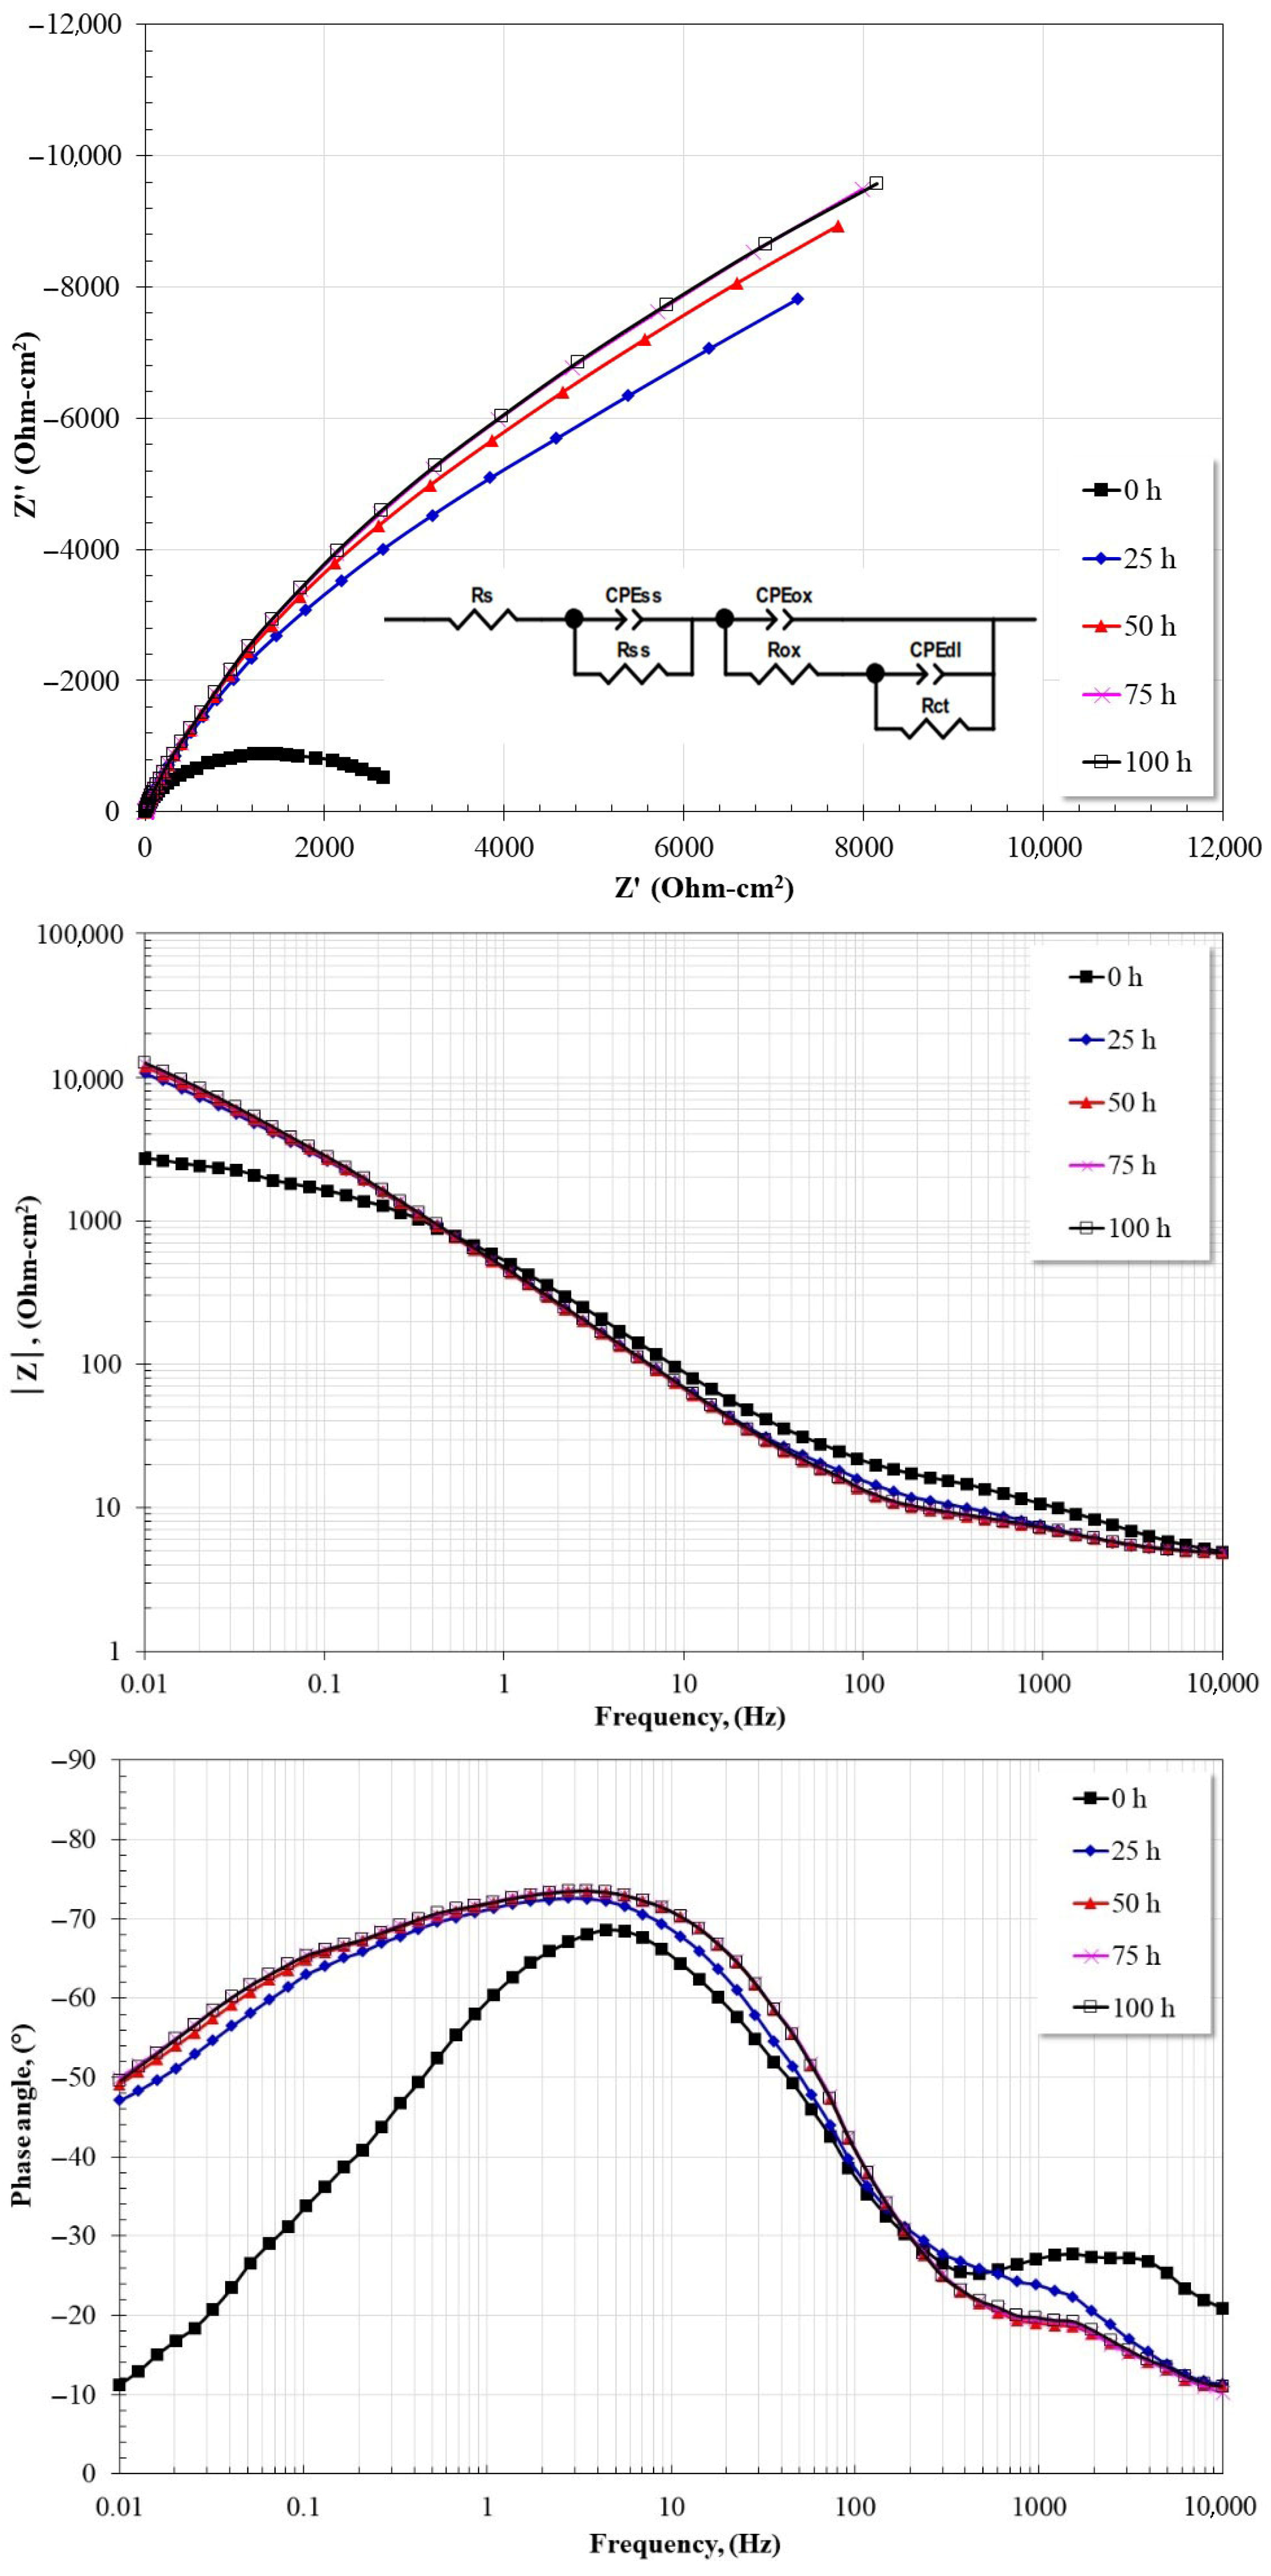
3.6. Electrochemical Impedance Spectroscopy (EIS)

Figure 11, Figure 12 and Figure 13 show the evolution of the electrochemical impedance spectra of the Ni3Al alloy immersed in nitrate molten salts for 100 h at different test temperatures. EIS spectra are related to the behavior of an electrochemical interface, which can generate a dielectric response, oxidation-reduction reactions, and mass transport across the interface, determined by the electrolytes’ and the electrodes’ electrical and chemical properties. Based on the Bode diagram, it is possible to identify the elements for the arrangement of equivalent circuits that describe the electrochemical system [1].
Figure 11 shows the evolution of the EIS spectra of the Ni3Al alloy in molten salt at 300 °C for 100 h. In the Nyquist diagram, the data describes the presence of a capacitive semicircle; the diameter of the semicircle shows a tendency to increase as a function of immersion time. The formation of a large, depressed, low-frequency capacitive semicircle is associated with the formation of a protective layer on the alloy surface, and the increase in its diameter is associated with a decrease in the corrosion rate. From the Bode diagram (impedance modulus), at all test times, the formation of the high-frequency plateau is not detected; instead, a linear relationship (log |Z|-log ƒ) is observed, suggesting the presence of a time constant in that region. At intermediate frequencies, the apparent presence of another relationship is detected (log |Z|-log ƒ), and in the low-frequency region, the formation of the low-frequency plateau is not observed. On the other hand, in the Bode diagram, in its phase angle format, three time constants can be observed: the first in the high frequency region with a maximum phase angle located around 1000–2000 Hz, the second between 1 and 5 Hz, and the third around 0.1 Hz. In all three cases, the maximum of the time constants does not show a significant variation or displacement. The first and second time constants can be associated with the formation of a layer of corrosion products, either because, in the first case, it can be seen as a layer of bilayer-type corrosion products, where the outer layer is porous and the inner layer is dense and adherent to the metal surface, or, because, in the second case, as a protective layer, the outer layer is composed of intermediate species adsorbed to a protective film adhered to the metal surface. The last time constant is associated with the resistive–capacitive response of the metal surface.
Figure 12 shows the evolution of the EIS spectra of the Ni3Al alloy in molten salt at 400 °C for 100 h. In general, the spectra and their evolution are like those observed at 300 °C. That is, from the Nyquist diagram, a single capacitive semicircle is observed whose diameter increases with time. It is notable that its diameter increases substantially after the first measurement. This suggests the rapid formation or thickening of a protective surface layer. From the Bode diagram (impedance modulus), the formation of the high-frequency plateau is also not detected. In the intermediate frequency region, a linear relationship (log |Z|-log ƒ) is detected, while in the low frequency region, the presence of the low-frequency plateau is not observed. From the Bode diagram in its phase angle format, two time constants are initially observed: the first in the high-frequency region around 3000 Hz, with a maximum close to 28°, and the second around 5 Hz, with a maximum around 68°. At longer times, three time constants are observed: the first in the high-frequency region around 1000 Hz, with a decreasing maximum reaching 20° starting at 50 h; that is, it shifted towards lower frequencies and its maximum decreased with respect to what was observed at zero hours. The second time constant is located around 3 Hz, with a maximum around 74°. The third time constant is observed around 0.1 Hz, with a constant maximum around 65°. The meaning of the three-time constants is the same as that described at 300 °C.
At 500 °C (Figure 13), the Nyquist diagram shows the presence of a depressed capacitive semicircle, but unlike what was observed at 400 °C, in this case, the diameter of the capacitive semicircle decreases as the immersion time increases. This suggests an increase in the corrosion rate with increasing exposure time. Regarding the Bode diagram (|Z|), and unlike the other temperatures, in this case, the formation of a high-frequency plateau is observed. At frequencies below 1000 Hz, a linear relationship (log |Z|-log ƒ) is observed. On the other hand, the phase angle Bode diagram shows the presence of two-time constants. These time constants could correspond to the capacitive response of a thin surface layer and the surface of the Ni3Al intermetallic. This indicates a constant dissolution of the protective layer and a continuous attempt of the intermetallic to regenerate its passive layer [27].
In general, the impedance spectra show that the magnitude of the diameter of the capacitive semicircles decreases with increasing temperature. This is because with increasing temperature, the aggressiveness of the solar salt increases, and ion diffusion through it is greater, which is the rate-controlling step. The diameter of the semicircle represents the resistance to charge transfer, and therefore, the larger the diameter of the semicircle, the lower the corrosion rate. The results are consistent with those obtained from gravimetric analysis.
Electrical circuits can be used to simulate impedance spectra. According to the interpretation of the impedance spectra, they can be modeled by the equivalent circuits shown in Figure 14. Rs represents electrolyte resistance, Cdl the electrochemical double-layer capacitance, Rct the charge-transfer resistance, Rox the resistance of the resistive layer, and Cox is its capacitance. At 300 and 400 °C, the first-time constant is represented by Rss and Css.
Because the roughness of the electrode surface increases during the degradation process, it is generally suggested to use the constant phase element (CPE) instead of capacitance (C) to compensate for the dispersion effect at the electrode interface. The impedance of the CPE is given by [50]
Z C P E = Y 1 ( j w ) n ,
where Y = constant (F cm−2 s(n−1)); ω = angular frequency (rad s−1); j2 = −1; and n is a coefficient representing the phase shift and the surface heterogeneity (0 < n < 1). If n = 1, CPE = C, while if n = 0.5, CPE = ZW (Warburg impedance) and if n = 0, CPE = R. The CPE capacitance can be calculated according to equation [51,52]
C C P E = ( Y R f ) 1 / n R f ,
A complex non-linear least squares (CNLS) simulation is utilized to compare those attained experimental and data simulation of the EIS plots, as commonly reported [53,54,55]. It is worth noting that the quality fitting is represented by “chi-squared”, as demonstrated in Table 2.
The adjustment of the impedance spectra was carried out considering a goodness of fit (χ2) of 0.001. Figure 15 shows the variation in Rct and Rox values as a function of time. Regarding the Rct values, it can be observed that their trend and values show a great similarity with those of the polarization resistance measurements (Figure 10). This agreement suggests that equivalent circuits are adequate for simulating surface processes at the metal–electrolyte interface. Possible differences could be because, in general, Rp = Rct + Rox. According to the results, the intermetallic Ni3Al shows a similar corrosion resistance at 300 °C and 400 °C; however, at 500 °C, its corrosion resistance decreases significantly. This behavior is consistent with the Rox values, where its resistance is also similar at 300 °C and 400 °C, and it decreases at 500 °C. This observed trend indicates a decrease in the chemical stability of the protective layer formed.
Figure 16 shows the evolution of Cdl and Cox values with immersion time. Regarding Cdl values, at 300 °C and 400 °C, a tendency to decrease with time is observed. However, at 500 °C, the opposite behavior is observed; that is, Cdl values increase steadily until the first 50 h of immersion and subsequently remain with little variation. The decrease in Cdl values observed at 300 °C and 400 °C indicates a decrease in the corrosion rate of the Ni3Al intermetallic. At 500 °C, the initial increase is indicative of high electrochemical activity on the material’s surface, and it subsequently shows quasi-stationary behavior. However, its values indicate a higher corrosion rate, as corroborated by the Rct and Rp values (Figure 10 and Figure 15) [27]. Regarding the Cox values, a similar trend to that observed with the Cdl values is observed and its values also suggest that the stability of the passive films is similar at 300 °C and 400 °C, and this decreases at 500 °C.

3.7. Reaction Mechanisms

The corrosive mechanism is influenced by the type of anion present in the molten salt. Oxyanionic salts (nitrates, carbonates, sulfates, hydroxides) in the molten state exhibit acid/base behavior that can be analyzed using the Lux–Flood model, with the oxide ion concentration (O2−) being the determining parameter for the basic nature of the melt. At low O2− concentrations, the medium becomes acidic, and the metal oxides undergo acid dissolution:
M x O y x M + z + y O 2 ,
On the contrary, at high O2− concentration, basic dissolution is favored:
M x O y + z O 2 M x O y + z 2 ,
In general, oxyanionic salts dissociate into cationic species and oxygenated anion according to
R x A O y x R + z + A O y z ,
A O y z A O y 1 + 2 z + O 2 ,
where R represents an alkali metal (Na+, K+) and A is an element such as C, S, N, or H [56].
In the specific case of nitrate salts (NaNO3-KNO3), its thermal decomposition generates dissolved oxygen through the following primary reactions:
2 N O 3 2 N O 2 + O 2
This oxygen promotes the oxidation of the metallic elements:
4 A l + 3 O 2 2 A l 2 O 3
2 N i + O 2 2 N i O
The nitrite species (NO2) formed can also decompose under high temperature conditions, generating more oxidizing species and increasing the basicity of the medium:
2 N O 2 O 2 + N O + N O 2
5 N O 2 O 2 + N 2 + 3 N O 3
The generation of O2− increases the basicity of the molten salts, favoring the dissolution of protective oxides:
N i O + O 2 N i O 2 2
A l 2 O 3 + O 2 A l 2 O 4 2
The complex anions generated can subsequently react with metal cations (Na+, K+), giving rise to stable compounds such as sodium aluminate:
2 N a + + A l 2 O 4 2 2 N a A l O 2 ,
This product has been reported to be thermally stable and adherent to the metal surface [57], providing some corrosion resistance. In contrast, Cr2O3-forming alloys generate soluble products such as Na2CrO4 and K2CrO4, which do not contribute to passive protection [11,37,58,59].
Finally, it is highlighted that the Na+ cation has greater ionic mobility and its base salt (NaNO3) is less thermally stable than KNO3, which makes it the main promoter of these reactions in Solar Salt [37].
The experimental evidence presented is consistent with the available information on the free energies of formation of the main species involved in the corrosion protection process (Table 3). On the one hand, from a thermodynamic point of view, the main protective oxide formed onto Ni3Al surface is Al2O3, and despite its high stability as a protective oxide, the formation of NaAlO2 is possible over time, also due to the magnitude of its free energy of formation.

4. Conclusions

This work evaluated the performance of the intermetallic alloy Ni3Al in Solar Salt at of 300, 400, and 500 °C for up to 1000 h. Based on gravimetric analysis, electrochemical testing, and surface characterization, the following conclusions can be drawn.
The Ni3Al intermetallic exhibits high corrosion resistance in molten solar salt environments, especially at 300 and 400 °C, where the mass gained or lost and the calculated corrosion rates were minimal (≤0.20 µm/year), evidencing an efficient formation of protective layers of aluminum-rich oxides. At 500 °C, an increase in corrosion was observed, both in the mass gained through the formation of reaction products and in the mass lost through metal dissolution. This increase is related to the thermal decomposition of NO3 to NO2 and O2−, which generates a more aggressive environment that favors material degradation.
The formation of protective layers composed of Al2O3 and NaAlO2 was confirmed by SEM and elemental mapping, with these layers becoming more abundant at higher temperatures. The layers were thin enough not to allow clear identification by X-ray diffraction, but they proved effective in limiting corrosion. The potentiodynamic polarization curves showed active behavior with steep anodic slopes, which shifted toward higher current densities with increasing temperature, indicating greater electrochemical activity and faster formation of corrosion products. The open circuit potential (OCP) showed the progressive formation of a passive layer at all temperatures, reaching higher values as the immersion time progressed, although with lower stability at 500 °C. Polarization resistance (Rp) and The EIS results confirmed the development of protective layers on the Ni3Al, with high impedance values and the presence of multiple time constants, associated with layers of corrosion products. At 500 °C, a decrease in Rp and greater dispersion of the data were observed, indicating partial loss of protection. Overall, the data suggest that Ni3Al is a promising material for applications in contact with molten salts in thermal storage or heat transfer systems, especially at moderate temperatures (<500 °C), where it maintains its surface integrity and forms effective passivating layers.

Author Contributions

Conceptualization, J.G.C.-N., J.P.-C. and J.G.G.-R.; methodology, D.L.-D., N.B.G.-G., C.D.A.-G. and J.d.l.V.O.; validation, J.d.l.V.O. and C.D.A.-G.; formal analysis, J.d.l.V.O.; investigation, D.L.-D., N.B.G.-G. and C.D.A.-G.; writing—original draft preparation, J.G.C.-N., J.P.-C. and J.G.G.-R.; writing—review and editing, J.G.C.-N., J.P.-C. and J.G.G.-R.; supervision, J.P.-C. All authors have read and agreed to the published version of the manuscript.

Funding

This research received no external funding.

Data Availability Statement

The raw data supporting the conclusions of this article will be made available by the authors on request.

Acknowledgments

D. Lopez-Dominguez thanks CONAHCYT (National Council of Humanities, Science and Technology) Mexico for the financial support received during their studies.

Conflicts of Interest

The authors declare no conflicts of interest.

References

  1. Encinas-Sánchez, V.; de Miguel, M.T.; Lasanta, M.I.; García-Martín, G.; Pérez, F.J. Electrochemical impedance spectroscopy (EIS): An efficient technique for monitoring corrosion processes in molten salt environments in CSP applications. Sol. Energy Mater. Sol. Cells 2019, 191, 157–163. [Google Scholar] [CrossRef]
  2. Ma, L.; Zhang, C.; Wu, Y.; Lu, Y. Comparative review of different influence factors on molten salt corrosion characteristics for thermal energy storage. Sol. Energy Mater. Sol. Cells 2022, 235, 111485. [Google Scholar] [CrossRef]
  3. Zhan, F.; Yu, H.; Yang, P.; Zhu, M.; Bai, Z.; Gao, Y. Review of Molten Salt Corrosion in Stainless Steels and Superalloys. Crystals 2025, 15, 237. [Google Scholar] [CrossRef]
  4. Mortazavi, A.; Zhao, Y.; Esmaily, M.; Allanore, A.; Vidal, J.; Birbilis, N. High-temperature corrosion of a nickel-based alloy in a molten chloride environment—The effect of thermal and chemical purifications. Sol. Energy Mater. Sol. Cells 2022, 236, 111542. [Google Scholar] [CrossRef]
  5. Fernández, A.G.; Cabeza, L.F. Corrosion monitoring and mitigation techniques on advanced thermal energy storage materials for CSP plants. Sol. Energy Mater. Sol. Cells 2019, 192, 179–187. [Google Scholar] [CrossRef]
  6. Sutter, F.; Oskay, C.; Galetz, M.C.; Diamantino, T.; Pedrosa, F.; Figueira, I.; Glumm, S.; Bonk, A.; Agüero, A.; Rodríguez, S.; et al. Dynamic corrosion testing of metals in solar salt for concentrated solar power. Sol. Energy Mater. Sol. Cells 2021, 232, 111331. [Google Scholar] [CrossRef]
  7. Fernandez, A.G.; Rey, A.; Lasanta, I.; Mato, S.; Brady, M.; Perez, F.J. Corrosion of alumina-forming austenitic steel in molten nitrate salts by gravimetric analysis and impedance spectroscopy. Mater. Corros. 2014, 65, 267–275. [Google Scholar] [CrossRef]
  8. Cheng, W.-J.; Chen, D.-J.; Wang, C.-J. High-temperature corrosion of Cr–Mo steel in molten LiNO3–NaNO3–KNO3 eutectic salt for thermal energy storage. Sol. Energy Mater. Sol. Cells 2015, 132, 563–569. [Google Scholar] [CrossRef]
  9. Ignatiev, V.; Surenkov, A.; Gnidoy, I. Intergranular tellurium cracking of nickel-based alloys in molten salt mixture. J. Nucl. Mater. 2013, 440, 243–249. [Google Scholar] [CrossRef]
  10. Kumar, S.; Chattopadhyay, K.; Alam, Z.; Singh, V.; Satyanarayana, D.V.V.; Kumar, V. Corrosion Behavior of Surface Nanostructured IN718 Superalloy at 650 °C. Matls. Perf. Charact. 2022, 11, 157–170. [Google Scholar] [CrossRef]
  11. Felix-Contreras, R.; de la Vega Olivas, J.; Arrieta-Gonzalez, C.D.; Chacon-Nava, J.G.; Rodriguez-Diaz, R.A.; Gonzalez-Rodriguez, J.G.; Porcayo-Calderon, J. Kinetic and Thermodynamic Aspects of the Degradation of Ferritic Steels Immersed in Solar Salt. Materials 2024, 17, 5776. [Google Scholar] [CrossRef] [PubMed]
  12. Brady, M.P.; Yamamoto, Y.; Santella, M.L.; Pint, B.A. Effects of minor alloy additions and oxidation temperature on protective alumina scale formation in creep-resistant austenitic stainless steels. Scr. Mater. 2007, 57, 1117–1120. [Google Scholar] [CrossRef]
  13. Yamamoto, Y.; Brady, M.P.; Santella, M.L.; Bei, H.; Maziasz, P.J.; Pint, B.A. Overview of Strategies for High-Temperature Creep and Oxidation Resistance of Alumina-Forming Austenitic Stainless Steels. Metall. Mater. Trans. A 2011, 42, 922–931. [Google Scholar] [CrossRef]
  14. Shi, J.; Meng, F.; Huang, G.; Liu, F.; Zhai, L.; Chen, Y.; Zhang, F.; Lin, J.; Wang, L. Improving the oxidation resistance by forming continuous Al2O3 protective layer in alumina-forming austenitic stainless steel. Surf. Coat. Technol. 2024, 493, 131279. [Google Scholar] [CrossRef]
  15. Wenga, T.; Wu, X.; Yixian, X.; Zeng, S.; Ma, W. High-temperature corrosion mechanisms of a Ni-based alloy in simulated multi-source organic waste co-incineration environments. Fuel 2024, 377, 132784. [Google Scholar] [CrossRef]
  16. Yang, S.; Gao, S.-Y.; Xue, W.-H.; Wu, B.; Duan, D.L. Oxidation, hot corrosion, and interdiffusion behavior of NiAlTa coating by electro-spark deposition. Rare Met. 2025, 44, 4988–5004. [Google Scholar] [CrossRef]
  17. Yadav, P.; Abro, M.A.; Lee, D.B.; Yoon, J. High-temperature corrosion of pure Ni3Al and its alloyed (2.99 wt.% Ti) in Ar-0.2% SO2 gas environment. J. Mater. Res. Technol. 2022, 17, 3055–3065. [Google Scholar] [CrossRef]
  18. Tiwari, S.K.; Rao, A.U.; Kharb, A.S.; Chawla, A.K.; Avasthi, D.K. A review of mechanical and tribological properties of Ni3Al-based coatings-synthesis and high-temperature behavior. Phys. Scr. 2023, 98, 072001. [Google Scholar] [CrossRef]
  19. Wang, Y.; Guo, Q.; Zhou, Q.; Zhang, C.; Song, B.; Qiao, J.; Fan, D.; He, J.; He, W.; Guo, H.; et al. Research progress in high temperature functional coatings for advanced aeroengines. J. Aeronautical Mater. 2024, 44, 48–69. [Google Scholar] [CrossRef]
  20. McConohy, G.; Kruizenga, A. Molten nitrate salts at 600 and 680 °C: Thermophysical property changes and corrosion of high-temperature nickel alloys. Sol. Energy 2014, 103, 242–252. [Google Scholar] [CrossRef]
  21. Dorcheh, A.S.; Durham, R.N.; Galetz, M.C. Corrosion behavior of stainless and low-chromium steels and IN625 in molten nitrate salts at 600 °C. Sol. Energy Mater. Sol. Cells 2016, 144, 109–116. [Google Scholar] [CrossRef]
  22. Fernández, A.G.; Galleguillos, H.; Fuentealba, E.; Pérez, F.J. Corrosion of stainless steels and low-Cr steel in molten Ca(NO3)2–NaNO3–KNO3 eutectic salt for direct energy storage in CSP plants. Sol. Energy Mater. Sol. Cells 2015, 141, 7–13. [Google Scholar] [CrossRef]
  23. Bradshaw, R.W. Thermal convection loop study of the corrosion of incoloy 800 in molten NaNO3-KNO3. Corrosion 1987, 43, 173–178. [Google Scholar] [CrossRef]
  24. ISO 17245; Corrosion of Metals and Alloys—Test Method for High Temperature Corrosion Testing of Metallic Materials by Immersing in Molten Salt or Other Liquids Under Static Conditions International Standard, First Edition 2015-04-15. ISO: Geneva, Switzerland, 2015.
  25. ASTM G31-72; Standard Practice for Laboratory Immersion Corrosion Testing of Metals. ASTM: West Conshohocken, PA, USA, 2004.
  26. Yang, P.; Deng, Z.; Chen, B.; Wang, Y. High-temperature dynamic corrosion mechanisms of austenitic stainless and carbon steels in nitrates for concentrating solar power. Sol. Energy Mater. Sol. Cells 2024, 266, 112690. [Google Scholar] [CrossRef]
  27. Gomez-Guzman, N.B.; Lopez-Dominguez, D.; Arrieta-Gonzalez, C.D.; Mayen, J.; Porcayo-Palafox, E.; Chacon-Nava, J.G.; Gonzalez-Rodriguez, J.G.; Porcayo-Calderon, J.; Rodriguez-Diaz, R.A. Behavior of Ni20Cr Alloy in Molten Nitrate Salts. Int. J. Mol. Sci. 2022, 23, 7895. [Google Scholar] [CrossRef] [PubMed]
  28. Audigié, P.; Encinas-Sánchez, V.; Juez-Lorenzo, M.; Rodríguez, S.; Gutiérrez, M.; Pérez, F.J.; Agüeroa, A. High temperature molten salt corrosion behavior of aluminide and nickel-aluminide coatings for heat storage in concentrated solar power plants. Surf. Coat. Technol. 2018, 349, 1148–1157. [Google Scholar] [CrossRef]
  29. Sidhu, B.S.; Prakash, S. Evaluation of the corrosion behaviour of plasma-sprayed Ni3Al coatings on steel in oxidation and molten salt environments at 900 °C. Surf. Coat. Technol. 2003, 166, 89–100. [Google Scholar] [CrossRef]
  30. Ramos-Hernandez, J.J.; Porcayo-Calderon, J.; Gonzalez-Rodriguez, J.G.; Mayén, J.; Lara-Rodriguez, G.; Salinas-Bravo, V.M.; Martinez-Gomez, L. Effect of the Noble Metals Addition on the Oxidation Behavior of Ni3Al. Adv. Mater. Sci. Eng. 2018, 2018, 1616340. [Google Scholar] [CrossRef]
  31. Ramos-Hernandez, J.J.; Arrieta-Gonzalez, C.D.; Chacon-Nava, J.G.; Porcayo-Palafox, E.; Sanchez-Carrillo, M.; Flores-De los Rios, J.P.; Pedraza-Basulto, G.K.; Diaz-Mendez, S.E.; Porcayo-Calderon, J. Effect of Noble Metal Addition on the Disorder Dynamics of Ni3Al by Means of MonteCarlo Simulation. Materials 2020, 13, 4832. [Google Scholar] [CrossRef]
  32. Choi, S.C.; Cho, H.J.; Lee, D.B. Effect of Cr, Co, and Ti additions on the high-temperature oxidation behavior of Ni3Al. Oxid. Met. 1996, 46, 109–127. [Google Scholar] [CrossRef]
  33. Chang, T.T.; Pan, Y.C.; Chuang, T.H. The oxidation behavior of Ni3AlZr alloys with various zirconium contents. J. Alloy Compd. 1996, 243, 126–132. [Google Scholar] [CrossRef]
  34. Haasch, R.T.; Venezia, A.M.; Loxton, C.M. The relationship between mass transport and oxide chemistry in oxidation of Ni3Al alloys. J. Mater. Res. 1992, 7, 1341–1349. [Google Scholar] [CrossRef]
  35. Pan, Y.C.; Chuang, T.H.; Yao, Y.D. Long-term oxidation behaviour of Ni3Al alloys with and without chromium additions. J. Mater. Sci. 1991, 26, 6097–6103. [Google Scholar] [CrossRef]
  36. Singh, H.; Prakash, S.; Puri, D. Some observations on the high temperature oxidation behaviour of plasma sprayed Ni3Al coatings. Mater. Sci. Eng. A 2007, 444, 242–250. [Google Scholar] [CrossRef]
  37. Meißner, T.M.; Oskay, C.; Bonk, A.; Gregoire, B.; Donchev, A.; Solimani, A.; Galetz, M.C. Improving the corrosion resistance of ferritic-martensitic steels at 600 ◦C in molten solar salt via diffusion coatings. Sol. Energy Mater. Sol. Cells 2021, 227, 111105. [Google Scholar] [CrossRef]
  38. Zahrani, E.M.; Cuevas-Arteaga, C.; Verhelst, D.; Alfantazi, A. High Temperature Corrosion of 625 Superalloy under Iron-Zinc Oxide/Lead Sulfate Salt Mixture. ECS Meet. Abstr. 2010, MA2010-01, 895. [Google Scholar] [CrossRef]
  39. Cuevas Arteaga, C. Corrosion study of HK-40m alloy exposed to molten sulfate/vanadate mixtures using the electrochemical noise technique. Corros. Sci. 2008, 50, 650–663. [Google Scholar] [CrossRef]
  40. Cuevas-Arteaga, C.; Uruchurtu, J.; Gonzalez, J.; Izquierdo-Montalvo, G.; Porcayo Calderon, J.; Cano-Castillo, U. Corrosion evaluation of Alloy 800 in sulfate/vanadate molten salts. Corrosion 2004, 60, 548–560. [Google Scholar] [CrossRef]
  41. Cuevas-Arteaga, C.; Porcayo-Calderon, J.; Izquierdo, G.; Martinez-Villafañe, A.; Gonzalez-Rodriguez, J.G. Study of hot corrosion of alloy 800 using linear polarisation resistance and weight loss measurement. Mater. Sci. Technol. 2001, 17, 880–885. [Google Scholar] [CrossRef]
  42. ASTM G102; Standard Practice for Calculation of Corrosion Rates and Related Information from Electrochemical Information. ASTM: West Conshohocken, PA, USA, 2023.
  43. Nunes, V.M.B.; Queirós, C.S.; Lourenço, M.J.V.; Santos, F.J.V.; Nieto de Castro, C.A. Molten salts as engineering fluids—A review Part I. Molten alkali nitrates. Appl. Energy 2016, 183, 603–611. [Google Scholar] [CrossRef]
  44. Bradshaw, R.W.; Meeker, D.E. High-temperature stability of ternary nitrate molten salts for solar thermal energy systems. Sol. Energy Mater. 1990, 21, 51–60. [Google Scholar] [CrossRef]
  45. Fernández, A.G.; Ushak, S.; Galleguillos, H.; Pérez, F.J. Development of new molten salts with LiNO3 and Ca(NO3)2 for energy storage in CSP plants. Appl. Energy 2014, 119, 131–140. [Google Scholar] [CrossRef]
  46. Carranza, R.M.; Alvarez, M.G. The effect of temperature on the passive film properties and pitting behaviour of a Fe-Cr-Ni alloy. Corros. Sci. 1996, 38, 909–925. [Google Scholar] [CrossRef]
  47. Guilemany, J.M.; Fernandez, J.; Espallargas, N.; Suegama, P.H.; Benedetti, A.V. Influence of spraying parameters on the electrochemical behaviour of HVOF thermally sprayed stainless steel coatings in 3.4% NaCl. Surf. Coat. Technol. 2006, 200, 3064–3072. [Google Scholar] [CrossRef]
  48. Romo, L.; Gonzalez-Rodriguez, J.G.; Porcayo-Calderon, J.; Guardian, R.; Salinas-Bravo, V.M. A study on the effect of Co, Cr and Ti on the corrosion of FE40AL intermetallic in molten NaCl–KCl mixture. Intermetallics 2015, 67, 156–165. [Google Scholar] [CrossRef]
  49. Szczygieł, B.; Kołodziej, M. Composite Ni/Al2O3 coatings and their corrosion resistance. Electrochim. Acta 2005, 50, 4188–4195. [Google Scholar] [CrossRef]
  50. Fattah-alhosseini, A.; Soltani, F.; Shirsalimi, F.; Ezadi, B.; Attarzadeh, N. The semiconducting properties of passive films formed on AISI 316 L and AISI 321 stainless steels: A test of the point defect model (PDM). Corros. Sci. 2011, 53, 3186–3192. [Google Scholar] [CrossRef]
  51. Hsu, C.H.; Mansfeld, F. Technical Note: Concerning the Conversion of the Constant Phase Element Parameter Y0 into a Capacitance. Corrosion 2001, 57, 747–748. [Google Scholar] [CrossRef]
  52. Brug, G.J.; van den Eeden, A.L.G.; Sluyters-Rehbach, M.; Sluyters, J.H. The analysis of electrode impedances complicated by the presence of a constant phase element. Electroanal. Chem. 1984, 176, 275–295. [Google Scholar] [CrossRef]
  53. Bell, S.; Steinberg, T.; Will, G. Corrosion mechanisms in molten salt thermal energy storage for concentrating solar power. Renew. Sustain. Energy Rev. 2019, 114, 109328. [Google Scholar] [CrossRef]
  54. Macdonald, J.R. Comparison and application of two methods for the least squares analysis of immittance data. Solid State Ion. 1992, 58, 97–107. [Google Scholar] [CrossRef]
  55. Sadkowski, A. CNLS fits and Kramers–Kronig validation of resonant EIS data. J. Electroanal. Chem. 2004, 573, 241–253. [Google Scholar] [CrossRef]
  56. Scarpioni, F.; Khalid, S.; Chukwu, R.; Pianta, N.; La Mantia, F.; Ruffo, R. Electrochemical Impedance Spectroscopy for Electrode Process Evaluation: Lithium Titanium Phosphate in Concentrated Aqueous Electrolyte. ChemElectroChem 2023, 10, e202201133. [Google Scholar] [CrossRef]
  57. Tortorelli, P.F.; Bishop, P.S.; DiStefano, J.R. Selection of Corrosion-Resistant Materials for Use in Molten Nitrate Salts; No. ORNL/TM-11162; Oak Ridge National Lab. (ORNL): Oak Ridge, TN, USA, 1989. [Google Scholar] [CrossRef]
  58. Kim, W.-B.; Choi, W.-S.; Lim, K.-S.; Cho, S.-H.; Lee, J.-H. High-Temperature Corrosion Behavior of Al-Coated Ni-Base Alloys in Lithium Molten Salt for Electroreduction. Coatings 2021, 11, 328. [Google Scholar] [CrossRef]
  59. Pettersson, C.; Pettersson, J.; Asteman, H. KCl-induced high temperature corrosion of the austenitic Fe-Cr-Ni alloys 304L and Sanicro 28 at 600 °C. Corros. Sci. 2006, 48, 1368–1378. [Google Scholar] [CrossRef]
  60. Barin, I.; Platzki, G. Thermochemical Data of Pure Substances, 3rd ed.; VCH: New York, NY, USA, 1995; ISBN 3-527-28745-0. [Google Scholar]
Figure 1. Mass change in the Ni3Al intermetallic with respect to time and temperature: (a) removal of soluble surface layers and (b) removal of corrosion products by chemical dissolution.
Metals 15 00764 g001
Figure 2. Corrosion rate of the intermetallic Ni3Al at different temperatures.
Metals 15 00764 g002
Figure 3. Surface appearance of Ni3Al after 1000 h of immersion at (a) 300 °C, (b) 400 °C, and (c) 500 °C.
Metals 15 00764 g003
Figure 4. Element mapping of the alloy surface immersed in molten salt for 1000 h at 300 °C.
Metals 15 00764 g004
Figure 5. Element mapping of the alloy surface immersed in molten salt for 1000 h at 400 °C.
Metals 15 00764 g005
Figure 6. Element mapping of the alloy surface immersed in molten salt for 1000 h at 500 °C.
Metals 15 00764 g006
Figure 7. Cross-sectional appearance of the Ni3Al intermetallic immersed in molten salt after 1000 h at (a) 300 °C, (b) 400 °C, and (c) 500 °C.
Metals 15 00764 g007
Figure 8. Potentiodynamic polarization curves of the intermetallic alloy at 300, 400, and 500 °C (scan rate 1 mV/s).
Metals 15 00764 g008
Figure 9. Variation in OCP values for Ni3Al in Solar Salt at 300, 400, and 500 °C for 100 h.
Metals 15 00764 g009
Figure 10. Variation in Rp values of Ni3Al in molten salts at 300, 400, and 500 °C.
Metals 15 00764 g010
Figure 11. Evolution of the impedance spectra (Nyquist and Bode diagrams) for Ni3Al immersed in molten salt for 100 h at 300 °C.
Metals 15 00764 g011
Figure 12. Evolution of the impedance spectra (Nyquist and Bode diagrams) for Ni3Al immersed in molten salt for 100 h at 400 °C.
Metals 15 00764 g012
Figure 13. Evolution of the impedance spectra (Nyquist and Bode diagrams) for Ni3Al immersed in molten salt for 100 h at 500 °C.
Metals 15 00764 g013
Figure 14. Equivalent electrical circuits.
Metals 15 00764 g014
Figure 15. Variation in (a) Rct and (b) Rox values.
Metals 15 00764 g015
Figure 16. Variation in (a) Cdl and (b) Cox values.
Metals 15 00764 g016
Table 1. Electrochemical parameters (5% error).
TemperatureEcorr
(mV)
icorr
(mA/cm2)
βa
(mV/Dec)
βc
(mV/Dec)
CR
(μm/Year)
300 °C290.001402132030.0105
400 °C680.003543062860.0355
500 °C970.014174853550.1428
Table 3. Free energy of formation (kJ/mol). Adapted from Ref. [60].
TemperatureNiOAl2O3NaAlO2NaNO3
300 °C−186.342−1495.763−1008.431−274.889
400 °C−177.582−1464.543−986.191−245.049
500 °C−168.822−1433.323−963.951−216.810
Table 2. Electrochemical parameters obtained from EIS spectra (χ2 = 0.001).
Temperature 300 °C
Time
(h)
Rs
(Ω·cm2)
Rss
(Ω·cm2)
Yss
−1·cm−2·sn)
nssRox
(Ω·cm2)
Yox
−1·cm−2·sn)
noxRct
(Ω·cm2)
Ydl
−1·cm−2·sn)
ndlCox
(F·cm−2)
Cdl
(F·cm−2)
02.1511.230.000501410.60133700.0004810.9260560.000523240.880.0005676810.000612356
253.397.0960.000222060.7993010.0004140.92466120.000186290.730.0004684240.000423254
503.376.6230.000292330.7780470.0004170.92515890.000217940.810.0004654920.000381354
753.515.9270.000261140.7971120.0004050.92506290.000230310.810.0004443410.000406408
1002.156.0120.000316220.7782560.0004130.92511880.000249750.880.000461590.000353521
Temperature 400 °C
Time
(h)
Rs
(Ω·cm2)
Rss
(Ω·cm2)
Yss
−1·cm−2·sn)
nssRox
(Ω·cm2)
Yox
−1·cm−2·sn)
noxRct
(Ω·cm2)
Ydl
1·cm−2·sn)
ndlCox
(F·cm−2)
Cdl
(F·cm−2)
03.8310.430.000120990.7717390.0003610.8513180.00234840.700.0003318620.003811244
254.405.4510.000230160.7864230.0004480.85273840.00040710.680.0005377620.00129236
504.453.230.000114660.8666270.000440.86270480.000337490.720.0005240320.000793804
754.533.1930.00009950.8870930.0004320.86271500.000322230.750.0005192410.000669377
1004.473.3460.00010410.8773010.0004310.86249140.000327320.770.0005202250.000607913
Temperature 500 °C
Time
(h)
Rs
(Ω·cm2)
Rss
(Ω·cm2)
Yss
(Ω−1·cm−2·sn)
nssRox
(Ω·cm2)
Yox
1·cm2·sn)
noxRct
(Ω·cm2)
Ydl
−1·cm−2·sn)
ndlCox
(F·cm−2)
Cdl
(F·cm−2)
02.09------2.200.00102260.6137050.0002960.930.0003933040.000298051
252.85------16550.00130960.7923240.0040460.600.0016075680.017880809
502.82------18750.00156730.7816310.0111290.600.0021055840.076127497
752.82------19200.0015710.78831.60.0173930.780.0021275870.037563319
1002.74------568.60.00225980.84947.10.0316910.780.0023716780.081726827
Disclaimer/Publisher’s Note: The statements, opinions and data contained in all publications are solely those of the individual author(s) and contributor(s) and not of MDPI and/or the editor(s). MDPI and/or the editor(s) disclaim responsibility for any injury to people or property resulting from any ideas, methods, instructions or products referred to in the content.

