Article

Machine Learning-Driven Prediction of Glass-Forming Ability in Fe-Based Bulk Metallic Glasses Using Thermophysical Features and Data Augmentation

by
Renato Dario Bashualdo Bobadilla
,
Marcello Baricco
and
Mauro Palumbo
*
Dipartimento di Chimica, NIS and INFM, Università di Torino, Via Giuria 7/9, 10125 Torino, Italy
*
Author to whom correspondence should be addressed.
Metals 2025, 15(7), 763; https://doi.org/10.3390/met15070763
Submission received: 1 May 2025 / Revised: 30 June 2025 / Accepted: 30 June 2025 / Published: 7 July 2025
(This article belongs to the Section Computation and Simulation on Metals)

Abstract

The identification of suitable alloy compositions for the formation of bulk metallic glasses (BMGs) is a key challenge in materials science. In this study, we developed machine learning (ML) models to predict the critical casting diameter ( D m a x ) of Fe-based BMGs, enabling rapid assessment of glass-forming ability (GFA) using composition-based and calculated thermophysical features. Three datasets were constructed: one based on alloy molar fractions, one using thermophysical quantities calculated via the CALPHAD method, and another utilizing Magpie-derived features. The performance of various ML models was evaluated, including support vector machines (SVM), XGBoost, and ensemble methods. Models trained on thermophysical features outperformed those using only molar fractions, with XGBoost and SVM models achieving test R 2 scores of up to 0.63 and 0.60, respectively. Magpie features yielded similar results but required a larger feature set. To enhance predictive accuracy, we explored data augmentation using the PADRE method and a modified version (PADRE-2). While PADRE-2 demonstrated slight improvements and reduced data redundancy, the overall performance gains were limited. The best-performing model was an ensemble combining SVM and XGBoost models trained on thermophysical and Magpie features, achieving an R 2 score of 0.69 and MAE of 0.69, comparable to published results obtained from larger datasets. However, predictions for high D m a x values remain challenging, highlighting the need for further refinement. This study underscores the potential of leveraging thermophysical features and advanced ML techniques for GFA prediction and the design of new Fe-based BMGs.

1. Introduction

Amorphous metal alloys, also known as metallic glasses, were first discovered in 1960 [1]. Unlike other amorphous materials (e.g., inorganic or polymeric materials), they are inherently more challenging to produce because metals tend to crystallize more readily upon solidification compared to other material types [2]. Achieving an amorphous structure typically requires extremely high cooling rates, which often restricts their formation to thin films, such as ribbons. Only a limited number of alloy compositions can be processed into relatively thick (bulk) shapes, known as Bulk Metallic Glasses (BMGs), making them suitable for a wider range of structural applications. BMGs possess a unique combination of properties, including a very high elastic strain limit due to the absence of grain boundaries [3], as well as excellent resistance to corrosion and wear [4], making them highly attractive for various industrial applications.
One of the main challenges in producing BMGs is identifying suitable compositions that allow for their formation through casting. This requires estimating the so-called glass-forming-ability (GFA) of an alloy. GFA refers to an alloy’s ability to vitrify, or transition into an amorphous state, and its capacity to suppress the nucleation of crystals during the cooling process [5]. In previous decades, different criteria to rationalize the GFA and to predict which alloy compositions are more favorable in this respect were proposed. For example, the confusion theory proposed in 1993 by Greer et al. [6] or “the three empirical rules” proposed by Inoue [7]. Other approaches are based on the thermodynamic stability of the liquid alloy and the crystalline phases which can be formed during solidification [8]. In other cases, researchers have found criteria based on atomic packing [9]. From these and other studies, it is evident that the GFA depends on several factors, such as chemical composition of alloy, mutual interactions among constituent elements, atomic size of elements, thermodynamic stability of the involved phases, production method and more.
It is also important to note that there is no universally accepted definition of GFA. The concept has evolved from a qualitative and somewhat vague notion of ease of vitrification to more quantitative definitions. These include measures such as the maximum diameter (critical casting diameter or D m a x ) of the rod (or cone) that can be cast in the amorphous form, the minimum cooling rate (critical cooling rate) necessary to obtain a metallic glass, etc.
Recently, several attempts have been made at predicting properties, classifying new sets of materials and creating new amorphous alloys using machine learning (ML) and data-driven approaches, as reported in recent review papers [10,11]. These approaches have shown promising results in analyzing high-dimensionality compositional spaces and identifying correlations between structure–composition–property–transformation relations [5]. A pioneering work published by Ward et al. [12] first applied several machine-learning-based models to bulk metallic glasses (BMG). Building a large dataset consisting of more than 8000 metallic glass experiments (including both ribbons and bulk samples) and using composition-derived properties generated with a software framework (Magpie), they were able to make different types of predictions, such as the result of rapid solidification would be a metallic glass or not and whether it would be a ribbon or a bulk (an ML classification task). Furthermore, their trained ML models were able to estimate the critical casting diameter and the supercooled liquid range [12]. Other attempts have been reported in the literature, differing in the use of various ML models or predictors (features). These approaches can be broadly categorized into two types: a priori and a posteriori. In the a posteriori approach, the features used in machine learning models include quantities such as the glass transition temperature ( T g ) and onset crystallization temperature ( T x ). These quantities are derived from measurements taken on amorphous alloys that have already been synthesized and are typically employed when experimental data is available. They are useful to evidence correlations between the GFA and these features, but they have limited applicability for screening and developing new suitable alloy composition [13,14,15,16]. In contrast, a priori approaches rely on data that is available prior to the synthesis of the material, such as the chemical composition of the alloy. This enable predictions to be made without direct experimental data. An example of an a priori approach is the work by Mastropietro et al. [17], in which the authors developed a predictive model for Fe-based BMGs using atomic chemical concentration as the only predictor variables. Other works [18,19,20] use similar a priori approaches that allows the construction of partial alloy system diagrams, which can be used to evaluate the critical casting diameter ( D m a x ) for future compositions, providing a valuable tool for guiding the development of new alloys. In a recent publication [21], machine learning has been applied to exploit phase diagrams (and the underlying thermodynamics) to automate the search for deep eutectic invariant points, which are indicative of alloys with high glass-forming ability (GFA). Prior to the widespread adoption of ML, several methods for estimating GFA relied on thermodynamic quantities, often calculated using the CALPHAD approach [8].
In this work, we develop an a priori approach for predicting the critical casting diameter ( D m a x ) of Fe-based metallic glasses. As predictors, we used the alloy molar compositions and features generated with Magpie software, as already done in earlier works, but we also considered some thermophysical quantities calculated using the CALPHAD approach [22] and specifically the ThermoCalc software and their commercial database for high entropy alloys (TCHEA) [23]. To the best of our knowledge this has not been done in previous work. CALPHAD is a powerful computational approach used to model and predict phase equilibria and thermodynamic properties in multi-component systems. It is widely applied in materials design, alloy development, and process optimization to understand how composition, temperature, and other conditions influence material behavior. Leveraging this methodology is expected to provide predictors of higher quality with respect to other empirical equations used in some earlier ML works [10]. A significant challenge in training ML models in materials science, particularly for BMGs, is the limited availability of data required for models to perform effectively and generalize well. To address this, we employed PAirwise Difference REgression (PADRE), a meta-procedure developed by Michael Tynes et al. [24]. PADRE enhances the performance of ML regressors by leveraging pairwise differences in the data to augment the dataset and improve model training. Data augmentation can also mitigate the effects of data imbalance in the dataset used in this work and the PADRE procedure has not previously been applied to ML models for GFA prediction. The approach developed here enables the prediction of D m a x values for new alloys using only input data based on compositions and properties that can be easily calculated with ThermoCalc or other similar software. This allows for rapid estimation of the GFA of Fe-based metallic alloys.

2. Methodology

2.1. Datasets

Data for training ML models (alloy compositions and corresponding D m a x values) were collected from publications that appeared in the literature. These data were assembled in a first dataset (DS1), in which the ML features are simply the molar fractions of the alloy and the target quantity is D m a x . We collected data only on Fe-based BMGs in order to construct a chemically homogeneous dataset. Furthermore, we included compositions from binary to multicomponent alloy systems, ensuring reliable predictions of D m a x even for complex compositions.
A second dataset (DS2) was assembled for the same alloys in DS1, but the features in this case are thermophysical quantities obtained from CALPHAD-based calculations using the Thermo-calc software with the TCHEA3 thermodynamic database for high entropy alloys [23,25]. To select these quantities, we leveraged previous literature findings [8,9]. Examples of such quantities are the liquidus ( T l i q ) and solidus ( T s o l ) temperatures, the enthalpy of mixing of the alloy ( H m i x ), the enthalpy ( H m e l t ) and entropy ( S m e l t ) of melting of the alloy, etc. Some of these quantities have been utilized in the literature as features and estimated as weighted averages derived from pure elements. It is worth noting that the reliability of these quantities, when calculated using CALPHAD-based databases, is expected to be higher. This is because they are determined through thermodynamic equilibrium calculations, which are based on a multicomponent modeling of the Gibbs free energy for each phase of the analyzed system. Moreover, we remark that some quantities, such as the driving force for nucleation of a crystalline phase or the T 0 temperature between phases, can only be calculated using the CALPHAD method as they require the knowledge of the Gibbs energy of each phase of the system as a function of composition and temperature (see [8] and refs. therein). We note that the CALPHAD thermodynamic quantities used in DS2 are calculated under the assumption of thermodynamic equilibrium, whereas the formation of BMGs by rapid solidification is inherently a non-equilibrium process. Despite this limitation, thermodynamics-based approaches have proven valuable, as non-equilibrium quantities are significantly more difficult to estimate [8]. A final note on uncertainties in CALPHAD-calculated quantities is worth mentioning. The accuracy of CALPHAD results depends on several factors, including the thermodynamic models used, the amount and quality of experimental data, and the first-principles results on which the assessment is based. Different thermodynamic databases may vary in accuracy, and estimating the associated uncertainties is not straightforward. Most current software tools and commercial databases do not offer a way to determine confidence intervals for the calculated quantities. Although a recently developed tool, ESPEI (https://espei.org/ (accessed on 26 April 2025, [26]), has the potential to estimate uncertainties during database development using Bayesian inference, it is still under active development and has not yet seen widespread adoption. An additional subset of features, such as the configurational entropy ( S c o n f ), the average atomic radius ( r a v e r a g e ), and more, was obtained by applying well-known equations. The choice of features to include was done by leveraging previous research on GFA criteria and earlier ML studies. All thermophysical quantities and symbols are defined in details in the Supplementary Materials.
A third dataset (DS3) was assembled for the same alloys in DS1, but using the Magpie framework to calculate 145 materials features from the alloys compositions [27]. The features in Magpie are obtained from fundamental properties (ground state volume, melting temperature, etc.) of the pure elements in the alloy and its composition. All datasets and additional information on the dataset construction can be found in the Supplementary Materials.
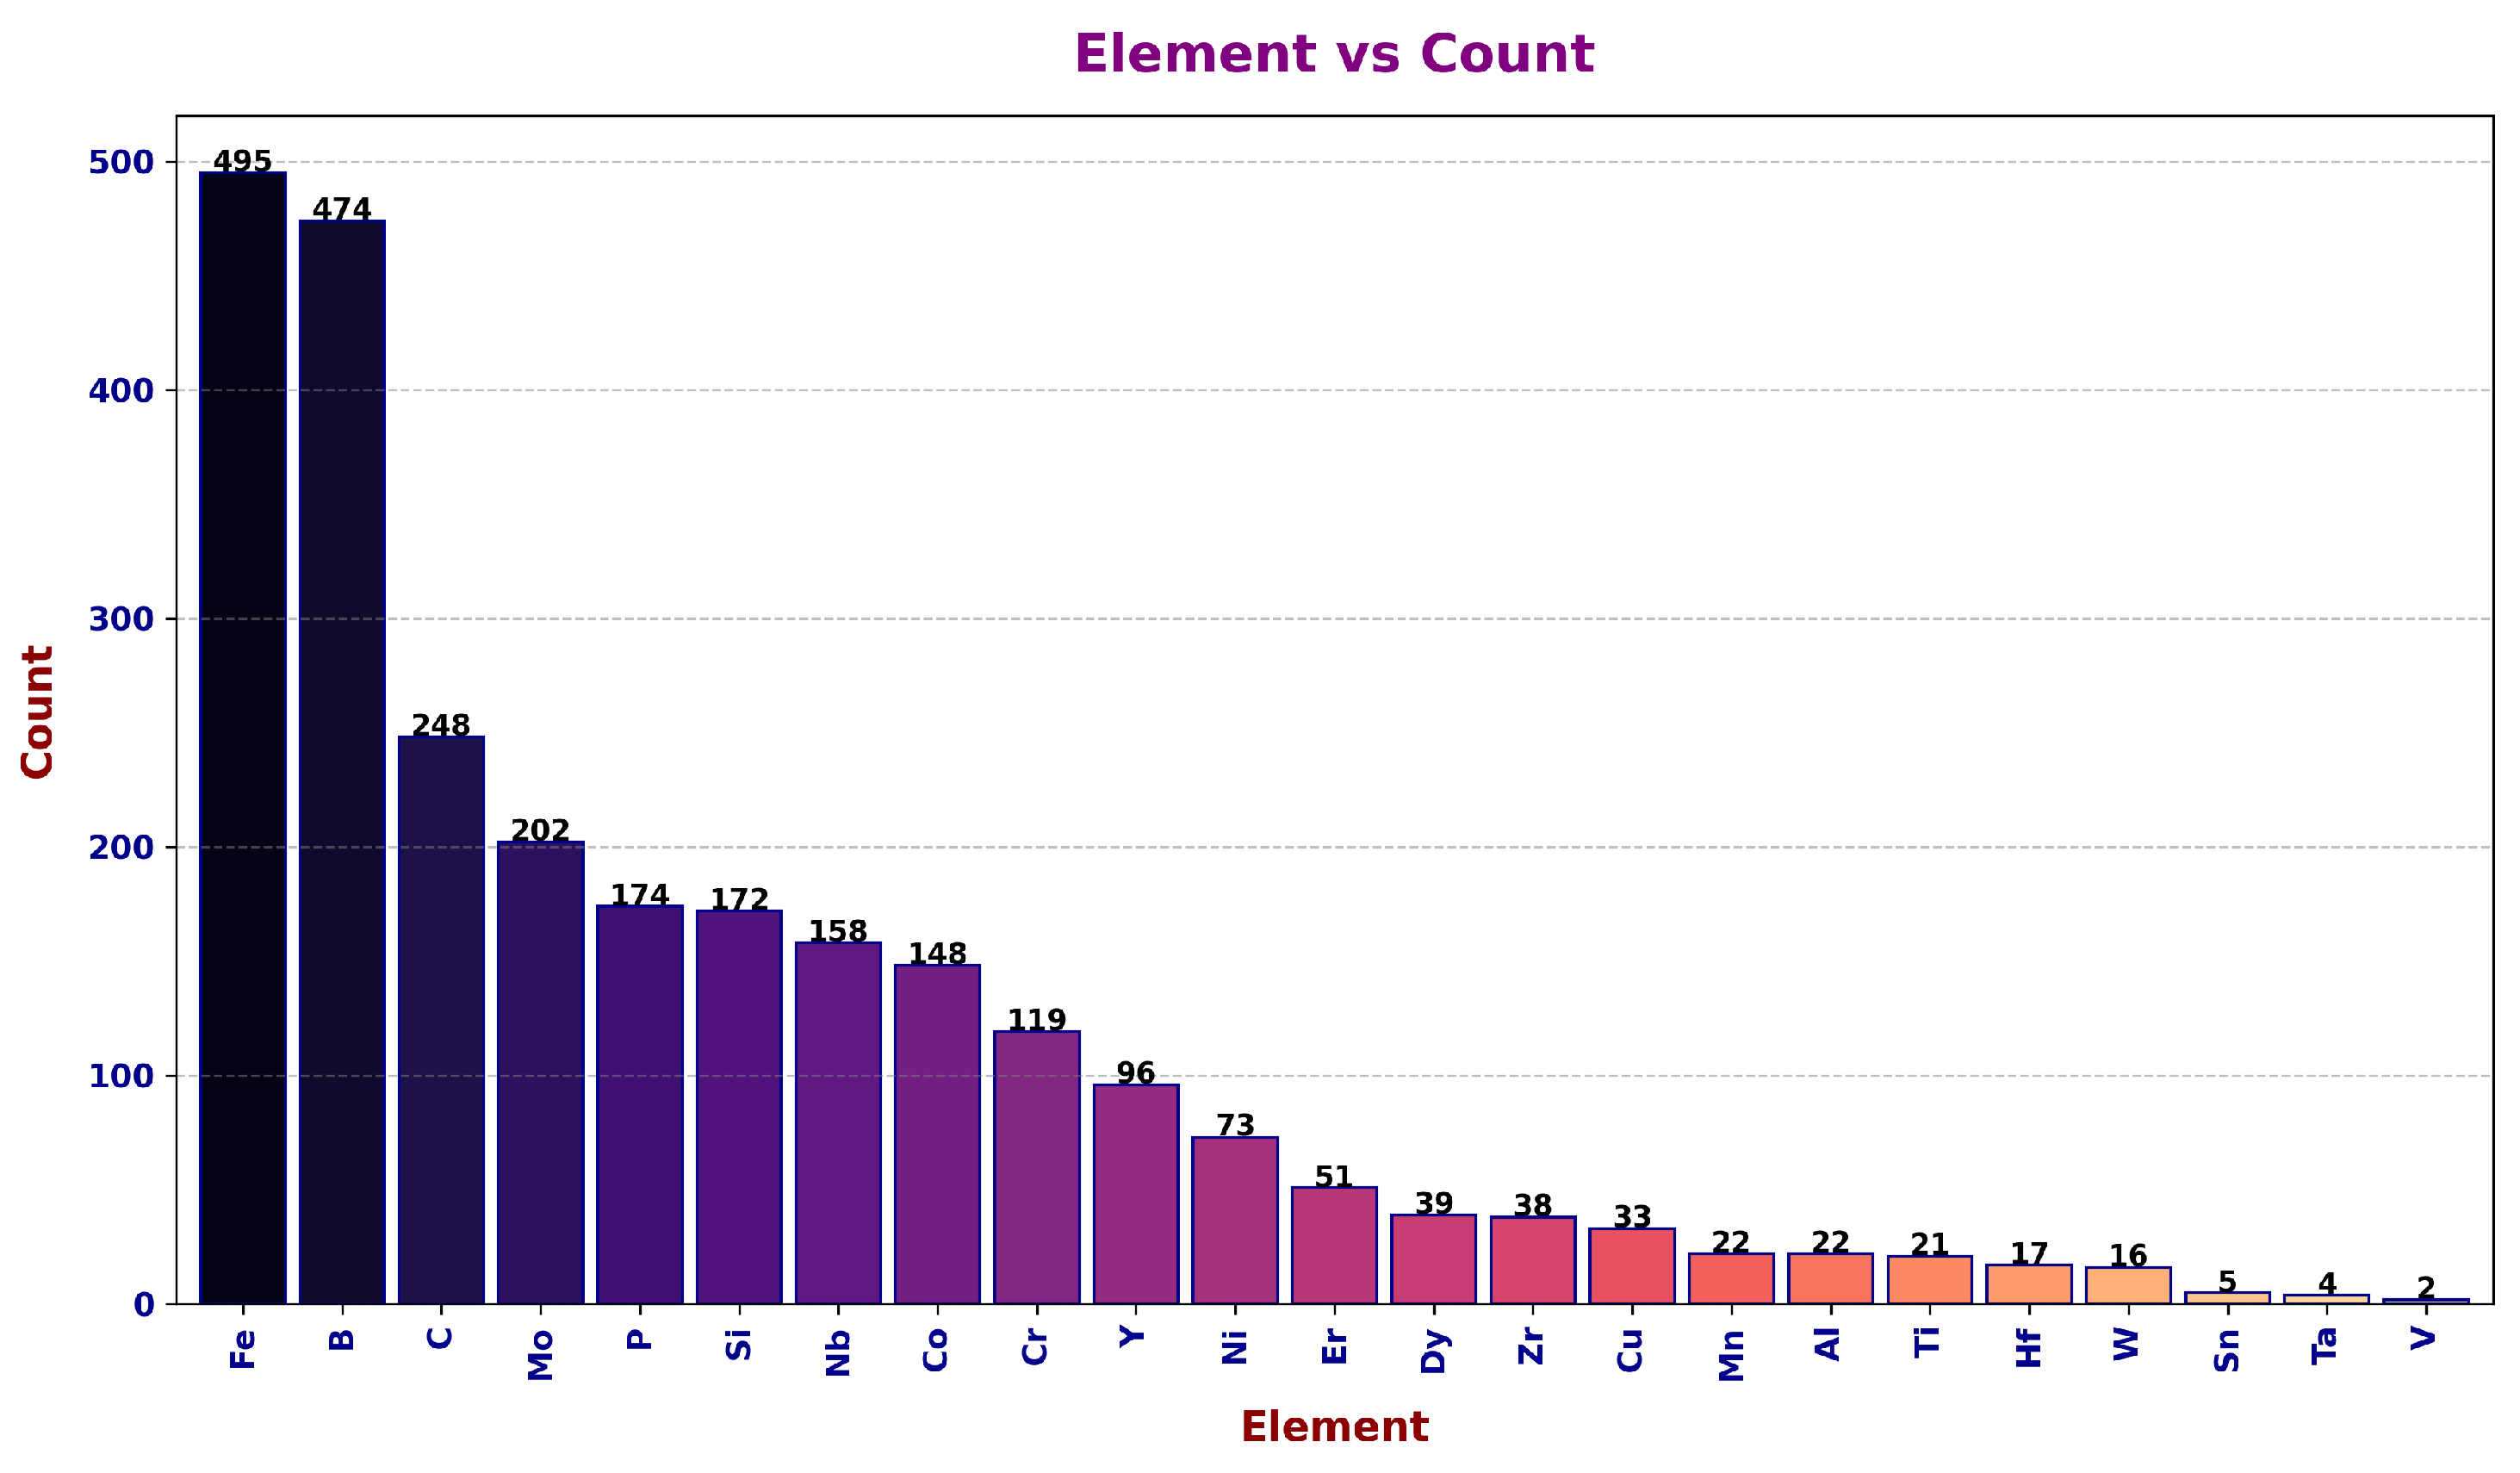
As can be seen from the Figure 1, the distribution of D m a x values (495 in total) in the datasets is unbalanced, with a predominance of values in the [ 1 , 3 ) mm range (296 BMGs), accounting for approximately 60 % of all Fe-based alloys. The collected values range from a minimum value of 0.055 mm in D m a x for alloy F e 83 C 1 B 8 S i 4 P 4 to a maximum value of 16 mm for alloy F e 41 C o 7 C r 15 M o 14 C 15 B 6 Y 2 . Furthermore, as shown in Figure 2 the alloys in our datasets include 23 different elements (including Fe), with the presence of boron in nearly all alloys and carbon in approximately half. This is unsurprising, as both elements—particularly boron—are well-known for their glass-forming ability in Fe-based alloys.

2.2. Machine Learning

Several machine learning models (or algorithms) were utilized and evaluated to identify the most suitable one for our datasets. At first we tested a simple Multiple Linear Regression model (MLR) [28] to look for linear relationships and obtain an easily interpretable model for predicting the D m a x values. In addition, we tested Random Forest (RF), Random Forest with Gradient Boosting (RFGB), and Support Vector Machines (SVM), using the implementations provided by the scikit-learn library [29]. We also tested the XGBoost tree algorithm from the XGBoost v. 2.1.4 library [30]. These models are widely recognized for their strong performance with medium-sized datasets. Furthermore, we applied the ensemble method, a powerful machine learning approach that combines multiple simple “building block” models to construct a single, potentially more effective model [28].
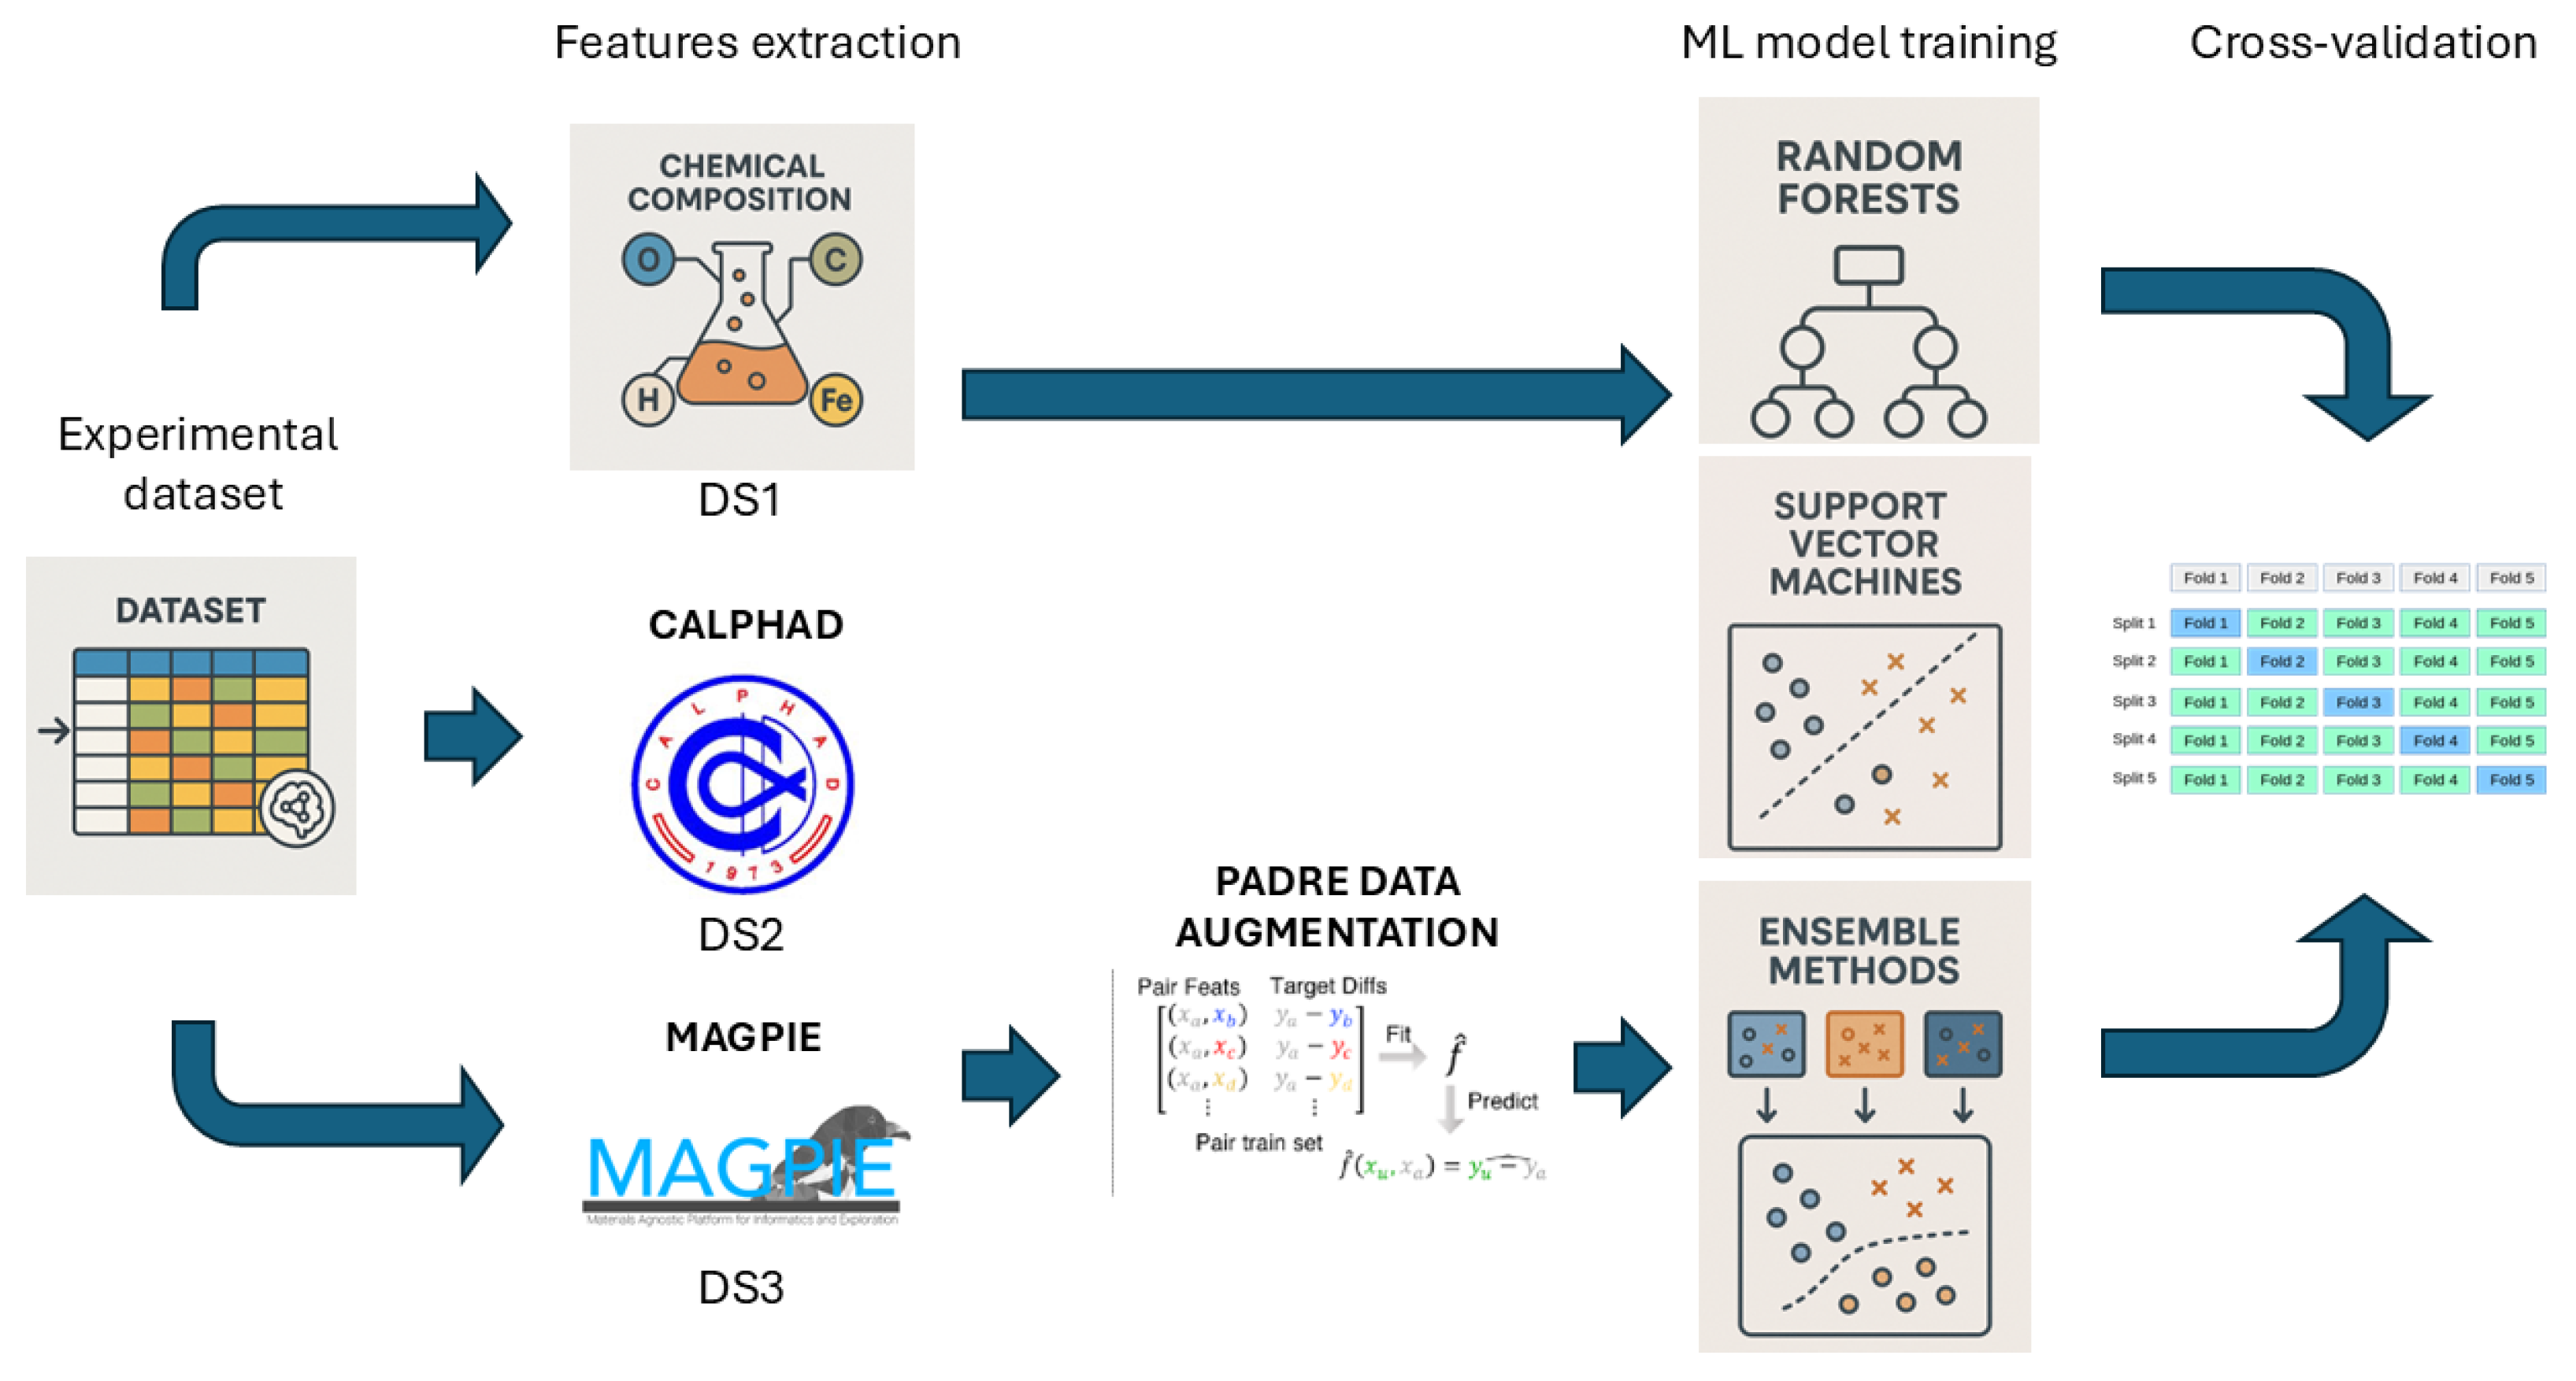
Before training, each dataset was converted into a matrix using the Python v. 3.8 library “Pandas” and randomly shuffled to reduce the risk of grouping similar data. For each machine learning algorithm, the optimal hyperparameter values were determined to maximize forecasting accuracy. This optimization was performed using the “GridSearchCV” function from the scikit-learn library, applied over a predefined grid of hyperparameter values. Each combination of hyperparameters was evaluated by training the algorithm and calculating the corresponding loss function. To ensure robust error statistics, 10-fold cross-validation was employed during each training iteration. This involved splitting the data into different train/test configurations, allowing the model to be evaluated 10 times. Cross-validation was also used to assess the final generalization error, using the optimal hyperparameters identified during the grid search. To ensure the reproducibility of the results, we used a random seed (81) in cross-validation. For both training and final model evaluation, the Mean Absolute Error (MAE) and the coefficient of determination (R2) were used as loss functions. To analyze and quantify the importance of features in our Fe-based datasets, we conducted a feature importance analysis using SHAP (SHapley Additive exPlanations) values. Introduced by Lundberg and Lee in 2017 [31], SHAP has gained widespread popularity in recent years due to its model-agnostic nature, allowing it to interpret a wide range of machine learning models, from simple linear regression to complex models like SVR, XGBoost, and Artificial Neural Networks. Finally, we tested the PADRE methodology [24] for data augmentation on our datasets and a modified version of PADRE-2 proposed in this work. A schematic representation of our ML pipeline is shown in Figure 3. More details are provided in the Supplementary Materials.

3. Results and Discussion

3.1. ML Models on Composition and Thermophysical Datasets

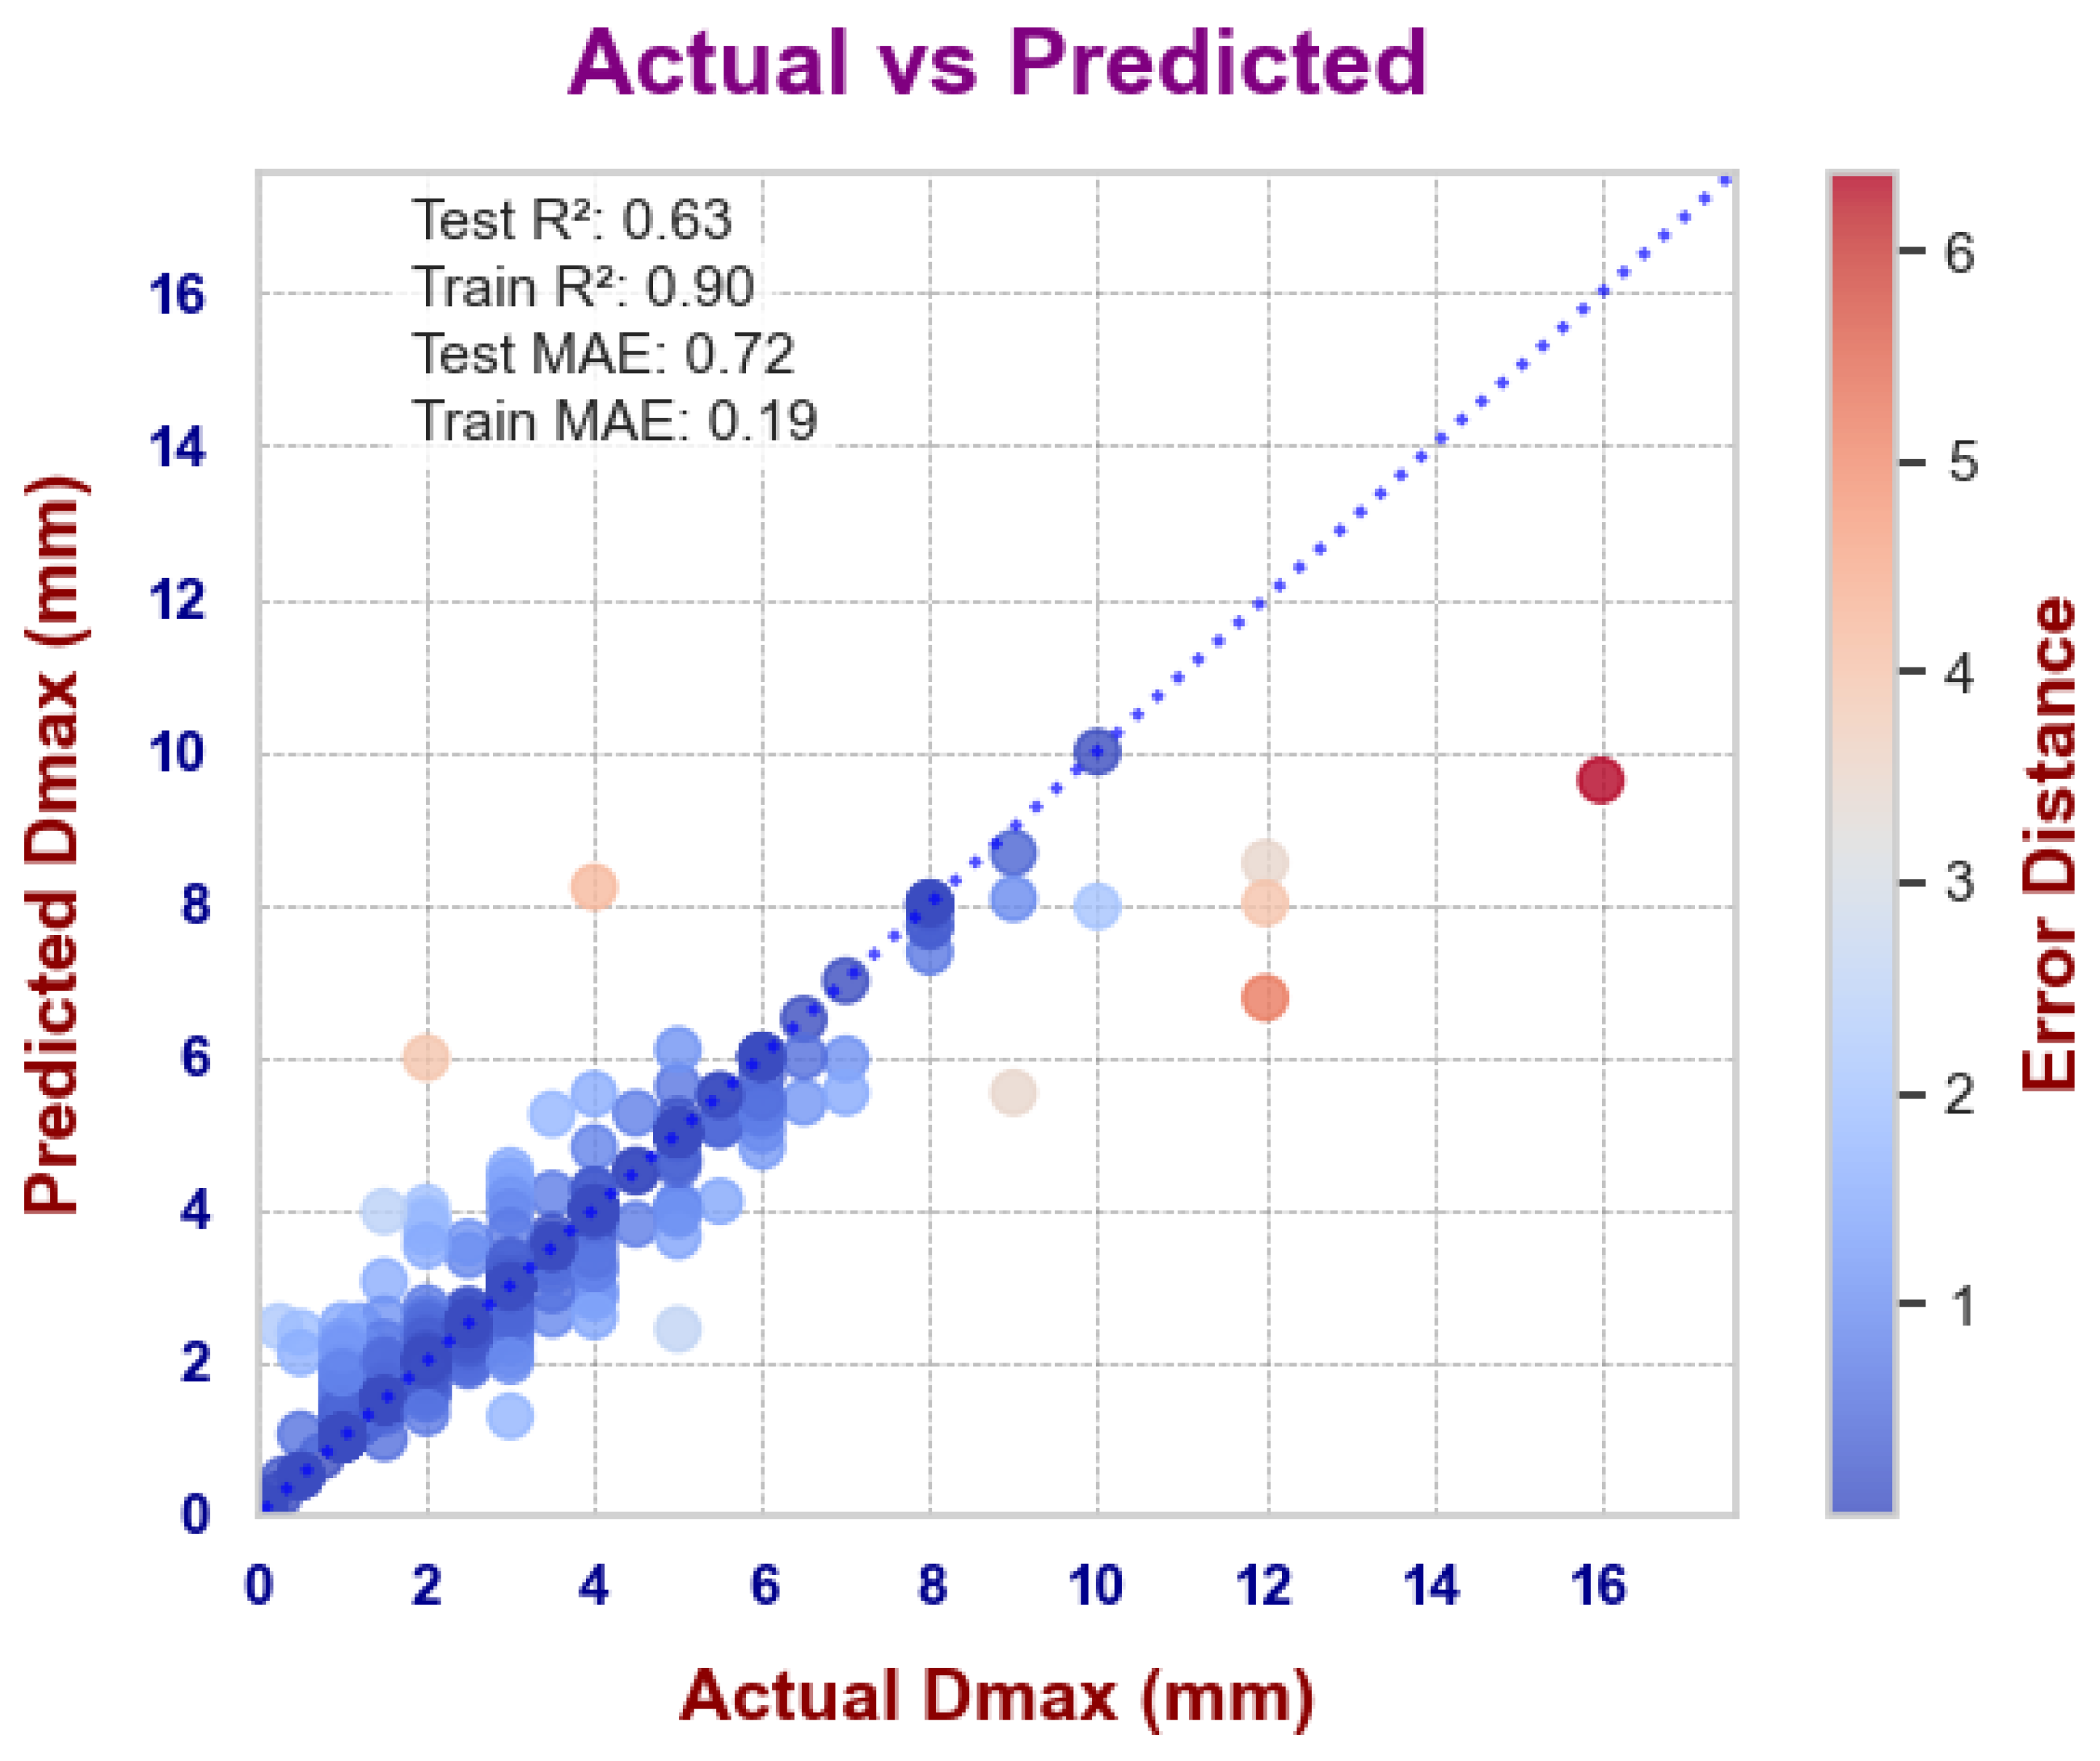
Table 1 summarizes the results obtained from training various models on the two datasets: DS1 (using molar fractions as features) and DS2 (using thermophysical parameters as features). The results clearly show that the MLR model exhibits poor predictive power, indicating the presence of strong non-linear correlations between the D m a x values and both compositional and thermophysical features. In contrast, both the SVM and XGBoost models demonstrate superior performance, achieving R 2 values of 0.54 on the DS1 dataset and R 2 values of 0.63 and 0.60 for SVM and XGBoost, respectively, on the DS2 dataset. These results are consistent with earlier published works [17,18,27]. Higher R 2 values have been reported using a posteriori approaches that include features such as T g or T x [15,16], although these methods limit the predictive power of the models, as discussed in the introduction. Interestingly, Ward et al. [27] achieved a similar R 2 value (after excluding ribbons from their dataset), despite utilizing a larger dataset that included non-Fe-based alloys. It is worth noting that all models perform significantly better when trained on DS2. This is not entirely surprising, as DS2 uses thermophysical quantities as features, leveraging prior knowledge about correlations between GFA and relevant physical properties. While it is reasonable to expect that a sufficiently robust ML model could eventually learn the complex correlations between alloy compositions and D m a x values, these correlations are likely more intricate and less explicit than those involving thermophysical properties. Consequently, a larger dataset may be required for the model to effectively learn these relationships.
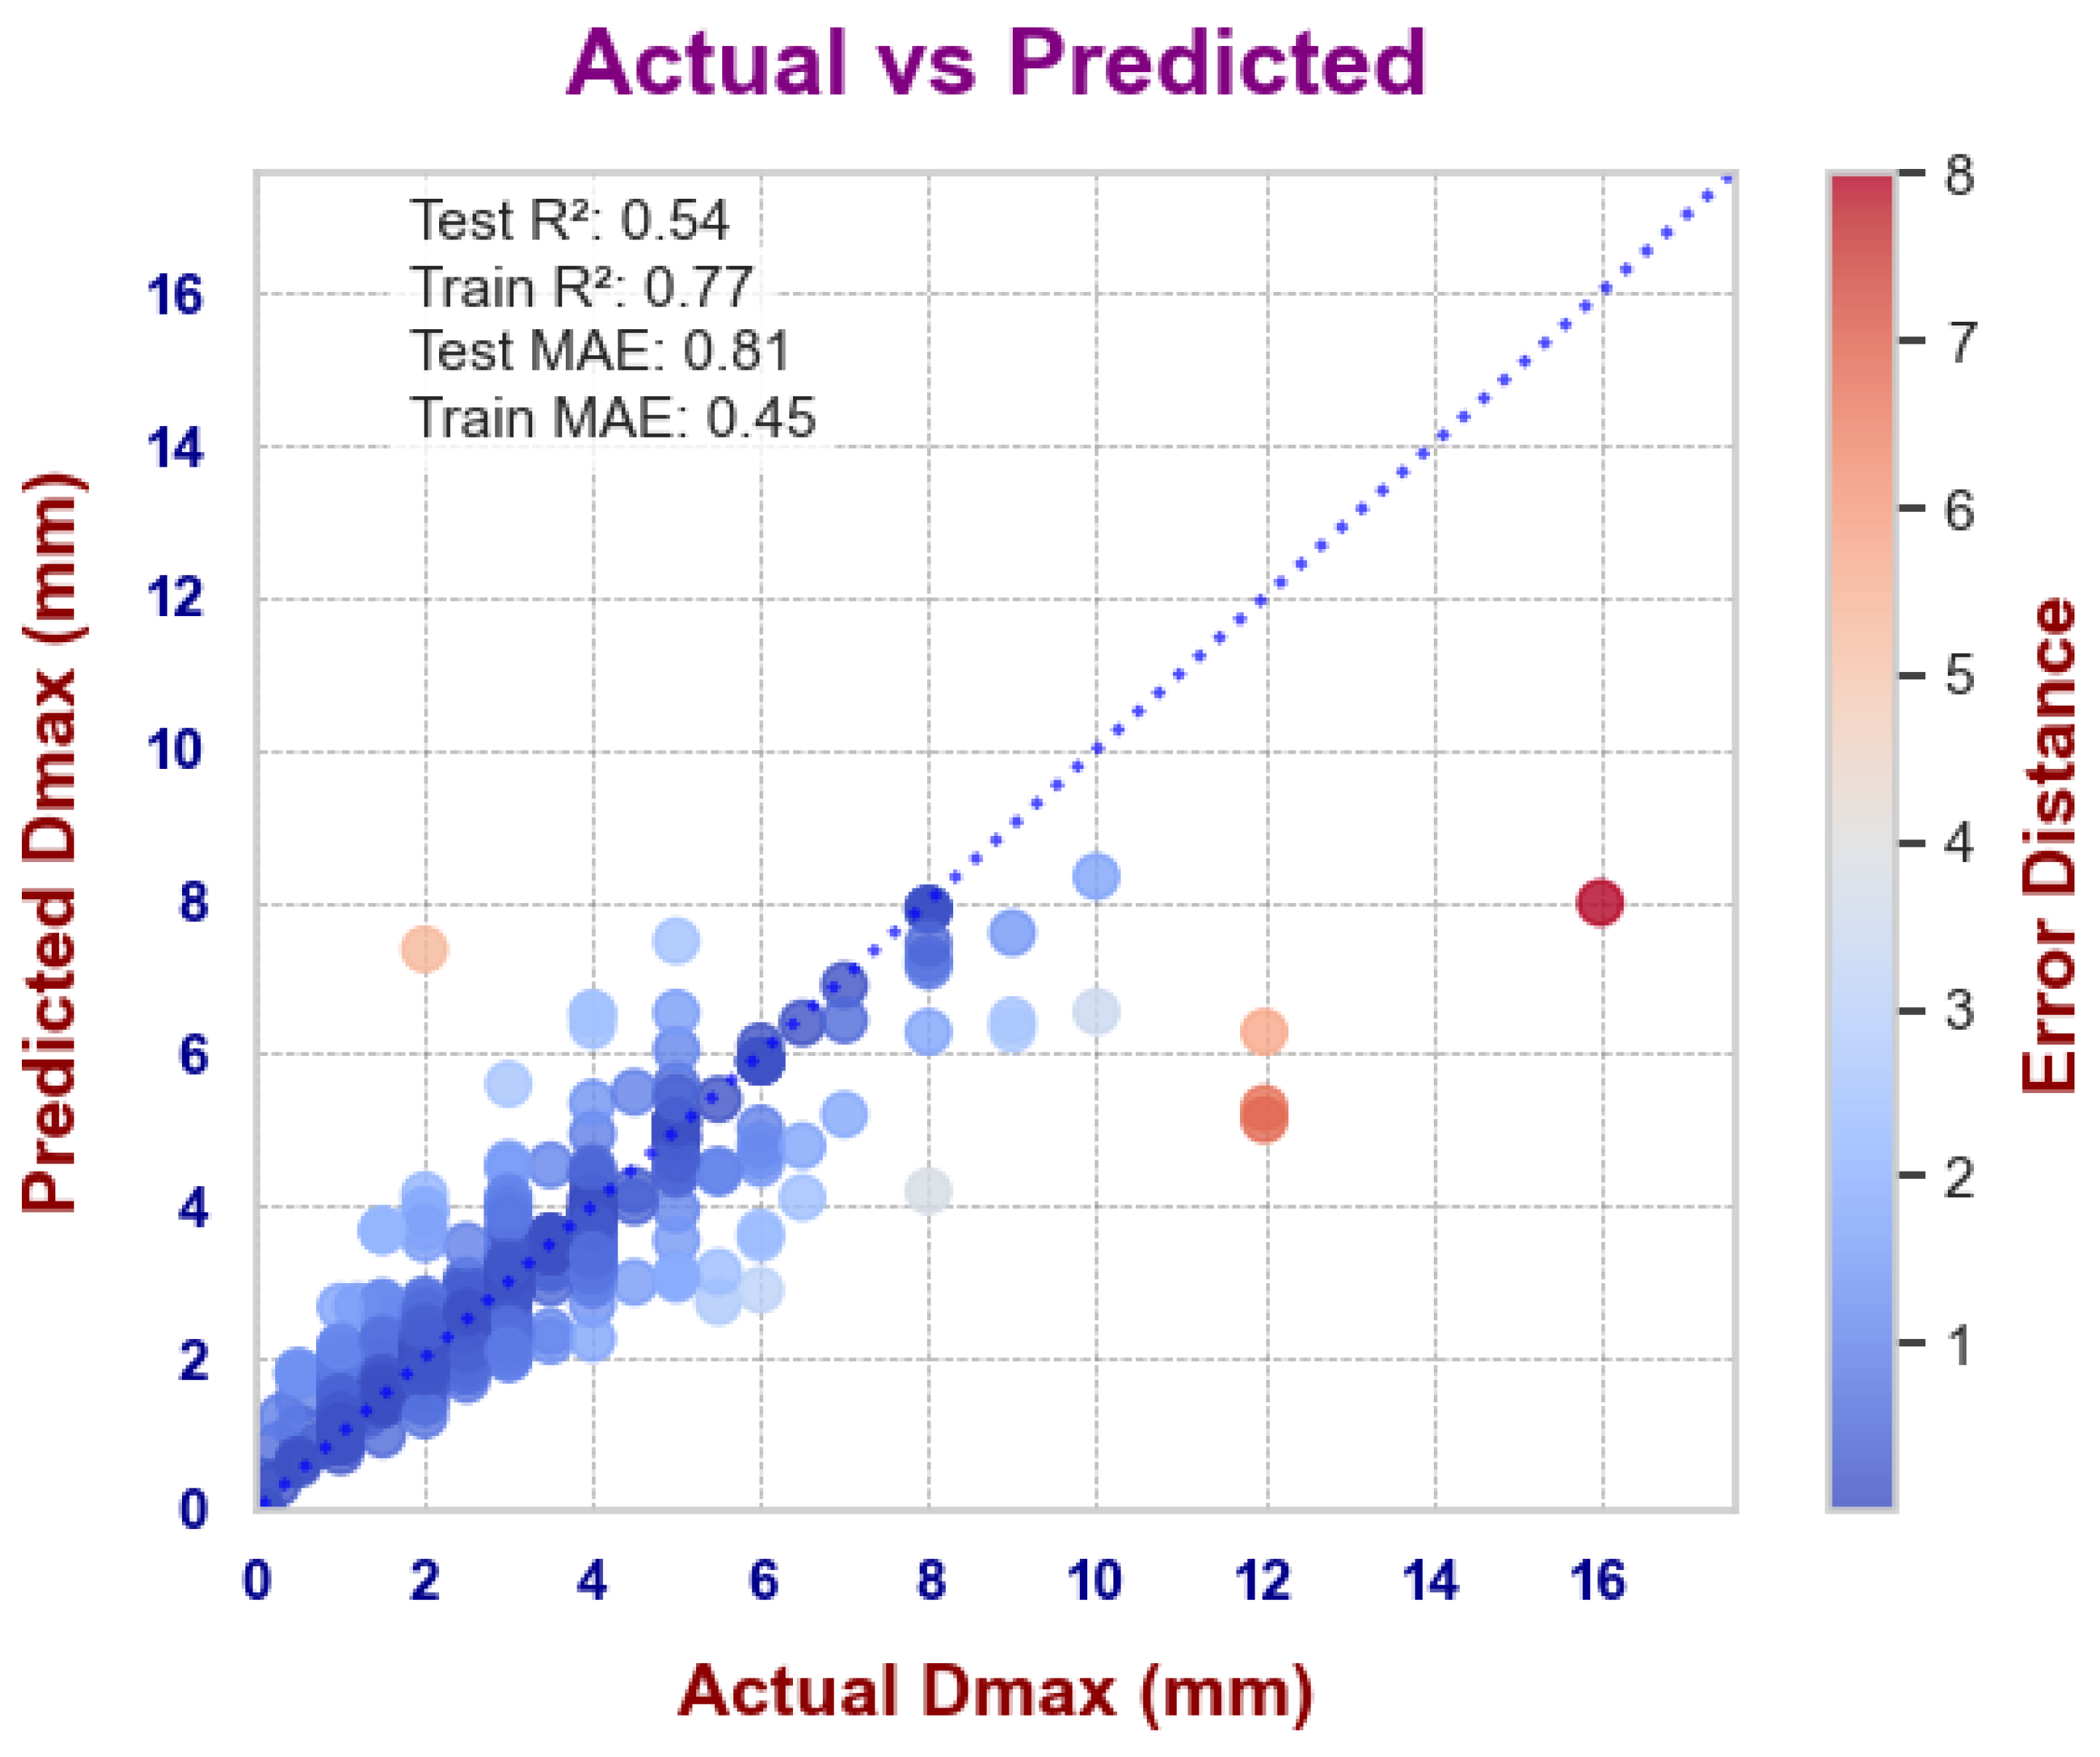
The results obtained with the best model (SVR) for datasets DS1 and DS2 are shown in Figure 4 and Figure 5, respectively. For compositional features, while both SVM and XGBoost models achieve the same R 2 value on the test set (0.54), SVM demonstrates a slightly better MAE (0.81 compared to 0.85). More importantly, XGBoost shows signs of overfitting, with a high R 2 value (0.99) and a low MAE (0.17) on the training set. It is also worth noting that the predictions of both SVM models on DS1 and DS2 significantly deviate from actual D m a x values at higher ranges. This is due to the imbalance in the data distribution, as only a few data points are available in the high D m a x range (see Figure 1). Unfortunately, it is difficult to produce amorphous metallic alloys with large D m a x values and improve on this point.

3.2. ML Models on Magpie Dataset

The choice of thermophysical quantities as features in DS2 obviously does not include all possibilities, and alternative suggestions have been made in the literature. An extensive set of features can in fact be obtained using the Magpie software, as we did to obtain the dataset DS3. In order to compare the predictive capabilities of these features with those in the other datasets, we trained XGBoost and SVM models on DS3 and the results are reported in Table 2. For further comparison, we also trained RF and GBRF from the Scikit-learn library.
We can note that, in this case, tree-based methods perform slightly better than SVM, with XGBoost as the best among all. However, despite using a large number of features here (145 as generated by Magpie), the ML models do not perform significantly better than ML models trained on DS2 with only 16 features. This suggests that several Magpie features may be redundant in this case. This is further supported by the SHAP analysis (see Section 3.3), which shows that the importance of Magpie features is quite uneven.

3.3. Features Importance

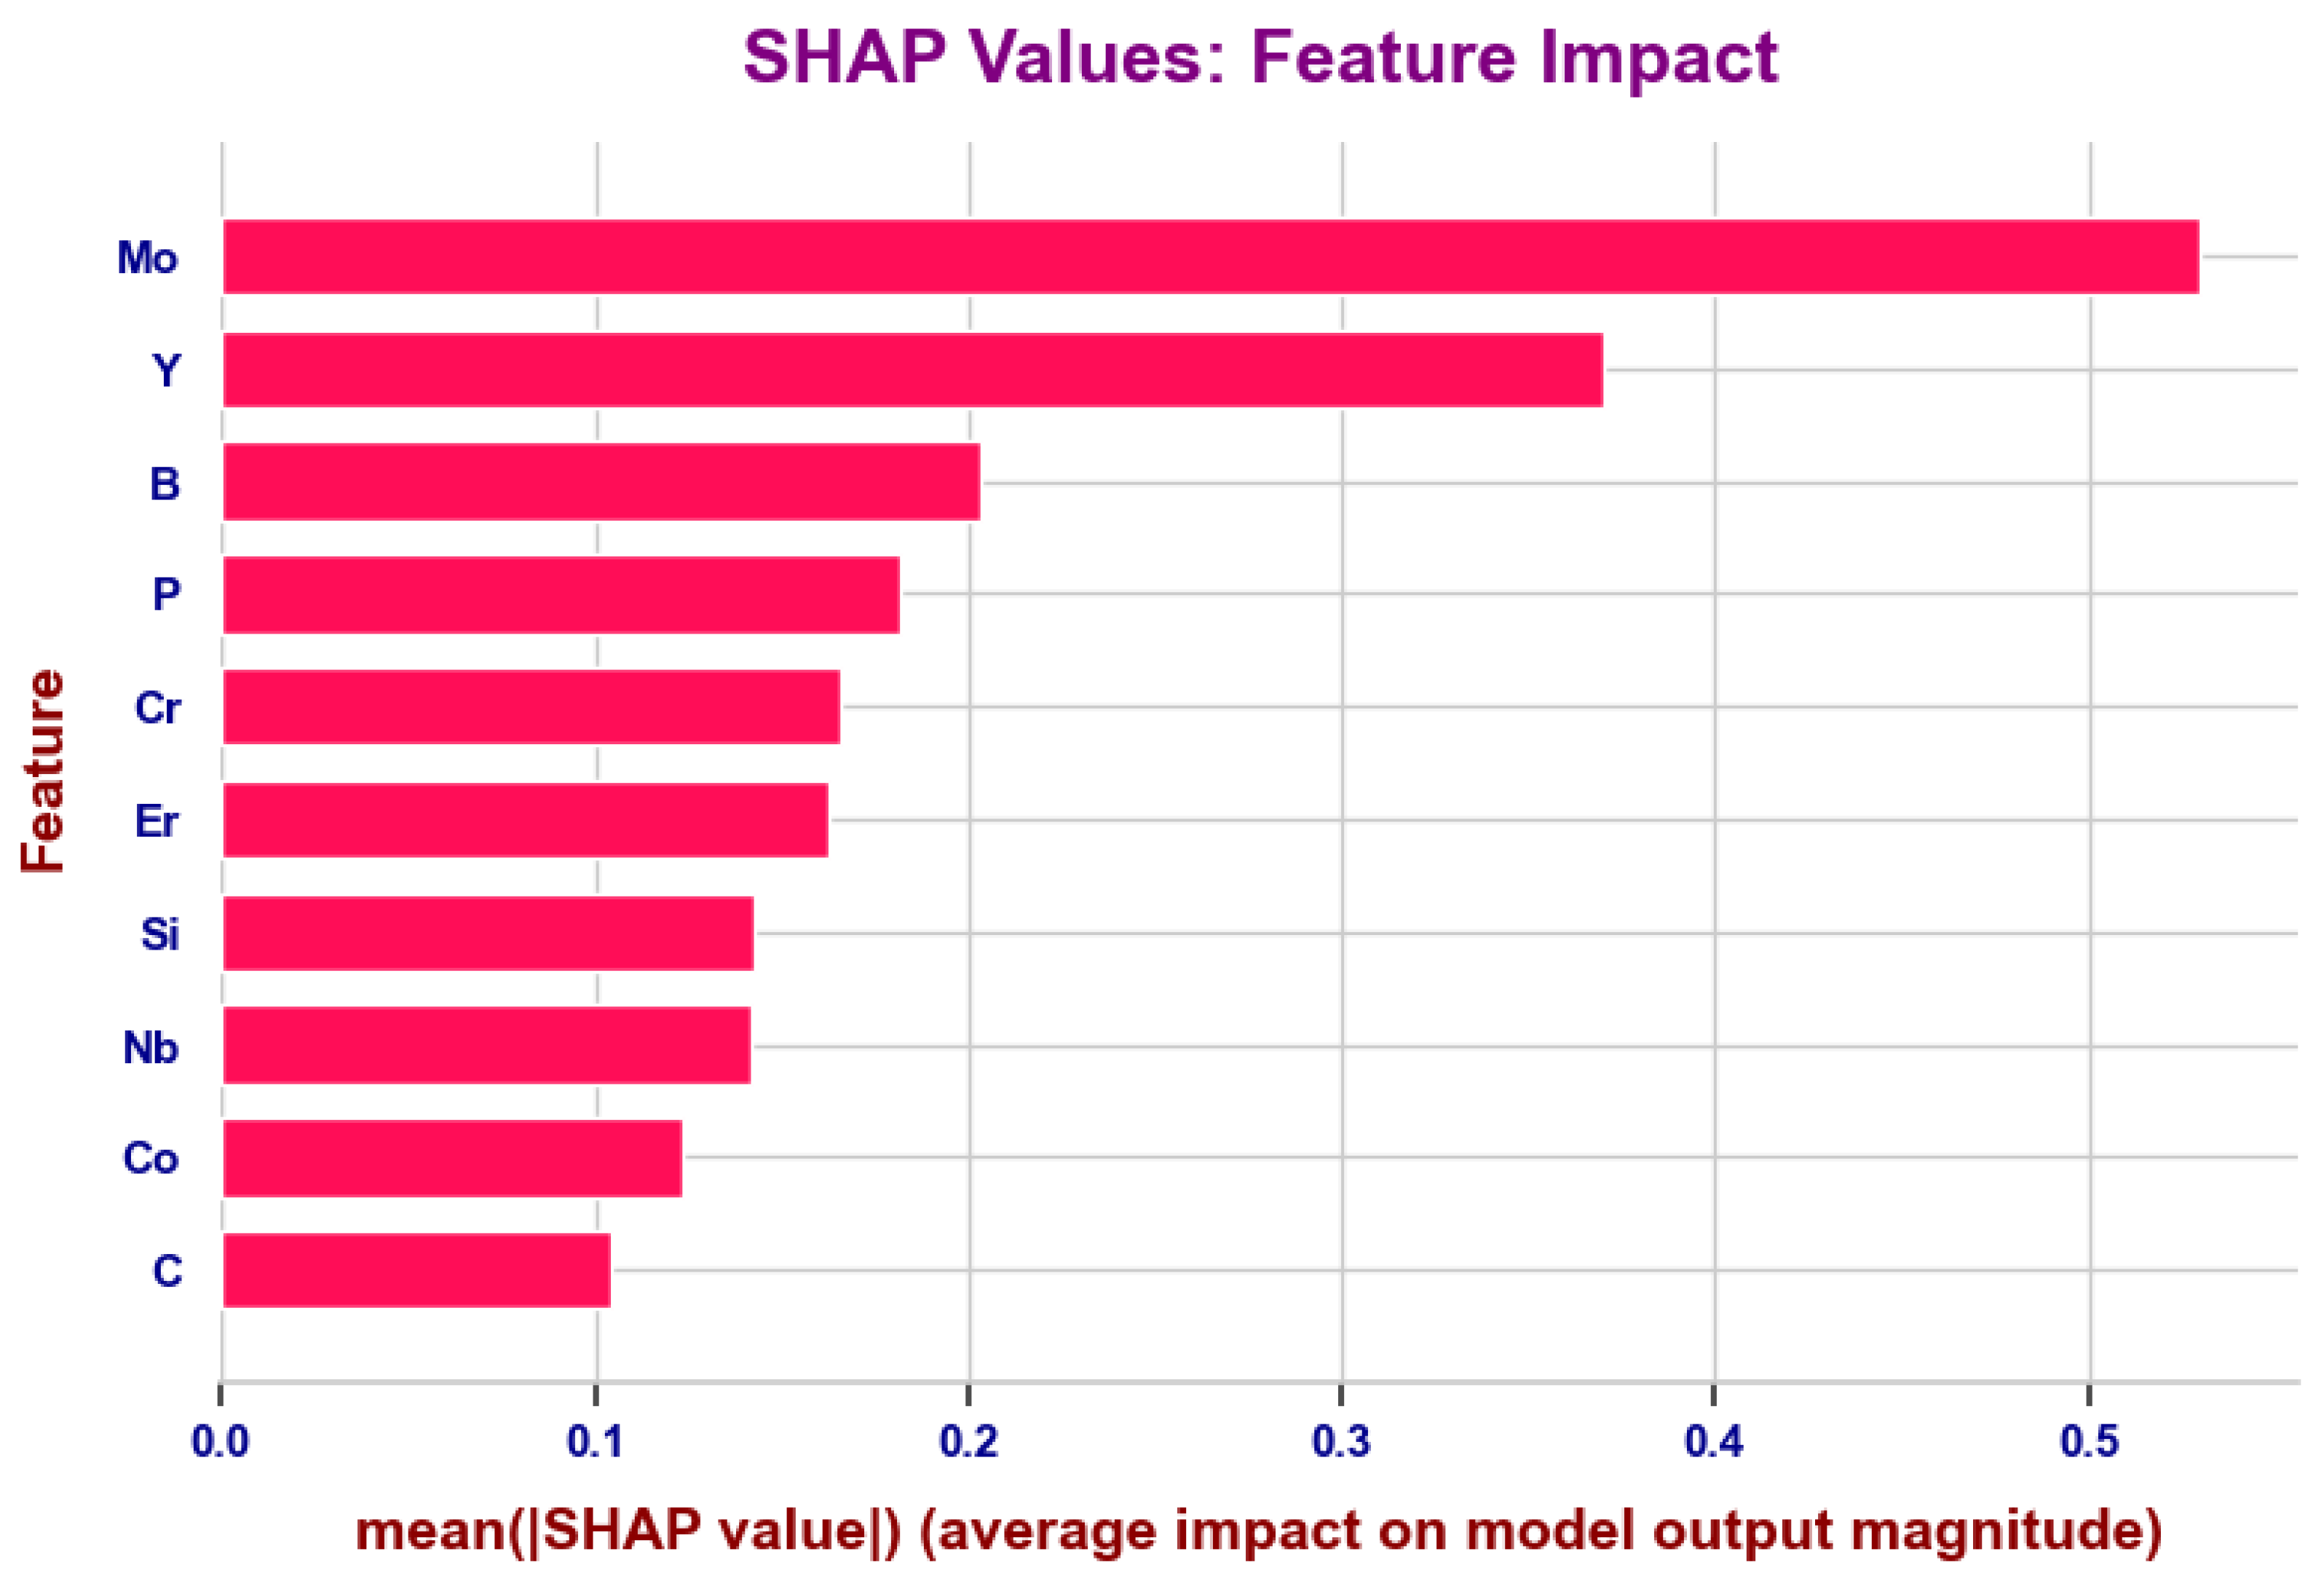
It is important to interpret the results of ML models through feature importance, which provides an “explainable” insight into the inner workings of the models and helps to understand the correlations between the features and the target properties. In the case of the MLR model, the relative importance of each feature is directly derived from the optimal values of the coefficients in the linear model (as reported in the Supplementary Materials). However, due to the poor performance of the model (Table 1), these coefficients cannot be considered reliable indicators of feature importance. Using SHAP methodology, the results of feature importance for the SVM model trained on dataset DS1 are reported in Figure 6.
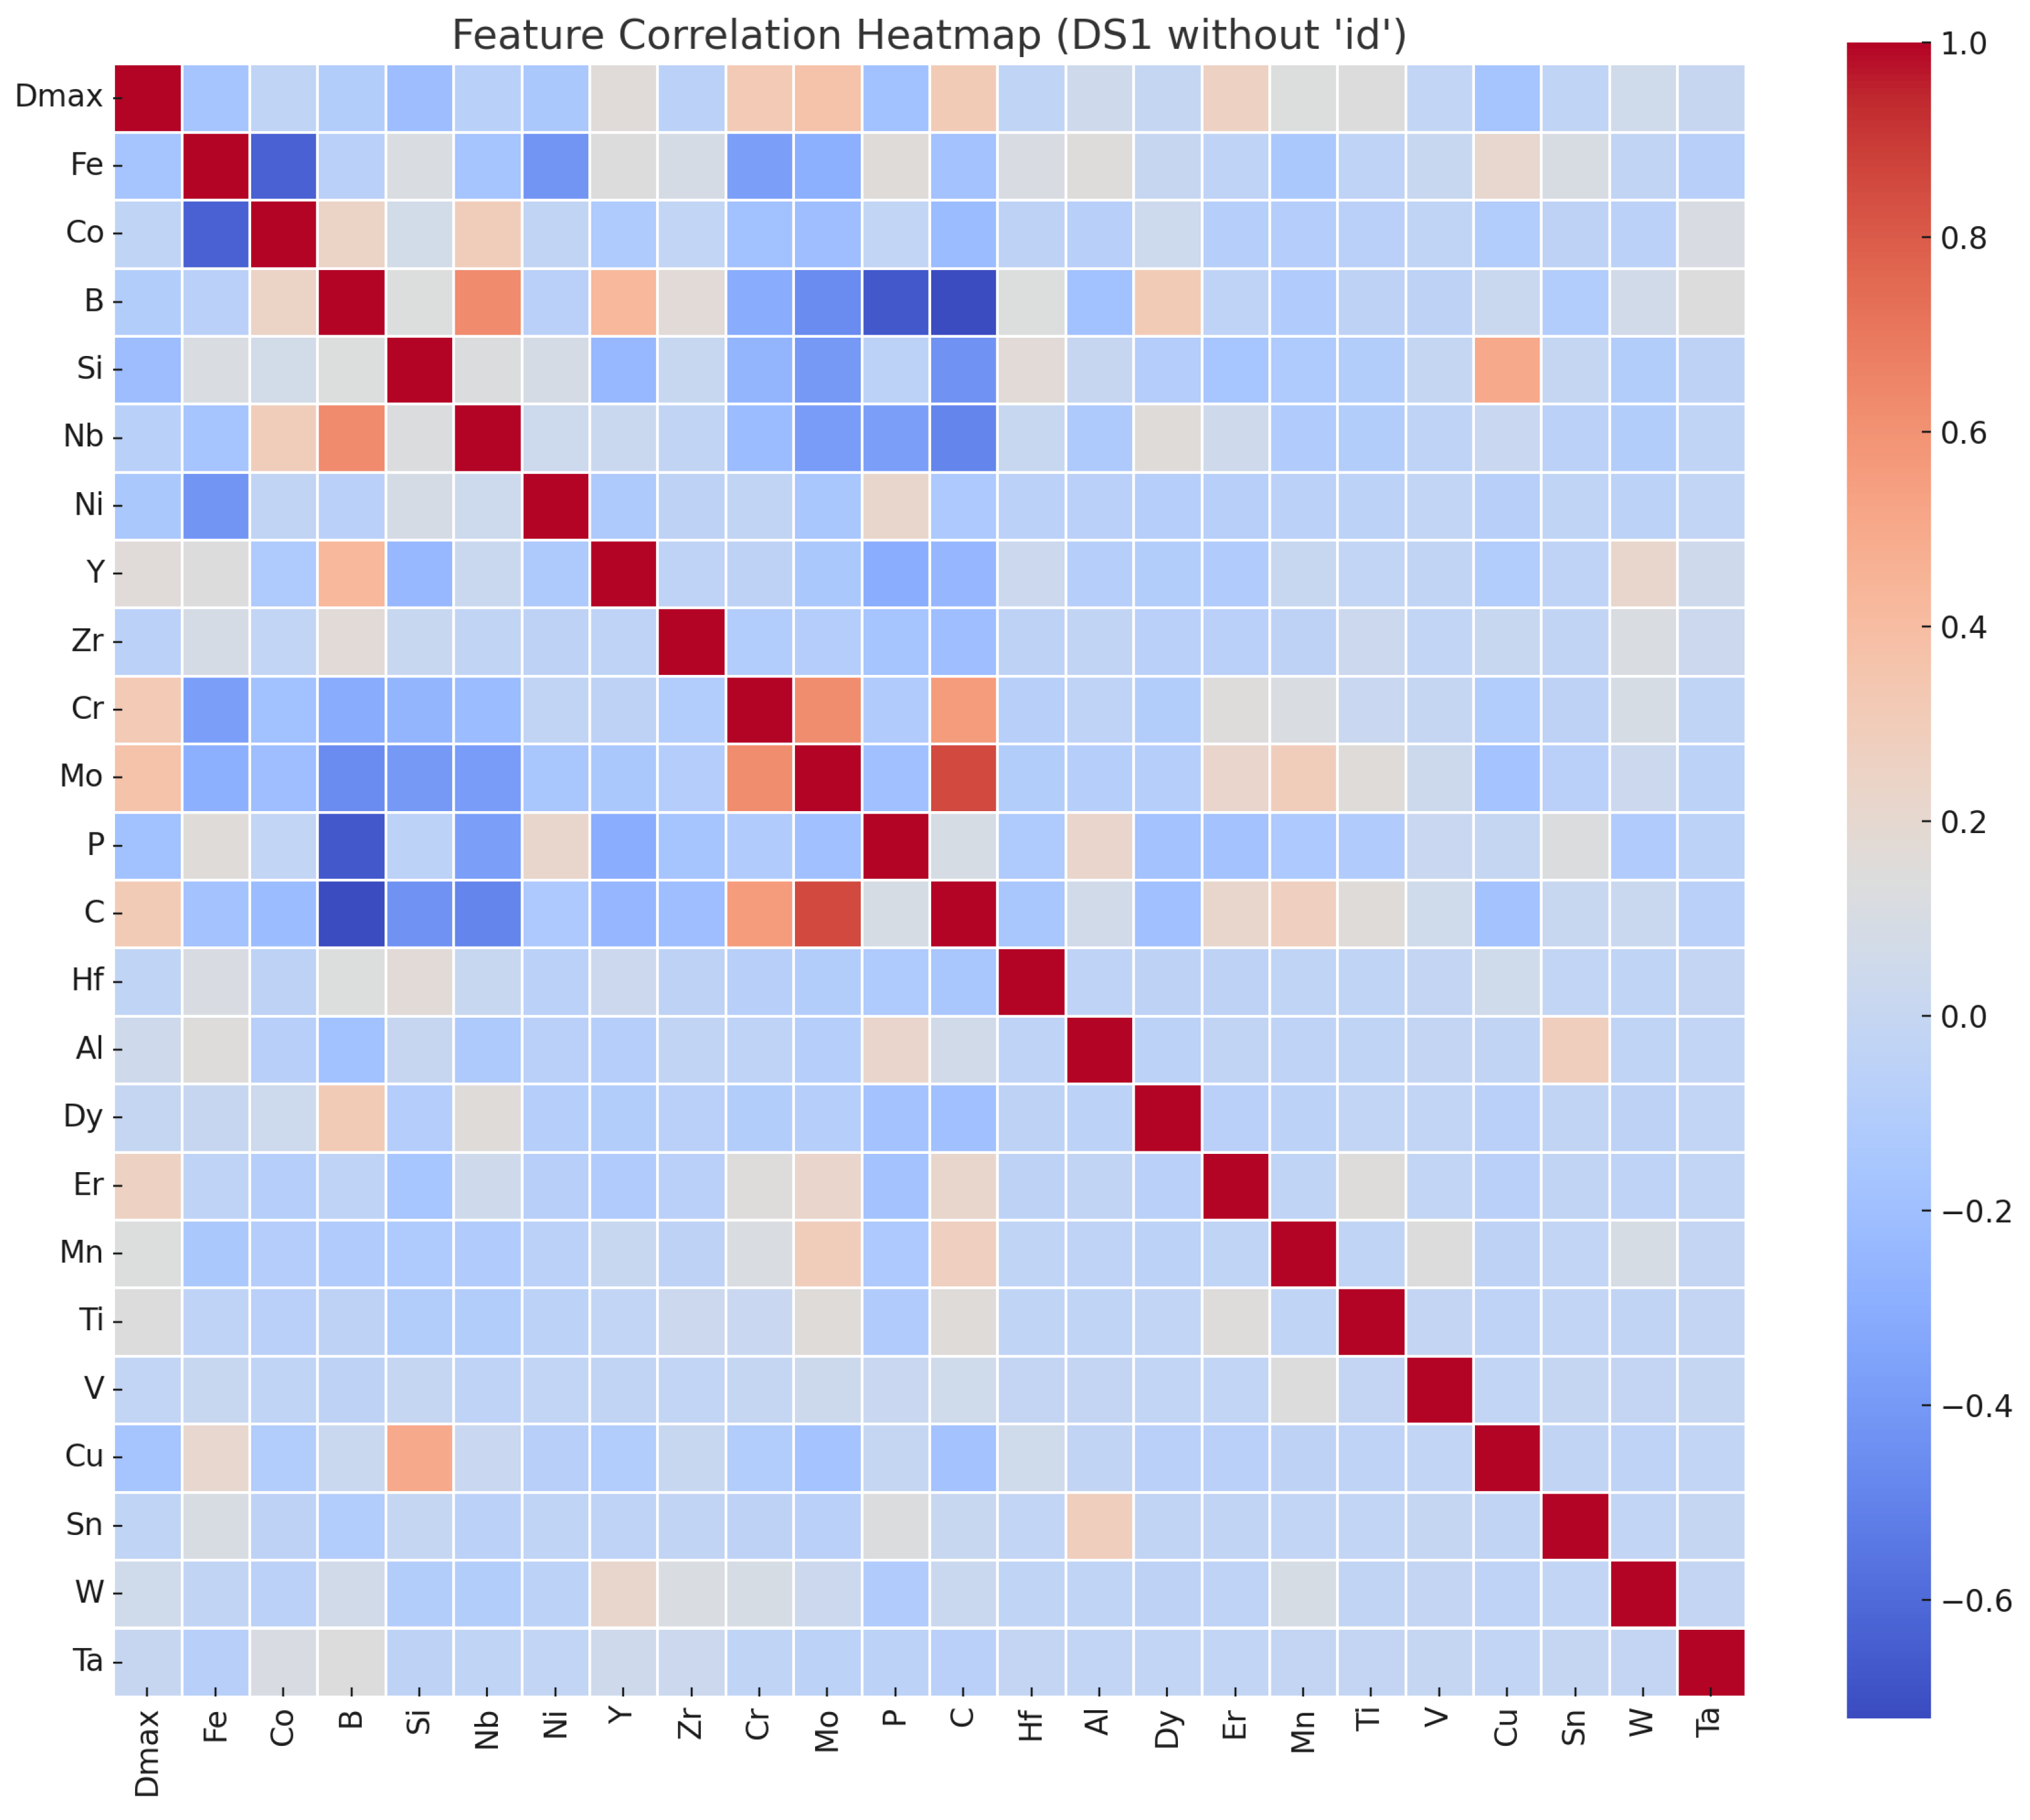
Although boron and carbon are present in most alloys in the dataset, the molybdenum and yttrium molar fractions are the most important features for predicting D m a x when using compositional features. However, boron and carbon still rank among the top ten most important features. It is important to note that the values shown in Figure 6 reflect the relative importance of these features in predicting the D m a x of the alloy. These rankings do not necessarily imply that the presence of these elements promotes GFA or maximizes D m a x . For comparison, correlation heatmaps were also calculated and are presented in Figure 7. Linear correlations between the molar fractions appear to be limited (the highest being between Mo and C), whereas the molar fractions of Mo, Cr, Er, and C exhibit the strongest linear correlations with the target D m a x . In contrast, other elements ranked among the top ten in the SHAP analysis show low linear correlations with D m a x , indicating the presence of non-linear relationships with the target.
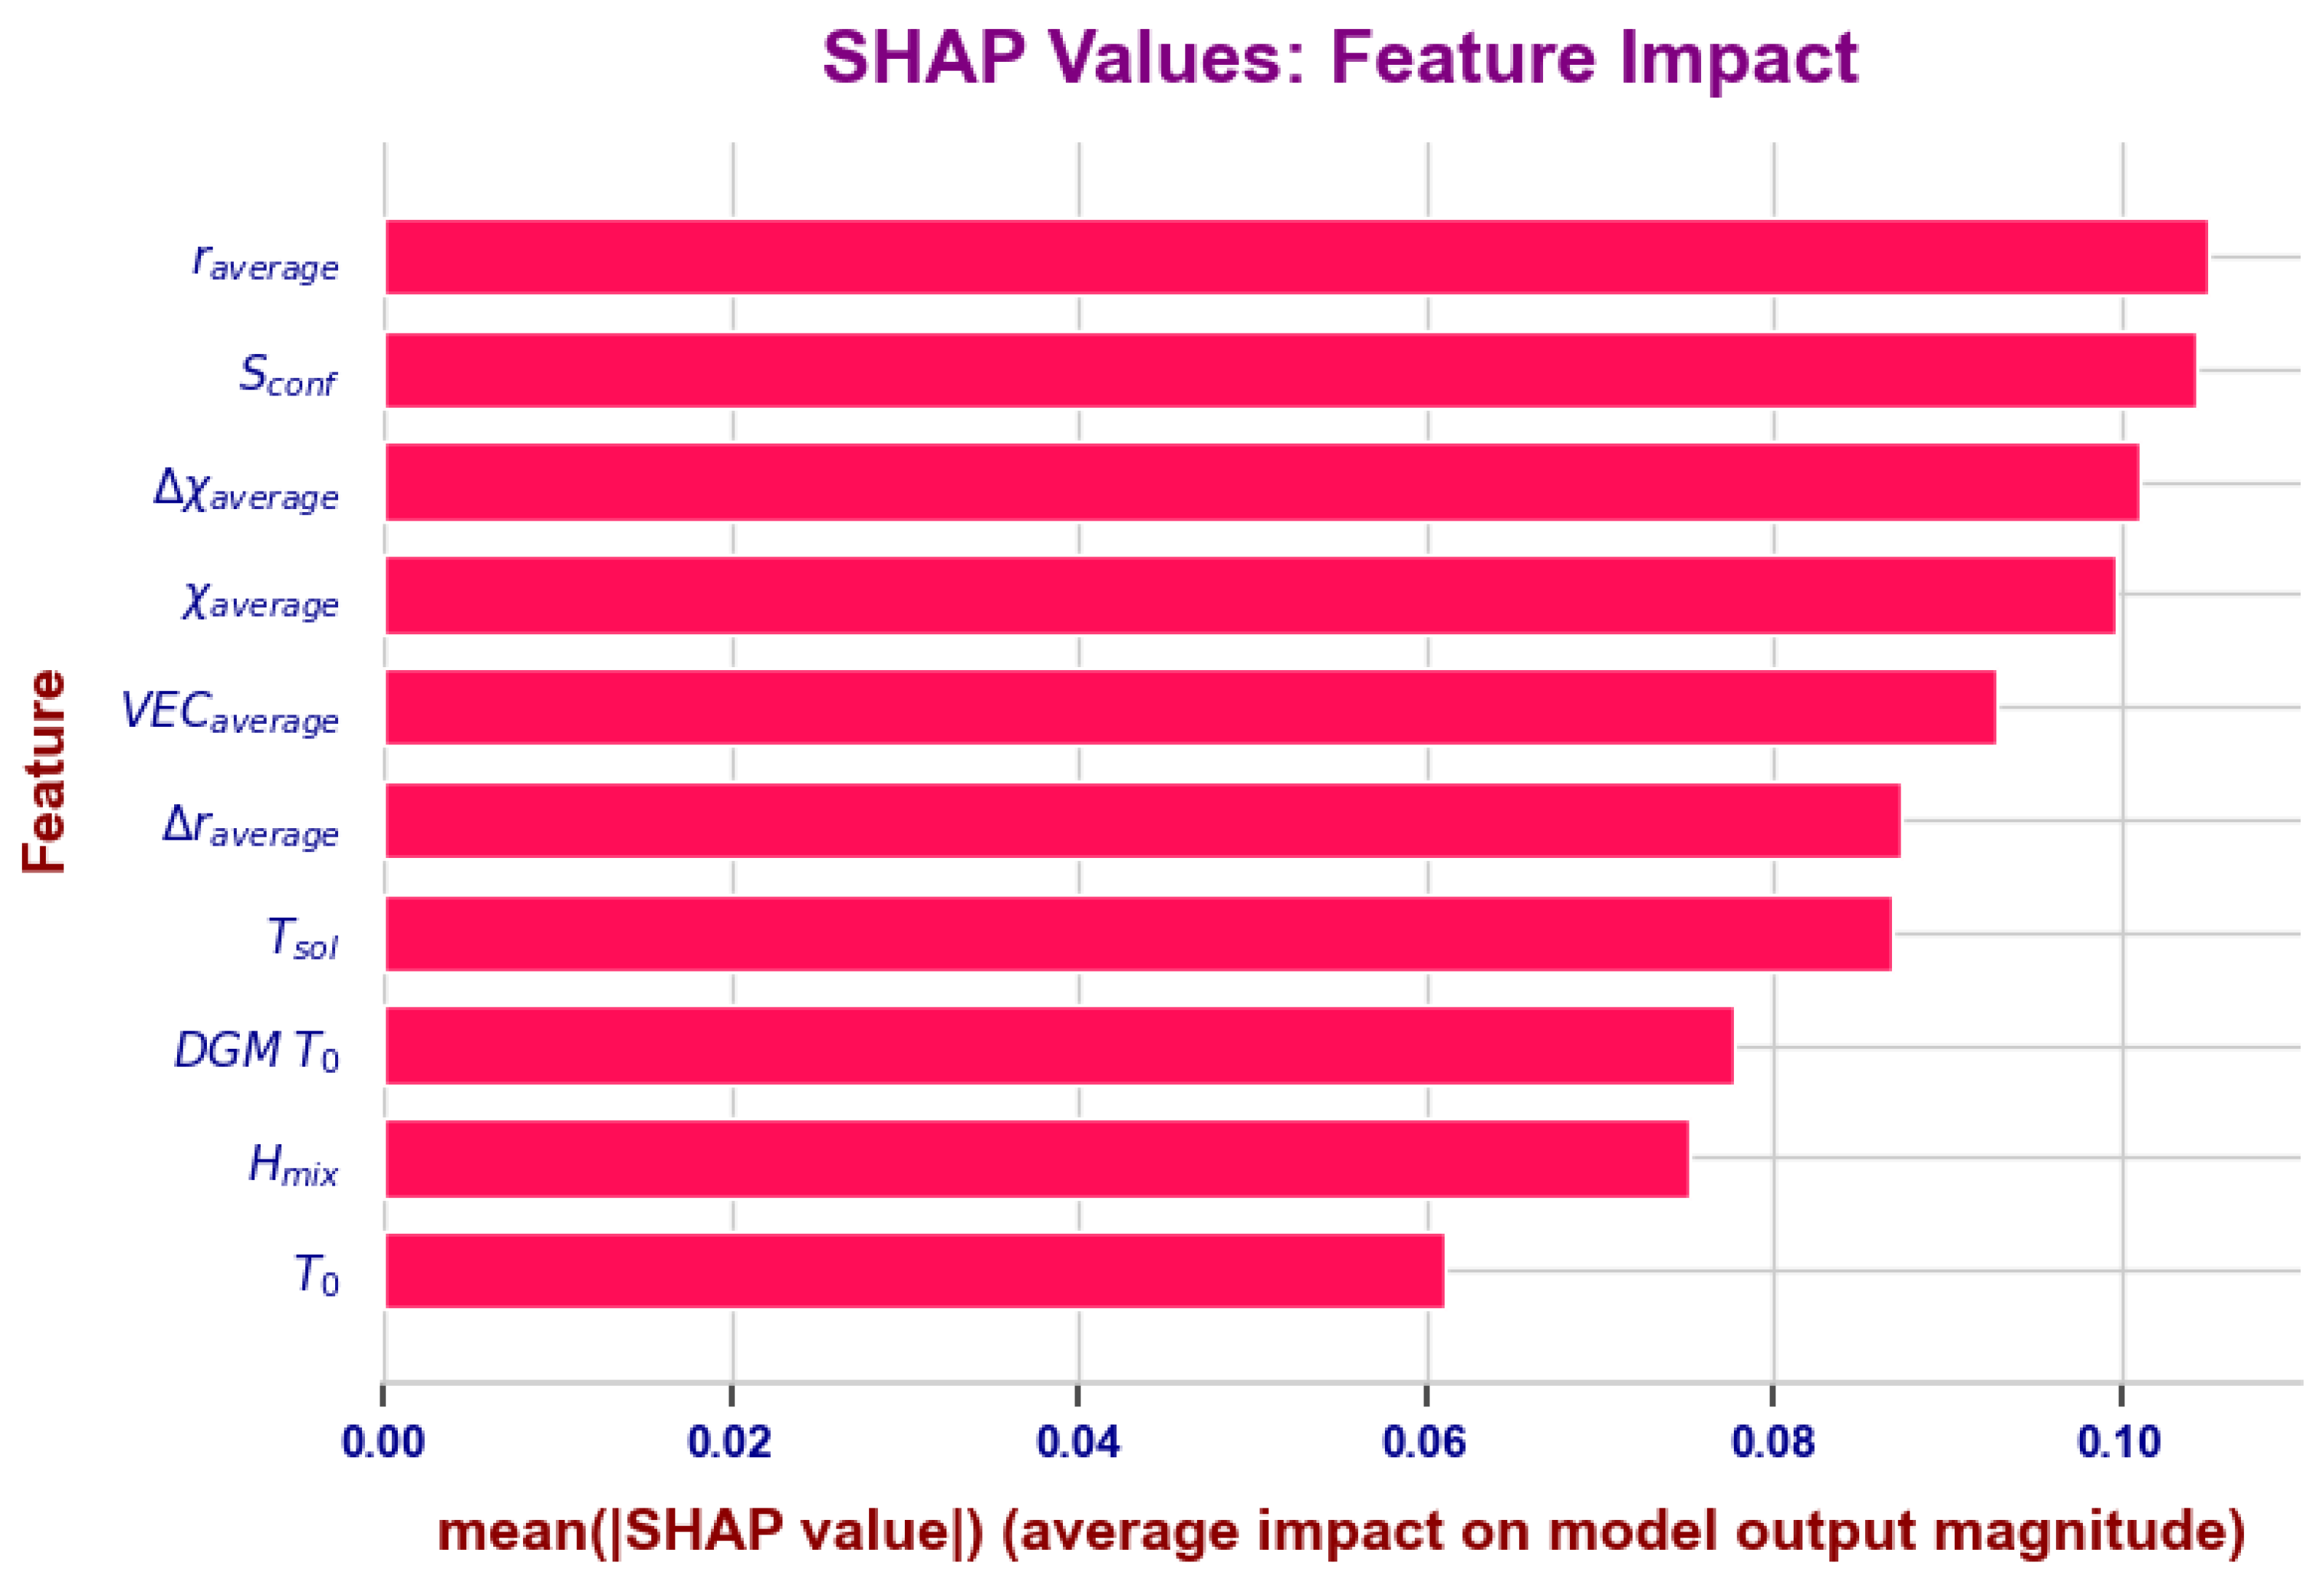
Similarly, the top ten most important features obtained for the SVM model trained on dataset DS2 are shown in Figure 8. Interestingly, there is little difference in the relative importance of the top ten thermophysical quantities, highlighting that several features are almost equally important for the model to make predictions. Although the average atomic radius ( r a v e r a g e ) ranks first, several other features, such as the configurational entropy ( S c o n f ), Average Pauling electronegativity ( χ a v e r a g e ), and Average Pauling electronegativity difference ( Δ χ ) are almost equally important. Remarkably, thermodynamic quantities such as the driving force for nucleation of solid phases ( D G M T 0 ), the enthalpy of mixing ( H m i x ), and the T nought temperature ( T 0 ) appear at the bottom of the list, while others such as the enthalpy and entropy of melting of the alloy do not appear at all in the top ten. The influence of quantities related to atomic packing and thermodynamics on the GFA of metallic alloys has already been discussed in the literature [8,9]. In fact, several of these quantities have been used to estimate the GFA. For example, plots of the driving force for nucleation of crystalline phases (DGM) have been used to identify the composition/temperature regions with higher GFA, assuming that they are the regions where the driving force for nucleation is lower [8]. However, this is a qualitative criterion that does not necessarily account for all physical factors which contribute to the D m a x . Moreover, the DGM in this study was calculated only at two temperatures ( T s o l and T 0 ), whereas a more comprehensive evaluation over an extended temperature range would be preferable.
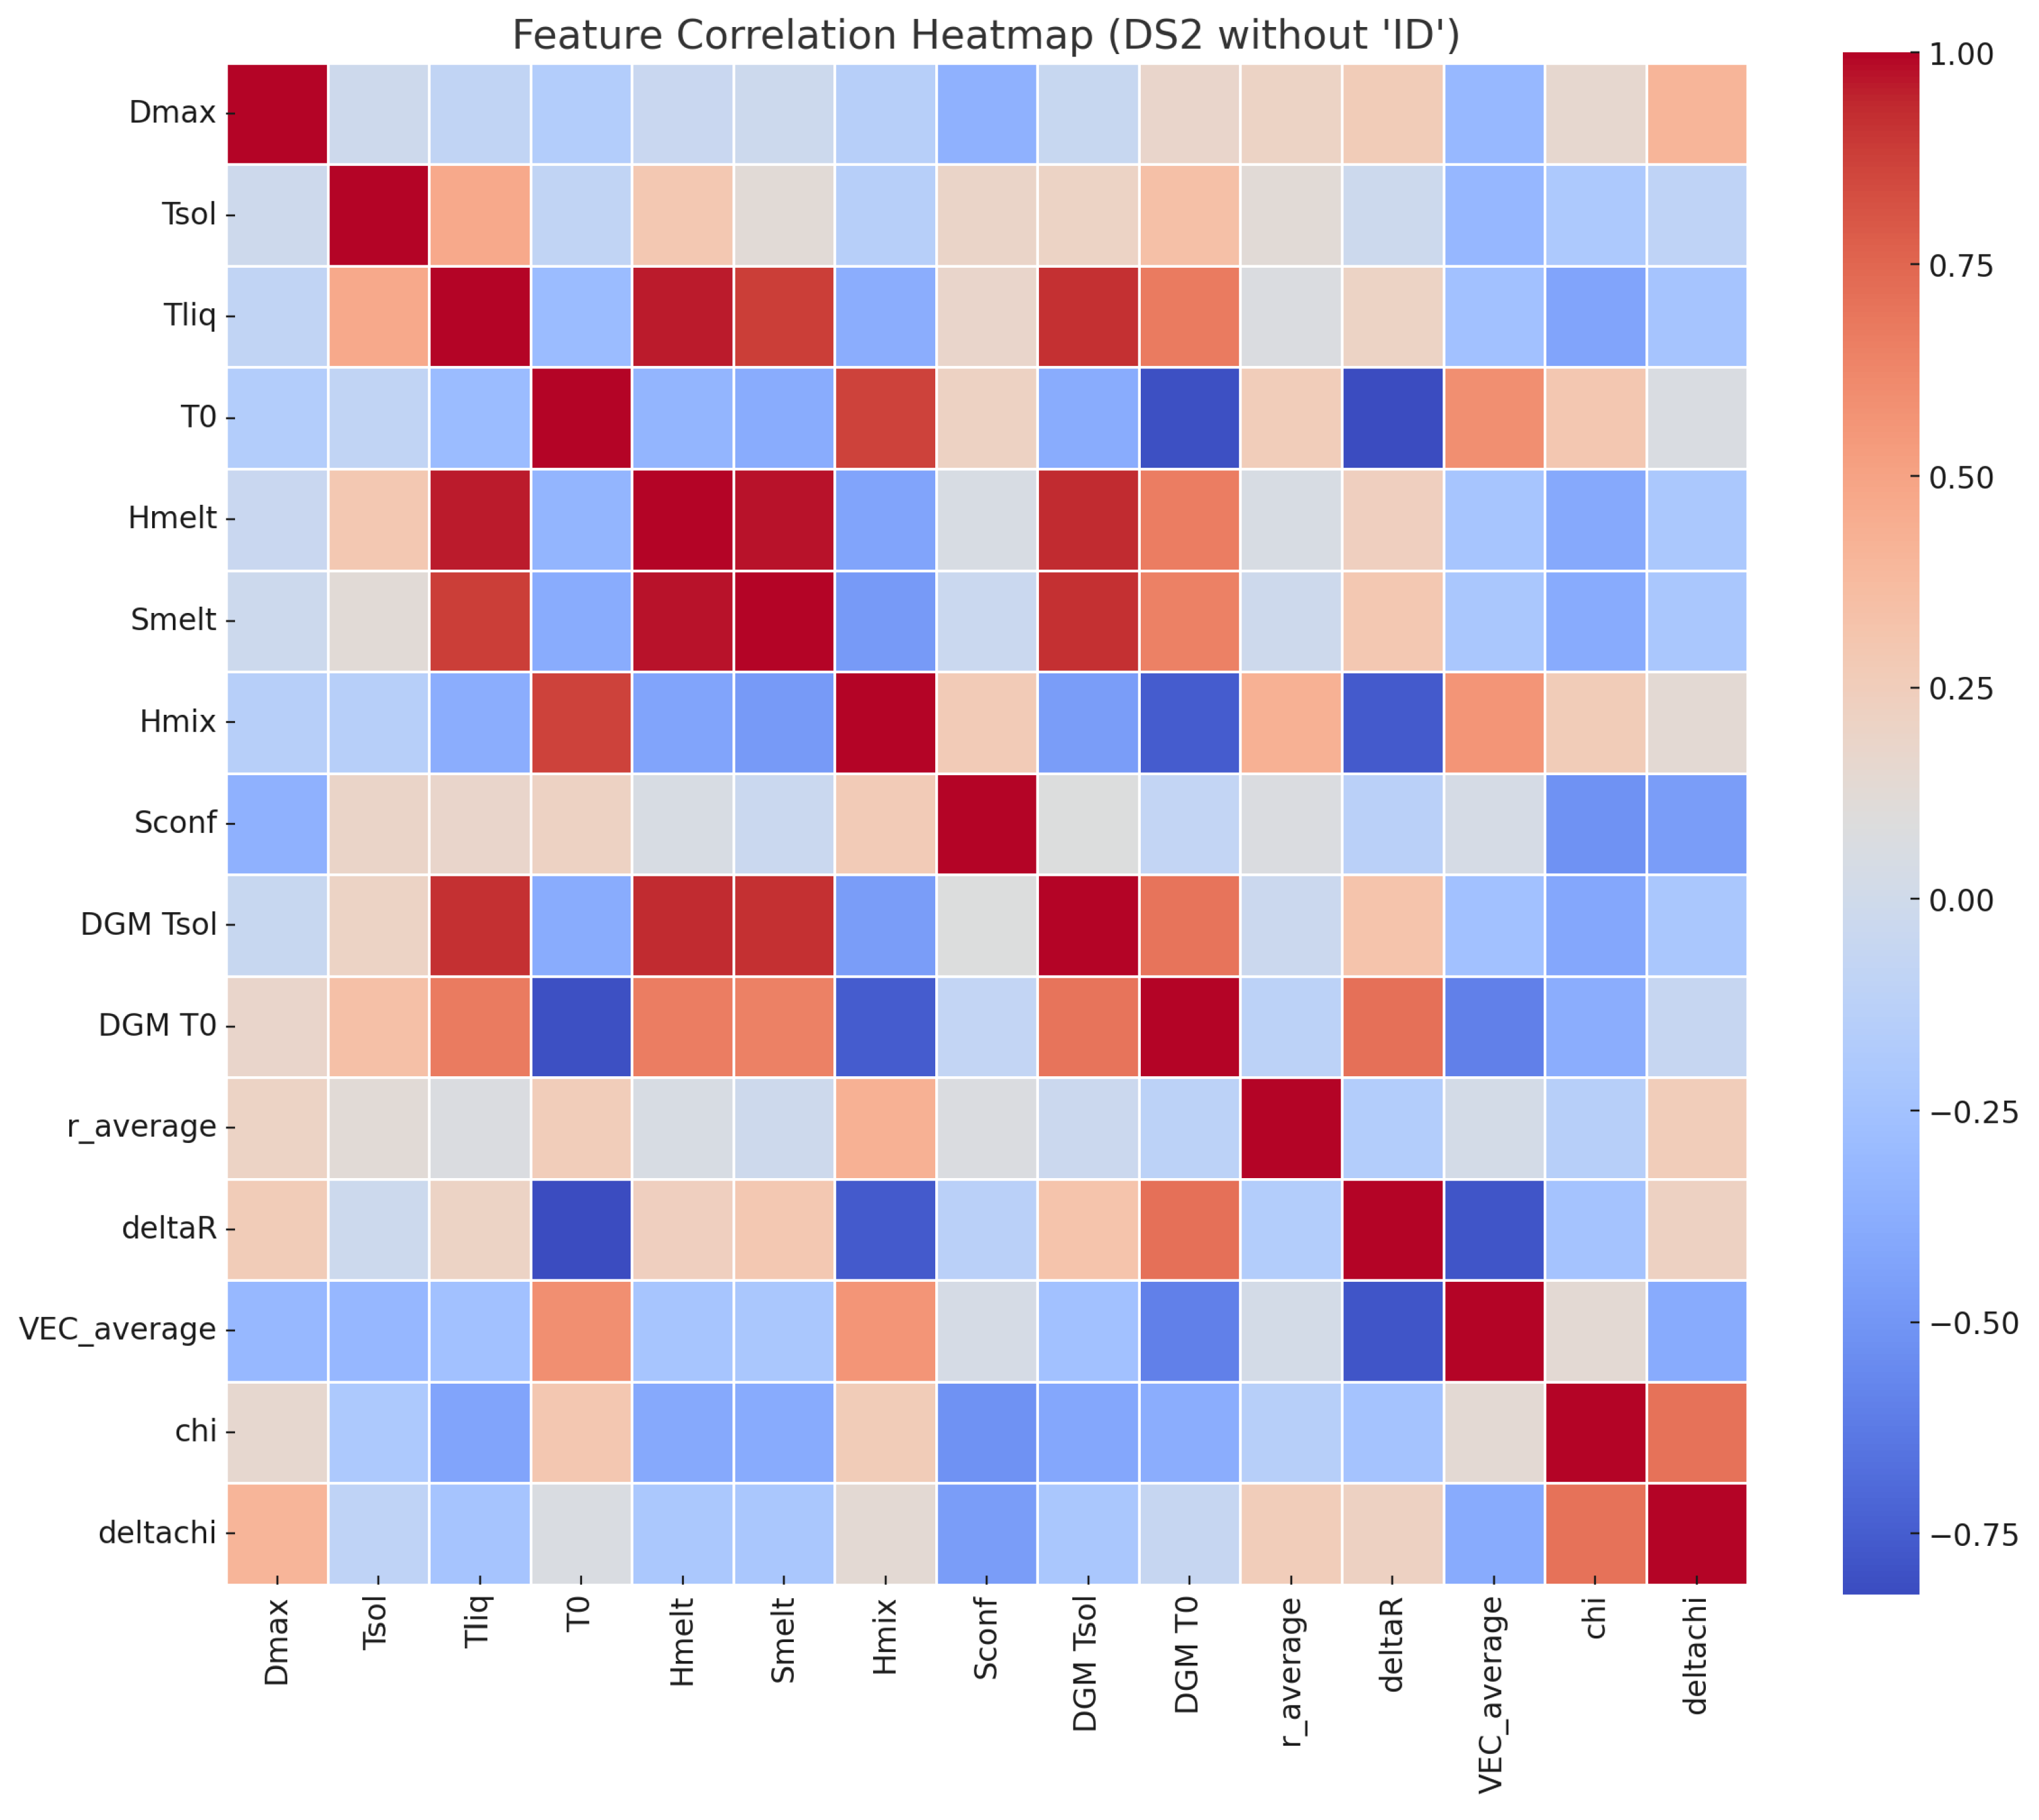
The heatmap (correlation matrix) for dataset DS2 is presented in Figure 9. Moderate linear correlations are observed between the target D m a x and the features Δ χ , χ average , Δ r average , and r average , in agreement with the SHAP feature importance analysis. Interestingly, some thermodynamic properties exhibit high correlation values, which may suggest that certain features are redundant.
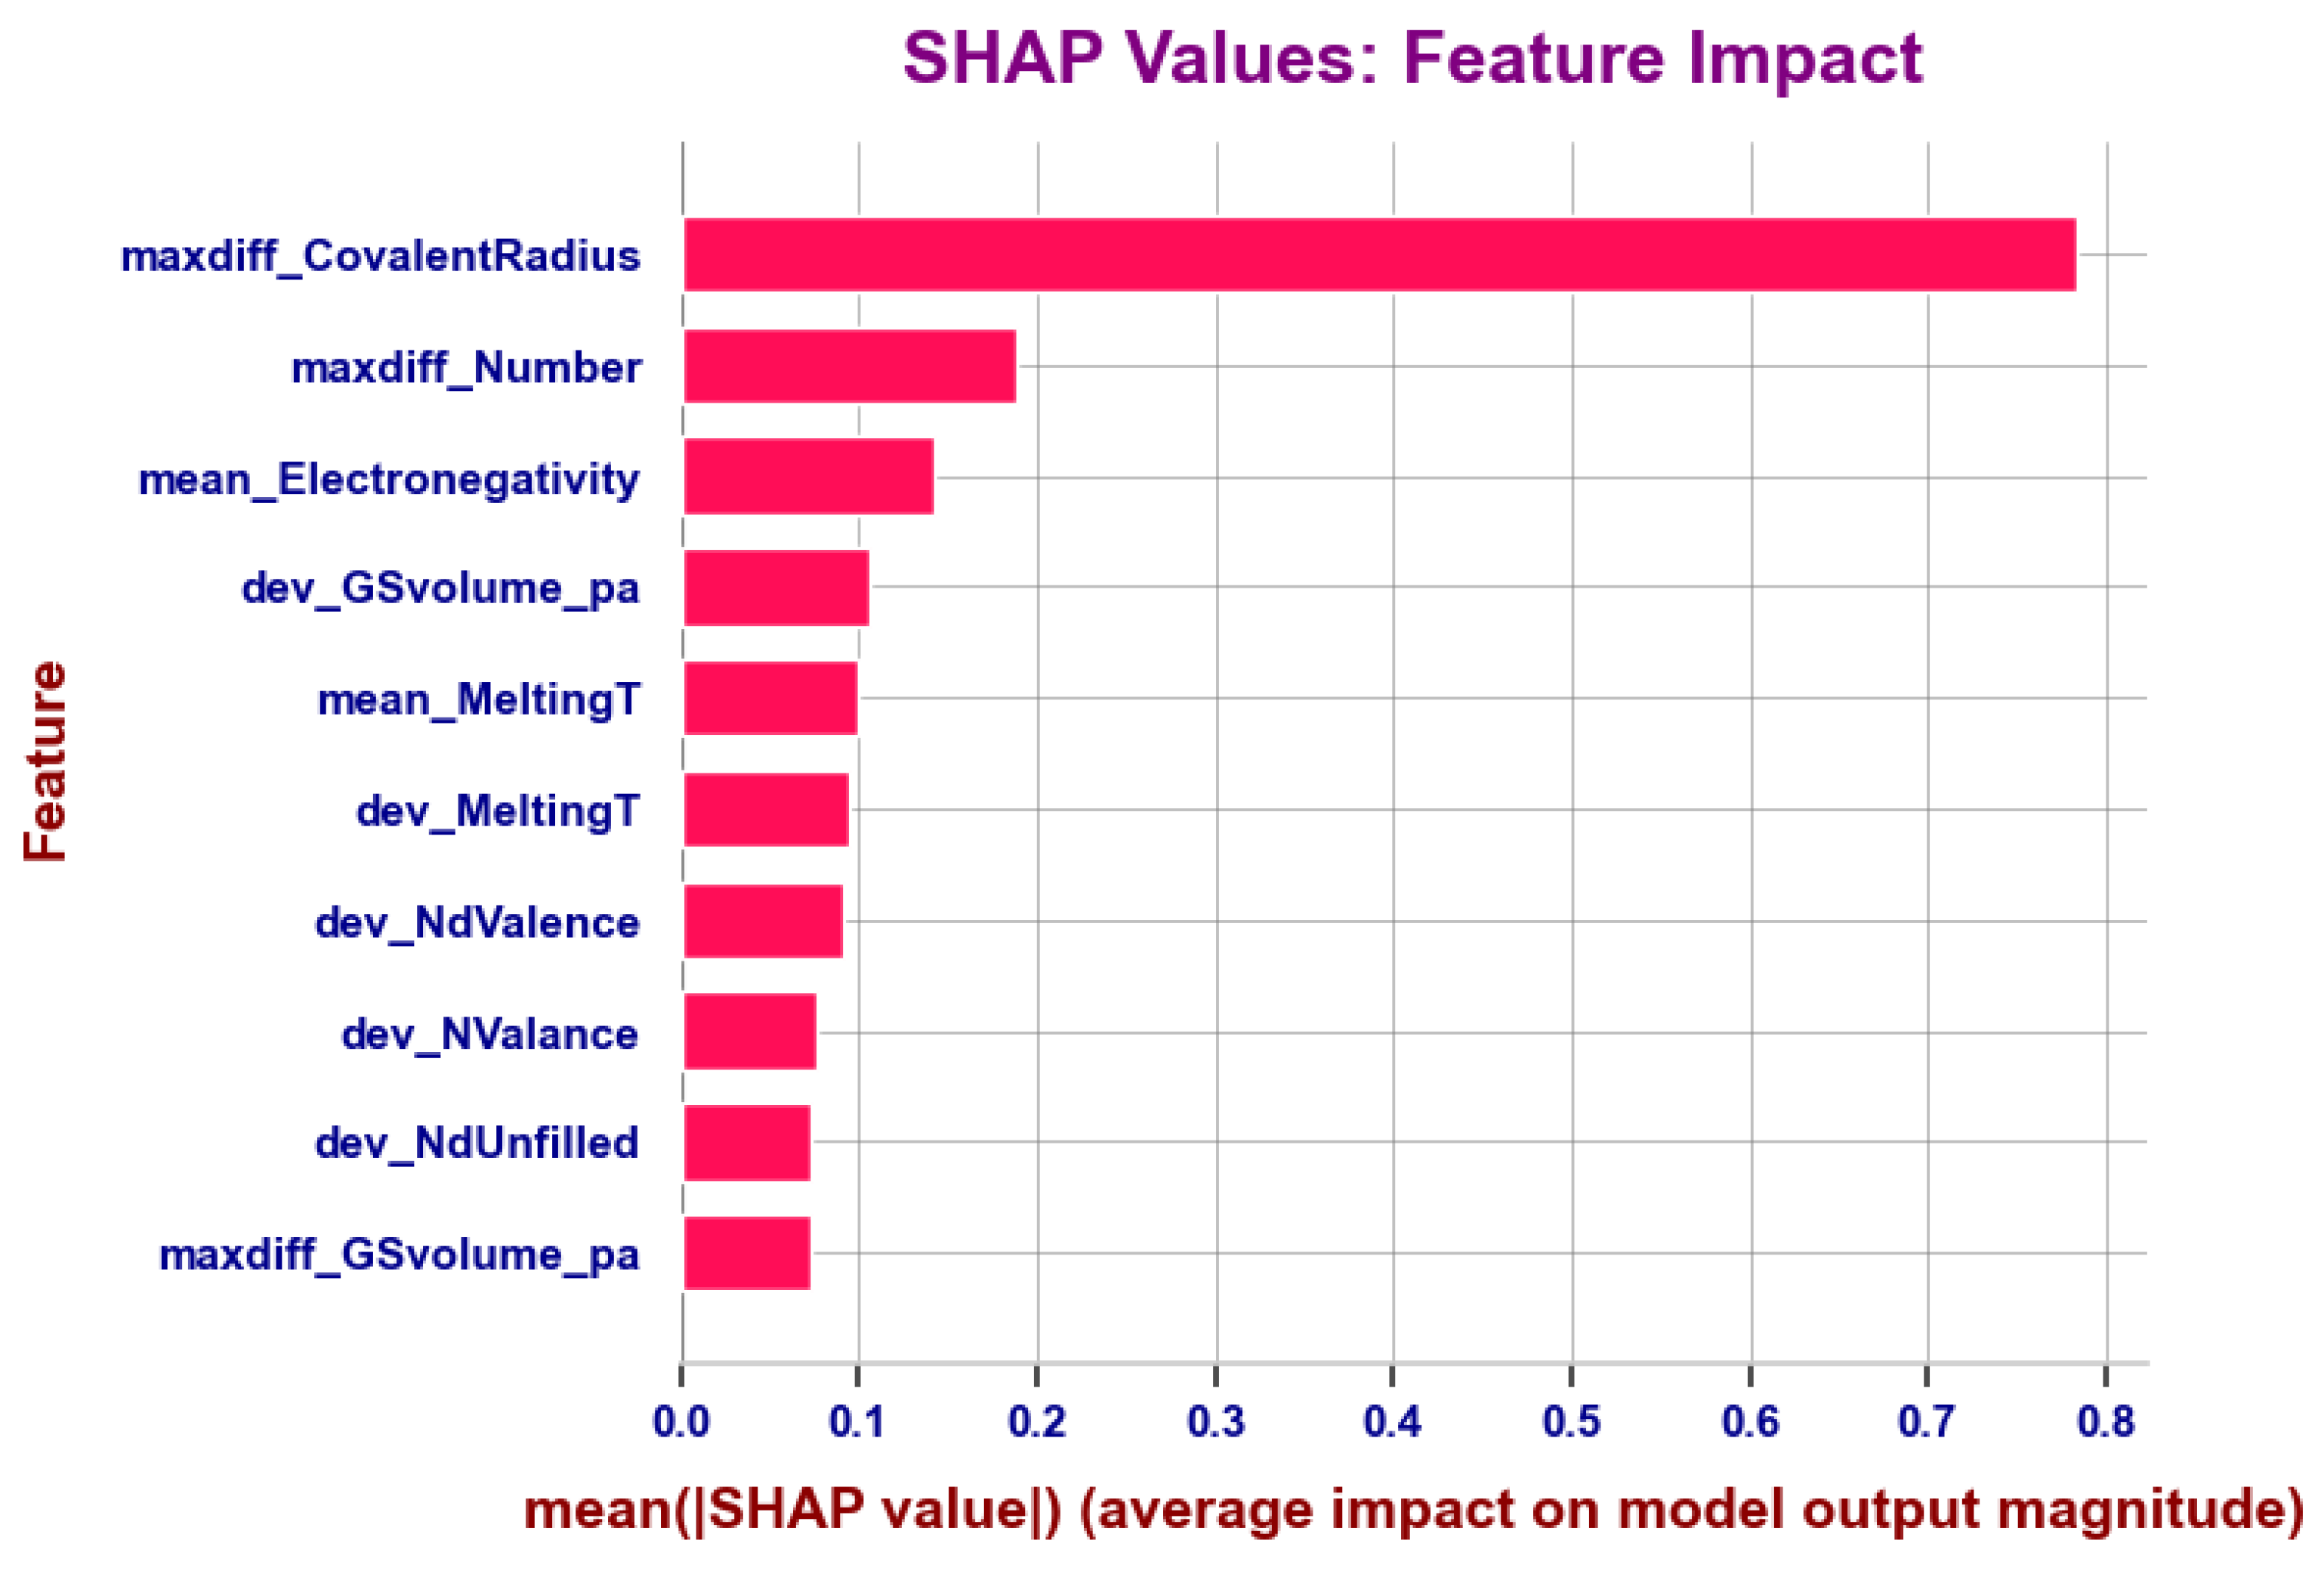
Finally, Figure 10 reports the feature importance obtained for the best model (XGBoost) trained on dataset DS3. In this case, a single feature, maxdiff_CovalentRadius, stands out as significantly more influential than all the others. This property is the maximum difference among the covalent atomic radii of the elements present in the alloy. Atomic packing has been recognized as a key factor in glass formation [9], large size mismatches between atoms (typically ≥12%) make it hard for the atoms to arrange into a regular crystalline structure, size differences contribute to dense and irregular atomic packing and increase the viscosity of the molten alloy as it cools, which slows down atomic mobility and further suppresses crystallization. However, it is challenging to understand why, in this case, a single feature, maxdiff_CovalentRadius, emerges as so dominant compared to the other features generated by Magpie. This has not been reported in earlier studies using Magpie for BMGS [12]. This raises questions about whether this feature captures a particularly strong correlation with D m a x or if it reflects an underlying bias in the dataset or feature generation process.

4. Ensemble Methods

To further boost the predictive ability of our ML models, we tested several possible ensemble models as summarized in Table 3. Ensemble models are typically more robust and accurate than individual models. Furthermore, they reduce overfitting, handle noise better, and improve generalization by leveraging the diverse perspectives provided by different ML models. In the present case, we created ensemble predictions by averaging the predictions of the above-trained models with equal weights using the VotingRegressor from Scikit-learn library. However, ensembles including the MLR model performed poorly and were then discarded. On the contrary, ensemble models constructed from SVM and XGB models trained on different datasets lead to a significant improvement in the prediction power of the model, as evidenced by the R 2 and M A E scores in Table 3.
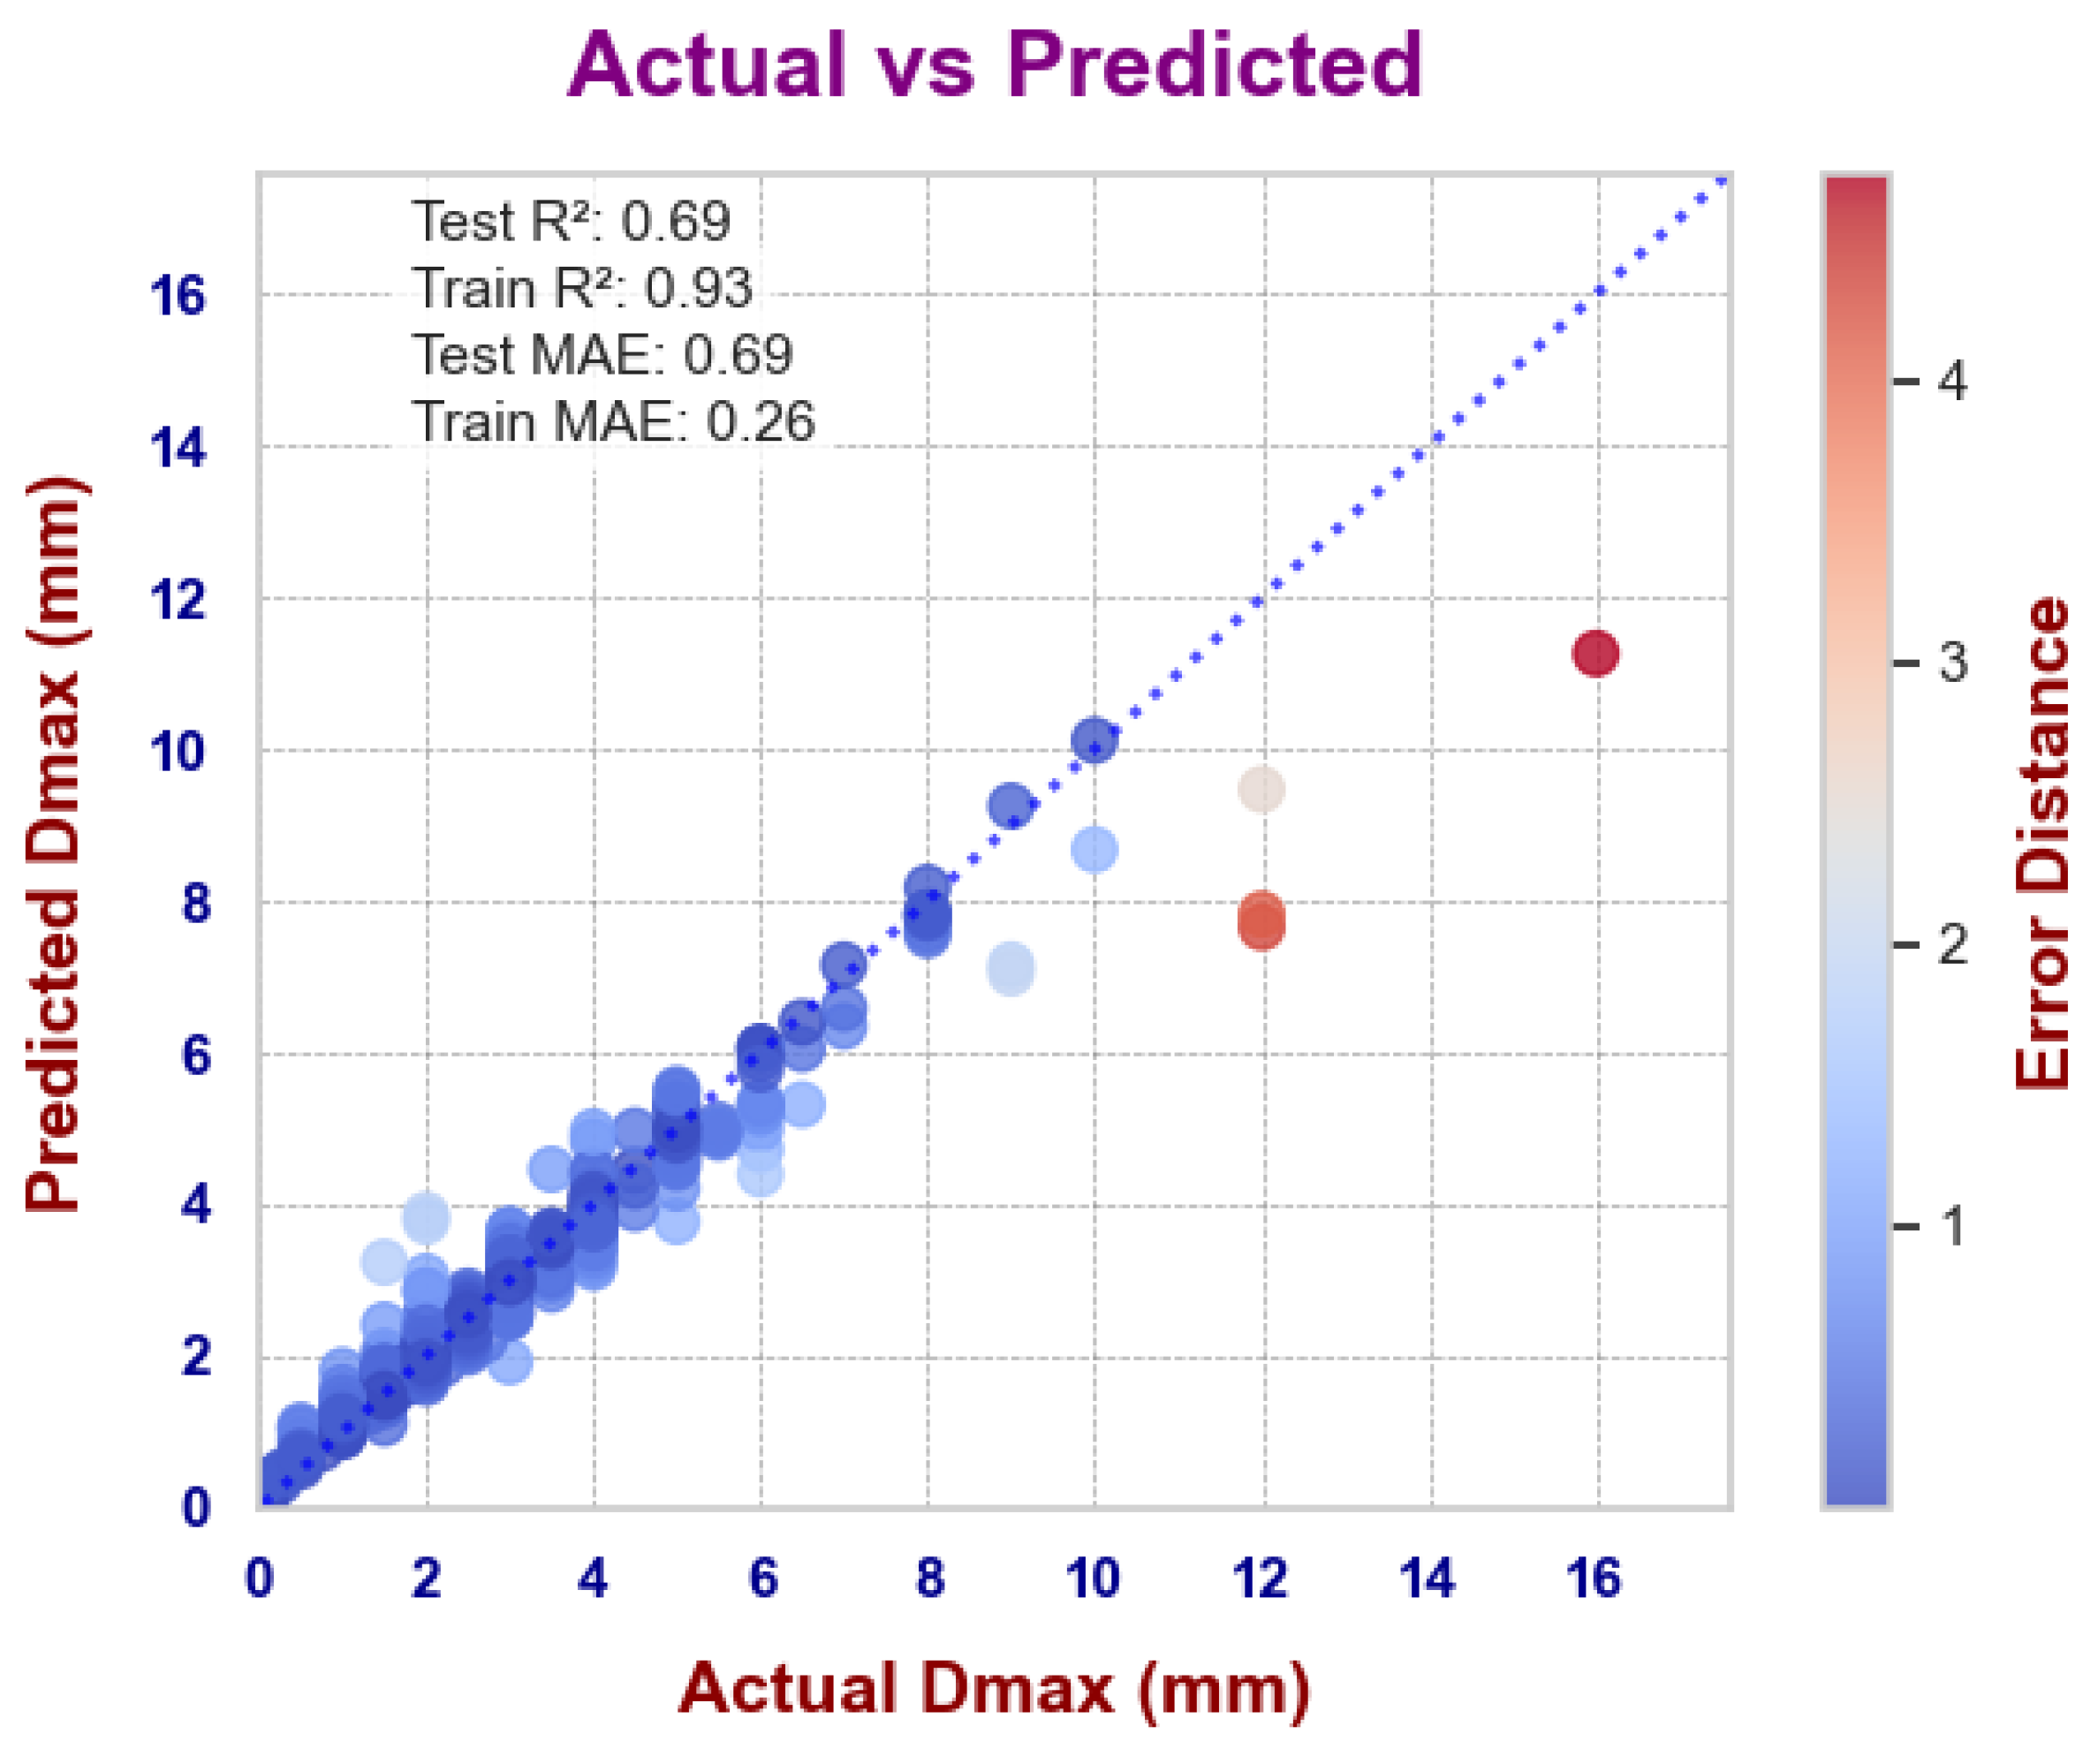
The best ensemble model was achieved by combining four different models: two SVM models (trained on DS2 and DS3) and two XGB models (trained on DS2 and DS3). This ensemble reached an R 2 value of 0.69 on the test set, with a corresponding M A E of 0.69. Although this represents a modest improvement over the best ML model from the previous section (from 0.63 for the R 2 score and from 0.72 for the M A E ), it was achieved with minimal additional effort, as the ensemble method is not significantly slower than the individual models. Furthermore, the improvement appears consistent across the folds used in cross-validation and, as shown in Figure 11, the ensemble model demonstrates noticeable improvement in predicting large D m a x values, although there remains room for further enhancement. Our best ensemble model compares well with earlier studies. A higher R 2 value (0.79) was obtained by Ward et al. using an a posteriori approach and a much larger dataset that included amorphous ribbon samples; however, the R 2 drops to 0.64 when using only BMG samples. Other a posteriori studies report R 2 values ranging from 0.64 [14] to 0.95 [15], though, as previously mentioned, the predictive ability of these models is limited. Comparable or lower R 2 values have been obtained in earlier studies using a priori approaches (0.64 [19]; 0.71 [17]). Notably, another study reported a significant improvement in the R 2 value of an XGBoost model—from 0.61 to 0.76—through a data augmentation technique [20]. In the following section, we explore the potential for improving our results using an alternative data augmentation method. A summary of results from this work and the literature is reported in Table 4.

PADRE Data Augmentation

Further attempts were conducted to evaluate the effect of data augmentation using the PADRE methodology. Since this approach significantly increases both the number of entries and the features in the dataset, only the XGBoost model was trained on the augmented datasets (DSA1 and DSA2 obtained with PADRE and DSA1-2 and DSA2-2 obtained with PADRE-2). SVM models were not used, as they do not scale well with large datasets. The results obtained on PADRE and PADRE-2 data augmented datasets from the original compositional and thermophysical features datasets are presented in Table 5.
Unexpectedly, data augmentation using the PADRE method did not improve model performance. In fact, when using thermophysical features, the XGBoost model trained on the augmented dataset (DSA2) showed worse performance. Conversely, the modified data augmentation approach, PADRE-2, yielded slightly better results and effectively reduced redundancy in the data, demonstrating its potential as a more refined augmentation strategy. However, the current results do not match the significantly higher performance improvements achieved with other augmentation methodologies (e.g., R 2 scores of up to 0.78 achieved with ensemble methods) [20]. These methods appear to be more effective in addressing the data distribution imbalance inherent in these datasets. However, the cited study also incorporates feature combinations of T g and T x temperatures, which may contribute significantly to the observed improvements.

5. Conclusions

In this study, we evaluated several machine learning (ML) models on various datasets of Fe-based bulk metallic glasses (BMGs), the models were trained to predict the maximum diameter ( D m a x ) of rods or cones that can be cast in an amorphous form. The effectiveness of different types of features was analyzed, and thermophysical quantities, calculated either using the CALPHAD method or based on fundamental equations, were found to be more effective than the molar fractions of the alloy. We also tested Magpie features, which demonstrated comparable performance but required a larger number of features. Notably, we intentionally avoided using features such as T g and T x temperatures, as these can significantly enhance model performance but would render the approach unsuitable for glass-forming ability (GFA) screening. Unexpectedly, the PADRE augmentation method, along with its modified version introduced in this work (PADRE-2), resulted in only minor improvements in the performance of the machine learning models. Our best-performing model was an ensemble that combined four machine learning models: XGBoost and SVM, each trained on both thermophysical and Magpie features. This ensemble achieved performance scores of R 2 = 0.69 and MAE = 0.69, comparable to the best published results obtained using larger datasets. However, further improvements are needed, particularly in accurately predicting the higher range of D m a x , which is critical for the development of new bulk metallic glasses (BMGs). As it has already been remarked, it is not easy to increase the number of data at high D m a x values, but some specific techniques to address the data imbalance could help with improving the accuracy of the predictions.Further validation of the models hereby trained is also desirable with new data points which are outside the present set of data. Moreover, it may be worthwhile to explore the use of machine learning models that incorporate probabilistic inference, such as Bayesian Neural Networks or Gaussian Processes, to better estimate the uncertainties associated with the predictions.

Supplementary Materials

The following supporting information can be downloaded at: https://www.mdpi.com/article/10.3390/met15070763/s1. Table S1: Table of thermodynamic parameters, obtained from Thermo-calc. Table S2: Table of thermophysical parameters, obtained from empirical equations. Table S3: Examples of Magpie generated attributes (features) and their meaning. Table S4: Best hyperparameters for SVR for DS1 and DS2. Table S5: Best hyperparameters for XGBoost for DS1 and DS2. Table S6: Final Results. Table S7: Regression coefficients of the MLR model for the DS1 dataset, indicating the contribution of each element. Table S8: Regression coefficients of the MLR model for the DS2 dataset, showing the contribution of each variable. Datasets and code for this work are available on https://github.com/mauropalumbo75/ML_BMGs, accessed on 26 April 2025.

Author Contributions

Conceptualization, M.P.; Methodology, M.P.; Software, R.D.B.B.; Formal analysis, R.D.B.B. and M.P.; Investigation, R.D.B.B.; Data curation, R.D.B.B.; Writing—original draft, R.D.B.B.; Writing—review & editing, M.B. and M.P.; Supervision, M.P.; Project administration, M.B.; Funding acquisition, M.B. All authors have read and agreed to the published version of the manuscript.

Funding

This research received no external funding.

Data Availability Statement

The raw data supporting the conclusions of this article will be made available by the authors on request.

Acknowledgments

Support from the Project CH4.0 under the MUR program “Dipartimenti di Eccellenza 2023–2027” (CUP: D13C22003520001) is acknowledged. The authors would also like to thank the “Centro di Competenza sul Calcolo Scientifico” for the computing time on the OCCAM supercomputer.

Conflicts of Interest

The authors declare that they have no known competing financial interests or personal relationships that could have appeared to influence the work reported in this paper.

References

  1. Klement, W.; Willens, R.; Duwez, P. Non-crystalline structure in solidified gold–silicon alloys. Nature 1960, 187, 869–870. [Google Scholar] [CrossRef]
  2. Greer, A. 4—Metallic Glasses. In Physical Metallurgy, 5th ed.; Laughlin, D.E., Hono, K., Eds.; Elsevier: Oxford, UK, 2014; pp. 305–385. [Google Scholar] [CrossRef]
  3. Khanolkar, G.R.; Rauls, M.B.; Kelly, J.P.; Graeve, O.A.; Eliasson, A.M.H.; Eliasson, V. Shock Wave Response of Iron-based In Situ Metallic Glass Matrix Composites. Sci. Rep. 2016, 6, 22568. [Google Scholar] [CrossRef] [PubMed]
  4. Hashimoto, K. What we have learned from studies on chemical properties of amorphous alloys? Appl. Surf. Sci. 2011, 257, 8141–8150. [Google Scholar] [CrossRef]
  5. Sparks, T.D.; Kauwe, S.K.; Parry, M.E.; Tehrani, A.M.; Brgoch, J. Machine Learning for Structural Materials. Annu. Rev. Mater. Res. 2020, 50, 27–48. [Google Scholar] [CrossRef]
  6. Greer, A.L. Confusion by design. Nature 1993, 366, 303–304. [Google Scholar] [CrossRef]
  7. Inoue, A. Stabilization of metallic supercooled liquid and bulk amorphous alloys. Acta Mater. 2000, 48, 279–306. [Google Scholar] [CrossRef]
  8. Palumbo, M.; Battezzati, L. Thermodynamics and kinetics of metallic amorphous phases in the framework of the CALPHAD approach. Calphad 2008, 32, 295–314. [Google Scholar] [CrossRef]
  9. Miracle, D.B.; Sanders, W.S.; Senkov, O.N. The influence of efficient atomic packing on the constitution of metallic glasses. Philos. Mag. 2003, 83, 2409–2428. [Google Scholar] [CrossRef]
  10. Graeve, O.A.; García-Vázquez, M.S.; Ramírez-Acosta, A.A.; Cadieux, Z. Latest Advances in Manufacturing and Machine Learning of Bulk Metallic Glasses. Adv. Eng. Mater. 2023, 25, 2201493. [Google Scholar] [CrossRef]
  11. Schmidt, J.; Marques, M.; Botti, S.; Marques, M. Recent advances and applications of machine learning in solid-state materials science. npj Comput. Mater. 2019, 5, 83. [Google Scholar] [CrossRef]
  12. Ward, L.; O’Keeffe, S.C.; Stevick, J.; Jelbert, G.R.; Aykol, M.; Wolverton, C. A machine learning approach for engineering bulk metallic glass alloys. Acta Mater. 2018, 159, 102–111. [Google Scholar] [CrossRef]
  13. Ren, B.; Long, Z.; Deng, R. A new criterion for predicting the glass-forming ability of alloys based on machine learning. Comput. Mater. Sci. 2021, 189, 110259. [Google Scholar] [CrossRef]
  14. Deng, B.; Zhang, Y. Critical feature space for predicting the glass forming ability of metallic alloys revealed by machine learning. Chem. Phys. 2020, 538, 110898. [Google Scholar] [CrossRef]
  15. Ghorbani, A.; Askari, A.; Malekan, M.; Nili-Ahmadabadi, M. Thermodynamically-guided machine learning modelling for predicting the glass-forming ability of bulk metallic glasses. Sci. Rep. 2022, 12, 11754. [Google Scholar] [CrossRef]
  16. Long, T.; Long, Z.; Pang, B.; Li, Z.; Liu, X. Overcoming the challenge of the data imbalance for prediction of the glass forming ability in bulk metallic glasses. Mater. Today Commun. 2023, 35, 105610. [Google Scholar] [CrossRef]
  17. Mastropietro, D.G.; Moya, J.A. Design of Fe-based bulk metallic glasses for maximum amorphous diameter (Dmax) using machine learning models. Comput. Mater. Sci. 2021, 188, 110230. [Google Scholar] [CrossRef]
  18. Xiong, J.; Shi, S.Q.; Zhang, T.Y. Machine learning prediction of glass-forming ability in bulk metallic glasses. Comput. Mater. Sci. 2021, 192, 110362. [Google Scholar] [CrossRef]
  19. Xiong, J.; Shi, S.Q.; Zhang, T.Y. A machine-learning approach to predicting and understanding the properties of amorphous metallic alloys. Mater. Des. 2020, 187, 108378. [Google Scholar] [CrossRef]
  20. Xiong, J.; Zhang, T.Y. Data-driven glass-forming ability criterion for bulk amorphous metals with data augmentation. J. Mater. Sci. Technol. 2022, 121, 99–104. [Google Scholar] [CrossRef]
  21. Dasgupta, A.; Broderick, S.; Mack, C.; Urala Kota, B.; Subramanian, R.; Setlur, S.; Govindaraju, V.; Rajan, K. Probabilistic Assessment of Glass Forming Ability Rules for Metallic Glasses Aided by Automated Analysis of Phase Diagrams. Sci. Rep. 2019, 9, 357. [Google Scholar] [CrossRef]
  22. Lukas, H.; Fries, S.G.; Sundman, B. Computational Thermodynamics: The Calphad Method; Cambridge University Press: Cambridge, UK, 2007. [Google Scholar]
  23. ThermoCalc. ThermoCalc Website. 2023. Available online: https://thermocalc.com/ (accessed on 25 November 2024).
  24. Tynes, M.; Gao, W.; Burrill, D.J.; Batista, E.R.; Perez, D.; Yang, P.; Lubbers, N. Pairwise Difference Regression: A Machine Learning Meta-algorithm for Improved Prediction and Uncertainty Quantification in Chemical Search. J. Chem. Inf. Model. 2021, 61, 3846–3857. [Google Scholar] [CrossRef] [PubMed]
  25. Andersson, J.O.; Helander, T.; Höglund, L.; Shi, P.; Sundman, B. Thermo-Calc & DICTRA, computational tools for materials science. Calphad 2002, 26, 273–312. [Google Scholar] [CrossRef]
  26. Bocklund, B.; Otis, R.; Egorov, A.; Obaied, A.; Roslyakova, I.; Liu, Z. ESPEI for efficient thermodynamic database development, modification, and uncertainty quantification: Application to Cu–Mg. MRS Commun. 2019, 9, 618–627. [Google Scholar] [CrossRef]
  27. Ward, L.; Agrawal, A.; Choudhary, A.; Wolverton, C. A General-Purpose Machine Learning Framework for Predicting Properties of Inorganic Materials. npj Comput. Mater. 2016, 2, 16028. [Google Scholar] [CrossRef]
  28. James, G.; Witten, D.; Hastie, T.; Tibshirani, R.; Taylor, J. Classification, Regression. In An Introduction to Statistical Learning: With Applications in Python; Springer: Berlin/Heidelberg, Germany, 2023. [Google Scholar]
  29. Pedregosa, F.; Varoquaux, G.; Gramfort, A.; Michel, V.; Thirion, B.; Grisel, O.; Blondel, M.; Müller, A.; Nothman, J.; Louppe, G.; et al. Scikit-learn: Machine Learning in Python. arXiv 2018, arXiv:1201.0490. [Google Scholar] [CrossRef]
  30. Chen, T.; Guestrin, C. XGBoost: A Scalable Tree Boosting System. In Proceedings of the 22nd ACM SIGKDD International Conference on Knowledge Discovery and Data Mining, KDD ’16, San Francisco, CA, USA, 13–17 August 2016; pp. 785–794. [Google Scholar] [CrossRef]
  31. Lundberg, S.M.; Lee, S.I. A Unified Approach to Interpreting Model Predictions. In Advances in Neural Information Processing Systems 30; Guyon, I., Luxburg, U.V., Bengio, S., Wallach, H., Fergus, R., Vishwanathan, S., Garnett, R., Eds.; Curran Associates Inc.: New York, NY, USA, 2017; pp. 4765–4774. [Google Scholar]
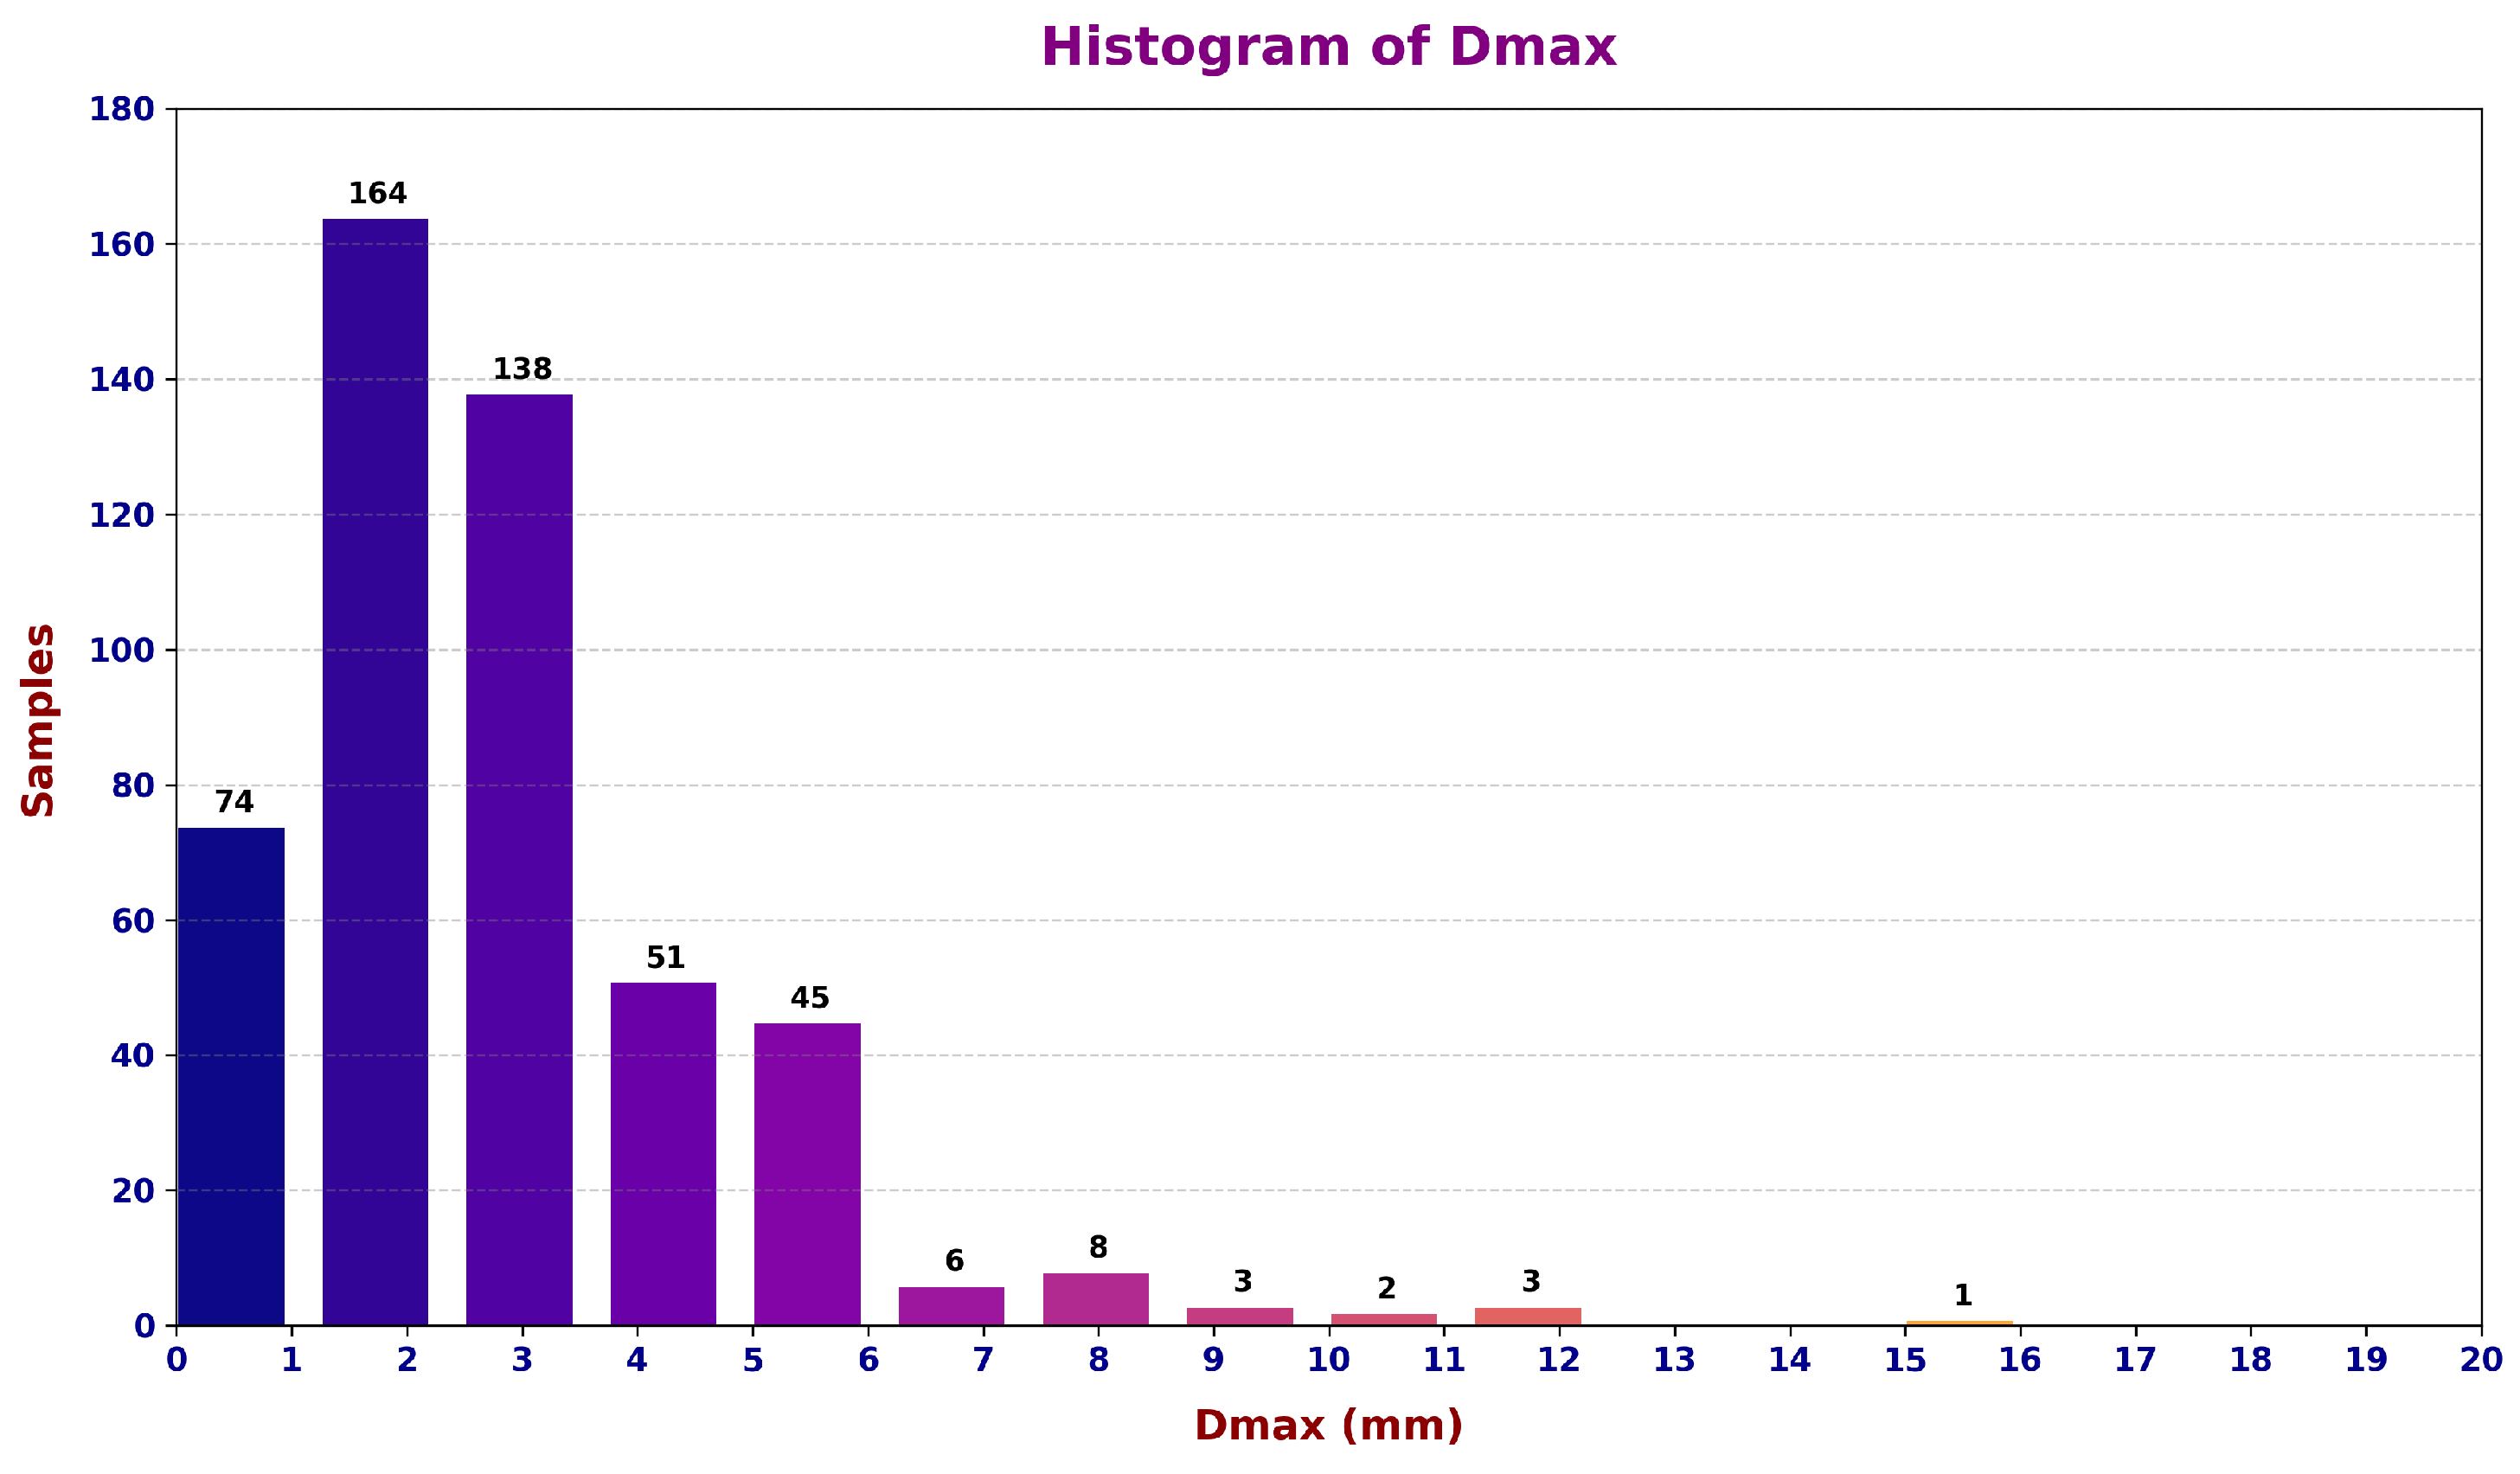
Figure 1. Distribution of D m a x values in the datasets.
Metals 15 00763 g001
Figure 2. Count plot showing the presence of a particular element in the alloys included in the datasets.
Metals 15 00763 g002
Figure 3. Schematic representation of the ML pipeline adopted in this work.
Metals 15 00763 g003
Figure 4. Predicted vs. actual values plot with a Support Vector Regressor applied to molar compositions.
Metals 15 00763 g004
Figure 5. Predicted vs. actual values plot with a Support Vector Regressor applied to thermophysical features.
Metals 15 00763 g005
Figure 6. Top ten SHAP features importance values on the best model (SVM) trained with compositional features (DS1 dataset).
Metals 15 00763 g006
Figure 7. Heatmap (correlation matrix) for dataset DS1.
Metals 15 00763 g007
Figure 8. Top ten SHAP features importance values on the best model (SVM) trained with thermophysical features (DS2 dataset). The meaning of each symbol is detailed in the Supplementary Materials.
Metals 15 00763 g008
Figure 9. Heatmap (correlation matrix) for dataset DS2.
Metals 15 00763 g009
Figure 10. Top ten SHAP features importance values on the best model (XGBoost) trained with Magpie features (DS3 dataset). The meaning of each symbol is detailed in the Supplementary Materials.
Metals 15 00763 g010
Figure 11. Predicted vs actual values plot obtained from an ensemble between SVR, XGBoost trained on magpie features, and SVR, XGBoost trained on thermophysical features.
Metals 15 00763 g011
Table 1. Predictive power ( R 2 and MAE scores on the test sets) obtained when training different ML models using compositional (DS1) and thermophysical features. Scores have been obtained with a 10-fold cross validation.
ML ModelTest R 2 ScoreTest MAE Score
Multiple Linear Regressor (DS1)0.181.18
Multiple Linear Regressor (DS2)0.241.13
Support Vector Regressor (DS1)0.540.81
Support Vector Regressor (DS2)0.630.72
XGBoost (DS1)0.540.85
XGBoost (DS2)0.600.77
Table 2. Predictive power ( R 2 and MAE scores on the test sets) obtained from training using Magpie features (dataset DS3). Scores have been obtained with a 10-fold cross validation.
ModelTest R 2 ScoreTest MAE Score
RF0.610.79
GBRF0.620.76
XGBoost0.650.73
Support Vector Regressor0.580.79
Table 3. Predictive power ( R 2 and MAE scores on the test sets) obtained training different ensemble models. Scores have been obtained with a 10-fold cross validation.
Ensemble Models Results
Ensemble Test R 2 Score Test MAE Score
MLR(DS1) + XGB(DS1)0.520.89
MLR(DS2) + XGB(DS2)0.520.88
SVR(DS1) + XGB(DS1)0.620.75
SVR(DS2) + XGB(DS2)0.670.70
XGB(DS1) + XGB(DS2)0.650.75
SVR(DS1) + XGB(DS1) +
SVR(DS2) + XGB(DS2)0.680.69
SVR(DS3) + XGB(DS3) +
SVR(DS2) + XGB(DS2)0.690.69
Table 4. A comparison of the predictive power ( R 2 score on the test sets) obtained in this work and in literature works.
Test R 2 ScoreNotesSource
0.79a posteriori approach, including ribbon samples, large dataset[12]
0.64a posteriori approach, only BMGs samples, large dataset[12]
0.64a posteriori approach[14]
0.95a posteriori approach[15]
0.68a priori approach, best ensemble methodthis work
0.63a priori approach, best single modelthis work
0.64a priori approach[19]
0.71a priori approach, ensemble method[17]
0.76a priori approach, data augmentation[20]
Table 5. R 2 and MAE scores obtained with the XGBoost model trained on different augmented datasets (DSA1 and DSA2 obtained with PADRE and DSA1-2 and DSA2-2 obtained with PADRE-2). Scores are obtained with a 10-fold cross validation.
DatasetTest R 2 ScoreTest MAE Score
DSA10.540.85
DSA20.590.78
DSA1-20.580.76
DSA2-20.660.72
Disclaimer/Publisher’s Note: The statements, opinions and data contained in all publications are solely those of the individual author(s) and contributor(s) and not of MDPI and/or the editor(s). MDPI and/or the editor(s) disclaim responsibility for any injury to people or property resulting from any ideas, methods, instructions or products referred to in the content.