Article

Activity and Operational Loss of IrO2-Ta2O5/Ti Anodes During Oxygen Evolution in Acidic Solutions

by
Jovana Bošnjaković
1,
Maja Stevanović
2,
Marija Mihailović
1,*,
Vojin M. Tadić
3,
Jasmina Stevanović
1,
Vladimir Panić
1,4 and
Gavrilo Šekularac
1
1
Institute of Chemistry, Technology and Metallurgy, National Institute of the Republic of Serbia, University of Belgrade, Njegoševa 12, 11000 Belgrade, Serbia
2
Innovation Center of the Faculty of Technology and Metallurgy, Karnegijeva 4, 11000 Belgrade, Serbia
3
Electrical Power Supply Company of Serbia, Carice Milice 2, 11000 Belgrade, Serbia
4
Department of Natural and Mathematical Science, State University of Novi Pazar, 36300 Novi Pazar, Serbia
*
Author to whom correspondence should be addressed.
Metals 2025, 15(7), 721; https://doi.org/10.3390/met15070721
Submission received: 29 May 2025 / Revised: 19 June 2025 / Accepted: 23 June 2025 / Published: 27 June 2025

Abstract

The oxygen-evolving IrO2-Ta2O5/Ti anode (OEA), primarily used in electrolyzers for plating, metal powder production, electrowinning (EW), and water electrolysis, is analyzed. This study focuses on the distribution of oxygen evolution reaction (OER) activity and the associated operational loss over the randomized OEA texture. The OER activity and its distribution across the IrO2-Ta2O5 coating surface are key factors that influence EW operational challenges and the lifecycle of OEA in EW processes. To understand the OER activity distribution over the coating’s randomized texture, we performed analyses using anode polarization in acid solution at both low and high (EW operation relevant) overpotentials and electrochemical impedance spectroscopy (EIS) during the OER. These measurements were conducted on anodes in both their as-prepared and deactivated states. The as-prepared anode was deactivated using an accelerated stability test in an acid solution, the EW simulating electrolyte. The obtained data are correlated with fundamental electrochemical properties of OEA, such as structure-related pseudocapacitive responses at open circuit potential in the same operating environment. OER and Ir dissolution kinetics, along with the physicochemical anode state upon deactivation, are clearly characterized based on current and potential dependent charge transfer resistances and associated double layer capacitances obtained by EIS. This approach presents a useful tool for elucidating, and consequently tailoring and predicting, anode OER activity and electrolytic operational stability in industrial electrochemical applications.

1. Introduction

Anodes with oxide-based coatings, which are electroactive for the oxygen evolution reaction (OER), are crucial components in various electrochemical technologies, including wastewater treatment, water electrolysis for clean energy storage, and regenerative fuel cells [1,2,3,4,5]. This is because the OER is a kinetically slow process, significantly limiting energy conversion efficiency [5,6,7,8].
To overcome this, mixed metal oxides, typically combining noble and transition metal oxides, are widely employed to enhance electrochemical properties and reduce costs. Iridium dioxide (IrO2) stands out as the most active electrocatalyst for OER [9], with ruthenium dioxide (RuO2) also being highly active but less stable [1]. Various IrO2- and RuO2-based mixed oxides (e.g., IrO2-TiO2/Ti, RuO2-ZrO2/Ti, etc. [1]) have been explored. Although strategies like mixing RuO2 with SnO2 or Sb2O5 have shown improved lifetimes [7,8,9,10,11,12,13], the inherent stability advantage of IrO2-based anodes remains significant. IrO2-based anodes have demonstrated lifetimes approximately 20 times longer than RuO2-based counterparts in acidic environments [14,15]. Among IrO2-based systems, IrO2-Ta2O5/Ti anodes, particularly with a 70 mol% Ir and 30 mol% Ta mole ratio, have proven to be exceptionally effective for OER [15,16,17]. In this coating, IrO2 primarily provides the electrocatalytic activity [15], while Ta2O5 is crucial for enhancing both stability and electrocatalytic performance [16,18].
Despite recognized advantages, continuous efforts are needed to reduce the high Ir content in the coatings through innovative synthesis and application approaches. To guide these developments towards clear benefits, a comprehensive understanding of the influence of anode texture and composition uniformity on OER activity and anode operational stability is crucial. Our previous work [19] demonstrated that a thorough analysis of anode electrochemical responses at open circuit potential (OCP), in both active and deactivated states, can establish correlations between coating structure-induced properties and anode service life. However, these correlations require confirmation under actual OER conditions, where side processes apparently might occur as well.
To bridge this gap between OCP (pure electrochemically structural) behavior and anode OER performance (kinetic response), the present study introduces an approach by systematically analyzing the Tafel slopes of IrO2-Ta2O5/Ti anodes over a systematic ohmic drop elucidation, allowing for a clearer kinetic interpretation across various overpotential regions. We suppose that the characteristic Tafel slope observed in the anode’s deactivated state can be correlated to that found for the active state at higher overpotentials. An attempt to focus uniquely on distinguishing the kinetic contributions of OER and the parallel electrochemical Ir dissolution at high anodic potential, as a critical factor for anode deactivation, is demonstrated. Through detailed electrochemical impedance spectroscopy (EIS) analysis, we further differentiate the interplay of charge transfer and interlayer processes, proposing clear assignments for OER and iridium dissolution kinetics based on current- and potential-dependent resistances and capacitances. By correlating these findings with pseudocapacitive responses, we provide a deeper understanding of the physicochemical change-driven operational loss of the anode. Finally, we believe this research proposes a robust analytical framework for elucidating and predicting the operational stability and OER activity of OER anodes, thus offering valuable insights for the design of more durable and efficient catalytic coatings. For a comprehensive visual overview of our research methodology and to contextualize the present study within our broader research efforts, Scheme 1 schematically illustrates the distinct focus and experimental approaches employed, particularly in comparison to our earlier work [19].
A schematic of the experimental approach applied in the present and previous study is shown [19]. The segment “Anode fabrication” gives the steps related to Ti substrate preparation, coating precursor application by drop casting, and coating formation by dried layer calcinations. The appearance of an etched and coated sample is also presented with corresponding steps. In the lower segment, the coating performance analysis under faradaic and non-faradaic conditions (the latter applied in the previous study [19]) in characteristic electrochemical cell set-up is presented. The same cell set-up is used for non-faradaic, faradaic, and deactivation experiments. WE is positioned horizontally at the bottom of the cell to allow free gravitational exhaustion of evolving oxygen from the anode surface.

2. Materials and Methods

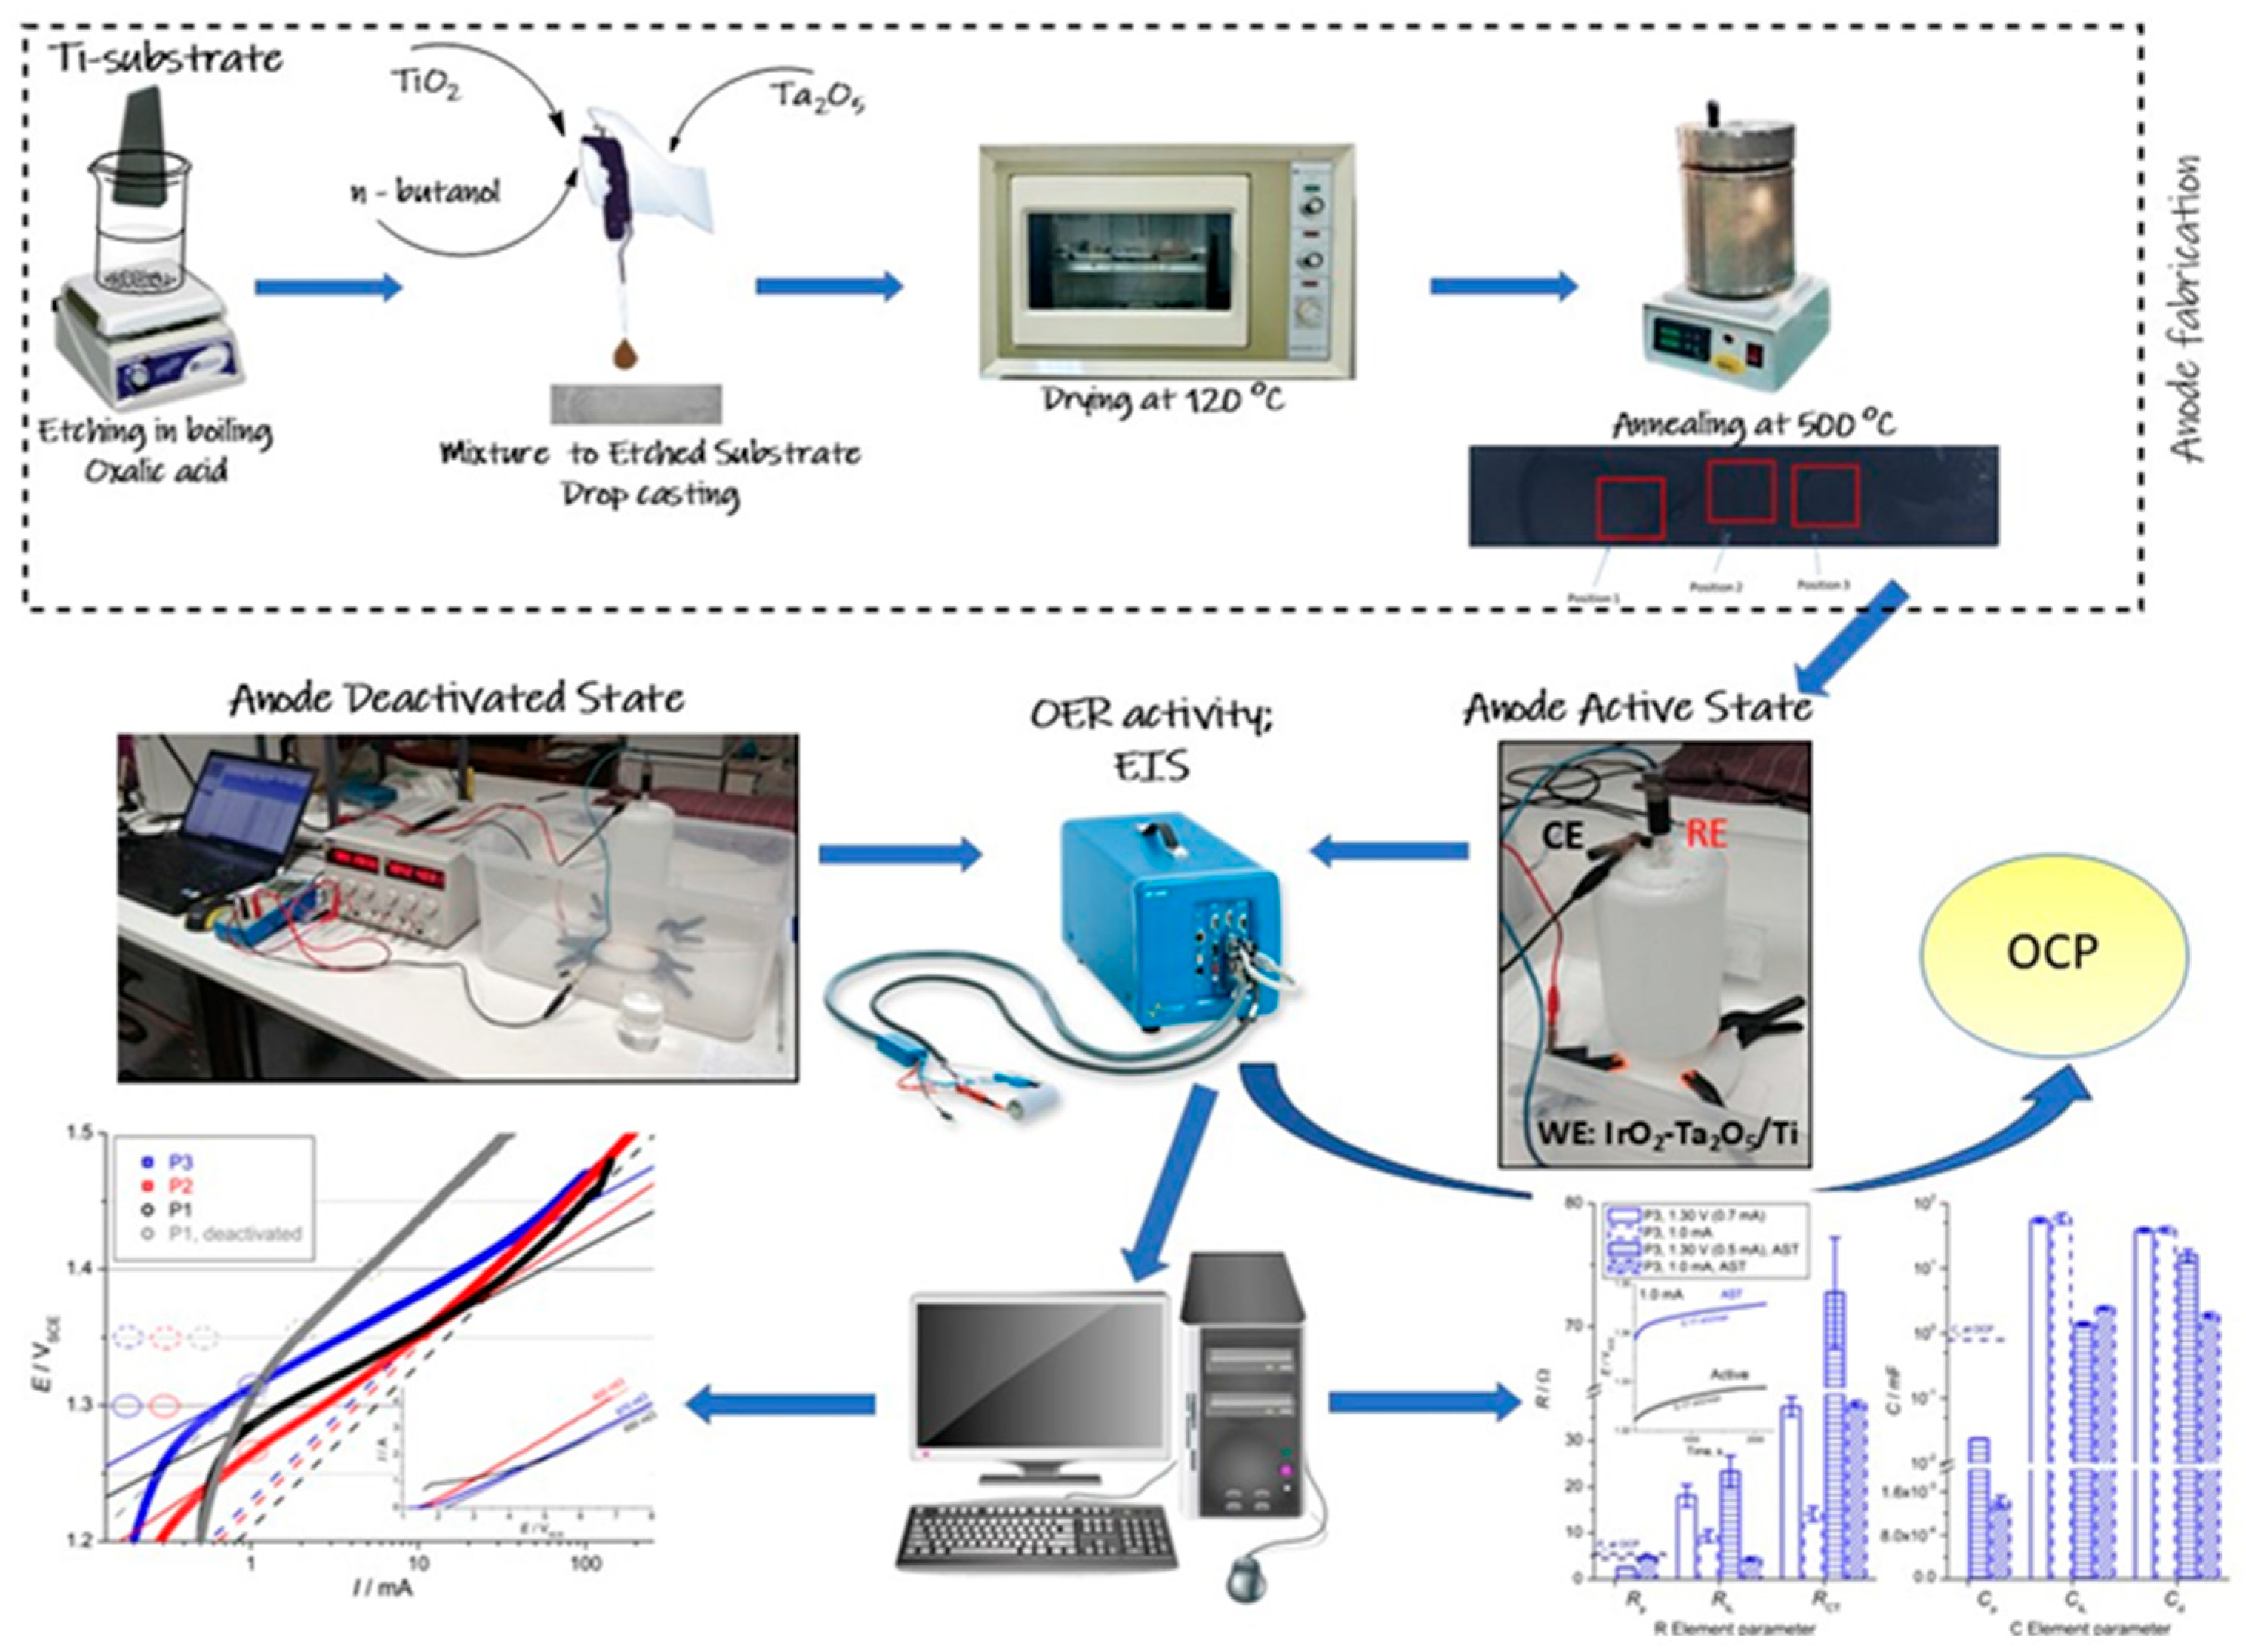
2.1. Electrode Preparation

IrO2-Ta2O5/Ti anodes with a molar ratio of Ir:Ta = 70:30 were synthesized using a conventional thermal decomposition method [20,21]. Prior to coating, industrial titanium plates were sandblasted and subsequently cleaned with acetone (for analysis EMSURE® ACS, ISO, Reag. Ph Eur, Supelco, Merck, Kenilworth, NJ, USA) and deionized water (18 MΩ, Merck Millipore, Burlington, MA, USA). To remove the spontaneously formed TiO2 layer and to achieve a uniformly rough surface, the titanium substrates were etched in a 10% boiling oxalic acid solution (ACS reagent grade 99%, Sigma Aldrich, St. Louis, MO, USA).
The coating precursor was prepared by dissolving H2IrCl6 × H2O (36.0–44.0% Ir, Sigma Aldrich, St. Louis, MO, USA) and TaCl5 (reagent grade 99%, Sigma Aldrich, St. Louis, MO, USA) in n-butanol in the desired molar ratio. The resulting solution was applied onto the Ti substrate using a drop-casting technique in four successive layers, with each layer containing approximately 22.3 mg of active material (totals of 56 mg of IrO2 and 33 mg of Ta2O5 were applied). Each layer was initially dried at 50 °C for 5 min, followed by an additional drying step at 100 °C for another 5 min. After drying, the layers were annealed at 500 °C for 15 min. The final calcination step was carried out at 500 °C for 2 h in an oven. The total oxide loading on the substrate was targeted at 1 mg/cm2.

2.2. Electrochemical Measurements

The electrochemical performance of the IrO2-Ta2O5/Ti anode toward the oxygen evolution reaction (OER) was evaluated at three randomly selected surface positions (P1–P3) using potentiodynamic measurements, electrochemical impedance spectroscopy (EIS), and an accelerated stability test (AST). These analyses were conducted to assess the OER behavior in both the fresh (as-prepared) and deactivated (post-AST) states. All experiments were carried out in a 10% H2SO4 solution using a high-density polyethylene electrochemical cell and a Biologic VSP SP-240 potentiostat (Biologic, Seyssinet-Pariset, France) equipped with a high-current booster.
A standard three-electrode setup was employed, consisting of a platinum wire as the counter electrode (CE), a saturated calomel electrode (SCE) as the reference, and the prepared IrO2-Ta2O5/Ti anode as the working electrode. The SCE scale was referenced for all reported potentials.
To evaluate the spatial distribution of OER activity, polarization curves were recorded quasi-stationarily at a scan rate of 5 mV/s in both high and low overpotential regions, while EIS measurements were performed in both potentiostatic (PEIS) and galvanostatic (GEIS) modes. Measurements were conducted at 1.30 or 1.35 V (for PEIS) and at constant currents of 1, 2, or 5 mA (for GEIS), using sinusoidal perturbations of 10 mV or current amplitudes of 100 or 500 μA, respectively, over a frequency range from 1 MHz to 10 mHz.
The accelerated stability test (AST) was carried out at current densities of 2.0 or 3.0 A/cm2 and temperatures between 50 and 60 °C. The cell voltage was continuously monitored. The end of service life was defined as the point at which the anode potential increased by 50% relative to the initial value of approximately 6.5 V. Under these test conditions, the anode exhibited a service life of approximately 100 h at all examined positions.

2.3. Taffel Slope

Based on the obtained results of anodic polarization experiments up to extreme currents of the concern of anode operation and AST, the Tafel slopes and ohmic drops at low, high, and extremely high over-voltages were gained and analyzed. True electrode potential can be calculated from the measured value, Emeas, by taking into account the ohmic drop due to potential independent resistance, RS, according to the following [22,23,24,25]:
E = EmeasIRS
where I is E-dependent OER faradaic current. Ohmic drop-corrected kinetic parameters can be obtained according to the Taffel formula, based on the values obtained for E, as follows [26]:
E = a + blogI
where a is an intercept of a Tafel line, and b is the slope.
The values for b were obtained by linear fitting of the dependence curve between E and logI within Origin 6.1 software. The polarization parameters are correlated to those gained by fitting the EIS data collected at low and moderate OER overpotentials. The fitting was performed by finding the appropriate equivalent electrical circuits of a suitable combination of resistors and capacitor-related elements, which reliably describes the anode EIS response with the appropriate assignment of the physicochemical meaning of electrical elements and their circuit conformation. The fitting procedure was performed in Z-View of Scribner Associates software, demo ver. 3.2.

3. Results and Discussion

Figure 1 presents the OER polarization characteristics of the anode at different surface positions, which are based on the data reported in the previous paper [19], with additional data extended up to overpotentials relevant for OEA operation and electrolytic stability testing (inset of Figure 1). The main feature of the polarization at low to moderate overpotentials—the switch of the Tafel slope to its near doubled value—is analyzed here by fixing the ohmic drop correction of the polarization data to the value that produces the slope of 120 mV at the anodic potentials > 1.42 V; in the previous paper [19], it was performed arbitrarily, and the corresponding Tafel slope ranged from 99 to 127 mV. For an illustration, the polarization data at position P1 are given for its deactivated state upon electrolytic stability testing by an accelerated stability test (AST) as well; the other two positions, P2 and P3, show similar features in their deactivated state [19]. The present approach to polarization data aims to consider the possibility that the unique Tafel slope in the deactivated state corresponds to the slope found for the active (as-prepared) state at higher overpotentials, and both stand near 120 mV. The doubling of the slope in an active state with respect to a low overpotential region was commented on in the previous paper by considering the contribution of the porous structure of the anode coating. The analysis was based on the electrochemical responses at the open circuit potential to prove their apparent relationship to OER activity. For this analysis to be posed as a rule, it should also fit to the electrochemical properties at the potentials at which the OER takes part. This involves the consideration of the following two kinetic issues: (i) the switch of the rate-determining step in the OER mechanism, which is proposed as the cause of the switch of the slope [27]: the r-d step switch is usually from dissociative adsorption with charge transfer at low overpotentials to the recombination of intermediates at high overpotentials ( it should be noted that there is no clear consensus about the complicated 4-electron OER mechanism); (ii) the onset of pH-dependent electrochemical dissolution of Ir species, which is found to take part in parallel to the considerable rate and exchanged mechanism as well, at the potentials above ca. 1.6 VSCE [28,29,30]. The kinetics of Ir dissolution, which were the cause of anode deactivation, were found dependent on the state of Ir oxide [31], whereas the slope of the electrochemical dissolution of noble metal oxides in general was reported to be close to 120 mV and to share intermediates with OER [29,30,31,32,33]. It follows that the slope at high overpotentials should be considered as the interplay value of the two processes in parallel—OER and Ir dissolution—although the latter is of an appreciable lower rate.
Iridium dioxide (IrO2) is indeed the primary electrocatalytically active component responsible for the activity of the oxygen evolution reaction (OER) on these mixed oxide anodes. Its excellent activity and relatively good stability in acidic environments make it one of the most effective OER catalysts.
The role of IrO2 in our anode system can be understood in the following key aspects:
  • Active sites for OER: IrO2 provides the necessary active sites where the electrochemical oxidation of water to oxygen occurs. The number and accessibility of these active sites directly correlate with the anode’s OER activity, as evidenced by our voltammetry capacitance measurements (as discussed in relation to our previous work [19]), which are proportional to the electrochemically active surface area (ECSA).
  • Pseudocapacitive behavior: The IrO2 component is responsible for the characteristic pseudocapacitive behavior observed in our cyclic voltammetry (CV) and EIS measurements. The associated redox transitions (e.g., Ir(III)/Ir(IV)) are inherent to iridium oxide and contribute to its ability to participate in charge transfer processes. Roles 1 and 2 are intrinsically caused by a specific interaction between hydrated oxide moieties at the electrode surface and OH adsorbed from the water molecule. The interaction is also pH dependent.
  • Influence on morphology: Although we do not explicitly focus on the morphology of discrete IrO2 particles in this study, the overall structure of the mixed oxide coating is critical. The distribution, porosity, and connectivity of the IrO2 within the Ta2O5 matrix influence the effective surface area and mass transport properties, impacting overall OER efficiency.
  • Role in anode deactivation (iridium dissolution): Crucially, while being the active component, IrO2 is also susceptible to electrochemical dissolution, particularly regarding the high anodic potentials required for OER. This iridium dissolution takes place in parallel to OER.
  • Synergy with Ta2O5: The presence of Ta2O5 within the mixed oxide plays a vital role in stabilizing the IrO2 component, improving its dispersion, and mitigating the rate of iridium dissolution, but it also possibly affects the “spil-over” effect related to OER/Ir dissolution intermediates. This synergistic effect is essential for achieving the desired long-term durability of the anode.
IrO2 particles (as an integral part of the mixed oxide coating) are central to both the OER activity and the deactivation mechanisms of the anode. Our electrochemical analyses are designed to elucidate how the properties and state of this key component evolve under operational conditions.
Polarization to extremely high currents (Figure 1, inset) shows another characteristic of the ohmic-like linear current–potential relationship at the potentials above 2 V. The slopes indicate the resistances below 1 Ω, while position P2 maintains the highest activity from the low overpotential region. However, position P2 is of highest resistance in the extreme region. Table 1 presents the values of the ohmic drops required to set the slope in the high overpotential region to 120 mV (RS) and those gained from the fitting of potentiostatic (1.30 V and open circuit potential) impedance (PEIS) response (discussed in subsequent text) for the most (P2) and the least (P3) active positions. The latter (RS,PEIS) should be considered as a “true” ohmic drop since it is independent of potential. It is clear that RS is higher than RS,PEIS to different extents depending on surface position. It follows the activity order that shows the least active P3 is of the highest RS with the most pronounced difference from the RS,PEIS value. This suggests that RS can involve an additional resistance contribution of complex interplay of E-dependent OER and Ir dissolution charge transfer resistances. It is known that charge transfer resistance decreases with E. Hence, the RS reported is rather the mean value affected by OER and true ohmic drop.
The resistances connected to OER apparently tend to be limiting values at extreme polarizations, which are considerably lower than RS,PEIS and RS. It follows that resistance in extreme conditions is affected by ohmic drop only negligibly, being thus closely connected to OER-induced processes. Since the highest value is found for the most OER-active P2, it appears that it is mainly affected by Ir dissolution. Here, the activity is observed as high currents and not necessarily the low Tafel slope. Indeed, P2 has the highest Tafel slope at low overpotentials, but it is of the highest currents. It was reported that more OER-active Ir oxide suffers less from Ir dissolution [32], which should produce higher resistance at extreme polarizations, as shown in Figure 1.
To further analyze these suppositions, impedance measurements are performed in the potential region of OER. The activity response is checked by performing potentiostatic (PEIS) and galvanostatic (GEIS) measurements on active and deactivated states of anode surface positions at characteristic polarization points indicated by ellipses in Figure 1. Figure 2 presents the data of the most and the least active positions P2 and P3, whereas Figure 3 relates to a deactivated state of all positions. The insets in Figure 3 show the high-frequency features of complex plane plots related to the anode deactivated state. The appearance of the loops in complex planes reflects into Bode phase angle peaks at distinct frequencies. While PEIS loops show the apparent complex overlapping structure, GEIS loops appear much like semicircle dependencies. For both PEIS and GEIS responses, however, the extension of a simple circuit of capacitance and resistance in parallel was required to fit the impedance data and to reach the parameters of anode OER behavior. The equivalent electrical circuits are shown in Figure 4, whereas the circuit impedance responses are given in Figure 2 and Figure 3 by full or dashed lines. The inductive characteristics were observed in the high frequency region of PEIS measurements (shown for P3 as an illustration in Figure 3) and are not discussed since no significant dependence of the inductance on the surface position and potential were found. The circuits for GEIS responses are the same, with inductive elements excluded.
The inspection of the plots in Figure 2 leads to the conclusion that the differences between positions initially recognized as the most and the least active (Figure 1) are only negligible. Either PEIS or GEIS loops are of similar dimensions, where the most pronounced difference in maximally reached impedance is by ca. 30% higher for less active position P3. A cause for the absence of clear differences in impedance measurements is related to the continuous loss of activity, as it is illustrated later by the chronopotentiometry insets in Figure 5, Figure 6 and Figure 7, and to the finding that these two positions reach similar activity around 1.45 V (Figure 1). This becomes important if the time scale of polarization and impedance measurements are considered; the former is performed quasi-stationary, while the latter takes nearly half an hour for a stationary measurement.
Figure 4 illustrates that P2 and P3 impedance responses in an active state can be described at last by the two capacitor/resistor combinations in parallel, which are arranged in a series. In some cases, a constant phase element, Qd, better describes the response than the capacitor. The capacitance values were calculated according to the usual procedure (exponential Qd parameter was above 0.72) [34]. One of the combinations in parallel represents the charge transfer (CT) processes [35,36], whereas the other is colloquially assigned to the response of a coating interlayer (IL) just to keep in mind the in-depth distributed morphology of the active oxide coating discussed in the previous paper [19]. Nevertheless, both CT and IL elements can contain different charge transfer contributions. OER and Ir dissolutions share the same intermediate(s), and Ir dissolution takes place in parallel to OER since it requires an intermediate from the OER. Different processes could proceed by different rates at different surfaces if the coating composition and texture were distributed, which makes the strict assignment of the circuit elements to a particular process hard to release.
The presence of the charge transfer arcs, since they relate to polarization to the OER Tafel region, in our complex plane plots, is characteristic of charge transfer processes at the electrode/electrolyte interface, coupled with double layer phenomena originating from the mixed oxide coating. Specifically, these arcs can be attributed to the following key electrochemical processes:
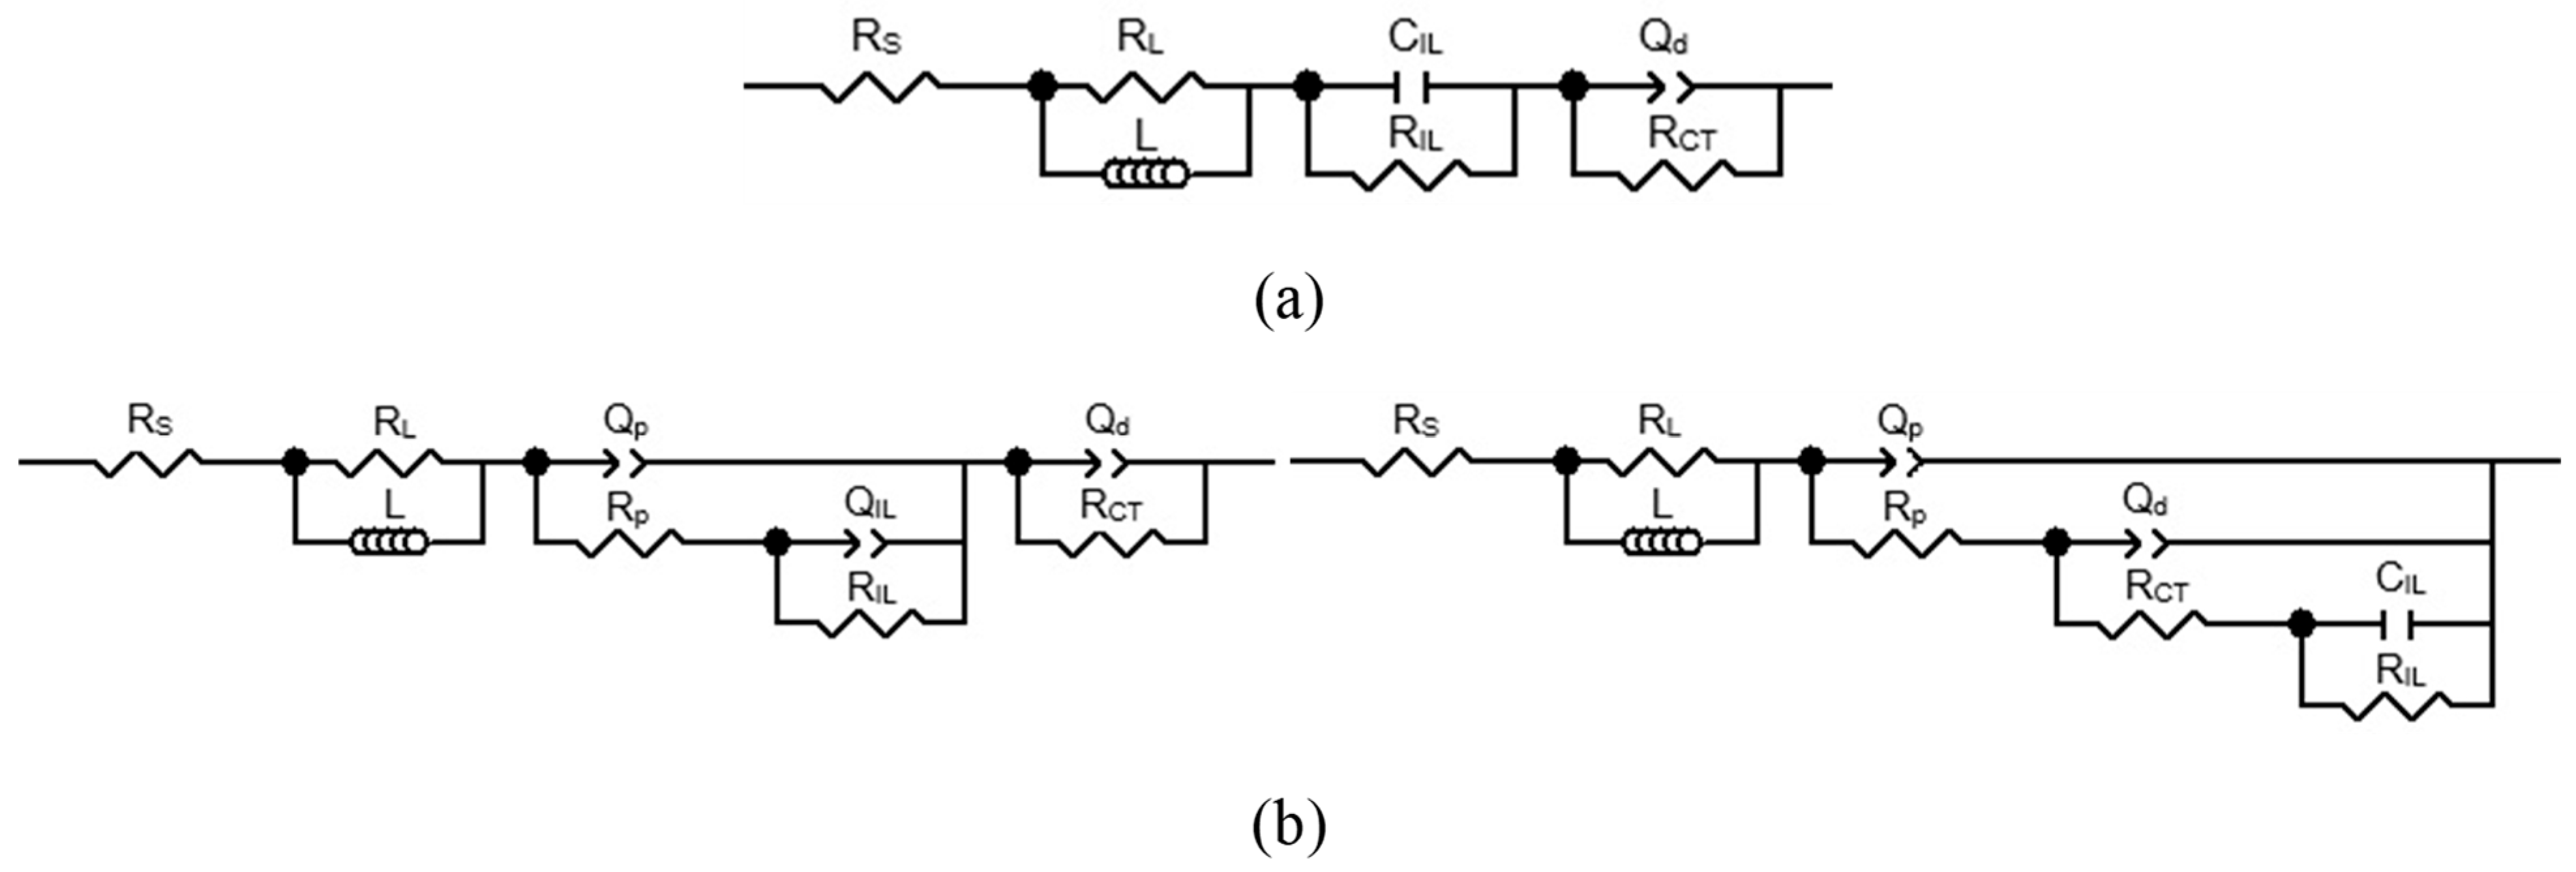
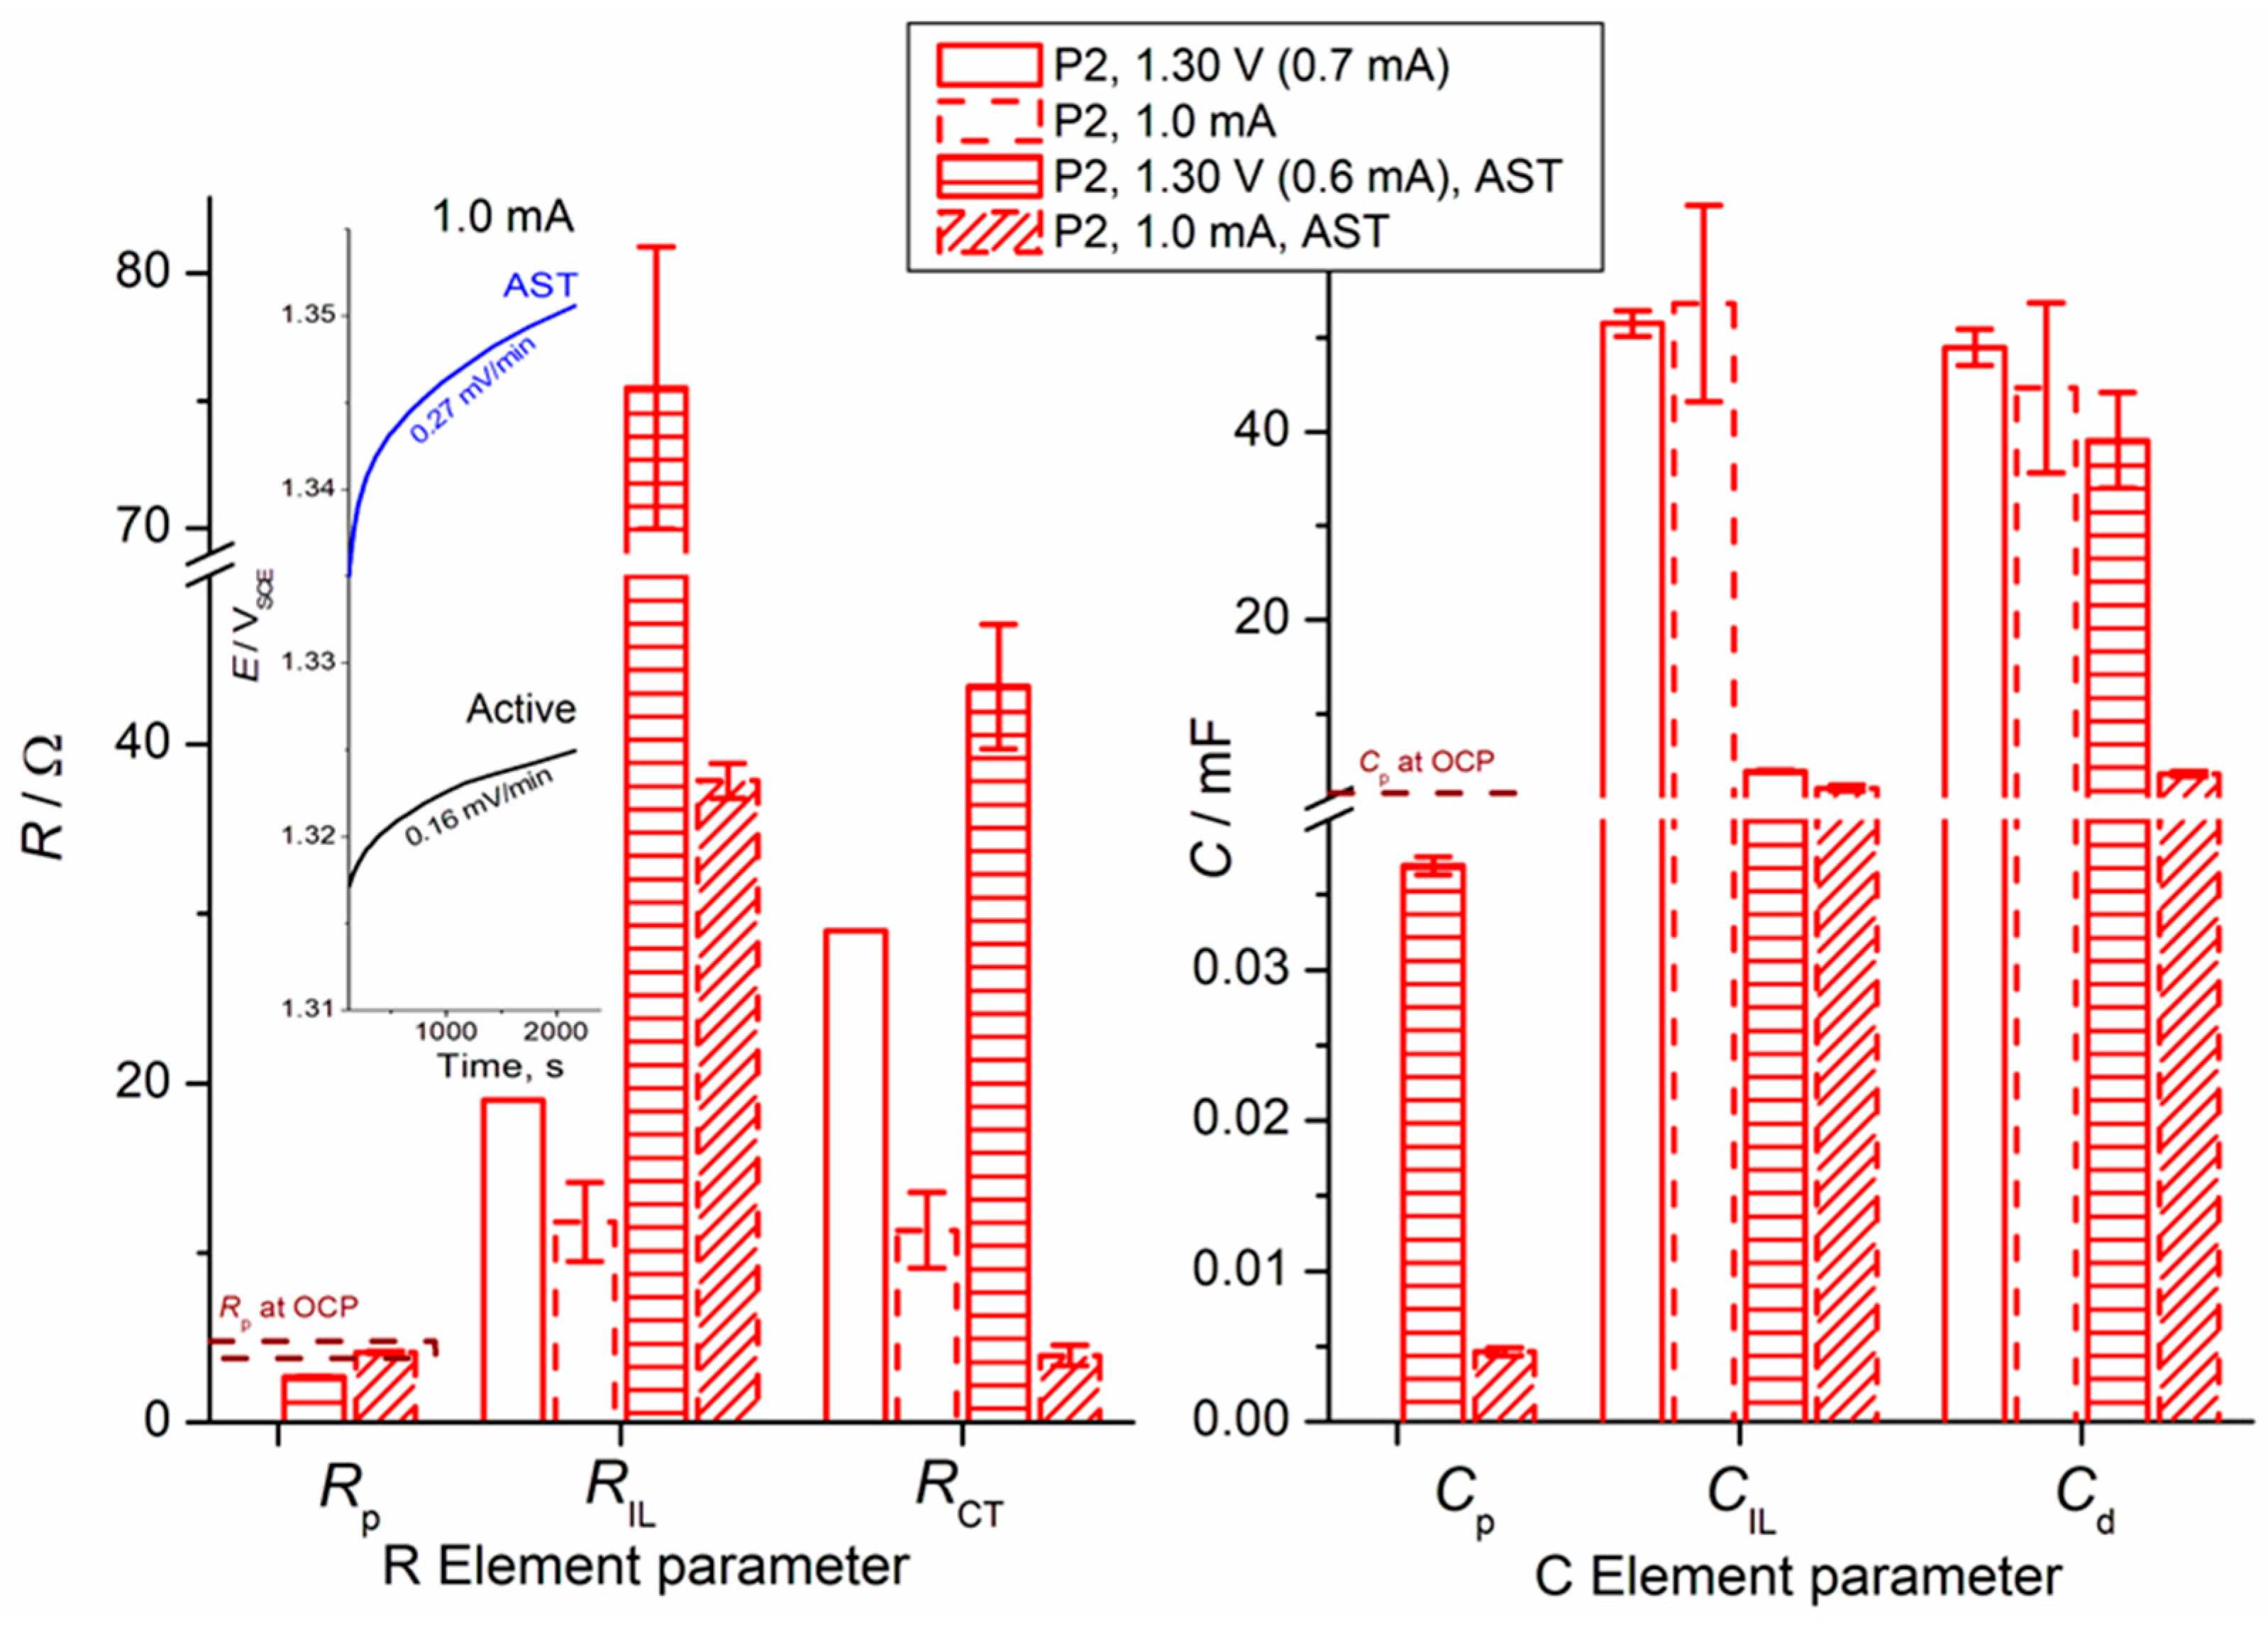
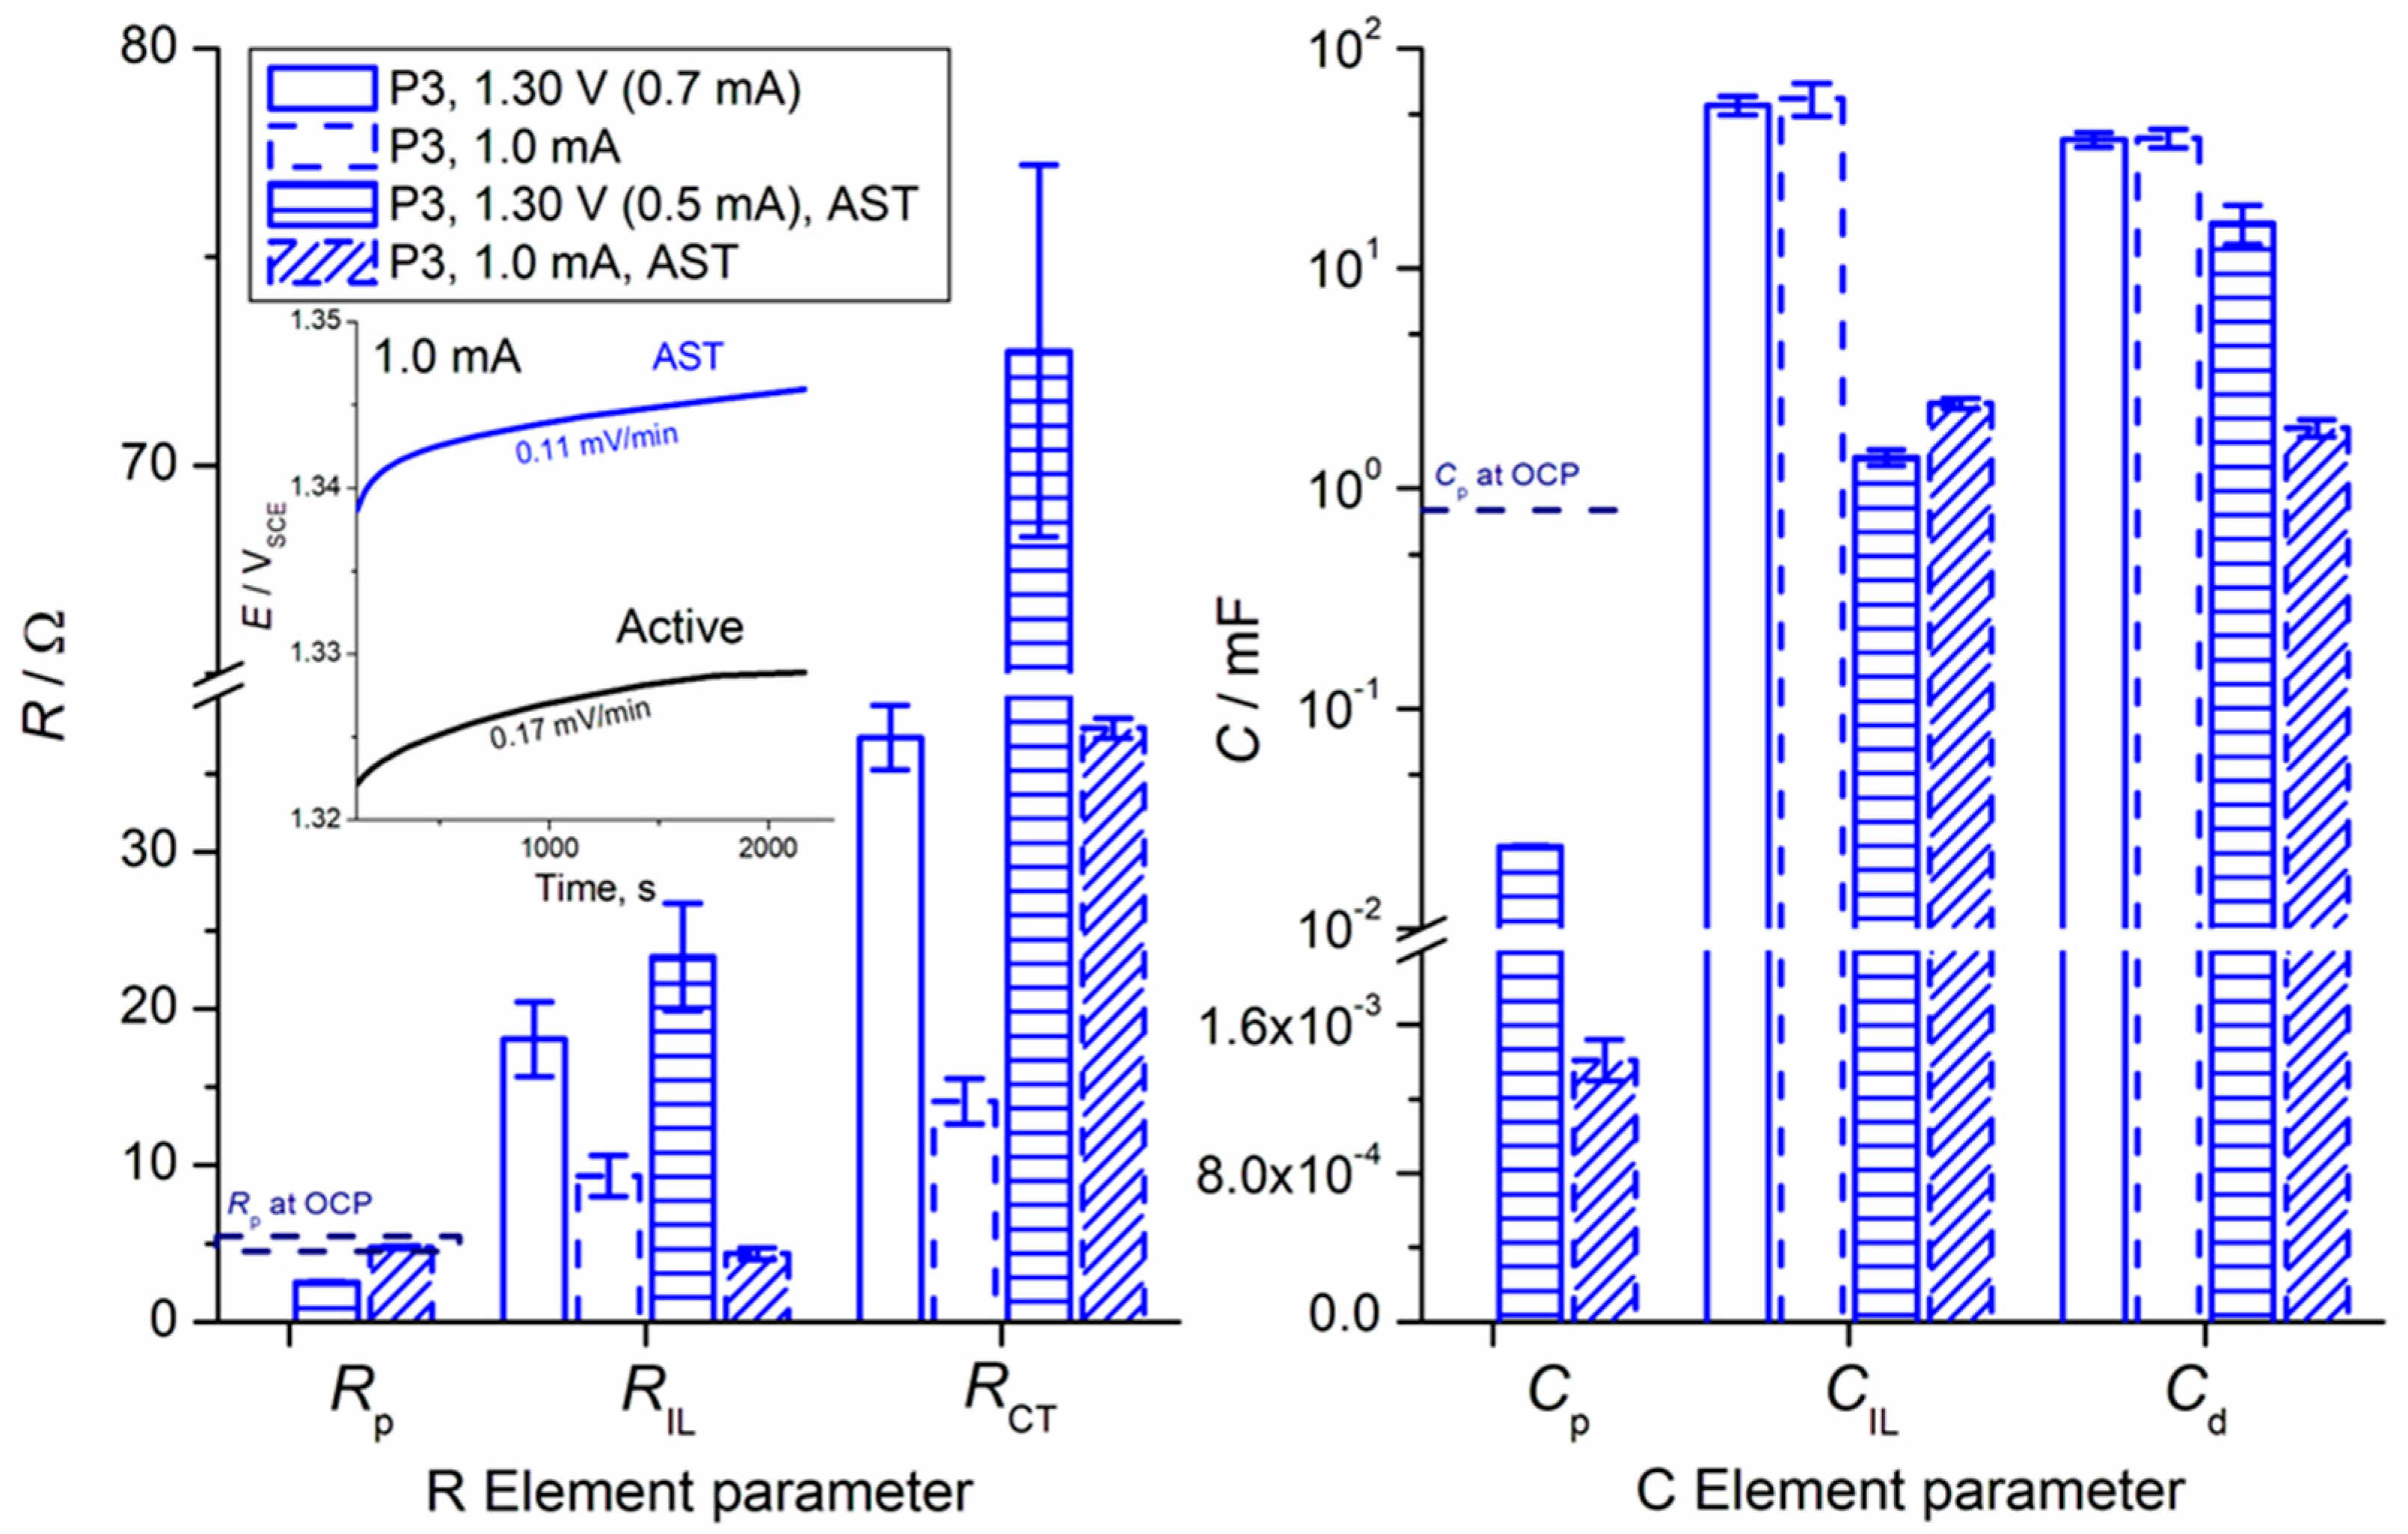
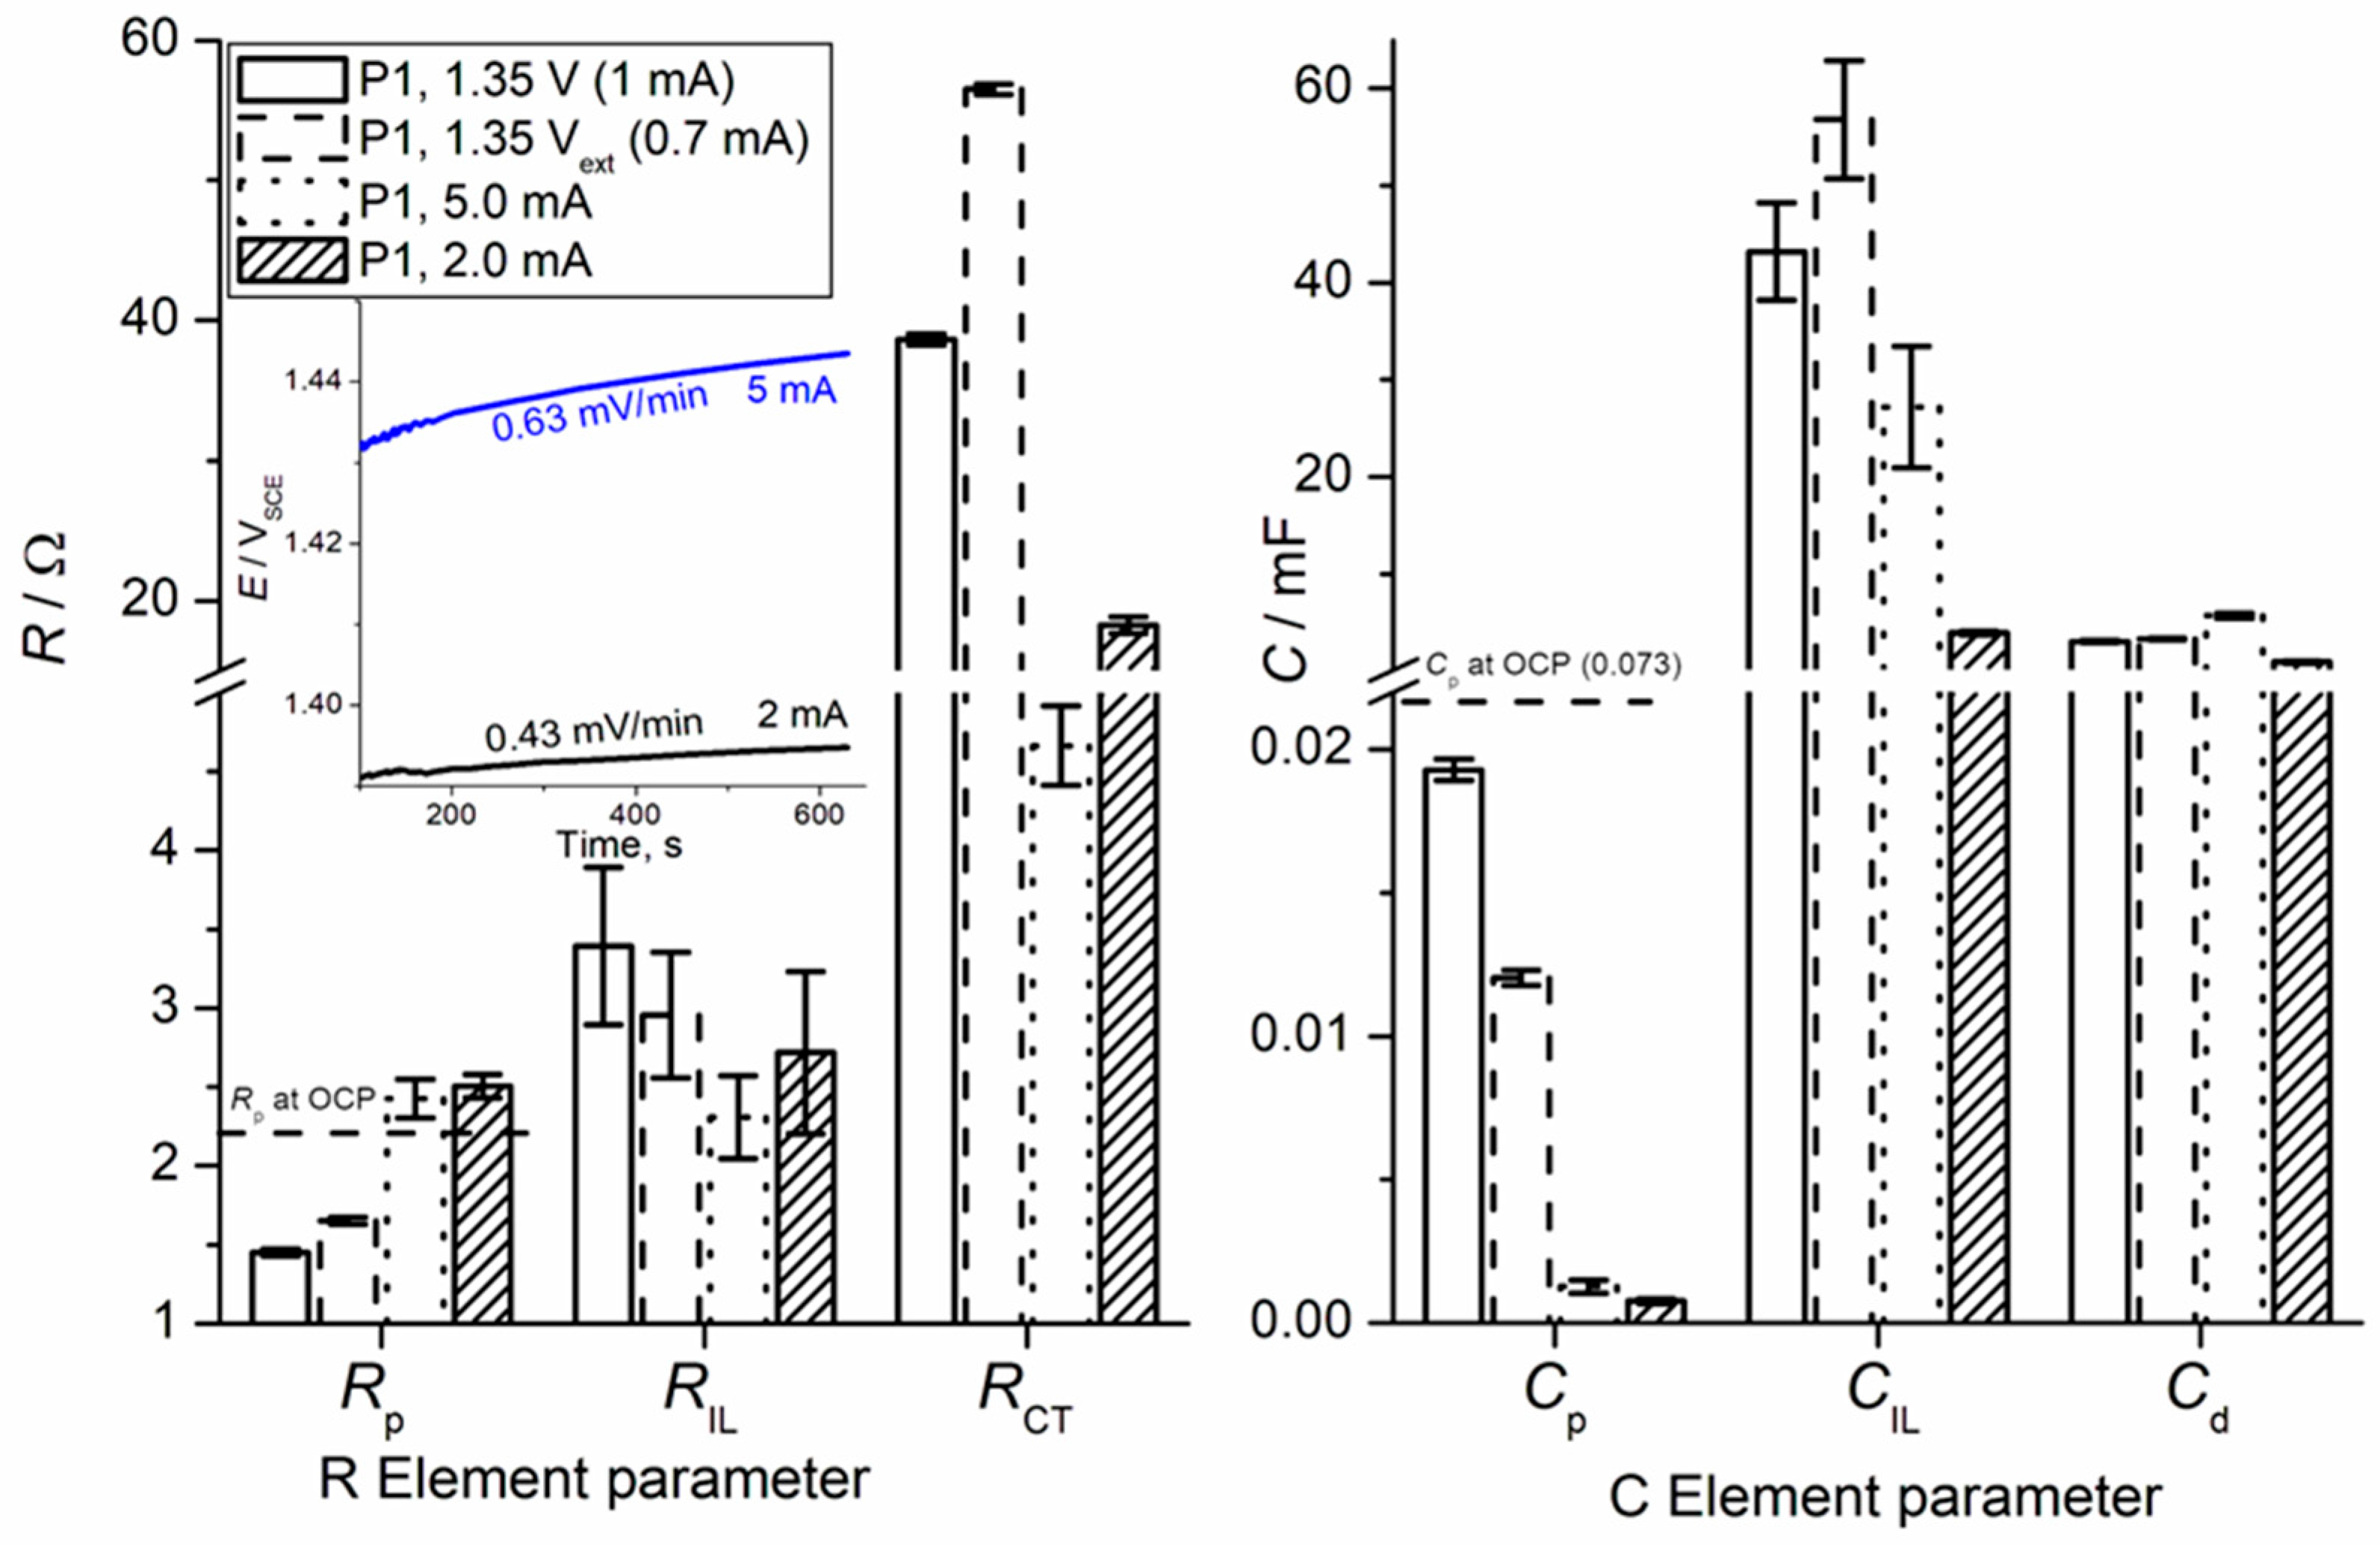
  • Charge Transfer (CT) Processes: The primary charge transfer arc (represented by RCT and Cd elements in our equivalent electrical circuit, Figure 4) is directly associated with the oxygen evolution reaction (OER). The diameter of this arc in the Nyquist plot is proportional to the charge transfer resistance, reflecting the ease with which electrons are transferred across the interface during the OER.
  • EIS Response and Interlayer Processes: Given the nature of noble metal oxides like IrO2, the coating exhibits additional behavior, arising from Ir dissolution upon polarization. The observed elements (including CIL associated with RIL) reflect the charge transfer characteristics within the distributed morphology of an internal interface of the active IrO2-Ta2O5 coating. The assignment of the ‘interlayer’ (IL) element refers to the response within this complex porous oxide structure, not a separate physical layer.
  • Parallel Processes: As discussed in our manuscript, the OER occurs in parallel with the electrochemical dissolution of iridium (Ir dissolution), particularly at higher potentials. Both these faradaic processes contribute to the overall charge transfer resistance and thus influence the shape and magnitude of the observed arcs. The interplay between these processes defines the overall electrochemical response observed in EIS.
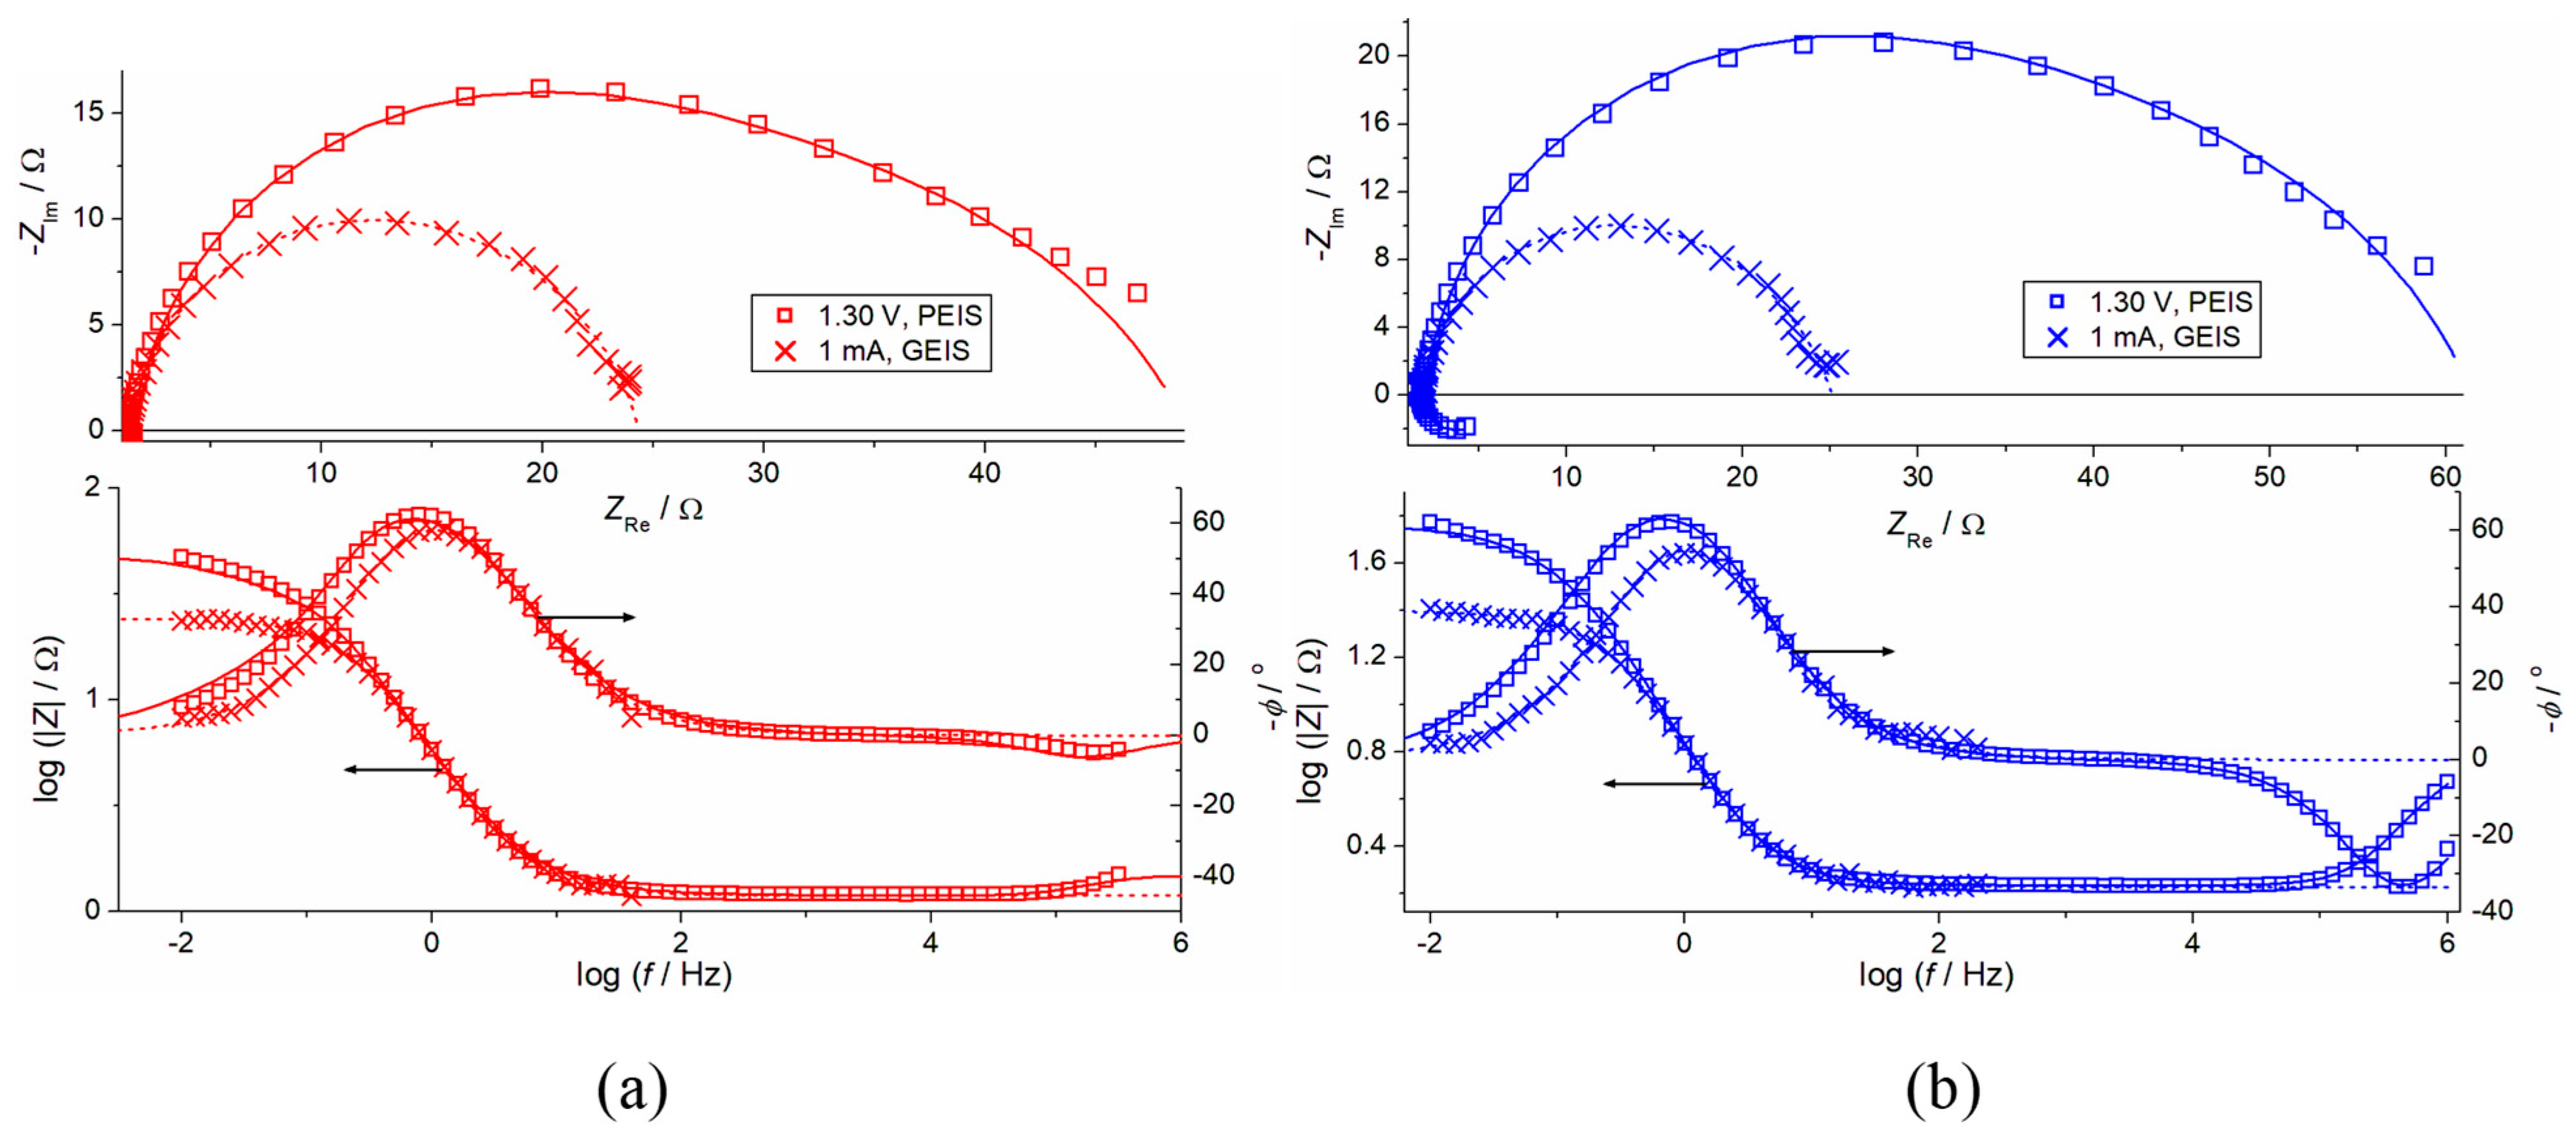
  • Surface Heterogeneity and Porosity: The multi-arc or overlapping arc structures often observed in our EIS data (Figure 2 and Figure 3) can also indicate the presence of multiple time constants, reflecting the heterogeneity of the electrode surface, the porous nature of the coating, and varied accessibilities of active sites within the coating bulk.
In summary, the arcs in Figure 2 are a direct manifestation of the complex interplay of charge transfer kinetics for OER and Ir dissolution, coupled with the pseudocapacitive and structural characteristics of the porous IrO2-Ta2O5 coating. Our equivalent electrical circuits (Figure 4) are designed to model these specific electrochemical contributions to reliably quantify these processes.
We would like to clarify the terminology used. The ‘interlayer (IL)’ element in our equivalent electrical circuit (as shown in Figure 4) does not represent a separate, distinct TaOx layer physically inserted between the Ti substrate and the IrO2-Ta2O5 coating. Instead, this element is colloquially assigned to describe the distributed morphology and behavior of the active oxide coating itself, where Ta2O5 is an integral component of the IrO2-Ta2O5 mixed oxide. Our discussion of the IL element refers to internal processes or interfaces within this mixed oxide layer, which contribute to the overall electrochemical response during OER,. The role of Ta2O5 within the mixed oxide is to enhance stability and electrocatalytic activity, influencing the overall coating structure and active site accessibility [37].
Regarding the consistency with cyclic voltammetry (CV) results: Yes, our EIS findings, specifically the observed changes in Rct and Qdl, are consistent with CV measurements. As presented in our previous work on these anodes [19] (e.g., Figure 1 and 1d therein), CVs reveal typical pseudocapacitive redox transitions assigned to Ir(III)/Ir(IV). The voltammetric capacitance, assumed to be proportional to the number of active sites, provides a direct measure of the electrochemically active surface area (ECSA). However, the CV response is found to be lacking the important information while the anode is polarized to OER, which is the main core of the present manuscript.
Our CV results confirm the following:
As-prepared anodes exhibit moderate homogeneity in pseudocapacitive characteristics across different surface positions (e.g., less than 20% difference), indicating variations in coating structure uniformity.
Upon accelerated stability testing (AST), while the general shape of CVs is maintained, a “tilt” is observed, which clearly indicates an increase in coating resistance, consistent with the increase in Rct from the EIS analysis in the deactivated state from the present manuscript.
Crucially, despite this increase in resistance, the voltammetric capacitance largely remains unaffected or shows only a slight decrease (especially at position 1) after AST. This suggests that the active sites are possibly evenly distributed throughout the coating bulk. The AST outcomes, particularly for initially more compact positions, appears to uncover or make accessible internal active sites, leading to a reduction in the relative difference between capacitances across positions (e.g., from a 20% to a 12% difference).
This consistency between CV and EIS data reinforces our interpretation of the observed decrease in Rct and increase in Qdl.
More active regions reflect a higher ECSA and a more efficient charge transfer. Even in deactivated states, where overall resistance increases, the maintenance of pseudocapacitive charge suggests that active sites persist, albeit with hindered access due to a poorly conductive layer of deactivated coating, which is captured by the CpRp element in our EIS model.
The CpRp combination was added to the circuit layout in Figure 4a to describe the response of the deactivated state, as shown in Figure 4b by the two variants. In some cases, the variant of CpRp, inserted as an additional branch to the CT and IL combination, worked better than the variant with a CpRp segment in the series separate to the rest of the circuit. However, a basis to comment on the difference between variants either from electrical or physicochemical origin was not found. CpRp combination is well resolved in the high-frequency domain of the impedance response of the deactivated state, as shown in Figure 3 (the insets in complex plane plots). The low-frequency loops, related to CT and IL, are of higher diameters in comparison to those in the active state (Figure 2), with the corresponding move of the phase angle peaks to somewhat higher frequencies (the decrease in time constants).
The CpRp combination is specifically introduced into our equivalent circuit model to describe the impedance response of the anode in its deactivated state, following accelerated stability testing (AST). This element is predominantly resolved in the high-frequency domain of the impedance spectra (as illustrated in Figure 3, insets for deactivated state).
Its significance lies in representing the formation of a poorly active/conductive surface layer that develops during the deactivation process. Our analysis suggests that this newly formed or significantly altered surface layer acts as a barrier, hindering access to the underlying internal coating surface, which may still retain a certain degree of electrochemical activity for charge transfer processes. This phenomenon aligns with observations from our previous work [19] based on open circuit potential EIS data, indicating the formation of such a blocking layer upon degradation.
Therefore, the CpRp combination directly quantifies the impedance contribution of this passivation or highly resistive surface layer, which is a critical factor in the observed operational loss and overall deactivation of the anode. Furthermore, our findings indicate that the parameters of this deactivated surface layer (Rp and Cp) are sensitive to the operational current/potential conditions, suggesting a dynamic interaction rather than the formation of a completely insulating, static layer. This provides valuable insight into the mechanisms governing the long-term performance and eventual failure of these anodes [38].
Figure 5, Figure 6 and Figure 7 show the values, with corresponding absolute fitting errors as y-bars, of the circuit parameters at different surface positions. From Figure 5 and Figure 6, the parameters for P2 and P3, respectively, can be compared. In the active state (the data for the deactivated state are marked with “AST”), the RCT from PEIS is higher than RIL and is also higher for initially less active P3 in comparison to P2. While RIL and RCT from GEIS (which are lower values from PEIS for both P2 and P3 positions due to higher current) for more active P2 are similar (and even a bit lower RCT is obtained, contrary to PEIS data), higher RCT is found for P3 from the PEIS data. Bearing in mind that RCT from PEIS is higher for P3, it can be concluded that the initially lower OER activity of P3 is reflected in mentioned trends of circuit resistivity parameters, despite the fact that the data were collected upon prolonged polarization with decreasing activity. The cause of the initial differences in activity is also seen from potential decays given as the insets of Figure 5, Figure 6 and Figure 7. Although the linearized parts of decay for both P2 and P3 are of similar slope, the initial value of potential is lower, and its initial decay (up to 500 s) is much higher for P2, which should lead toward the equalization of activity upon prolonged polarization.
Another important observation from Figure 5 and Figure 6 relates to the capacitance values. Neither differential (Cd) nor interlayer capacitance (CIL) depends on the surface position of the active anode, and neither the current nor the dynamic regime (PEIS or GEIS). This finding strongly suggests that CT and IL features are not to be anticipated as connected to the coating structural properties, but they are much connected to the intrinsic contribution of the processes taking place during the OER. The domination of the charge transfer processes in impedance responses, suggested by capacitive behavior during the OER, is supported by the comparison to the data obtained at OCP, which were analyzed in the previous paper [19]. At OCP, the total capacitances gained from the analysis of the distribution through the porous layer are of similar values found here for Cd and CIL. It follows that coating capacitance is independent of potential and/or circumstance whether Faradaic process(es) is(are) taking a part or not. The whole anode porous surface takes part in charge transfer, and hence, associated resistances RCT and RIL are due to charge transfer on substantially the same electrode surface. This leaves the space to suppose that CIL is more affected by Ir dissolution, whereas OER kinetics are quantified by RCT. Indeed, RCT at P2 is lower due to higher OER activity, and RIL is higher due to a lower Ir dissolution rate.
A general trend of the increase in charge transfer resistances and the decrease in associated capacitances is found upon degradation at positions P2 and P3, as it is illustrated by the “AST” data in Figure 5 and Figure 6. The increase in resistances is more obvious from PEIS data registered at lower average currents than in GEIS with higher stationary currents. The decrease in capacitance is of opposite behavior with respect to the regime; Cd decreases more according to GEIS data, whereas the decrease in CIL is similar in both PEIS and GEIS regime. As in the active state, CIL is of similar values in PEIS and GIS, which shows that the anode preserves the equality of the surface toward charge transfer related to Ir dissolution. On the other hand, Cd from PEIS is higher and closer to the value gained in the anode active state. This suggests that the anode surface available for OER is similar in an active and deactivated state, but it holds only for the galvanostatic regime. Upon deactivation, OER activity in the potentiostatic regime is surface distributed in a way that it takes place at a much higher rate at the surface of higher capacitance, i.e., on that of the maintained content of Ir active component as in the active state. Associated charge transfer resistance RCT is, however, higher in the deactivated state, which indicates that the OER active surface is not easily accessed like in the active state. Apparently, there is a poorly active/conductive surface layer that hinders access to the internal coating surface still active for charge transfer processes, as it was found from OCP data in the previous paper [19]. Its impedance response is observed as the appearance of the CpRp combination.
The increase in RCT from PEIS upon degradation is more pronounced for the initially less active position P3, which is valid also for the data gained by GEIS. RCT for the more active position P2 can be even lower with respect to the active state according to GEIS. This indicates that the coating internal surface is more active at P2 than at P3, which explains its initial higher activity. Consequently, RIL is much higher, i.e., Ir dissolution forms the coating interior in its deactivation state and is slower in comparison to P3. For the same cause, according to the literature [32], RIL from GEIS for P3 is lower than for P2 and even to its own active state. As a consequence, P3 apparently operates more stably than P2 in a similar potential range upon deactivation due to the more pronounced contribution of Ir dissolution, as seen in the insets of Figure 5 and Figure 6.
Registered differences in active and deactivated states between P2 and P3 appear to not substantially affect the mechanism of the loss of anode activity, but they are useful to elucidate the apparently tiny differences between their OER activities. Indeed, the circuit parameters related to the deactivated state, Rp and Cp, are quite similar for P2 and P3, and they show the dependence on the regime. Rp is higher in the GEIS regime and coincides with the values found at OCP [19]. The important finding is that the parameters of the defined coating layer of the lost activity apparently depend on the current/potential operational conditions, which should not be the case if it is newly generated as insulating. To check the behavior of key impedance parameters from Figure 5 and Figure 6 in the deactivated state, the deactivated position P1 is checked by PEIS and GEIS under different conditions. The results are shown as AST data in Figure 7.
Since galvanostatic loss of the activity is much steeper (inset of Figure 7) than for positions P2 and P3, the changes of the parameters were also checked upon extended polarization at 1.35 V (1.35 Vext data). The average current is lower (0.7 mA in comparison to 1.0 mA as the initial value), and only RCT is increased, which indicates that the stationary loss of activity mainly concerns OER. To some small degree, the Rp is also increased, which appears as a rule for Rp to increase with prolonged and intensified polarization (Rp grows with the increase in current from 1 to 5 mA). On the other hand, Cp considerably decreases for an order of magnitude. It appears that the parameters of the deactivated surface coating layer are sensitive to the products of the charge transfer processes that take place in the coating interior, although it does not participate due to the exhausted active Ir component.
Similarly, CIL also decreases with the polarization current and RIL only negligibly, indicating that CIL is affected by ions produced in charge transfer processes, while RIL does not decrease much due to low Ir content. With decreasing RCT due to OER acceleration with polarization, Cd does not change and appears insensitive to the products of the processes. It could be that full coverage of the surface by adsorbed OER intermediates is reached, which corresponds to the registered 120 mV slope (Figure 1), with slow desorption as the OER-rate determining step.

4. Conclusions

The activity for oxygen evolution reaction (OER) and corresponding changes in the activity upon deactivation of the titanium-supported IrO2-Ta2O5 coating are analyzed through the data collected by electrochemical impedance spectroscopy (EIS) during the potentiostatic or galvanostatic polarization. The aim was to present and prove a useful analytical tool sensitive to the crucial oxygen-evolving anode properties for its extended lifecycle in water electrolysis from acid solution, which is particularly important for metal electrowinning.
The EIS parameters were collected at different positions of the anode surface to check the reliability of the observed parameter values and also the surface uniformity of the coating properties. The data were used to fortify the approach based on anode EIS behavior at open circuit potential (OCP) and to extend the findings to the region of anode operational features in OER.
The general finding that the anode loses its operational power due to the active Ir component exhaustion from a surface coating layer is confirmed, with the appearance of EIS well-resolved features in OER caused by capacitive and resistive properties of a layer. It is proven by the EIS response in the OER that the layered EIS features are sensitive to ionic products of anode polarization and the content of the Ir active component as well.
In addition to information about the changes in the deactivated surface layer, joint potentiostatic and galvanostatic EIS, while OER is taking place, allowed for the reliable separation of the kinetic contribution of OER and the side reaction of Ir dissolution, responsible for the loss of anode activity and cut of the anode lifecycle. Different capacitive and resistive parameters are assignable to these two processes. They were found dependent in an intrinsic way on polarization conditions and explain well the anode OER activity and changes that cause the anode operational loss.
It is proven that the presented analytical tool, although rather complex, can be used to predict the operational properties of the Ir-based oxygen-evolving anodes for the specific electrolytic application according to the active oxide coating composition and structure.

Author Contributions

Conceptualization, V.P., V.M.T. and G.Š.; methodology, V.P. and G.Š.; software, J.B. and M.S.; validation, V.P., G.Š., V.M.T. and J.S.; formal analysis, V.P., M.S. and J.B.; investigation, J.B., M.S. and G.Š.; resources, J.S., V.M.T. and M.M.; data curation, V.P., V.M.T., M.S. and J.B.; writing—original draft preparation, V.P., M.M. and J.B.; writing—review and editing, J.B., V.P. and M.M.; visualization, J.B. and M.S.; supervision, J.S. and G.Š.; project administration, V.P. and M.M.; funding acquisition, J.S., V.M.T. and M.M. All authors have read and agreed to the published version of the manuscript.

Funding

The authors wish to acknowledge the support of the Science Fund of the Republic of Serbia (project number 6666), Renewal of the Waste Oxygen-Evolving anodes from Hydrometallurgy and their improved Activity for Hydrogen Economy, Wastewater, and Soil Remediation—OxyRePair. The authors wish to acknowledge the financial support from the Ministry of Science, Technological Development and Innovations of the Republic of Serbia [Grant No. 451-03-136/2025-03/200026]. The work is aligned with the United Nations Sustainable Development Goal #7: Ensure access to affordable, reliable, sustainable, and modern energy for all.

Data Availability Statement

The original contributions presented in the study are included in the article; further inquiries can be directed to the corresponding author.

Conflicts of Interest

Author Vojin M. Tadić was employed by Electrical Power Supply Company of Serbia. The remaining authors declare that the research was conducted in the absence of any commercial or financial relationships that could be construed as a potential conflict of interest.

References

  1. Liu, B.; Ma, B.; Chen, Y.; Wang, C. Corrosion mechanism of Ti/IrO2-RuO2-SiO2 anode for oxygen evolution in sulfuric acid solution. Corros. Sci. 2020, 170, 108662. [Google Scholar] [CrossRef]
  2. Hoseinieh, S.M.; Ashrafizadeh, F.; Maddahi, M.H. A Comparative Investigation of the Corrosion Behavior of RuO2 – IrO2 – TiO2 Coated Titanium Anodes in Chloride Solutions. J. Electrochem. Soc. 2010, 157, 50–56. [Google Scholar] [CrossRef]
  3. Wei, Q.; Ren, X.; Du, J.; Wei, S.; Hu, S.R. Study of the electrodeposition conditions of metallic manganese in an electrolytic membrane reactor. Miner. Eng. 2010, 23, 578–586. [Google Scholar] [CrossRef]
  4. Marcela, G.T.; Lozele, V.A.; Aline, M.S.S.; Josealdo, T.; Carlos, A.M.H.; Carmem, L.P.S.Z. Electrochemical oxidation of Methyl Red using Ti/Ru0.3Ti0.7O2 and Ti/Pt anodes. Chem. Eng. J. 2012, 204–206, 141–150. [Google Scholar]
  5. Eloy, I.C.; Baró, M.D.; Rossinyol, E.; Morales-Ortiz, U.; Sort, J.; Brillas, E.; Pellicer, E. Comparative electrochemical oxidation of methyl orange azo dye using Ti/Ir-Pb, Ti/Ir-Sn, Ti/Ru-Pb, Ti/Pt-Pd and Ti/RuO2 anodes. Electrochim. Acta 2017, 244, 199–208. [Google Scholar]
  6. Zhang, Y.; Cao, M.; Lv, H.; Wei, J.; Gu, Y.; Liu, D.; Zhang, W.; Ryan, M.P.; Wu, X. Electrodeposited nanometer-size IrO2/Ti electrodes with 0.3 mg IrO2 cm−2 for sludge dewatering electrolysers. Electrochim. Acta 2018, 265, 507–513. [Google Scholar] [CrossRef]
  7. Escalera-López, D.; Czioska, S.; Geppert, J.; Boubnov, A.; Röse, P.; Saraçi, E.; Krewer, U.; Grunwaldt, J.D.; Cherevko, S. Phase- and Surface Composition-Dependent Electrochemical Stability of Ir-Ru Nanoparticles during Oxygen Evolution Reaction. ASC Catal. 2021, 11, 8968–10094. [Google Scholar] [CrossRef]
  8. Li, Z.; Zhang, X.; Ou, C.; Zhang, Y.; Wang, W.; Dong, S.; Dong, X. Transition metal-based self-supported anode for electrocatalytic water splitting at a large current density. Coord. Chem. Rev. 2023, 495, 215381. [Google Scholar] [CrossRef]
  9. Bhattacharyya, K.; Poidevin, C.; Auer, A.A. Structure and Reactivity of IrOx Nanoparticles for the Oxygen Evolution Reaction in Electrocatalysis: An Electronic Structure Theory Study. J. Phys. Chem. C 2021, 125, 4331–4926. [Google Scholar] [CrossRef]
  10. Liu, B.; Wang, C.; Chen, Y.; Ma, B. Electrochemical behavior and corrosion mechanism of Ti/IrO2-RuO2 anodes in sulphuric acid solution. J. Electroanal. Chem 2019, 837, 175–183. [Google Scholar] [CrossRef]
  11. Mehdipour, M.; Tabaian, S.H.; Firoozi, S. Electrochemical evaluation of IrO2–Ta2O5-MWCNT-coated anodes with different pretreatments of titanium substrate. J. Iran. Chem. Soc. 2021, 18, 233–243. [Google Scholar] [CrossRef]
  12. Kasian, O.; Li, T.; Mingers, M.A.; Schweinar, K.; Savan, A.; Ludwig, A.; Mayrhofer, K. Stabilization of an iridium oxygen evolution catalyst by titanium oxides. J. Phys. Energy 2021, 3, 034006. [Google Scholar] [CrossRef]
  13. Chen, X.; Chen, G. Stable Ti/RuO2–Sb2O5–SnO2 electrodes for O2 evolution. Electrochim. Acta 2005, 50, 4155–4159. [Google Scholar] [CrossRef]
  14. Iwakura, C.; Sakamoto, K. Effect of active layer composition on the service life of (SnO2 and RuO2)-coated Ti electrodes in sulfuric acid solution. J. Electrochem. Soc. 1985, 132, 2420–2423. [Google Scholar] [CrossRef]
  15. Cao, H.; Zhang, L.; Chen, M. Characteristics of anodic TiO2 nanotube arrays mediated IrO2 Active Anode in the Oxygen Evolution Reaction. Int. J. Electrochem. Sci. 2022, 17, 220461. [Google Scholar] [CrossRef]
  16. Herrada, R.A.; Rodil, S.E.; Sepúlveda-Guzmán, S.; Manriquez, J.; Exner, K.S.; Bustos, E. Characterization of Ti electrodes electrophoretically coated with IrO2-Ta2O5 films with different Ir:Ta molar ratios. J. Alloys Compd. 2021, 862, 158015. [Google Scholar] [CrossRef]
  17. Yan, Z.; Li, G.; Wang, J.; Zhang, Z.; Feng, Z.; Tang, M.; Zhang, R. Electro-catalytic study of IrO2single bondTa2O5 coated anodes with pretreated titanium substrates. J. Alloys Compd. 2016, 680, 60–66. [Google Scholar] [CrossRef]
  18. Tolba, R.; Tian, M.; Wen, J.; Jiang, Z.H.; Chen, A. Electrochemical oxidation of lignin at IrO2- based oxide electrodes. J. Electroanal. Chem. 2010, 649, 9–15. [Google Scholar] [CrossRef]
  19. Bošnjaković, J.; Panić, V.; Stevanović, M.; Stopic, S.; Stevanović, J.; Grgur, B.; Šekularac, G. Revealing the Surface and In-Depth Operational Performances of Oxygen-Evolving Anode Coatings: A Guideline for the Synthesis of Inert Durable Anodes in Metal Electrowinning from Acid Solutions. Metals 2024, 14, 1339. [Google Scholar] [CrossRef]
  20. Lee, Y.; Suntivich, J.; May, K.J.; Perry, E.E.; Shao-Horn, Y. Synthesis and Activities of Rutile IrO2 and RuO2 Nanoparticles for Oxygen Evolution in Acid and Alkaline Solutions. J. Phys. Chem. Lett. 2012, 3, 399–404. [Google Scholar] [CrossRef]
  21. Liu, Y.; Xu, L.; Xuan, J.; Xin, Y.; Li, Y.; Duan, T.; Liu, F. A comparative study on Ti/IrO2–Ta2O5 anodes prepared by microwave plasma-assisted sintering and conventional thermal decomposition methods. J. Mater. Res. Technol. 2023, 23, 1447–1457. [Google Scholar] [CrossRef]
  22. Heijden, O.; Park, S.; Vos, R.E.; Eggebeen, J.J.J.; Koper, M.T.T. Tafel Slope Plot as a Tool to Analyze Electrocatalytic Reactions. ACS Energy Lett. 2024, 9, 1871–1879. [Google Scholar] [CrossRef]
  23. Mefford, J.T.; Zhao, Z.; Bajdich, M.; Chueh, W.C. Interpreting Tafel Behavior of Consecutive Electrochemical Reactions through Combined Thermodynamic and Steady State Microkinetic Approaches. Energy Environ. Sci. 2020, 13, 622–634. [Google Scholar] [CrossRef]
  24. Fletcher, S. Tafel Slopes from First Principles. J. Solid State Electrochem. 2009, 13, 537–549. [Google Scholar] [CrossRef]
  25. Nong, H.N.; Falling, L.J.; Bergmann, A.; Klingenhof, M.; Tran, H.P.; Spöri, C.; Mom, R.; Timoshenko, J.; Zichittella, G.; KnopGericke, A.; et al. Key Role of Chemistry versus Bias in Electrocatalytic Oxygen Evolution. Nature 2020, 587, 408–413. [Google Scholar] [CrossRef]
  26. Marshall, A.T.; Vaisson-Béthune, L. Avoid the Quasi Equilibrium Assumption When Evaluating the Electrocatalytic Oxygen Evolution Reaction Mechanism by Tafel Slope Analysis. Electrochem. Commun. 2015, 61, 23–26. [Google Scholar] [CrossRef]
  27. Chizmadzhevand, Y.A.; Chirkov, Y.G. Porous Electrodes. In Comprehensive Treatise of Electrchemistry, 1st ed.; Yeager, E., Bockris, J.O.M., Conway, B.E., Sarangapani, S., Eds.; Springer Science + Business Media: New York, NY, USA, 1983; Volume 6, pp. 317–385. [Google Scholar]
  28. Damjanovic, A.; Dey, A.; Bockris, I.J. O’M. Electrode Kinetics of Oxygen Evolution and Dissolution on Rh, Ir, and Pt-Rh Alloy Electrodes. J. Electrochem. Soc. 1966, 113, 741–746. [Google Scholar] [CrossRef]
  29. Jovanovič, P.; Hodnik, N.; Ruiz-Zepeda, F.; Arčon, I.; Jozinović, B.; Zorko, M.; Bele, M.; Šala, M.; Šelih, V.S.; Hočeva, S. Electrochemical Dissolution of Iridium and Iridium Oxide Particles in Acidic Media: Transmission Electron Microscopy, Electrochemical Flow Cell Coupled to Inductively Coupled Plasma Mass Spectrometry, and X-ray Absorption Spectroscopy Study. J. Am. Chem. Soc. 2017, 139, 12837–12846. [Google Scholar] [CrossRef]
  30. Zlatar, M.; Escalera-Lopez, D.; Cornelius, S.; Briega-Martos, V.; Stojanovski, K.; Cherevko, S. pH dependence of noble metals dissolution: Iridium. Electrochim. Acta. 2025, 513, 145450. [Google Scholar] [CrossRef]
  31. Buckley, D.N.; Burke, L.D. The oxygen electrode. Part 6. Oxygen evolution and corrosion at iridium anodes. J. Chem. Soc. Faraday Trans. 1 Phys. Chem. Condens. Phases 1975, 12, 1–77. [Google Scholar] [CrossRef]
  32. Kasian, O.; Grote, J.P.; Geiger, S.; Cherevko, S.; Mayrhofer, K.J.J. The common Intermediates of Oxygen Evolution and Dissolution Reactions during Water Electrolysis on Iridium. J. Prakt. Chem. 2018, 57, 2488–2491. [Google Scholar] [CrossRef] [PubMed]
  33. Gajic-Krstajic, L.M.; Trisovic, T.L.; Krstajic, N.V. Spectrophotometric study of the anodic corrosion of Ti/RuO2 electrode in acid sulfate solution. Corros. Sci. 2004, 46, 65–74. [Google Scholar] [CrossRef]
  34. Jovic, V.D. Determination of the Correct Value of Cdl from the Impedance Results Fitted by the Commercially Available Software; Gamry Instruments, Inc.: Warminster, PA, USA, 2003; pp. 1–3. [Google Scholar]
  35. Haripriya, M.; Manimekala, T.; Dharmalingam, G.; Minakshi, M.; Sivasubramanian, R. Asymmetric Supercapacitors Based on ZnCo2O4 Nanohexagons and Orange Peel Derived Activated Carbon Electrodes. Chem. Asian J. 2024, 19, e202400202. [Google Scholar] [CrossRef] [PubMed]
  36. Vasudevan, S.; Tharani, D.S.; Manickam, M.; Sivasubramanian, R. A sol–gel derived LaCoO3 perovskite as an electrocatalyst for Al–air batteries. Dalton Trans. 2024, 53, 3713–3721. [Google Scholar] [CrossRef]
  37. Moradi, F.; Dehghanian, C. Addition of IrO2 to RuO2+TiO2 coated anodes and its effect on electrochemical performance of anodes in acid media. Prog. Nat. Sci. Mater. Int. 2014, 24, 134–141. [Google Scholar] [CrossRef]
  38. Liu, B.; Wang, C.; Chen, Y. Surface determination and electrochemical behavior of IrO2-RuO2-SiO2 ternary oxide coatings in oxygen evolution reaction application. Electrochim. Acta 2018, 264, 350–357. [Google Scholar] [CrossRef]
Scheme 1. Experimental design of the anode fabrication and performance analysis applied in the present (faradaic conditions) and preceding study (Adapted from Ref. [19]) (non-faradaic conditions).
Metals 15 00721 sch001
Figure 1. Ohmic drop-corrected OER Tafel curves at different positions at the surface of the IrO2-Ta2O5/Ti anode gained by polarization to extreme currents (inset). To illustrate a typical difference between as-prepared and deactivated anode state (Adapted from Ref. [19]), corresponding curves are given for P1. The steady-state positions for EIS data collection either by PEIS or GEIS are indicated by elliptical figures for EIS responses of as-prepared (full ellipse) and deactivated states (dashed ellipse). Linear fittings of Tafel regions at low (<1.42 V) and high overpotentials (>1.42 V) are given by full and dashed lines, respectively.
Metals 15 00721 g001
Figure 2. Electrochemical impedance spectroscopy (EIS) analysis of as-prepared IrO2-Ta2O5/Ti anode: complex plane and bode plots for positions P2 (a) and P3 (b) under potentiostatic (1.30 V) and galvanostatic (1 mA) conditions. Symbols represent experimental data, while lines represent the fitted response of the equivalent electrical circuit.
Metals 15 00721 g002
Figure 3. Electrochemical impedance spectroscopy (EIS) analysis of deactivated IrO2-Ta2O5/Ti anode: complex plane and bode plots for positions P1 (a), P2 (b), and P3 (c) at specified potentiostatic (1.30 and 1.35 V) and galvanostatic (1, 2, or 5 mA) regimes. Symbols represent experimental data, while lines represent the fitted response of the equivalent electrical circuit.
Metals 15 00721 g003
Figure 4. Equivalent electrical circuits used to fit the PEIS impedance response of the anode in its active (a) and deactivated states (b); for GEIS, the inductive RIL part is omitted.
Metals 15 00721 g004
Figure 5. The values of the circuit parameters gained by fitting the impedance response from Figure 2a and Figure 3b at position P2 in anode active and deactivated states (“AST” data); corresponding Cp and Rp data (Adapted from Ref. [19]) at open circuit potential (OCP) are indicated.
Metals 15 00721 g005
Figure 6. The values of the circuit parameters gained by fitting the impedance response from Figure 2b and Figure 3c at position P3 in anode active and deactivated states (“AST” data); corresponding Cp and Rp data (Adapted from Ref. [19]) at open circuit potential (OCP) are indicated.
Metals 15 00721 g006
Figure 7. The values of the circuit parameters gained by fitting the impedance response from Figure 3a at position P1 in the anode deactivated state; corresponding Cp and Rp data (Adapted from Ref. [19]) at open circuit potential (OCP) are indicated.
Metals 15 00721 g007
Table 1. Tafel OER kinetic parameters and RS values for the ohmic drop compensation of the polarization data of Figure 1 to set the 120 ± 1 mV Tafel slope in the high overpotential region (>1.42 V) in comparison to resistances gained by PEIS at 1.30 V and open circuit potential (OCP) for different anode surface positions.
Surface PositionRSTafel Slope, mV (Low Overpotentials, <1.42 V)RS,PEIS/Ω from PEIS (±SD of the Fitting)
1.30 VOCP
P11.5664
P21.32821.19 ± 0.011.16 ± 0.01
P33.12671.71 ± 0.011.67 ± 0.02
Disclaimer/Publisher’s Note: The statements, opinions and data contained in all publications are solely those of the individual author(s) and contributor(s) and not of MDPI and/or the editor(s). MDPI and/or the editor(s) disclaim responsibility for any injury to people or property resulting from any ideas, methods, instructions or products referred to in the content.

