Abstract
Magnesium (Mg) alloys are gaining widespread use in the automotive and construction industries for their potential to enhance performance and lower manufacturing costs, making them ideal for lightweight structural applications. However, despite these advantages, extruding Mg alloys remains technically challenging due to their inherently limited formability and the strong crystallographic textures that form during deformation. This study aimed to comprehensively characterize the ductile fracture behavior of ZM51M Mg alloy round bars under various stress states and to improve the reliability of ductile failure predictions through the application and calibration of multiple uncoupled damage criteria. Tensile and compressive tests were conducted on specimens of varying geometries (dogbone, notched R5, shear, uniaxial compression, and plane strain compression specimens) and dimensions, meticulously cut along the extrusion direction of the round bar. These tests encompassed a wide spectrum of stress–strain responses and fracture characteristics, including uniaxial tension, uniaxial compression, and shear-dominated states. An inverse analysis approach, involving iterative numerical simulation coupled with experimental data, was employed to precisely determine fracture strains from the test results. The plastic deformation behavior was accurately modeled using the combined Swift–Voce hardening law. Subsequently, three prominent uncoupled ductile fracture criteria—Rice–Tracey, DF2014, and DF2016—were calibrated against the experimental data. The DF2016 criterion demonstrated superior predictive accuracy, consistently yielding the most accurate fracture strain predictions and significantly outperforming the Rice–Tracey and DF2014 criteria across the tested stress states. The findings of this work provide significant insights for improving the assessment of formability and fracture prediction in Mg alloys. This research directly contributes to overcoming the challenges associated with their inherent formability limitations and complex deformation textures, thereby facilitating more reliable design and broader adoption of Mg alloys in advanced lightweight structural solutions.
1. Introduction
Mg alloys are among the lightest structural metals used in engineering applications. They are recognized for their impressive strength-to-weight ratio, excellent dimensional stability, and superior machinability. These qualities make Mg alloys particularly attractive in sectors such as automotive, aerospace, and electronics, where minimizing weight is crucial for improving fuel efficiency and overall performance. While their formability at room temperature is somewhat limited due to their hexagonal close-packed (HCP) crystal structure, recent advancements in alloy design and processing have improved their ductility, expanded their applicability in complex, high-performance components [1,2,3,4]. However, accurately predicting their mechanical behavior, particularly ductile fracture under various stress states, remains a significant challenge.
To statistically characterize the yield behavior of metals, a variety of yield criteria have been established to represent plastic deformation under different stress states. Initially, several isotropic yield functions, including Tresca, von Mises, Drucker, and Drucker–Prager, were developed by considering factors such as hydrostatic pressure and the third invariant of the deviatoric stress tensor, thereby enhancing the accuracy of yield predictions under tensile, compressive, and shear loading conditions [5,6,7,8,9]. However, in rolled sheet metals, the formation of crystallographic texture during processing leads to anisotropic plastic behavior, meaning the yield response is affected by the loading direction in relation to the rolling direction. To address this directional dependence, various yield functions have been developed to characterize plastic deformation under different stress states, accounting for factors such as hydrostatic pressure and the third invariant of the deviatoric stress tensor [10,11]. The anisotropic fracture characteristics during rolling processes significantly impact both manufacturing costs and production safety. Researchers have made substantial advancements in understanding the plastic deformation and fracture behaviors of enhanced high-strength metals. To address the effects of three stress invariants on material yield behavior, various isotropic yield functions have been developed. The von Mises function, which posits that plastic deformation occurs when the root-mean-square shear stress exceeds a certain threshold, is the most widely employed. This function has been extended to a generalized orthotropic version of the Ducker yield criterion through the linear transformation method, effectively characterizing the plastic behavior of alloy sheets with strong coherence between theoretical predictions and experimental observations. Two methods have been proposed that effectively clarify the asymmetry in tension and compression [12,13]. One of the most widely employed yield criteria for capturing the asymmetry between tension and compression in metallic materials is the Cazacu–Plunkett–Barlat model family [14,15]. These criteria incorporate an asymmetry parameter that accounts for the variation in yield stress between tension and compression, a phenomenon often observed in HCP metals and other pressure-sensitive materials.
Ductile fracture is a complex process involving microvoid nucleation, growth, and coalescence. The fracture behavior of metals is highly dependent on the stress state, particularly stress triaxiality (the ratio of hydrostatic stress to equivalent stress) and the Lode parameter (which describes the deviatoric stress state). While many traditional fracture models perform well in tensile-dominated scenarios, they often exhibit limited predictive capability under complex loading conditions, especially those characterized by low or negative stress triaxiality, such as shear or compression. This highlights the need for comprehensive damage models that accurately capture the influence of both stress triaxiality and the Lode parameter across a broad range of loading conditions [16,17,18].
Building on prior research, Cazacu et al. [19] introduced the Cazacu–Barlat 2004 yield criterion, which extends the classical von Mises approach by incorporating a formulation that considers the strength differential effect (SDE). This enhancement enables more accurate predictions of anisotropic yielding under non-symmetrical loading conditions. Subsequently, Lou et al. [20] presented an improved yield criterion that includes the first stress invariant, further refining the model’s capacity to describe materials exhibiting tension-compression asymmetry. These advancements represent significant progress in yield surface modeling, particularly for materials subjected to complex mechanical responses under multiaxial loading. The foundational research conducted by McClintock [21] provided essential insights into the behavior of voids through the analysis of the growth and merging of elongated cylindrical voids in materials undergoing plastic deformation. This work underscored the substantial influence of stress triaxiality on the rate of void growth. Building on this groundwork, Rice and Tracey [22] performed an analytical study of spherical voids within an idealized non-hardening material and demonstrated that an increase in stress triaxiality corresponds to a decrease in fracture ductility, thereby establishing a fundamental relationship between stress states and fracture resistance. Subsequent advancements led to the development of the Gurson–Tvergaard–Needleman (GTN) model [23,24], which incorporates the processes of void nucleation, growth, and coalescence while considering the interactive behavior of adjacent voids during plastic deformation. This model has proven highly effective in predicting ductile fracture in materials subjected to high triaxial stress conditions, as it captures essential aspects of the underlying microstructural damage mechanisms. Additionally, the Void Growth Model (VGM) [25] established a relationship between fracture strain and stress triaxiality, particularly in predicting fracture behavior in steel. However, it fell short in adequately addressing the influence of the Lode parameter, which is crucial under conditions of low or negative triaxiality.
Several studies have aimed to evaluate and enhance the predictive performance of ductile fracture models under various stress conditions [26]. Li et al. [27] conducted a comprehensive assessment of existing ductile fracture criteria, revealing that while most models demonstrate reliable accuracy in predicting tensile-dominated fracture modes, their effectiveness tends to diminish in shear-dominated stress scenarios, resulting in less dependable predictions. To address these limitations, researchers have proposed modifications to traditional damage models. For instance, efforts have been made to incorporate shear damage mechanisms or the Lode parameter into the Gurson–Tvergaard–Needleman (GTN) model, thereby improving its predictive capabilities in low stress triaxiality conditions [28,29]. One of the notable advancements in fracture modeling is the Modified Mohr-Coulomb (MMC) criterion, introduced by Bai and Wierzbicki [30]. This criterion builds upon classical Mohr-Coulomb theory by characterizing fracture strain as a function of both stress triaxiality and the Lode angle parameter. This approach offers a more comprehensive framework for understanding the complex behavior of ductile fracture across a diverse range of loading paths. Due to its robust formulation, the MMC model has been widely applied to predict fracture behavior in various metallic materials and alloy systems [31,32,33]. Simultaneously, various other models have concentrated on connecting theoretical formulations to observable physical quantities, such as equivalent plastic strain, maximum principal stress, and hydrostatic stress. While simple yield-based criteria, such as the von Mises equivalent stress, are often sufficient for assessing the onset of plastic deformation in many engineering applications, they do not provide a comprehensive prediction of ductile fracture. For materials like Mg alloys, which exhibit significant plastic deformation before failure, accurately predicting the initiation and progression of fracture under complex multiaxial stress states is critical for robust design and safety. This study provides significant added value by moving beyond yield-based assessments to offer a predictive framework for ductile failure, incorporating the crucial influences of stress triaxiality and the Lode parameter. This detailed fracture modeling, even under quasi-static conditions, enables more precise component design against actual failure, rather than just yielding. While cyclic or fatigue loading scenarios present additional complexities, the fundamental understanding and predictive capabilities developed herein serve as a vital foundation for future investigations into more dynamic loading conditions.
Despite advancements, a significant gap remains in the existing literature regarding the comprehensive characterization of ductile fracture behavior in ZM51M Mg round bars, particularly under compressive and complex loading conditions. This study aims to bridge this gap by examining the ductile fracture response of extruded magnesium alloys across various stress states through an integrated experimental-numerical approach. The material’s hardening behavior is modeled using the Swift–Voce hardening law, with parameters calibrated via inverse analysis by iteratively aligning experimental load–displacement curves with finite element predictions. Moreover, the study evaluates the predictive capabilities of well-established uncoupled ductile fracture criteria—specifically Rice–Tracey, DF2014, and DF2016—across a wide range of stress triaxialities and Lode parameters. This work provides valuable insights for improving the assessment of formability and fracture prediction in Mg alloys, thereby supporting their wider application in lightweight structural solutions.
2. Materials and Methods
2.1. Material and Specimen Preparation
Tensile and compression experiments were performed on Mg specimens, which included dogbone, notched R5 (NR5), shear, uniaxial compression (UC), and plane-strain compression (PSC) specimens. These were cut from a round bar measuring 120 mm in diameter aligned with the extrusion direction using a wire electrical discharge machining process. This method was selected for its outstanding dimensional accuracy and its ability to minimize mechanical or thermal stresses during the cutting process. Additionally, we ensured a clean surface finish to avoid any residual stresses or surface defects that could affect the fracture behavior. Post-cutting inspections confirmed that the specimen surfaces were free of visible imperfections, thereby ensuring the reliability of the mechanical testing results, as shown in Figure 1. These geometries were meticulously designed to characterize the ductile fracture behavior of ZM51M Mg alloys across a broad range of stress states. The dogbone specimens were designed in accordance with the ASTM E8/E8M standard [34] for uniaxial tensile testing of metallic materials, ensuring consistency with widely accepted testing protocols for determining tensile properties and fracture under tensile-dominated loading. The geometry NR5 specimens were specifically adopted from prior studies to control and vary the stress triaxiality, a critical parameter in ductile fracture characterization [35,36]. The shear specimens were custom-designed to promote a state of in-plane shear failure, a loading condition crucial for understanding fracture under low stress triaxiality. Such specialized geometries are frequently employed in ductile fracture research to isolate and study shear-dominated fracture mechanisms [37,38]. For PSC and UC tests, the specimen configurations were based on well-established approaches in the literature, as formal universal standards for these specific loading modes in ductile fracture studies are less common. For the tensile tests, dogbone, NR5, and shear specimens with a thickness of 2.0 mm were utilized. In contrast, the UC and PSC specimens, which had a thickness of 5.0 mm and 20.0 mm, were used for the compression tests. The dimensions of these specimens are shown in Figure 2. The chemical composition of the Mg-ZM51M alloy is detailed in Table 1.
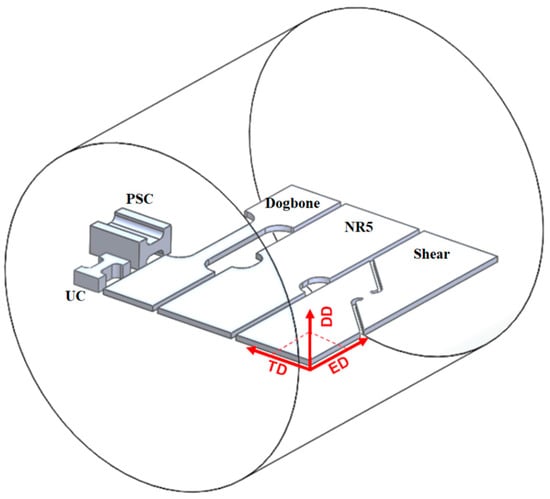
Figure 1.
Mg-ZM51M round bar.
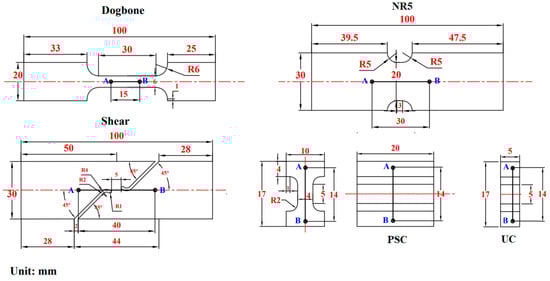
Figure 2.
Specimens’ dimensions with gauge length (line A-B); thickness is 5 mm for UC, 20 mm for PSC, and 2 mm for dogbone, NR5, and shear.

Table 1.
Chemical compositions of Mg-ZM51M round bar (wt.%). Reprinted with permission from ref. [39]. 2011 Elservier.
2.2. Testing Procedures
A universal testing machine (WANCE, Shenzhen, China) with a force capacity of 50 kN was utilized at room temperature under quasi-static conditions to perform tensile and compressive tests on the specimens. During the experiment, an XTOP digital image correlation (DIC) system with a resolution of 2448 × 600 pixels captured between 200 and 250 images for each specimen to measure and analyze their deformation and fracture behavior. An EFII-100 light was employed throughout the experimental process to enhance DIC calculations by improving contrast and minimizing glare on the specimens. Before commencing the experiments, uniform black and white speckles were sprayed onto the surface of all specimens to ensure consistent DIC performance. For the dogbone specimens, the crosshead speed was set to 1.8 mm/min, corresponding to a strain rate of 0.001/s under quasi-static conditions, while a speed of 0.5 mm/min was used for the NR5, shear, UC, and PSC specimens. The axial extensometer gauge lengths were 15 mm for dogbone specimens, 20 mm for NR5 and shear specimens, and 14 mm for UC and PSC specimens. Each experiment was conducted at least three times to obtain the average fracture loading process and ensure experimental accuracy. The stroke was calculated by monitoring changes in axial gauge length throughout the experiment using GOM 2018 software. To ensure accurate measurements, the extensometer was positioned in a region of uniform deformation at both ends of the specimen’s parallel zone.
2.3. Analytical Approach of Stress–Strain
The analytical assessment of stress–strain curves is vital for characterizing materials due to its effectiveness in handling experimental data and alignment with standard testing practices. The material’s anisotropic behavior based on loading orientation was validated by the results of tensile and compression tests performed in the diagonal and transverse loading directions along with the ED. However, in this study, only the mechanical response along the ED loading orientation was considered; hence, its applicability is limited to this direction. The material’s anisotropic response to varying loading orientations is thus not taken into consideration by the existing model. The true stress–strain curves were analytically obtained from the engineering stress–strain data using Equations (1)–(3). This derivation accounted for necessary adjustments related to necking and geometric alterations during the deformation process. To reliably forecast the plastic deformation, the Swift–Voce hardening model was utilized in conjunction with the experimental data gathered from the specimens. The parameters of the hardening law for the dogbone specimens were determined using analytical techniques and optimization algorithms, integrating the capabilities of Abaqus 6.14 software and MATLAB R2023a.
where is true strain, is true stress, is the engineering strain, which is found by dividing the displacement by the gauge length, is the engineering stress, which is found by dividing the load by cross-sectional area, is the equivalent plastic strain, and E is the elastic modulus, which is found as the slope of the linear fitting at 70% of . The Swift–Voce hardening function was used to represent the hardening curves, and the formula for this function is included in the related analysis as follows:
where , , and are hardening constants, is the hardening exponent, determining how rapidly the strength of materials increases in response to strain, represents initial plastic strain, and denotes the proportionality factor, which is set to 0.5 to take into account the Swift–Voce hardening law. The calibrated curves that fit the test data are satisfactory, demonstrating the high accuracy of the Swift–Voce hardening function in describing the hardening behavior of ZM51M. To capture the intrinsic tension-compression asymmetry of HCP magnesium alloys, the mechanical behavior under both tensile and compressive loading conditions was thoroughly characterized. Figure 3 primarily illustrates the stress–strain behavior of tension-compression specimens. The resulting experimental data from both tensile and compressive tests were utilized to calibrate the combined Swift–Voce hardening law, ensuring an accurate representation of the material’s plastic deformation across a broad range of stress states, including those dominated by compression. The specific parameters for the Swift–Voce law, derived from fitting to both tensile and UC experimental curves, are detailed in Table 2, thereby providing a complete characterization of the material’s asymmetric plastic response crucial for robust fracture modeling under multiaxial conditions. The fitting of Swift–Voce hardening laws exhibits significant similarity with the experimental results. These results will be used for numerical simulation of complex states like NR5, shear, UC, and PSC.
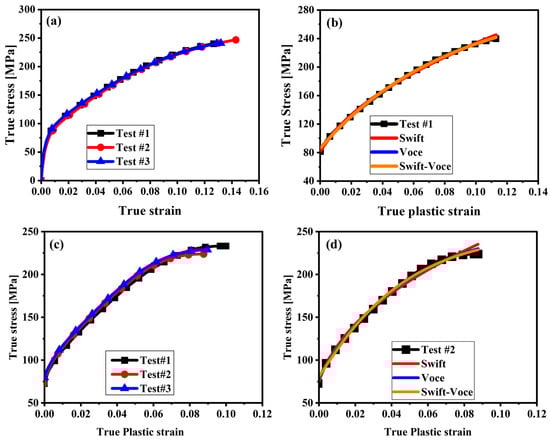
Figure 3.
Stress–strain results of the tension-compression specimens: (a) true stress–strain curve of dogbone; (b) Swift–Voce hardening function fitting of dogbone; (c) true stress–strain curve of UC; (d) Swift–Voce hardening function fitting of UC.
Table 2.
Parameters calibrated for the Swift–Voce fitting for dogbone and UC specimens of ZM51M Mg.
2.4. Finite Element Analysis
To optimize the design and application of lightweight Mg alloys, accurate prediction of their fracture behavior is important. This study leverages advanced numerical simulations, particularly finite element analysis and inverse analysis techniques, as an indispensable tool to complement experimental observations. By precisely modeling complex stress states and material responses, these simulations enable a deeper understanding of fracture mechanisms, facilitate the calibration of sophisticated damage models, and ultimately enhance the reliability of ductile failure predictions in Mg alloys.
The finite element model evaluates load–displacement curves for the dogbone, NR5, shear, UC, and PSC specimens. Numerical results were generated using ABAQUS/Explicit 6.14, with different element sizes assigned to each specimen. Hypermesh 9.0 software was utilized for the 3D modeling and meshing of these samples, employing C3D8R mesh types. To enhance computational efficiency and leverage the symmetry of the specimen, a 1/8 model configuration was chosen for the finite element analysis of the dogbone and NR5 specimens, while full models were used for UC and PSC specimens. In contrast, a 1/2 model configuration was utilized for the shear specimens, taking into account their asymmetry along the X-axis, which allows for the construction of only half of the Z-axis symmetry model. The accuracy of the finite element models for the specimens was assessed by examining how variations in cell counts impact computational precision and efficiency. Larger cell sizes can lead to increased errors, whereas smaller sizes may result in longer computation times. Figure 4 illustrates two distinct cell sizes for dogbone specimens. The first size features finer mesh elements, and the second model presents coarser mesh units, with smaller meshes still present in the stretching region. From the figure, we can see the mesh size has a minimal impact on simulation accuracy, whereas it significantly affects computational time, as shown in Figure 5. After assessing these two cell size models, size 1 emerged as the most time-efficient option. Therefore, the 3D model was employed to simulate the dogbone specimens, selecting the first size for the numerical simulation. This sensitivity to mesh size is crucial for identifying when adjustments are necessary. Figure 6 illustrates cell sizes for all specimens.
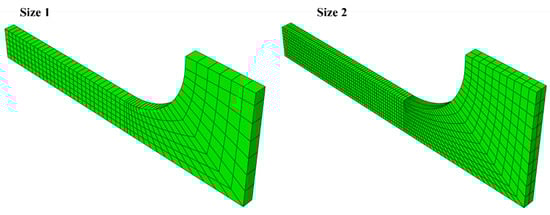
Figure 4.
Finite element model of dogbone specimen of two sizes.
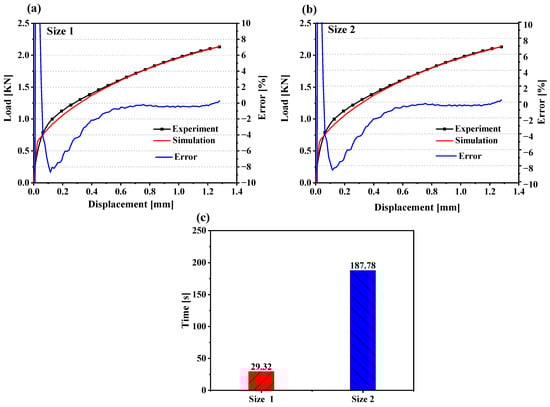
Figure 5.
Comparison of finite element simulation error and simulation time of dogbone specimens showing the results of different sizes of elements: (a) size 1, (b) size 2, and (c) time of simulation duration for two sizes.
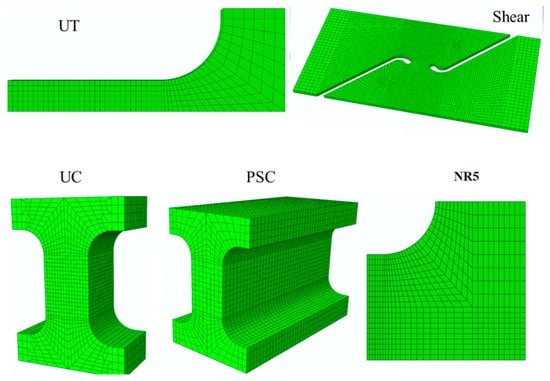
Figure 6.
Element size of Mg-ZM51M specimens for the finite element model.
2.5. Finite Element Simulation by Inverse Analysis Approach
The inverse analysis approach was employed to derive the ideal numerical load–displacement curves for NR5, shear, UC, and PSC specimens, while load–displacements for dogbone specimens were simulated analytically. As illustrated in Figure 7, this approach encompasses numerical simulation conducted under identical experimental loading conditions, followed by an error analysis that compares experimental and predicted outcomes. Material parameters in the constitutive model are then adjusted accordingly. This approach systematically leverages numerical simulations to bridge the gap between theoretical models and experimental observations. The process initiates with a finite element (FE) model of the specimen, constructed to replicate the experimental loading conditions precisely. This FE model, which incorporates the constitutive equation via a material subroutine, is then subjected to a simulated loading history. The resulting numerical load–displacement responses or strain fields are subsequently compared against their experimental counterparts. This comparison is quantified through an error analysis, typically involving the calculation of a relative error as defined in Equation (5). This comparison forms the basis of an iterative optimization loop. Material parameters within the constitutive or fracture models are systematically varied and refined in subsequent numerical simulations. The objective of this iterative process is to minimize the discrepancy between simulated and experimental outcomes, thereby identifying the set of parameters that provides the ‘best solution’ or optimal fit. The convergence of this process is governed by predefined criteria, ensuring that the identified parameters accurately represent the material’s behavior. For this study, the ABAQUS/Explicit analysis mode was employed for the FE simulations, with loading times adjusted to match the experimental displacement rates. This intelligent and visual procedure allows for the robust calibration of complex material models, even in the absence of direct analytical solutions, and is crucial for the predictive accuracy of the subsequent fracture analysis. To simulate the yield behavior, the von Mises yield criterion was applied, alongside a combined Swift–Voce model to define the hardening behavior. The initial parameters of Swift–Voce, as presented in Table 2, were utilized to calibrate the material constants for the inverse analysis approach. Figure 8 displays a comparison of the strain fields between the DIC experiment and the numerical simulation prior to the fracture stroke for the specimens, revealing a strong correlation between the modeled and experimental results.
where n represents the number of data point DIC images collected during the test for the load–displacement curve obtained from the tensile test. and represent the load value at the number of i loading steps during the experiment and simulation. is the average value of all load data collected during the test.
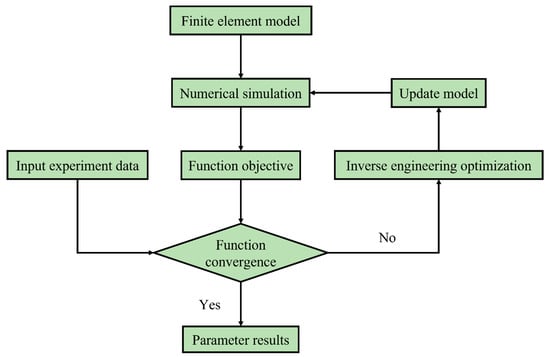
Figure 7.
Flow chart of the inverse analysis approach.
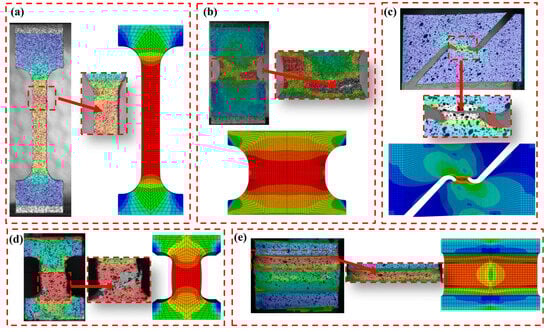
Figure 8.
Comparison of the Mises strain distributions between the experiment and numerical simulation before fracture: (a) dogbone, (b) NR5, (c) shear, (d) UC, and (e) PSC.
3. Results
3.1. Experimental Results
Figure 9 presents the load–displacement responses for the dogbone, NR5, shear, UC, and PSC specimens, incorporating results from three to four repeated tests for each specimen type. The mechanical testing data demonstrate strong repeatability across all specimen categories, confirming the reliability and consistency of the experimental procedures. All specimens displayed a typical elastic–plastic transition, with a linear elastic region followed by evident strain hardening. This behavior reflects the intrinsic characteristics of the Mg alloy, notably its high strength-to-weight ratio and limited ductility. The peak load closely aligns with the initiation of localized plastic deformation, after which some specimens exhibited softening or instability depending on the stress state. The observed concentration of plastic strain near the failure zones suggests that the Mg alloy offers high tensile strength but reduced ductility under the applied loading conditions.
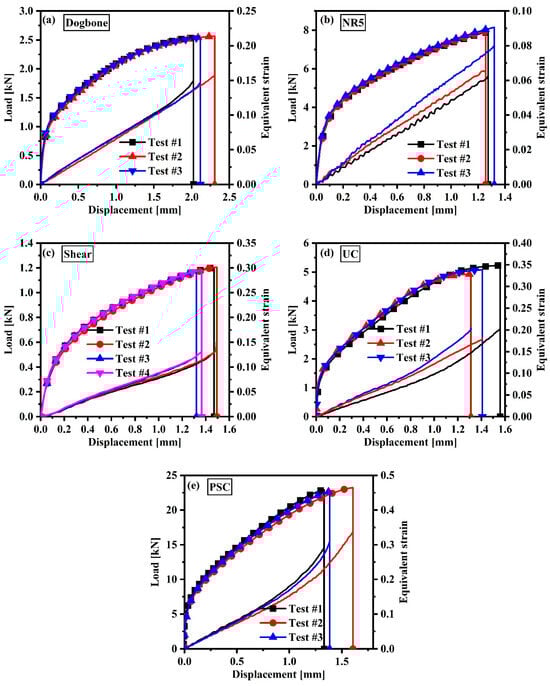
Figure 9.
Load–displacement results for: (a) dogbone, (b) NR5, (c) shear, (d) UC, and (e) PSC.
3.2. Finite Element Results
The results from the finite element simulations reveal a strong correlation with the experimental load–displacement curves for the dogbone, NR5, shear, UC, and PSC specimens, as illustrated in Figure 10. This figure provides a direct comparison of the experimental and numerically predicted responses, highlighting the model’s exceptional accuracy in capturing the mechanical behavior across various specimen geometries and loading conditions. Notably, the simulation results for the dogbone, NR5, and shear specimens exhibit remarkable alignment with the experimental data, with low error margins ranging around 0%, which underscores the precision and reliability of the modeling approach for standard tensile and moderate triaxiality conditions. In contrast, the UC and PSC specimens show somewhat larger error margins, ranging between −2% and 2%, as depicted in Figure 10d,e. These variances can be attributed to the increased complexity of the stress states and boundary conditions inherent to these geometries, which result in localized effects such as stress concentrations, non-uniform strain distributions, and potential microstructural influences that the continuum model may not completely capture. Nevertheless, the relatively low error values indicate that the model still provides a credible approximation of the mechanical response. The hardening behavior for the NR5, shear, UC, and PSC specimens was characterized by the Swift–Voce hardening law, with material parameters obtained through an inverse analysis process that involved iteratively matching simulated and experimental data. The optimized parameters, detailed in Table 3, were crucial for achieving accurate predictions of stress–strain responses across a range of stress triaxialities. The strong agreement between numerical and experimental results for all specimen types reinforces the effectiveness of the selected constitutive model and the robustness of the simulation framework in anticipating ductile deformation and failure in Mg-ZM51M components.
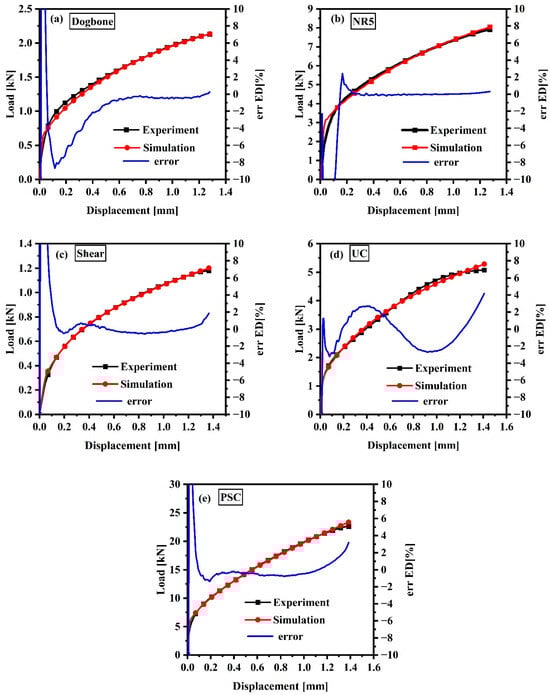
Figure 10.
Comparison of the experimental results with predicted load–displacement curves with error: (a) applying analytical modeling for dogbone, (b–e) applying inverse analysis for NR5, shear, UC, and PSC, respectively.
Table 3.
Parameters of the Swift–Voce law for NR5, shear, and PSC specimens found from inverse engineering.
4. Fracture Modeling
To accurately predict the ductile fracture behavior of Mg alloys across a wide range of stress states, three uncoupled damage criteria—Rice–Tracey, DF2014, and DF2016—were selected for comprehensive calibration and evaluation. These models represent different approaches to ductile fracture prediction, varying in their complexity and ability to account for the influence of stress triaxiality and the Lode parameter. The Rice–Tracey model, a foundational criterion, provides a baseline for comparison, while the more advanced DF2014 and DF2016 criteria offer enhanced capabilities to capture the intricate fracture mechanisms observed in metallic materials. By systematically calibrating and comparing these models against experimental data, this study aims to identify the most suitable criterion for reliable ductile failure predictions in ZM51M Mg alloys, thereby directly supporting the overarching goal of improving formability assessment and structural design.
4.1. Rice–Tracey Fracture Criterion
The Rice–Tracey fracture criterion provides insight into the formation of voids in ductile materials subjected to high stress triaxiality [22,40]. This criterion is based on a model that investigates the growth of an initially ellipsoidal void within a rigid-plastic matrix during significant plastic deformation, denoted in an integral form as follows:
where is the equivalent fracture strain, is the hydrostatic stress, is the von Mises equivalent stress, is the equivalent plastic strain increment, and is a material constant determined through calibration. The model shows a nonlinear relationship between the rate of void expansion and hydrostatic stress, indicating that as stress increases, void growth accelerates. This relationship is often represented in an integral format that incorporates both stress triaxiality and equivalent plastic strain. This criterion serves as a reliable method for predicting ductile failure and is commonly used in fracture simulations and damage modelling within engineering contexts.
4.2. DF2014 Fracture Criterion
The DF2014 fracture criterion represents a macroscopic model for ductile failure, incorporating the influences of both stress triaxiality and shear stress on damage accumulation [41]. It highlights the combined effects of void formation, expansion, and shear-induced merging. DF2014 fracture can be expressed as follows:
where is the equivalent plastic strain to fracture, indicates the maximum shear stress, and and are three material constants that need to be calibrated from experiments. According to this ductile fracture criteria, the shear coalescence of voids is influenced by the normalized maximum shear stress , the void nucleation is assumed to be proportionate to the equivalent plastic strain, and the void growth is controlled by the stress triaxiality . Both the normalized maximum shear stress term and the stress triaxiality term are exponentiated by two material constants and to modulate the impacts of void nucleation, growth, and shear coalescence on ductile fracture.
In order to predict the fracture locus, the Lode dependence in ductile fracture with the relationships in Equation (7) further transformed the criteria that were suggested by Lou et al. [42] as follows:
The equivalent plastic strain is influenced by void nucleation, while stress triaxiality is related to void growth, and the normalized maximum shear stress impacts the coalescence of voids. The experimental findings indicate that metals do not exhibit ductile fracture behavior when decreases, with the cut-off value related to the material and loading conditions. At room temperature and quasi-static conditions, indicates stress triaxiality and Lode parameter dependency. The Lode-dependent cut-off value for stress triaxiality is suggested [43] in the form of
The Lode dependence of the cut-off value in Equation (8) in the modified criteria in Equation (7) is used as follows:
As follows, the suggested ductile fracture criterion’s Lode-dependent form is derived below:
In addition, according to the experimental observation, the fracture parameter on the fracture locus illustrating principal stress space is set to two values: 0 and 1.
4.3. DF2016 Fracture Criterion
The DF2016 fracture criterion effectively estimates the fracture strain of metallic materials under a variety of loading conditions, including tension, compression, and shear [44]. Building upon its predecessor, DF2014, it incorporates advanced expressions for critical strain, taking into account stress triaxiality and the Lode angle, which allow for a more precise differentiation of fracture mechanisms. Its seamless transition across various loading paths renders it suitable for complex forming processes and crash scenarios in structural applications. Furthermore, the DF2016 criterion integrates effectively with finite element methods for numerical simulations of ductile failure. The DF2016 ductile fracture criterion is expressed as follows:
The function is suggested to be written in the form of
where C1, C2, C3, and C4 denote four distinct fracture parameters. Additionally, C is incorporated to account for the influence of L on the alteration of void shape throughout the deformation process. In numerical prediction, ductile fracture is viewed as a cumulative process. Hence, Equation (10) can be represented using an integral form as follows:
5. Prediction of Fracture Behavior
This section presents a comprehensive comparison between the experimentally observed fracture behavior of ZM51M Mg alloys and the predictions derived from the calibrated Rice–Tracey, DF2014, and DF2016 ductile fracture criteria. The objective is to critically evaluate the predictive accuracy of each model across the various stress states investigated, thereby identifying the most robust criterion for improving ductile failure assessment in these alloys. The subsequent analysis will detail the performance of each model, highlight key agreements and discrepancies with experimental data, and ultimately determine their suitability for practical engineering applications.
5.1. Assessment of Prediction Performance
The equivalent plastic strain (εp), which combines experiments and finite element simulations, was used to determine the fracture parameters. The equivalent plastic strain includes the fracture strain (εf) at the initiation of fracture, the stress triaxiality η, and the load factor (L).
The determination of Lode parameters and stress triaxiality relies exclusively on finite element simulations, which pose significant experimental challenges. Consequently, high-precision finite element models are vital for obtaining these parameters. Numerical simulations for both tensile and compression specimens were conducted using the Swift–Voce hardening model in line with the Mises yield criterion. Figure 11 displays the contours of equivalent plastic strain prior to the fracture point for the various specimens, including dogbone, NR5, shear, UC, and PSC. The DIC experiment reveals uneven strain distribution contours, attributed to insufficient stabilization of the specimens at the center during tensile testing. Overall, the finite element models developed effectively capture the plastic deformation behavior of these specimens. The stress triaxiality and normalized Lode angle have been calibrated for potential fracture initiation locations, particularly at the most critical sections. In the PSC specimens, the critical areas are not located in the central zone, whereas for upsetting tests, the critical points are found on the specimen’s surface. In contrast, for the simple shear test, the critical point is identified within the shear band. Throughout these experiments, it was noted that as plastic strain developed in the accumulated zone, the values of stress triaxiality exhibited variation. Notched testing indicates that the accumulated plastic strain corresponds to a stable increase in the normalized Lode angle. Furthermore, in the proposed basic shear test, both the stress triaxiality and normalized Lode angle are not exactly zero, highlighting the difficulty in achieving a pure shear stress state.
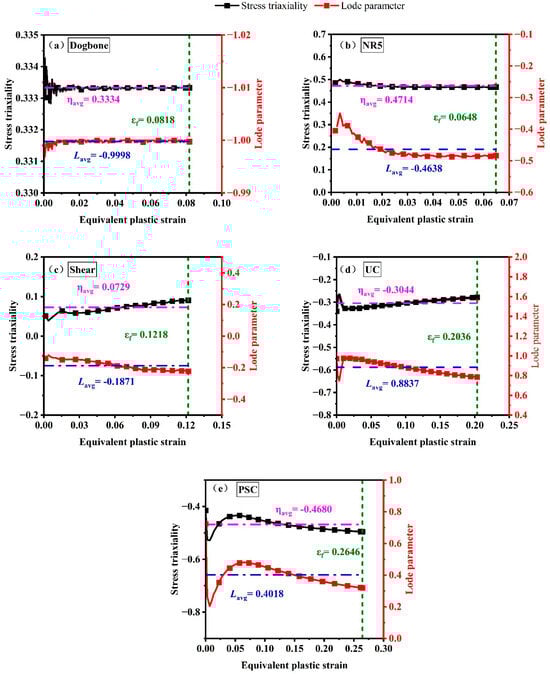
Figure 11.
Stress triaxiality and equivalent plastic strain for fracture tests of (a) dogbone, (b) NR5, (c) shear, (d) UC, and (e) PSC obtained from the numerical elements.
5.2. Comparison of the Experimental and Predicted Results
The fracture locus of Mg-ZM51M round bars is depicted using three distinct common isotropic criteria, which effectively model the ductile fracture behavior under five critical stress states for bar metals: dogbone, NR5, shear, UC, and PSC specimens. The experimental outcomes were carefully compared with predictions derived from the Rice–Tracey, DF2014, and DF2016 fracture criteria to examine the ductile fracture behavior under varying stress states. The Rice–Tracey criterion suggests that ductile fracture is influenced solely by stress triaxiality, predicting an exponential decrease in fracture strain as triaxiality increases. However, this dependence on uniaxial conditions limits its applicability in complex loading situations.
The DF2014 model, which accounts for both stress triaxiality and shear effects through a variable cut-off approach, demonstrated improved predictive performance, particularly under moderate triaxialities, compared to the Rice–Tracey model, although some discrepancies remained in extreme stress states. Figure 12 illustrates the loading paths at the points of fracture initiation used for model calibration. The diverse stress conditions observed in the tested specimens resulted in a wide range of fracture stresses and strains. The 3D fracture loci under plane stress conditions, depicted by the green and red solid lines in Figure 12, along with the corresponding strain values at the point of fracture initiation, indicate a non-linear relationship between fracture strain and varying triaxiality. A significant minimum in fracture strain was noted around a triaxiality value of 1.0, suggesting a critical transition in the fracture response under uniform stress conditions. Similar variations were observed under pure shear conditions, indicating that the fracture mechanism is influenced not only by hydrostatic stress but also by factors such as the Lode angle parameter, strain rate sensitivity, and evolving microstructural features like void nucleation and shear band formation.
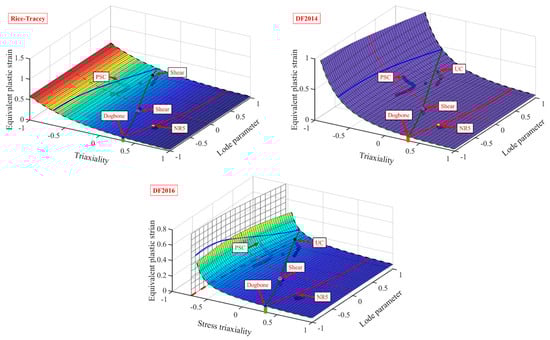
Figure 12.
Prediction of fracture strain for Rice–Tracey, DF2014, and DF2016.
The specimens exhibited notable fracture anisotropy under three representative stress states, which different damage models captured with varying degrees of accuracy. Among these models, the DF2016 criterion provided the most reliable predictions. By incorporating both stress triaxiality and the Lode angle parameter, it effectively represented fracture behavior across a wide range of multiaxial stress states. The DF2016 model closely matched experimental trends, particularly at intermediate and high triaxialities, where the DF2014 criteria were less accurate. Additionally, DF2016 was highly accurate in determining both the location and onset of fracture, with predictions aligning closely with experimental results, especially for dogbone specimens. These findings highlight that fracture strain is not only determined by the magnitude of the applied stress but is also significantly influenced by the nature and orientation of the stress state. Thus, using data from a single loading direction to calibrate fracture models is insufficient for accurately representing the anisotropic fracture behavior of metallic materials. A comprehensive multi-axial calibration is essential for generating robust and generalizable predictions of ductile fracture. The fracture parameters for the Rice–Tracey, DF2014, and DF2016 fracture criteria are calibrated using an unconstrained optimization method in MATLAB. This calibration relies on the experimental data presented in Table 4.
Table 4.
Calibrated fracture parameters of the different fracture criteria.
In summary, the comparative analysis of experimental and simulated fracture behavior unequivocally demonstrates the superior predictive capability of the DF2016 criterion for Mg-ZM51M alloys across the diverse range of stress states investigated. While the Rice–Tracey and DF2014 models provided valuable insights, their limitations in capturing complex fracture mechanisms, particularly under compressive and shear-dominated loading, were evident. The robust performance of the DF2016 model, evidenced by its close agreement with experimental fracture strains, significantly advances the reliability of ductile failure predictions for these lightweight alloys. This enhanced predictive accuracy is crucial for optimizing material utilization, improving design methodologies, and ultimately facilitating the broader and safer application of Mg alloys in demanding structural components.
6. Conclusions
This study significantly advances the understanding and prediction of ductile fracture in ZM51M Mg alloys, a critical step for their reliable application in lightweight structural components for industries such as automotive and aerospace. Through a combined experimental and numerical approach, we comprehensively characterized the fracture behavior of these alloys across a wide range of stress states, providing essential data on stress triaxiality, Lode parameter, and fracture strain at failure. This meticulous analysis offers crucial insights into how multiaxial stress environments influence the material’s failure mechanisms, directly improving the accuracy of ductile failure predictions. The investigation primarily focused on a specific ZM51M Mg alloy under quasi-static loading conditions and at room temperature. Furthermore, the uncoupled damage criteria employed, while effective, do not account for potential damage-plasticity coupling effects, which could influence fracture behavior under certain complex loading paths. The key findings of the study can be summarized as follows:
- The Swift–Voce hardening law provided a consistent characterization of the strain hardening behavior for dogbone specimens, exhibiting good agreement with the experimental true stress–true plastic strain curves. This indicates the model’s capacity to represent the material’s plastic response.
- The inverse analysis methodology, as applied in the numerical simulations, resulted in a high degree of agreement with the experimental load–displacement responses across all specimen types. With a prediction error consistently below 0.21%, the simulation framework demonstrated its capability in modeling mechanical behavior under complex multiaxial loading conditions.
- The Rice–Tracey, DF2014, and DF2016 fracture models demonstrated the ability to represent the fracture behavior across a broad range of stress triaxiality values. Among these, the DF2016 criterion consistently showed the highest predictive accuracy, particularly in simulating fracture initiation and progression under various loading scenarios. This suggests its potential as a reliable tool for predicting ductile failure in structural applications.
Building upon these findings, future work could explore the fracture behavior of ZM51M Mg alloys under dynamic loading conditions or elevated temperatures, which are relevant for many industrial applications. Investigating the influence of microstructure evolution on fracture mechanisms, potentially through the use of coupled damage models, would also provide deeper insights. Additionally, extending the experimental matrix to include more complex loading paths, such as non-proportional loading, could further refine the predictive capabilities of ductile fracture criteria.
Author Contributions
Conceptualization, T.S.A. and Y.L.; methodology, T.S.A. and Y.L.; software, T.S.A. and A.I.C.; validation, T.S.A. and A.I.C.; formal analysis, T.S.A. and H.A.; investigation, T.S.A. and A.I.C.; resources, Y.L.; data curation, T.S.A.; writing—original draft preparation, T.S.A. and H.A.; writing—review and editing, T.S.A. and Y.L.; visualization, T.S.A. and Y.L.; supervision, Y.L.; project administration, Y.L.; funding acquisition, Y.L. All authors have read and agreed to the published version of the manuscript.
Funding
This research was funded by the National Natural Science Foundation of China (grant numbers 52075423 and U2141214), the National Science and Technology Major Project (grant number Y2022-VII-0007-0049), and the National Science and Technology Major Project of China (grant number J2019-III-0008-0051).
Institutional Review Board Statement
Not applicable.
Informed Consent Statement
Not applicable.
Data Availability Statement
The original contributions presented in this study are included in the article. Further inquiries can be directed to the corresponding author.
Conflicts of Interest
The authors declare no conflicts of interest.
References
- Bazhenov, V.E.; Saidov, S.S.; Tselovalnik, Y.V.; Voropaeva, O.O.; Plisetskaya, I.V.; Tokar, A.A.; Bazlov, A.I.; Bautin, V.A.; Komissarov, A.A.; Koltygin, A.V.; et al. Comparison of Castability, Mechanical, and Corrosion Properties of Mg-Zn-Y-Zr Alloys Containing LPSO and W Phases. Trans. Nonferrous Met. Soc. China 2021, 31, 1276–1290. [Google Scholar] [CrossRef]
- Yang, Y.; Xiong, X.; Chen, J.; Peng, X.; Chen, D.; Pan, F. Research Advances of Magnesium and Magnesium Alloys Worldwide in 2022. J. Magnes. Alloys 2023, 11, 2611–2654. [Google Scholar] [CrossRef]
- Jena, K.D.; Cao, P. Processing of Magnesium Alloys by Mechanical Alloying. In Mechanically Alloyed Novel Materials: Processing, Applications, and Properties; Rajendrachari, S., Ed.; Springer Nature: Singapore, 2024; pp. 293–339. ISBN 978-981-97-6504-1. [Google Scholar]
- Xu, T.; Yang, Y.; Peng, X.; Song, J.; Pan, F. Overview of Advancement and Development Trend on Magnesium Alloy. J. Magnes. Alloys 2019, 7, 536–544. [Google Scholar] [CrossRef]
- Perić, D.; de Souza Neto, E.A. A New Computational Model for Tresca Plasticity at Finite Strains with an Optimal Parametrization in the Principal Space. Comput. Methods Appl. Mech. Eng. 1999, 171, 463–489. [Google Scholar] [CrossRef]
- Alhalaybeh, T.S.; Akhtar, H.; Chowdhury, A.I.; Lou, Y. Anisotropic Hardening of HC420 Steel Sheet: Experiments and Analytical Modeling. Metals 2025, 15, 149. [Google Scholar] [CrossRef]
- Billington, E.W. Generalized Isotropic Yield Criterion for Incompressible Materials. Acta Mech. 1988, 72, 1–20. [Google Scholar] [CrossRef]
- Cazacu, O. New Yield Criteria for Isotropic and Textured Metallic Materials. Int. J. Solids Struct. 2018, 139–140, 200–210. [Google Scholar] [CrossRef]
- Szabó, L.; Kossa, A. A New Exact Integration Method for the Drucker–Prager Elastoplastic Model with Linear Isotropic Hardening. Int. J. Solids Struct. 2012, 49, 170–190. [Google Scholar] [CrossRef]
- Yoshida, F.; Hamasaki, H.; Uemori, T. A User-Friendly 3D Yield Function to Describe Anisotropy of Steel Sheets. Int. J. Plast. 2013, 45, 119–139. [Google Scholar] [CrossRef]
- Thamer, A.; Yilihaer, M.; Hongchun, S.; Xiaoqing, L.; Liucheng, Z.; Yanshan, L. Artificial Neural Network Based Stamping Process Design for Three-Point Bending. Acta Mech. Sin. 2026, 42, 424895. [Google Scholar] [CrossRef]
- Karafillis, A.P.; Boyce, M.C. A General Anisotropic Yield Criterion Using Bounds and a Transformation Weighting Tensor. J. Mech. Phys. Solids 1993, 41, 1859–1886. [Google Scholar] [CrossRef]
- Barlat, F.; Lege, D.J.; Brem, J.C. A Six-Component Yield Function for Anisotropic Materials. Int. J. Plast. 1991, 7, 693–712. [Google Scholar] [CrossRef]
- Cazacu, O.; Plunkett, B.; Barlat, F. Orthotropic Yield Criterion for Hexagonal Closed Packed Metals. Int. J. Plast. 2006, 22, 1171–1194. [Google Scholar] [CrossRef]
- Plunkett, B.; Cazacu, O.; Barlat, F. Orthotropic Yield Criteria for Description of the Anisotropy in Tension and Compression of Sheet Metals. Int. J. Plast. 2008, 24, 847–866. [Google Scholar] [CrossRef]
- Gorji, M.B.; Furmanski, J.; Mohr, D. From Macro—To Micro—Experiments: Specimen-Size Independent Identification of Plasticity and Fracture Properties. Int. J. Mech. Sci. 2021, 199, 106389. [Google Scholar] [CrossRef]
- Espeseth, V.; Morin, D.; Tekoğlu, C.; Børvik, T.; Hopperstad, O.S. Ductile Tearing of Aluminium Plates: Experiments and Modelling. Int. J. Fract. 2023, 242, 39–70. [Google Scholar] [CrossRef]
- Gao, B.; Huang, W.; Wang, S.; Liu, Z.; Chen, X.; Su, S. Uncoupled Ductile Fracture Criterion Motivated by Micromechanisms: Modeling and Experiments. Eng. Fract. Mech. 2025, 313, 110659. [Google Scholar] [CrossRef]
- Cazacu, O.; Barlat, F. A Criterion for Description of Anisotropy and Yield Differential Effects in Pressure-Insensitive Metals. Int. J. Plast. 2004, 20, 2027–2045. [Google Scholar] [CrossRef]
- Lou, Y.; Zhang, S.; Yoon, J.W. Strength Modeling of Sheet Metals from Shear to Plane Strain Tension. Int. J. Plast. 2020, 134, 102813. [Google Scholar] [CrossRef]
- McClintock, F.A. A Criterion for Ductile Fracture by the Growth of Holes. J. Appl. Mech. 1968, 35, 363–371. [Google Scholar] [CrossRef]
- Rice, J.R.; Tracey, D.M. On the Ductile Enlargement of Voids in Triaxial Stress Fields∗. J. Mech. Phys. Solids 1969, 17, 201–217. [Google Scholar] [CrossRef]
- Gurson, A.L. Continuum Theory of Ductile Rupture by Void Nucleation and Growth: Part I—Yield Criteria and Flow Rules for Porous Ductile Media. J. Eng. Mater. Technol. 1977, 99, 2–15. [Google Scholar] [CrossRef]
- Bong, H.J.; Kim, D.; Kwon, Y.-N.; Lee, J. Predicting Hot Deformation Behaviors under Multiaxial Loading Using the Gurson-Tvergaard-Needleman Damage Model for Ti–6Al–4V Alloy Sheets. Eur. J. Mech.- A/Solids 2021, 87, 104227. [Google Scholar] [CrossRef]
- Kanvinde, A.M.; Deierlein, G.G. The Void Growth Model and the Stress Modified Critical Strain Model to Predict Ductile Fracture in Structural Steels. J. Struct. Eng. 2006, 132, 1907–1918. [Google Scholar] [CrossRef]
- Akhtar, H.; Alhalaybeh, T.S.; Fang, X.; Asbah, S.U.; Chao, S.; Lou, Y. Fracture Modeling of QP980 Steel: Evaluating the Rice–Tracey and DF2016 Criteria Under Diverse Loading States. Materials 2025, 18, 1303. [Google Scholar] [CrossRef] [PubMed]
- Li, H.; Fu, M.W.; Lu, J.; Yang, H. Ductile Fracture: Experiments and Computations. Int. J. Plast. 2011, 27, 147–180. [Google Scholar] [CrossRef]
- Xue, L. Constitutive Modeling of Void Shearing Effect in Ductile Fracture of Porous Materials. Eng. Fract. Mech. 2008, 75, 3343–3366. [Google Scholar] [CrossRef]
- Nahshon, K.; Hutchinson, J.W. Modification of the Gurson Model for Shear Failure. Eur. J. Mech.- A/Solids 2008, 27, 1–17. [Google Scholar] [CrossRef]
- Bai, Y.; Wierzbicki, T. Application of Extended Mohr–Coulomb Criterion to Ductile Fracture. Int. J. Fract. 2010, 161, 1–20. [Google Scholar] [CrossRef]
- Mirnia, M.J.; Vahdani, M. Calibration of Ductile Fracture Criterion from Shear to Equibiaxial Tension Using Hydraulic Bulge Test. J. Mater. Process. Technol. 2020, 280, 116589. [Google Scholar] [CrossRef]
- Göçmen, Y.; Erdogan, C.; Yalçinkaya, T. A Numerical Ballistic Performance Investigation of Armox 500T Steel through Ductile Damage Models. Eng. Fract. Mech. 2023, 292, 109658. [Google Scholar] [CrossRef]
- Barnwal, V.K.; Lee, S.-Y.; Choi, J.; Kim, J.-H.; Barlat, F. Performance Review of Various Uncoupled Fracture Criteria for TRIP Steel Sheet. Int. J. Mech. Sci. 2021, 195, 106269. [Google Scholar] [CrossRef]
- ASTM E8/E8M-21; Standard Test Methods for Tension Testing of Metallic Materials. ASTM International: West Conshohocken, PA, USA, 2021.
- Needleman, A.; Tvergaard, V. An Analysis of Ductile Rupture in Notched Bars. J. Mech. Phys. Solids 1984, 32, 461–490. [Google Scholar] [CrossRef]
- Peng, J.; Wang, Y.; Dai, Q.; Liu, X.; Liu, L.; Zhang, Z. Effect of Stress Triaxiality on Plastic Damage Evolution and Failure Mode for 316L Notched Specimen. Metals 2019, 9, 1067. [Google Scholar] [CrossRef]
- Thomason, P.F. Tensile Plastic Instability and Ductile Fracture Criteria in Uniaxial Compression Tests. Int. J. Mech. Sci. 1969, 11, 187–198. [Google Scholar] [CrossRef]
- Spulak, N.; Lowe, R.L.; Seidt, J.D.; Gilat, A.; Park, C.K.; Carney, K.S. Ductile Fracture under In-Plane Biaxial Tension and out-of-Plane Compression. Int. J. Solids Struct. 2020, 202, 234–242. [Google Scholar] [CrossRef]
- Zhang, D.F.; Shi, G.L.; Zhao, X.B.; Qi, F.G. Microstructure Evolution and Mechanical Properties of Mg-X%Zn-1%Mn (X=4, 5, 6, 7, 8, 9) Wrought Magnesium Alloys. Trans. Nonferrous Met. Soc. China 2011, 21, 15–25. [Google Scholar] [CrossRef]
- Kiran, R.; Khandelwal, K. Computational Models for Ductile Fracture Prediction in Structural Engineering Applications. Procedia Mater. Sci. 2014, 3, 1947–1955. [Google Scholar] [CrossRef]
- Li, F.-F.; Fang, G. Establishment and Verification of Two-Component Ductile Fracture Criteria with High Estimation Accuracy. Eng. Fract. Mech. 2018, 204, 221–234. [Google Scholar] [CrossRef]
- Lou, Y.; Huh, H. Extension of a Shear-Controlled Ductile Fracture Model Considering the Stress Triaxiality and the Lode Parameter. Int. J. Solids Struct. 2013, 50, 447–455. [Google Scholar] [CrossRef]
- Lou, Y.; Yoon, J.W.; Huh, H. Modeling of Shear Ductile Fracture Considering a Changeable Cut-off Value for Stress Triaxiality. Int. J. Plast. 2014, 54, 56–80. [Google Scholar] [CrossRef]
- Lou, Y.; Chen, L.; Calusmeyer, T.; Tekkaya, A.E.; Yoon, J. Modeling of ductile fracture from shear to balanced biaxial tension for sheet metals. Int. J. Solids Struct. 2017, 112, 169–184. [Google Scholar] [CrossRef]
Disclaimer/Publisher’s Note: The statements, opinions and data contained in all publications are solely those of the individual author(s) and contributor(s) and not of MDPI and/or the editor(s). MDPI and/or the editor(s) disclaim responsibility for any injury to people or property resulting from any ideas, methods, instructions or products referred to in the content. |
© 2025 by the authors. Licensee MDPI, Basel, Switzerland. This article is an open access article distributed under the terms and conditions of the Creative Commons Attribution (CC BY) license (https://creativecommons.org/licenses/by/4.0/).