Article

Evaluation of the Corrosion Behavior of Inconel 718 Alloy Processed by SLM Additive Manufacturing Method After 5000 h of Immersion in Natural Seawater

1
Institute of Physical Chemistry-Ilie Murgulescu, Splaiul Independentei 202, 060021 Bucharest, Romania
2
Surface Engineering and Corrosion Laboratory, Faculty of Industrial Engineering and Robotics, National University of Science and Technology Politehnica Bucharest, Splaiul Independentei 313, 060042 Bucharest, Romania
3
Romanian Research and Development Institute for Gas Turbines COMOTI, Iuliu Maniu 220D, 061126 Bucharest, Romania
*
Authors to whom correspondence should be addressed.
Metals 2025, 15(7), 713; https://doi.org/10.3390/met15070713
Submission received: 30 May 2025 / Revised: 20 June 2025 / Accepted: 24 June 2025 / Published: 26 June 2025

Abstract

The corrosion behavior of Inconel 718 alloy, developed through two different methods—forging (S1) and additive manufacturing (S2)—was evaluated in a seawater environment, and the results were compared with those of Inconel 825 alloy (S3). The corrosion performance of the alloys was examined according to ISO 8044/2024, using open circuit potential (OCP), potentiodynamic polarization (PP), and electrochemical impedance spectroscopy (EIS), in natural seawater at 25 °C over an extended immersion period. After 5000 h of immersion, the corrosion rate (Rcorr) estimated from anodic polarization tests was found to be lower for the wrought Inconel 718 alloy (1.21 µm y−1) compared to the wrought 825 alloy (4.1 µm y−1) and to the SLM Inconel 718 alloy (35.1 µm y−1), indicating high corrosion resistance for wrought Inconel 718. A morphological analysis of the alloy’s surface conducted using scanning electron microscopy (SEM) coupled with energy-dispersive X-ray spectroscopy (EDS) revealed a continuous, compact film with localized salt deposits on wrought Inconel 718 and Incoloy 825. In contrast, SLM Inconel 718 exhibited a porous, inhomogeneous film, leading to reduced protective capabilities and lower corrosion resistance. The results demonstrate that wrought Inconel 718 exhibits excellent corrosion resistance in seawater, making it a promising alloy for marine applications.

1. Introduction

Ni-based alloys are regarded as an essential category of materials extensively utilized in producing marine equipment and pipelines for oil and gas transportation, owing to their superior mechanical properties and corrosion resistance. The corrosion resistance of nickel-based alloys is influenced by several factors, including the alloy’s chemical composition and microstructure, [1,2] as well as the environmental characteristics in which they are used, such as pH, temperature, chloride concentration, and salinity [3,4]. The corrosion of these alloys in seawater significantly impacts the reliability and lifespan of marine equipment, raising serious concerns for scientists and engineers. Furthermore, the employed manufacturing techniques can also impact corrosion resistance [5,6,7]. Nickel-based alloys exhibit very low general corrosion rates in seawater due to the development of a passive surface film. The high corrosion resistance of nickel-based alloys is attributed to the protective oxide layer that forms on their surface, which consists of compounds made from nickel (Ni), chromium (Cr), and molybdenum (Mo) [8,9]. Numerous research studies [10,11] have shown that adding molybdenum to stainless steel and nickel-based alloys enhances corrosion resistance, especially against crevice corrosion. While Cr is necessary to form a protective passive film on the alloy surface; in the event the passive film is compromised, Mo alloying is beneficial in controlling the dissolution rate and promoting repassivation [12]. This ability to reduce metal dissolution is important for minimizing localized film damage. Consequently, the chemical composition of these alloys is crucial, especially in terms of the content of chromium, molybdenum, iron, niobium, and titanium, which are essential elements to achieve the desired properties. Notable nickel-based alloys with this composition include Inconel 718 and Incoloy 825. These alloys are widely used in high-temperature applications, such as aircraft engine components, chemical processing equipment, and marine machinery. In addition, when Inconel 718 alloy is used in gas turbines and operates in marine environments, corrosion can cause failure for this material, largely due to environmental factors [13].
Recent advancements in manufacturing technologies have introduced new challenges for researchers and engineers regarding the corrosion resistance of Ni-based alloys in seawater, particularly when producing components with complex geometries. Producing components from nickel alloys with intricate designs is challenging due to their high hardness, poor machinability, and low thermal conductivity [14]. Conventional processes like forging and casting often face design limitations and require extensive post-processing. However, new machining strategies have emerged to address these challenges. In particular, cryogenic cooling, hybrid minimum quantity lubrication (MQL), and high-feed turning techniques have greatly improved tool life and surface integrity when machining Inconel 718 [15,16,17]. These methods not only enhance manufacturing efficiency but also positively impact surface characteristics that can influence corrosion behavior during service. Similar hybrid cooling and sustainable machining solutions have also been successfully applied to other difficult-to-cut alloys, such as Ti6Al4V, especially in the aerospace sector [18]. However, this drawback can be overcome by using alternative fabrication methods like additive manufacturing (AM), which can facilitate the production of complex shapes. Several AM processes have been developed that use energy sources such as lasers, electron beams, or plasma arcs to melt Ni-based alloy powders selectively [19]. Selective laser melting (SLM) is a commonly used additive manufacturing (AM) technique in which a laser beam selectively melts a layer of alloy powder, and the layer-by-layer melting process helps build the required 3D shape of a component [20]. Moreover, the corrosion resistance in seawater of nickel-based alloys, manufactured through additive processes, is a significant property that warrants investigation for industrial applications.
To our knowledge, very few reports exist on the corrosion behavior of SLM Ni-based alloys in natural seawater. Given that the corrosion process occurs slowly, we believe that conducting a long-term immersion study in seawater will provide more accurate insights into the corrosion resistance of these alloys. Currently, no data is available on the corrosion performance of this alloy produced by additive manufacturing (AM) after immersion for extended periods (over 5000 h). However, several studies have reported on the corrosion behavior of other SLM Ni-based alloys in acidic and NaCl solutions for shorter immersion times [2,4,21]. The results indicated that the passive film formed on the surface of these alloys contains less chromium oxide and more nickel oxide and, as such, is more porous and exhibits lower corrosion resistance than the film formed on the wrought alloy.
Seawater is a complex mixture that includes inorganic salts, dissolved oxygen, suspended solids, organic matter, and microorganisms. Experiments conducted in synthetic seawater solutions can produce misleading results; therefore, using natural seawater for testing is essential. To gain more accurate information about the corrosion behavior of nickel-based alloys in marine environments that significantly impact their service life, using water from the Red Sea as the experimental medium is the best choice, given that this seawater has the highest salinity.
This study aims to evaluate the possibility of using alloy Inconel 718 to obtain components with complex geometry intended for marine environments. Currently, Inconel 825 is commonly used for these applications, but it requires traditional methods like casting or forging, which involve costly post-processing. Inconel 718 alloy is suitable for additive manufacturing (AM) through different techniques (SLS, SLM), allowing the manufacture of parts with complex geometry without subsequent processing. Thus, we will evaluate the corrosion behavior of AM-SLM specimens made from Inconel 718 for a long-term immersion period in a natural marine environment and compare them to traditional casting and forging specimens made from the same alloy and Incoloy 825. Moreover, this research aims to explore the potential of AM as a viable alternative for manufacturing complex marine components.
To assess the corrosion performance of these alloys in seawater from the Red Sea, the study was conducted over a long immersion period of 5000 h at 25 °C in static conditions. The corrosion resistance of these alloys was assessed using various corrosion parameters, including corrosion potential (Ecorr), corrosion current (icorr), and corrosion rate (Rcorr). This evaluation was carried out through electrochemical methods, such as Open Circuit Potential (OCP) measurements, Potentiodynamic Polarization (PP), and Electrochemical Impedance Spectroscopy (EIS). In order to gain further insight into the corrosion behavior of these alloys in seawater, additional information about surface morphology and corrosion products was obtained using Atomic Force Microscopy (AFM) and Scanning Electron Microscopy (SEM).

2. Materials and Methods

2.1. Materials Preparation

In this study, two types of nickel-based alloys were investigated—Inconel 718 produced through forging (Sample S1) and additive manufacturing using the selective laser melting technique (Sample S2) and the commercial Incoloy 825 from Ulbrich Stainless Steels & Special Metals Inc., North Haven, CT, USA, (Sample S3). The specimens (S2) with dimensions of 15 × 15 × 15 mm were fabricated using a ZRapid iSLM160 machine (ZRapid Technologies Co., Ltd., Suzhou, China), equipped with a 200 W IPG fiber laser operating at a wavelength of 1064–1080 nm and employing selective laser melting (SLM) technology (Table 1). The build was performed using the same Inconel 718 alloy powder as that used for the S1 sample, ensuring identical chemical composition and particle morphology. The machine features a build volume of 160 × 160 × 200 mm3 and operates under an inert gas atmosphere (argon or nitrogen), with the oxygen content maintained below 0.3% to limit oxidation during processing. The powder was expertly spread using a precision blade recoater system, ensuring a consistent layer thickness of 50 µm for this build, which enhances overall quality and performance. The specimens were fabricated using a 90° laser scanning strategy, alternating the scan direction between each layer to minimize residual stresses. To reduce thermal gradients and enhance layer adhesion, the build platform was preheated to 100 °C. A cross-type support structure was implemented to ensure stability during the build process and to minimize warping, following standard practices for selective laser melting (SLM). The specimens were manufactured without contour borders, and no post-build heat treatment was conducted before surface characterization.
Specimens measuring 1.0 cm2 were cut from the stock, then ground and polished using an automatic machine, the METCON Forcipol-Forcimat 1 V (Metkon, Kent, UK), along with a four-step preparation kit from AKASEL that included grinding discs, polishing compounds, and emulsions. After this preparation process, the specimens were meticulously rinsed with acetone and distilled water in an ultrasonic bath.

2.2. Electrochemical Measurements

Electrochemical corrosion experiments were conducted using a three-electrode electrochemical cell with an Ag/AgCl reference electrode and a Pt counter electrode. The tests were carried out using a Potentiostat/Galvanostat PARSTAT 4000 (Princeton Applied Research, AMETEK Scientific Instruments, Oak Ridge, TN, USA), and the results were analyzed using CorrView 3.3d software. The electrochemical experiments were conducted in natural seawater at room temperature (25 °C) under static conditions. The composition of the natural seawater and the physical parameters are presented in Table 2 and Table 3. To evaluate the corrosion behavior and corrosion resistance of these alloys in natural seawater, the long-term monitoring of open-circuit potential (OCP) was performed according to the static immersion method [22], for 5000 h of immersion. During the first 500 h, the Eoc value was logged at 12 h. For the subsequent 1500 h, the Eoc value was noted daily, and between 2000 and 5000 h, the Eoc value was recorded every 5 days. Electrochemical impedance spectroscopy (EIS) was carried out at the OCP potentiostatically, with an AC amplitude of 10 mV over the frequency range of 100 kHz to 0.01 Hz, during a long period of exposure in seawater. Potentiodynamic polarization was accomplished in the potential range from −0.3 V to +1.2 V vs. Ag/AgCl at a scan rate of 2.5 mV/s. CorrView 3.3d and ZView 2.7 specialized software (Scribner Associates, Inc., Souther Pines, NC, USA) were used to analyze the electrochemical parameters (Ecorr, jcorr, Rcorr) and EIS data. The electrolyte used was natural seawater from the Red Sea, whose average annual temperature is practically similar to that in the laboratory (25 °C) and relatively constant throughout the year. At the same time, Red Sea water is a more aggressive environment given its very high salinity. The volume of the solution was kept constant by adding fresh seawater. To preserve its properties, seawater from the Red Sea was stored at 25 °C. Three identical samples of each alloy were tested to certify the reproducibility.

2.3. Surface Examination Methods

Atomic force microscopy (AFM) was performed in non-contact mode using XE100 AFM (Park Systems, Suwon, Republic of Korea), having flexure-guided, cross-talk-eliminated scanners. All AFM measurements were performed with PPP-NCHR tips (NanosensorsTM) with the following characteristics: <8 nm tip radius, ~125 μm length, ~30 μm mean width, thickness ~4 μm, ~42 N/m force constant, and ~330 kHz resonance frequency. The AFM images were processed with the XEI program (v 1.8.0—Park Systems) for displaying purpose and roughness evaluation. The images are presented in classic mode as well as by the so-called “enhanced color”™ view mode, in order to improve the morphological details. Representative line scans are presented showing the scanned samples’ surface profile, and the selected particles’ dimensions are indicated with red arrows along the selected line.
The surface morphology and elemental composition of the Ni-based alloy samples (S1, S2, S3) after prolonged exposure to seawater were examined using a FEI Inspect F50 scanning electron microscope (FEI Company, Brno, Czech Republic), equipped with an EDAX APEX 2i energy-dispersive X-ray spectrometer (EDS) and an Apollo X SDD detector (EDAX Inc., Ametek MAD, Mahwah, NJ, USA). Before imaging, each sample was sputter-coated with a thin layer of gold using a SC7620 Mini Sputter Coater/Glow Discharge System (Quorum Technologies, Laughton, UK) to reduce the charging effects and enhance image quality.
SEM images were acquired at various magnifications, ranging from ×1200 to ×30,000, depending on the size and morphology of interest. Imaging was performed at an accelerating voltage of 20 kV and a spot size of 3.5. EDS spectra were collected from selected zones of each sample to assess the composition of the corrosion products and oxide films, targeting approximately 1200 counts to ensure an adequate signal-to-noise ratio. In addition, elemental distribution maps were generated to visualize the localization and association of elements within the corrosion layer and deposits.

3. Results and Discussion

3.1. Electrochemical Results

The electrochemical characterization of Ni-based alloys (S1, S2, and S3) was conducted to investigate their corrosion behavior in seawater at room temperature.

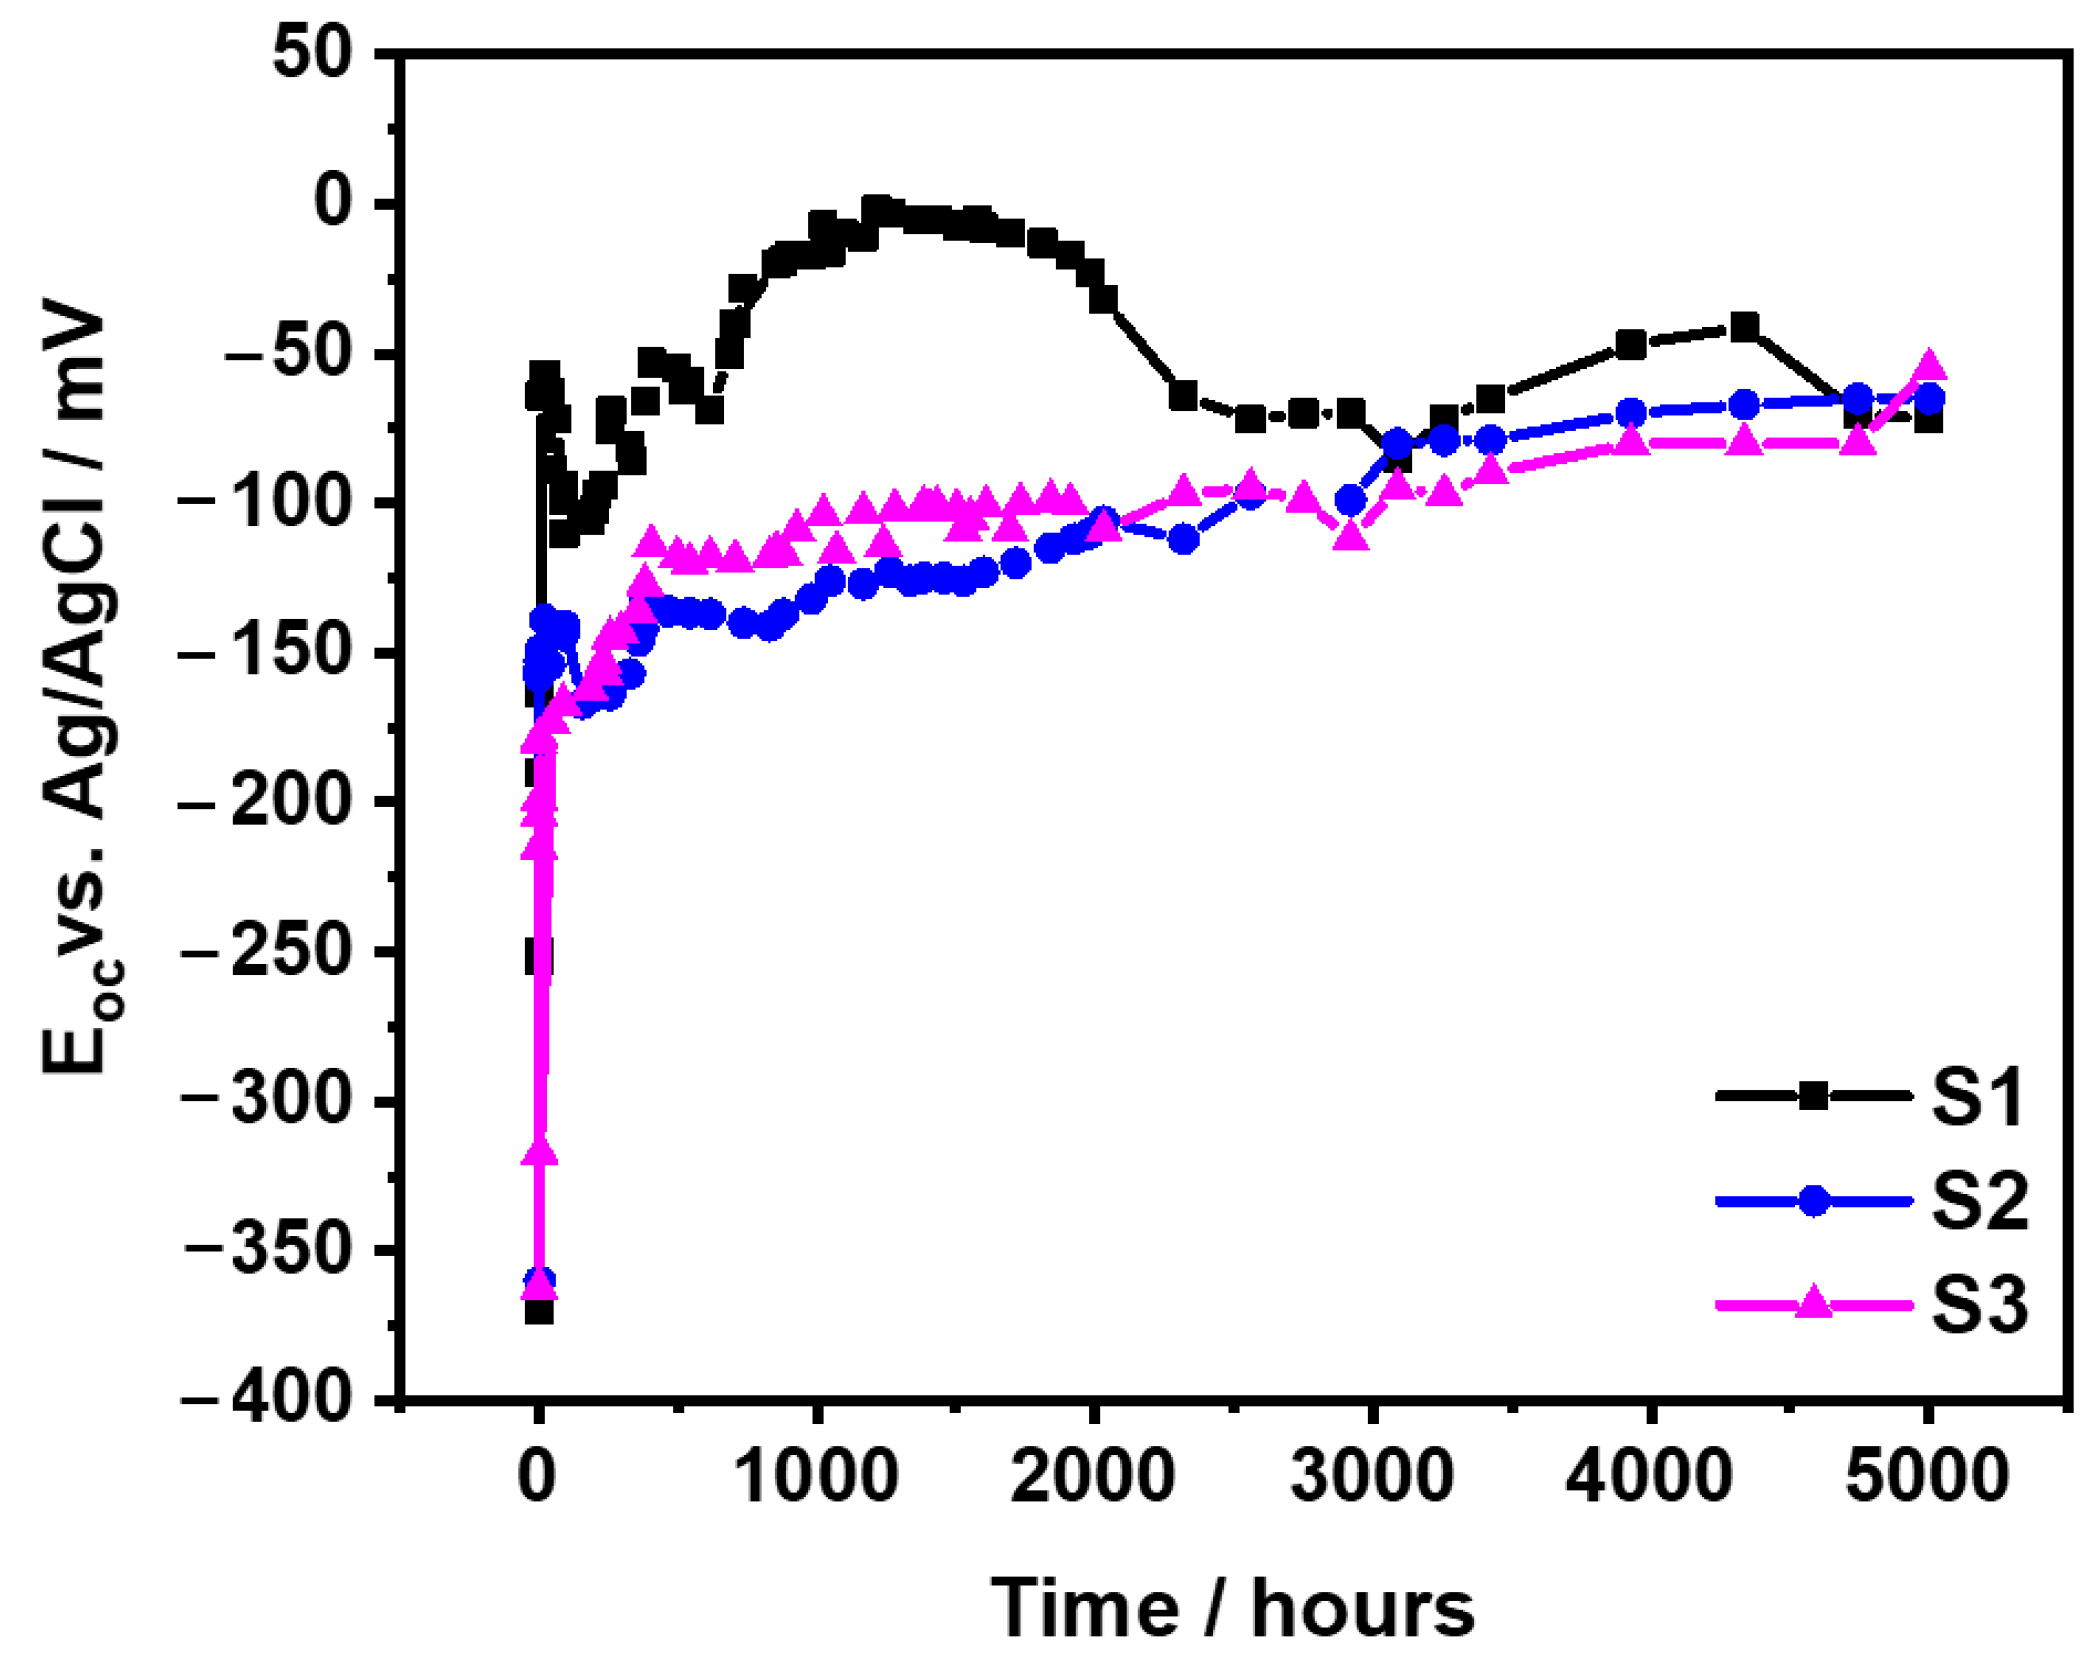
3.1.1. OCP Evolution

Figure 1 illustrates the evolution of the open circuit potential (OCP) over time for all three samples immersed in seawater at 25 °C for 5000 h. During the initial 24 h, all samples displayed similar behavior, marked by a rapid increase in their open circuit potential (Eoc) values. This increase is likely due to the formation of a thin oxide layer on the surfaces of the alloys. Afterwards, the surface state evolves and fluctuations in the Eoc values are observed over the next 2000 h, especially for the S1 sample. According to literature reports [23], the fluctuations observed in the OCP curves may be attributed to the localized instability of the electric double layer that forms on the surface of the alloys. This instability could be caused by the adsorption and desorption of salts from seawater, as well as the formation of specific residual corrosion products. Besides, the S1 sample exhibits more positive Eoc values than the S2 and S3 samples throughout the 2000 h of immersion. This characteristic observed in the S1 sample may be associated with the rapid formation of a film enriched in chromium, nickel, and molybdenum oxides [8]. After 2000 h of immersion, the S1 sample demonstrates a notable decrease in its Eoc value, dropping by approximately 60 mV. This slight potential shift in the negative direction could be associated with the partial dissolution of non-metallic inclusions or the metallic surface around them [24]. The distinct electrochemical behavior of sample S2 compared to S1, as depicted in Figure 1, can be attributed to their different manufacturing technologies. The film formed on the S2 sample surface is thinner than the S1 sample due to a more porous surface created by additive manufacturing technology. During the long immersion period, the S3 sample demonstrated similar behavior to the S2 sample. The open circuit potential (Eoc) initially shifted in a nobler direction over the first 500 h, eventually stabilizing at approximately −0.1 V vs. Ag/AgCl. After reaching this value, Eoc has shown only slight fluctuations over the next 1500 h. As shown in Figure 1, for the next 3000 h of immersion, the Eoc values of all samples remain relatively high, suggesting that the surface becomes passivated. This behavior is associated with the formation of a layer on the alloy’s surface consisting of nickel, chromium, and molybdenum oxides [25].

3.1.2. EIS Measurements

Electrochemical impedance spectroscopy (EIS) is a versatile nondestructive technique used to directly investigate the properties of passive films and assess their corrosion resistance. As shown in Figure 2, the impedance spectra are illustrated in both Bode and Nyquist plots. It is known that in Bode diagrams, the impedance Z at high frequency (f > 103 Hz) represents the solution resistance, and at low frequency (f < 1 Hz), the impedance Z is associated with the polarization resistance of the materials’ surface. Furthermore, the phase angle maxima at high frequency result from the formation of an electric double layer, while those at low frequency are due to the development of a protective passive film [2]. The Nyquist plots reveal incomplete and distorted semicircles for samples S1 and S3, (see Figure 2a), which are due to the charge transfer process at the electrolyte/electrode interface, and their diameters are related to the corrosion resistance of the alloys, i.e., the larger diameter is related to a higher corrosion resistance [2,26]. In contrast, sample S2 displays a distinct characteristic, with a Nyquist plot that shows a complete semicircle with a lower impedance value. This lower impedance is attributed to higher porosity resulting from the additive manufacturing method. The increased porosity leads to a larger surface area for sample S2, making it more susceptible to oxidation. Consequently, the film formed on this sample is less stable and more easily degraded by seawater, initiating the corrosion process [2,27].
Figure 2b demonstrates that the polarization resistance of the S2 sample is significantly lower than that of the S1 and S3 samples (i.e., Rp of S2 is smaller than Rp of S1 by two orders of magnitude), which is considerably affected by the properties of the film formed on the surface. Moreover, the Bode diagrams indicate that the phase angles of the S1 and S3 samples approach 90 degrees and 70 degrees, within the frequency range of 103 to 10−2 Hz, suggesting a superior protective capability of these alloys. The S3 sample exhibited a significant decrease in the phase angle at frequencies below 10 Hz, indicating lower corrosion resistance than the S1 sample. These findings are consistent with the potentiodynamic polarization studies, which revealed that the S1 sample exhibits higher corrosion resistance. To gain a deeper understanding of the corrosion behavior of the studied nickel-based alloys, the impedance spectra of all samples were fitted using an equivalent circuit (EEC) with two-time constants in parallel corresponding to a physical model illustrated in Figure 2c, and the fitted results are presented in Table 4 and plotted in a solid line in Figure 2a,b. The chi-squared values (χ2) are less than 1.2 × 10⁻³ for all samples. In this circuit, Rs, Rf, and Rct represent the electrolyte resistance, the film resistance, and the charge transfer resistance, respectively. A constant phase element (CPE) is used to describe the capacitive behavior of the surface. The first time constant, represented by CPEf/Rf, corresponds to the film formed on the surface during immersion, while the second time constant, represented by CPEdl/Rct, accounts for the corrosion processes occurring at the alloy/electrolyte interface [2,28]. This EEC model has previously been successfully applied to describe the corrosion behavior of other Ni-based alloys [4,29]. From these parameters, the polarization resistance (Rp) of the samples was calculated as the sum of the film resistance (Rf) and charge transfer resistance (Rct). The values obtained were 1622 Kohm cm2 for S1, 8.6 Kohm cm2 for S2, and 225 Kohm cm2 for S3, respectively. The Rp value of the S1 sample is significantly higher, by two orders of magnitude compared to S2 and by one order of magnitude compared with S3, suggesting better protective properties of the film formed on the S1 surface. According to literature reports [27,30], alloys with high porosity exhibit low film resistance (Rf = 1350 Ω·cm2 for S2 compared to Rf = 761,835 Ω·cm2 for S1, indicating that S2’s resistance is 560 times lower than that of S1 and a significantly higher value of the constant phase element of the film (see Table 4), which is about 1.5 times greater than that of the S1 sample (see Table 4). Therefore, we can conclude that the lower Rf observed in the S2 sample is likely due to its higher porosity, a characteristic of samples produced through additive manufacturing, which tends to promote corrosion. Other reports attest that the Rf values increase with a higher chromium and molybdenum oxide content in the passive film [8]. In the case of the S3 sample (with higher Fe content), the Rf is 67 times lower than that of S1 and 10 times higher than that of S2. The low film resistance (Rf = 11,331 Ω·cm2 for S3) suggests that higher iron content in the film may influence these results. Furthermore, the charge transfer resistance (Rct) for all samples is high (see Table 4). These values are comparable to the film resistance Rf, indicating that the corrosion resistance of all samples immersed in seawater is affected by both the film resistance and the charge transfer resistance. These findings reveal that the Inconel 718 alloy produced through additive manufacturing (S2) has a lower protective capability compared to wrought Inconel 718 alloys, which correlates with reduced corrosion resistance. Consequently, the EIS measurements align with the results from potentiodynamic polarization, which highlighted the superior corrosion resistance of the S1 sample in seawater.

3.1.3. Potentiodynamic Polarization

Potentiodynamic polarization curves can be used to study the corrosion behavior of the S1, S2, and S3 samples. These curves yield specific data on these alloys’ behavior after long seawater immersion. Figure 3 illustrates the polarization curves of the S1, S2, and S3 samples in stagnant seawater after 5000 h of immersion. Despite the differences in Ni and Fe content in the alloys, the S1 and S3 samples exhibit similar polarization behavior. The corrosion potential, Ecorr, is quite similar for the S1 and S3 samples, while it shifts approximately 100 mV in the positive direction for the S2 sample. Furthermore, the S1 and S3 samples demonstrate a pseudo passive region that extends up to 0.6 V (vs. Ag/AgCl), during which the current density remains below 10 µA cm−2 followed by the transpassive range up to 0.9 V. This pseudopassive region is attributed to the film formed on the surface during long-term immersion in seawater. Additionally, at higher potentials exceeding 0.6 V vs. Ag/AgCl, a notable increase in the current density, of about 175 µA cm−2 for the S1 sample and about 112 µA cm−2 for the S3 sample, was observed. This change is likely a result of the dissolution of the oxide layer, which is characteristic of the transpassive region. In contrast, the S2 sample produced through additive manufacturing exhibits a level of sensitivity, as evidenced by the increase in current densities from 29 µA cm2 to 126 µA cm2. However, these values remain in the range of tens of microamperes throughout the entire anodic curve. This behavior indicates a high dissolution rate, which is linked to the heterogeneity of the film formed on the surface [31]. According to literature reports [9], a thin layer of nickel oxide depleted in chromium and molybdenum may also contribute to this effect. It is important to note that, irrespective of manufacturing technology, all these alloys display an identical anodic peak current at approximately 0.1 V (vs. Ag/AgCl). Based on reported data [32,33], an active dissolution of nickel occurs at this potential, leading to the formation of a thin Ni(OH)2 layer, characteristic of nickel-based alloys in neutral environments. The presence of the Ni(OH)2 layer can temporarily slow down the dissolution process before higher oxidation states develop at elevated potentials [34].
In conclusion, the analysis of polarization curves shows that S1 and S3 samples undergo activation dissolution phenomena and also demonstrate evidence of pseudopassivation. What is more, the S2 sample, fabricated by additive manufacturing, exhibits greater surface activity during the immersion tests, which hinders the process of passivation. Additionally, Cl ions in seawater are known for their strong corrosive effects, which can impede the formation of a protective passive film on the sample surface [13]. However, the surface analysis conducted after 5000 h of immersion did not reveal any signs of localized corrosion. Under these circumstances, we conclude that the surfaces are resistant to attack by chlorine ions.
To assess the corrosion resistance of these alloys in seawater, the corrosion parameters, including corrosion current (jcorr), corrosion potential (Ecorr), and corrosion rate (Rcorr), were estimated. These parameters were determined by extrapolating Tafel curves recorded at various immersion times, and the results are depicted in Table 5. The results indicate that the three samples’ corrosion potential (Ecorr) shifts toward a nobler direction as the immersion period increases. This suggests that a protective film develops on the surfaces of all the alloys, serving as a barrier against corrosion processes. Additionally, after 5000 h of immersion, the Ecorr for the S2 sample is nobler, measuring −0.058 V vs. Ag/AgCl, compared to −0.164 V vs. Ag/AgCl for the S1 sample and−0.104 V vs. Ag/AgCl for the S3 sample. The nobler value in Ecorr of the S2 sample is related to the higher hydrophobicity of this surface due to its high roughness and low surface energy. It is well known that hydrophobic surfaces provide good corrosion protection for alloys. However, changes in corrosion potential cannot be used as a reliable index for evaluating corrosion resistance, particularly in the case of nickel-based alloys. In these alloys, the state of passivation is the primary factor in assessing the degree of corrosion [35]. The other main corrosion parameters, corrosion current (jcorr) and corrosion rate (Rcorr), were estimated together, since Rcorr is directly proportional to jcorr. During the initial 2000 h of immersion in seawater, the S2 and S3 samples exhibited a consistent increase in jcorr, rising from 6.7 to 15.36 µA cm−2 for S2 and from 1.8 to 10.1 µA cm−2 for the S3 sample. In contrast, the S1 sample showed a continuous decrease in jcorr during the first 1000 h of immersion, followed by a sharp increase in the subsequent 1000 h, with values rising from 1.97 × 10⁻² to 11.7 × 10⁻² µA cm−2. After 5000 h of immersion, the icorr of the S1 sample was two orders of magnitude lower than that of S2 and twice as low as that of S3 (see Table 5). In terms of corrosion rates, which correspond with the observed variations in corrosion current, the S1 sample consistently demonstrated the lowest values throughout the entire immersion period compared to the S2 and S3 samples. Notably, a significant increase in corrosion rate (Rcorr) was observed for the S2 and S3 samples after 2000 h of immersion (i.e., 113 µm y−1 for S2 and 129 µm y−1 for S3). In contrast, the S1 sample displayed a different pattern, with a corrosion rate of less than 1 µm y−1. This suggests that the protective film formed on the surface of the S1 sample is considerably more effective in resisting corrosion processes. After 5000 h of immersion, a visible decrease in the jcorr was observed for the S2 and S3 samples leading to lower values in Rcorr (i.e., 35.1 µm y−1 for S2 and 4.1 µm y−1 for S3 samples), suggesting that after this long period of immersion, the film grown on the surface is thicker and more stable, increasing the corrosion resistance of these two alloys. At the end of this immersion period, the S1 sample exhibited reliable protective properties in the film that formed on its surface. Consequently, the corrosion rate (Rcorr) estimated after this immersion period was approximately 1.21 µm y−1, which was the lowest corrosion rate recorded among the three studied samples. From these results, it is interesting to note that the corrosion parameters of the S1 sample, i.e., jcorr and Rcorr, do not change noticeably with the immersion time, revealing that the protective film formed on the surface of this alloy was not found to be susceptible to breakdown events. According to literature reports [8], the protective films grown during immersion have been characterized by the presence of Ni2+ in the alloy matrix, which accelerates the enrichment of Cr and Mo within the oxide [36] and improves the corrosion resistance of this Ni-based alloy irrespective of the oxidizing exposure environment. Based on these observations, we expect that a similar process will occur in our experiments. Most likely, the formation of a stable and thick film on the surface prevents pitting in these Ni-based alloys. These findings are supported by the SEM images, which did not show corrosion pitting on the analyzed surfaces.
To highlight the corrosion performance of wrought and SLM Inconel 718 in seawater, we compared the corrosion parameters obtained after prolonged immersion with similar alloys studied in a 3.5% NaCl solution. As shown in Table 6, the corrosion parameters, Ecorr and icorr, are either superior to or comparable with similar alloys reported in the literature [23,31,37,38]. The lower corrosion rate observed after 5000 h of immersion in natural seawater demonstrates the high corrosion resistance of the Inconel 718 alloy in marine environments.
In conclusion, the wrought alloy Inconel 718 provides excellent corrosion resistance in seawater, making it suitable for a broader range of applications in marine environments. Additionally, the satisfactory corrosion performance of SLM Incoloy 718 in seawater presents new opportunities for additive manufacturing (AM). This allows for the production of parts with complex geometries without the need for additional processing.

3.2. Surface Characterization

Surface Topography and Morphology

The samples were measured by AFM before and after corrosion tests. Figure 4 presents comparative 2D AFM images of the samples (topography), before (first row) and after corrosion (second row), at the scale of (5 × 5) μm2. The surface of the prepared samples (Figure 4a, first row) is relatively smooth, as their roughness (both root mean square (RMS) and average) is in the range of 1.3–2.1 nm (see Figure 5a). From the morphological point of view, the sample of the as-prepared samples (before corrosion) shows random grooves (dimples) and scratches (dark colored), as well as some particles. The fine structure of the samples is well exhibited in Figure 6, first row, where 2D topographic AFM images, enhanced colored, were registered over an area of (2 × 2) μm2. These small particles have diameters of 30–40 nm, as indicated by the selected features along the red lines presented below each AFM figure. The morphology of the samples appears to be changed after the corrosion experiments, as it is visible at both scales (Figure 4b,d,f and Figure 6b,d,f). The surface profiles (see the line scans from Figure 6) are changing their small features, as the surfaces become distorted by the corrosion process. The roughness histograms indicate an abrupt increase in surface corrugation, in the order S1 > S3 > S2.
To observe the growth of the passive film and corrosion products after 5000 h of immersion in seawater, the surface microstructure of all samples was analyzed.
The surface film of the S1 sample shows a thick, compact layer with some deposit products (Figure 7b). Preliminary energy-dispersive spectroscopy (EDS) analysis revealed the presence of elements associated with these salt deposits in specific areas, likely resulting from the alloy’s interaction with the marine environment. However, these deposits do not indicate any structural degradation of the protective film, which remains dense and well-adhered. Analysis of the elemental distribution on the surface reveals that the examined areas are deposits of complex compounds, specifically sodium and calcium oxysulfides, resulting from reactions with the marine environment and showing no relation to the alloy.
The relatively stable elemental distribution shown in Table 7 supports the existence of a continuous and resilient film on the surface.
Elemental mapping presented in Figure 8 confirmed this general stability, with Ni, Cr, and Mo evenly distributed across the surface. Oxygen overlapped with these elements, supporting the development of a continuous and protective oxide film. Localized enrichments of Na and K appeared restricted to isolated areas and are likely the result of salt deposits rather than indicators of film degradation. EDS analysis consistently showed Cr and Mo in all analyzed regions, supporting the presence of their respective oxides, which are known to enhance passivation. Ni remained the dominant surface element, with no signs of selective leaching. These findings confirm that the passive film formed on the S1 sample was chemically stable and provided effective long-term corrosion protection in seawater. Altogether, the evidence indicates that the corrosion process on the S1 surface was effectively inhibited by the film formed during long-term exposure to seawater.
Given that EDS elemental analysis revealed the presence of Cr and Mo oxides, it is necessary to distinguish between corrosion residues and passive layers. These differ in both origin and function; corrosion products are generally porous and form due to sustained electrochemical degradation, while passive layers are thin, stable oxides that suppress further corrosion. Although SEM-EDS alone cannot distinguish these layers conclusively, the markedly higher polarization resistance and clear passivation behavior observed for the S1 sample support the presence of a surface film with protective characteristics.
After 5000 h of seawater exposure, the S2 sample exhibited a rough and discontinuous film (Figure 9). SEM analysis revealed evidence of localized surface degradation, particularly in recessed areas where salt products had accumulated. Compared to S1, the film appeared less structurally coherent.
EDS point analysis (Table 8) showed a marked increase in Na content in Z1 and Z2 zones, suggesting the accumulation of more salts in these areas. Oxygen levels remained relatively uniform across all regions, whereas S showed slight variation, likely due to superficial contamination. Mo appeared enriched in both Z1 and Z2 areas, while Ni and Cr were reduced compared to the global composition, suggesting localized dissolution or incomplete passivation.
Elemental mapping (Figure 10) showed a heterogeneous distribution of Cr and Mo. Clusters of oxygen (O), Na, S, Cl, and Ca were detected in specific areas, indicating the presence of adsorbed products and surface contamination. The localized increases in sulfur and sodium further suggest that these are salt deposits rather than a continuous passive film. The characteristics indicate an uneven passive layer, which provides less corrosion resistance in seawater.
After 5000 h of seawater exposure, the S3 sample exhibited an intermediate surface condition. The oxide layer appeared partially developed, with uneven coverage and isolated clusters of corrosion products (Figure 11). SEM images showed surface irregularities and early-stage degradation, but no evidence of deep pitting or widespread film detachment. A notable feature in the SEM images (Figure 11c) is the presence of widespread acicular crystalline structures distributed across the surface. These structures are visible and extend over large areas, indicating the formation of corrosion-related crystallites not confined to isolated zones.
EDS point analysis (Table 9) revealed lower concentrations of Ni, Fe, and Cr in area Z1 compared to the global composition, suggesting selective leaching in localized areas. Fe showed a pronounced decrease, likely due to dissolution in the chloride-rich environment. In the Z1 area, the oxygen level was elevated, consistent with oxide formation, while Mo remained relatively stable. The localized oxygen enrichment is likely due to adsorbed or precipitated corrosion by products—such as metal oxides and marine salts accumulated in depressions or microstructurally heterogeneous regions. The co-detection of Na and K supports this interpretation, suggesting salt-derived surface residues. These oxygen-rich areas are isolated and do not reflect the overall behavior of the passive film observed across the surface.
Elemental mapping presented in Figure 12 confirmed the inhomogeneity of the passive film. Cr and Mo signals were irregularly distributed, while multiple elements (e.g., Ca, K, Na, Cr) appeared concentrated in distinct surface regions. These localized clusters suggest the presence of salt deposits or surface accumulations, rather than components of the oxide film itself. The oxygen signal inconsistently overlapped with the metallic elements, suggesting that the protective layer is chemically heterogeneous and incomplete.
The microstructural and compositional features observed for the S1 sample (wrought Inconel 718) support the electrochemical data, indicating its superior corrosion resistance. The protective film on the surface was continuous and compact, with small salt deposits dispersed across it (see Figure 7b). These deposits did not affect the overall chemical stability of the film, as confirmed by both EDS point analysis (Table 7) and elemental mapping (Figure 8). Minor variations in Cr, Mo, and Ni were observed between the global and Z1 areas, suggesting the homogeneity of the film grown on the surface. The consistent presence of Cr and Mo in all zones supports the formation of Cr and Mo oxides, which are known to enhance passivity [8]. Ni remained dominant and showed no evidence of selective leaching. The oxygen signal overlapped with Ni, Cr, and Mo, confirming the development of a stable and protective film. The low corrosion rates and high polarization resistance values align with this microstructural evidence, confirming that the protective layer formed on S1 effectively limited the corrosion process during long-term exposure.
The surface characterization results for the S2 sample (Inconel 718 SLM) support the electrochemical findings, which indicated lower corrosion resistance and higher corrosion rates compared to the S1 sample (Inconel 718 W). Scanning electron microscopy (SEM) and energy-dispersive X-ray spectroscopy (EDS) data revealed a rough, porous, and chemically inhomogeneous film that developed during immersion. Sodium (Na) showed a significant increase in both zones, Z1 and Z2, compared to the overall composition, indicating salt accumulation in corrosion-active areas. In contrast, sulfur (S) showed only minor variations, likely due to surface contamination. Ni and Cr were both reduced compared to the global composition, suggesting localized dissolution or incomplete passivation (Table 8). Mo appeared slightly enriched in Z1 and Z2, but its uneven distribution, together with that of Cr, reflects the disrupted formation of a protective oxide layer. Elemental mapping (Figure 10) showed non-uniform Cr and Mo signals and Na, K, Mg, and Cl clusters, pointing to salt entrapment. These observations confirm that the passive film is structurally compromised and chemically unstable. Such characteristics are typical for additively manufactured alloys, where process-induced microstructural heterogeneities and lack of uniformity in passive film development often impair corrosion performance [2].
The surface of the S3 sample, after 5000 h in seawater, exhibited partial oxide coverage with clear topographical irregularities, as supported by SEM (Figure 11), EDS (Figure 12), and mapping data. Although oxide formation occurred, the film lacked continuity and chemical uniformity. EDS analysis (Table 9) revealed lower Ni and Cr contents in the Z1 area, compared to the global composition, indicating localized alloy degradation. Iron (Fe) levels were also reduced, suggesting dissolution or the presence of soluble corrosion products. Mo showed slight enrichment in Z1, but its distribution remained irregular. These variations suggest limited and non-uniform film development. Similar effects have been reported in Fe-containing Ni alloys where iron-rich corrosion products form under chloride exposure, reducing passivation efficiency [39]. Elemental mapping (Figure 10) reinforced the SEM and EDS observations by revealing widespread acicular crystalline deposits distributed across the surface. These structures were predominantly enriched in Ca and O, with only minor Cr signals, suggesting that they represent product accumulations rather than constituents of the protective film. In contrast, Fe, Ni, and Mo were sparsely detected within these formations. The lack of consistent overlap between oxygen and metallic element signals further supports the interpretation that these deposits are superficial and formed post-corrosion, rather than being part of a uniform and stable oxide layer.
Overall, the findings indicate that wrought processing provides better protective film characteristics, while additive manufacturing requires further optimization to offer similar corrosion protection in chloride-rich environments like seawater.

4. Conclusions

This study investigates the corrosion behavior of two nickel-based alloys, Inconel 718 obtained by forging and additive manufacturing (SLM) and Incoloy 825, after 5000 h of immersion in seawater. The results are compared with the most used alloy for marine applications, wrought Incoloy 825. The study concluded with the following results:
(1)
This study demonstrates that the corrosion resistance of Ni-based alloys exposed to seawater is significantly influenced by the manufacturing process, which governs the structure and chemistry of the protective film formed.
(2)
The wrought Inconel 718 alloy (S1 sample) developed a dense, continuous, and compositionally stable protective film enriched in Cr and Mo, which provided the most effective protection against the corrosion process. In contrast, the additively manufactured SLM Inconel 718 alloy (S2 sample) exhibited a porous and chemically heterogeneous layer, disrupted by salt entrapment and surface defects, leading to lower corrosion resistance. The findings align well with the corrosion parameters estimated from Tafel curves during the immersion period, showing that the corrosion rate (Rcorr) of the wrought 718 alloy is significantly lower (thirty times) than that of the SLS 718 alloy. This suggests that the wrought 718 alloy exhibits superior corrosion resistance. Additionally, these results are further supported by electrochemical impedance spectroscopy (EIS) data, which indicate a higher polarization resistance (Rp) for the protective film of the wrought 718 alloy, measuring 1.622 MΩ cm−2, compared to just 8.6 kΩ cm−2 for the SLM 718 alloy.
(3)
In conclusion, polarization curve analysis reveals that wrought Inconel 718 and Incoloy 825 alloys display pseudopassivation and activation dissolution behavior. In contrast, the SLM Inconel 718 alloy shows increased sensitivity, indicated by a continuous rise in current density within the tens of microamperes range, suggesting a high dissolution rate linked to surface film heterogeneity. Notably, surface analysis of all samples after 5000 h of immersion indicated no localized corrosion, confirming the alloys’ resistance to marine corrosion.
(4)
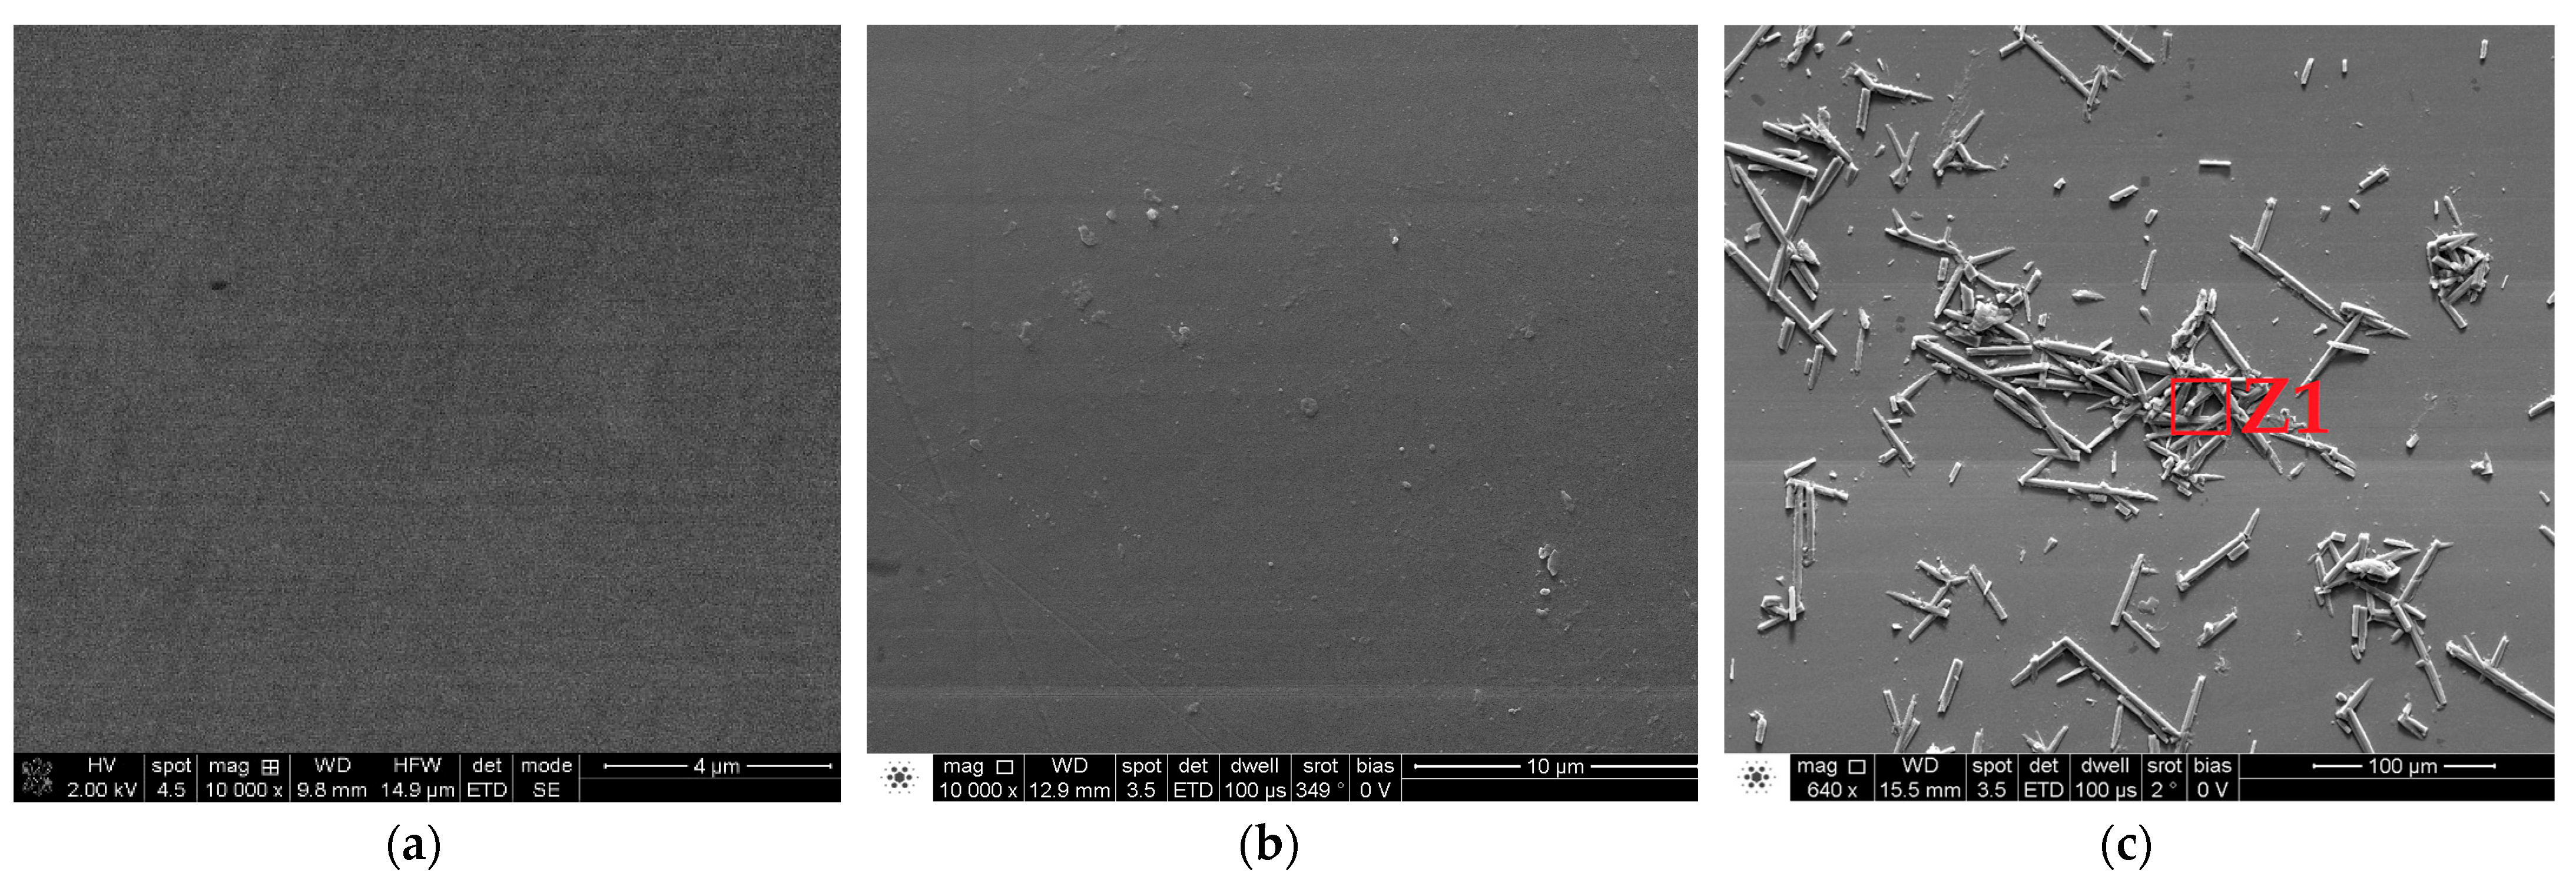
The Incoloy 825 commercial alloy (S3 sample) showed an intermediate response. Although its corrosion performance was superior to the AM-produced Inconel 718 (S2 sample), it did not achieve the same level of uniformity and chemical stability in the protective film as identified in the S1 alloy. The presence of widespread acicular deposits rich in calcium (Ca), oxygen (O), and chromium (Cr) indicates the accumulation of some products, which interfere with the formation of a homogeneous protective film on the alloy’s surface.
(5)
Compared to the corrosion performance of Inconel 718 alloys reported in NaCl solution, the examined alloy in seawater displayed superior corrosion resistance for wrought Inconel 718, while SLM Inconel 718 exhibited comparable corrosion performance, making them suitable for a broader range of applications in marine environments.

Author Contributions

Conceptualization, E.I.N., A.B. (Alexandra Banu) and M.M.; methodology, E.I.N.; validation, A.B. (Alexandra Banu); formal analysis, C.D., L.P. and M.A.; investigation, E.I.N., C.D., L.P., M.A., A.P. and A.B. (Adrian Bibis); resources, A.P.; data curation, A.P.; writing—original draft, M.A. and A.B. (Adrian Bibis); writing—review and editing, M.M.; supervision, M.M. All authors have read and agreed to the published version of the manuscript.

Funding

This work was carried out within “Nucleu” Program through The National Plan for Research, Development and Innovation 2022–2027, funded by Romanian Ministry of Research, Innovation and Digitization, grant no. 31N/2023.

Data Availability Statement

The original contributions presented in this study are included in the article. Further inquiries can be directed to the corresponding authors.

Acknowledgments

This study was performed within the framework of the Electrochemical preparation and characterization of active materials with predetermined features research project of the “Ilie Murgulescu” Institute of Physical Chemistry of the Romanian Academy.

Conflicts of Interest

The authors declare that they have no known competing financial interest or personal relationships that could have appeared to influence the work reported in this paper.

References

  1. Pavapootanont, G.; Wongpanya, P.; Viyanit, E.; Lothongkum, G. Corrosion Behavior of Ni Steels in Aerated 3.5-wt.% NaCl Solution at 25 °C by Potentiodynamic Method. Eng. J. 2018, 22, 1–12. [Google Scholar] [CrossRef]
  2. Zang, L.N.; Ojo, O.A. Corrosion behavior of wire arc additive manufactured. J. Alloys Compd. 2020, 829, 154455. [Google Scholar] [CrossRef]
  3. Yuan, S.Y.; Pehkonen, S.O. Surface characterization and corrosion behavior of 70/30 Cu-Ni alloy in pristine and sulfite-containing simulated seawater. Corros. Sci. 2007, 49, 1276–1304. [Google Scholar] [CrossRef]
  4. Wang, Q.-Y.; Zhang, X.-S.; Zheng, H.-B.; Liu, T.-Y.; Dong, L.-J.; Zhang, J.; Xi, Y.-C.; Zeng, D.-Z.; Lin, Y.-H.; Luo, H. Intergranular corrosion mechanism of sub-grain in laser additive manufactured Hastelloy C22 induced by heat treatment. Appl. Surf. Sci. 2023, 608, 155140. [Google Scholar] [CrossRef]
  5. Mehta, S.; Jha, S.; Liang, H. Corrosion of nickel-based alloys fabricated through additive manufacturing: A review. Prog. Addit. Manuf. 2022, 7, 1257–1273. [Google Scholar] [CrossRef]
  6. Thuneman, T.; Raja, K.S.; Charit, I. Room Temperature Corrosion Behavior of Selective Laser Melting (SLM)-Processed Ni-Fe Superalloy (Inconel 718) in 3.5% NaCl Solution at Different pH Conditions: Role of Microstructures. Crystals 2024, 14, 89. [Google Scholar] [CrossRef]
  7. Galvele, J.R. Tafel’s law in pitting corrosion and crevice corrosion susceptibility. Corros. Sci. 2005, 47, 3053–3067. [Google Scholar] [CrossRef]
  8. Henderson, J.D.; Almusned, B.; Momeni, M.; Anderson, S.; Dehnavi, V.; Zagidulin, D.; Shoesmith, D.W.; Noël, J.J. Investigating the influence of Cr and Mo Additions to Commercial Ni-Based Alloys Exposed to Neutral and Acidic Chloride Solution. J. Electrochim. Soc. 2020, 167, 131512. [Google Scholar] [CrossRef]
  9. Mirsha, A.K.; Shoesmith, D.W. The activation/depassivation of nickel–chromium–molybdenum alloys: An oxyanion or a pH effect—Part II. Electrochim. Acta 2013, 102, 328–335. [Google Scholar] [CrossRef]
  10. Lloyd, A.C.; Noël, J.J.; McIntyre, S.D.W.; Shoesmith, D.W. Cr, Mo and W alloying additions in Ni and their effect on passivity. Electrochim. Acta 2004, 49, 3015–3027. [Google Scholar] [CrossRef]
  11. Klapper, H.S.; Zadorozne, N.S.; Rebak, R.B. Localized corrosion characteristics of nickel alloys: A review. Acta Metall. Sin. 2017, 30, 296–305. [Google Scholar] [CrossRef]
  12. Gerretsen, J.H.; De Wit, J.H.W. The role of molybdenum in the active-passive transition of iron-chromium alloys. Electrochim. Acta 1991, 36, 1465–1467. [Google Scholar] [CrossRef]
  13. Stanciu, E.M.; Pascu, A.; Ţierean, M.H.; Voiculescu, I.; Roată, I.C.; Croitoru, C.; Hulka, I. Dual Coating Laser Cladding of NiCrBSi and Inconel 718. Mater. Manuf. Process. 2016, 31, 1556–1564. [Google Scholar] [CrossRef]
  14. Choudhury, I.A.; El-Baradie, M.A. Machinability of nickel-base super alloys: A general review. J. Mater. Res. Technol. 1998, 77, 278–284. [Google Scholar] [CrossRef]
  15. Amigo, F.J.; Urbikain, G.; Pereira, O.; Fernández-Lucio, P.; Fernández-Valdivielso, A.; López de Lacalle, L.N. Combination of high feed turning with cryogenic cooling on Inconel 718. J. Manuf. Process. 2020, 58, 208–222. [Google Scholar] [CrossRef]
  16. Mostafaei, A.; Ghiaasiaan, R.; Ho, I.-T.; Strayer, S.; Chang, K.-C.; Shamsaei, N.; Shao, S.; Paul, S.; Cho Yeh, A.G.; Tin, S.; et al. Additive manufacturing of nickel-based superalloys: A state-of-the-art review on process-structure-defect-property relationship. Prog. Mater. Sci. 2023, 136, 101108. [Google Scholar] [CrossRef]
  17. Pereira, R.B.D.; Gómez-Escudero, G.; Calleja-Ochoa, A.; Pereira, O.; González-Barrio, H.; Brandão, L.C.; López de Lacalle, L.N. Hybrid cryogenic/MQL helical milling for hole-making of Inconel 718. Results Eng. 2025, 26, 104776. [Google Scholar] [CrossRef]
  18. González, H.; Pereira, O.; López de Lacalle, L.N.; Calleja, A.; Ayesta, I.; Muñoa, J. Flank-milling of integral blade rotors made in Ti6Al4V using cryo CO₂ and minimum quantity lubrication (MQL). J. Manuf. Sci. Eng. 2021, 143, 091011. [Google Scholar] [CrossRef]
  19. Shahwaz, M.; Nath, P.; Sen, I. Recent advances in additive manufacturing technologies for Ni-Based Inconel superalloys—A comprehensive review. J. Alloys Compd. 2025, 1010, 177654. [Google Scholar] [CrossRef]
  20. Tang, Y.; Shen, X.; Liu, Z.; Xiao, Y.; Yang, L.; Lu, D.; Zhou, J.; Xu, J. Corrosion Behaviors of Selective Laser Melted Inconel 718 Alloy in NaOH Solution. Acta Metall. Sin. 2022, 58, 324–333. [Google Scholar] [CrossRef]
  21. Jeyaprakash, N.; Yang, C.H.; Karuppasamy, S.S.; Radhika, N. Microstructural evolution and anti-corrosion characteristics of as-cast and LPBF printed Inconel plates in seawater environment. Surf. Rev. Lett. 2023, 31, 2450032. [Google Scholar] [CrossRef]
  22. ISO 8044/2020; Corrosion of Metals and Alloys—Basic Terms and Definitions. ISO: Geneva, Switzerland, 2020.
  23. Tang, Z.; Yang, C.; Duan, Y.; Ma, L.; Zheng, S.; Li, M. Corrosion and wear behaviors of Inconel 718 nickel-based alloy by boroaluminizing. Surf. Coat. Technol. 2024, 478, 130500. [Google Scholar] [CrossRef]
  24. Huang, X.; Qiu, W.; Niu, B.; Zou, X.; Pan, L.; Kwok, C.T. Role of complex nonmetallic inclusions on the localized corrosion resistance of wire arc additively manufactured super duplex stainless steel. J. Mater. Res. Technol. 2024, 28, 799–813. [Google Scholar] [CrossRef]
  25. Pourbaix, M. Atlas of Electrochemical Equilibria. In Aqueous Solutions, 2nd ed.; National Association of Corrosion: Houston, TX, USA, 1974. [Google Scholar]
  26. Dobri, G.; Banu, A.; Donath, C.; Marcu, M. The Influence of the Tantalum Content on the Main Properties of the TixTa9Nb8Zr2Ag Alloy. Metals 2023, 13, 1294. [Google Scholar] [CrossRef]
  27. Xie, F.X.; He, X.B.; Lu, S.L.; Qu, X.H. Structural characterization and electrochemical behavior of a laser-sintered porous Ti–10Mo alloy. Corros. Sci. 2013, 67, 217–224. [Google Scholar] [CrossRef]
  28. Orezam, M.E.; Tribolet, B. Electrochemical Impedance Spectroscopy; Wiley: New York, NY, USA, 2017. [Google Scholar]
  29. Jiang, X.; Di, X.; Li, C.; Wang, D.; Hu, W. Improvement of mechanical properties and corrosion resistance for wire arc additive manufactured nickel alloy 690 by adding TiC particles. J. Alloys Compd. 2022, 928, 167198. [Google Scholar] [CrossRef]
  30. Banu, A.; Preda, L.; Marcu, M.; Dinca, L.L.; Maxim, M.E.; Dobri, G. Electrochemical Behavior of SLM Ti–6Al–4V Alloy After Long Time of Immersion in Lactic Acid. Metall. Mater. Trans. A Phys. Metall. Mater. Sci. 2022, 53, 2060–2070. [Google Scholar] [CrossRef]
  31. Tang, Y.; Shen, X.; Qiao, Y.; Yang, L.; Chen, J.; Lu, D.; Zhang, Z. Corrosion behavior of a Selective Laser Melted Inconel 718 Alloy in a 3.5% NaCl Solution. J. Mater. Eng. Perform. 2021, 30, 5506–5514. [Google Scholar] [CrossRef]
  32. Klapper, H.S.; Stevens, J. Susceptibility to Pitting Corrosion of Nickel-Based Alloy 718 Exposed to Simulated Drilling Environments. Corrosion 2014, 70, 899–906. [Google Scholar] [CrossRef]
  33. Markovic, T. The passivity of nickel in neutral and alkaline solutions. Werkst. Korros. 1965, 16, 570. [Google Scholar] [CrossRef]
  34. Macdonald, D.D. Passivity-The key to our metals-based civilization. Pure Appl. Chem. 1999, 71, 951–978. [Google Scholar] [CrossRef]
  35. Zhu, J.; Li, D.; Chang, W.; Wang, Z.; Hu, L.; Zhang, Y.; Wang, M.; Yang, Z.; Song, J.; Chen, S.; et al. In situ marine exposure study on corrosion behaviors of five alloys in coastal waters of western Pacific Ocean. J. Mater. Res. Technol. 2020, 9, 8104–8116. [Google Scholar] [CrossRef]
  36. Li, X.; Ogle, K. The Passivation of Ni-Cr-Mo Alloys: Time Resolved Enrichment and Dissolution of Cr and Mo during Passive-Active Cycles. J. Electrochem. Soc. 2019, 166, C3179–C3185. [Google Scholar] [CrossRef]
  37. Xu, Z.; Qin, X.; Liu, X.; Su, L.; Sun, Z.; Li, W.; Ma, X.; Guo, W.; Cheng, W. Effect of surface morphology and microstructure on the corrosion behavior of Inconel 718 superalloy prepared by laser additive and subtractive hybrid manufacturing. Mater. Today Commun. 2025, 44, 112176. [Google Scholar] [CrossRef]
  38. Zhao, B.; Hutt, K.; Yamaguchi, H.; Pan, S. Surface corrosion in laser powder bed fusion-fabricated Inconel 718 with magnetic field-assisted post-processing. J. Manuf. Process. 2025, 143, 277–292. [Google Scholar] [CrossRef]
  39. Li, X.; Wang, J.; Han, E.-H.; Ke, W. Corrosion behavior for Alloy 690 and Alloy 800 tubes in simulated primary water. Corros. Sci. 2013, 67, 169–178. [Google Scholar] [CrossRef]
Figure 1. OCP evolution of S1, S2, and S3 samples in seawater during 5000 h of immersion at 25 °C.
Metals 15 00713 g001
Figure 2. Nyquist (a) and Bode (b) plots of S1, S2, and S3 samples after 5000 h of immersion in seawater at 25 °C. (c) The physical model and the corresponding electric equivalent circuit used to fit the impedance data of S1, S2, and S3 samples.
Metals 15 00713 g002
Figure 3. Potentiodynamic polarization curves of S1, S2, and S3 samples after 5000 h of immersion in seawater at 25 °C.
Metals 15 00713 g003
Figure 4. 2D AFM images at the scale of (5 × 5) μm2 for samples S1, 1st row, S2, 2nd row, and S3, 3rd row, before (a,c,e) and after (b,d,f) corrosion experiments.
Metals 15 00713 g004
Figure 5. Roughness histograms of the investigated samples (root mean square (RMS) and average); (a), (5 × 5) µm2 scale, (b) (2 × 2) µm2 scale.
Metals 15 00713 g005
Figure 6. 2D AFM images at the scale of (2 × 2) μm2 for samples S1, 1st row, S2, 2nd row, and S3, 3rd row, accompanied by characteristic line scans plotted below each image, before (a,c,e) and after (b,d,f) corrosion experiments.
Metals 15 00713 g006
Figure 7. SEM images of the S1 sample before (a) and after 5000 h of immersion in static seawater: (b) area used for global chemical composition, (c) Z1 area.
Metals 15 00713 g007
Figure 8. EDS elemental mapping of the S1 sample after 5000 h of immersion in static seawater.
Metals 15 00713 g008
Figure 9. SEM images of the S2 sample before (a) and after 5000 h of immersion in static seawater: (b) area used for global chemical composition, (c) Z1 and Z2 areas.
Metals 15 00713 g009
Figure 10. EDS elemental mapping of the S2 sample after 5000 h of immersion in static seawater.
Metals 15 00713 g010
Figure 11. SEM images of the S3 sample before (a) and after 5000 h of immersion in static seawater (b), area used for global chemical composition, (c) Z1 area.
Metals 15 00713 g011
Figure 12. EDS elemental mapping of the S3 sample after 5000 h of immersion in static seawater.
Metals 15 00713 g012
Table 1. Nominal chemical composition (wt.%) of the main components of experimental ingots.
SampleNiCrMoFeNbMnCuTi
Inconel 718 (S1)552231330.5-1
SLM Inconel 718 (S2)552231330.5-1
Incoloy 825 (S3)4021331-11.81.2
Table 2. The chemical composition of seawater from the Red Sea (main ions).
IonsNa+K+Ca2+Mg2+ClSO42−NO3PO43−
mg L−114,110652712135023,25036890.80.11
Table 3. The physical parameters of the seawater used for the experiments.
MediumpHConductivity (mS cm−1)Salinity (ppt)Dissolved Oxygen (mg L−1)
Seawater6.555.2535.27.1
Table 4. EIS parameters obtained from fitting experimental data on the proposed equivalent electrical circuit of S1, S2, and S3 samples after 5000 h of immersion in seawater at 25 °C.
SampleRs (ohm cm2)CPEf sn Ω−1 cm−2nRf (ohm cm2)CPEdl sn Ω−1 cm−2nRct (ohm cm2)Rp (ohm cm2)
S15.46 ± 0.11.40 × 10−50.91761,835 ± 202.53 × 10−70.9859,695 ± 201,621,535 ± 51
S26.26 ± 0.22.50 × 10−50.891350 ± 123.52 × 10−50.517290 ± 708646 ± 7
S33.07 ± 0.14.90 × 10−50.8211,331 ± 151.41 × 10−50.88213,561 ± 10224,895 ± 12
Table 5. Corrosion parameters estimated by Tafel extrapolation for S1, S2, and S3 samples after different times of exposure in seawater.
Exposure
Time, h
S1S2S3
Ecorr
(V)
jcor
(µA cm−2)
Rcorr
(µm y−1)
Ecorr
(V)
jcor
(µA cm−2)
Rcorr
(µm y−1)
Ecorr
(V)
jcor
(µA cm−2)
Rcorr
(µm y−1)
336−0.158 ± 0.050.055 ± 0.010.39 ± 0.03−0.202 ± 0.036.7 ± 0.270.6 ± 0.3−0.284 ± 0.011.8 ± 0.219.3 ± 0.3
500−0.103 ± 0.010.031 ± 0.010.33 ± 0.04−0.156 ± 0.017.62 ± 0.1580.4 ± 0.5−0.165 ± 0.012.3 ± 0.125.3 ± 0.5
1000−0.095 ± 0.020.019 ± 0.020.20 ± 0.03−0.090 ± 0.0111.8 ±0.186.5 ± 0.7−0.153 ± 0.016.5 ± 0.269.8 ± 0.2
2000−0.097 ± 0.010.117 ± 0.010.82 ± 0.04−0.079 ± 0.0215.36 ± 0.1113.0 ± 0.5−0.135 ± 0.0110.1 ± 0.2129.0 ± 0.3
5000−0.164 ± 0.050.173 ± 0.021.21 ± 0.02−0.058 ± 0.012.33 ± 0.235.1 ± 0.6−0.104 ± 0.010.348 ± 0.014.1 ± 0.2
Table 6. Main corrosion parameters of Inconel 718 alloys estimated by electrochemical methods in 3.5% NaCl solution at different times of exposure.
Alloyicorr (A cm−2)Ecorr (mV)Rcorr (µm y−1)Time Immersion, hReferences
Inconel 7186.67 × 10−6−930 vs. SCE 1[23]
Inconel 718 SLM2.1 × 10−7−200 vs. SCE3.41[31]
Inconel 718 LDED *3.43 × 10⁻⁵−382 [35]
Inconel 718- LPBF **24.61 × 10⁻⁶−850 vs. Ag/AgCl 0.5[36]
Inconel 718 SLM2.33 × 10−6−58 vs. Ag/AgCl355000This paper ***
Inconel 718 wrought1.73 × 10−7−164 vs. Ag/AgCl1.215000This paper ***
* Inconel 718 fabricated using LDED—Laser Direct Energy Deposition; ** Inconel 718 fabricated by LPBF—Laser Powder Bed Fusion; *** Inconel 718 wrought and Inconel 718 SLM studied in natural seawater from the Red Sea, for long-time immersion.
Table 7. Chemical compositional (wt.%) of the areas (EDS derived) on the S1 sample after immersion in seawater for 5000 h.
Areas O K NaK MgK MoL TiK S K ClK K K CaK CrK FeK NiK
Global3.32.151.752.71.375.671.020.951.1719.484.1156.33
Z13.261.981.882.325.346.240.981.091.2619.434.1352.09
Table 8. Chemical compositional (wt.%) of areas (EDS derived) on the S2 sample after immersion in seawater for 5000 h.
AreasO KNaKMgKMoLTiKS KClKK KCaKCrKFeKNiK
Global2.841.791.542.311.175.731.050.941.1319.464.957.14
Z13.375.533.493.491.647.680.871.351.6916.724.8849.29
Z24.016.934.825.312.239.620.941.62.2714.475.5542.25
Table 9. Chemical compositional (wt.%) of the areas (EDS derived) on the S3 sample after immersion in seawater for 5000 h.
AreasO KNaKMgKMoLS KK KClKCaKTiKCrKFeKNiK
Global4.241.351.271.662.220.851.372.61.8919.3425.937.31
Z125.432.021.211.741.710.781.4144.171.335.145.899.17
Disclaimer/Publisher’s Note: The statements, opinions and data contained in all publications are solely those of the individual author(s) and contributor(s) and not of MDPI and/or the editor(s). MDPI and/or the editor(s) disclaim responsibility for any injury to people or property resulting from any ideas, methods, instructions or products referred to in the content.

