Article

Methods for Evaluating the Elastic Properties of Stainless Steel Perforated Plates

1
Institute of Mechanical and Biomedical Engineering, Riga Technical University, LV-1048 Riga, Latvia
2
Institute of High-Performance Materials and Structures, Riga Technical University, LV-1048 Riga, Latvia
3
Institute of Materials and Surface Engineering, Riga Technical University, LV-1048 Riga, Latvia
4
Institute of Civil Engineering, Riga Technical University, LV-1048 Riga, Latvia
*
Author to whom correspondence should be addressed.
Metals 2025, 15(7), 711; https://doi.org/10.3390/met15070711
Submission received: 15 May 2025 / Revised: 23 June 2025 / Accepted: 24 June 2025 / Published: 26 June 2025
(This article belongs to the Special Issue Metallic Functional Materials: Development and Applications)

Abstract

Perforated materials are widely used in various fields, including in medicine, for example, in trays for placing and storing cutting tools and for sterilizing disposable materials. Currently, the effective elastic modulus of orthopedic plates is higher than the effective elastic modulus of human bone tissue (the effective elastic modulus of bone ranges between 10 and 30 GPa, depending on the type of bone). This difference in effective elastic modulus leads to the phenomenon known as the stress shielding effect, where the bone experiences insufficient mechanical loading. One potential approach to influence the effective elastic modulus of orthopedic plates is through perforations in their design. Stainless steel 316L has garnered significant interest among medical engineering specialists due to its lower weight, higher strength, and superior biocompatibility. The elastic properties of perforated constructions are influenced by their internal quality, dimensions, shapes, and the overall perforation area, making their study important. An experiment was conducted on perforated plates of 316L stainless steel with perforation areas ranging from 3% to 20%. Increasing the perforation area in perforated 316L stainless steel plates (perforated plates had dimensions of 50 mm in height, 20 mm in width, and 1 mm in thickness; hole diameter of 1 mm; and pitch between the holes of 2, 3, 4, and 5 mm) from 3% to 20% resulted in a decrease in Young’s modulus of the perforated plates from 199 GPa to 147.8 GPa, determined using a non-destructive method for determining resonant frequencies using a laser vibrometer. A three-point bending test on the perforated plates confirmed these findings, demonstrating a consistent trend of decreasing Young’s modulus with increasing perforation area, from 194.4 GPa at 3.14% to 142.6 GPa at 19.63%. The three-point bending method was also employed in this study to determine the Young’s modulus of the perforated plates in order to reinforce the obtained results on the elastic properties by determining the resonance frequencies with a laser vibrometer. It was discovered that the Young’s modulus of a perforated plate cannot be determined solely by the perforation area, as it depends on both the perforation diameter and the pitch between the perforations. In addition, finite element method (FEM) simulations were conducted, revealing that increasing perforation diameter and decreasing pitch significantly reduce the Young’s modulus—with values dropping from 201.5 GPa to 72.6 GPa across various configurations.

1. Introduction

Metals such as stainless steel and titanium are extensively used in medical devices due to their corrosion resistance, durability, and biocompatibility. Stainless steel is commonly used for sterilization trays and surgical instrument storage, while titanium is favored for implants due to its strength and biocompatibility [1,2]. Perforation is the process of creating regular or irregular holes in a material [3,4]. One of the main advantages of perforated metal constructions is their lightness. Due to the holes, perforated metal constructions are considerably lighter than their solid counterparts, which reduces the overall weight of structures and facilitates transportation and installation (Figure 1).
Perforated constructions can be made from various substances, such as paper, cardboard, plastic, and metal. Metal perforation is carried out using methods such as stamping, laser cutting, waterjet cutting, and others. Stamping is a more efficient technology for mass production, providing a high processing speed and low cost for high volumes. However, stamping technology has disadvantages, such as high cost in small series production, as well as the difficulty of modifying the design of the structure. Also, stamping is not suitable for all materials and their thickness, and may also cause burrs and defects on the products, which makes it unacceptable for medical devices such as orthopedic implants [4]. Laser cutting technology provides the most precise and accurate perforation of structures; therefore, it is suitable for most materials and makes it possible to create shapes of various complexity [4]. Waterjet cutting is also suitable for all materials and provides high quality perforations, but without the heat of laser cutting. The perforation process with waterjet cutting is longer than that with laser cutting. The accuracy and precision of waterjet cutting is less than that of laser cutting, but better than that of punching [4].
Perforated materials can vary significantly depending on their application and technical requirements [5,6,7,8].
Perforated materials also offer sufficient strength and stiffness, making them suitable for constructions where both lightness and durability are important. Another important factor in the use of perforated materials is cost efficiency. The perforation process helps to save raw materials, reducing production costs [4,6,9]. Thus, perforated materials combine functional and economic advantages, making them highly sought after in various industrial and construction sectors [7,9,10]. Also, microperforated materials are a type of perforated metal material characterized by having very small holes, typically in the millimeter or sub-millimeter range. These materials are designed to provide specific properties that cannot be achieved with solid materials. The main features and applications of microperforated materials are highly effective for sound absorption without the need for additional classical absorbing materials, making them ideal for applications in machinery, aerospace, and industrial enclosures [11,12]. Despite their reduced weight, microperforated materials can still provide significant tensile strength and stiffness, depending on the source material [13]. They are used in construction for creating lightweight but strong structural elements. In medical applications, particularly in the field of biomaterial development and research, a key challenge is to optimize the physical and chemical properties of materials to enhance biocompatibility, reduce weight, and adjust elasticity to match that of bone while maintaining material strength.
Currently, perforation technology is being increasingly used for medical applications. For the production of sterilization trays and trays for washing instruments, it is most appropriate to use the waterjet cutting method for perforation, which provides higher productivity and economic efficiency. For the production of implants, the laser perforation method is preferred, which provides holes in plates and structures of small diameter [14,15,16]. These applications include perforation technology in the construction sector.
Implants used in medicine, such as orthopedic implants, dental implants, and bone fixators, are subject to stress shielding, which occurs when an implant bears the mechanical loads that would otherwise be carried by the bone. This happens because the implant, often made from a material stiffer than the surrounding bone, takes on a disproportionate share of the load, reducing the stress on the bone [17]. Stress shielding can lead to a reduction in bone density and strength because the bone is not subjected to the usual physiological stresses that stimulate remodeling and maintenance [17]. This can lead to a reduction in the mechanical stress experienced by the bone, which in turn can cause bone resorption and weakening over time. In the context of biomedical implants, stress shielding is a critical issue because it can compromise the long-term success of the implant. For example, metal implants, which are much stiffer than bone, can lead to significant stress shielding. This mismatch in stiffness results in the bone not being sufficiently loaded, which is necessary for maintaining bone density and strength [18]. To prevent mechanical stress shielding—where implants with high elastic properties take on most of the load, leading to the atrophy and decreased density of the surrounding bone tissue known as osteopenia or osteoporosis—it is important to reduce elastic properties such as the Young’s modulus of construction for orthopedic implants [17]. Constructions with a Young’s modulus close to the elastic properties of human bone (Young’s modulus of human bone is 10–30 GPa) provide better load distribution between the orthopedic implant and the bone, reducing the risk of bone degradation [19,20].
The primary objective of this article is to determine whether perforations in metal could be used to affect the construction’s elastic properties to an optimal level for orthopedic implants. By varying the percentage of the perforated area, along with controlling the shape, size, and pattern of the holes, it is possible to adjust the Young’s modulus of the implant construction to match that of the specific bone into which the orthopedic implant will be inserted.
According to Hooke’s law, for an isotropic body:
σ = E ϵ
where σ is the stress, depending on force and cross-sectional area, the Young’s modulus of construction is related to the cross-sectional area of the construction under stress [21,22]. Specifically, Young’s modulus is determined by the ratio of applied stress to strain, where stress is the force per unit area [23]. As the cross-sectional area of construction affects the distribution of the applied force, any change in will directly influence the magnitude of stress, and, therefore, the calculation of E [24]. Thus, for a given construction, variations in the cross-sectional area (depending on perforation diameter and pitch between perforations) can significantly impact the construction’s apparent stiffness and deformation response under load. The integration of perforations into the metal structure, specifically in this research into a metal plate, reduces the cross-sectional area. Consequently, the method of perforation influences the Young’s modulus of construction, effectively lowering it.
The three-point bending test is a standardized destructive method widely used in materials science to assess the mechanical properties of materials, particularly their flexural behavior and Young’s modulus [25]. This method provides critical information on the response of materials to bending loads, which is particularly relevant in the context of orthopedic implant manufacturing, where components frequently experience flexural stresses during service. In this method, a rectangular or beam-like specimen is positioned on two parallel supports, and a concentrated load is applied at its center. As the load increases, the specimen bends, and the corresponding force–displacement response is recorded. The calculation of Young’s modulus, based on the Euler–Bernoulli beam theory, uses the following equation:
E = F   L 3 4 d b h 3
where E is the Young’s modulus, F is the applied force, L is the span length between supports, b and h are the width and thickness of the tested specimen, and d is the deflection at the load point [25].
Finite element method (FEM) analysis is widely used to investigate the mechanical behavior of perforated materials under various loading conditions. The presence of perforations significantly influences the stress–strain distribution, load capacity, and energy absorption characteristics of materials, which are crucial for their application in engineering structures. These analyses provide valuable insights for optimizing design parameters to enhance the structural efficiency of perforated material [26]. The elastic properties of materials are currently mostly determined using mechanical compression or tension tests, in which the deformation of the material under load is measured. In addition to these methods, bending, torsion, and dynamic loading tests are used to evaluate the behavior of the material under different conditions [4].
Summarizing the relevance of perforated materials and the necessity to optimize the elastic properties of constructions for orthopedic implants, the primary objective of this article was to investigate the effect of varying perforation areas and hole diameter and pitch between holes on the elastic properties of these constructions, and to explore the potential application of using this technology in orthopedic implant design.

2. Materials and Methods

2.1. Stainless Steel 316L Plate Perforation

The main task of this article is to analyze the dependence of the elastic properties of 316L stainless steel perforated plates on the perforation area. For the experiment, austenitic stainless steel AISI 316L was selected due to its low carbon content. It is well known for its high corrosion resistance, especially in aggressive environments and against intergranular corrosion. AISI 316L contains approximately 16–18% Cr, 10–14% Ni, and up to 2% Mo, which provides this material with greater mechanical strength compared to other stainless steel grades. However, other grades can also be used—for example, AISI 304, which offers increased ductility, a property that is essential for the fabrication of complex-shaped cranial implants. The stainless steel 316L metal alloy was selected for the experiment due to its lower weight, greater durability, and higher biocompatibility [27,28,29,30]. In this study, only one specimen was tested for each perforation percentage. The primary objective of this study was to explore the conceptual potential of perforation to modulate the elastic properties of orthopedic implants, with less emphasis placed on deriving statistically reliable or standardized values for each specific perforation configuration. Specifically, this study highlights how perforation can effectively reduce the Young’s modulus of metallic implant materials, thereby offering a prospective approach to reduce the stress shielding effect. Four stainless steel 316L plates with dimensions of 50 mm in height, 20 mm in width, and 1 mm in thickness were manufactured and fabricated using the same equipment, materials, and parameters to ensure consistency across tests. The perforations in all specimens were created individually on solid stainless steel 316L plates using laser cutting, rather than cutting shapes from pre-perforated sheets. This ensured full control over the perforation geometry and positioning. The holes were arranged in a regular square pattern and oriented symmetrically, with the perforation grid aligned perpendicular to all plate edges. Special care was taken to preserve exact distances between perforations and from the perforations to the edges of the specimen. The precision of the cutting process was verified, confirming that the perforations were consistent and accurately positioned relative to the bending direction. Laser cutting was used for the stainless steel 316L plates, and the perforation parameters are shown in Table 1. The determination of resonance frequencies using a laser vibrometer Polytec PSV-500 (Polytec GmbH, Waldbronn, Germany) was employed to determine the Young’s modulus of the perforated stainless steel 316L plates. The results from the laser vibrometry were processed to determine the dependence of the Young’s modulus of the perforated stainless steel 316L plates on the perforation area. The perforation type was circular in a square arrangement. The perforation area was calculated using the following formula:
A p e r f = d 2 78.54 s 2
where d is the hole diameter and s is the pitch between holes [4].
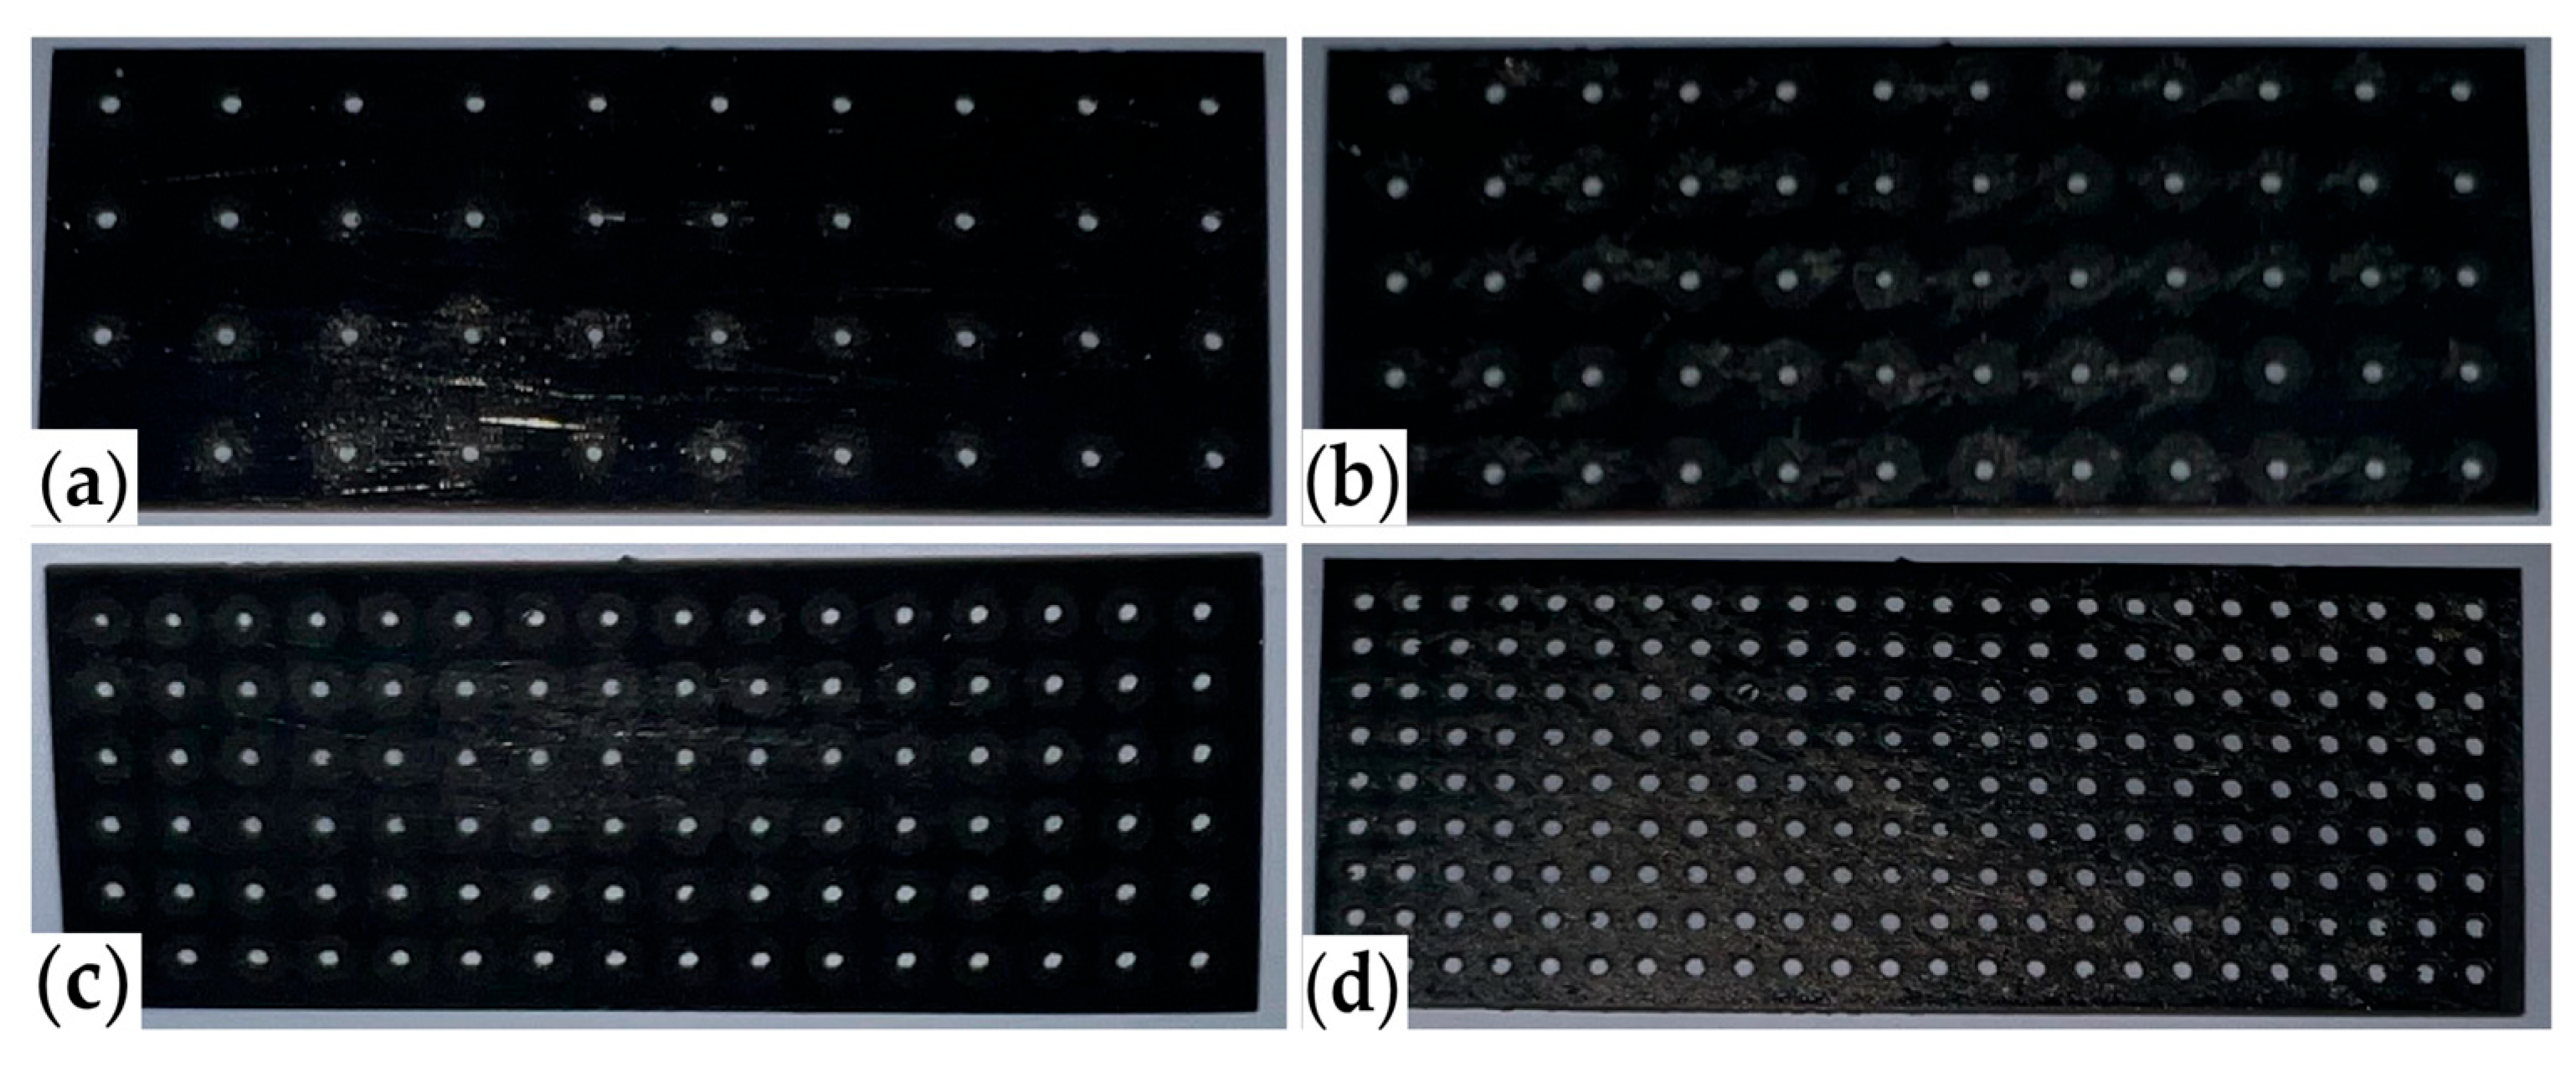
Figure 2 shows the samples of perforated stainless steel 316L plates created using the laser cutting method, with perforation areas ranging from 3.14% to 19.63%.

2.2. Perforated Stainless Steel 316L Plates’ Elastic Properties Determination Using Laser Vibrometry

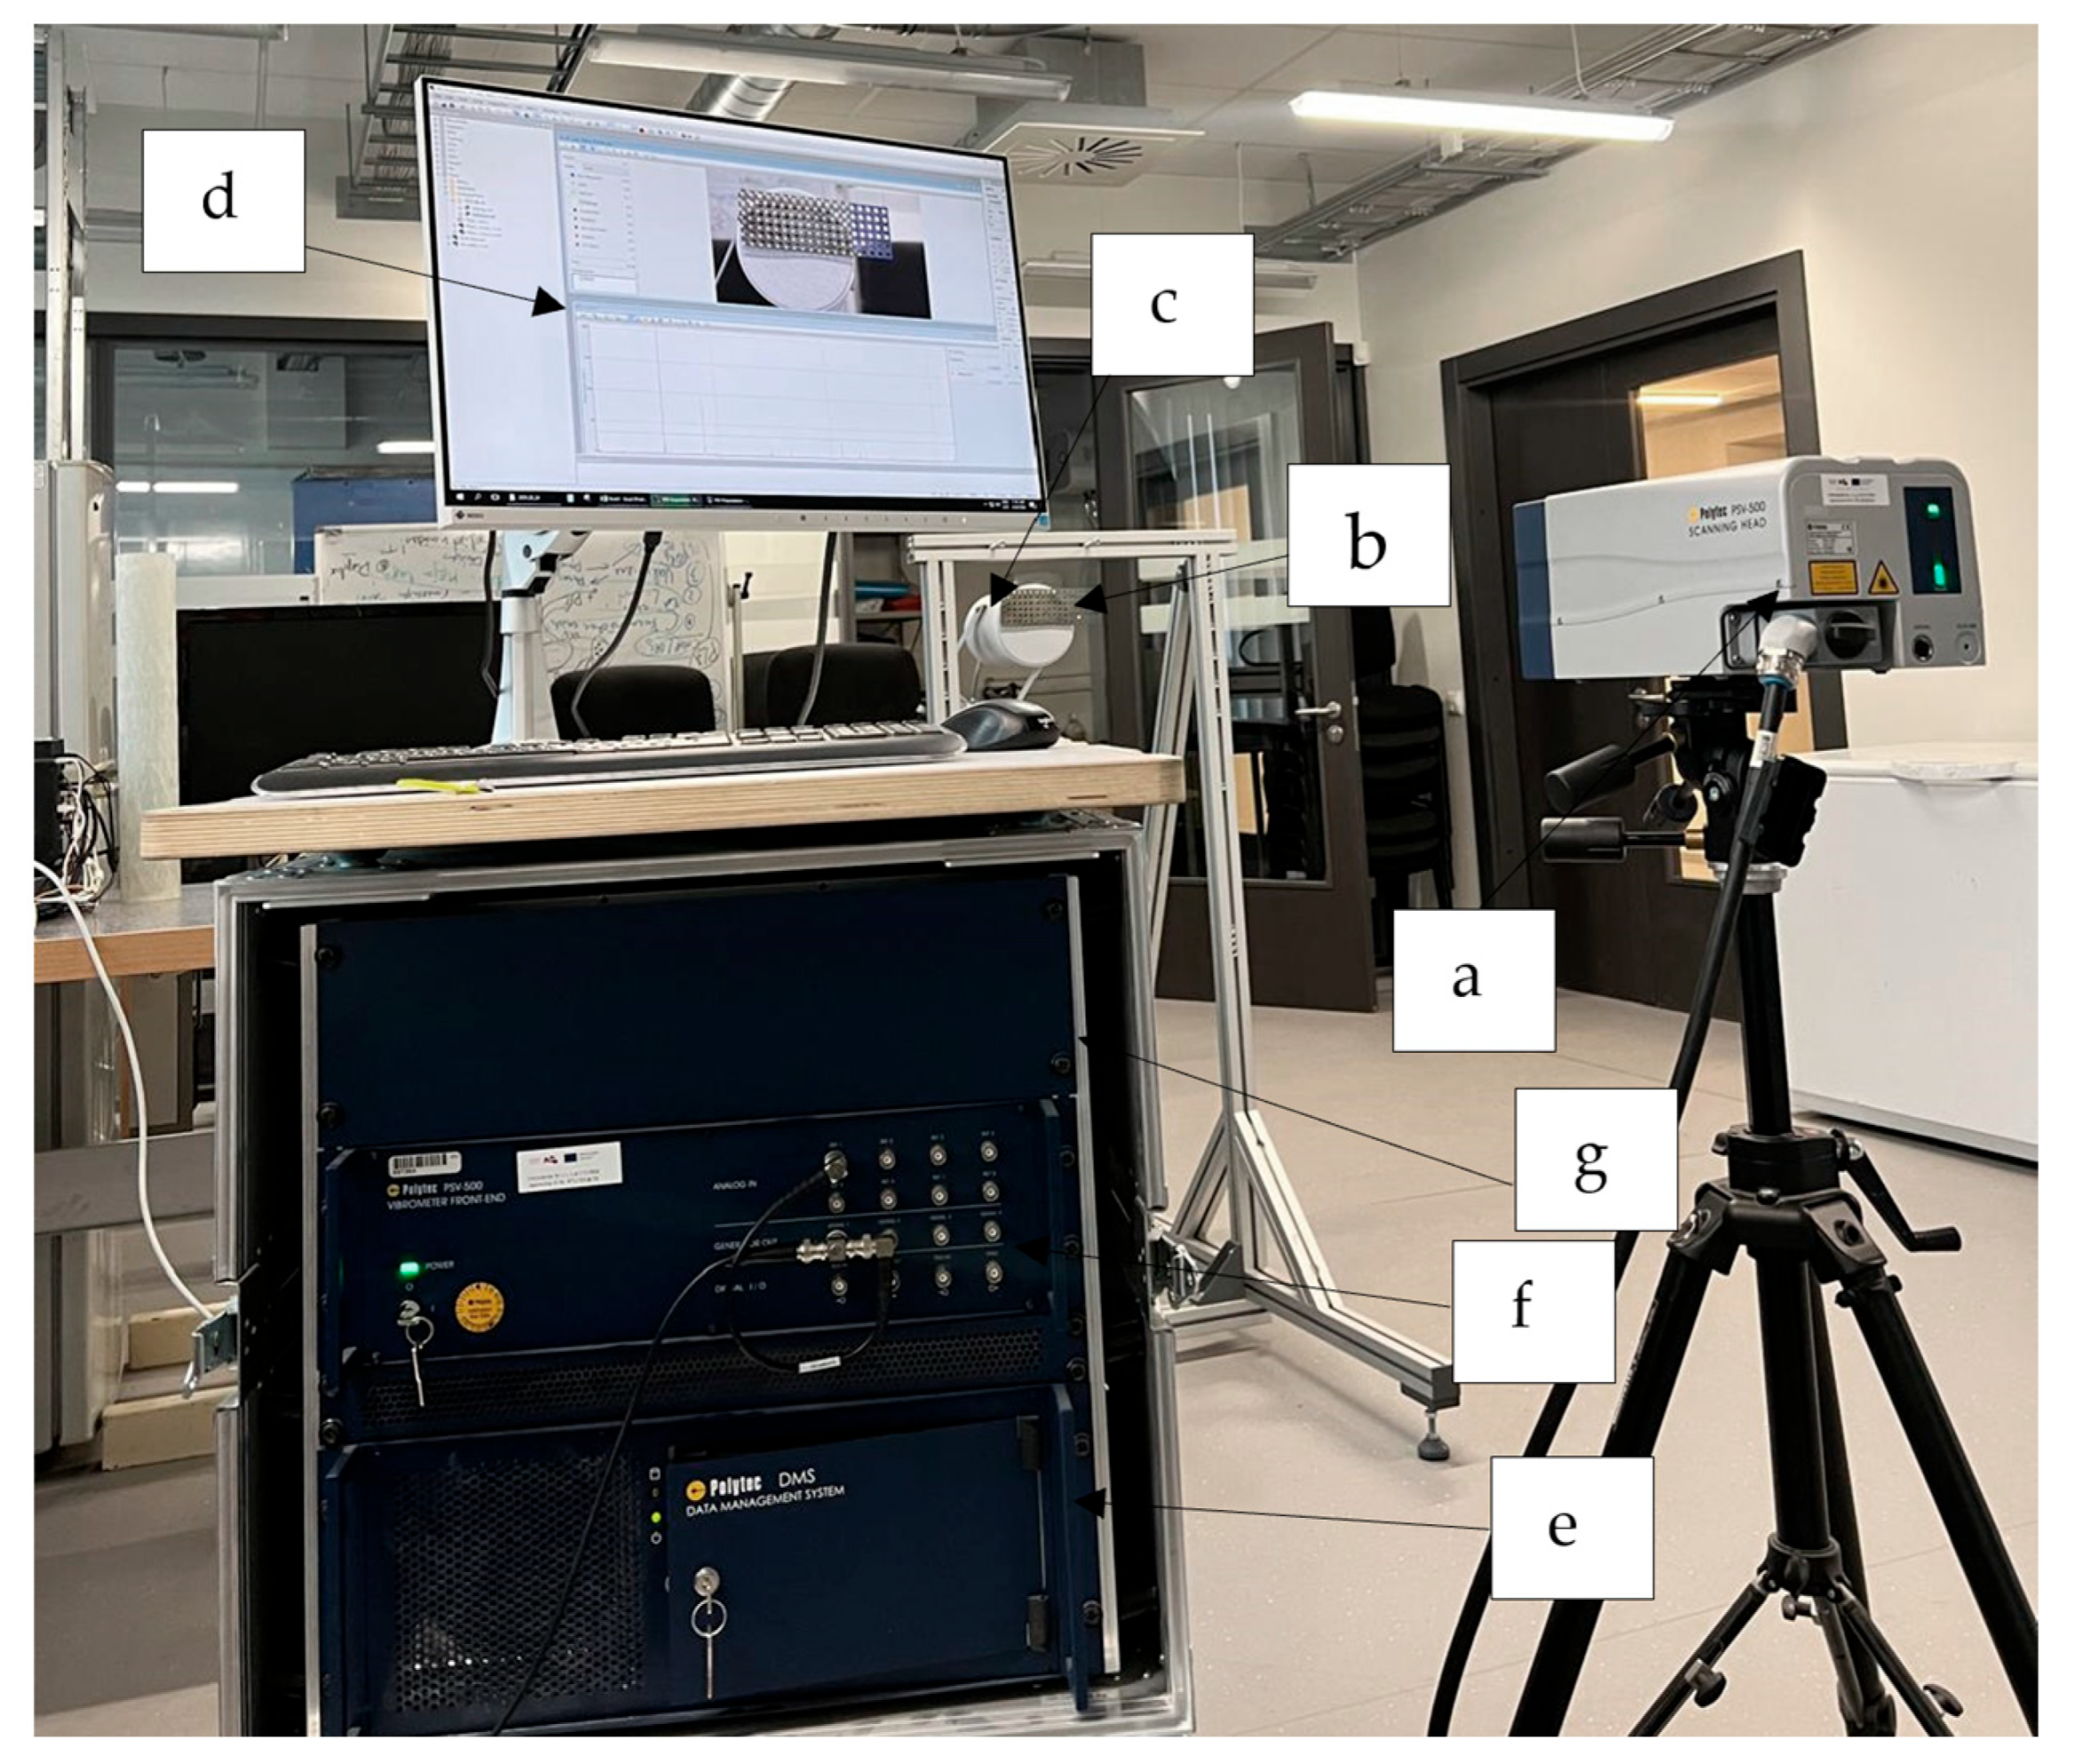
One of the achievements of this article was determining the elastic properties of perforated metal plates using a non-destructive method. Laser vibrometry is an instrument for determining the dynamic properties of the sample—the resonant frequencies, which in turn are needed to determine the elastic properties. The resonant methods widely used for the determination of elastic properties of composite materials were adopted for the characterization of the perforated steel plates in this study [31,32,33,34,35,36]. A laser vibrometer was used as a tool for the non-contact experimental determination of resonant frequencies. Laser scanning vibrometry is based on detecting the Doppler frequency shift that occurs when laser light is scattered from a moving surface [37]. This frequency shift is directly proportional to the surface velocity, allowing for the precise measurement of vibration speed. The advantages of this method include non-contact measurements that do not affect the structure of material, high resolution, and accuracy [37,38]. Laser vibrometry is particularly suitable for analyzing the elastic properties of perforated metal plates because it can precisely measure vibration speed and patterns without mechanically influencing the material. The main components of the laser vibrometry system include a laser source, which generates a laser beam directed at the surface of the sample under examination [37]. To determine the elastic properties, including the Young’s modulus, of the perforated 316L stainless steel plates with perforation areas ranging from 3.14% to 19.63%, the Polytec PSV-500 system was used (Figure 3). All measurements were conducted under environmental conditions, where room temperature was maintained at approximately 19 °C, with a relative humidity of 45%. Each specimen was tested once.
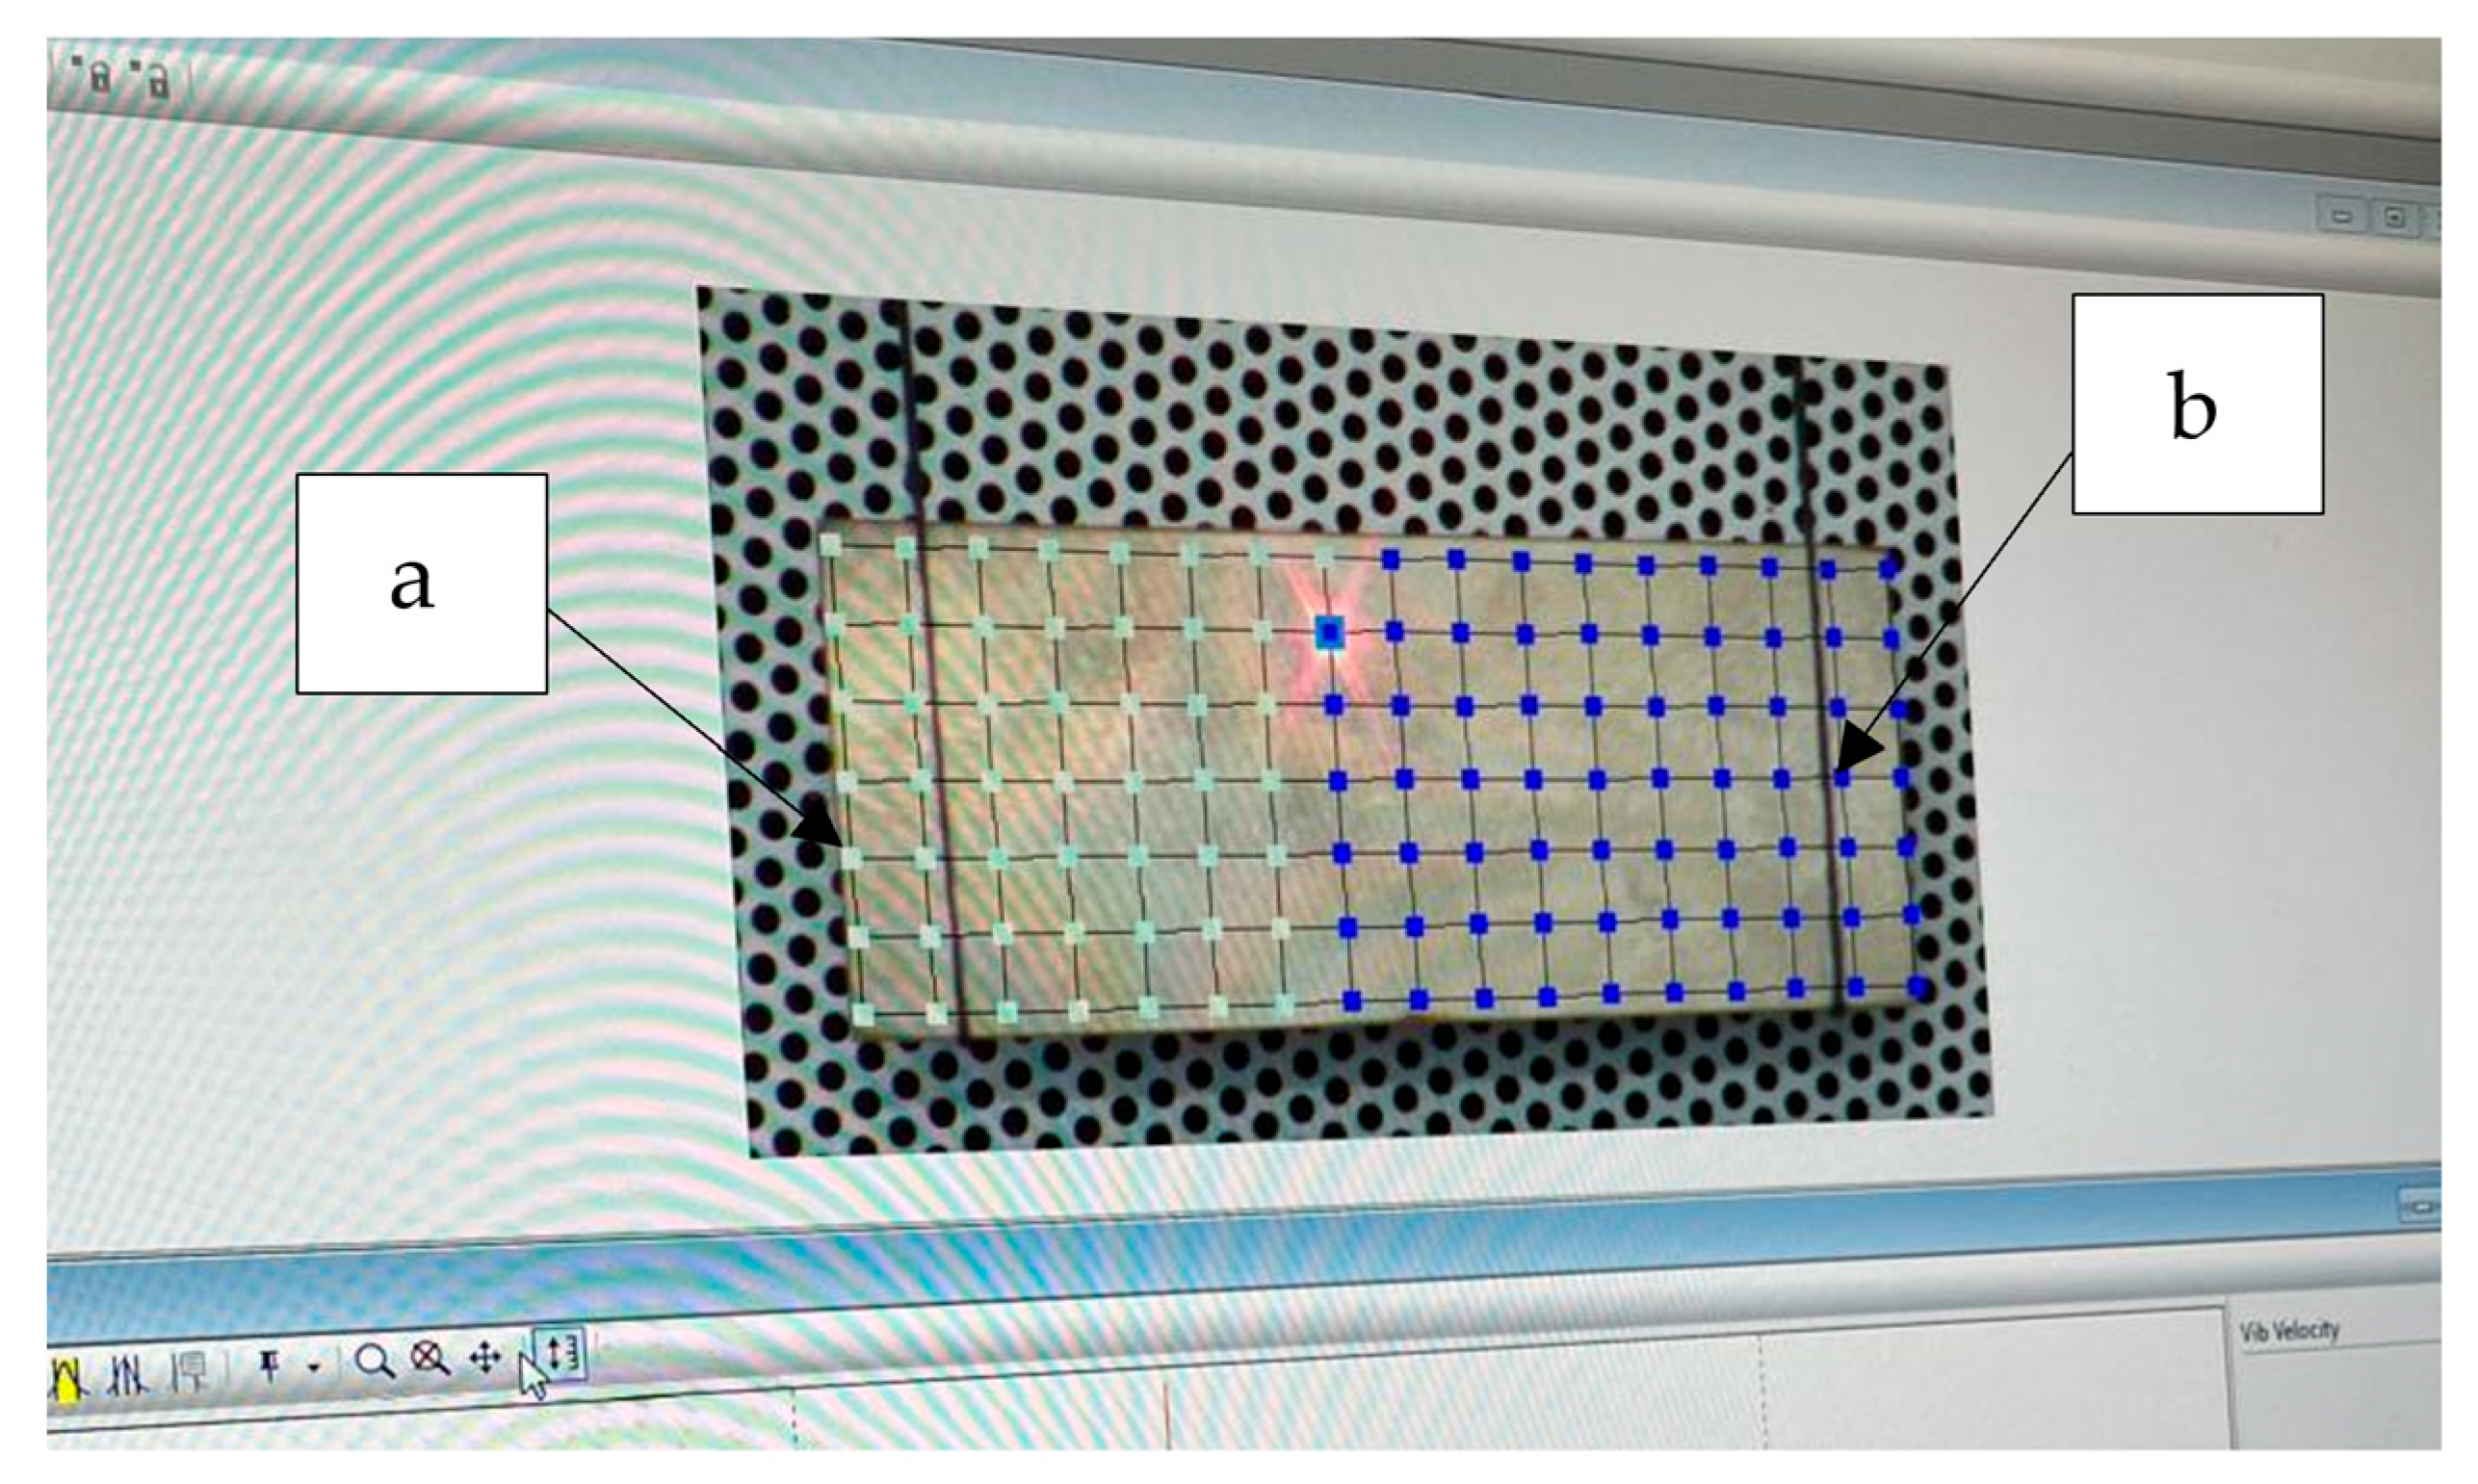
In the control software, the excitation frequency range was set from 0 to 10 kHz, covering the resonance frequencies of the plates. Each plate’s surface was scanned, evenly distributed across the length and width, to obtain a detailed view of the vibrations. In Figure 4, the process of scanning the surface of the plate is shown at points that were set in the software before starting scanning. The scanning points were uniformly distributed across the plate surface with a spacing of 2–3 mm between adjacent points.
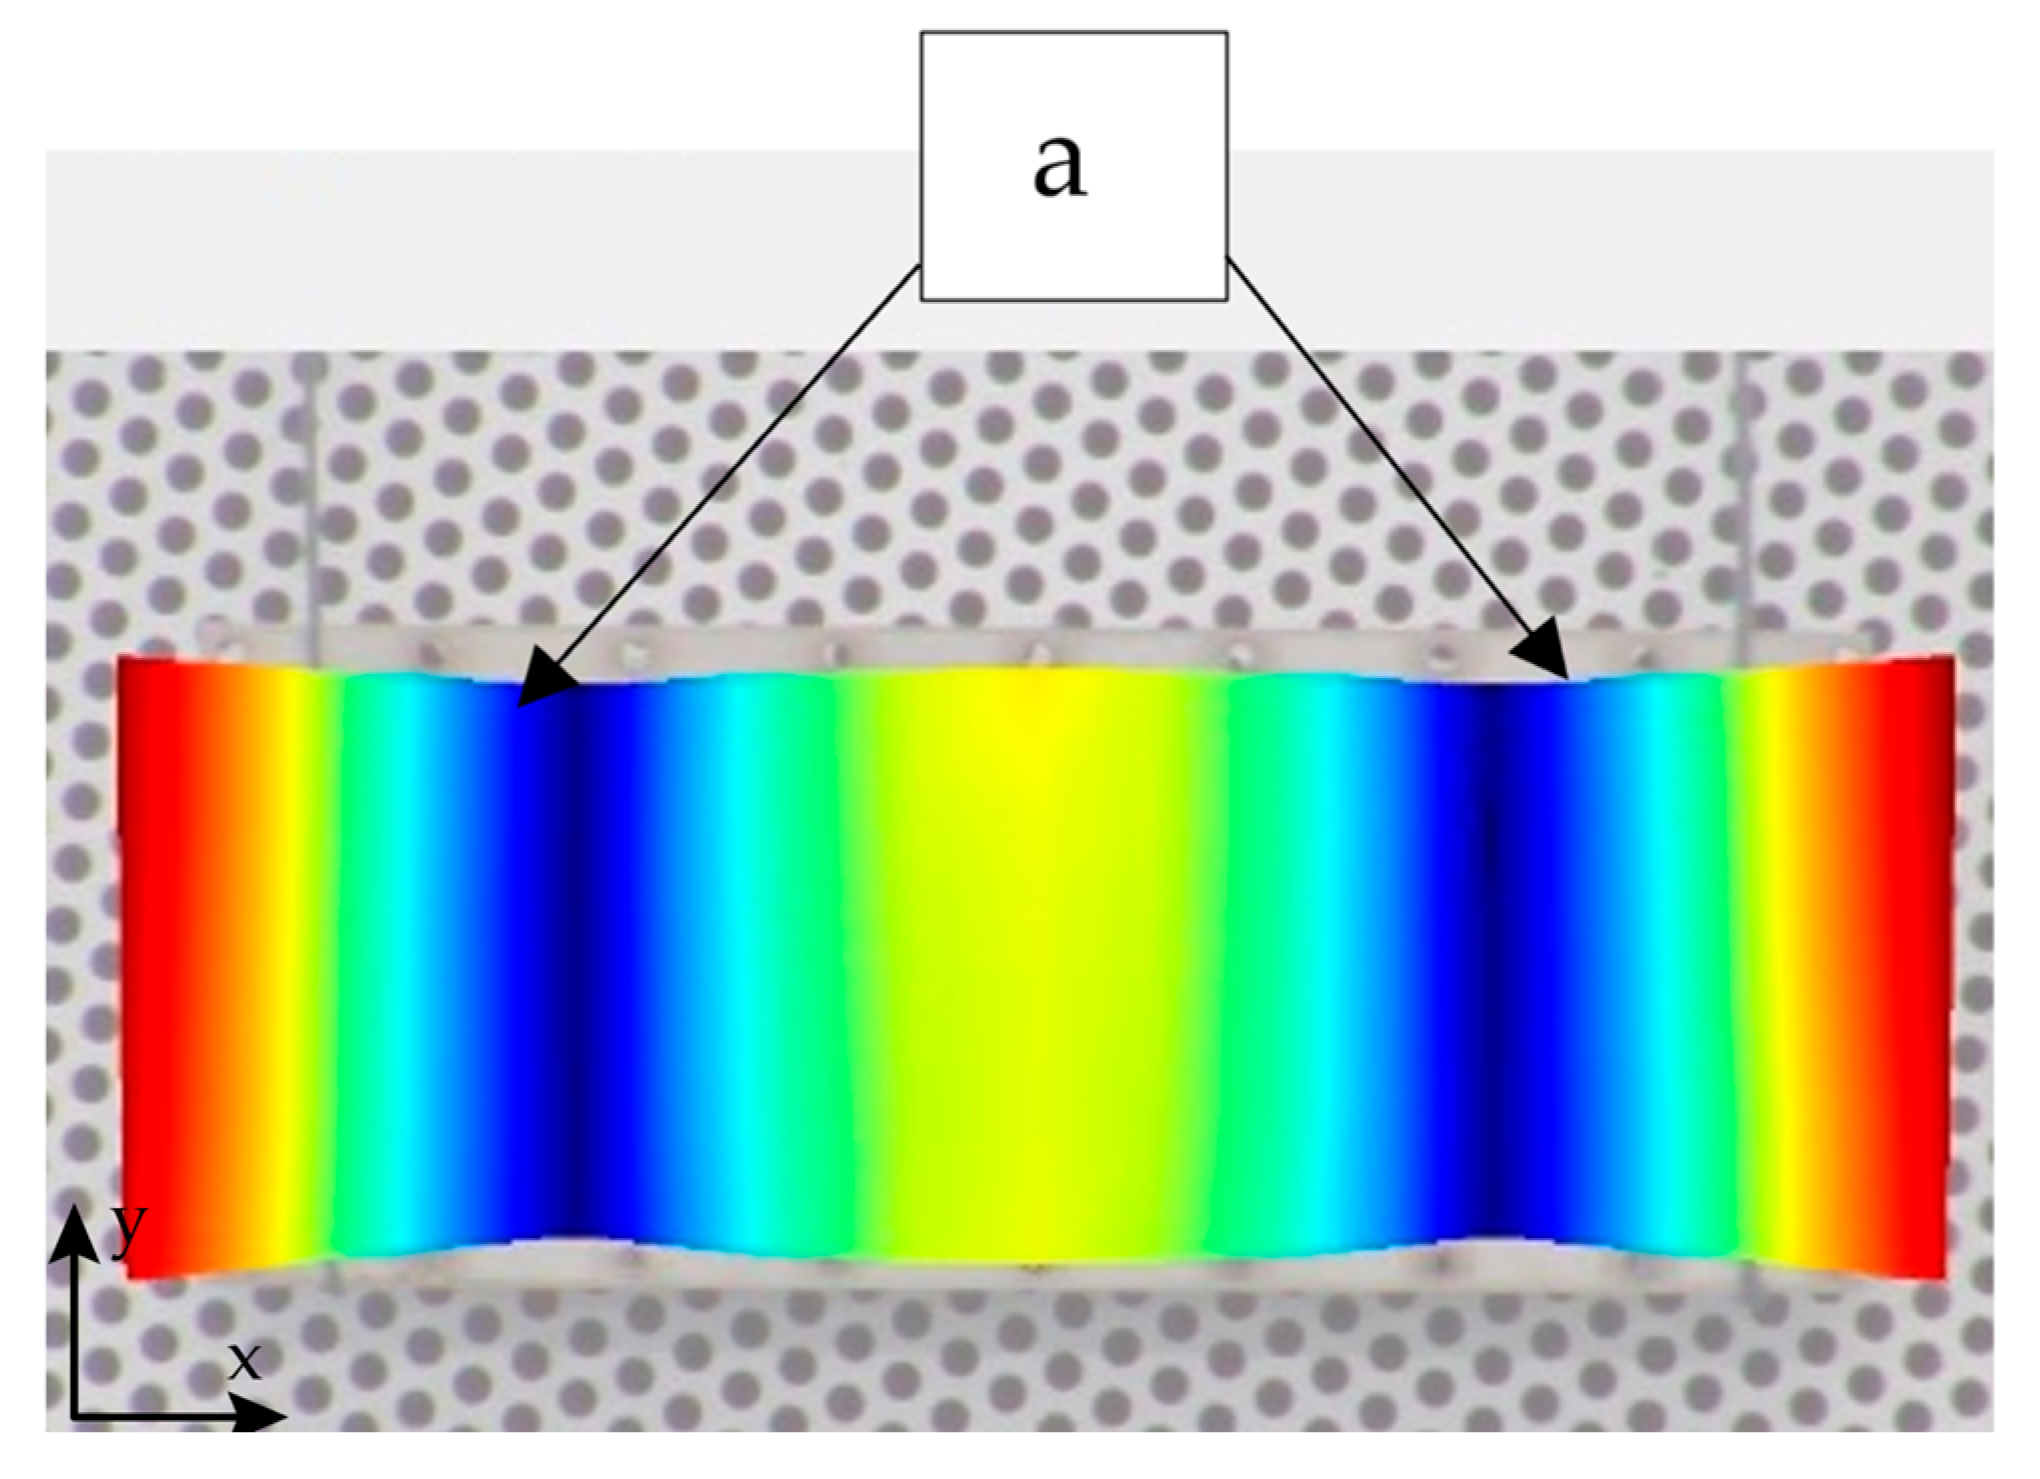
The data were transmitted to a computer, where they were processed to generate frequency response graphs. The 2.0 mode label, which is shown in Figure 5 (two half-waves in length and zero in width) indicates the fundamental bending frequency, where the material experiences maximum stress at the center and minimum at the edges. The 2.0 mode label represents the vibration modes used to calculate the Young’s modulus of the perforated plates [36].
The measured values of the resonance frequencies were applied to the appropriate formulas to calculate the Young’s modulus of the plates. Each perforated stainless steel 316L sample was tested using the laser vibrometry method. After each test, the results included the fundamental bending frequency. Table 2 shows the obtained data on the fundamental bending frequencies for each tested sample.
The formula for calculating Young’s modulus E of the tested samples using the sample’s fundamental bending frequency fb is as follows:
E = 0.9465 × m × f b 2 b × l h 3 × T
where geometrical parameters for calculating Young’s modulus of tested samples were thickness h, length l, and width b, and the physical parameter was weight m. Correction factor T (which for l/h > 20) was calculated as follows:
T = 1 + 6.585 h l 2
Using experimentally obtained fundamental bending frequencies, Young’s modulus E of the tested samples was calculated according to Formulas (4) and (5) [34,36]. To perform the calculations, geometric parameters such as length, width, and thickness were measured using a caliper (accuracy of ±0.1 mm), and the weight of the samples was weighed (accuracy of ±0.1 g). The obtained data for the calculations of the Young’s modulus of perforated stainless steel 316L plates are shown in Table 2.

2.3. Perforated Stainless Steel 316L Plates’ Elastic Properties Determination Using Three-Point Flexural Test

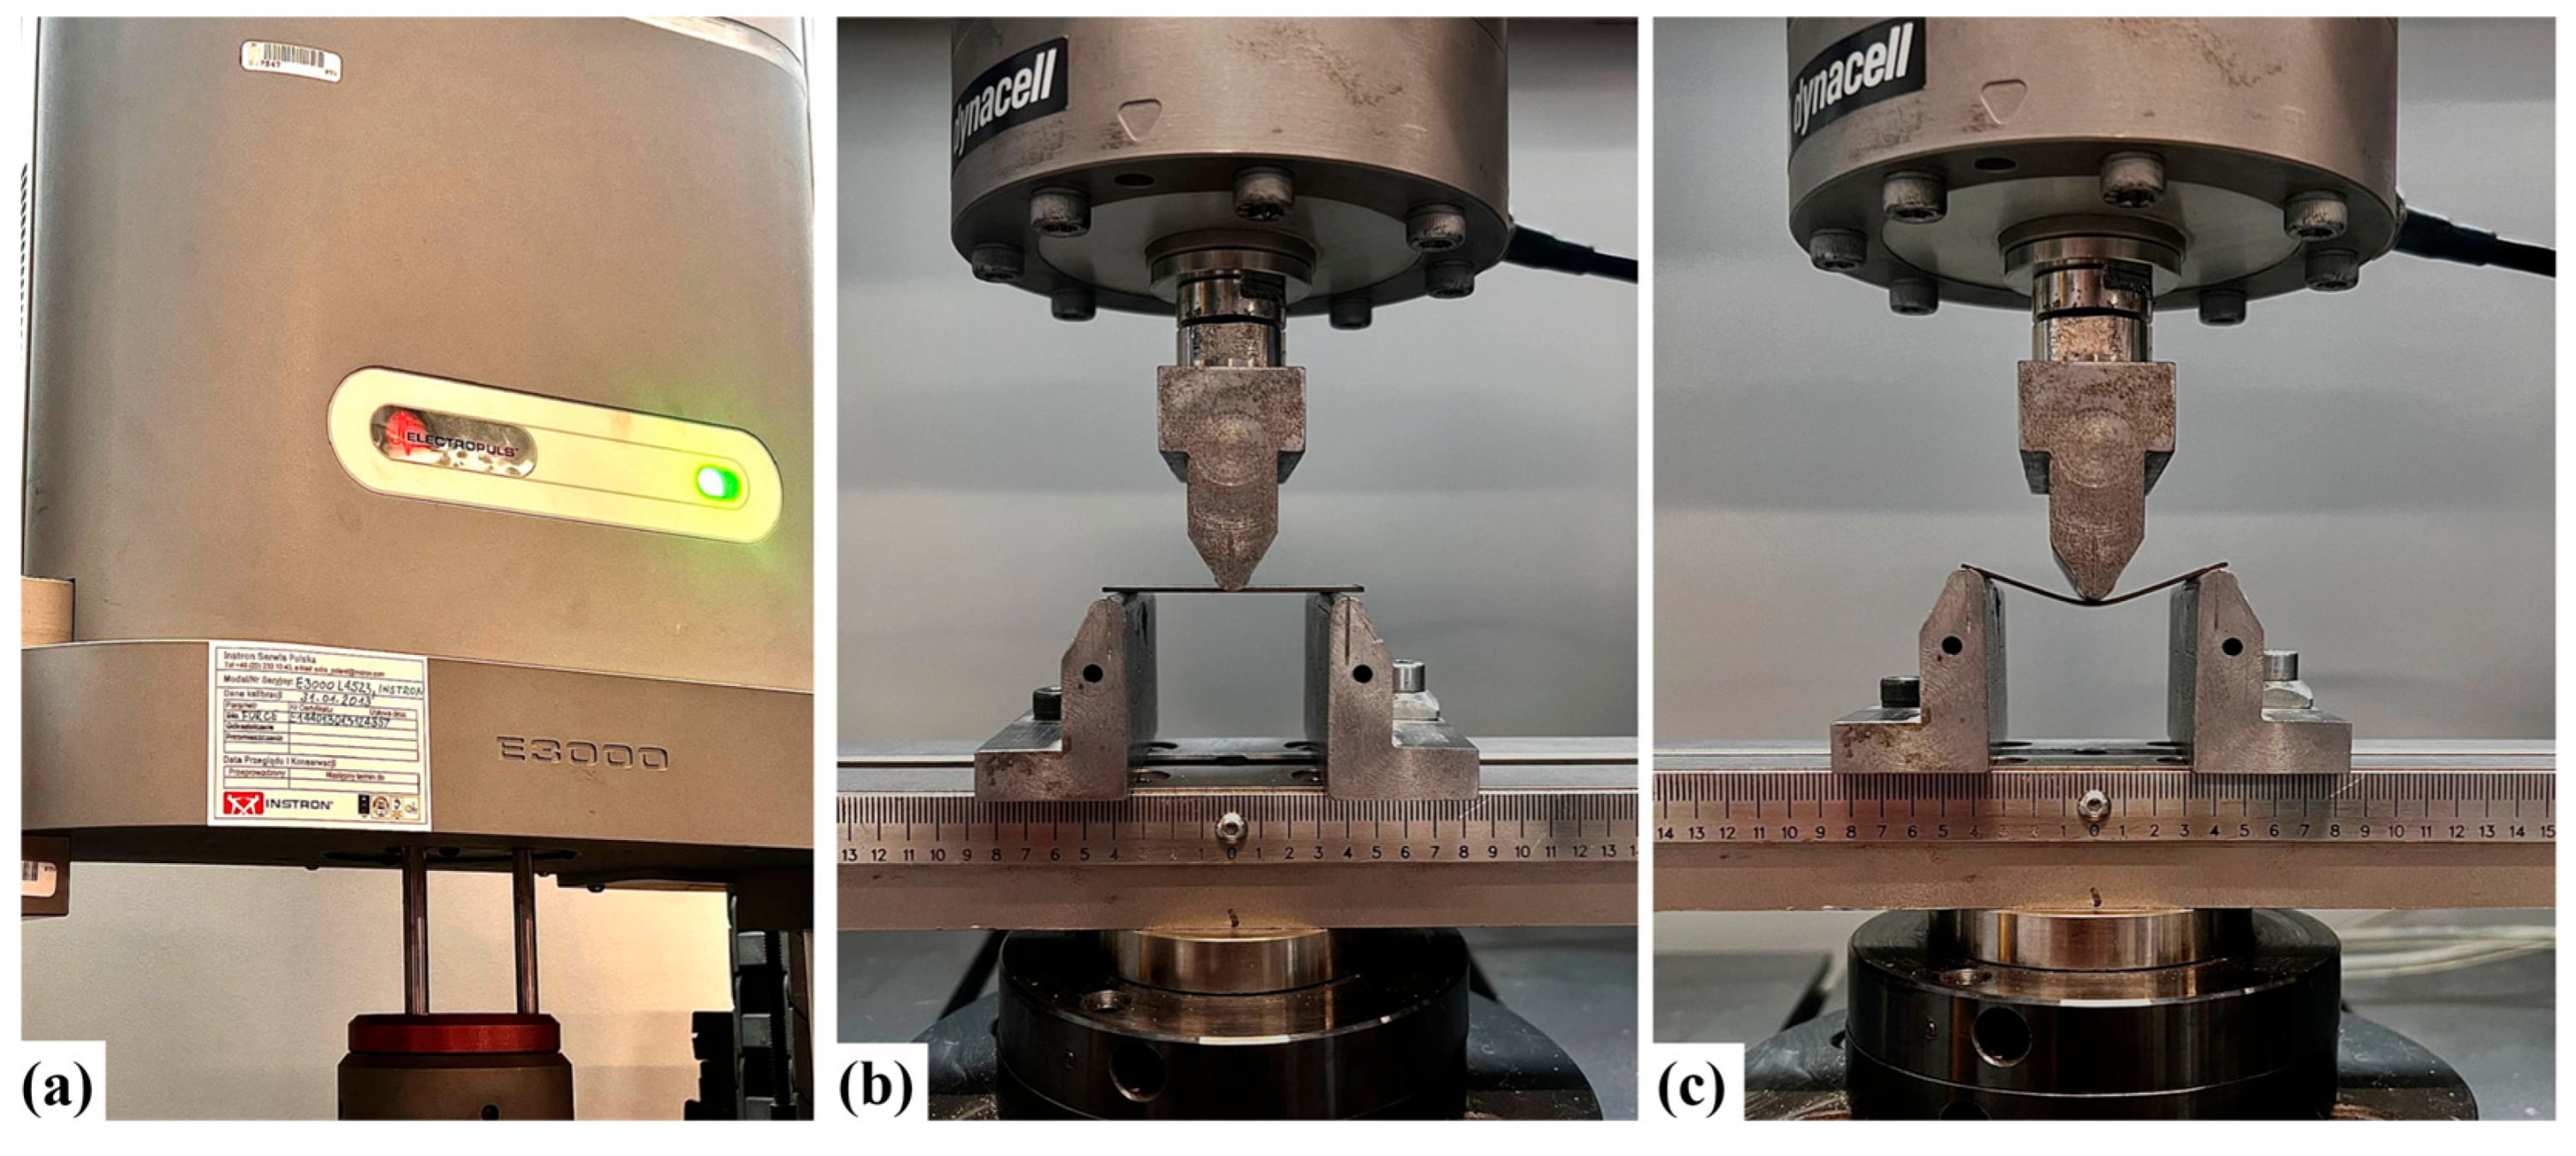
The three-point bending test was conducted to determine the elastic properties of four perforated stainless steel 316L plates. The perforation area varied between 3.14% and 19.63%, and the experiment followed a destructive testing approach. All measurements were conducted under environmental conditions, where room temperature was maintained at approximately 21 °C, with a relative humidity of 45%. Each specimen was tested only once, due to the fact that a single sample was available for each perforation configuration. Additionally, the three-point bending test employed in this study is a destructive method, rendering the specimen unusable for repeated testing. This approach, while limiting statistical analysis, was considered sufficient for the conceptual validation of the proposed methodology. The tests were carried out using an ElectroPlus E3000 testing machine (Instron, Norwood, MA, USA) (Figure 6). The support span (distance between the two outer supports) was set to 41 mm. Each specimen was subjected to loading, and numerical data were recorded, including the applied force F and flexure extension. The experimental data were subsequently analyzed, and the Young’s modulus of each perforated plate was calculated using the Euler–Bernoulli beam theory and Equation (2) in MS Excel.

2.4. Perforated Stainless Steel 316L Plates’ Elastic Properties Determination Using the Finite Element Method (FEM)

A virtual experiment using the finite element method was used to investigate the elastic properties of 316L stainless steel. The main objective of this experiment was to study the impact of perforation parameters, such as hole diameter and pitch between holes, on the Young’s modulus of perforated 316L stainless steel plates. These parameters determine the total perforation area, which allows for a more detailed investigation of their effect on the elastic properties of the plates. This experiment was conducted using the finite element method (FEM) to obtain new results on the dependence of Young’s modulus of perforated stainless steel 316L plates on the perforation configuration.
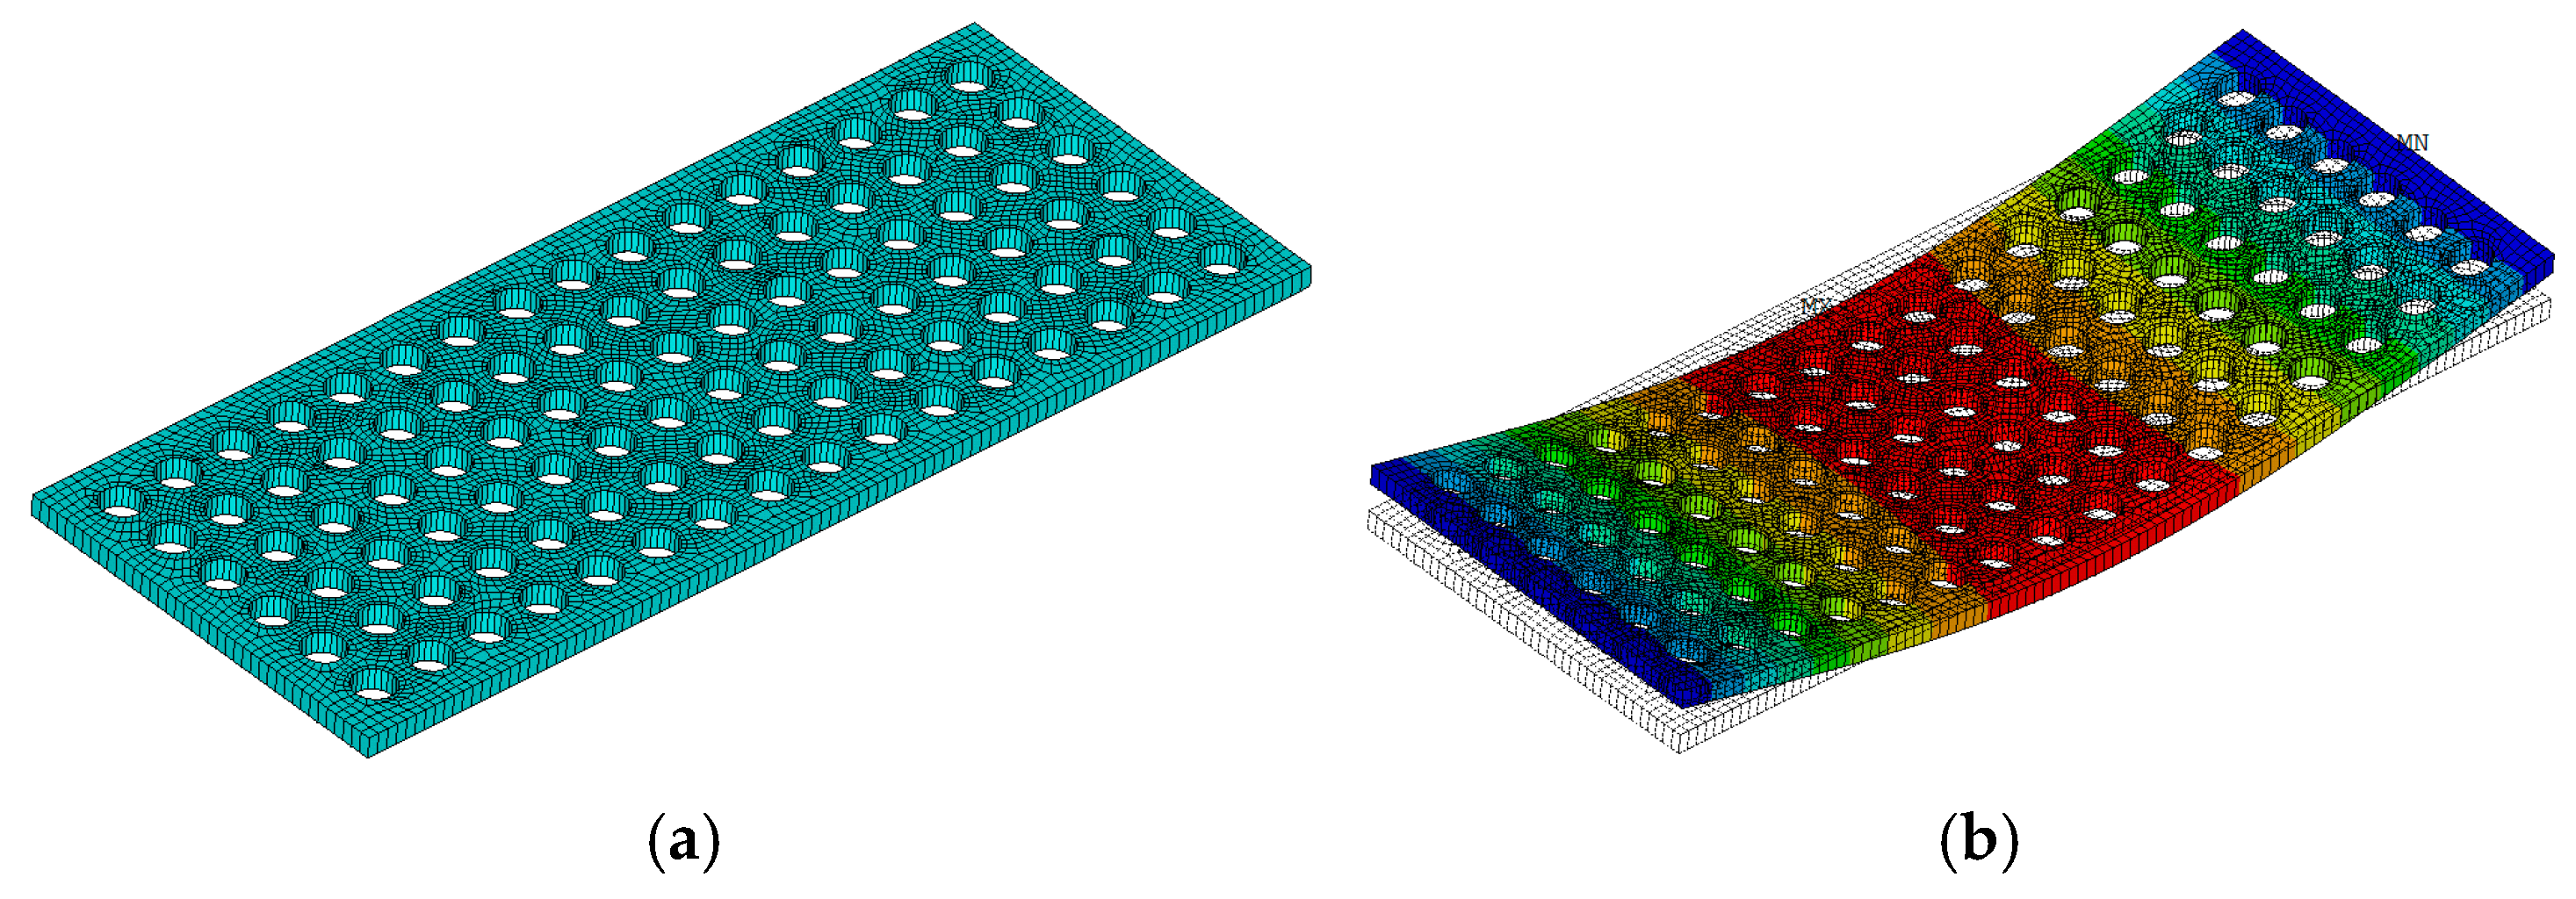
To enhance the range of variable parameters and systematically evaluate the effect of the perforation diameter and pitch between perforations on the Young’s modulus of steel plates, the experimental framework was broadened. The investigation focused on perforation diameters of 1.5, 2.0, 2.5, and 3.0 mm, combined with consistent pitches of 2, 3, 4, and 5 mm between the holes. For the experiment, the dimensions of the 316L stainless steel plates were created according to the dimensions of the original plates, with a length of 50 mm, width of 20 mm, and thickness of 1 mm. To optimize research efficiency and reduce time expenditure, a numerical modal analysis was employed as a substitute for physical testing. Numerical simulations of the perforated plates were performed using ANSYS Mechanical APDL 2023R1, where structural finite elements (Shell181) were used to accurately model the geometry and mechanical behavior of the plates (Figure 7a). Undamped modal analysis was executed using the Block Lanczos method (Figure 7b). This approach allowed for a detailed assessment of how variations in perforation parameters influence the elastic characteristics.
The elastic and mass properties of 316L stainless steel, required for the numerical experiments, were determined by minimizing the differences between the physical and numerical mass and the first bending eigenfrequency of plates with a perforation diameter of 1.0 mm and pitches between perforations of 2, 3, 4, and 5 mm. The identified properties are as follows: density ρ = 7800 kg/m3, Young’s modulus E = 215 GPa, and Poisson’s ratio as 0.3. Notably, the identified Young’s modulus E is higher than the typical datasheet range of 193–200 GPa. However, the tensile tests have also yielded values within the range of 210–215 GPa, corroborating the results obtained in this study [38]. Table 3 presents the results and the difference in physical and numerical mass and dynamic properties of the 316L stainless steel plates with a perforation diameter of 1 mm.
The numerically obtained data for calculating the Young’s modulus of the perforated 316L stainless steel virtual plates using Formulas 4 and 5 are summarized in Table 4.
In this experiment, the number of perforated plates is not consistent across samples with perforation diameters of 2, 2.5, and 3 mm, which is shown in Table 4. This difference is due to the difference between the increasing perforation diameter and the corresponding pitch between perforations. At certain pitch values, perforations could not be fitted within the plate dimensions without overlapping or breaching the required spacing between them, resulting in the absence of results for those configurations.

3. Results

3.1. Elastic Properties of Perforated Stainless Steel 316L Plates Obtained by Method of Determination of Resonant Frequencies and by Three-Point Flexural Test

Numerical data on flexure load and flexure extension were obtained for each perforated stainless steel 316L plate specimen.
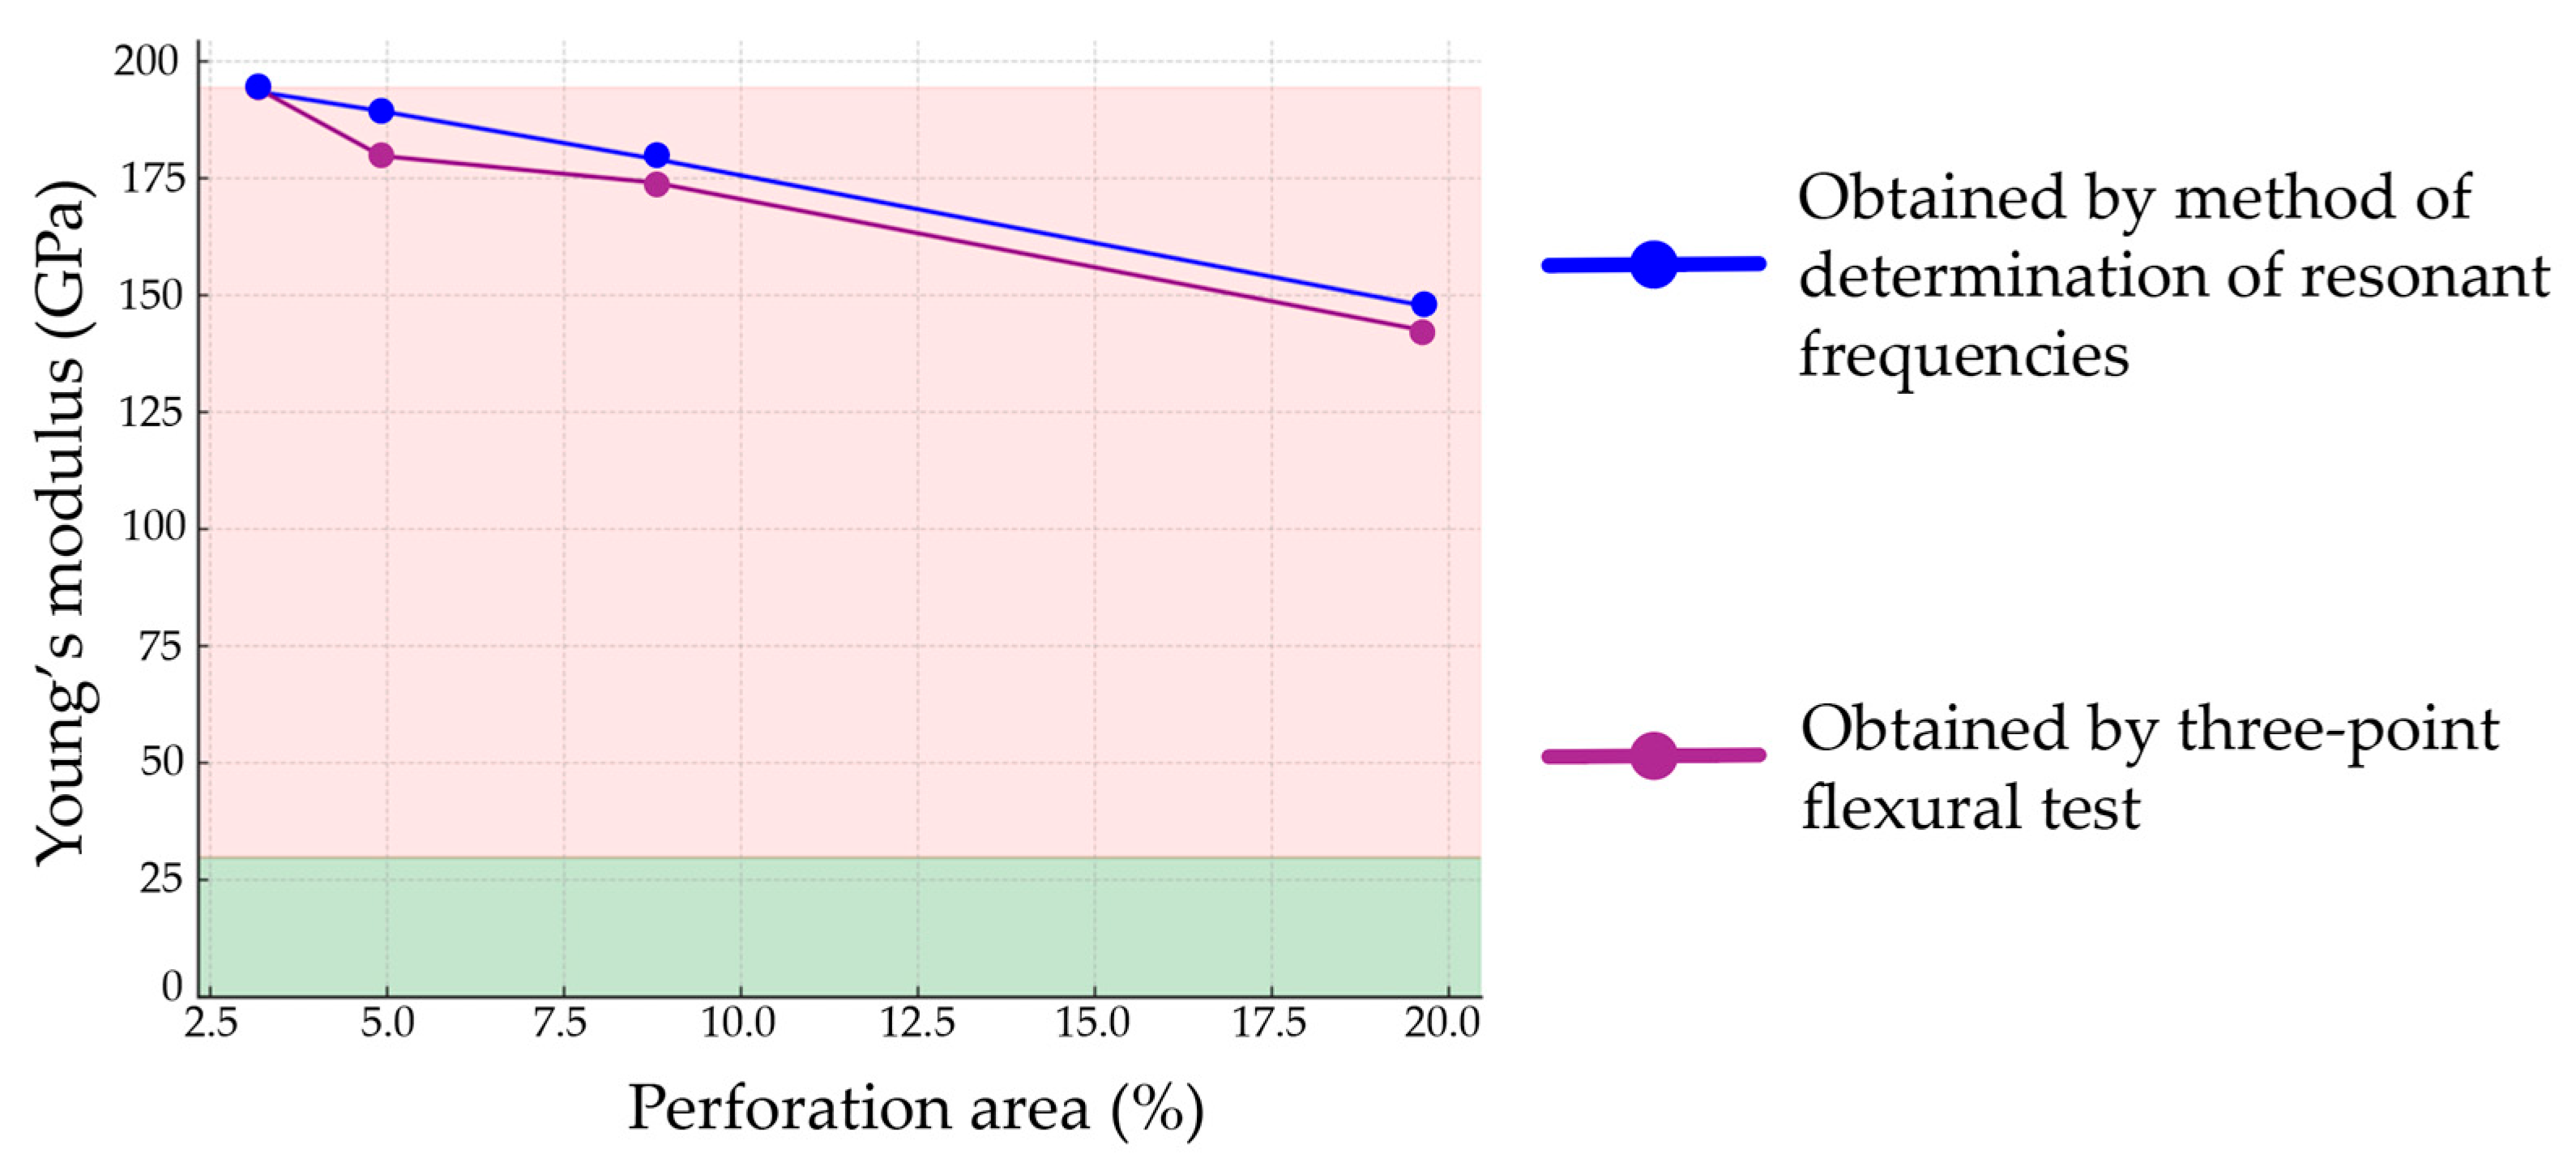
The plot of the dependence of Young’s modulus of perforated 316L stainless steel plates on perforation obtained by the method of determination of resonant frequencies and three-point flexural test in Figure 8 shows that, as the perforation percentage increases, the material’s elastic properties decrease. The perforation area affects the Young’s modulus of the structure, and, by this method, the Young’s modulus of the structure can be achieved to solve the stress shielding effect. As the perforation area is 3.14%, the Young’s modulus of the perforated plate is 193.63 GPa (by the method of determination of resonant frequencies) and 194.432 GPa (by the three-point flexural test). With an increase in perforation area to 4.91%, the decreasing trend continues, and the Young’s modulus of the perforated plate reaches 189.41 GPa (by the method of determination of resonant frequencies) and 179.839 GPa (by the three-point flexural test). When the perforation area increases to 8.78%, the Young’s modulus of the perforated plate decreases further to 179.18 GPa (by the method of determination of resonant frequencies) and 174.113 GPa (by the three-point flexural test). The most significant reduction in all parameters occurs at a perforation area of 19.625%, where the Young’s modulus of the perforated plate falls to 147.84 GPa (by the method of determination of resonant frequencies) and 142.568 GPa (by the three-point flexural test). Summarizing the Young’s modulus values, in the perforation area range from 3.14% to 8.725%, there is a gradual decrease in Young’s modulus (about a 20 GPa difference). However, in the perforation area range from 8.725% to 19.625%, a more substantial decrease in Young’s modulus is observed (about 30 GPa difference). We must consider the Young’s modulus of human bone, which ranges from 10 to 30 GPa and is indicated in green in the plot of the Young’s modulus of the perforated plates’ dependence on the perforation area for perforated 316L stainless steel plates. The sample with the highest perforation area is 19.625%, which is still higher than the Young’s modulus of human bone. Therefore, further research into 316L stainless steel plates with perforation areas greater than 19.625% would be necessary to reduce the Young’s modulus to be closer to that of human bone.
A static analysis of the experimental results was performed to provide an approximation of the perforated plates’ elastic properties’ dependence on the perforations’ geometrical configuration. This is fundamental for reliably predicting material behavior under various perforation design configurations, especially for orthopedic implant applications, where elastic modulus control is necessary to mitigate the stress shielding effect.
The analysis was conducted using the EDAOpt v.2.96 software package, which enables the modeling of experimental data using polynomial regression and the evaluation of statistical reliability [39]. The independent variable was defined as the distance between the centers of the perforation holes (pitch), with tested values of 5 mm, 4 mm, 3 mm, and 2 mm, corresponding to perforation areas of 3.14%, 4.91%, 8.78%, and 19.63%, respectively. The dependent variable was the experimentally determined Young’s modulus, derived from resonance frequency measurements using laser vibrometry. The results of the polynomial approximation, obtained using the EDAOpt v.2.96 software, are presented in Table 5.
The data were modelled using a second-order polynomial regression model, resulting in the following expression:
E = 51.275 + 62.22 × P − 6.78 × P2
where P is the pitch between perforations (in mm) and E is the predicted Young’s modulus. The model’s statistical parameters demonstrate the adjusted coefficient of determination, R2 = 0.97, indicating that approximately 97.3% of the variance in the Young’s modulus is explained by the model.
The significance analysis of normalized coefficients revealed that the linear term X has the dominant influence on the response, followed by the quadratic term X2, which introduces the necessary curvature to accurately model the observed non-linear relationship. The free term is constant and was not shown in the normalized coefficient analysis, as it does not contribute to the relative variation. The obtained regression clearly confirms that a decrease in pitch (leading to an increase in perforation area) results in a systematic reduction in Young’s modulus. Importantly, the presence of a significant quadratic term indicates that this relationship is not strictly linear. The reduction in modulus accelerates at smaller pitch values, which is consistent with the physical understanding of stress concentration effects and loss of cross-sectional integrity. The model allows reliable estimation within the tested range of perforation pitches and provides a basis for predicting the elastic behavior of new designs with similar geometric parameters. Furthermore, it supports the experimental conclusion that both pitch and hole diameter must be jointly considered to accurately predict the mechanical response, as identical perforation areas with different geometries yield different Young’s modulus values. The static analysis validates and reinforces the experimental findings by providing a statistically robust approximation of the relationship between perforation geometry and elastic properties. The resulting regression model can serve as a practical tool for pre-selecting perforation configurations in the design of orthopedic plates and other medical devices, with the objective of tuning elastic properties to approach the target modulus of human bone tissue and minimize the risk of stress shielding.

3.2. Elastic Properties of Perforated Stainless Steel 316L Plates with Variable Perforation Diameter and Pitch Between Perforations Using the Finite Element Method

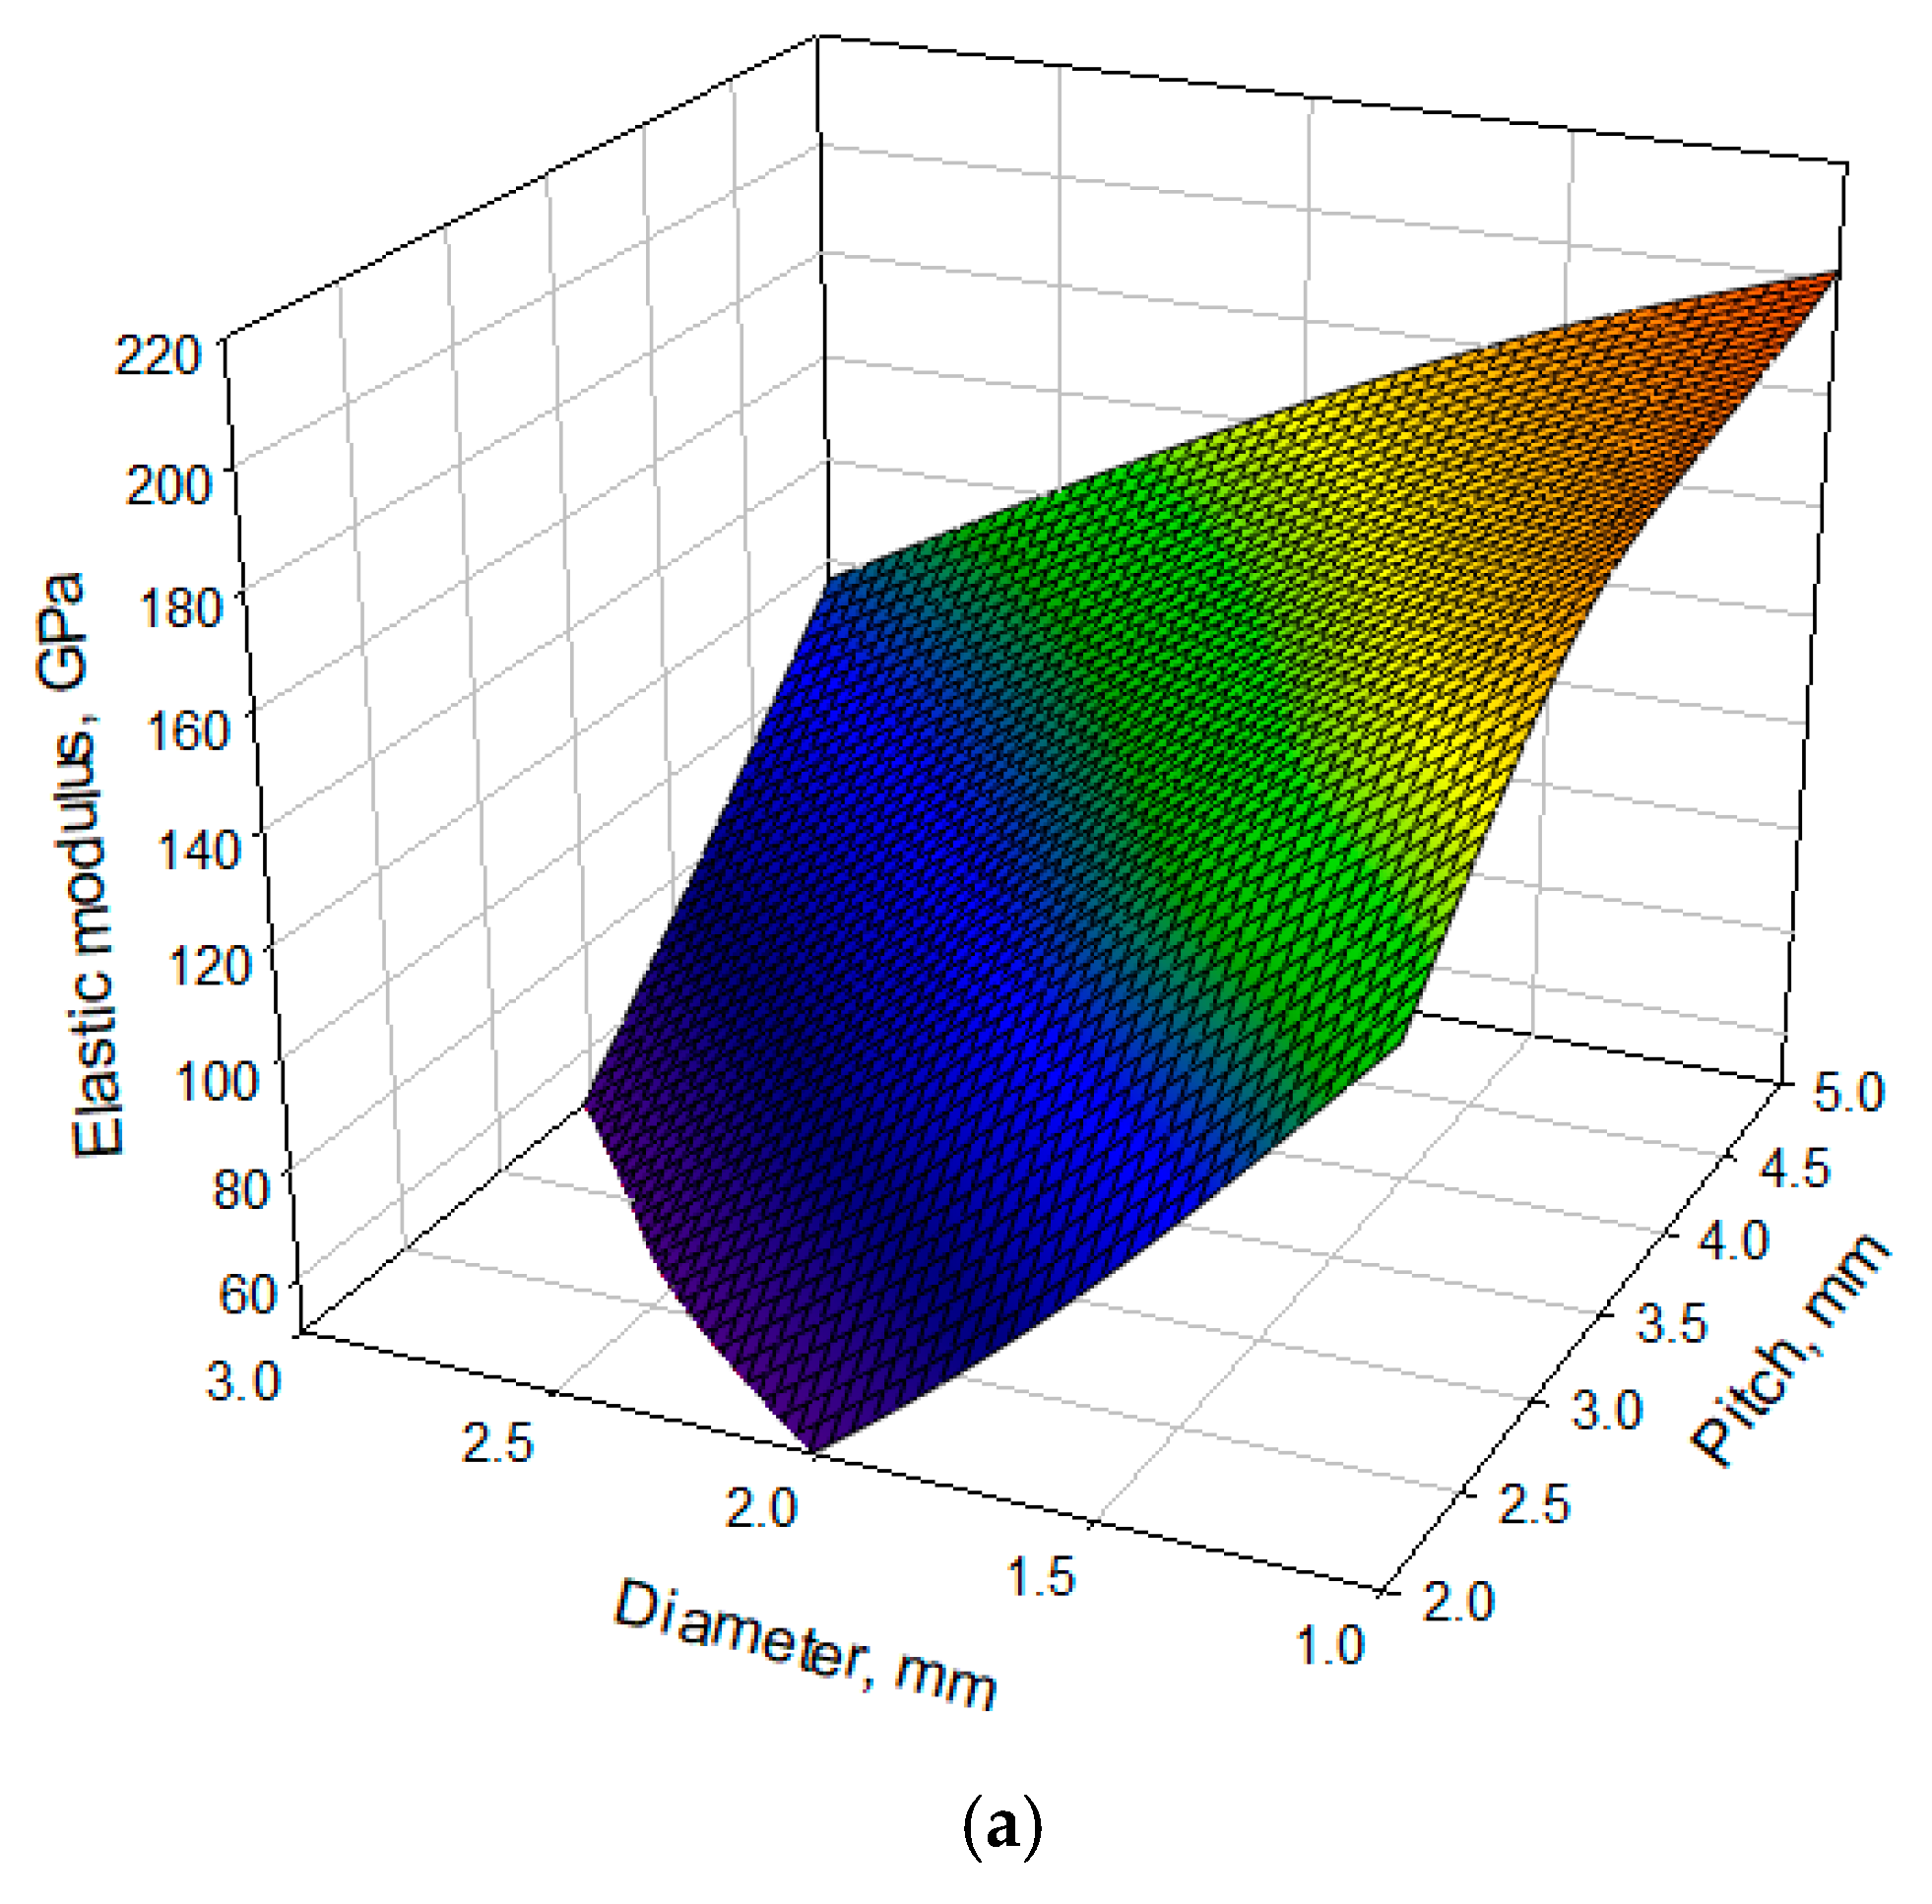
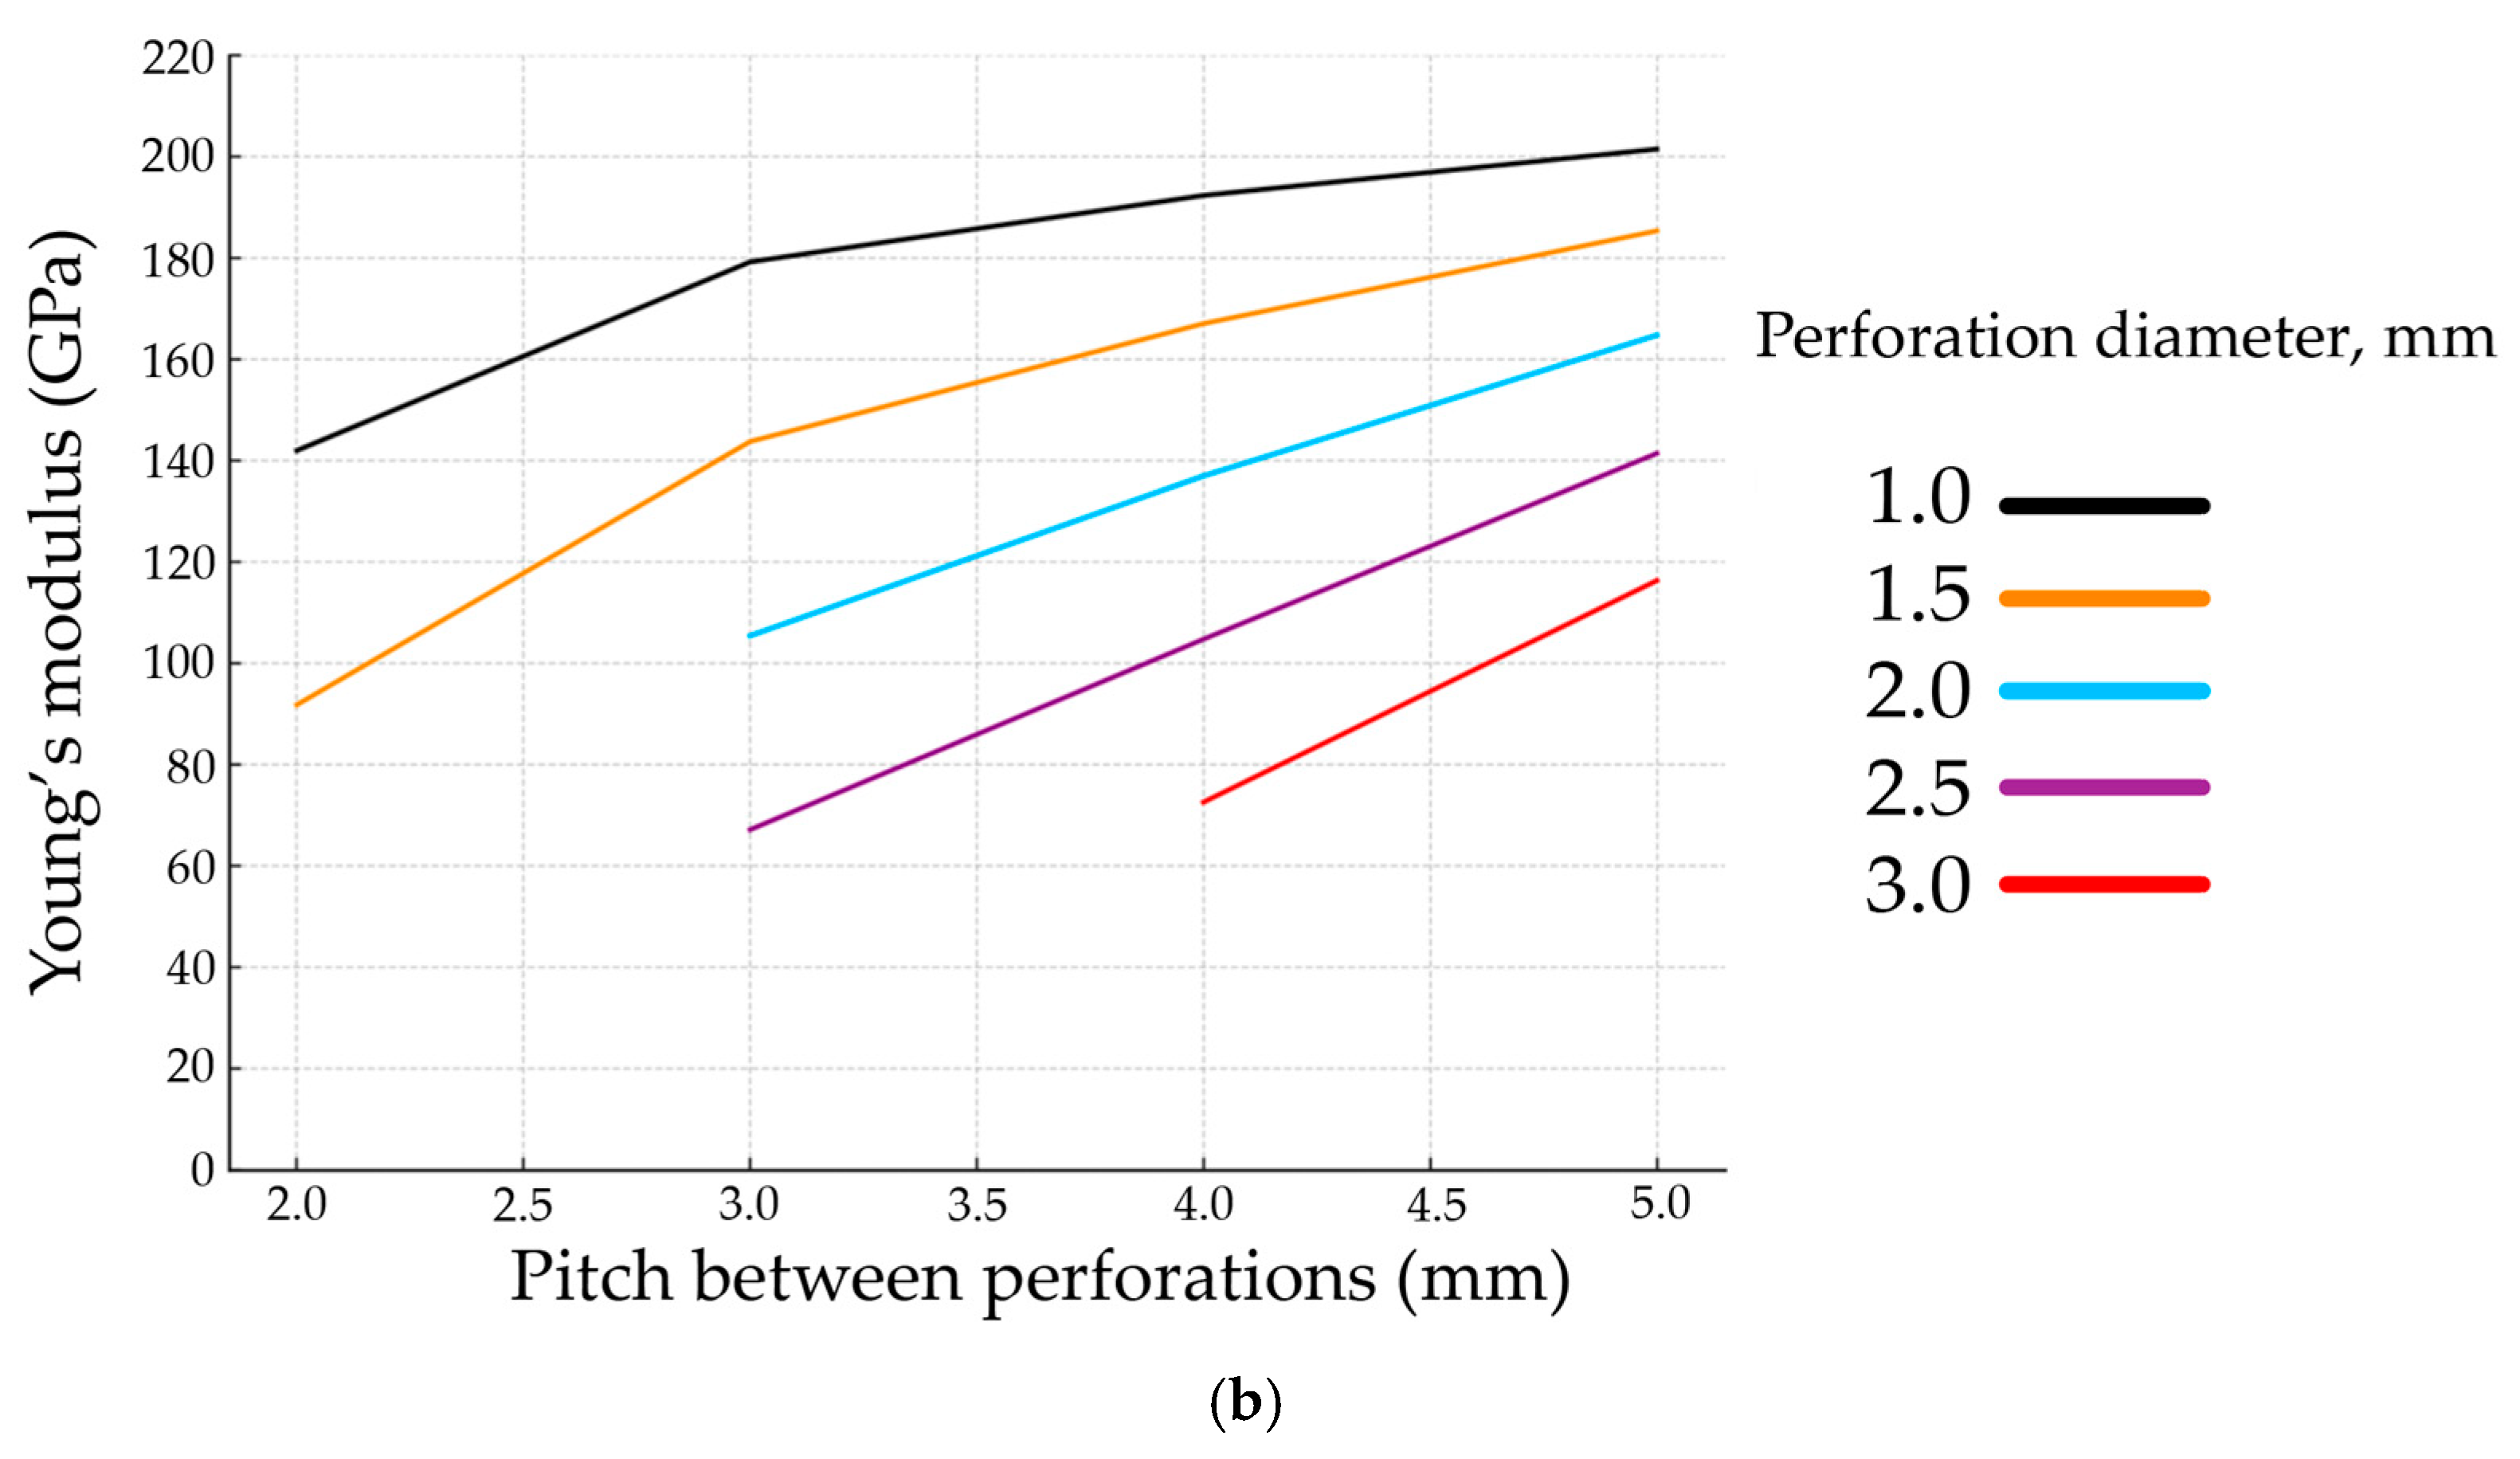
When analyzing the results of the virtual experiment, we explored how variations of perforation diameter and pitch between perforations influence the elastic properties of perforated 316L stainless steel plates. The results were further visualized graphically as a 3D surface, demonstrating the relationship between the Young’s modulus of the perforated plates, perforation diameter, and pitch between perforations. The analysis of the results demonstrates how an increase in perforation diameter and pitch between perforations leads to a decrease in the elastic modulus of the plates. A perforated plate with a larger perforation diameter and smaller pitch between the perforations consequently allows the Young’s modulus to be reduced more rapidly than one with a smaller perforation diameter and larger pitch between the perforations, as shown in the 2D plot in Figure 9.
A detailed statistical analysis of the virtual experiment results was performed using the EDAOpt v.2.96 software package to quantify and generalize the influence of perforation geometry on the elastic properties of perforated plates. The aim was to develop a regression model that could predict the effective Young’s modulus E of perforated stainless steel plates based on two key parameters—the pitch between perforations and the perforation diameter. This approach allows the perforation pattern to be optimized in order to achieve the desired mechanical properties, which is particularly important for biomedical applications. A second-order polynomial regression model was selected as the optimal compromise between accuracy and physical interpretability. This dependence was approximated using a second-order polynomial function:
E = 144.767 + 52.3702 × P − 109.531 × D − 7.07648 × P2 + 17.2956 × P × D − 5.0348 × D2
where E is the effective Young’s modulus in GPa, P is the pitch between perforations in mm, and D is the perforation diameter in mm. The regression coefficients were calculated based on sixteen experimental points (virtual samples).
Table 6 shows the statistical quality of the regression model, with a key metric being the adjusted coefficient of determination, R2adj = 0.992, which indicates a model fit of 99.2% (i.e., 99.2% of the variance is explained).
Figure 10 presents the relative influence of the regression terms. Both primary variables (P and D) significantly affect the Young’s modulus.
The largest influence is attributed to perforation diameter D = X2 and pitch P = X1. The interaction term P*D also makes a strong contribution, and the quadratic terms P2 and D2 refine the model curvature. Thus, it is confirmed that Young’s modulus depends not only on the perforation area, but also on the specific combination of diameter and pitch.
To verify the model, three additional virtual samples with geometrical configurations that were not used during its construction were tested (Table 7), and we computed their values using an approximation model.
These samples provide an independent test of the model’s predictive ability. The predicted Young’s modulus values for these additional points showed good agreement with the calculated results (difference of 5.21% and 4.05%), confirming the sustainability of the approximation (difference below 10% is sustainable in our conditions) and its applicability to a wider design space.
In addition, a Pearson correlation analysis was conducted to compare the Young’s modulus values obtained using three different methods: the determination of resonant frequencies, the finite element method, and the three-point bending test. The Pearson correlation coefficients are shown in Table 8.
These high correlation values confirm the consistency and reliability of the model and methodology even further. The graphical 3D surface representation offers a demonstrative view of this dependency. It was also discovered, based on the results shown in Table 4, that when the perforation areas are the same or close to each other, the Young’s modulus of the perforated plates can be different. For perforated plates with a perforation area of 19.64% but different perforation diameters and pitch between the perforations, the Young’s modulus of the perforated plates is different. When the perforation area is 19.64%, the perforated plate with 1 mm of perforation diameter and 2 mm pitch between perforations has a Young’s modulus of 142.03 GPa; the perforated plate with 1.5 mm of perforation diameter and 3 mm pitch between perforations has a Young’s modulus of 143.81 GPa; and the perforated plate with 2 mm of perforation diameter and 4 mm pitch between perforations has a Young’s modulus of 137.02 GPa. The Young’s modulus of perforated plates with a perforation area of 44.18% is also different for perforated plates with changing parameters, such as perforation diameter and pitch between perforations. At a perforation area of 44.18%, a perforated plate with a perforation diameter of 1.5 mm and a pitch between perforations of 2 mm has a Young’s modulus of 91.84 GPa; and a perforated plate with a perforation diameter of 3 mm and a pitch between perforations of 4 mm has a Young’s modulus of 72.62 GPa.

4. Discussion

4.1. Methods for Reducing the Elastic Modulus

In recent years, various approaches have been explored to reduce the elastic modulus of metallic implants and mitigate stress shielding. One promising approach is the development of β-type titanium alloys with an inherently low Young’s modulus (below 60 GPa). Ti-29Nb-13Ta-4.6Zr (TNTZ) alloys and Ti-Nb-Zr-Sn systems, for example, achieve a combination of low stiffness and high fatigue strength through severe plastic deformation, thermal treatments, and the addition of non-toxic elements [40]. Another widely studied method involves fabricating porous titanium foams with interconnected porosity [41]. Their electrochemical dealloying technique produces foams with elastic moduli in the range of 15.5–36 GPa, approaching that of cortical bone, while maintaining sufficient mechanical strength for load-bearing applications. In comparison, the present study introduces a more controlled geometric approach involving the adjustment of the pitch and diameter of perforations in stainless steel plates. Although the absolute reduction in Young’s modulus achieved with perforations (down to approximately 110–120 GPa) does not yet reach the levels obtained with specialized titanium alloys or foams, this method offers several practical advantages. It can be implemented using conventional manufacturing technologies, such as laser cutting. It preserves the structural integrity of the bulk material and allows the modulus to be tailored without introducing material heterogeneity. Furthermore, optimizing perforation patterns could enable further modulus reduction, bringing the mechanical behavior of implants closer to that of bone without the need for more complex alloy design or porosity processing.

4.2. The Method of Determination of Resonant Frequencies, the Three-Point Flexural Test Method, and the Finite Element Method Obtained Results

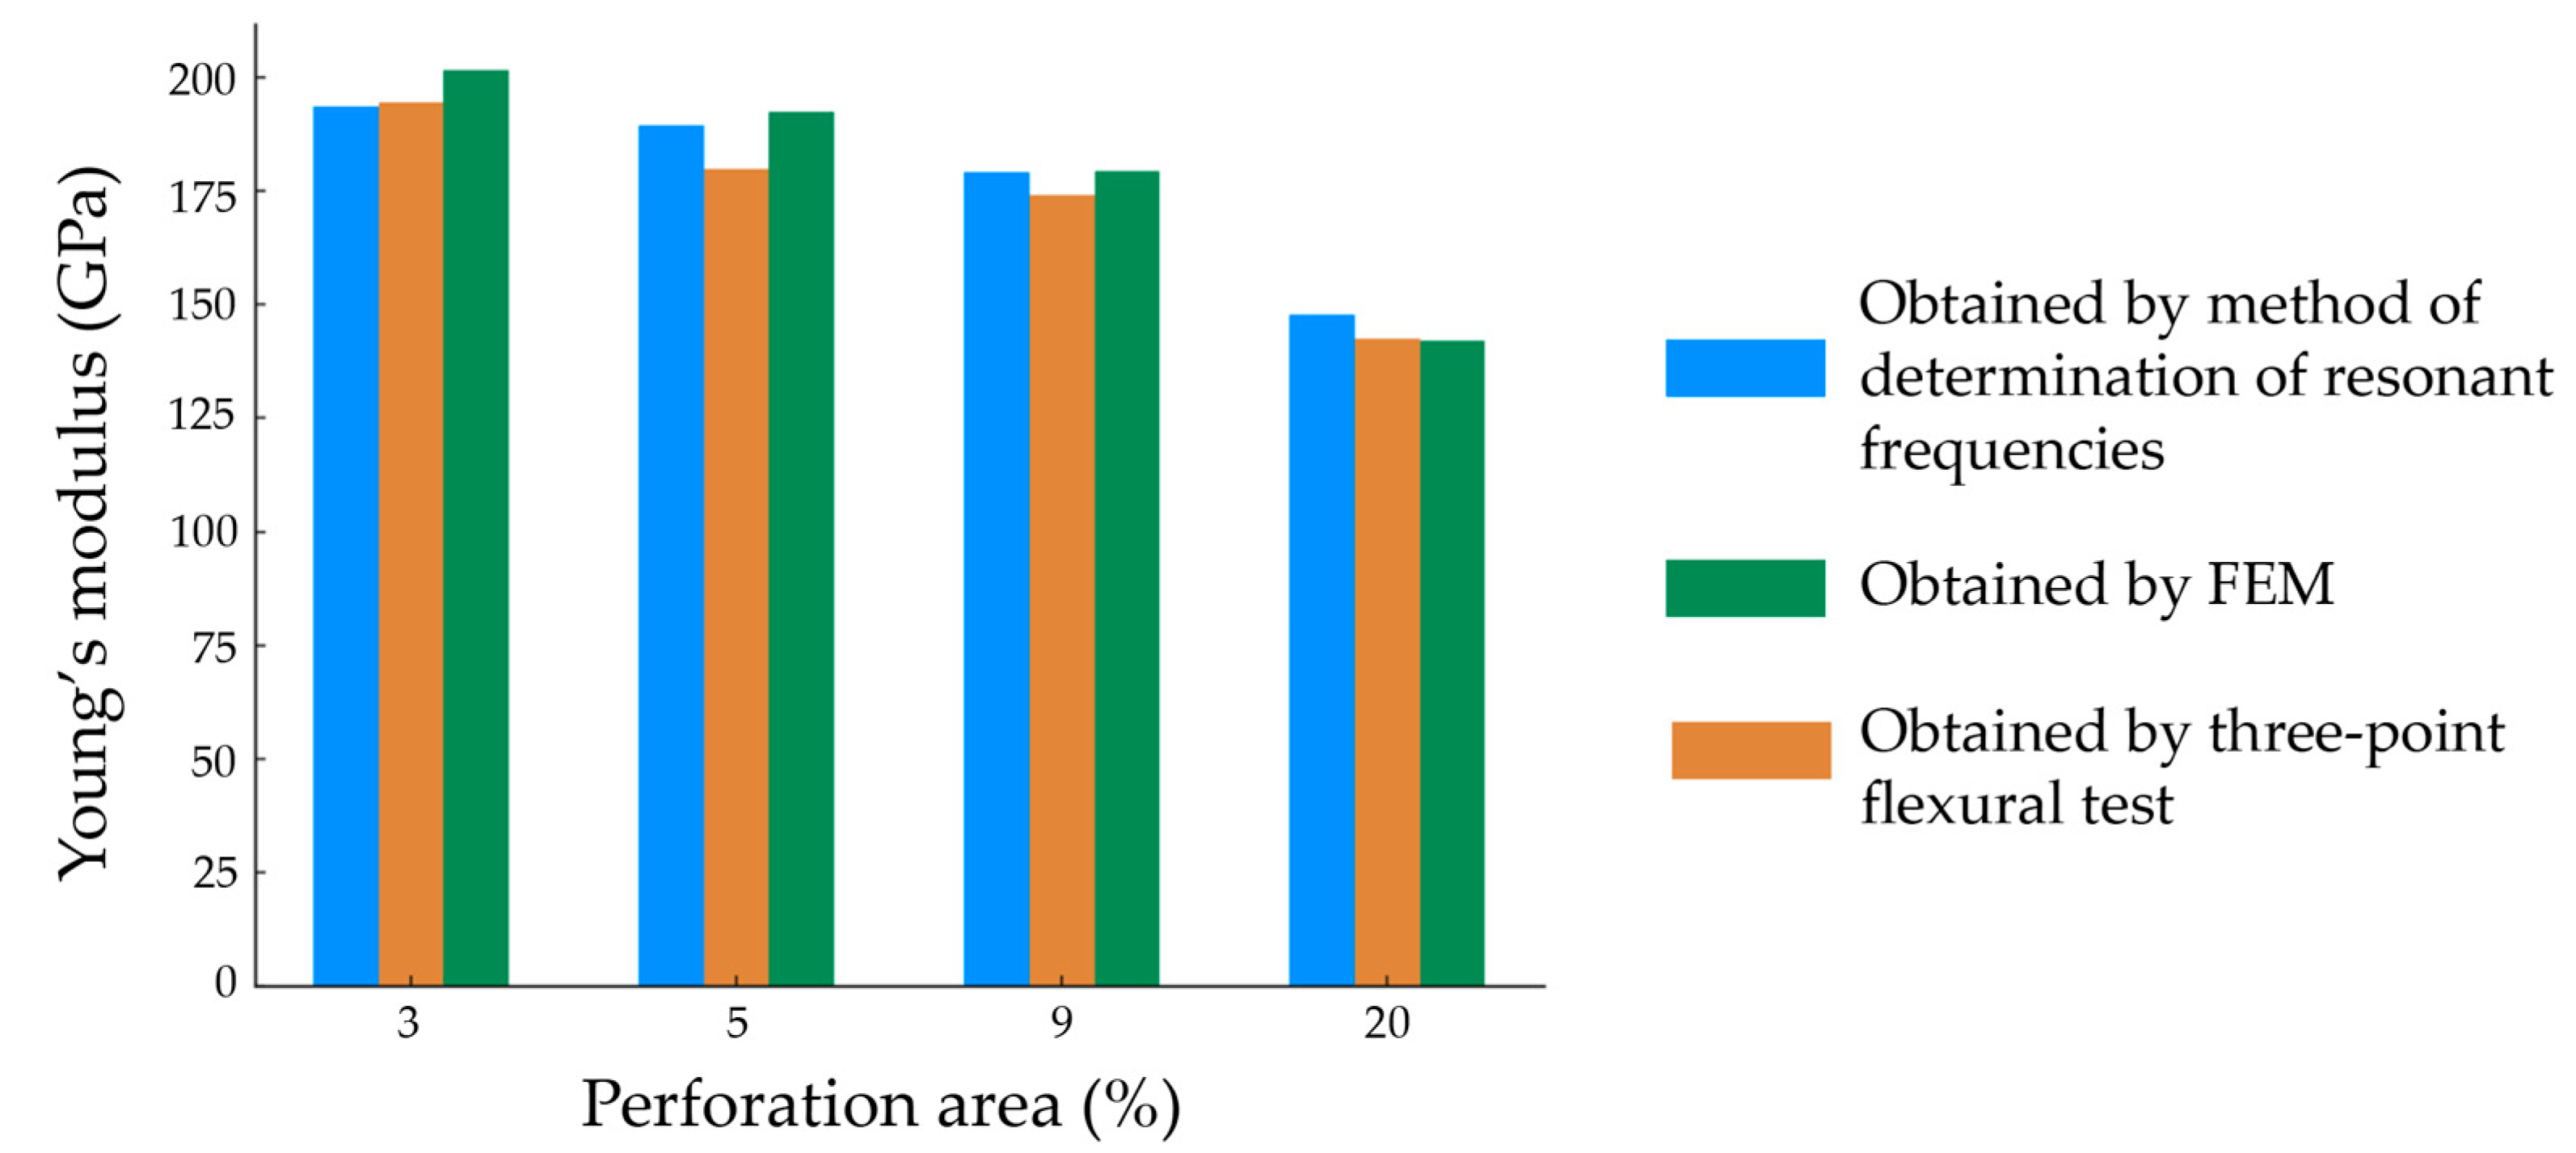
The calculated percentage reductions are summarized in Table 9, providing a comparative assessment of the different methods. The results show the importance of selecting an appropriate evaluation technique when analyzing the mechanical properties of perforated constructions, as different methods may yield varying magnitudes of stiffness reduction. A crucial aspect of evaluating the reliability of the obtained Young’s modulus values is assessing the consistency of the results across different methods. If the percentage difference between methods varies significantly at each perforation level, it concerns the accuracy and reproducibility of the results. Conversely, if the deviations between the methods remain relatively small and stable across all perforation percentages, this consistency suggests that the obtained values are robust and reliable for scientific interpretation. To quantitatively analyze these variations, the percentage difference between the methods was calculated for each perforation area.
Figure 11 presents a comparative analysis of the percentage reduction in Young’s modulus obtained by three methods across different perforation levels. The results show that, at 3.14% perforation, all methods provide nearly identical values, confirming consistency. As perforation increases, the values begin to diverge. At 4.91%, FEM predicts the highest reduction, while the resonant frequency and flexural test methods show slightly lower drops. At 8.78%, the difference becomes more distinct, with FEM showing an 11.05% reduction, resonant frequency showing 7.46%, and the flexural test showing 10.45%. At the highest perforation (19.63%), all methods show a significant drop, as follows: FEM (29.52%), resonant frequency (23.65%), and flexural test (26.68%). The convergence of the results at this stage suggests that all methods reflect the same overall mechanical trend, despite earlier discrepancies.
At a perforation area of 20%, a more pronounced divergence appears, likely due to the increasing complexity of local deformation mechanisms and potential limitations in the FEM mesh resolution and boundary conditions at high porosity levels. Across all perforation levels, the three-point bending test results show slightly lower Young’s modulus values, which can be attributed to the inherent differences between static flexural loading and dynamic resonant methods, as well as the influence of shear effects in flexural testing.
The observed non-linear decrease in Young’s modulus with increasing perforation is primarily attributed to the complex interaction between hole diameter and spacing (pitch). While both parameters influence the overall reduction in stiffness, the effect is not strictly proportional to the perforated area alone. As perforation increases, stress concentrations and local deformation zones around the holes interact, especially when the spacing becomes comparable to the hole diameter, which leads to an accelerated reduction in effective stiffness. The results of the polynomial regression analysis further indicate that spacing (pitch) has a more significant influence on the modulus than hole diameter, particularly due to its role in controlling the degree of ligament connectivity between holes. Smaller pitch values lead to reduced load-bearing paths and a more pronounced decline in stiffness, explaining the non-linear trend observed in the experimental data.

5. Conclusions

This research displays a novel approach for investigating the elastic properties of perforated metal plates using a non-destructive method of determining resonance frequencies with a laser vibrometer.
This research discovered that an increase in perforation area leads to a reduction in the Young’s modulus of 316L stainless steel plates.
For 316L stainless steel plates (perforated plates dimensions of 50 mm in height, 20 mm in width, and 1 mm in thickness; hole diameter of 1 mm; and pitch between the holes of 2, 3, 4, and 5 mm), increasing the perforation area from 3.14% to 19.63% led to a decrease in the Young’s modulus of the perforated plates from 193.63 GPa to 147.8 GPa, which was assessed using a non-destructive approach based on resonant frequency measurements obtained via laser vibrometry.
Additional results were provided by a static three-point bending test, which showed a similar downward trend in Young’s modulus with an increasing perforation area—from 194.4 GPa at 3.14% perforation to 142.6 GPa at 19.63%.
Furthermore, the finite element method (FEM) simulations confirmed that variations in perforation geometry—specifically, larger hole diameters and reduced pitch—result in a notable decline in the Young’s modulus, with values ranging from 201.5 GPa down to 72.6 GPa, depending on the configuration (diameter of perforation and pitch between perforations).
The results of the polynomial regression analysis of the virtual experiment confirmed that the effective Young’s modulus is affected by the perforation diameter and the pitch between perforations in a non-linear and interdependent way. This supports the conclusion that the perforation area alone is insufficient to fully characterize the elastic behavior of perforated plates.
A static analysis of the experimental results showed that the relationship between perforation geometry and elastic properties is non-linear and can be accurately approximated using a second-order polynomial model.
The reduction in Young’s modulus of perforated 316L stainless steel plates also impacts their strength properties. It is, therefore, recommended that future research should explore the mechanical, strength, and fatigue properties of perforated 316L stainless steel plates in order to identify the potential risks associated with increased perforation area and to determine the optimal perforation areas for these materials for future use in orthopedic implants.
To achieve an effective Young’s modulus below 70 GPa, a perforation ratio above 55%, with a perforation diameter exceeding 2.5 mm and pitch values below 3 mm, is recommended.
The results demonstrate that, with the current material, further reduction in the effective Young’s modulus is limited by technological constraints on maximum perforation diameter and minimum pitch. However, by selecting materials with intrinsically lower Young’s modulus values (e.g., Ti-6Al-4V), it would be possible to achieve target values suitable for orthopedic applications. Moreover, further optimization of hole arrangement and perforation pattern could enable additional tailoring of elastic properties, although this requires a dedicated investigation and will be addressed in future studies.
To further validate the applicability of the developed approach for orthopedic use, future studies should include mechanical testing in simulated physiological environments, such as resonance frequency measurements in PBS solution at body temperature (37 °C), to assess the possible effects of fluid interaction on the elastic properties.
The obtained results clearly indicate a consistent reduction in the Young’s modulus of 316L stainless steel perforated plates with an increasing perforation area and variation in perforation geometry. This suggests that the elastic properties of orthopedic implant structures can be deliberately tailored through controlled perforation, offering a viable strategy to affect the stress shielding effect by more closely aligning the implant’s elastic properties with the elastic properties of the bone tissue.

Author Contributions

Conceptualization, M.O. and V.M.; methodology, M.O., V.M. and P.A.; software, P.A. and M.O.; investigation, M.O., V.M., V.Z. and P.A.; data curation, M.O., V.M., P.A. and D.S.; writing—original draft preparation, M.O., V.M. and D.S.; writing—review and editing, M.O., V.M., D.S. and P.A.; visualization, P.A. and M.O.; project administration, V.M., V.Z. and M.O. All authors have read and agreed to the published version of the manuscript.

Funding

This research was funded by the project of the Latvian Council of Science LZP FLPP no. LZP-2021/1-0290 “Comprehensive assessment of the condition of bone and muscle tissue using quantitative ultrasound (BoMUS)”.

Data Availability Statement

Data supporting the results presented can be provided upon request to the respective author.

Conflicts of Interest

The authors declare no conflicts of interest.

References

  1. Nuwirth, A.L.; Ashley, B.S.; Hardaker, W.M.; Sheth, N.P. Biomedical Applications of Metals; Rai, M., Ingle, A.P., Medici, S., Eds.; Springer International Publishing: Cham, Switzerland, 2018; pp. 3–95. [Google Scholar]
  2. Swee, H.T. Engineering Materials for Biomedical Application; World Scientific Publishing Co. Pte. Ltd.: Hackensack, NJ, USA, 2004; pp. 4–29. [Google Scholar]
  3. Marco Specialty Steel, Inc. Designers, Specifiers & Buyers. In Handbook for Perforated Metals; Industrial Perforators Association: Houston, TX, USA, 1993; pp. 3–14. [Google Scholar]
  4. Mironovs, V.; Lisicins, M. Perforated Metal Materials and Their Use Possibilities; RTU Publishing House: Riga, Latvia, 2015; pp. 15–152. [Google Scholar]
  5. Lisicins, M.; Serdjuks, D.; Akishin, P.; Mironovs, V.; Goremikins, V.; Lapkovskis, V. Improving the Structural Efficiency of Punched Metal-Material-Based Composites. Polymers 2024, 16, 3468. [Google Scholar] [CrossRef] [PubMed]
  6. Baik, S.C.; Oh, K.H.; Lee, D.N. Analysis of the Deformation of a Perforated Sheet under Uniaxial Tension. J. Mater. Process. Technol. 1996, 58, 139–144. [Google Scholar] [CrossRef]
  7. Xinjian, D.; Arnaud, W.; Wilkinson, D.S.; Metzger, D.R. Plastic Limit Analysis of Perforated Material Under Finite Deformation. In Proceedings of the ASME 2005 Pressure Vessels and Piping Conference, Denver, CO, USA, 17–21 July 2005; Volume 2, pp. 1–5. [Google Scholar]
  8. Wadley, H.N. Cellular Metals Manufacturing. Adv. Eng. Mater. 2002, 4, 726–733. [Google Scholar] [CrossRef]
  9. Qian, Y.J.; Kong, D.Y.; Liu, S.M.; Sun, S.M.; Zhao, Z. Investigation on micro-perforated panel absorber with ultra-micro perforations. Appl. Acoust. 2013, 74, 931–935. [Google Scholar] [CrossRef]
  10. Abo Dorra, H.M.; Abd-Elbasseer, M.; Mahmoud, A.E.A.; Mohamed, H.K. Effect of Orifices Distribution Pattern on the Sound Absorption Performance of Double Metal Micro-Perforated Panels. Int. J. Mech. Prod. Eng. Res. Dev. 2020, 10, 15467–15476. [Google Scholar]
  11. Mironovs, V.; Kuzmina, J.; Serdjuks, D.; Usherenko, Y.; Lisicins, M. Sustainable Lifecycle of Perforated Metal Materials. Materials 2023, 16, 3012. [Google Scholar] [CrossRef] [PubMed]
  12. Karakaya, C. Numerical Investigation on Perforated Sheet Metals under Tension Loading. Open Chem. 2022, 20, 244–253. [Google Scholar] [CrossRef]
  13. Reza, F.; Tamaki, Y.; Takahashi, H.; Iwasaki, N.; Miyazaki, T. Properties of a gypsum-bonded magnesia investment using a K₂SO₄ solution for titanium casting. Dent. Mater. J. 2009, 28, 4. [Google Scholar] [CrossRef]
  14. Kroes, L. Creating More Efficiency and Patient Safety by Changing Processes and Contents of Instrument Trays. Master’s Thesis, University of Twente, Enschede, The Netherlands, 2009. [Google Scholar]
  15. Wexler Surgical. Available online: https://www.wexlersurgical.com/wexler-metal-sterilization-tray-single-level-wsilicone-brackets-105quotx215quotx25quot-266x533x63cm-p-1464.html (accessed on 1 October 2024).
  16. Dewidar, M.; Khalil, A.; Lim, J.K. Processing and Mechanical Properties of Porous 316L Stainless Steel for Biomedical Applications. Trans. Nonferrous Met. Soc. 2007, 17, 468–473. [Google Scholar] [CrossRef]
  17. Shahzamanian, M.M.; Banerjee, R.; Dahotre, N.B.; Srinivasa, A.R.; Reddy, J.N. Analysis of stress shielding reduction in bone fracture fixation implant using functionally graded materials. Compos. Struct. 2023, 321, 117262. [Google Scholar] [CrossRef]
  18. Wintermantel, E.; Mayer, J.; Goehring, T.N.; Aqida, S. Composites for Biomedical Applications. Ref. Modul. Mater. Sci. Mater. Eng. 2016, 2–3. [Google Scholar] [CrossRef]
  19. William, D.F. Handbook of Biomaterial Properties, 2nd ed.; Murphy, W., Black, J., Hastings, G., Eds.; Springer: New York, NY, USA, 2016; pp. 153–154. [Google Scholar]
  20. Ratner, B.D.; Hoffman, A.S.; Schoen, F.J.; Lemons, J.E. Biomaterials Science. An Introduction to Materials in Medicine, 2nd ed.; Elsevier: London, UK, 2004; pp. 526–528. [Google Scholar]
  21. Follansbee, P.S. Fundamentals of Strength. Principles, Experiment, and Applications of an Internal State Variable Constituve Formulation; John Wiley & Sons: Hoboken, NJ, USA, 2014; pp. 7–8. [Google Scholar]
  22. Callister, W.D. Fundamentals of Materials Science and Engineering: An Integrated Approach, 2nd ed.; John Wiley & Sons: Hoboken, NJ, USA, 2005; pp. 183–190. [Google Scholar]
  23. Callister, W.D.; Rethwisch, D.G. Fundamentals of Materials Science and Engineering: An Integrated Approach, 3rd ed.; John Wiley & Sons: Hoboken, NJ, USA, 2008; pp. 226–228. [Google Scholar]
  24. Ahmed, M.S. Numerical Analysis of the Perforated Steel Sheets Under Uni-Axial Tensile Force. Metals 2019, 9, 632. [Google Scholar] [CrossRef]
  25. Callister, W.D.; Rethwisch, D.G. Materials Science and Engineering: An Introduction, 10th ed.; John Wiley & Sons: Hoboken, NJ, USA, 2018; pp. 433–435. [Google Scholar]
  26. Migonney, V. Biomaterials. Bioengineering and Health Science Series; ISTE Ltd.: Hertfordshire, UK; John Wiley & Sons: Hoboken, NJ, USA, 2014; pp. 31–34. [Google Scholar]
  27. Ratner, B.D.; Hoffman, A.S.; Schoen, F.J.; Lemons, J.E. Biomaterials Science. An Introduction to Materials in Medicine, 1st ed.; Academic Press: Millbrae, CA, USA, 1996; pp. 37–50. [Google Scholar]
  28. Hanawa, T. Research and development of metals for medical devices based on clinical needs. Sci. Technol. Adv. Mater. 2012, 13, 064102. [Google Scholar] [CrossRef]
  29. Sáenz de Viteri, V.; Fuentes, E. Titanium and Titanium Alloys as Biomaterials. In Tribology—Fundamentals and Advancements; Gegner, J., Ed.; IntechOpen: Rijeka, Croatia, 2013; pp. 160–163. [Google Scholar]
  30. Krasnikovs, A.; Kononova, O.; Machanovskis, A.; Zaharevskis, V.; Akishins, P.; Ruchevskis, S. Characterization of mechanical properties by inverse technique for composite reinforced by knitted fabric. Part 2. Experimental evaluation of mechanical properties by frequency eigenvalues method. J. Vibroeng. 2012, 14, 691–698. [Google Scholar]
  31. Kovalovs, A.; Rucevskis, S. Identification of elastic properties of composite plate. IOP Conf. Ser. Mater. Sci. Eng. 2011, 23, 012034. [Google Scholar] [CrossRef]
  32. Wesolowski, M.; Barkanov, E.; Rucevskis, S.; Chate, A.; La Delfa, G. Characterisation of elastic properties of laminated composites by non-destructive techniques. In Proceedings of the ICCM International Conferences on Composite Materials, Edinburgh, UK, 27–31 July 2009; pp. 5–7. [Google Scholar]
  33. Rothberg, S.J.; Allen, M.S.; Castellini, P.; Di Maio, D.; Dirckx, J.J.J.; Ewins, D.J.; Halkon, B.J.; Muyshondt, P.; Paone, N.; Ryan, T.; et al. An international review of laser Doppler vibrometry: Making light work of vibration measurement. Opt. Lasers Eng. 2017, 99, 11–22. [Google Scholar] [CrossRef]
  34. Barkanov, E.; Wesolowski, M.; Akishin, P.; Mihovski, M. Techniques for Non-Destructive Material Properties Characterisation. In Non-Destructive Testing and Repair of Pipelines; Barkanov, E.N., Dumitrescu, A., Parinov, I.A., Eds.; Engineering Materials; Springer: Cham, Switzerland, 2018; pp. 194–203. [Google Scholar]
  35. Rikards, R.; Abramovich, H.; Green, T.; Auzins, J.; Chate, A. Determination of Elastic Properties of Stiffened Composite Shells by Vibration Analysis. Mech. Adv. Mater. Struct. 2003, 10, 177–180. [Google Scholar]
  36. Pickett, G. Equations for Computing Elastic Constants from Flexural and Torsional Resonant Frequencies of Vibration of Prisms and Cylinders. Proc. ASTM 1945, 45, 846–865. [Google Scholar]
  37. ASTM Standard E 1876-07; Standard Test Method for Dynamic Young’s Modulus, Shear Modulus and Poisson’s Ratio by Impulse Excitation of Vibration. ASTM International: West Conshohocken, PA, USA, 2007.
  38. Losertová, M.; Štamborská, M.; Lapin, J.; Mareš, V. Comparison of deformation behavior of 316L stainless steel and Ti6Al4V alloy applied in traumatology. Metalurgija 2016, 55, 667–670. [Google Scholar]
  39. Auzins, J.; Janushevskis, A.; Janushevskis, J.; Skukis, E. Software EDAOpt for experimental design, analysis and multiobjective robust optimization. In Proceedings of the 1st International Conference on Engineering and Applied Sciences Optimization, Kos, Greece, 4–6 June 2014; pp. 1055–1077. [Google Scholar]
  40. Yaqoob, K.; Amjad, I.; Awan, M.A.M.; Liaqat, U.; Zahoor, M.; Kashif, M. Novel Method for the Production of Titanium Foams to Reduce Stress Shielding in Implants. ACS Omega 2023, 8, 1876–1884. [Google Scholar] [CrossRef]
  41. Niinomi, M.; Nakai, M. Titanium-Based Biomaterials for Preventing Stress Shielding Between Implant Devices and Bone. Int. J. Biomater. 2011, 2011, 836587. [Google Scholar] [CrossRef] [PubMed]
Figure 1. Types of perforation in metal construction.
Metals 15 00711 g001
Figure 2. Perforated stainless steel 316L plates made using the laser cutting method. (a) Aperf = 3.14%; (b) Aperf = 4.91%; (c) Aperf = 8.78%; (d) Aperf = 19.63%.
Metals 15 00711 g002
Figure 3. The Polytec PSV-500 scanning head was used in this experiment to determine the resonance frequences using the laser vibrometry method. (a) Scanning head; (b) sample; (c) loudspeaker; (d) monitor; (e) PC; (f) junction box; (g) controller.
Metals 15 00711 g003
Figure 4. Sample scanning process using Polytec PSV-500. (a) Scanned points marked with light green color; (b) un-scanned points marked with blue color.
Metals 15 00711 g004
Figure 5. Stainless steel 316L 4 sample’s experimentally measured mode shape 2.0 as the fundamental bending frequency (fb). (a) Two half-waves in length.
Metals 15 00711 g005
Figure 6. Three-Point bending test of the perforated stainless steel 316L plates. (a) Experimental machine for conducting the three-point bending test; (b) perforated stainless steel 316L plate before the three-point bending test; (c) perforated stainless steel 316L plate after the three-point bending test.
Metals 15 00711 g006
Figure 7. Finite element model of the stainless steel 316L perforated plate with a perforation diameter of 2 mm and pitch of 3 mm. (a) Finite element model; (b) 1st bending mode shape.
Metals 15 00711 g007
Figure 8. Dependence of Young’s modulus of the perforated 316L stainless steel plates on perforation area (perforated plates dimensions of 50 mm in height, 20 mm in width, and 1 mm in thickness; hole diameter of 1 mm; and pitch between the holes of 2, 3, 4, and 5 mm), obtained by method of determination of resonant frequencies and obtained by three-point flexural test.
Metals 15 00711 g008
Figure 9. Dependence of the perforated stainless steel 316L plate’s Young’s modulus on perforation diameter and pitch between perforations. (a) Three-dimensional surface of elastic modulus, diameter, and pitch dependence; (b) 2D plot of Young’s modulus dependence on pitch between the perforations and perforation diameter from 1mm to 3 mm.
Metals 15 00711 g009aMetals 15 00711 g009b
Figure 10. Relative influence of P and D parameters.
Metals 15 00711 g010
Figure 11. Dependence of the Young’s modulus of the perforated 316L stainless steel plates on the perforation area, obtained by the method of determination of resonant frequencies, the three-point flexural test method, and the FEM.
Metals 15 00711 g011
Table 1. Perforation parameters of the stainless steel 316L plates.
Sample No.Perforation Diameter (mm)Pitch between Perforations (mm)Perforation Area (%)
1.153.14
2.144.91
3.138.78
4.1219.63
Table 2. Physical, geometric, experimental, and calculated data of the perforated stainless steel 316L samples.
Sample No.Weight (g)Length (mm)Width (mm)Thickness (mm)Fundamental Bending Frequency (kHz)Correction Factor TPerforated Plates’ Young’s Modulus (GPa)
1.7.4502012.1001.003193.63
2.7.4502012.0771.003189.41
3.7.2502012.0481.003179.18
4.6.6502011.9431.003147.84
Table 3. Comparison of the physical and numerical properties of the perforated stainless steel 316L plates with a perforation diameter of 1.0 mm.
Pitch Between Holes (mm)Experimental 1st Eigenfrequency (kHz)Numerical 1st Eigenfrequency (kHz)1st Eigenfrequency Difference (%)Experimental Weight (g)Numerical Weight (g)Weight Difference (%)
52.1002.1211.07.407.552.0
42.0772.0890.67.407.430.4
32.0482.0470.07.207.210.1
21.9431.922−1.16.606.48−1.8
Table 4. Physical, numerical, and calculated data of the perforated stainless steel 316L virtual samples with dimensions of 50 × 20 × 1 mm.
Sample No.Perforation Diameter (mm)Pitch Between Perforations (mm)Weight (g)Fundamental Bending Frequency (kHz)Correction Factor TYoung’s modulus of Perforated Virtual Samples (GPa)Perforation Area (%)
V1157.552.1211.003201.533.14
V2147.432.0891.003192.384.91
V3137.212.0471.003179.268.78
V4126.481.9221.003142.0319.63
V51.557.252.0761.003185.397.07
V61.546.972.0101.003167.0811.05
V71.536.481.9341.003143.8119.64
V81.524.821.7291.00391.8444.18
V9256.822.0181.003164.7912.57
V10246.331.9101.003137.0219.64
V11235.451.8061.003105.4734.91
V122.556.271.9501.003141.4619.64
V132.545.501.7921.003104.7930.68
V142.534.121.6581.00367.1954.54
V15355.591.8731.003116.3628.27
V16344.491.6511.00372.6244.18
Table 5. Results of the second-order polynomial regression.
Free TermLinear TermQuadratic Termσcross,
%
R2adjustedσ, %Standard Deviation of ExpressionMaximal Relative Error, %
51.27562.22−6.7854.390.9716.3220.691.27
Table 6. Results of the second-order polynomial regression for the finite element method.
Free TermLinear TermsQuadratic Termsσcross,
%
R2adjustedσ, %Standard Deviation of ExpressionMaximal Relative Error, %
144.76752.3702
−109.531
−7.07648
−5.0348
17.2956
11.650.998.7942.127.06
Table 7. Verification with additional points.
Sample No.Perforation Diameter (mm)Pitch Between Perforations (mm)Weight (g)Fundamental Bending Frequency (kHz)Correction Factor TYoung’s Modulus of Perforated Virtual Samples (GPa)Young’s Modulus of Perforated Virtual samples Obtained Using Mathematical Model (GPa)Difference, %Perforation Area (%)
T11.753.56.491.9601.003147.93140.215.2119.64
T22.252.53.461.6311.00354.6156.824.0563.62
T32.754.55.761.8951.003122.73111.888.8529.33
Table 8. Pearson correlation coefficients between methods.
MethodsPearson Correlation Coefficient
Determination of resonant frequencies and three-point bending test0.98
Determination of resonant frequencies and finite element method0.99
Finite element method and three-point bending test0.99
Table 9. The percentage reductions in Young’s modulus of the perforated 316L stainless steel plates obtained by the method of determination of resonant frequencies, the three-point flexural test method, and the finite element method (FEM).
Perforation Area (%)Percentage Reduction in Young’s Modulus Obtained by the Method of Determination of Resonant Frequencies (%)Percentage Reduction in Young’s Modulus Obtained by the Three-Point Flexural Test (%)Percentage Reduction in Young’s Modulus Obtained by FEM (%)
3.14000
4.912.187.514.54
8.787.4610.4511.05
19.6323.6526.6829.52
Disclaimer/Publisher’s Note: The statements, opinions and data contained in all publications are solely those of the individual author(s) and contributor(s) and not of MDPI and/or the editor(s). MDPI and/or the editor(s) disclaim responsibility for any injury to people or property resulting from any ideas, methods, instructions or products referred to in the content.