Article

High-Speed Nanoindentation and Local Residual Stress Analysis for Cut Edge Damage in Complex Phase Steels for Automotive Applications

by
Laia Ortiz-Membrado
1,2,*,
Sergi Parareda
3,4,
Daniel Casellas
3,5,
Emilio Jiménez-Piqué
1,2 and
Antonio Mateo
1,2
1
CIEFMA—Department of Materials Science and Engineering, EEBE—Campus Diagonal Besòs, Universitat Politècnica de Catalunya—BarcelonaTech, 08019 Barcelona, Spain
2
Barcelona Research Center in Multiscale Science and Engineering, Campus Diagonal Besòs, Universitat Politècnica de Catalunya—BarcelonaTech, 08019 Barcelona, Spain
3
Unit of Metallic and Ceramic Materials, Eurecat, Centre Tecnològic de Catalunya, 08243 Manresa, Spain
4
Mechatronics and Modelling Applied on Technology of Materials (MECAMAT), Universitat de Vic-Universitat Central de Catalunya (UVic-UCC), 08500 Vic, Spain
5
Division of Solid Mechanics, Department of Engineering Sciences and Mathematics, Luleå University of Technology, 971 87 Luleå, Sweden
*
Author to whom correspondence should be addressed.
Metals 2025, 15(6), 651; https://doi.org/10.3390/met15060651
Submission received: 1 May 2025 / Revised: 5 June 2025 / Accepted: 9 June 2025 / Published: 11 June 2025
(This article belongs to the Special Issue Microstructure and Mechanical Behavior of High-Strength Steel)

Abstract

:
Advanced high-strength steels (AHSSs) are used as lightweight solutions for vehicles, mainly focusing on the Body-in-White. However, the implementation of such steels for chassis parts requires a profound knowledge of the key design parameters for these components, particularly those concerning fatigue performance. Manufacturing of chassis parts include mechanical cutting operations. Therefore, the deformation and damage induced at the cut edge may affect the fatigue resistance of the parts in service. To characterize and study this critical area, damage and micromechanical properties have been evaluated at the cut edge for three different AHSS grades, CP800, CP980, and DP600, analyzing the impact of cutting parameters and post-processing treatments, such as sandblasting. Large high-speed nanoindentation maps of 400 × 200 µm2 have been carried out along the cut edge in the three different target zones: burnish, fracture, and burr. In the hardness maps, the deformation lines and the gradient of hardness with increasing distance from the cut edge are perfectly observed. Residual stresses at the target zones of the cut edges were measured using the FIB-DIC method for CP980 to complement the micromechanical study in these critical areas. The results found show that reduced cutting clearance leads to larger hardened zones and favorable compressive stress distributions, correlating with improved fatigue resistance. Hardened zones extending up to 100 µm from the cut edge and compressive residual stresses exceeding −300 MPa were observed at low clearance. These findings are consistent with numerical simulations and previous fatigue tests, highlighting the potential of combining high-speed nanoindentation and local stress analysis for optimizing shear cutting processes in AHSS components.

Graphical Abstract

1. Introduction

The automotive industry emphasizes the importance of reducing the weight of its components in order to improve vehicle efficiency and reduce the environmental impact. This aspect becomes particularly relevant in electric vehicles, where limited battery capacity makes vehicle range more sensitive to weight. Body-in-white (BiW) components have traditionally been the main focus of weight reduction, but in recent years, the focus has shifted to the lightweighting of chassis components too. To achieve this, it is essential to reduce components’ thickness while maintaining mechanical integrity, particularly fatigue performance, which can be addressed with the use of higher-strength materials [1,2,3].
Candidates for these applications are advanced high-strength steels (AHSSs) due to their superior mechanical properties. Among AHSSs, dual phase (DP) steels are widely used for BiW applications because of their optimal balance between strength and ductility, which is a result of their ferrite–martensite microstructure. This microstructure gives them good formability and high strength [4,5]. However, in the context of the chassis, where components are subjected to high dynamic loads and cyclic stresses, the demand for enhanced strength, fatigue resistance, and fracture toughness and crashworthiness makes complex phase (CP) AHSSs the preferred choice [6]. CP steels are characterized by their multiphase microstructure, which typically includes martensite, bainite, ferrite, retained austenite, dispersed carbide precipitates, and also, in some grades, perlite [7,8,9]. This refined microstructure results in a combination of high strength and fracture toughness, and improved resistance to strain localization and edge cracking compared with DP steels [10,11].
One of the main challenges in implementing both DP and CP steels in automotive components is their susceptibility to shear cutting processes, such as trimming and punching. These manufacturing processes introduce localized plastic deformation, residual stresses, and microstructural damage at the cut edge, with its consequent impact on fatigue life and mechanical performance [12,13]. Previous works demonstrated that damage at the cutting edges of DP steels primarily occurs due to the nucleation of voids in martensite, decohesion at the ferrite–martensite interface, and fracture of hardened particles [14]. In contrast, CP steels exhibit higher fracture resistance due to their fine and homogeneous microstructure consisting of martensite, bainite, retained austenite, and carbide precipitates. This results in a reduction in the susceptibility to damage localization and enhanced resistance to crack propagation [15]. To improve fatigue strength, surface treatments that introduce compressive residual stresses and refine the microstructure in the surface layer, such as shot peening and sandblasting, have been explored in the literature [13]. Additionally, the use of two-step punching has been investigated as an effective strategy to improve the quality of the cut edge, reducing defects and optimizing the mechanical strength of the material [16]. It has also been shown that bake hardening treatment in CP steels improves stress distribution and increases fatigue strength, providing an effective strategy for optimizing mechanical performance [17].
Some studies have used advanced techniques to characterize damage at the sheared edges of AHSS. The use of scanning electron microscopy (SEM), EBSD, and nanoindentation has allowed the evaluation of local variations in hardness, elasticity, and crystal structure at shear-affected edges [18]. Previous research has correlated nanoindentation results with conventional mechanical tests, such as hole expansion and tensile tests, demonstrating that localized edge hardening directly affects the fracture toughness and ductility of CP and DP steels [19].
This damage also produces residual stresses, which can significantly influence crack propagation and the fatigue life of components [20]. Studies have shown that, after the cutting process, residual stresses can be either tensile or compressive, depending on the microstructure and processing parameters [21]. Residual stress measurement and analysis have been conducted in previous studies [22] using X-ray diffraction (XRD) and finite element simulations. These methods have enabled the assessment of how various shear conditions influence residual stress levels along the sheared edge.
It has been observed that the increase in shear clearance generates a higher accumulation of tensile stresses in the affected zones, affecting the mechanical strength and formability of the material [23,24]. However, these methods cover wide spatial ranges and thus are not adequate for studying local residual stresses in the shear zone. Techniques such as Focused Ion-Beam Digital Image Correlation (FIB-DIC) could provide a more accurate characterization of residual stresses in specific regions of the vicinity of the sheared edge. This method has been used in other materials to analyze residual stresses in areas of damage, such as in alloys affected by shot peening [25], microvoids at interfaces [26], or fatigue cracks [27]. Despite these applications, studies employing FIB-DIC to quantify residual stresses in the cut edge damage zones of AHSS are scarce, and more research is needed to explore the applicability of this technique to the characterization of small material volumes at the sheared edges. It is expected that more accurate results would allow us to better understand the relation between the sheared damage and the fatigue performance, which would give valuable information to design microstructures with enhanced edge damage tolerance.
In addition, recently, the novel technique of high-speed nanoindentation (HSN) has demonstrate the ability to provide high-throughput testing with rapid and large acquisition of micromechanical property maps along the surface [28,29,30]. This method allows us to characterize regions with property gradients or local property changes due to processing. Very small material volumes can be analyzed because the indentation depths are typically within the range of 1–2 µm. This technique provides a detailed understanding of microscale mechanical responses, which can be upscaled to the macroscopic performance of materials and help to improve material selections in automotive applications. By bridging micromechanics and applied engineering, HSN links microscopic phenomena to overall material behavior. When integrated with advanced residual stress measurements, it offers a powerful framework for analyzing deformation and damage mechanisms across various materials and processes. Nevertheless, in highly heterogeneous microstructures with very small grain or phase sizes, such as in complex phase steels, the indentation may cover multiple phases, leading to average hardness values and limiting phase-level resolution. This should be taken into account when interpreting the maps [31].
Following the above comments, in this work, the damage induced at the shear edge of CP steels was analyzed by a combination of high-speed nanoindentation and local residual stress measurement using FIB-DIC techniques. The micromechanical properties were investigated along the shear edge for different shear clearances commonly used in sheet metal forming processes. The effect of sandblasting, widely used in the automotive industry for surface preparation prior to painting, on the shear edge’s characteristics was also evaluated. This study demonstrates the potential of the proposed approach to improve edge damage assessment in AHSS sheets, which may contribute to optimizing forming parameters when manufacturing structural components.

2. Materials and Methods

2.1. Materials

Three hot-rolled high-strength steels supplied by ArcelorMittal (Asturias, Spain), two CP grades and one DP grade, were selected to investigate the influence of cut edge damage on the micromechanical properties. The tensile properties of these steels are summarized in Table 1, whereas their chemical compositions according to the material suppliers are given in Table 2. Both CP steels were specially designed to have a very good stretch flangeability, which is indicated in their designation by SF. HR CP800 SF is a hot-rolled (HR) steel with a microstructure composed of a bainitic–ferritic matrix with martensite and austenite islands. Higher tensile strength is achieved by the HR CP980 SF thanks to the complex microstructure composed of tempered martensite and ferrite, combined with upper bainite and retained austenite islands. HR DP600 steel perfectly balances formability and strength by combining a soft ferrite matrix with martensite islands. The microstructures are shown in Figure 1.
Trimmed shear cut (open cut) specimens were produced using a servo-hydraulic machine. The cutting clearance is defined as the horizontal distance between the punch and the die, expressed as a percentage of the sheet’s thickness, as shown in Figure 1a. Detailed information on the specimens and the cutting methodology is provided in [32].
Sandblasting was performed on HR CP800 SF specimens. The sandblasting process was carried out using glass microspheres (40 to 95 µm in diameter) as the abrasive media and a compressed air pressure of 6 bar. The blasting direction was always perpendicular to the surface of the material, with a 20 mm distance between the workpiece and the nozzle. The detailed configurations of the studied materials and treatments are presented in Table 3.
The selection of these steels was based on their relevance in automotive applications. Sandblasting treatment was analyzed in CP800 to assess its potential to mitigate cut edge damage and improve fatigue performance, as CP800 represents a widely used grade with a balanced combination of strength and ductility. Its intermediate mechanical strength makes it an ideal material to evaluate treatment effects without masking them. CP980 was chosen for analyzing the clearance effect because its high tensile strength amplifies the impact of clearance variation on residual stress accumulation and hardening distribution at the shear edge. DP600, a dual phase steel with high ductility, was included as a reference to compare the micromechanical response of CP steels against a more deformable AHSS.
To characterize the cut edge region, the specimens were sectioned along the cross-section, as illustrated in the schema on the left side of Figure 2. The cross-sectional shape of the cut edge is shown on the right side of Figure 2, with the specific zones of interest (burr, fracture, transition, and burnish) marked. The burnish zone corresponds to the smooth, shiny region formed by the initial contact and plastic deformation by the tool on the sheet’s surface, typically extending from the top edge downward, characterized by a uniform surface finish. The transition zone follows the burnish zone and marks the shift from material deformation to material fracture. The fracture zone is defined by a rough appearance; it extends from the burnish zone to near the bottom edge, showing irregular contours. Finally, the burr is the rough edge formed at the bottom of the cut as the punch exits the sheet. It results from severe plastic deformation, where the material is dragged instead of being cleanly fractured. This zone typically accumulates high residual stresses and may require post-processing to improve dimensional accuracy and surface finish.

2.2. High-Speed Nanoindentation (HSN)

Specimens were cut and polished with up to 1 micron diamond paste and a last step with colloidal silica in a VibroMet 2 vibratory polishing machine from Buehler (Lake Bluff, IL, USA). Ethanol was used as a lubricant to avoid oxidation and contamination that could arise from water-based lubricants, ensuring a clean and uniform surface finish.
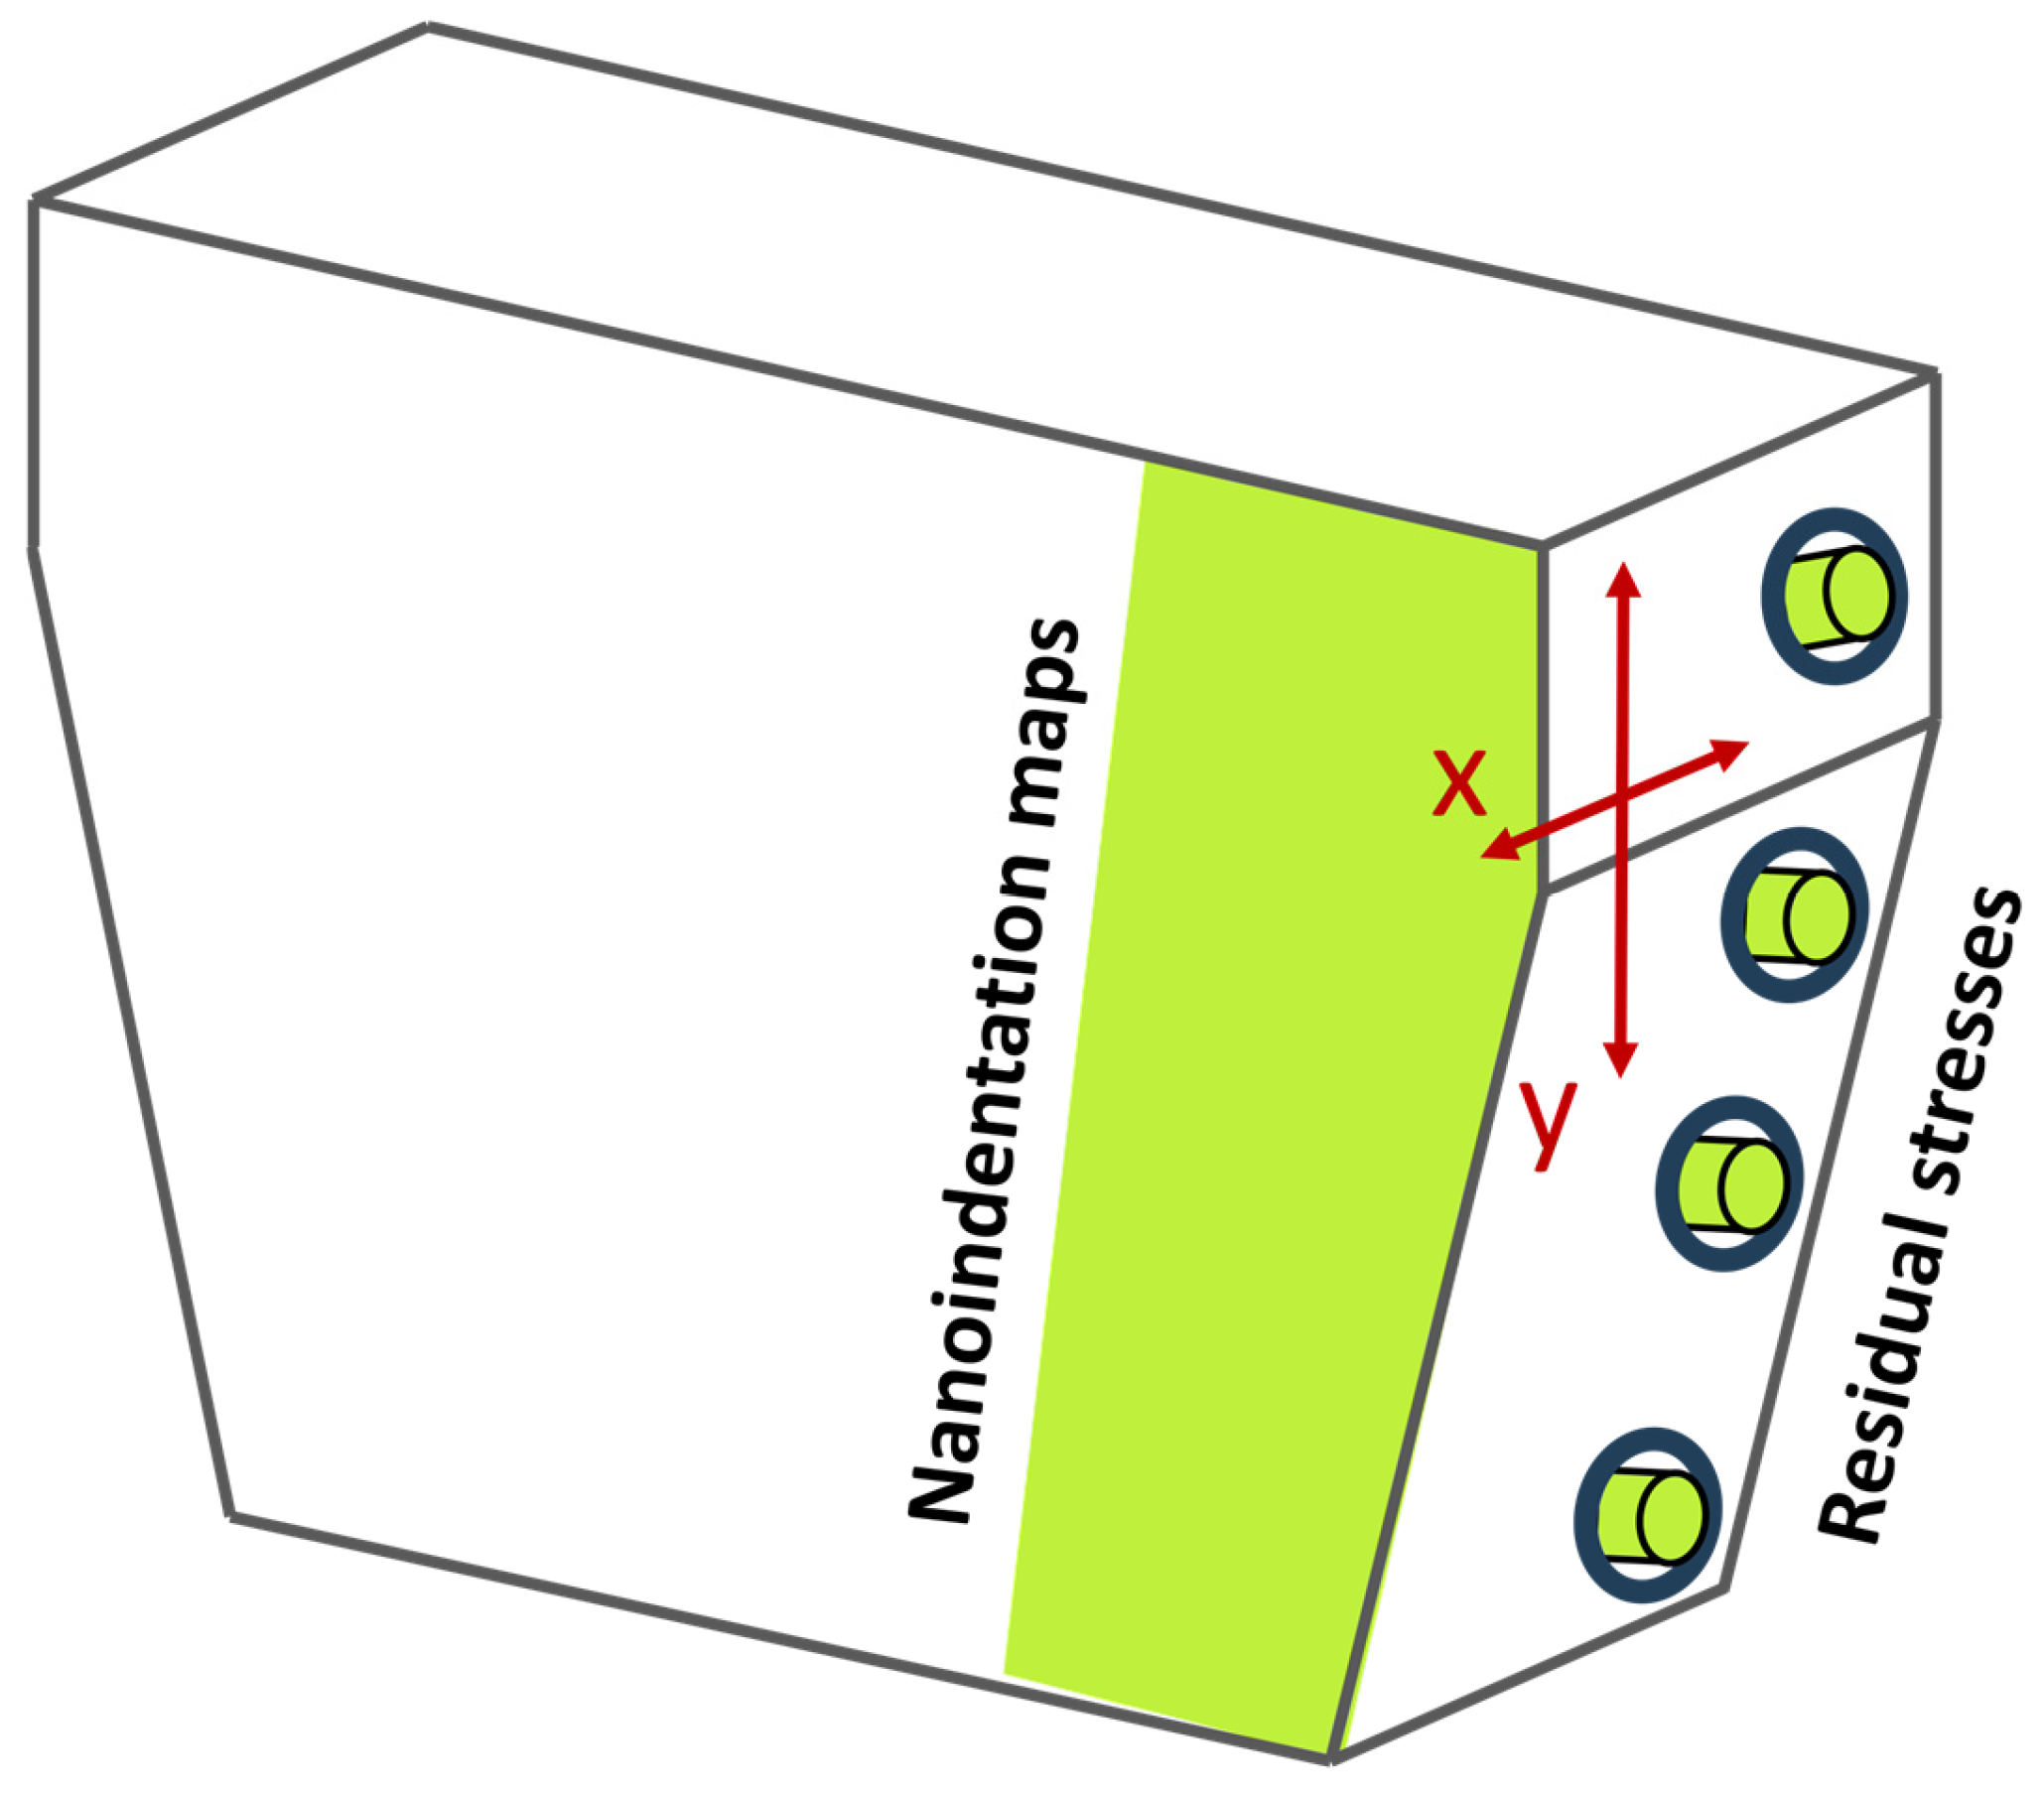
HSNs were obtained along the cut edge using NanoBlitz 3D property mapping of a KLA (Milpitas, CA, USA) iMicro nanoindenter. Tests were conducted with a Berkovich tip that had been previously calibrated with fused silica. A maximum load of 2 mN was applied, reaching a maximum indentation depth of 150 nm, whereas the spacing between indentations was set as 1.6 µm. Nanoindentation mapping was performed on all specimens on the cross-section face, as illustrated in Figure 3. For CP800, maps were performed in different regions of the cut edge. In the transition region, a 400 × 400 µm2 area was mapped, with 250 × 250 nanoindentations. For the fracture and burr regions, a 400 × 200 µm2 area was mapped with 250 × 125 nanoindentations. Similarly, for CP980 and DP600, maps were conducted in the burnish, fracture, and burr regions, covering 400 × 200 µm2 areas with 250 × 125 nanoindentations in each case.
Gaussian Mixture Model (GMM) [33,34] clustering analysis was subsequently applied to the nanoindentation data in each mapped region to identify distinct mechanical populations on the basis of hardness and modulus. This statistical classification enabled differentiation between the base microstructure and harder zones associated with plastic deformation and/or hard phases.

2.3. Residual Stress Measurement

Local residual stress measurements were performed at the cut edge of the two CP980 specimens using the FIB-DIC method [35]. Specimens were milled using a scanning electron microscope (SEM) equipped with a focused ion beam (FIB) Carl Zeiss Neon40 Crossbeam (Jena, Germany). Atlas 5 lithography from Zeiss, incorporated to the SEM-FIB was employed to control the milling process. Following the specimen preparation procedure depicted in Figure 3, FIB-DIC was applied to the burnish, transition, fracture, and burr zones. For each zone, the specimen was tilted to ensure that the surface was perpendicular to the FIB.
The ring–core procedure [36,37] was performed using a current of 2 nA at 30 kV. A protective platinum layer was deposited over the area of interest to prevent surface damage during milling, and a random dot pattern was produced via FIB milling to generate the required surface features for accurate digital image correlation (DIC). An alignment mark was also created to align the images between steps. The sample was kept at the standard FIB tilt angle during imaging, and a tilt correction was applied to the SEM images to accurately compute the strain component along the y-axis.
The incremental milling process of the ring–core geometry, with an inner diameter of 10 µm, was conducted in 7 steps, each reaching a depth of 1.4 µm. Two high-resolution images were captured at each step. The in-plane deformations in the x and y directions were analyzed using VIC-2D Digital Image Correlation software (version 7) to obtain strain data, subsequently plotted against the h/D ratio and fitted using a master curve approach, as recommended by established methodologies. This enabled the extrapolation of full-depth strain values. The residual stress was then calculated from these strain values using the adapted equation for biaxial conditions [35]
σ x = E 1 ν 2 Δ ε x + ν Δ ε y
where E is the elastic modulus, ν is Poisson’s ratio, and Δ ε x and Δ ε y are the measured strains in the x and y directions, as shown in Figure 3.
The study of residual stresses generated during the cutting process is fundamental to understanding the influence of clearance on the mechanical integrity of the material. In this section, the results obtained by FIB-DIC are presented. These results allow for the evaluation of the stress distribution in different zones of the shear edge in CP980 steel with 8.50% and 17.14% clearance.
To obtain a detailed analysis of the local residual stresses at the different zones, the FIB-DIC technique was used. This methodology allows us to measuring strain redistribution at the microscale from controlled material removal by ring–core milling, followed by digital image analysis.
In Figure 4, a series of images of the fracture zone in CP980 with 8.5% clearance are shown, corresponding to milling Steps 0, 1, and 5. These images are complemented with a deformation map that illustrates the distribution of measured deformation in the x-direction at the center of the milled geometry. It is evident from the images that a progressive redistribution of the deformation is observed as the milling progresses in each step. This allows for quantification of the stress relaxation in the central zone as the depth increases.
Figure 5 presents two of the measured values of strain relief in the x-direction at each step, plotted as a function of the height/diameter ratio (h/d) for the specimen with 8.5% clearance at two of the measured zones. In each step of the process, the mean deformation in the study area has been measured and plotted, with the error bar corresponding to the standard deviation. The values have been fitted with the master curve [35], and the two zones shown exhibit different trends. On one hand, the burnish zone (Figure 5a) exhibits compressive residual stresses, as evidenced by an increasing trend of relief with depth. In contrast, the transition zone (Figure 5b) demonstrates tensile residual stresses, characterized by a decreasing trend of relief as the h/d ratio increases.

3. Results and Discussion

3.1. Analysis of the Cut Edge Cross-Sections

Figure 6 presents optical microscopy images of the cut edge specimens under study, with shaded areas indicating the zones where tests were conducted: burr, fracture, and burnish along the cut edge. CP800 sandblasted specimen shows a more refined and polished surface texture, with slightly reduced roughness, in comparison with the untreated CP800 specimen. In the case of the CP980 specimens, the increase in clearance produced a different amount of burnish and fracture zone at the cut edge cross section. Similar cut edge profiles were observed in previous works [24]. While with a reduced clearance the transition from burnish zone to fracture area is almost linear, conversely, with an increased clearance, an outward curvature becomes apparent. This morphology is typically observed in sheared edges of AHSS because cracks nucleate at the surfaces in contact with the punch and the die, then for higher clearances the initial crack position are more separated and the final sheared edge shows a more pronounced curvature.

3.2. Effect of the Microstructure: Trimmed CP800, CP980, and DP600 Specimens

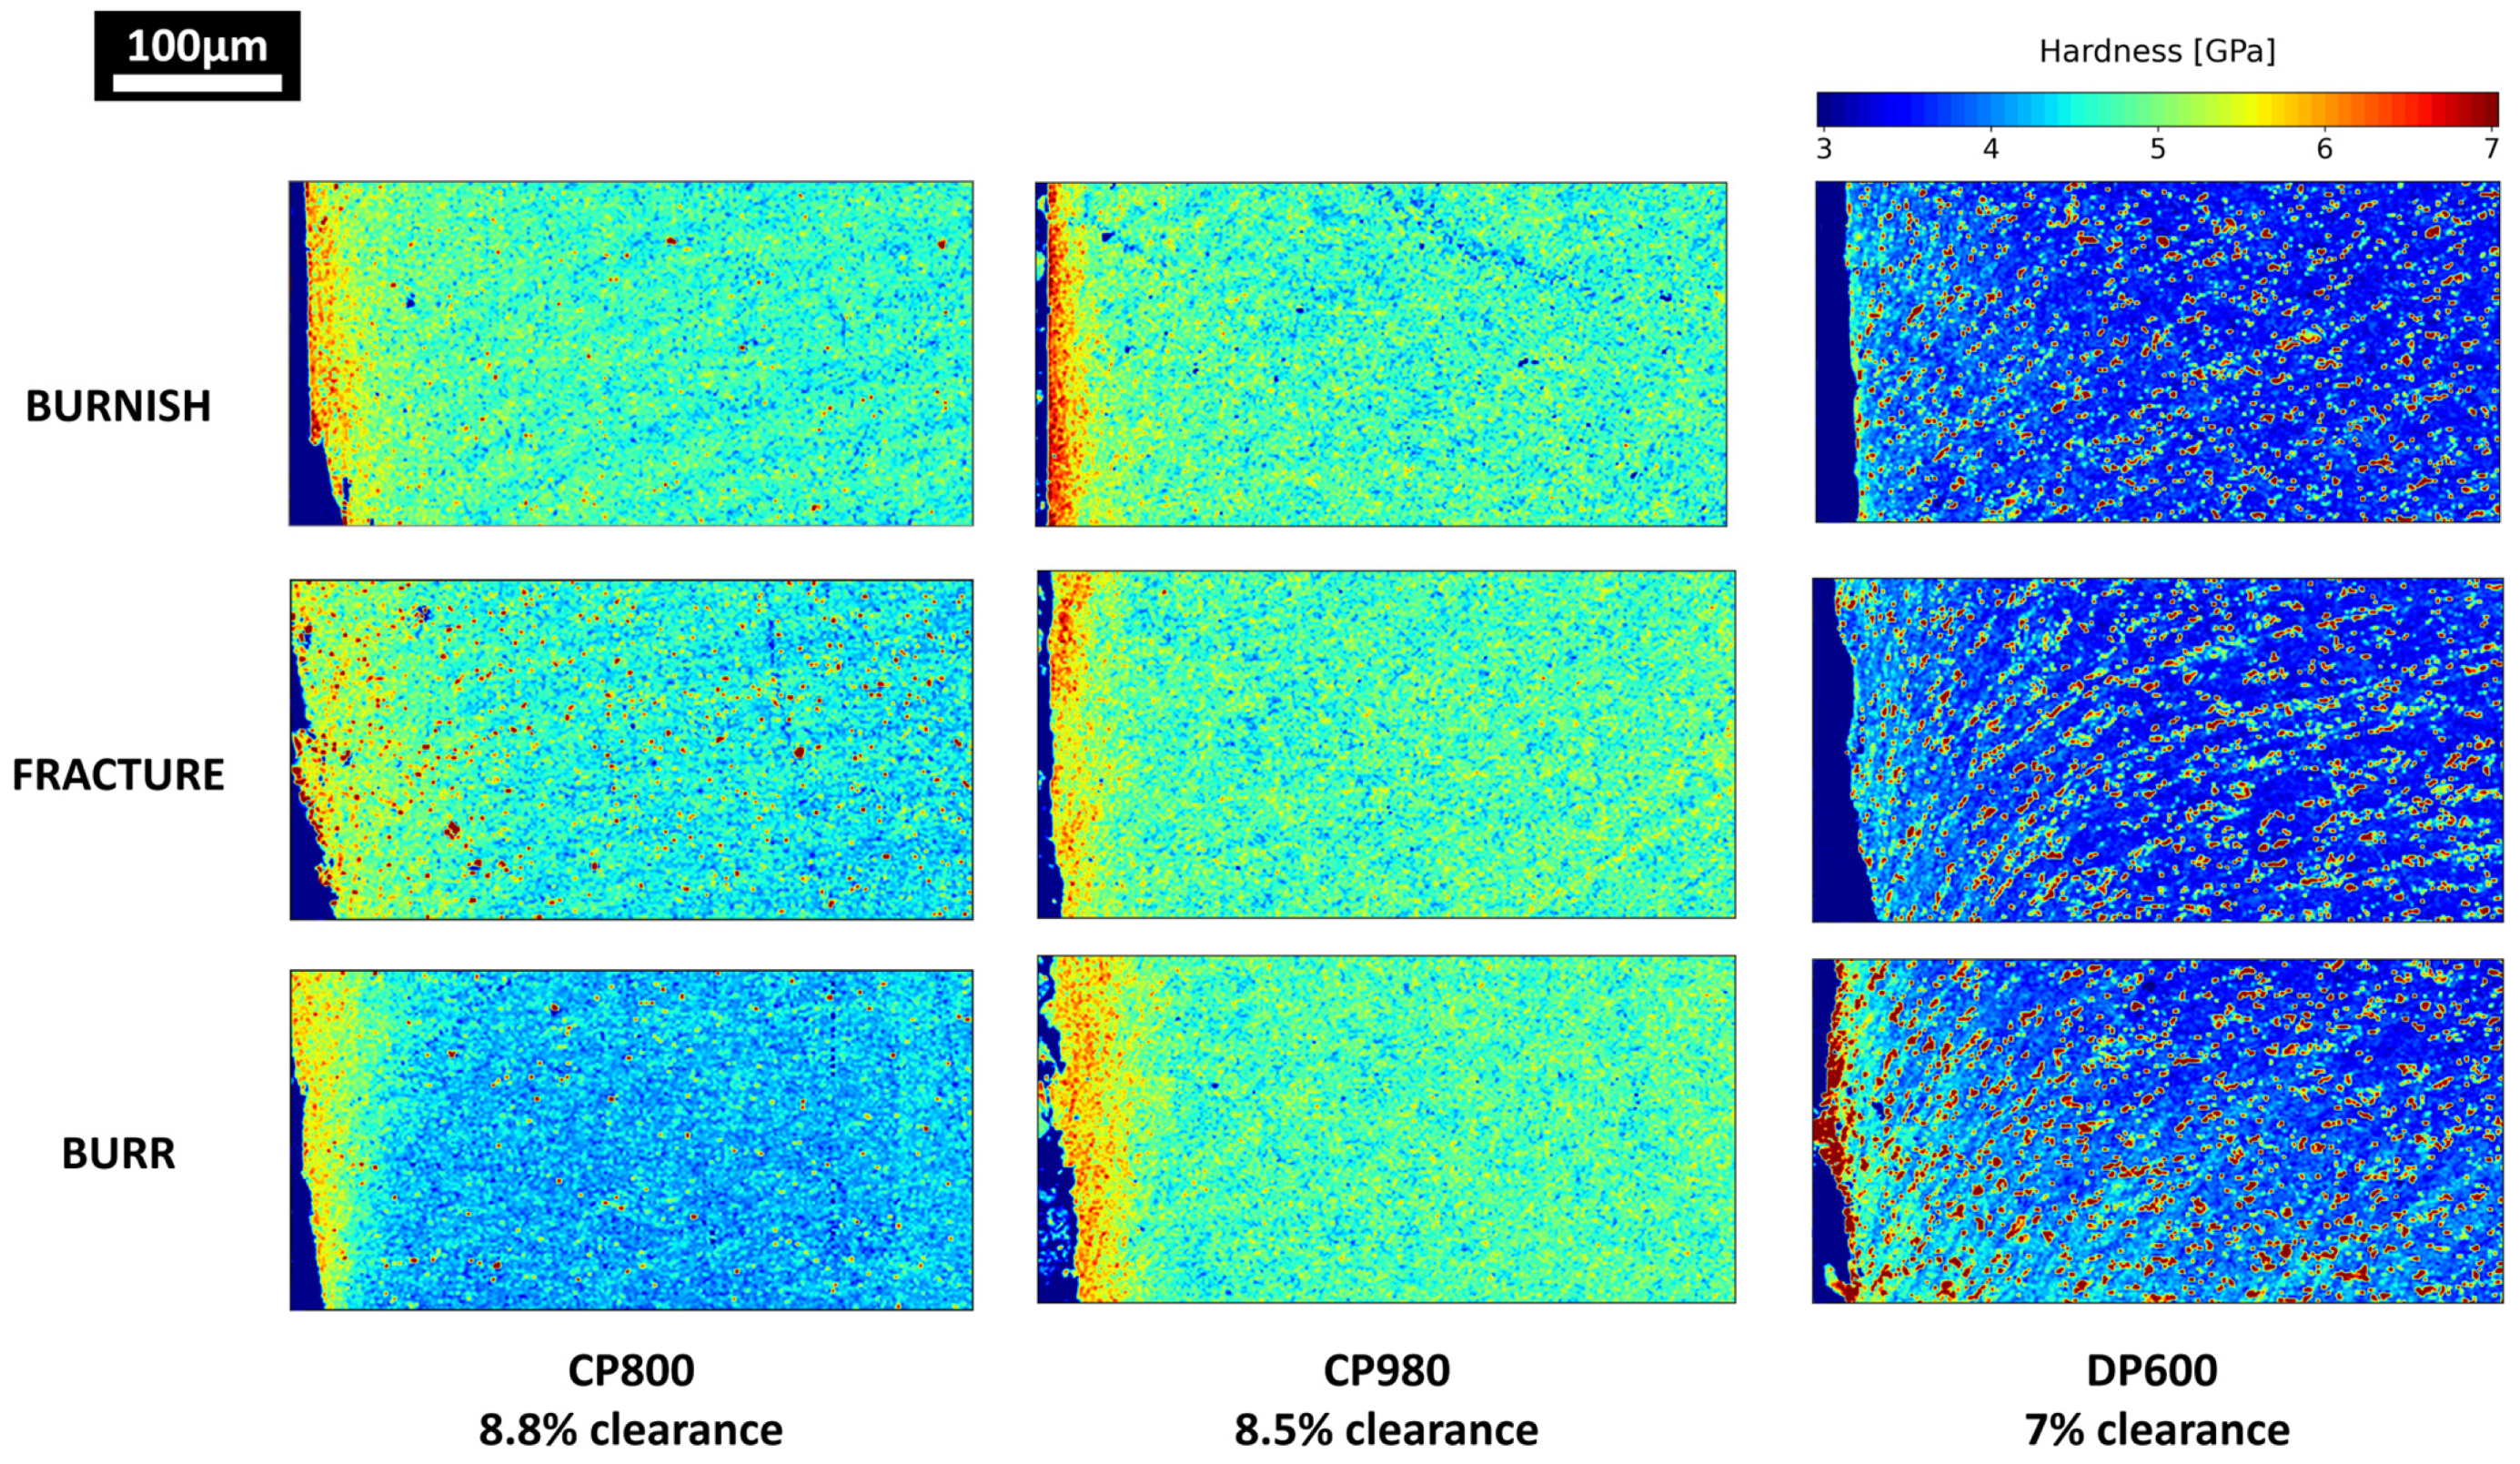
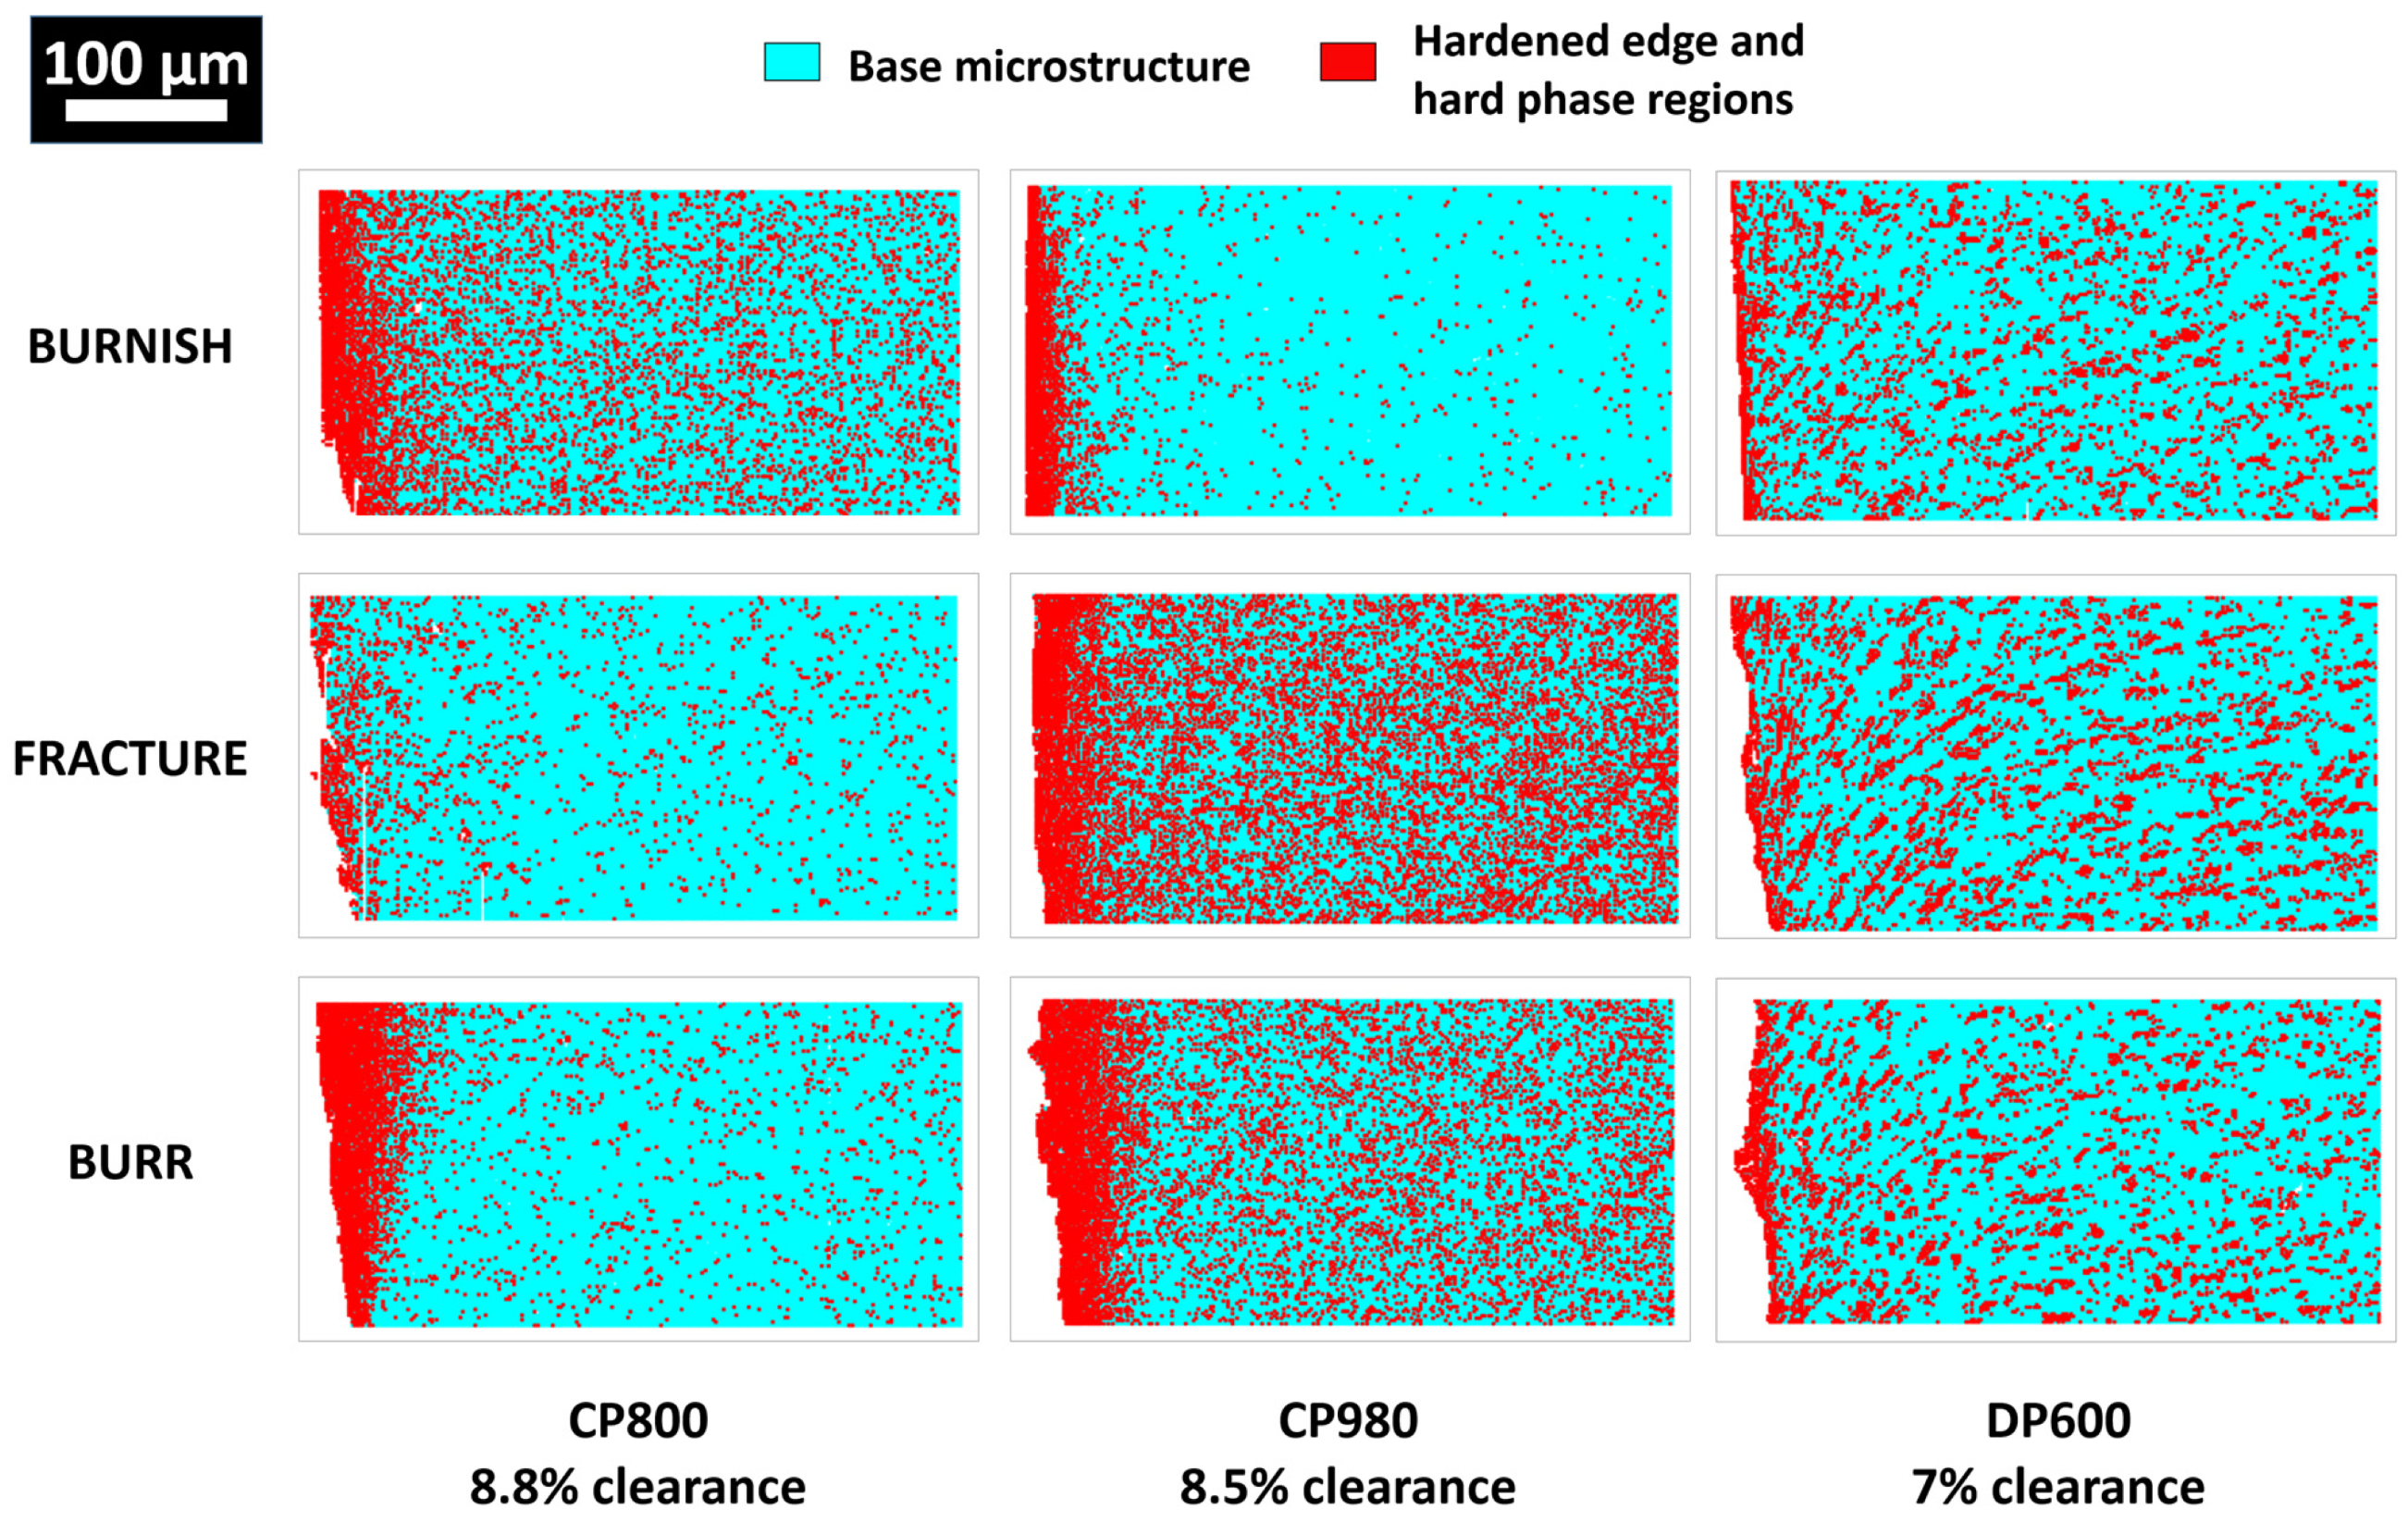
The results obtained with high-speed nanoindentation maps allowed for the visualization and quantification of the variation in hardness along the cut edge of the cross-section of the specimens under study. Hardness maps exhibit discernible changes (Figure 7), reflecting the effect of deformation hardening. An increase in the hardness is observed at the vicinity of the cut edge, indicating an accumulation of plastic deformation. However, the magnitude and pattern of hardening varies among specimens. In addition to localized hardening, strain lines are evident in the hardness maps, reflecting material flow during the cutting process. To support the interpretation of the hardness distribution, the nanoindentation data were classified using Gaussian Mixture Models (GMM), distinguishing two mechanical populations across the cut edge regions. The resulting maps are shown in Figure 8, where the base microstructure (cyan) and harder zones (red) are clearly separated. The mean hardness and standard deviation for each cluster and region are summarized in Table 4.
In the DP steel, distinct mechanical phases can be clearly identified in the interior regions, away from the cut edge. The ferritic matrix appears as continuous areas with lower hardness values around 3–4 GPa, while martensitic islands are distinguishable as discrete regions with higher hardness values, reaching up to ~7 GPa. This contrast aligns well with the expected dual phase microstructure. In the CP steels, individual phases are not as clearly resolved in the hardness maps due to their finer and more complex microstructures. Nevertheless, some heterogeneity in hardness is still observed, with the CP800 exhibiting a larger proportion of softer regions. This can be related to its microstructure, composed of a ferrite–bainite matrix with dispersed islands of martensite and retained austenite. In comparison, CP980 shows a more uniform hardness distribution with localized hard zones, consistent with its matrix of ferrite and tempered martensite, along with islands of upper bainite and retained austenite.
In DP600, the presence of clear deformation lines indicates that ferrite has absorbed the majority of the plastic deformation, while martensite has acted as a stiffer and more deformation-resistant phase. In contrast, in CP980, although noticeable hardening is evident at the shear edge, no visible deformation lines are present, as observed in CP800 or DP600. This observation indicates that the shear-induced plastic deformation has been more uniformly distributed within the microstructure, thereby preventing the formation of localized hardening bands.
The observed disparities in the manifestation of strain lines can be attributed to strain partitioning, which refers to the distribution of plastic deformation within the microstructure of the material. In the context of strain partitioning, one phase can exhibit a greater capacity to absorb strain compared with another, resulting in discernible discrepancies in the material’s mechanical response.
In DP600, strain partitioning is high because ferrite, the softer phase, deforms more, while martensite, the harder phase, contributes less to deformation. As a result, plastic deformation tends to concentrate in specific regions, as evidenced by the appearance of deformation lines visible on the hardness maps. These lines, however, do not signify the hardening of the ferrite; rather, they correspond to regions where martensite is present in the microstructure and is inherently harder than the surrounding ferrite. In the case of CP800, in addition to the presence of strain lines, a higher concentration of hardening is observed at the shear edge, indicating that the material has absorbed more strain in this zone before fracturing. In CP980, strain partitioning is lower, as its microstructure is dominated by hard phases such as martensite and bainite, which have a limited ability to deform plastically. Consequently, shear-induced deformation is not localized in visible bands; rather, it is more evenly redistributed in the microstructure without generating marked contrasts in hardness. Although significant hardening is also observed at the shear edge in CP980, the absence of strain lines suggests that plastic deformation has not been concentrated in specific zones. Rather, it has dissipated within the microstructure without generating obvious strain partitions between phases.

3.3. Effect of Sandblasting on Hardness Distribution at the Cut Edge

To understand the effect of sandblasting on local micromechanical properties, large high-speed nanoindentation maps were performed along the cut edge of the CP800 trimmed specimens, with and without sandblasting treatment. A larger nanoindentation map was specifically carried out covering the transition from the burnish to the fracture zone to better observe the effect of sandblasting in this region. The hardness maps along the edge profile are presented in Figure 9. To support the interpretation of the hardness distribution, the nanoindentation data were classified using Gaussian Mixture Models (GMM), distinguishing two mechanical populations across the cut edge regions. The resulting maps are shown in Figure 10, where the base microstructure (cyan) and harder zones (red) are clearly separated. The mean hardness and standard deviation for each cluster and region are summarized in Table 5.
The deformation lines can be discerned, with some differences in the hardness profiles. In the specimen without sandblasting, a hardened region of approximately 50 µm with a hardness of 5.8 ± 0.9 GPa is observed in the vicinity of the burnish and transition zones. In the fracture zone, the hardened region extends up to 100 µm, indicating a wider affected area. In contrast, in the burr zone, the extent of the hardened region is reduced, but the hardness gradient from the cut edge surface to the center of the specimen is more pronounced than in the other areas. Specifically, the hardness at the center of the burr zone drops to 4.3 ± 0.4 GPa, whereas in the other regions, the hardness at the center remains around 4.8 GPa. In the sample with sandblasting, the hardening gradient from the surface of the cut edge to the center of the sample is very similar to the one without sandblasting, but increased hardening is observed at the surface of the cut edge. Furthermore, a clear difference in surface roughness can be visually identified near the edge. In the untreated specimen, this edge appears significantly more irregular and jagged, indicating a rougher surface resulting from the trimming process. In contrast, the sandblasted specimen shows a much smoother and more uniform near the edge, showing that the sandblasting treatment effectively reduces surface roughness and edge damage. To sum up, sandblasting smoothens and rounds the edge surface and also induces additional hardening, with larger hardened zones and with higher hardness values.
It is well known that the sandblasting process induces superficial hardening, similar to but lower than the one produced by shot peening, and this results in an improvement in fatigue life [38,39]. The hardening observed along the edge of the specimen, measuring a few microns, can be attributed to the plastic deformation induced by the sandblasting process. This induced plastic deformation can lead to the development of compressive stresses, which have been shown to contribute to improve high-cycle fatigue performance.

3.4. Effect of Cutting Clearance on the Hardness Distribution at the Cut Edge

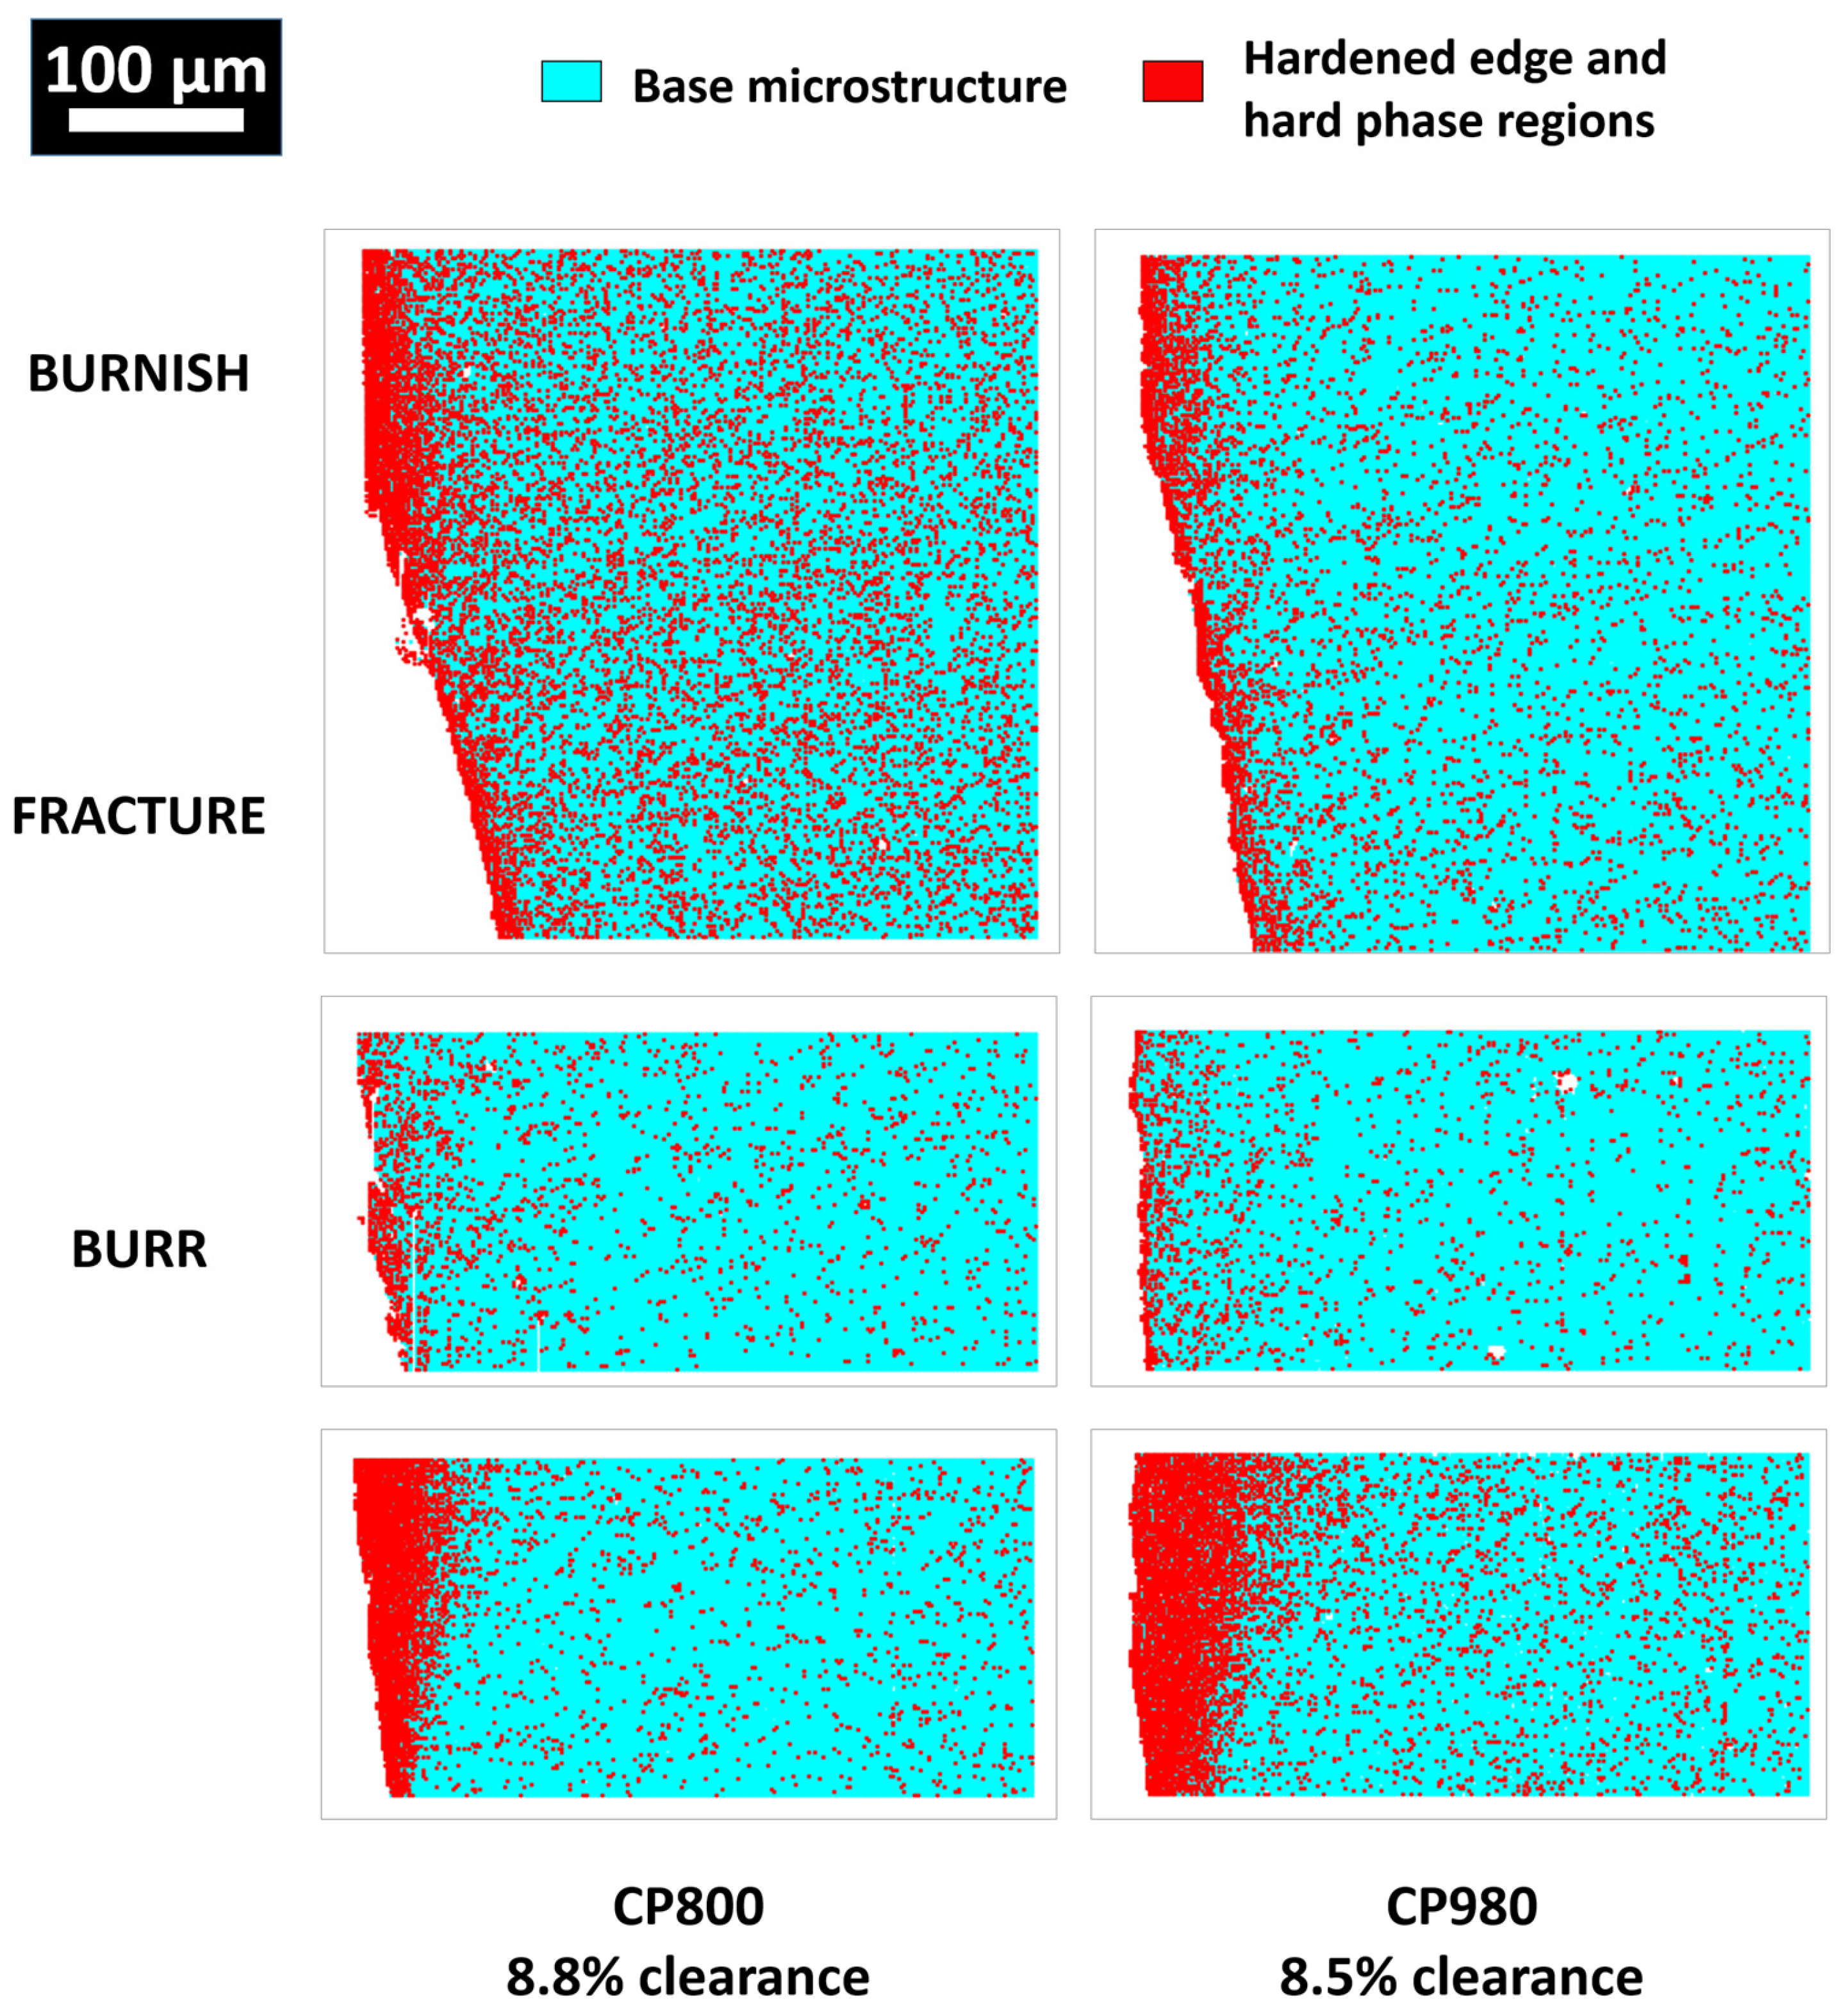
A critical factor in the context of shear cutting processes, particularly with regard to fatigue, is the cutting clearance [40]. Figure 11 presents the hardness for the CP980 specimen, with two different clearances. To support the interpretation of the hardness distribution, the nanoindentation data were classified using GMM, distinguishing two mechanical populations across the cut edge regions. The resulting maps are shown in Figure 12, where the base microstructure (cyan) and harder zones (red) are clearly separated. The mean hardness and standard deviation for each cluster and region are summarized in Table 6.
The effect of clearance on the distribution of hardening at the cutting edge of CP980 has been observed in both this study and previous research, in which the material was punched [41]. In both cases, it was found that a lower clearance generates a more extensive hardened zone and higher hardness at the edge, compared with a high clearance where the hardening is smaller. Quantitatively, the hardness spread observed in the specimen with 8.5% clearance ranges from 50 to 100 µm, while with 17% clearance, it reaches approximately 20 µm, indicating a reduction in the extent of the hardened zone when the clearance is higher. This behavior can be explained in terms of how plastic deformation accumulates before fracture. At 8.5% of clearance, the smaller space between the punch and the die induces greater shear deformation in the shear-affected zone, leading to a higher density of dislocations and, hence, greater hardening at the shear edge. In contrast, with high clearance, the deformation affects a larger area and is not as localized as with 8.5% of clearance, which limits the accumulation of dislocations and reduces localized hardening. A lower clearance favors a higher degree of shear before fracture and increases localized deformation, which explains the higher hardening observed. Conversely, high clearance facilitates more abrupt fractures, occurring without localized deformation.
It is well documented that the fatigue performance of sheared edges depends on the surface, the sheared edge’s roughness, and burr formation. Burr is the first area to trigger fatigue cracking, so large cutting clearances, larger than 15–25%, where burr formation appears, depending on the AHSS grade [14], shows the lowest fatigue life. The rough fracture area is responsible for fatigue cracking at intermediate clearances, and the transition between the burnish and the fracture accounts for fatigue crack initiation at low cutting clearances [40,42]. Lara et al. assessed the effect of clearance on DP100 and press-hardened thin steel sheets (about 2 mm) used for BiW applications [40]. Gustafsson et al. [32] conducted an analysis of the effect of clearance on fatigue resistance of a CP980 similar to the one studied here, determining that a clearance of 17% resulted in earlier failures than 8.5%. They observed a rougher transition between the burnish and fracture zones, which generates a higher stress concentration and a reduction in the effective cross-section. Furthermore, secondary microcracks were observed in specimens with high clearance, suggesting a negative impact on crack initiation and fatigue life. As shown in Figure 13 for the HR DP600, fatigue crack initiation in the trimmed specimens occurs at the burr. In this zone, the increased hardness induced by the shearing process promotes crack initiation. Additionally, the sharpness of the burr acts as a stress concentrator, further encouraging early crack initiation in a hardened and more sensitive region.
The obtained results here show that the enhanced fatigue strength in the lower clearance is also associated with the elevated hardening observed at the shear edge. The hardening within the surface zone could contribute to a more equitable distribution of stresses and retardation of crack nucleation, thereby functioning as a mechanical barrier against the propagation of pre-existing defects. However, the predominant factor is more likely to be the reduction in damage at the cutting edge. With a high clearance, the larger fracture generates more surface defects and a greater number of microcracks, which act as preferential sites of crack nucleation. In this sense, the use of a smaller clearance not only generates a larger hardened zone but also minimizes the presence of structural damage, which accounts for the better fatigue performance observed in these cases.

3.5. Effect of Cutting Clearance on the Residual Stresses of CP980 Trimmed Specimens

In Figure 14 and Table 7, the obtained local σ x stresses at the four zones (burnish, transition, fracture, and burr) for CP980 with 8.5% and 17.14% of clearance are presented. Different tendencies of the measured stresses along the cut edge are observed. For both conditions, the burnish zone, where the material deforms very plastically and shear is experienced, exhibits compressive residual stresses. This explains why fatigue origins are hardly found in the burnish zone.
Correlating with the nanoindentation maps of all conditions and materials, the burnish zone is characterized by more concentrated hardening on the surface. In the burr zone, where deformation tends to accumulate and material separation occurs, resulting in abrupt fracture, tensile stresses are observed. This is a clear explanation why the burr is the predominant site for fatigue nucleation.
In the transition and fracture zones, differences between low and high clearance are evident. At 8.5% of clearance, high tensile stresses are observed in both zones. During the trimming process, in the fracture and transition zones, the material accumulates a significant amount of compressive stresses due to the fracture process, and it is also subjected to considerable shear. Conversely, at a higher clearance of 17%, the stresses experienced during transition and fracture are reduced, with an average that approaches zero. This phenomenon may be attributed to the reduced shear stress and enhanced material relaxation during shearing. The results correlate well with the hardness maps in Figure 11 and Figure 12, which illustrate that the hardened band is larger for the specimen with 8.5% of clearance. These results explain the shift of the fatigue nucleation site from the transition zone to the fracture zones when clearance increases, as observed in the work of Lara et al. [40].
The local residual stress results are consistent with previous studies on punched CP980 specimens [41], where residual stresses in the cut edge (see Figure 2) were evaluated for 8.5% and 24.1% clearance. In that study, at 8.5% clearance, residual stresses in the lower part of the transition zone were tensile, in line with the positive σ x values observed at transition and fracture in this study. In contrast, at 24.1% clearance, residual stresses were highly compressive, which is also in agreement with the trend observed here at 17.14% clearance, where σ x remains compressive in the transition zone. These outcomes were further validated through simulations, which corroborated the experimental observations. Specifically, the simulations revealed that at 8.5% of clearance, the stresses in the x-direction were predominantly traction-like, while at 24.1% of clearance, compressive stresses prevailed.
Another study by Gustafsson et al. (2025) [38] investigates the residual stresses induced by punching processes through numerical simulations, specifically highlighting compressive residual stresses in the burnish zones and tensile residual stresses predominantly in the fracture zone. This distribution aligns closely with the results observed in this work, where compressive residual stresses are similarly identified within the burnish region, and tensile residual stresses appear distinctly within the fracture zone.
Gustafsson et al. (2024) [32] developed a modeling method to assess the fatigue resistance of mechanically sheared steel sheets by accounting for the surface roughness and residual stresses induced by the shearing process. One of the materials analyzed was the CP980 tested here, using the same cutting clearances. The predicted results of this modeling approach are similar to those obtained with the ring–core method. However, the stress distribution shown in Figure 10 differs slightly from that predicted by the simulation, particularly for the largest clearance of 17%. In the simulation, high tensile residual stresses are mainly located in the middle of the fracture surface, whereas the measured maximum tensile residual stresses occur near the burr under this condition. Nonetheless, it was demonstrated that for steels with high yield strength, fatigue resistance is strongly influenced by residual stress and is only marginally affected by surface roughness. Moreover, the difference in residual stresses between punching and trimming is only about 5%.
The ring–core method is based on the assumption of a homogeneous distribution of residual stresses within the analyzed region. However, in this case, the measured strain in the x and y directions were different, thereby introducing an error source in the quantification of the obtained stress values. Capturing more images during milling improves the accuracy of stress relaxation. However, equipment limitations reduced the image count in this study, adding uncertainty to the calculations. Despite these limitations, the results obtained allow us to identify clear trends in the residual stress distribution as a function of clearance and the cutting edge zone, providing information on the effect of the cutting process on the material.

3.6. Integrated Interpretation of the Results

The combination of high-speed nanoindentation and local residual stress analysis provided a comprehensive overview of how different AHSS grades respond to shear cutting. By comparing the results, it becomes clear that the material’s microstructure, cutting parameters, and surface treatments all play a key role in shaping the mechanical and stress profiles at the cut edge.
A discernible microstructure-dependent tendency is evident when the three steels are compared. The DP600 and CP800 models exhibited visible strain lines and localized hardening, indicating heterogeneous strain partitioning, particularly between ferrite and martensite. In contrast, CP980 exhibits more uniform hardening near the shear edge and the absence of visible deformation bands, suggesting a more homogeneous distribution of plastic strain. This discrepancy is indicative of the diminished strain partitioning capacity of CP980′s microstructure, which is predominantly composed of hard phases. The presence of these hard phases imposes limitations on local deformation and promotes a more refined mechanical response. The hardening distribution in CP980 is more homogeneous than that of CP800 due to a higher content of hard phases. Moreover, DP600 shows a lot of deformation and no remarkable hardening because of its high ductility and the large amount of a soft phase as ferrite in the microstructure. The hardness mapping also shows highly visible hardening lines, allowing us to clear discern the material flow due to deformation and fracture during the punching process.
Considering the effect of sandblasting, the hardness map obtained by high-speed nanoindentation on the CP800 specimens shows that it generates an additional thin layer of surface hardening, in addition to the hardening induced by the cutting process. This surface hardening, together with the smoother profile produced by the sandblasting, could improve the fatigue life.
The role of cutting clearance in the context of mechanical and residual stress behavior is of crucial significance. Lower clearances have been shown to promote greater strain localization, resulting in more extensive and intense hardening at the edge. This phenomenon is accompanied by shifts in the residual stress field, where compressive stresses consistently manifest in the burnish zone, while tensile stresses become more pronounced and concentrated in the transition and fracture zones, particularly under low-clearance conditions. At higher clearances, stress gradients become more uniform, and tensile peaks shift closer to the burr. This suggests that there is less localized deformation and a more relaxed stress state.
Overall, the cutting conditions that have been associated with improved fatigue performance in the literature, such as reduced clearance and the use of post-processing treatments, consistently show a more localized and intense hardening near the cut edge. In this study, such conditions also exhibit favorable residual stress distributions, with compressive stresses in the burnish zone and reduced tensile stresses in critical regions like the transition and fracture zones. These observations suggest a strong correlations among induced hardening, residual stress states, and the fatigue behavior of AHSS components, reinforcing the relevance of combined high-speed nanoindentation and FIB-DIC analysis for understanding and optimizing cutting processes.

4. Conclusions

The hardness distribution at the cut edge of three different AHSS steels (CP800, CP980 and DP600) was analyzed by high-speed nanoindentation. Additionally, FIB-DIC was applied to CP980 specimens to estimate local residual stresses under different cutting clearances. The following findings summarize the main effects of microstructure, cutting clearance, and surface treatment on the local mechanical behavior.
  • Hardness increases significantly near the shear edge due to cutting-induced plastic deformation. In DP600, lower hardening and more visible deformation lines were observed, while CP800 and CP980 showed higher hardening with less apparent plastic flow.
  • In CP800, sandblasting induces a thin additional hardened layer at the cut edge surface, superimposed on the cutting-induced hardening. While the hardness gradient across the edge remains similar to that of the untreated specimen, the surface hardness increases. The smoother profile and surface strengthening could contribute to improved fatigue resistance.
  • In CP980, a clearance of 8.5% produces a broader and more localized hardened zone, with hardness extending up to 100 µm from the edge. This is attributed to increased shear deformation and dislocation accumulation prior to fracture. In contrast, a 17% clearance leads to a narrower hardened zone (∼20 µm), as the material fractures more abruptly with less localized plastic deformation.
  • FIB-DIC analysis of CP980 reveals that the residual stress distribution across the cut edge is strongly influenced by the cutting clearance. At 8.5%, high tensile stresses are observed in the transition and fracture zones, while compressive stresses dominate in the burnish zone. At 17% clearance, tensile stresses shift towards the burr, and the transition zone shows reduced or compressive values, indicating stress relaxation. These trends correlate with the observed hardening patterns and help explain the shift in fatigue nucleation sites reported in the literature.
  • The use of low cutting clearance improves both the extent of strain hardening and the distribution of residual stresses, reducing tensile residual stresses at the burr, which is the most critical region for fatigue initiation. Sandblasting can be used as a complementary surface treatment.

Author Contributions

Conceptualization, L.O.-M., S.P., D.C., E.J.-P. and A.M.; Methodology, L.O.-M. and S.P.; Validation, L.O.-M. and A.M.; Formal analysis, L.O.-M.; Investigation, L.O.-M. and S.P.; Resources, L.O.-M., S.P. and D.C.; Data curation, L.O.-M.; Writing—original draft, L.O.-M. and S.P.; Writing—review and editing, L.O.-M., S.P., D.C., E.J.-P. and A.M.; Visualization, L.O.-M., S.P. and E.J.-P.; Supervision, D.C., E.J.-P. and A.M.; Funding acquisition, D.C., E.J.-P. and A.M. All authors have read and agreed to the published version of the manuscript.

Funding

The authors would like to thank the European Union for providing the funding of the Fatigue4Light project (Horizon 2020, LC-GV-06-2020 project No. 101006844) in which this study was conducted. Part of the work was also funded by Grant PID2021-126614OB-I00 by Spanish funded by MCIN/AEI/10.13039/501100011033 and by the “European Union NextGenerationEU/PRTR”. The first author gratefully acknowledges the Universitat Politècnica de Catalunya and Banco Santander for the financial support of her pre-doctoral grant FPI-UPC. CIEFMA acknowledges the Agency for Administration of University and Research (Agència de Gestió d’Ajuts Universitaris i de Recerca, AGAUR) (2021 SGR 01053) and Maria de Maeztu Units of Excellence Programme CEX2023-001300-M/funded by MCIN/AEI/10.13039/501100011033.

Data Availability Statement

The raw data supporting the conclusions of this article will be made available by the authors on request.

Conflicts of Interest

The authors declare that they have no known competing financial interests or personal relationships that could have appeared to influence the work reported in this paper.

References

  1. Bull, M. Mass reduction and performance of PEV and PHEV vehicles. In Proceedings of the 22nd International Technical Conference on the Enhanced Safety of Vehicles (ESV), Washington, DC, USA, 13–16 June 2011. [Google Scholar]
  2. Klose, F.B.; Kwiaton, N.; Lesch, C. Advanced High Strength Steels (AHSS) for Automotive Applications—Tailored Properties by Smart Microstructural Adjustments. Steel Res. Int. 2017, 88, 1700210. [Google Scholar] [CrossRef]
  3. Hilditch, T.B.; De Souza, T.; Hodgson, P.D. Properties and automotive applications of advanced high-strength steels (AHSS). In Welding and Joining of Advanced High Strength Steels (AHSS); Elsevier Ltd.: Amsterdam, The Netherlands, 2015. [Google Scholar]
  4. Yokota, H.; Matsuno, T.; Goto, K.; Watanabe, I.; Ando, R.; Yamashita, N. Analysis of preliminary local hardening close to the ferrite–martensite interface in dual-phase steel by a combination of finite element simulation and nanoindentation test. Int. J. Mech. Sci. 2020, 180, 105663. [Google Scholar] [CrossRef]
  5. Zheng, C.; Tsuzaki, K.; Raabe, D.; Ponge, D.; Peranio, N.; Bechtold, M.; Tasan, C.; Schemmann, L.; Roters, F.; Yan, D.; et al. An Overview of Dual-Phase Steels: Advances in Microstructure-Oriented Processing and Micromechanically Guided Design. Annu. Rev. Mater. Res. 2015, 45, 391–431. [Google Scholar] [CrossRef]
  6. Frómeta, D.; Tedesco, M.; Calvo, J.; Lara, A.; Molas, S.; Casellas, D. Assessing edge cracking resistance in AHSS automotive parts by the Essential Work of Fracture methodology. J. Phys. Conf. Ser. 2017, 896, 012102. [Google Scholar] [CrossRef]
  7. Hedström, P.; Borgenstam, A.; Larsson, J.; Sieurin, H.; Heshmati, N. Correlation between microstructure and fatigue properties of hot-rolled thick-plate complex-phase steel. Mater. Sci. Eng. A 2023, 885, 145624. [Google Scholar] [CrossRef]
  8. Yang, X.; Sun, H.; Wu, Y.; Wei, K.; Xiao, Z. Effects of pre-strain and annealing on the fatigue properties of complex phase steel CP800. Int. J. Fatigue 2020, 131, 105364. [Google Scholar] [CrossRef]
  9. Bleck, W.; Ramazani, A.; Li, X.; Prahl, U. Quantification of complex-phase steel microstructure by using combined EBSD and EPMA measurements. Mater. Charact. 2018, 142, 179–186. [Google Scholar] [CrossRef]
  10. Richter, S.; Bleck, W.; Lin, M.; Hangen, U.; Chang, Y.; Haase, C. Revealing the relation between microstructural heterogeneities and local mechanical properties of complex-phase steel by correlative electron microscopy and nanoindentation characterization. Mater. Des. 2021, 203, 109620. [Google Scholar] [CrossRef]
  11. Bardelcik, A.; Butler, Q. Strain partitioning characterization of advanced high strength steels using in-situ tensile tests with Micro digital image correlation—Methodology and analysis. Mater. Charact. 2024, 218, 114451. [Google Scholar] [CrossRef]
  12. Shih, H.-C.; Chiriac, C.; Shi, M.F. The effects of AHSS shear edge conditions on edge fracture. In Proceedings of the ASME 2010 International Manufacturing Science and Engineering Conference, Erie, PA, USA, 12–15 October 2010; Volume 1, pp. 599–608. [Google Scholar] [CrossRef]
  13. Thomas, D.J. Characterization of steel cut-edge properties for improved life predictions for preventing automotive structural failure. In Handbook of Materials Failure Analysis with Case Studies from the Aerospace and Automotive Industries; Elsevier Ltd.: Amsterdam, The Netherlands, 2016; pp. 341–363. [Google Scholar]
  14. Pathak, N.; Butcher, C.; Worswick, M.J.; Bellhouse, E.; Gao, J. Damage Evolution in complex-phase and dual-phase steels during edge stretching. Materials 2017, 10, 346. [Google Scholar] [CrossRef]
  15. Heibel, S.; Dettinger, T.; Nester, W.; Clausmeyer, T.; Tekkaya, A.E. Damage mechanisms and mechanical properties of high-strength multiphase steels. Materials 2018, 11, 761. [Google Scholar] [CrossRef] [PubMed]
  16. Abe, Y.; Yonekawa, R.; Sedoguchi, K.; Mori, K.-I. Shearing of ultra-high strength steel sheets with step punch. Procedia Manuf. 2018, 15, 597–604. [Google Scholar] [CrossRef]
  17. Qiao, L.; Yu, H.; Zhang, C.; Yan, Y. Novel bake hardening mechanism for bainite-strengthened complex phase steel. J. Mater. Sci. Technol. 2023, 143, 117–128. [Google Scholar] [CrossRef]
  18. Fafard, M.; Rachik, M.; Ben Ismail, A.; Hug, E.; Mazeran, P.-E. Material characterization of blanked parts in the vicinity of the cut edge using nanoindentation technique and inverse analysis. Int. J. Mech. Sci. 2009, 51, 899–906. [Google Scholar]
  19. Wo, P.C.; Ruimi, A.; Zhang, F.; Field, D.P. Morphology and distribution of martensite in dual phase (DP980) steel and its relation to the multiscale mechanical behavior. Mater. Sci. Eng. A 2016, 659, 93–103. [Google Scholar] [CrossRef]
  20. Yokoi, T.; Zhang, K.; Hamada, S.; Zhang, J.; Noguchi, H.; Koyama, M. Effect of shear-affected zone on fatigue crack propagation mode. Int. J. Fatigue 2018, 116, 36–47. [Google Scholar] [CrossRef]
  21. Hoffmann, H.; Dittmann, F.; Feistle, M.; Golle, R.; Paetzold, I.; Haefele, P.; Volk, W. Influence of shear cutting parameters on the fatigue behavior of a dual-phase steel. J. Phys. Conf. Ser. 2017, 896, 012107. [Google Scholar] [CrossRef]
  22. Zhou, J.; Xu, D.; Ahadi, A.; Agmell, M.; Stahl, J.-E.; Liu, Y. Investigation on residual stress evolution in nickel-based alloy affected by multiple cutting operations. J. Manuf. Process. 2021, 68, 818–833. [Google Scholar] [CrossRef]
  23. Tamai, Y.; Urabe, T.; Shiozaki, T. Effect of residual stresses on fatigue strength of high strength steel sheets with punched holes. Int. J. Fatigue 2015, 80, 324–331. [Google Scholar] [CrossRef]
  24. Casellas, D.; Sandin, O.; Hammarberg, S.; Frómeta, D.; Parareda, S.; Jonsén, P. Prediction of sheared edge characteristics of advanced high strength steel. IOP Conf. Ser. Mater. Sci. Eng. 2022, 1238, 012034. [Google Scholar] [CrossRef]
  25. Kan, Y.; Pisarev, V.S.; Somov, P.A.; Eleonsky, S.I.; Ozherelkov, D.Y.; Statnik, E.S.; Salimon, A.I. FIB-DIC Residual Stress Evaluation in Shot Peened VT6 Alloy Validated by X-ray Diffraction and Laser Speckle Interferometry. Nanomaterials 2022, 12, 1235. [Google Scholar] [CrossRef]
  26. Bemporad, E.; Massimi, F.; Sebastiani, M.; Merlati, G. Residual micro-stress distributions in heat-pressed ceramic on zirconia and porcelain-fused to metal systems: Analysis by FIB–DIC ring-core method and correlation with fracture toughness. Dent. Mater. 2015, 31, 1396–1405. [Google Scholar] [CrossRef]
  27. Sui, T.; Nowell, D.; Korsunsky, A.; Salvati, E.; O’Connor, S. A study of overload effect on fatigue crack propagation using EBSD, FIB–DIC and FEM methods. Eng. Fract. Mech. 2016, 167, 210–223. [Google Scholar] [CrossRef]
  28. Sebastiani, M.; Wheeler, J.M.; Rossi, E. High-speed nanoindentation mapping: A review of recent advances and applications. Curr. Opin. Solid State Mater. Sci. 2023, 27, 101107. [Google Scholar] [CrossRef]
  29. Stauffer, D.D.; Maloy, S.A.; Lienert, T.J.; Chen, Y.; Hintsala, E.D.; Eftink, B.P.; Sau, M.; Mara, N.A. High-Throughput Nanoindentation Mapping of Additively Manufactured T91 Steel. JOM 2022, 74, 1469–1476. [Google Scholar] [CrossRef]
  30. Roa, J.; Llanes, L.; Wheeler, J.; Jiménez-Piqué, E.; Rodriguez-Suarez, T.; Gordon, S.; Besharatloo, H. Micromechanical mapping of polycrystalline cubic boron nitride composites by means of high-speed nanoindentation: Assessment of microstructural assemblage effects. J. Eur. Ceram. Soc. 2023, 43, 2968–2975. [Google Scholar] [CrossRef]
  31. Besharatloo, H.; Wheeler, J.M. Influence of indentation size and spacing on statistical phase analysis via high-speed nanoindentation mapping of metal alloys. J. Mater. Res. 2021, 36, 2198–2212. [Google Scholar] [CrossRef]
  32. Munier, R.; Olsson, E.; Parareda, S.; Gustafsson, D. High cycle fatigue life estimation of punched and trimmed specimens considering residual stresses and surface roughness. Int. J. Fatigue 2024, 186, 108384. [Google Scholar] [CrossRef]
  33. Benítez, R.; Jiménez-Piqué, E.; Mateo, A.; Biserova-Tahchieva, A.; Llorca-Isern, N.; Ortiz-Membrado, L.; Rius-Ayra, O. Surface modification of superduplex stainless steel with C and N: Microstructural and nanomechanical insights. Surf. Coat. Technol. 2024, 494, 131441. [Google Scholar] [CrossRef]
  34. Fraley, C.; Raftery, A.E. How many clusters? Which clustering method? Answers via model-based cluster analysis. Comput. J. 1998, 41, 586–588. [Google Scholar] [CrossRef]
  35. Lord, J.; Cox, D.; Ratzke, A.; Sebastiani, M.; Korsunsky, A.; Salvati, E.; Mughal, M.Z.; Bemporad, E. A Good Practice Guide for Measuring Residual Stresses using FIB-DIC. In Good Practice Guide; The National Physical Laboratory: London, UK, 2018; Volume 143. [Google Scholar]
  36. Pharr, G.M.; Eberl, C.; Sebastiani, M.; Bemporad, E. Depth-resolved residual stress analysis of thin coatings by a new FIB–DIC method. Mater. Sci. Eng. A 2011, 528, 7901–7908. [Google Scholar] [CrossRef]
  37. Salvati, E.; Romano-Brandt, L.; Mughal, M.Z.; Sebastiani, M.; Korsunsky, A.M. Generalised residual stress depth profiling at the nanoscale using focused ion beam milling. J. Mech. Phys. Solids 2019, 125, 488–501. [Google Scholar] [CrossRef]
  38. Olsson, E.; Parareda, S.; Gustafsson, D.; Sieurin, H. Estimating the effect of punching on out-of-plane bending fatigue of steel sheet specimens. Eng. Fail. Anal. 2025, 173, 109415. [Google Scholar] [CrossRef]
  39. Casellas, D.; Sieurin, H.; Parareda, S.; D’armas, H.; Lara, A. Increasing fatigue performance in AHSS thick sheet by surface treatments. MATEC Web Conf. 2018, 165, 22015. [Google Scholar] [CrossRef]
  40. Picas, I.; Lara, A.; Casellas, D. Effect of the cutting process on the fatigue behaviour of press hardened and high strength dual phase steels. J. Mater. Process. Technol. 2013, 213, 1908–1919. [Google Scholar] [CrossRef]
  41. Jiménez-Piqué, E.; Mateo, A.; Olsson, E.; Parareda, S.; Ortiz-Membrado, L.; Gustafsson, D. Simulation of metal punching and trimming using minimal experimental characterization. J. Mech. Work. Technol. 2023, 321, 118148. [Google Scholar] [CrossRef]
  42. Whittaker, M.T.; Bright, G.W.; Gao, Y.; Thomas, D.J. The influence of mechanical and CO2 laser cut-edge characteristics on the fatigue life performance of high strength automotive steels. J. Mech. Work. Technol. 2011, 211, 263–274. [Google Scholar] [CrossRef]
Figure 1. Microstructure of (a) HR CP800 SF, (b) HR CP980 SF, and (c) HR DP600.
Metals 15 00651 g001
Figure 2. Schematic representation of the cutting process and trimmed specimen regions. (a) Illustration of the punching process used to create the trimmed specimens, highlighting the cutting clearance. (b) Schema of the trimmed specimen and the cross-sectional regions of interest at the cut edge: burnish, transition, fracture, and burr zones.
Metals 15 00651 g002
Figure 3. Schematic representation of the cut edge cross-section, highlighting the surface plane where high-speed nanoindentation (HSN) maps were performed. The circles indicate measurement locations for residual stress analysis, with arrows showing the considered stress directions.
Metals 15 00651 g003
Figure 4. Images of the FIB-DIC analysis of the fracture zone of CP980 8.5% cl. Ring–core milling Steps 0, 1, and 5, with a heatmap showing the measured strain distribution in the center of the milled geometry.
Metals 15 00651 g004
Figure 5. Measured relief in the x direction as a function of the height/diameter ratio for CP980 8.5% cl. In (a) burnish zone, which presents increasing relief strain, which corresponds to the presence of compressive residual stress and in (b) transition zone, which presents decreasing relief strain, which corresponds to the presence of tensile residual stress. Residual stresses are calculated with Equation (1), after fitting the Mastercurve and obtaining Δ ε x and Δ ε y .
Metals 15 00651 g005
Figure 6. Schematic image of the shear-affected zone and optical microscopy images of the cut edge for the specimens of study. Grey shadows showing the areas where nanoindentation maps were performed. Black shows the embedded resin (Bakelite).
Metals 15 00651 g006
Figure 7. Comparison of HSN hardness maps for CP800 (8.8% clearance), CP980 (8.5% clearance), and DP600 (7% clearance). The hardness distribution across different cut edge regions (burnish, transition, fracture, and burr) is shown, highlighting the differences in plastic deformation and material response to cutting.
Metals 15 00651 g007
Figure 8. GMM clustering of nanoindentation data for CP800 (8.8% clearance), CP980 (8.5% clearance), and DP600 (7% clearance), shown for three cut edge regions: burnish, fracture, and burr. Two clusters were identified: the base microstructure (cyan) and the hardened edge and hard phase regions (red), corresponding to areas affected by plastic deformation as well as intrinsically harder phases. This classification provides a complementary perspective to the hardness maps shown in Figure 7, enabling a clearer distinction of mechanical variations across the cut edge. Statistical values for each cluster are provided in Table 4.
Metals 15 00651 g008
Figure 9. Comparison of HSN hardness maps for CP800 (8.8% clearance) in untreated (left) and sandblasted (right) conditions. The untreated CP800 map is replicated from Figure 6 for direct comparison. The hardness distribution highlights the effect of sandblasting on the cut edge region.
Metals 15 00651 g009
Figure 10. GMM clustering of nanoindentation data for sandblasted and untreated CP800, shown for three cut edge regions: burnish, fracture, and burr. Two clusters were identified: the base microstructure (cyan) and the hardened edge and hard phase regions (red). This clustering complements the hardness maps shown in Figure 9, enabling a clearer distinction of mechanical variations across the cut edge. Statistical values for each cluster are provided in Table 5.
Metals 15 00651 g010
Figure 11. Hardness maps of the cut edge region in a CP980 steel specimen at two different cutting clearances (8.5% and 17%), showing the mechanical property variations across the cut edge.
Metals 15 00651 g011
Figure 12. GMM clustering of nanoindentation data for the CP980 steel specimen at two different cutting clearances (8.5% and 17%), for three cut edge regions: burnish, fracture, and burr. Two clusters were identified: the base microstructure (cyan) and the hardened edge and hard phase regions (red). This clustering complements the hardness maps shown in Figure 11, enabling a clearer distinction of mechanical variations across the cut edge. Statistical values for each cluster are provided in Table 6.
Metals 15 00651 g012
Figure 13. Fatigue crack initiation in the fracture area of HR DP600 specimens, occurring at the burr.
Metals 15 00651 g013
Figure 14. Evolution of residual σ x stress results for CP980 with 8.5% and 17.14% of clearance across the 4 zones of the cut edge, namely burnish, transition, fracture, and burr, obtained by FIB-DIC.
Metals 15 00651 g014
Table 1. Mechanical properties in terms of yield strength (σYS), ultimate tensile strength (σUTS), elongation at fracture (A80; gauge length, 80 mm), and microstructure.
MaterialσYS [MPa]σUTS [MPa]A80 [%]Microstructure
HR CP800 SF77883517F/B matrix—M/A islands
HR CP980 SF957103413F/TM matrix—UB/A islands
HR DP60043962221F matrix—M islands
F, ferrite; B, bainite; TM, tempered martensite; UB, upper bainite; M, martensite.
Table 2. Chemical composition of the studied materials (wt.%).
MaterialFeCSiMnPSAlCuBTi + NbCr + Mo
HR CP800 SFBal.≤0.18≤1.0≤2.2≤0.05≤0.01≤1.2≤0.2≤0.01≤0.25≤1.0
HR CP980 SFBal.≤0.20≤1.0≤2.2≤0.05≤0.01≤1.2≤0.2≤0.01≤0.25≤1.0
HR DP600Bal.≤0.10≤0.3≤1.5≤0.08≤0.01≤0.06---≤0.9
Table 3. Material configurations and post-cutting treatments. The table summarizes the sheets’ thickness, trimming clearance, and surface treatment conditions (untreated or sandblasted) for the investigated CP800, CP980, and DP600 steel specimens.
SteelThickness (mm)Trimming Clearance (%)Post-Cutting Treatment
HR CP800 SF3.48.8Untreated
Sandblasted
HR CP980 SF3.58.5
17.0
Untreated
HR DP6004.37.0Untreated
Table 4. Mean hardness and standard deviation for the two clusters identified by GMM in each cut edge region (burnish, fracture, burr) of CP800, CP980, and DP600. The base microstructure (cyan) and hardened edge and hard phase regions (red) correspond to the clusters identified.
SpecimenZonePhaseMean Hardness (GPa)Std. Dev. (GPa)
CP800 8.8% clearanceBurnishBase (cyan)4.60.3
Hardened (red)4.90.8
FractureBase (cyan)4.59.4
Hardened (red)5.991.6
BurrBase (cyan)4.20.3
Hardened (red)5.160.7
CP980 8.5% clearanceBurnishBase (cyan)4.60.4
Hardened (red)5.80.5
FractureBase (cyan)4.60.3
Hardened (red)5.20.4
BurrBase (cyan)4.60.3
Hardened (red)5.30.4
DP600 7% clearanceBurnishBase (cyan)3.60.3
Hardened (red)5.91.6
FractureBase (cyan)3.60.3
Hardened (red)5.81.5
BurrBase (cyan)3.90.4
Hardened (red)6.91.9
Table 5. Mean hardness and standard deviation for the two clusters identified by GMM in each cut edge region of sandblasted and untreated CP800. The base microstructure (cyan) and hardened edge and hard phase regions (red) correspond to the clusters identified.
SpecimenZonePhaseMean Hardness (GPa)Std. Dev. (GPa)
CP800 8.8% clearance
untreated
Burnish–transitionBase (cyan)4.60.3
Hardened (red)5.00.8
FractureBase (cyan)4.50.4
Hardened (red)5.91.6
BurrBase (cyan)4.20.3
Hardened (red)5.20.7
CP800 8.8% clearance
sandblasted
Burnish–transitionBase (cyan)4.80.4
Hardened (red)5.80.9
FractureBase (cyan)4.80.5
Hardened (red)6.21.6
BurrBase (cyan)4.30.4
Hardened (red)5.50.7
Table 6. Mean hardness and standard deviation for the two clusters identified by GMM in each cut edge region of the CP980 steel specimen at two different cutting clearances (8.5% and 17%). The base microstructure (cyan) and hardened edge and hard phase regions (red) correspond to the clusters identified.
SpecimenZonePhaseMean Hardness (GPa)Std. Dev. (GPa)
CP980 8.5% clearanceBurnish–transitionBase (cyan)4.70.4
Hardened (red)5.80.5
FractureBase (cyan)4.60.3
Hardened (red)5.20.4
BurrBase (cyan)4.60.3
Hardened (red)5.30.4
CP980 17.14% clearanceBurnish–transitionBase (cyan)4.80.3
Hardened (red)5.61.0
FractureBase (cyan)4.70.3
Hardened (red)5.40.8
BurrBase (cyan)4.60.3
Hardened (red)5.00.8
Table 7. Residual σx stresses and standard deviation values obtained by FIB-DIC for CP980 with 8.5% and 17.14% of clearance in 4 zones: burnish, transition, fracture, and burr.
SpecimenZone R e s i d u a l   σ x Stresses (MPa)Std. Dev. (MPa)
CP980 8.5% clearanceBurnish−613296
Transition688560
Fracture561695
Burr347100
CP980 17.14% clearanceBurnish−237307
Transition−198548
Fracture75893
Burr908435
Disclaimer/Publisher’s Note: The statements, opinions and data contained in all publications are solely those of the individual author(s) and contributor(s) and not of MDPI and/or the editor(s). MDPI and/or the editor(s) disclaim responsibility for any injury to people or property resulting from any ideas, methods, instructions or products referred to in the content.