Article

The Dual Influence of Silicon Content and Mechanical Stress on Magnetic Barkhausen Noise in Non-Oriented Electrical Steel

1
Department of Physics and Space Science, Royal Military College of Canada, Kingston, ON K7K 7B4, Canada
2
CanmetMATERIALS, Natural Resources Canada, Hamilton, ON L8P 0A5, Canada
*
Authors to whom correspondence should be addressed.
Metals 2025, 15(6), 600; https://doi.org/10.3390/met15060600
Submission received: 24 April 2025 / Revised: 21 May 2025 / Accepted: 22 May 2025 / Published: 27 May 2025
(This article belongs to the Special Issue Recent Advances in High-Performance Steel)

Abstract

Magnetic Barkhausen noise (MBN) analysis is a non-destructive evaluation technique that offers significant advantages in assessing the magnetic properties of electrical steels. It is particularly useful for quality control in electrical steel production and for evaluating magnetic quality during core manufacturing and assembly. Despite its potential, MBN has not been widely used in electrical steel characterization. One obstacle is that the effects of silicon content in the electrical steel and the residual stress generated during its processing on MBN have not been thoroughly understood, limiting the practical application of the MBN technique in the electrical steel and electric motor industries. To address this knowledge gap, this paper investigates the MBN responses from four non-oriented electrical steel (NOES) sheets with varying silicon contents (0.88, 1.8, 2.8, and 3.2 wt%) but similar other elements. The measurements were performed both with and without applied tensile stress. It is observed that increasing the Si content increases the pinning density, which, together with the microstructure and texture, largely impacts the MBN response. In addition, the MBN energy increases with the applied stress, which can be attributed to the increase in the number of 180° domain walls (DWs) in the direction of stress. The rate of this MBN increase, however, differs among steels with different silicon concentrations. This difference is due to the combined effect of the DWs and pinning density. When the DW spacing becomes less than the jump distance between the pinning sites, no further increase in the MBN energy is observed with additional stress. The reported results provide a basis for the interpretation of MBN signals for varying wt% Si in NOES when residual stresses are present.

1. Introduction

Non-oriented electrical steel (NOES), also known as non-grain-oriented (NGO) silicon steel, is the most widely used soft magnetic material for the manufacturing of lamination cores for electromagnetic devices [1,2] such as electric motors in appliances, traction motors in electric vehicles, and power generators in windmills. It is desirable for NOES sheets to have high permeability, low core loss, and low magnetostriction [3,4,5], which are achieved through proper alloying and process control [6] during NOES production [6,7]. On the other hand, minimizing the deterioration of the magnetic properties of NOES during the core lamination process [8,9] is also crucial for improving the efficiency of the electrical machines and reducing energy consumption [5].
Commercial NOES typically contains between 0 and up to ~3.3 wt% Si, although silicon content as high as 6.5 wt% has been reported in NOES produced in the laboratory [10]. The primary purpose of adding Si is to increase the electrical resistivity of the steel, thus reducing eddy current loss. While the effect of Si on the electrical, magnetic, and mechanical properties of the steel has been investigated [11,12], its influence on magnetic Barkhausen noise remains underexplored. In addition, the magnetic properties of NOES core laminations are significantly affected by the stresses [13,14,15] generated during laminate cutting and core assembling processes. These stresses alter the magnetic domain structure of the material, which in turn influences the overall magnetization [14]. Thus, studying the effect of stress on the magnetization of NOES is vital [13].
The common magnetic property measuring techniques, such as Epstein frame testing and single sheet testing, are destructive and time-consuming. These methods generally provide only the average magnetic properties along the rolling and transverse directions and fail to assess local magnetic variations. On the other hand, they are not suitable for in-line evaluation during the production of electrical steels. Consequently, there is a need for a versatile and non-destructive technique for the characterization of electrical steels, especially for magnetic quality monitoring and control during steel production and core lamination processes. Magnetic Barkhausen Noise (MBN), a non-destructive evaluation technology that can be used to characterize ferromagnetic materials [16,17,18,19,20,21,22,23], offers a promising solution. It has been successfully used in industry for quality control, for example, detecting case-hardening depth [24] and identifying grinding burns [25]. Despite its potential as an alternative method for evaluating the magnetic properties of electrical steels, only a few studies [26,27] have explored the correlation between MBN and magnetic properties of electrical steels. Moreover, challenges associated with the practical application of this technology in the electrical steel industry remain, since the correlation between the MBN signal and NOES magnetic properties has not been established. The influence of silicon content, microstructure, crystallographic texture, and stress state on the MBN response is not completely understood, which is examined in this study.
In MBN analysis, a varying magnetic field is applied to the excitation core of the MBN probe, which magnetizes the material and produces abrupt changes in local magnetization. These abrupt changes in magnetization are associated with the rapid motion of domain walls in ferromagnetic materials. Domain wall movement during magnetization is affected by a wide variety of material parameters, including chemical composition (C, Si, Mn, Al, etc.), microstructural phase (ferrite, martensite, pearlite, etc.), grain size, inclusions, precipitates, crystallographic texture, surface condition, and both residual and applied stress states [28]. The chemical composition affects the formation of the microstructure, texture, precipitation, and phases during processing and heat treatment, influencing the magnetic characteristics of the material and the pinning of domain wall motion. Additionally, alloying elements occupying interstitial or substitutional lattice positions create local lattice distortions due to size differences in atomic radius. These lattice distortions serve as pinning sites, restricting domain wall mobility. For a polycrystalline material, individual grains have been modeled as magnetic objects (MO), within which relatively independent magnetization processes take place [28,29]. Stress impacts these processes by increasing the number of 180° domain walls [28,29]. A 180° domain wall separates magnetic domains with magnetization vectors pointing in opposite directions, whereas a 90° domain wall separates domains with magnetization vectors that are perpendicular to each other. Furthermore, grain size plays a complicated role in MBN response: a smaller grain size means more grains (and more MOs) and more associated domain walls within the sensing area of the pickup coil, which increases the MBN energy; on the other hand, smaller grains require higher stress levels for the addition of 180° domain walls [28,29], thus limiting the increase in the MBN energy under stress. Studies examining the combined effect of these material parameters on MBN are limited.
Silicon in NOES acts as a substitutional element in iron, meaning the Si atoms replace some Fe atoms in the iron lattice [30]. This substitution strengthens the steel by solid solution strengthening and affects the phases present in the steel. The addition of silicon changes the steel’s physical, mechanical, magnetic, and electrical properties [30], for example, increasing the electrical resistivity, reducing the core loss, and improving other magnetic properties such as increasing the maximum magnetic permeability, while reducing the magnetic anisotropy and magnetostriction [31]. However, the local lattice strain induced by the addition of Si atoms can harden the material and act as pinning sites to hinder the movement of magnetic DWs [32].
The current work examines the effect of pinning site density within grains on the magnetic Barkhausen noise response in non-oriented electrical steel. Pinning site density in this context refers explicitly to the density of lattice distortions caused by Si atoms substituting Fe atoms, inferred directly from the silicon content. The novelty of the current study is that it investigates the combined effect of the pinning density (Si induced) and applied tensile elastic stress on the magnetic behavior of electrical steels, which has not been thoroughly examined in the past. The effect of the microstructure and texture on the MBN response is also investigated using electron backscatter diffraction (EBSD) techniques. The findings offer a foundation for advancing the use of MBN as a non-destructive monitoring tool to evaluate the properties of NOES.

2. Experimental

2.1. Materials

The NOES samples used for the present study are listed in Table 1. They were prepared by vacuum induction melting, hot rolling, hot band annealing, and cold rolling [33]. Final annealing of the cold-rolled strips was performed at 800 °C for 2 h under argon. The electrical resistivity of the NOES strips was measured at room temperature using a four-probe technique [34].

2.2. Microstructure and Texture Characterization

Samples for microstructure/texture characterization were cut at the mid-thickness plane (RD-TD, rolling direction—transverse direction) of the annealed steel sheets and prepared using conventional metallographic procedures. For EBSD characterization, a final polishing step using a 0.05 µm colloidal silica solution was applied. EBSD scans were performed on the RD-TD planes using an EDAX OIM EBSD system (V6.2, AMETEK, Inc., Berwyn, PA, USA) in a field emission gun scanning electron microscope (Nova NanoSEM, FEI Company, Hillsboro, OR, USA). The grain size and orientation distribution functions (ODF’s) were calculated from the orientation data using the OIM software (V6.2). A harmonic series expansion method with a Gaussian half-width of 5 deg and a series rank of 22 was used to calculate the ODF’s in Euler space (Bunge notation). The textures were plotted on the φ2 = 45° section of the Euler space.

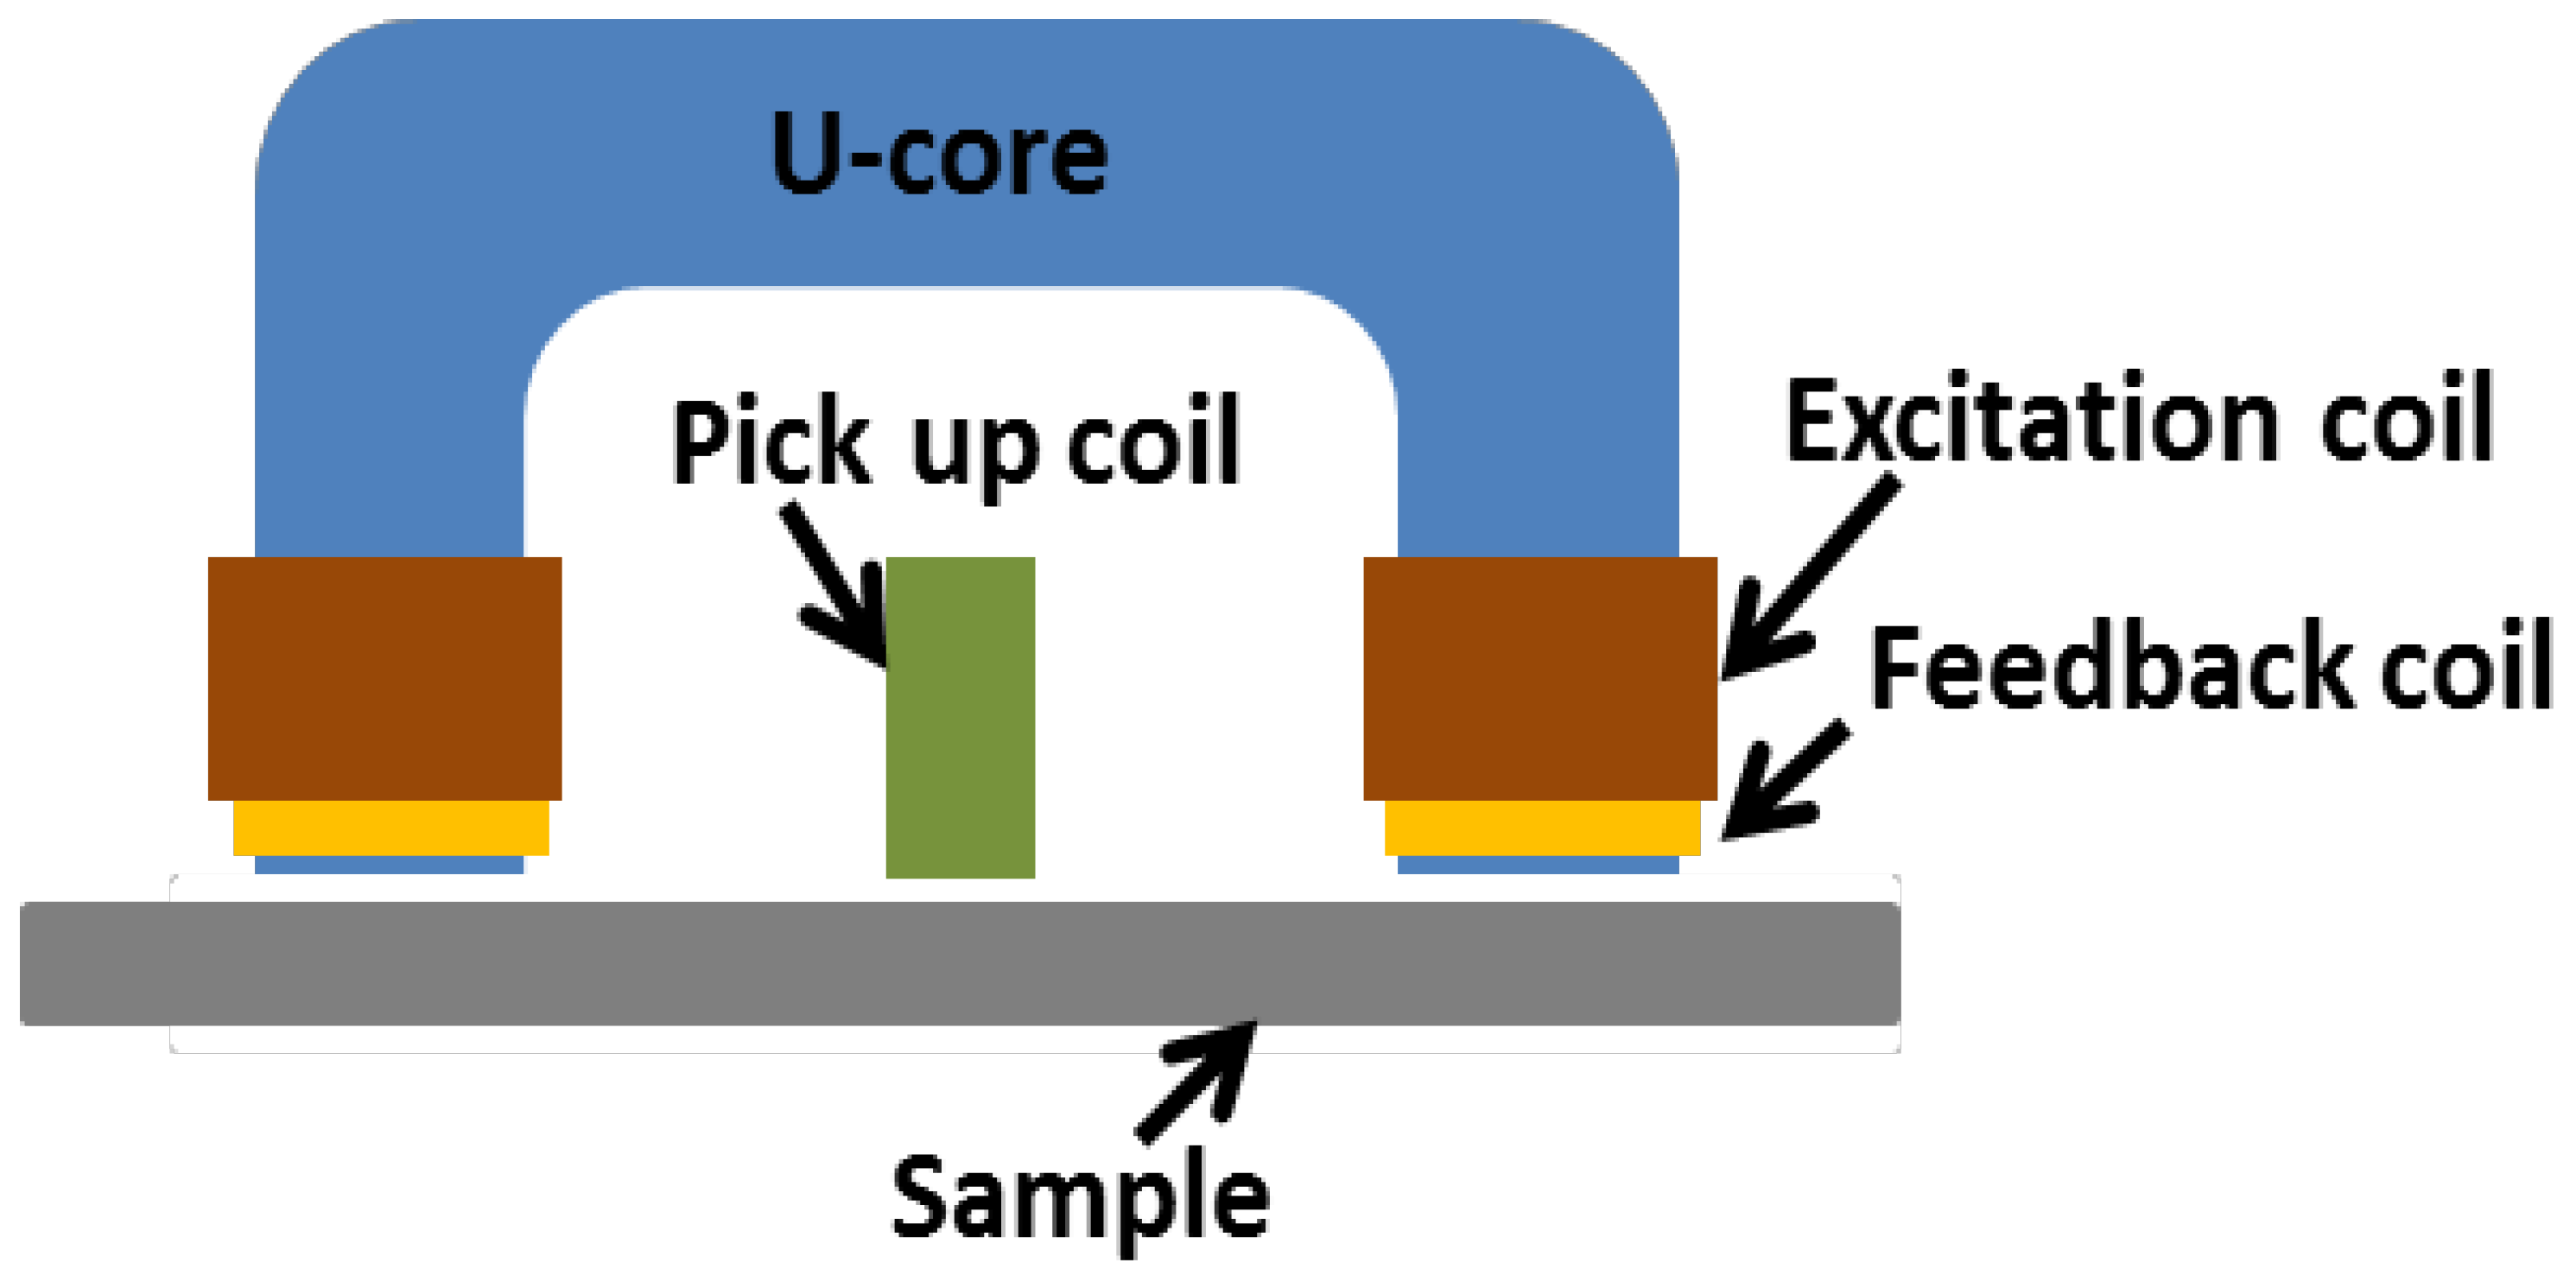
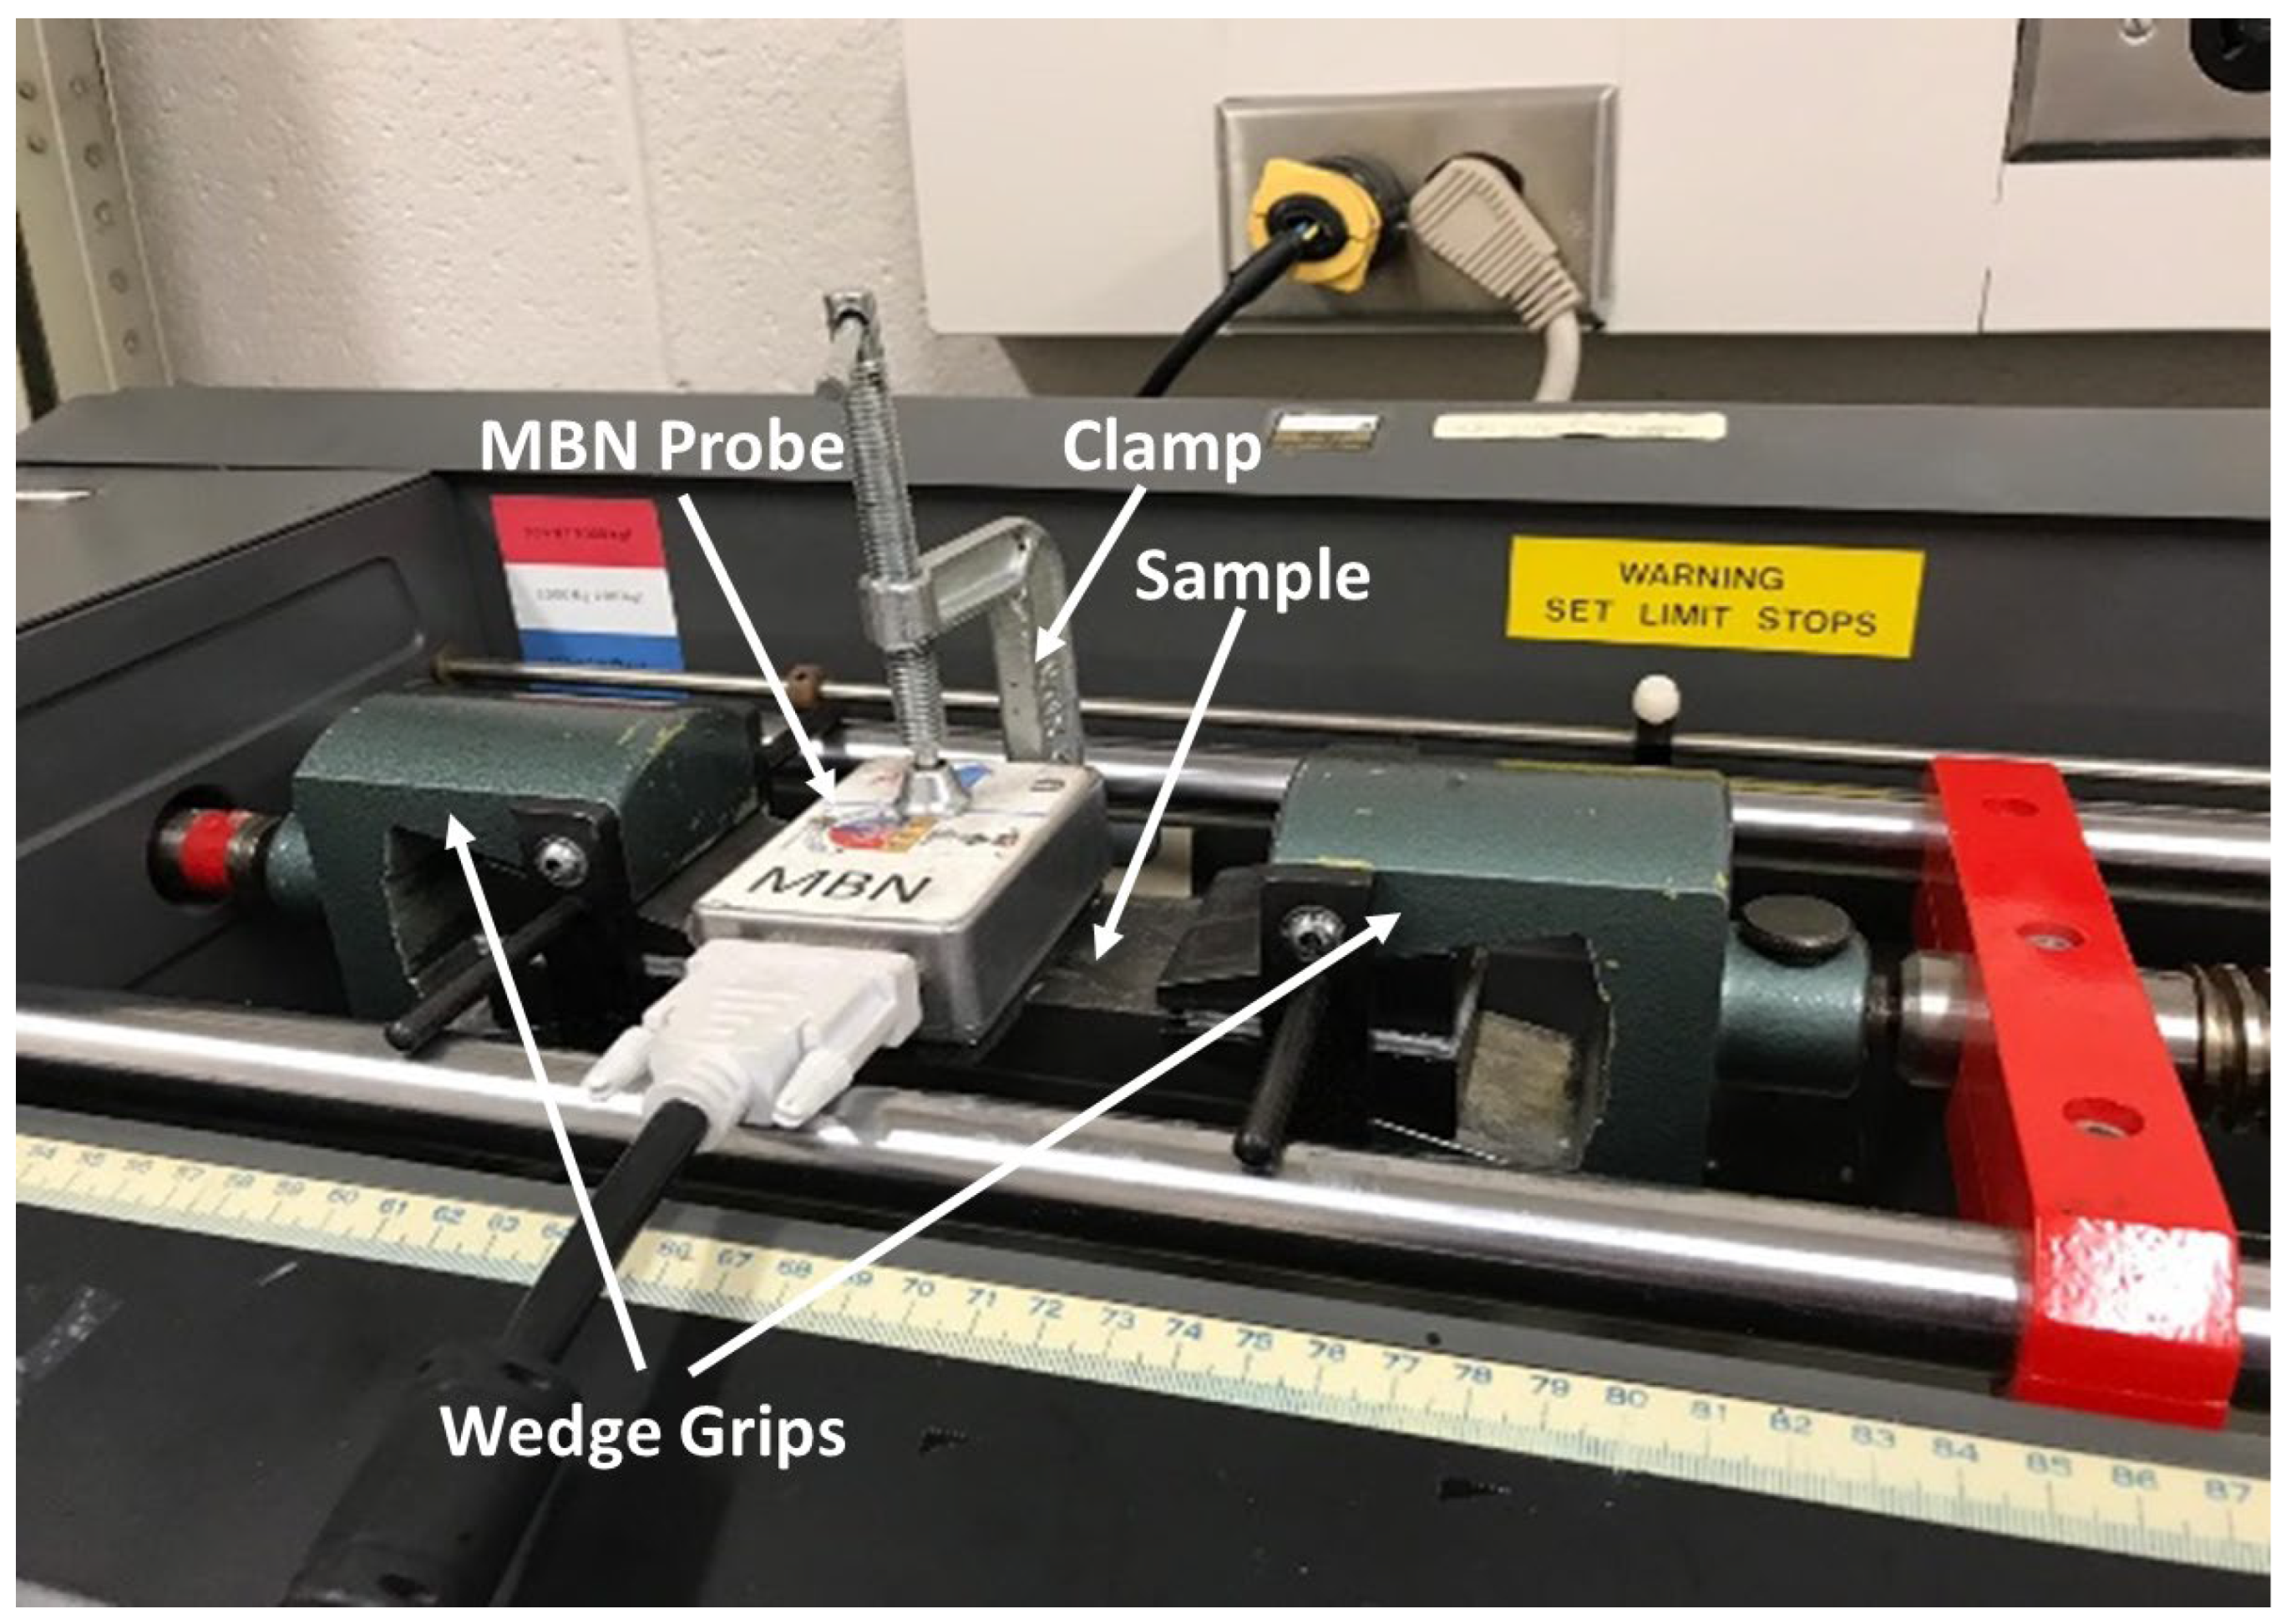
2.3. MBN Measurements

Magnetic Barkhausen noise (MBN), which originates from abrupt, localized changes in magnetization within a ferromagnetic material during magnetization, is a spectrum of high-frequency signals recorded as voltages. Typically, these signals reach their maximum amplitude near the coercive point of a magnetization cycle when sinusoidal excitation is employed. The MBN envelope—a graphical representation of these amplitude variations over a complete magnetization cycle—illustrates this behavior. The most common method of evaluating the Barkhausen noise signal, typically in the 10–100 Hz excitation range, is the root-mean-square (RMS) voltage.
The MBN measurements were performed using a dipole probe, as shown in Figure 1. The MBN probe includes a U-shaped, spring-loaded Supermendur core with two poles, each having a cross-sectional area of 4.2 mm × 9.5 mm, spaced 21.2 mm apart. Each pole is wound with a 500-turn excitation coil and a 50-turn feedback coil, both using American Wire Gauge (AWG) 36 wire. A spring-loaded, cylindrically symmetric pickup coil, oriented perpendicular to the sample surface, was used to capture the MBN signals. The pickup coil consists of a ferrite core wrapped with 100 turns of AWG 44 copper wire, shielded by a permeable sheath and conductive brass housing, limiting the effective sensing radius to approximately 2.4 mm at 30 Hz [16]. Coils of both excitation poles were excited with a sinusoidal current at a fixed frequency of 50 Hz. This frequency was selected because in electrical steels, this is the common frequency used for magnetic property measurements. A second pair of coils near the pole ends (feedback coils) was used to measure and control the induced flux through each pole. Flux control ensured that the effects from small changes in lift-off (spacing between probe and sample) were minimized [26,35]. The probe was centered on the sample and aligned with the sample’s rolling direction (RD). It was clamped to prevent probe movement or disturbance during measurements, as shown in Figure 2.
MBN flux sweep measurements were performed on both surfaces of each sample at multiple locations. Each sample had dimensions of 200 mm (length) × 50 mm (width) × 0.6 mm (thickness), and one sample was prepared per silicon composition. A total of six MBN measurements were performed per sample—three on each side. The average of these six measurements was reported as the MBN energy. For flux sweeps, the flux density was increased from 0.1 T to 0.7 T (as measured at the poles), and the corresponding MBN signals were recorded. Tensile stress was applied incrementally in loading steps of 1 kN using a horizontal 20 kN tensile testing machine (Monsanto Instruments Tensometer 20), as illustrated in Figure 2, and MBN was measured at each stress increment to the full flux density range. The tensometer has a constant crosshead speed of 1 mm/min and an accuracy of 1% for both crosshead speed and the applied load [16]. This speed provides a tensile test with a low strain rate, which is required to achieve uniform strain in the samples and to minimize the errors in the load cell output.

3. Results and Discussion

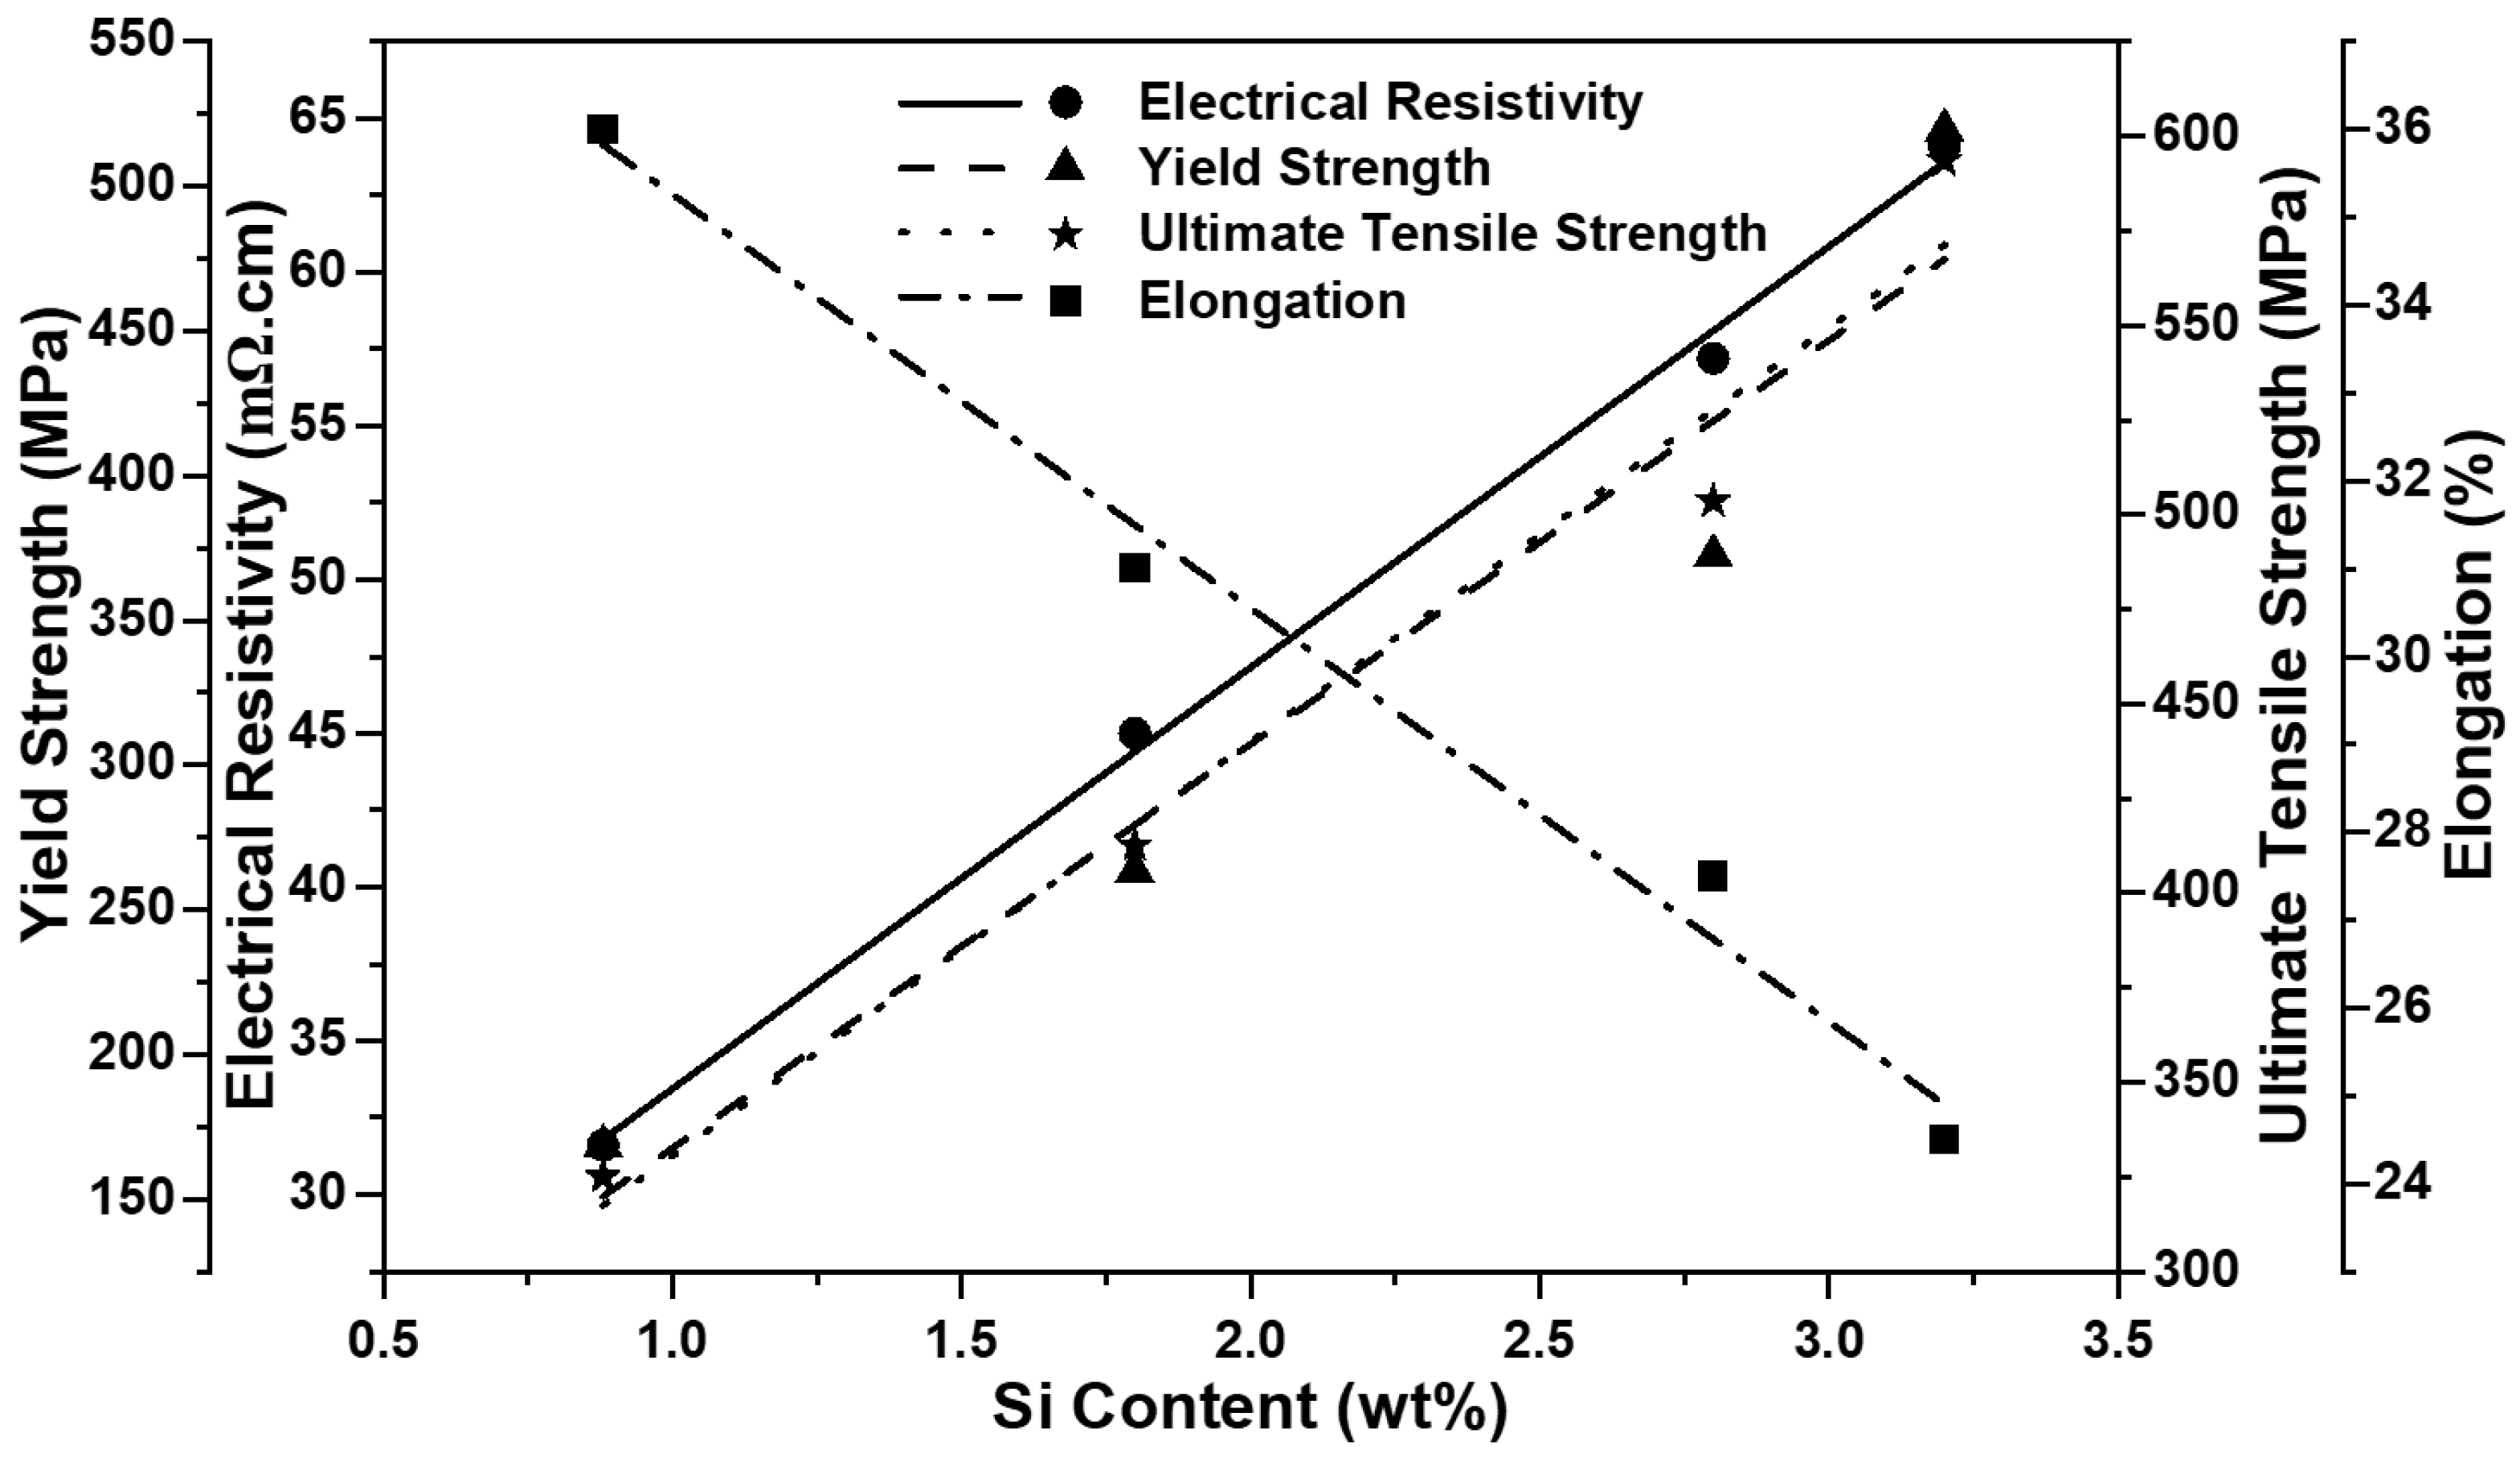
3.1. Material Properties

The electrical resistivity of the NOES increases linearly with the increase of silicon content (Figure 3). This is because silicon atoms substitute the iron atoms in the iron lattice [10], which increases the electrical resistivity, as silicon is not a conductor. The mechanical properties, as measured by standard tensile testing [33], also show linear relations with respect to the silicon content: both the yield strength (YS) (Table 2) and ultimate tensile strength (UTS) increase with the silicon content, while elongation decreases with the increase of silicon. This is due to solid solution strengthening by the addition of silicon, i.e., impeding dislocation slip and increasing the critical resolved shear stress. The increase in the critical resolved shear stress naturally decreases the NOES’ deformability (reduction in elongation).

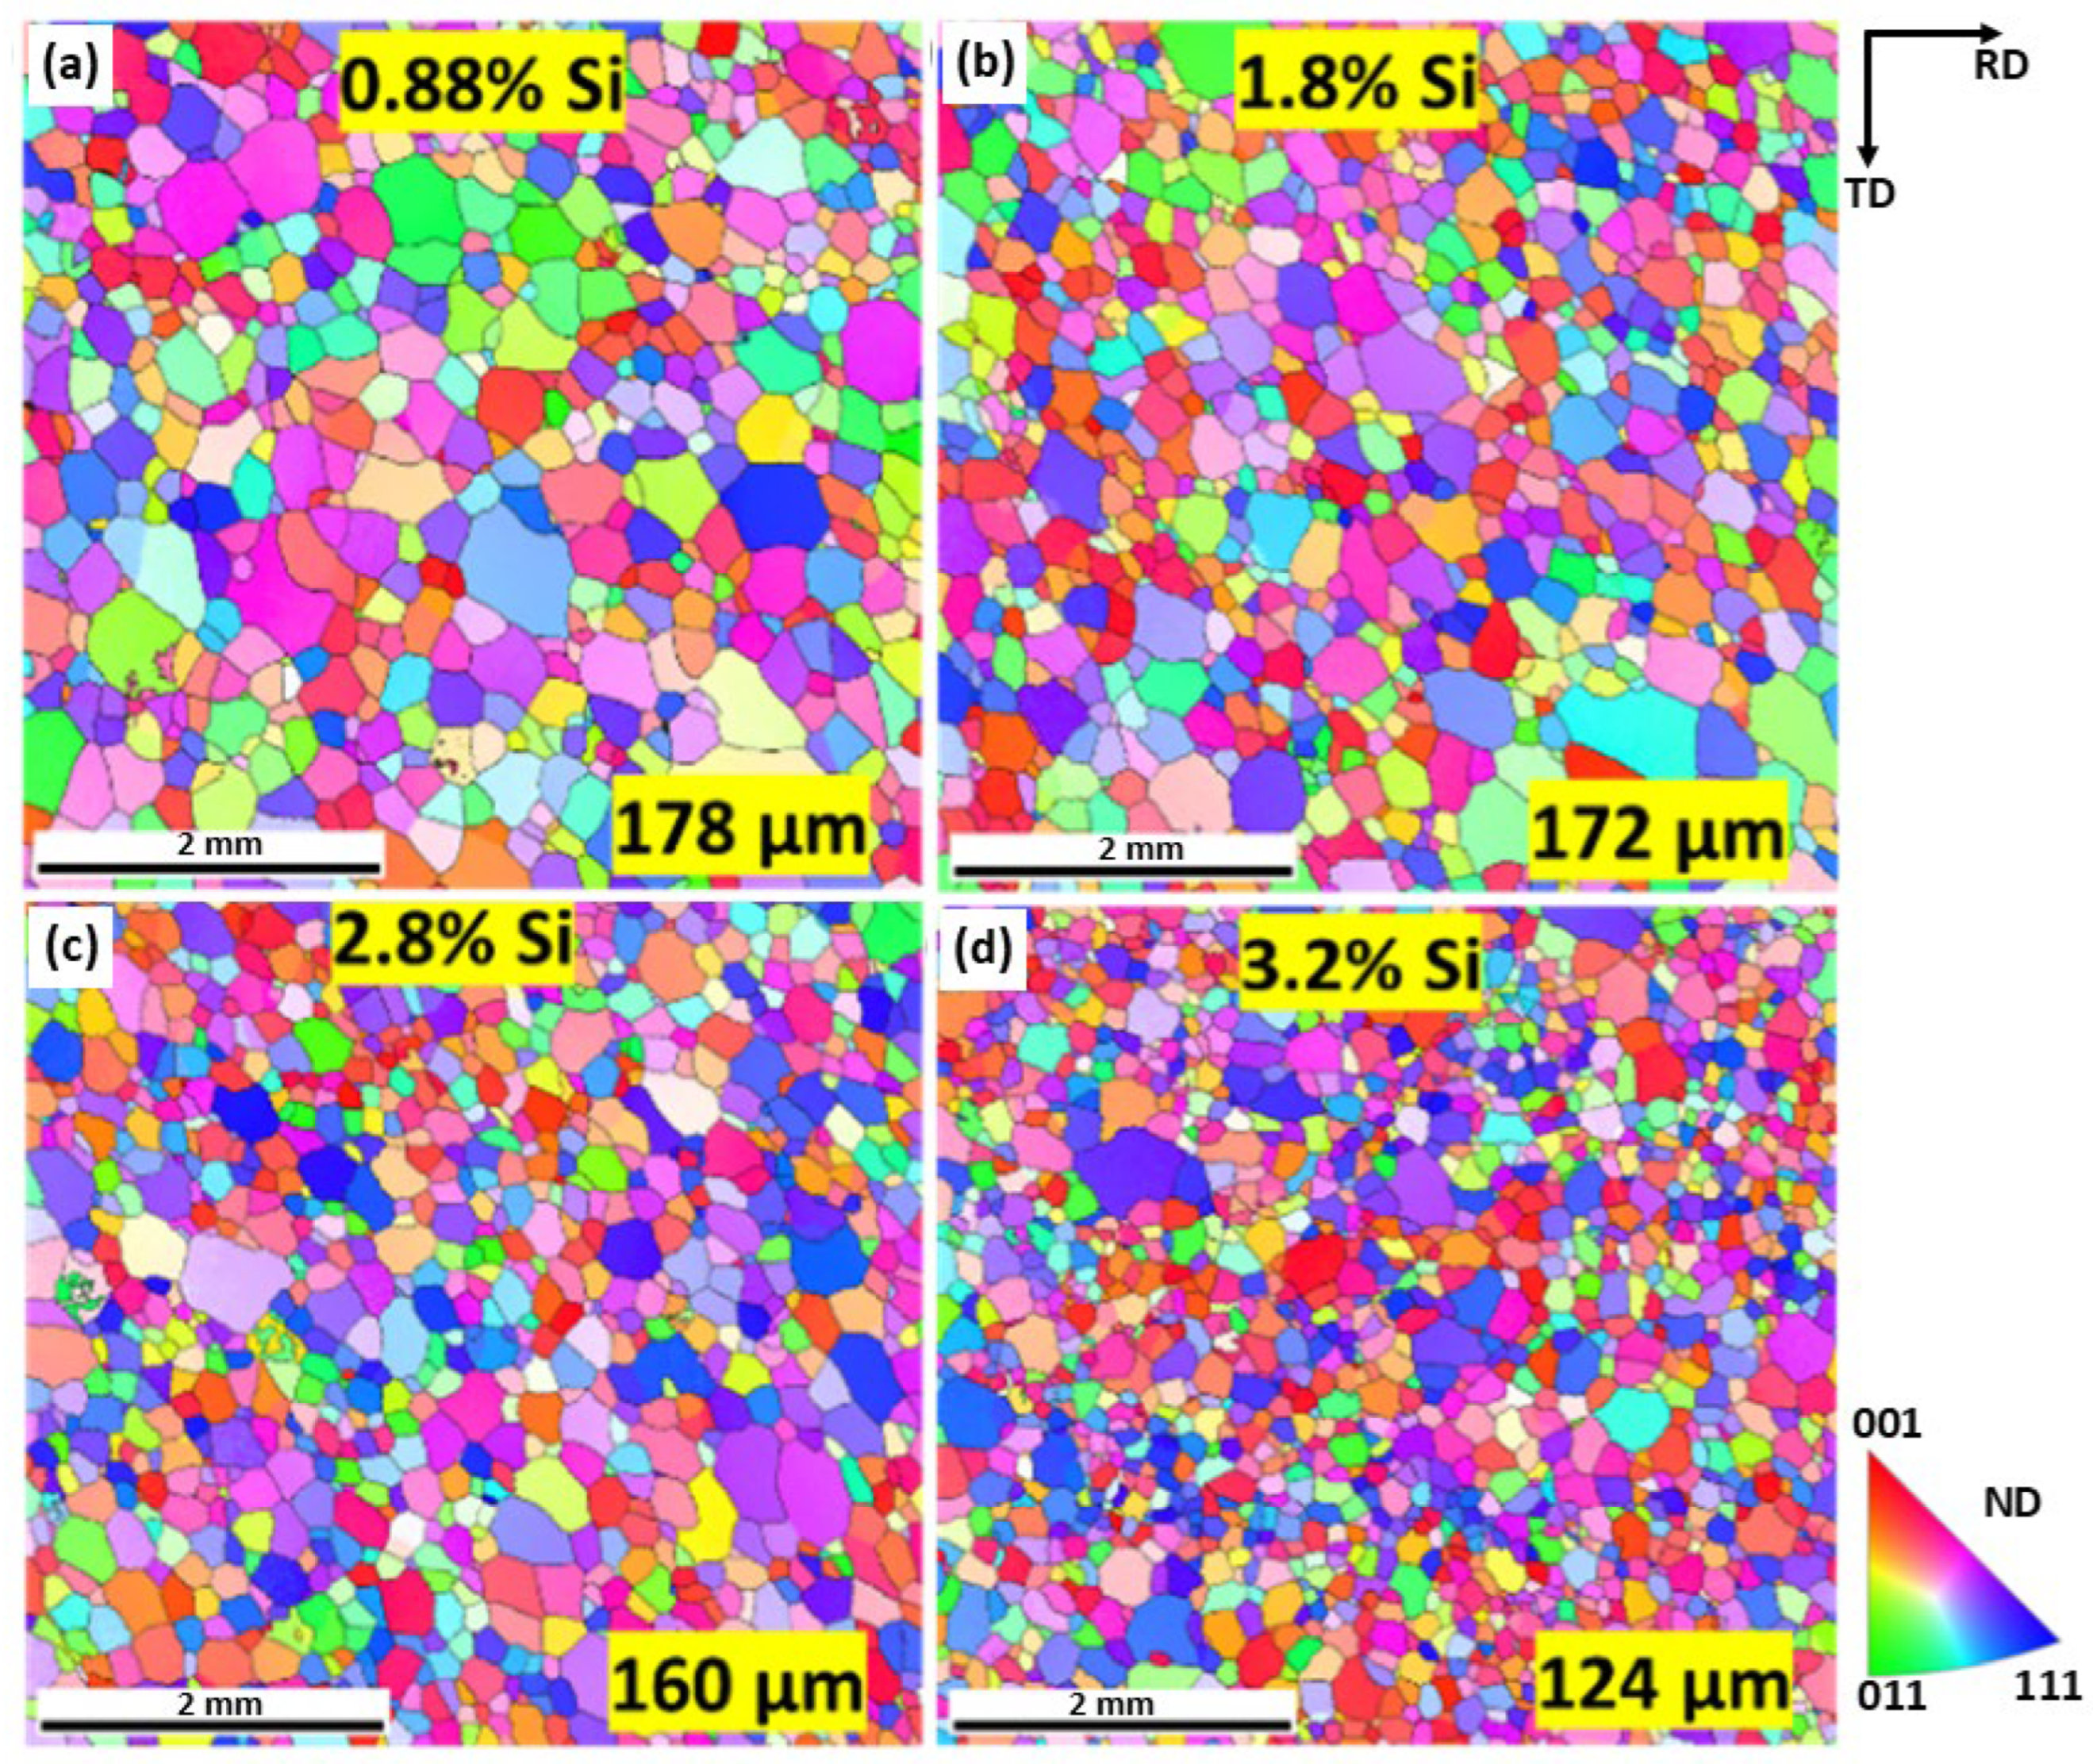
3.2. Microstructure and Texture

The EBSD inverse pole figure (IPF) maps of the NOES sheets after final annealing are shown in Figure 4. The average grain size generally decreases with the increase in the silicon content, as shown in Table 2. This is because the recrystallization temperature of NOES increases with silicon content [36]. At the same annealing temperature, grain growth in the higher silicon steel is slower, leading to a smaller grain size. The textures of the NOES calculated from the EBSD orientation data are shown in Figure 5. The intensities of the textures are relatively small (4.0–6.0), since annealing normally randomizes the texture. There is a <001>//ND (normal direction) texture (θ-fiber) in all the samples and the low silicon steels (0.88% and 1.8% Si) show a relatively strong cube texture ({001}<100>). The cube texture is believed to be the result of phase transformation in the low silicon steels [37,38]. The strongest cube texture is observed in the 1.8% Si steel. It is also noted that, in steels with low Si (0.88% and 1.8%), the <111>//ND fiber (γ-fiber) texture is relatively weak, while in steels with high Si (2.8% and 3.2%), a strong <111>//ND fiber is observed [39]. In fact, the <111>//ND fiber is a common texture for NOES with high silicon after annealing [6]. The austenite to ferrite transformation during hot rolling of the low silicon steels weakens the <111>//ND texture [40].

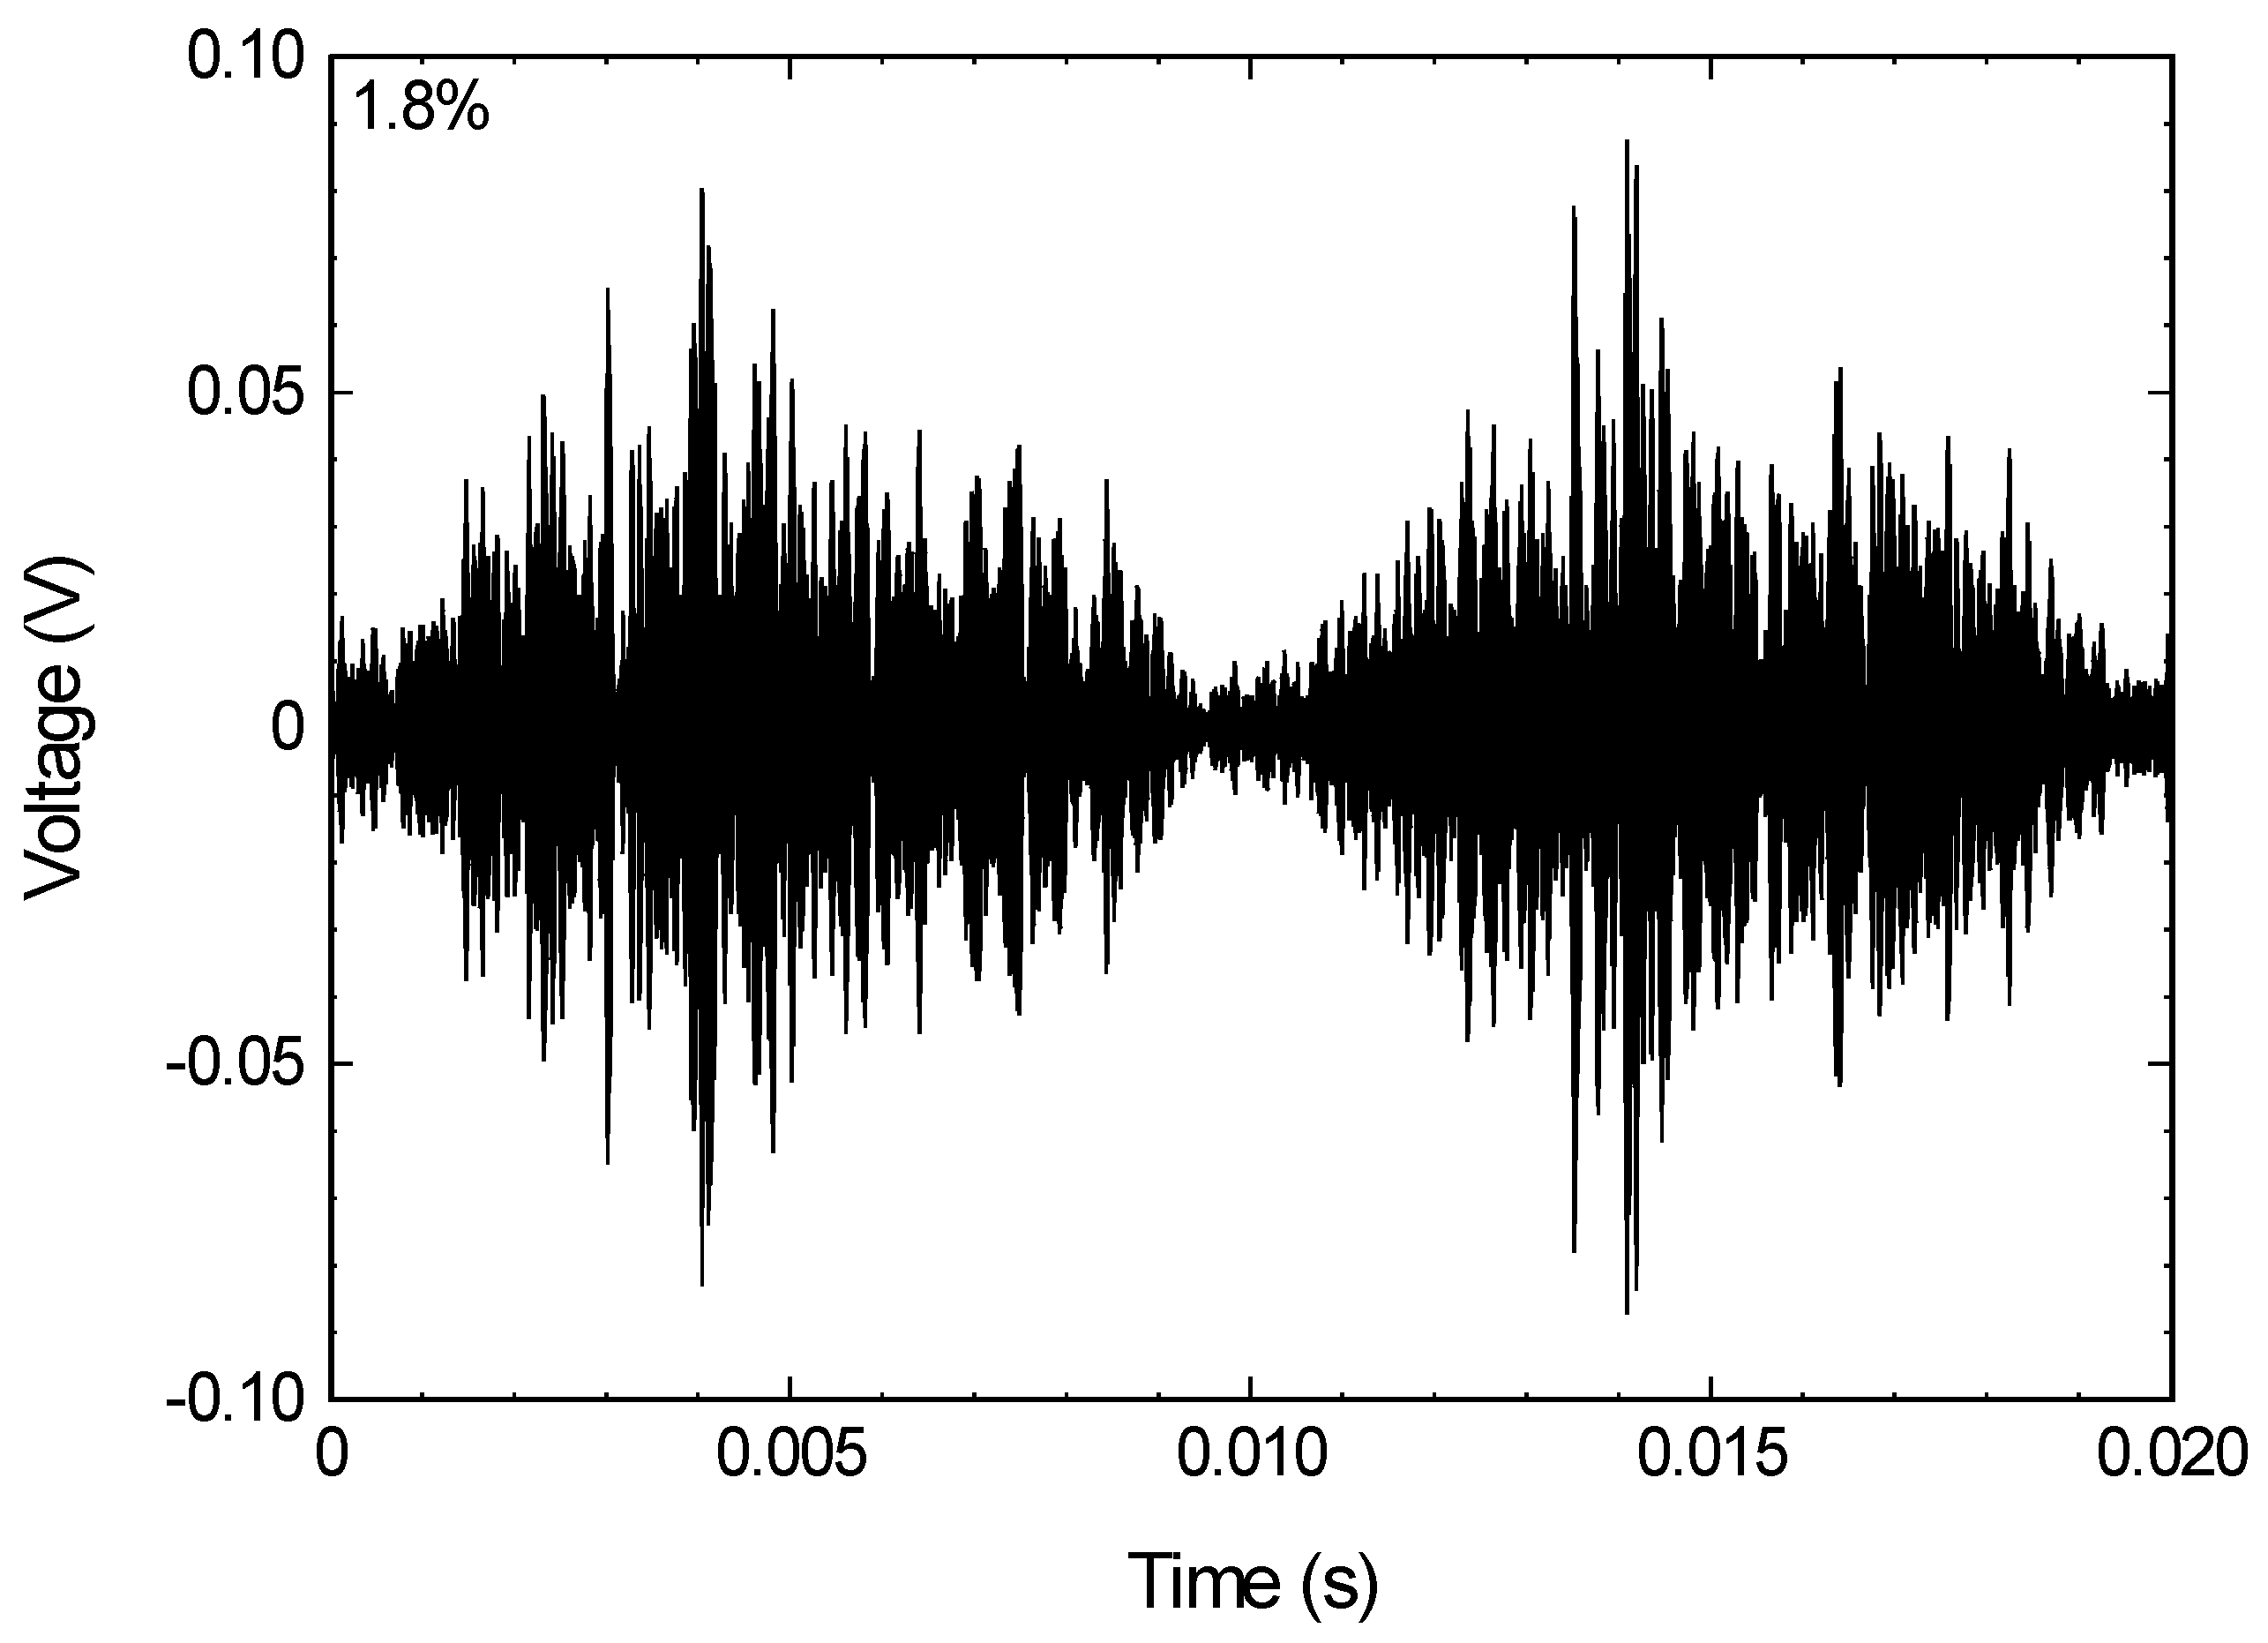
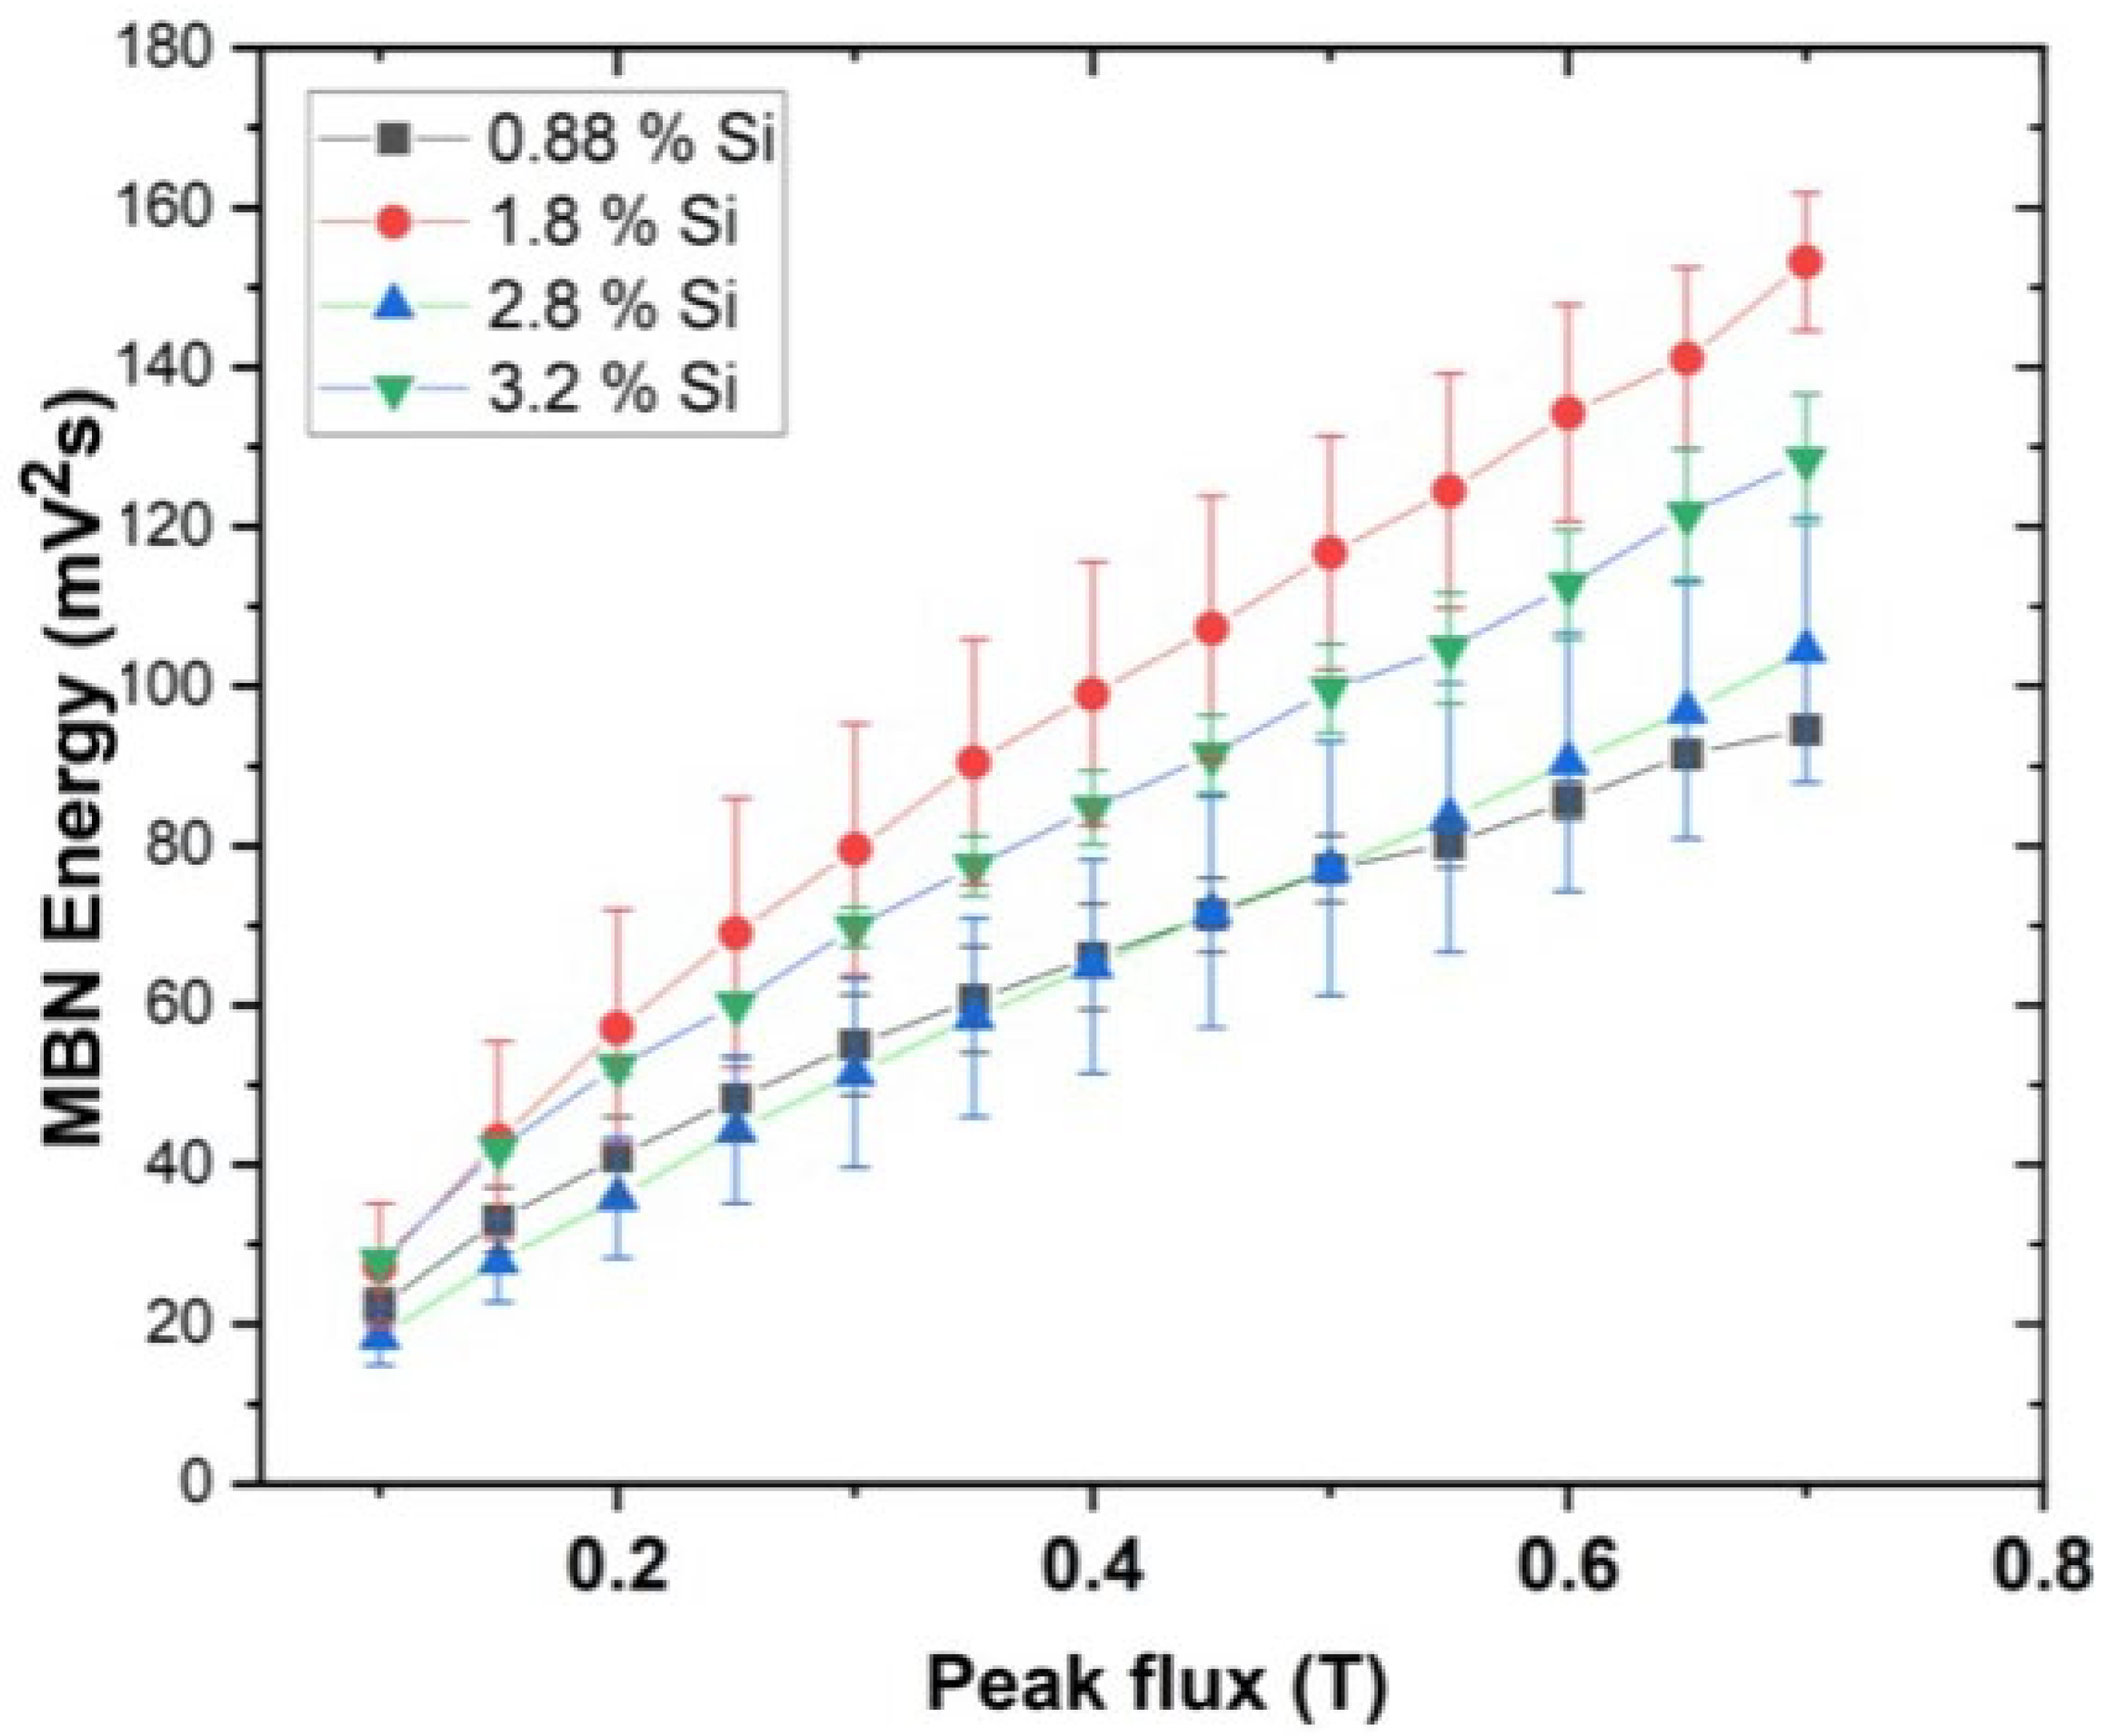
3.3. MBN Without Elastic Stress

For the given NOES, the characteristics of the MBN envelope can be observed in Figure 6. Analysis of this envelope could enable one to investigate effects of material properties, as it reflects the interactions between the microstructural features like grain boundaries, impurities, and the stress state within the material, and the movement of domain walls, which generate the Barkhausen noise.
Another common method to analyze the MBN signals is calculating the MBN energy as follows [28]:
M B N E n e r g y = e v e n t s V 2 d t
where V is the measured MBN voltage. The MBN energies at different magnitudes of peak flux for the NOES samples without applied stress are shown in Figure 7 along with the accompanying standard deviation shown as error bars. This variation can be attributed to the local sensitivity of MBN to microstructural features. Depending on where the pickup coil is positioned—over a single grain, across multiple grains, near a grain boundary, or a local defect—the measured signal can differ. Grain orientation, residual stress concentration, and defect distribution in that region can also influence the MBN response. For all the samples, the MBN energy increases monotonically with the peak flux density up to the maximum flux density applied, since increasing the magnetizing field affects the frequency of DW-pinning site interactions [28]. However, the MBN energy does not show a clear correlation with the silicon content. The MBN energies of the 1.8% and 3.2% Si steels are higher than those of the 0.88% and 2.8% Si steels, and the 1.8% Si steel shows the highest MBN energy, which can be attributed to the highest cube texture intensity in this steel (Figure 5b,e). Cube is the favorable orientation for NOES in terms of magnetic performance [41]. A stronger cube texture means a larger number of easy <100> directions along the rolling direction and hence a higher MBN energy, since when the applied field is along the macroscopic easy axis, the MBN energy is the strongest [27,42].
On the other hand, the 2.8% Si steel exhibits the smallest MBN energy up to a flux of 0.5 T, which is attributed to the strongest <111>//ND texture in this steel (Figure 5c,e). This unfavorable texture makes the steel hard to magnetize (low magnetic permeability) [31], which leads to small MBN as magnetization must proceed with a greater proportion of 90° DW motion. The 3.2% Si steel also shows a strong <111>//ND texture (Figure 5d,e), but its MBN energies are relatively high, which can be attributed to the small grain size and the larger number of pinning sites of this steel, as the smaller the grain size the greater the number of DWs and the greater the number of interactions with the pinning sites [16]. It is therefore seen that the final MBN energy is the combined result of several metallurgical factors, including Si%, grain size, and texture.

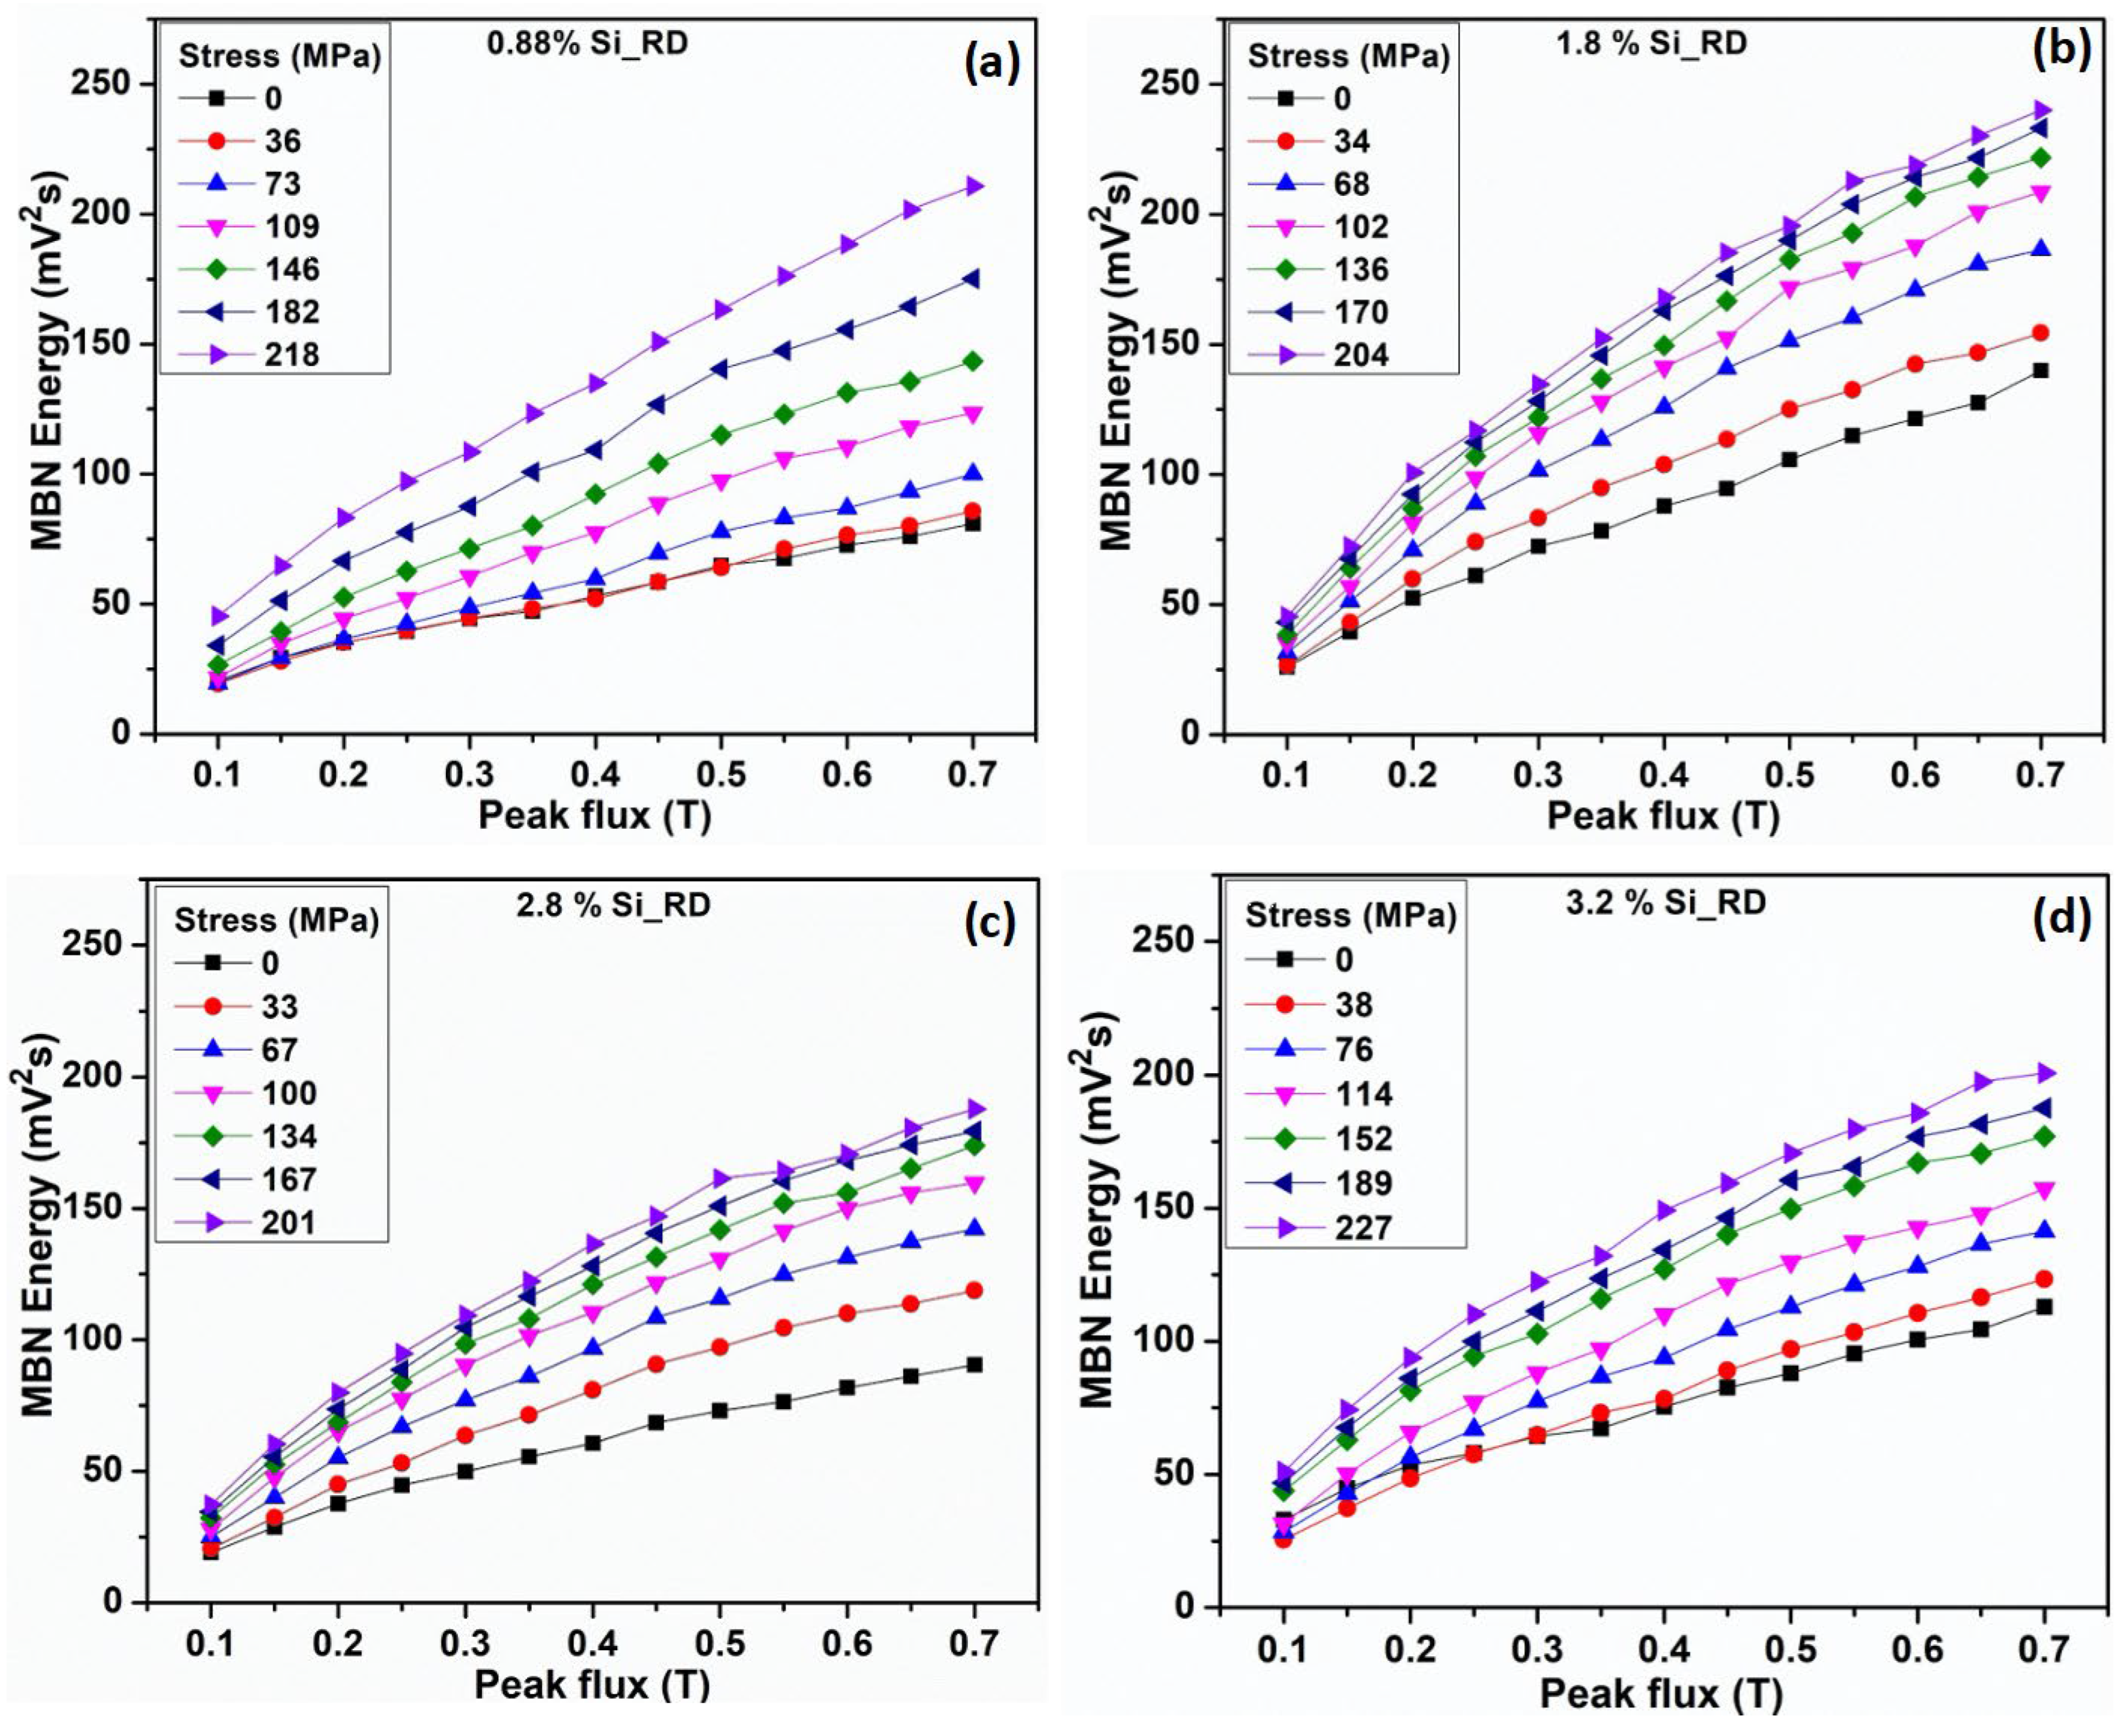
3.4. Elastic Stress Dependence of MBN

Flux sweeps for 0.88, 1.8, 2.8, and 3.2 wt % Si steel, at different stress levels, are shown in Figure 8a–d, respectively. MBN energy increases with applied stress and the difference in MBN is maximum at the highest flux levels. To isolate the effect of stress on MBN, MBN energies at various stress levels were normalized by the corresponding MBN energy without stress. This helped alleviate the effect of material parameters such as grain size, crystallographic texture, and pinning site density on the MBN of the stressed samples, which are initially different in the four samples. Normalized MBN energy is used here to isolate the effect of pinning site density and of stress, which increases the number of 180° domain walls and is plotted against stress as shown in Figure 9. It is important to note that the increase in the number of 180° domain walls under stress, as described above, is based on the correlations established in prior studies [28,29].
Figure 9 illustrates that the MBN energy mostly increases monotonically with the applied stress for all the NOES samples. This applied stress causes elastic deformation, leading to lattice distortions and temporary lattice strains that influence the MBN energy. However, an exception is observed in the 0.88 wt% Si steel under a 175 MPa stress, at which the normalized MBN energy decreases instead of increasing, as compared to a lower stress. This decrease in MBN energy is because the yield strength (YS) of this steel is about 170 MPa, and the deformation beyond the YS is plastic, which has been shown to decrease MBN energy [43,44]. In contrast, for the other three steels, the YS has not been exceeded, and the deformation remains elastic, resulting in a continued increase in normalized MBN energy with stress.
The normalized MBN energy increases with stress for all the samples, but at different rates. The 3.2% Si steel shows the highest rate of increase whereas the 0.88% Si steel shows the lowest. The dependence on pinning density can be attributed to the difference in atomic radius of Si (0.132 nm) and Fe (0.126 nm) [32]. When Si atoms substitute for Fe in the lattice, they cause local lattice distortions, which act as pinning sites during magnetization [45]. As the silicon content increases, so does the density of these pinning sites, which in turn increases the MBN energy [13]. The 3.2% Si steel has the largest Si content and thus has the highest pinning site density. As a result, the interactions between the 180° DWs and the pinning sites are greater in the 3.2% Si steel than in the other steels. These interactions, coupled with the smallest grain size in this steel, cause the highest number of MBN jumps and hence, the highest MBN energy as compared to the other steels.
Due to the lowest Si% and the largest grain size, the 0.88% Si steel has the smallest number of such pinning sites, and consequently the smallest number of interactions between DWs and pinning sites, which leads to rapid saturation of the MBN energy under increased stress. As a result, the 0.88% Si steel exhibits the smallest increase in the normalized MBN energy with stress, as shown in Figure 9. It is also possible that DW spacing becomes smaller than jump distance between pinning sites, thereby leading to the saturation of MBN signal with increasing stress as observed elsewhere [46] and as further described below. The interaction of the DWs with the pinning sites, whose number is affected by silicon addition, provides a qualitative explanation for the behavior of the MBN energy under varying stress levels and with different densities of pinning sites. Additionally, the 0.88% Si steel has the lowest YS, which results in the onset of plastic deformation within the range of applied stresses.
The changes in the normalized MBN signal can be further interpreted using the Magnetic Object (MO) model [10,22,23,47]. Figure 10 shows a MO model representation of a single grain with a NOES sample. Figure 10a shows the standard MO, with two 180° DWs and a sparse distribution of pinning sites representing the separation of pinning sites, ℓp, taken as the 1.8% Si steel in this example. Figure 10b shows refinement of the domain structure from (a) under applied uniaxial stress, with reduced 180° DW separation of ℓd. Figure 10c shows the relative representation of the 3.2% Si steel with a smaller grain size (see Table 1) and proportionally greater number of pinning sites. Figure 10d shows the transition to a refined domain structure under applied stress, but with a proportionally smaller number of 180° DWs compared with Figure 10b for the 1.8% Si steel sample, under a similar applied stress because of its smaller grain size [28,46]. These differences can explain the relative differences in stress dependence between the two steels. As described in [13], a reduced pinning site density will reduce the MBN signal due to fewer abrupt DW motions during magnetization.
The stress dependence of MBN energy can be more quantitatively described in terms of the relative mean distance (ℓp) between the pinning sites and the DW spacing (ℓd) between the 180° domains as defined in Figure 10. When the average DW spacing is greater than the pinning separation, ℓd > ℓp, interaction of DWs with pinning sites during magnetization will result in more abrupt DW motion that produces Barkhausen noise. With the application of stress, the DW structure is refined [13,28,29,46]. When the distance between the DWs is less than that between pinning sites, ℓd < ℓp, (see Figure 10b) the movement of 180° DWs is no longer inhibited by pinning. In this case, the MBN signal no longer increases with stress, i.e., it reaches saturation and can even decrease [13]. This effect is exhibited for the 0.88% Si steel under stress in Figure 8a.
The normalized stress dependence of MBN increases with increasing % Si for the 1.8% and 2.8% Si steels, but it also tends to saturate at higher stresses, as can be seen in Figure 9. For the 3.2% Si steel studied here, the limit of ℓd < ℓp is not reached for the stresses that have been applied. The combination of a higher pinning density and a smaller grain size, with a higher threshold stress required to introduce more 180° DWs [16,28,29,46], in the 3.2% Si steel facilitates the continued increase in MBN signal with stress, as compared to that of the lower wt% Si and larger grain size samples. These conditions explain the continued increase in MBN energy with stress for the 3.2% Si steel up to the maximum stress applied.
It should be noted that the magnetic domain structures were not characterized in this study. The interactions of the pinning sites with the domain walls were not directly visualized either. However, the assumptions made for the interpretation of the results in the paper have been well recognized in the literature [13,28,29,46]; thus, the interpretation provides a consistent explanation of the observed trends. Additional studies using direct magnetic domain characterization tools could further enhance the understanding of the mechanisms discussed.

4. Summary and Conclusions

In this study, the combined effect of stress and silicon content on the MBN of NOES was investigated. By normalizing the MBN energy at various stress levels with that under zero stress, it was possible to examine the effect of pinning density on the stress dependence of MBN. The results indicated that the normalized MBN energy increases with the increase in Si wt%, which is caused by the higher pinning site density produced by the substitution of the Si atoms for the Fe atoms in the lattice. The results also showed an increase in the normalized MBN energy with stress, (except for 0.88% Si beyond 170 MPa due to reaching yield), which is associated with the refinement of the domain structure (increase in 180° DWs).
The study provided insights into the magnetic response of NOES under stress, which is critical for the use of MBN as a non-destructive evaluation tool for NOES and other ferromagnetic materials.
Magnetic domain imaging of these samples could provide more details about the interaction between the pinning sites and the DWs. This can be a topic worth investigating in the future. Also, the MBN signal is affected by various factors, such as microstructure, texture, defects, residual and applied stresses, composition, and plastic deformation [47]. In order to use MBN as a potential tool for non-destructively characterizing NOES, it is important to investigate the individual and combined effect of these factors on MBN signals and develop mathematical models.

Author Contributions

Conceptualization, A.S.; methodology, P.R.U., Y.H. and T.W.K.; software, P.R.U.; validation, A.S., M.M. and P.R.U.; formal analysis, A.S.; investigation, A.S., M.M. and P.R.U.; resources, Y.H. and T.W.K.; data curation, A.S. and M.M.; writing—original draft, A.S.; writing—review, A.S., Y.H. and T.W.K.; supervision, Y.H. and T.W.K.; funding acquisition, Y.H. and T.W.K. All authors have read and agreed to the published version of the manuscript.

Funding

This work has been supported by the Natural Sciences and Engineering Research Council of Canada, and by Natural Resources Canada through the Program of Energy Research and Development (CMAT-23-108).

Data Availability Statement

The raw data supporting the conclusions of this article will be made available by the authors on request.

Acknowledgments

The authors are in debt to Erik Hilinski for providing some of the materials, and to Michael Attard for rolling the materials. Renata Zavadil and Jian Li are thanked for EBSD characterization, and Jie Liang is acknowledged for mechanical testing of the steels.

Conflicts of Interest

The authors declare no conflicts of interest.

References

  1. Karami, R.; Butler, D.; Tamimi, S. Manufacturing of non-grain-oriented electrical steels. Int. J. Adv. Manuf. Tech. 2024, 133, 1083–1109. [Google Scholar] [CrossRef]
  2. Paltanea, G.; Manescu, V.; Antoniac, A.; Nemoianu, I.V.; Gavrila, H. Mechanical and magnetic properties variation in non-oriented electrical steels with different cutting technology: A review. Materials 2024, 17, 1345. [Google Scholar] [CrossRef] [PubMed]
  3. Matsumura, K.; Fukuda, B. Recent developments of non-oriented electrical steel sheets. IEEE Trans. Magn. 1984, 20, 1533–1538. [Google Scholar] [CrossRef]
  4. Petrovic, D.S. Non-oriented electrical steel sheets. Mater. Technol. 2010, 44, 317–325. [Google Scholar]
  5. Bohn, F.; Gündel, A.; Landgraf, F.J.G.; Severino, A.M.; Sommer, R.L. Magnetostriction, Barkhausen noise and magnetization processes in E110 grade non-oriented electrical steels. J. Magn. Magn. Mater. 2007, 317, 20–28. [Google Scholar] [CrossRef]
  6. Kestens, L.; Jacobs, S. Texture Control During theManufacturing of Nonoriented Electrical Steels, Texture, Stress, and Microstructure; Wiley: Hoboken, NJ, USA, 2008; Article ID 173083; pp. 1–9. [Google Scholar]
  7. Xia, Z.; Kang, Y.; Wang, Q. Developments in the production of grain-oriented electrical steel. J. Magn. Magn. Mater. 2008, 320, 3229–3233. [Google Scholar] [CrossRef]
  8. Sundaria, R.; Lehikoinen, A.; Arkkio, A.; Belahcen, A. Effects of Manufacturing Processes on Core Losses of Electrical Machine. IEEE Trans. Energy Convers. 2021, 36, 197–206. [Google Scholar] [CrossRef]
  9. Füzer, J.; Dobák, S.; Petryshynets, I.; Kollár, P.; Kovác, F.; Slota, J. Correlation between Cutting Clearance, Deformation Texture, and Magnetic Loss Prediction in Non-Oriented Electrical Steels. Materials 2021, 14, 6893. [Google Scholar] [CrossRef]
  10. Ouyang, G.; Chen, X.; Liang, Y.; Macziewski, C.; Cui, J. Review of Fe-6.5 wt%Si high silicon steel—A promising soft magnetic material for sub-kHz application. J. Magn. Magn. Mater. 2019, 481, 234–250. [Google Scholar] [CrossRef]
  11. Bozorth, R.M. Ferromagnetism, 3rd ed.; D. Van Nostrand Company, Inc.: Toronto, ON, Canada, 1951. [Google Scholar]
  12. Hawezy, D. The influence of silicon content on physical properties of non-oriented silicon steel. Mater. Sci. Technol. 2017, 33, 1560–1569. [Google Scholar] [CrossRef]
  13. Perevertov, O.; Schäfer, R. Influence of applied tensile stress on the hysteresis curve and magnetic domain structure of grain-oriented Fe–3% Si steel. J. Phys. D Appl. Phys. 2014, 47, 185001. [Google Scholar] [CrossRef]
  14. Dijkstra, L.J.; Martius, U.M. Domain pattern in silicon-iron under stress. Rev. Mod. Phys. 1953, 25, 146. [Google Scholar] [CrossRef]
  15. Saleem, A.; Goldbaum, D.; Brodusch, N.; Gauvin, R.; Chromik, R.R. Microstructure and mechanical property connections for a punched non-oriented electrical steel lamination. Mater. Sci. Eng. A 2018, 725, 456–465. [Google Scholar] [CrossRef]
  16. Samimi, A.A. Magnetic Barkhausen Noise Testing: Steel Grades and Stress Response. Ph.D. Dissertation, Queen’s University, Kingston, ON, Canada, 2015. [Google Scholar]
  17. Liu, J.; Tian, G.Y.; Gao, B.; Zeng, K.; Liu QHZheng, Y. Magnetic Barkhausen Noise Transient Analysis for Microstructure Evolution Characterization with Tensile Stress in Elastic and Plastic Status. Sensors 2021, 21, 8310. [Google Scholar] [CrossRef]
  18. Yamaura, S.; Furuya, Y.; Watanabe, T. The effect of grain boundary microstructure on Barkhausen noise in ferromagnetic materials. Acta. Mater. 2001, 49, 3019–3027. [Google Scholar] [CrossRef]
  19. Maciusowicz, M.; Psuj, G. Use of time-dependent multispectral representation of magnetic Barkhausen noise signals for the needs of non-destructive evaluation of steel materials. Sensors 2019, 19, 1443. [Google Scholar] [CrossRef]
  20. Bahleda, F.; Neslušan, M.; Pastorek, F.; Koňár, R.; Kubjatko, T. Barkhausen Noise Emission as a Function of Tensile Stress in Low-Alloyed Steels: Influence of Corrosion and Steel Strength. Appl. Sci. 2023, 13, 6574. [Google Scholar] [CrossRef]
  21. Yelbay, H.İ.; Gür, C.H. Non-Destructive Determination of Surface Residual Stresses in Electron Beam Welded AISI 410 Martensitic Stainless Steel Using the Magnetic Barkhausen Noise Technique. Metals 2025, 15, 305. [Google Scholar] [CrossRef]
  22. Vourna, P.; Ktena, A.; Tsakiridis, P.E.; Hristoforou, E. An accurate evaluation of the residual stress of welded electrical steels with magnetic Barkhausen noise. Measurement 2015, 71, 31–45. [Google Scholar] [CrossRef]
  23. Wang, L.; Xu, C.; Feng, L.; Wang, W. A Survey of the Magnetic Anisotropy Detection Technology of Ferromagnetic Materials Based on Magnetic Barkhausen Noise. Sensors 2024, 24, 7587. [Google Scholar] [CrossRef]
  24. Tam, P.L.; Hammersberg, P.; Persson, G.; Olavison, J. Case depth evaluation of induction-hardened camshaft by using magnetic Barkhausen noise (MBN) method. Nondestruct. Test. Eval. 2020, 36, 494–514. [Google Scholar] [CrossRef]
  25. Lasaosa, A.; Gurruchaga, K.; Arizti, F.; Martinez-de-Guerenu, A. Induction Hardened Layer Characterization and Grinding Burn Detection by Magnetic Barkhausen Noise Analysis. J. Nondestruct. Eval. 2017, 36, 27. [Google Scholar] [CrossRef]
  26. Samimi, A.A.; Krause, T.W.; Clapham, L.; Gallaugher, M.; Ding, Y.; Ghosh, P.; Chromik, R.; Knight, A.M. Correlation between ac core loss and surface magnetic Barkhausen noise in electric motor steel. J. Nondestruct. Eval. 2014, 33, 663–669. [Google Scholar] [CrossRef]
  27. de Campos, M.F.; Campos, M.A.; Landgraf, F.J.G.; Padovese, L.R. Anisotropy study of grain oriented steels with magnetic Barkhausen Noise. In Journal of Physics: Conference Series; IOP Publishing: Bristol, UK, 2011; Volume 303, p. 012020. [Google Scholar]
  28. Krause, T.W.; Samimi, A.A. Micromagnetic Techniques. In ASM Handbook Volume17: Nondestructive Evaluation and Quality Control, 10th ed.; ASM International: Almere, The Netherlands, 2018. [Google Scholar]
  29. Krause, T.W.; Clapham, L.; Pattantyus, A.; Atherton, D.L. Investigation of the stress-dependent magnetic easy axis in steel using magnetic Barkhausen noise. J. Appl. Phys. 1996, 79, 4242–4252. [Google Scholar] [CrossRef]
  30. Lemke, J.N.; Simonelli, M.; Garibaldi, M.; Ashcroft, I.; Hague, R.; Vedani, M.; Wildman, R.; Tuck, C. Calorimetric study and microstructure analysis of the order-disorder phase transformation in silicon steel built by SLM. J. Alloys Compd. 2017, 722, 293–301. [Google Scholar] [CrossRef]
  31. Cullity, B.D.; Graham, C.D. Introduction to Magnetic Materials; John Wiley & Sons: Hoboken, NJ, USA, 2011. [Google Scholar]
  32. Chikazumi, S.; Charap, S.H. Physics of Magnetism; Krieger: Malaba, FL, USA, 1964. [Google Scholar]
  33. He, Y.; Hilinski, E.J. Skew rolling and its effect on the deformation textures of non-oriented electrical steels. J. Mater. Process. Technol. 2017, 242, 182–195. [Google Scholar] [CrossRef]
  34. Singh, Y. Electrical resistivity measurements: A review. In International Journal of Modern Physics: Conference Series; World Scientific Publishing Company: Singapore, 2013; Volume 22, pp. 745–756. [Google Scholar]
  35. White, S.A. A Barkhausen Noise Testing SYSTEM for CANDU Feeder Pipes. Ph.D. Thesis, Department of Physics, Queen’s University, Kingston, ON, Canada, 2009. [Google Scholar]
  36. Böhm, T.; Schneider, J.; Telger, K.; Wuppermann, C.-D.; Kawalla, R.; Friedrich, K.E. Method of Producing Non-Grain-Oriented Electrical Sheet. U.S. Patent US6582528B1, 24 June 2003. [Google Scholar]
  37. Tomida, T.; Uenoya, S.; Sano, N. Fine-grained doubly oriented silicon steel sheets and mechanism of cube texture development. Mater. Trans. 2023, 44, 1106–1115. [Google Scholar] [CrossRef]
  38. Ahn, Y.-K.; Jeong, Y.-K.; Kim, T.-Y.; Cho, J.-U.; Hwang, N.-M. Texture evolution of non-oriented electrical steel analyzed by EBSD and in-situ XRD during the phase transformation from γ to α. Mater. Today Commun. 2020, 25, 101307. [Google Scholar] [CrossRef]
  39. Sahoo, G.; Singh, C.D.; Deepa, M.; Dhua, S.K.; Saxena, A. Recrystallization behaviour and texture of non-oriented electrical steels. Mater. Sci. Eng. A 2018, 734, 229–243. [Google Scholar] [CrossRef]
  40. Ahn, Y.K.; Kwon, S.B.; Jeong, Y.K.; Cho, J.U.; Kim, T.Y.; Hwang, N.M. Fabrication of cube-on-face textured Fe-1wt% Si and Fe-2wt% Si-1wt% Ni electrical steel using surface nucleation during γ→α phase transformation. Mater. Charact. 2020, 170, 110724. [Google Scholar] [CrossRef]
  41. Sha, Y.H.; Sun, C.; Zhang, F.; Patel, D.; Chen, X.; Kalidindi, S.R.; Zuo, L. Strong cube recrystallization texture in silicon steel by twin-roll casting process. Acta. Mater. 2014, 76, 106–117. [Google Scholar] [CrossRef]
  42. Wang, L.; He, C.; Liu, X. Evaluation of the Magnetocrystalline Anisotropy of Typical Materials Using MBN Technology. Sensors 2021, 21, 3330. [Google Scholar] [CrossRef] [PubMed]
  43. Stefanita, C.G.; Atherton, D.L.; Clapham, L. Plastic versus elastic deformation effects on magnetic Barkhausen noise in steel. Acta Mater. 2000, 48, 3545–3551. [Google Scholar] [CrossRef]
  44. Di, J.; He, C.; Lee, Y.C.; Liu, X. Evaluation of the stress gradient of the superficial layer in ferromagnetic components based on sub-band energy of magnetic Barkhausen noise. Nondestruct. Test. Eval. 2021, 37, 41–55. [Google Scholar] [CrossRef]
  45. Chen, C.-W. Magnetism and Metallurgy of Soft Magnetic Materials; Dover Publications, Inc.: Garden City, NY, USA, 1986; p. 130. [Google Scholar]
  46. Corner, W.D.; Mason, J.J. The Effect of Stress on the Domain Structure of Cube-textured Silicon Iron. Proc. Phys. Soc. 1963, 81, 925. [Google Scholar] [CrossRef]
  47. Lee, K.; Park, S.; Huh, M.; Kim, J.; Engler, O. Effect of texture and grain size on magnetic flux density and core loss in non-oriented electrical steel containing 3.15% Si. J. Magn. Magn. Mater. 2014, 354, 324–332. [Google Scholar] [CrossRef]
Figure 1. Schematic of a dipole probe showing the U-core electromagnets.
Metals 15 00600 g001
Figure 2. MBN measurements of non-oriented electrical steels under tensile stress.
Metals 15 00600 g002
Figure 3. The relations of the electrical resistivity and mechanical properties of the non-oriented electrical steels with respect to the wt% Si. The lines are linear best fits to the experimental data.
Metals 15 00600 g003
Figure 4. EBSD invers pole figure maps showing the microstructures of the NOES samples after final annealing: (a) 0.88%, (b) 1.8%, (c) 2.8% and (d) 3.2% Si.
Metals 15 00600 g004
Figure 5. Textures of the NOES sheets after annealing: (a) 0.88% Si, (b) 1.8% Si, (c) 2.8% Si, (d) 3.2% Si, (e) volume fractions of texture component and fibers vs. silicon content. φ2 = 45° ODF sections, Bunge notation. When calculating the volume fractions, a 15° deviation from the ideal orientation (fiber) was allowed.
Metals 15 00600 g005
Figure 6. Typical MBN envelope of an NOES sheet (1.8% Si).
Metals 15 00600 g006
Figure 7. MBN energy of NOES with varying Si % as a function of sweeping flux.
Metals 15 00600 g007
Figure 8. MBN energy as a function of flux at different stress levels for (a) 0.88% Si steel, (b) 1.8% Si steel, (c) 2.8% Si steel, and (d) 3.2% Si steel.
Metals 15 00600 g008
Figure 9. Normalized MBN energy of NOES with different Si % as a function of stress at 0.6 T peak flux.
Metals 15 00600 g009
Figure 10. (a) Magnetic object model representation of 0.88% Si steel under zero stress, with mean pinning distance ℓp between Si atoms (), which transitions to (b) a refined domain structure under applied stress, where ℓd is the average 180° domain width (ℓd > ℓp). (c) Depiction of 3.2% Si steel, with greater pinning density and smaller grain size, under zero stress, which transitions to (d) a refined domain structure under applied stress (ℓd < ℓp).
Metals 15 00600 g010
Table 1. The chemical composition (wt%) and thickness of the non-oriented electrical steels investigated in this study.
SteelSiCMnAlFeThickness (mm)
A0.880.00210.3070.461Bal.0.56
B1.80.00230.2990.515Bal.0.59
C2.80.00330.3030.516Bal.0.60
D3.20.00290.4000.580Bal.0.61
Table 2. The average grain size and yield strength of the NOES samples.
SteelAverage Grain Size (μm)Yield Strength (MPa)
A178 ± 31168.5
B172 ± 25263.5
C160 ± 22372.5
D124 ± 15519.5
Disclaimer/Publisher’s Note: The statements, opinions and data contained in all publications are solely those of the individual author(s) and contributor(s) and not of MDPI and/or the editor(s). MDPI and/or the editor(s) disclaim responsibility for any injury to people or property resulting from any ideas, methods, instructions or products referred to in the content.

