Article

Machinability Assessment and Multi-Objective Optimization of Graphene Nanoplatelets-Reinforced Aluminum Matrix Composite in Dry CNC Turning

by
Nikolaos A. Fountas
1,*,
Dimitrios E. Manolakos
2 and
Nikolaos M. Vaxevanidis
1,*
1
Laboratory of Manufacturing Processes and Machine Tools (LMProMaT), Department of Mechanical Engineering Educators, School of Pedagogical and Technological Education (ASPETE), GR 151 22 Amarousion, Greece
2
School of Mechanical Engineering, National Technical University of Athens, GR 157 80 Zografou, Greece
*
Authors to whom correspondence should be addressed.
Metals 2025, 15(6), 584; https://doi.org/10.3390/met15060584
Submission received: 10 April 2025 / Revised: 18 May 2025 / Accepted: 19 May 2025 / Published: 24 May 2025

Abstract

This study examined machinability aspects in terms of the main cutting force and surface roughness in dry CNC turning of graphene-reinforced composite aluminum with 0.5 wt%. The cutting speed, feed rate and depth of cut influence were investigated in regard to the responses of main cutting force Fz and surface roughness Ra when turning high-purity aluminum (Al 96.83%) and graphene-reinforced aluminum with 0.5% graphene nanoplatelets for comparative analysis. A customized central composite design of the experiments with nine runs was established, and the results were assessed through analysis of variance and response surface regression. Full quadratic prediction models were generated based on the experimental results and they were examined for their validity and efficiency in predicting the response of the main cutting force and surface roughness of the machined graphene-reinforced composite aluminum. The NSGA-II algorithm was finally applied for simultaneously minimizing the main cutting force and surface roughness by providing a well-spread Pareto front of non-dominated solutions. The results indicated that the feed rate was the dominant parameter affecting both objectives, namely the main cutting force and surface roughness, while the NSGA-II algorithm was capable of delivering advantageous solutions for enhancing machinability with less than 10% error predictions when comparing simulated and actual machining results.

1. Introduction

Ongoing customers’ needs for functional, reliable and high-strength products impose the development of lightweight materials. These materials are characterized by their low density and enhanced mechanical properties to meet the requirements of various industrial sectors such as automotive, aerospace and electronics. Mechanical properties of lightweight materials may be mentioned depending on the material under question. Aluminum (Al) and its alloys exhibit excellent strength, ductility, rigidity and corrosion resistance. Al is a good heat and electricity conductor. Magnesium (Mg) and its alloys is also a lightweight material with beneficial properties like Al and Ti. Mg exhibits strength, good ductility, low density, corrosion resistance and high resilience. Ti and its alloys exhibit low thermal conductivity, good strength-to-weight ratio, etc.
In line with the development of reinforced polymer composites [1,2] Al matrix composites using a variety of additives have also drawn the research interest for enhancing mechanical properties of low-density, high-modulus and high-strength functional engineering components. Al matrix-reinforced composites aim to improve properties such as tensile strength while maintaining adequate ductility [3]. Even though additives in Al matrix with emphasis to high ceramic particle contents are preferred for improving the properties of Al composites, a considerable disadvantage related to poor ductility is indicated that tends to make the material prone to premature fatigue and failure [4,5,6]. Additives examined for enhancing mechanical, thermal, electrical and tribological properties of aluminum matrix composites are Cu-coated bimodal ceramics [7], Al 2024-SiC metal matrix composites [8], Al-4.5wt% Cu and SiC-reinforced Al [9,10], Al with Mg rich phases [11], AlSi10Mg [12] and graphene nanoplatelets (GNPs) to mention a few [13,14,15].
As a reasonable side effect of the development of metallic and non-metallic reinforced composites, an increased research demand concerning their machinability aspects is observed so as to end up with profitable cutting parameters that will favor productivity and quality [16]. El-Ghaoui et al. [17] examined the effects of graphene-filled matrix on the machinability of glass-fiber-reinforced (GFRP) composite. One of their major findings was that maintaining a low graphene content, i.e., 1wt% machinability of GFRP is improved owing to the increased thermal conductivity and reduced the cutting force components. Along with the cutting force reduction, the surface roughness was also found at lower levels. Nasr et al. [18] investigated experimental samples of Ti6Al4V matrix-reinforced nanocomposites with varying graphene contents; 0 wt%, 0.6 wt% and 1.2 wt% by determining different speed, feed and axial cutting depth levels in milling. Their research was conducted in terms of cutting force, surface roughness, micro hardness and chip morphology. They observed that despite the material’s high hardness, the 0.3 wt% GNPs/Ti6Al4V nanocomposite exhibited lower cutting forces compared to those reported for the base material, Ti6Al4V. Yu et al. [19] examined machinability aspects of graphene-reinforced Al metal matrix composites during micro-machining by implementing the finite element method. In their work, a 3D modeling module based on Python programming language was created to accurately simulate the cutting mechanism along with the magnitudes of cutting forces, which were verified by conducting actual experiments. They compared their findings with those obtained by performing actual cutting tryouts. Based on the literature presented above, low contents of additives are mainly preferred so as to balance the existence of improved properties of base materials and material degradation from different engineering perspectives such as crack propagation [20].
A limited domain of well-established optimization methodologies is also notable concerning the optimization of process-related parameters with reference to different performance criteria. In [21], a set of supervised machine learning algorithms were employed for simultaneously predicting material removal rate and surface roughness during dry turning of graphene-based Al metal matrix composite using a polycrystalline diamond carbide cutting insert. Design of experiments was initially established to obtain a dataset referring to results dealing with the material removal rate and surface roughness having the cutting speed, feed rate and depth of cut as the independent variables. Thereby regression models were obtained by applying neural networks, random forest regression, decision tree regression and light gradient boost regression. As a general outcome of this work, the improvement of both performance criteria, material removal rate and surface roughness was reported. As far as the most advantageous machine learning regression algorithm is concerned, the authors reported the random forest regression algorithm. In [22], the Gray-relational analysis was implemented to optimize the independent process parameters: cutting speed, feed rate and depth of cut when dry turning three hybrid composites, namely Al7075-10%SiC-0.1%B4C, Al7075-10%SiC-0.1% Graphene and Al7075-10%SiC-0.1% carbon nanotubes (CNT). As performance criteria, the flank wear, crater wear, cutting force, surface roughness and cutting tool temperature were set. The cutting tools implemented were uncoated and diamond-like carbon coated carbide inserts.
This work examined the influence of the feed, peripheral (cutting) speed and cutting depth on the machinability attributes related to the surface roughness and main cutting force when turning graphene nanoplatelets (GNPs)-reinforced Al with 0.5 wt% graphene. The former criterion represents machining quality whereas the latter focuses on power consumption that directly affects manufacturing cost. Both criteria were examined for their simultaneous minimization. A custom response surface design of experiments derived from an L9 Taguchi orthogonal array design was established with low number of experiments to reduce experimental cost while successfully studying the independent parameter effects owing to curvature presence as a robust property of response surface methodology. Machinability aspects for both high-purity Al and composite material are discussed with reference to observations related to surface quality of machined specimens and chip morphology.
From the perspective of optimization efforts, the well-known non-dominated sorting genetic algorithm (NSGA-II) was applied to efficiently examine beneficial non-dominated solutions. The study takes advantage of NSGA-II special algorithmic operators to generate a uniformly distributed Pareto front of solutions.

2. Materials and Methods

2.1. Experimental Design

A custom central composite design of experiments (CCD) was established to design a continuous experimental domain. Preliminary experiments were conducted given the equipment available, technical constraints and tools, to determine a meaningful and feasible range of cutting conditions. It should be noted that during the establishment of experimental designs, issues such as preliminary testing and initial screening while maintaining minimal resources and cost should be considered. Should a design of experiments involve a low number of trials, insufficient predictability and model reliability may be experienced. The central composite design of experiments was formulated using Minitab® 17 by utilizing its embedded functions to transform an L9 Taguchi orthogonal array (OA) to a response surface design (RSM). The selection of CCD design was decided owing to its benefits referring to the minimal experimentation error, less-prone corruption in terms of the experimental error sources and the safe estimation of linear, interaction and curvilinear parameter effects with eight factorial points, four axial points and six center (star) points [23,24]. For the face-centered experimental design type implemented, the distance from the center of each cube face (factorial space) was a = 1 while the distance of factorial points from the center of experiments was d = 1.414. Table 1 tabulates the independent parameters accompanied with their experimental levels.

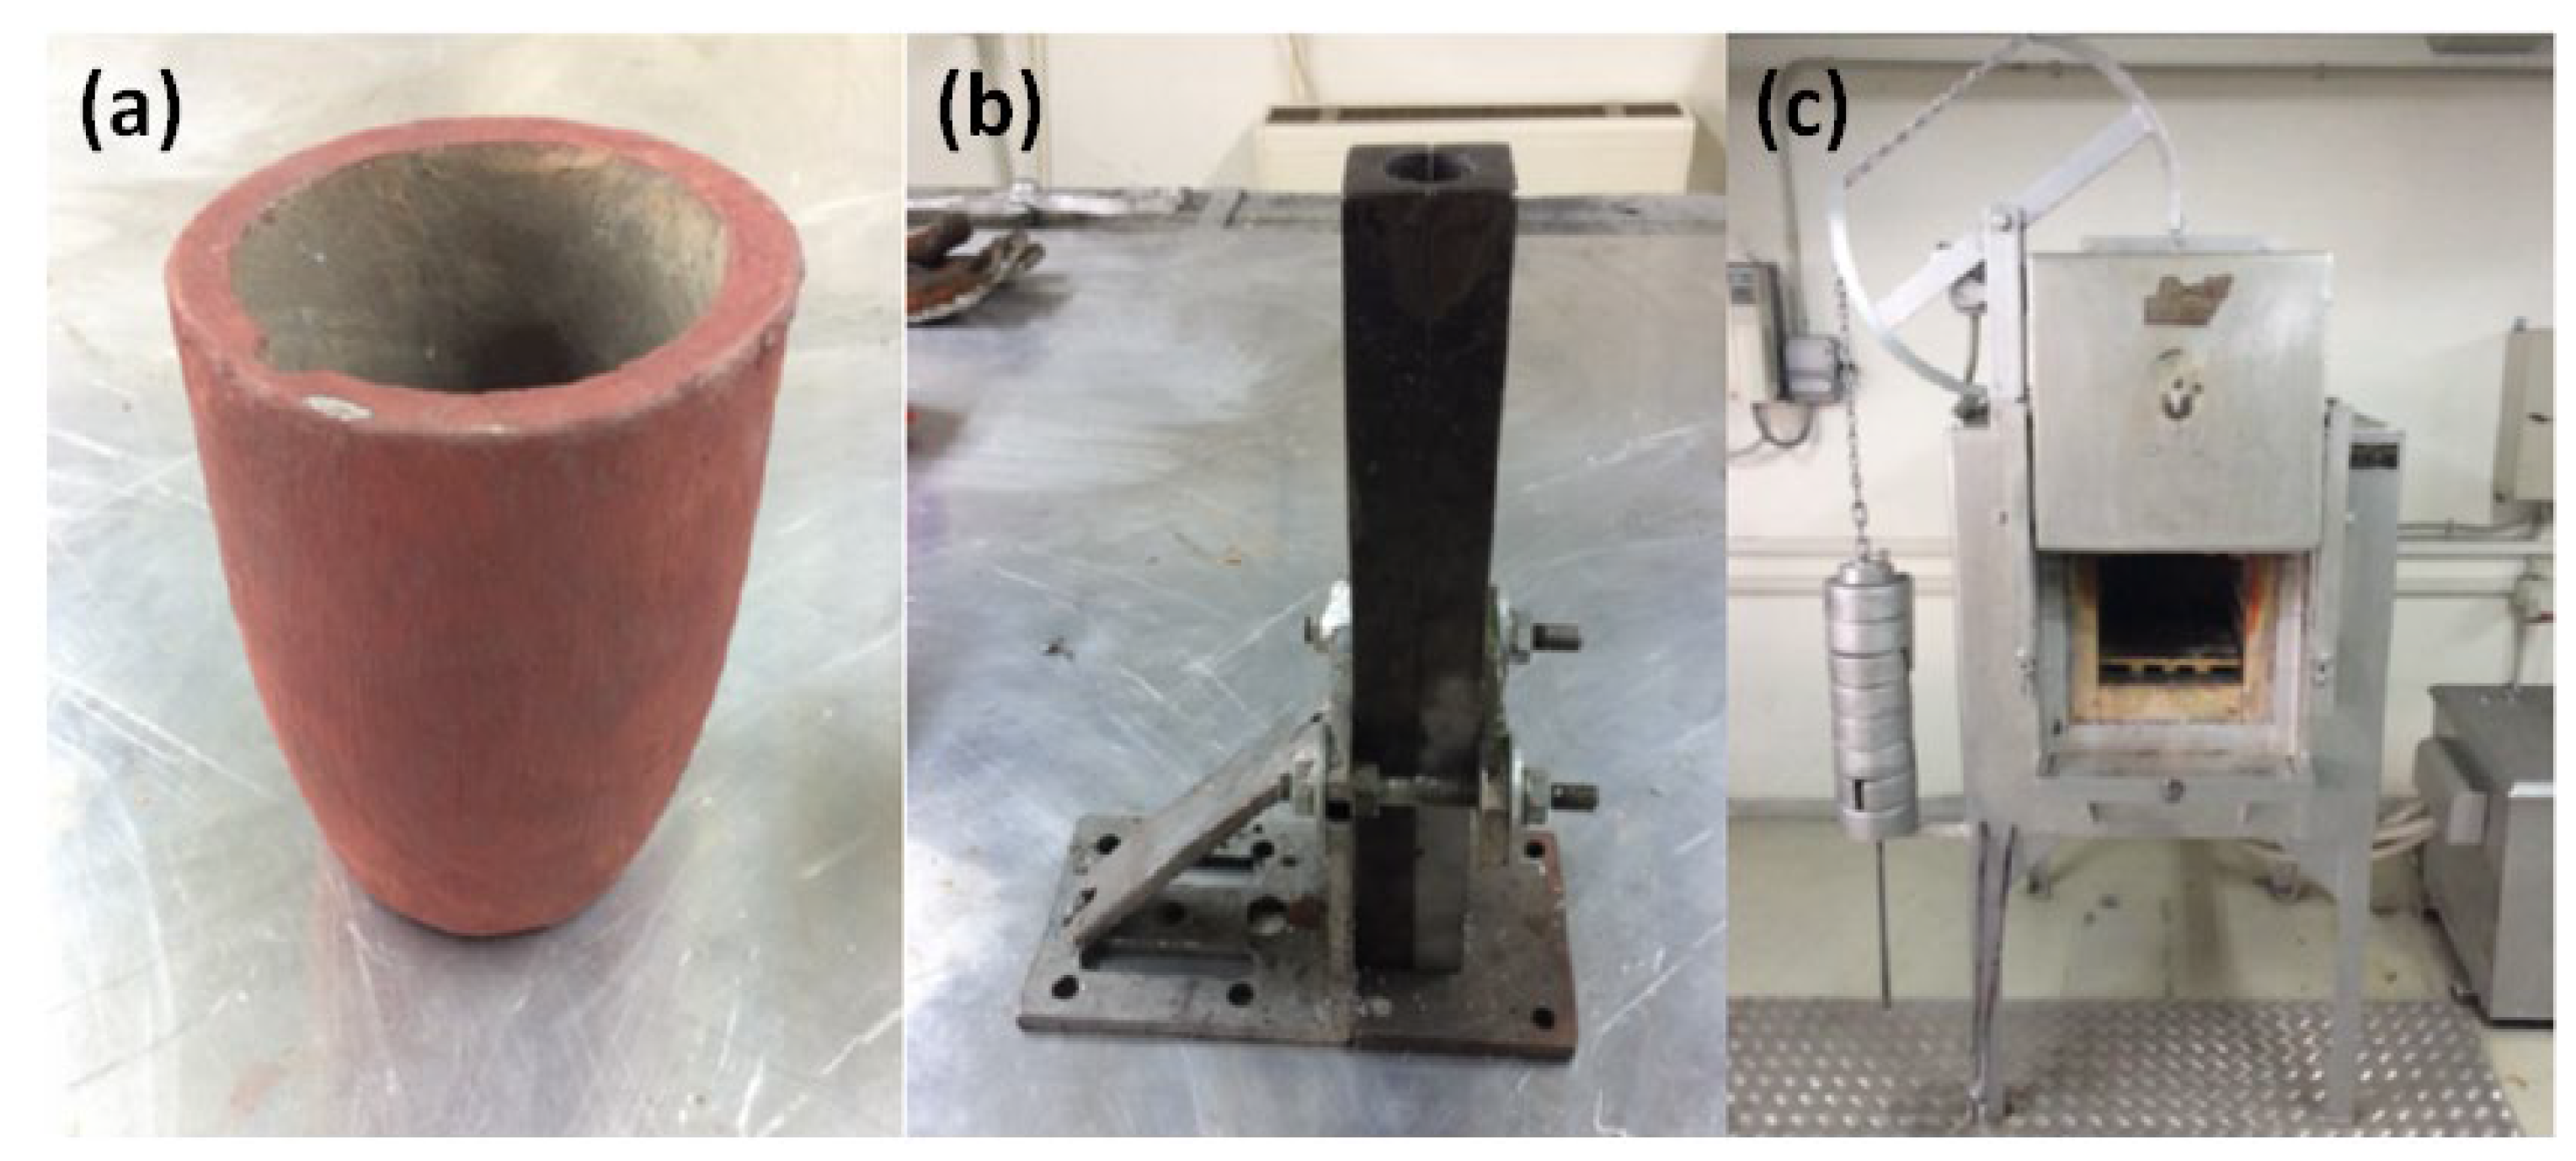
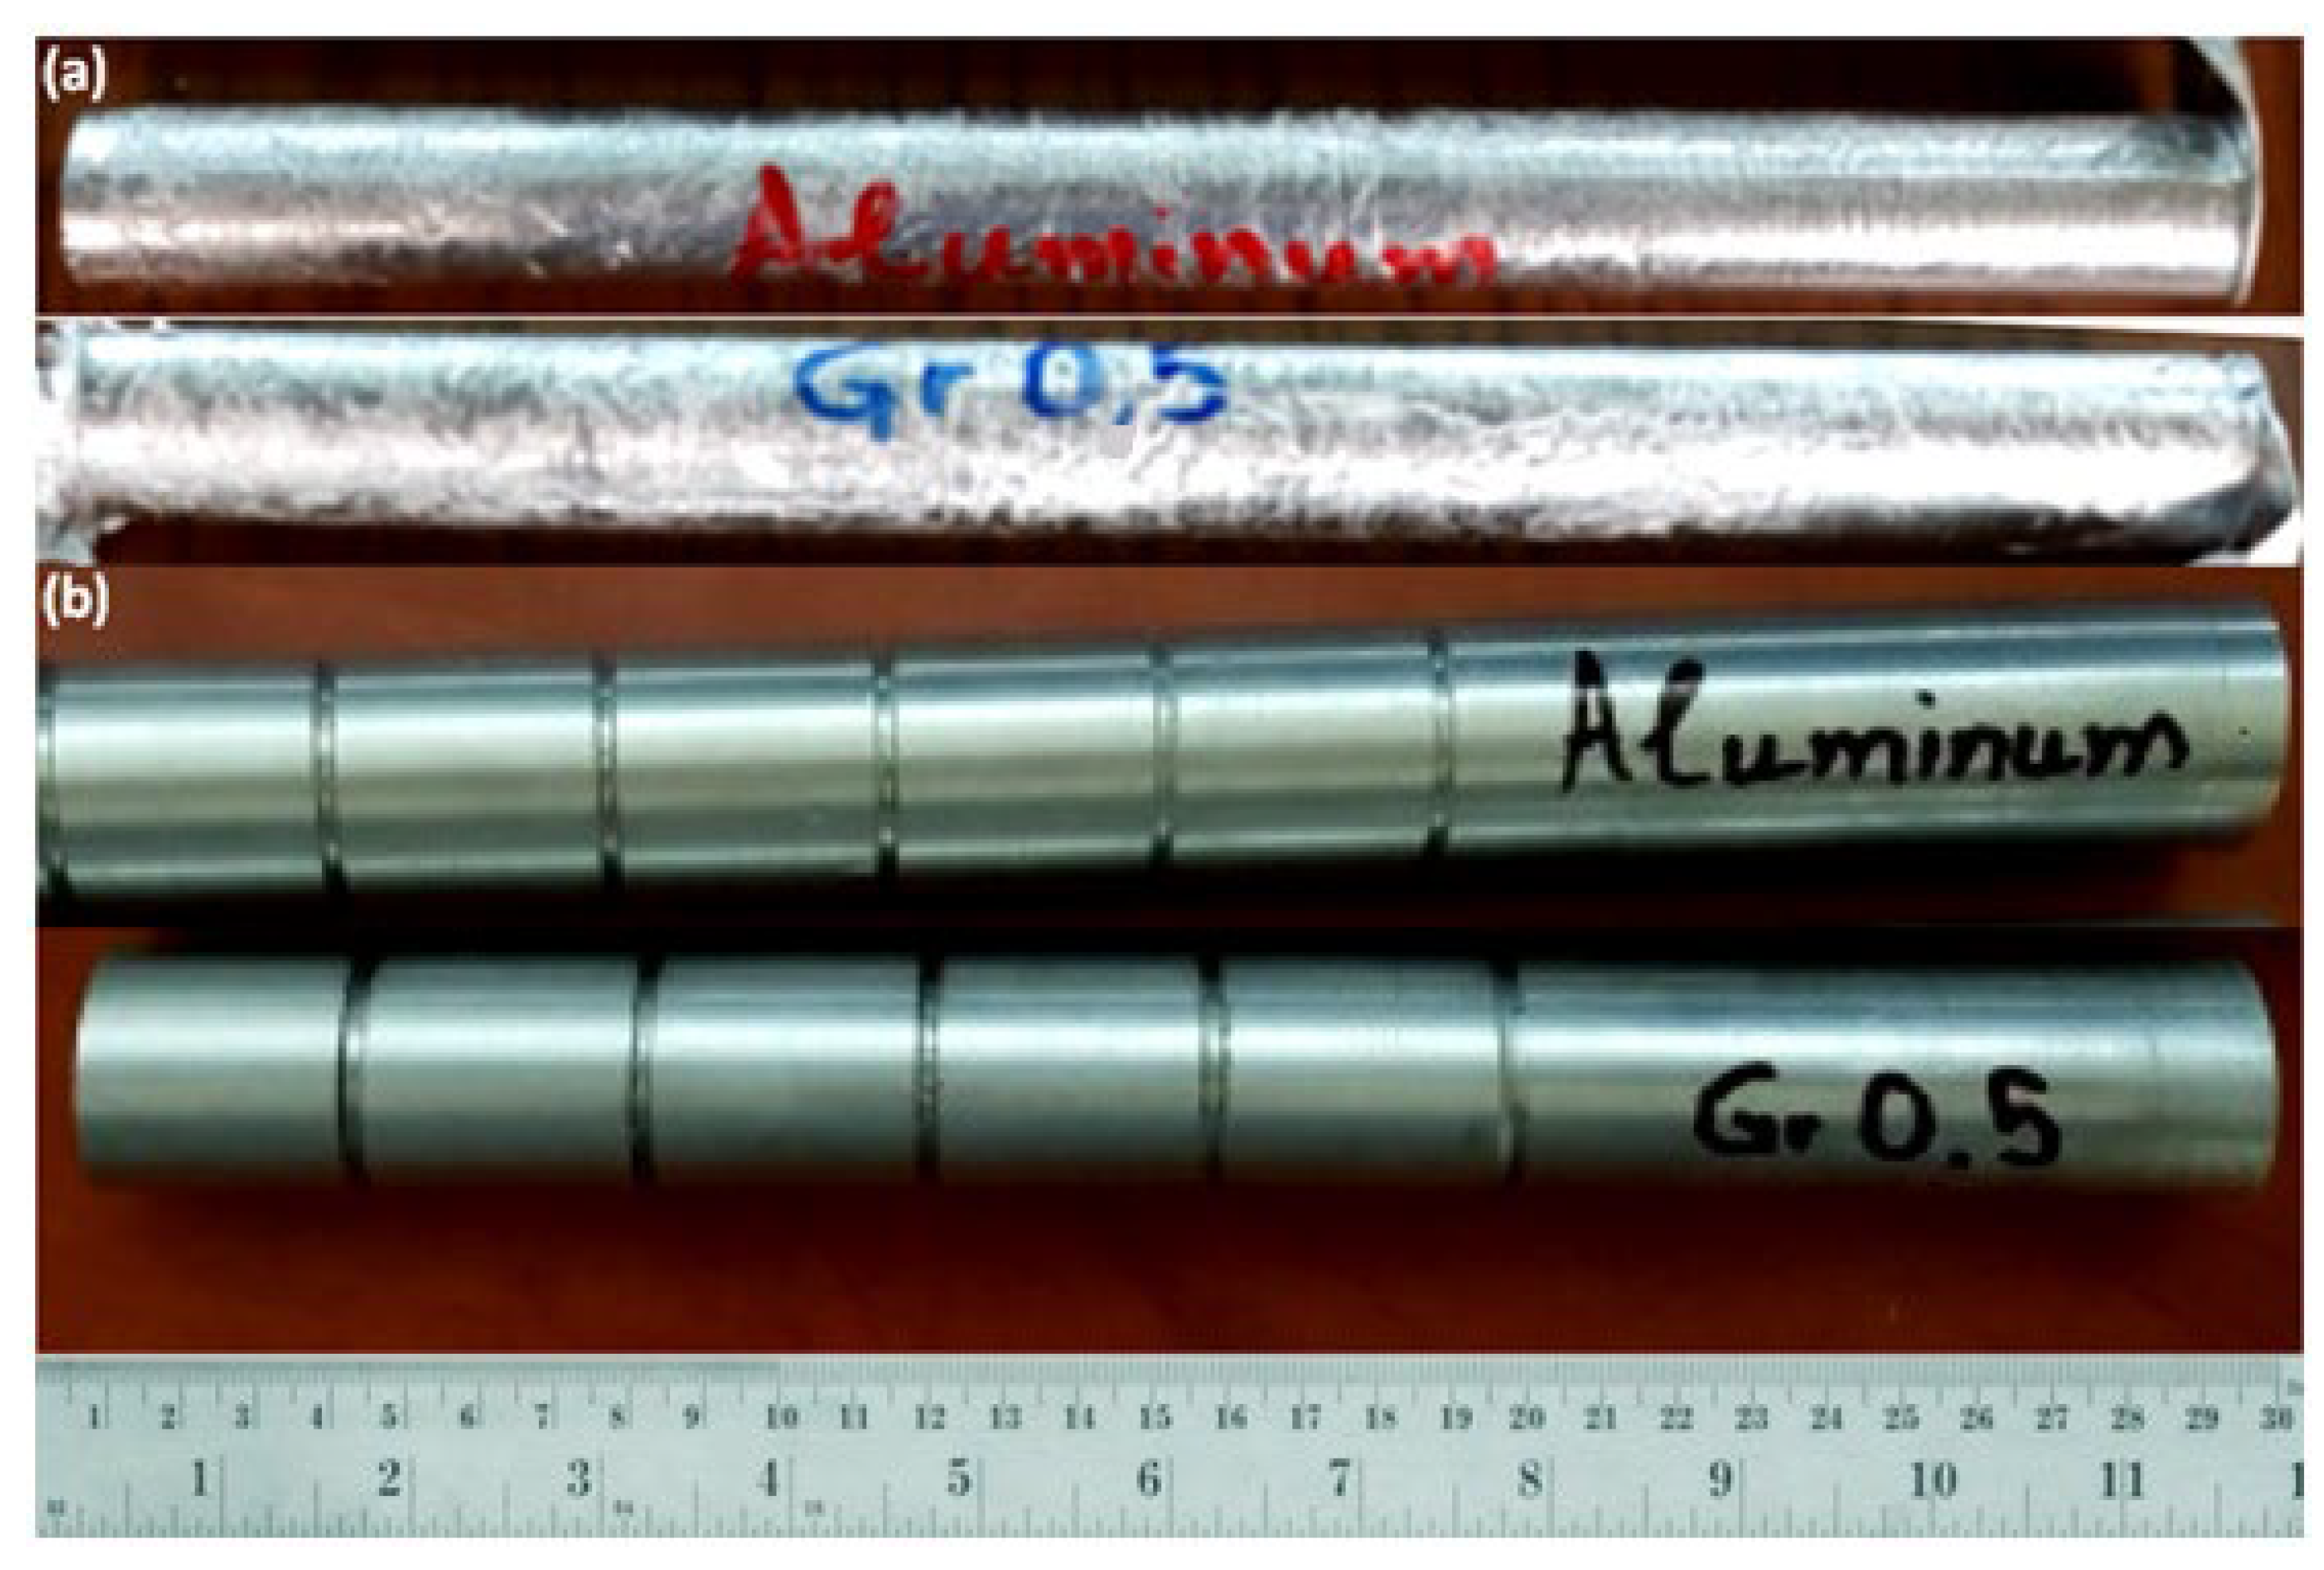
2.2. Workpiece Material Fabrication

As a workpiece material, high-purity Al was selected (Al 96.83%, Viohalco S.A., Maroussi, Greece) in the form of orthogonal billet: (Figure 1a) mixed with 500 m2/g graphene nanoplatelets-GNPs supplied by Alfa Aesar® S.A. (Waltham, MA, USA) (Figure 1b). To produce the composite, mixing was conducted through casting. Table 2 gives the spectrographic characterization of high-purity Al, provided by the vendor.
Casting process involved the heat of aluminum in a laboratory furnace at 750 °C with the use of a ceramic container. Prior to heat treatment, high-purity Al rectangular cross-section parts were washed and cleaned after sawing. Graphene nanoplatelets were weighted in a KERN® PCB 1000-1 precision electronic scale (Balingen-Frommern, Germany) and placed in a separate ceramic container. The steps followed to produce the composite material Al-Gr0.5% are bulleted below:
  • Placing a ceramic container with aluminum in the laboratory furnace,
  • Heating the laboratory furnace to 750 °C,
  • Liquefying aluminum and removal of oxides from the melt surface,
  • Aluminum casting into a preheated cylindrical mold at 100 °C using an electronic thermometer/heat-gun,
  • Adding graphene nanostructures (GNPs) and stirring,
  • Removing the split cylindrical mold after 3 min,
  • Cooling in free air at room temperature of 20 °C.
Figure 2 depicts the equipment used for producing the composite material Al-Gr0.5% (Figure 2a—ceramic vessel, Figure 2b—cylindrical splitted mold—Figure 2c laboratory furnace) whereas Figure 3 illustrates the additional devices adopted (Figure 3a—VEVOR® high precision infrared thermal camera, Figure 3b—glass container and Figure 3c—Graphene nanostructures /GNPs container).
Cylindrical experimental specimens (Ø25 mm, L = 300 mm) were produced using standard laboratory equipment involving furnace, casting equipment, ceramic containers, etc. For comparative analysis, two cylindrical rods were produced for each material category: two for examining high-purity Al as the reference material and two for assessing Al-Gr0.5% composite. All specimens were properly machined to reach the reference dimensions of Ø21 mm and L = 300 mm. The specimens were grooved to formulate five equidistant experimental cylindrical zones 35 mm in length, for facilitating observations and ease material removal. Figure 4a illustrates the rods prepared by casting whereas Figure 4b depicts the experimental rods roughed and finished until reaching the reference dimensions for diameter and length (Ø21 mm and L = 300 mm, respectively). Cylindrical rods were visually examined in terms of notable surface imperfections, whereas typical accuracy of cylindricity was tested using a dial indicator mounted to the CNC machine tool’s carrier to allow back and forth movements while slightly rotating the clamped specimens to check accuracy throughout the parts’ entire length of 300 mm.

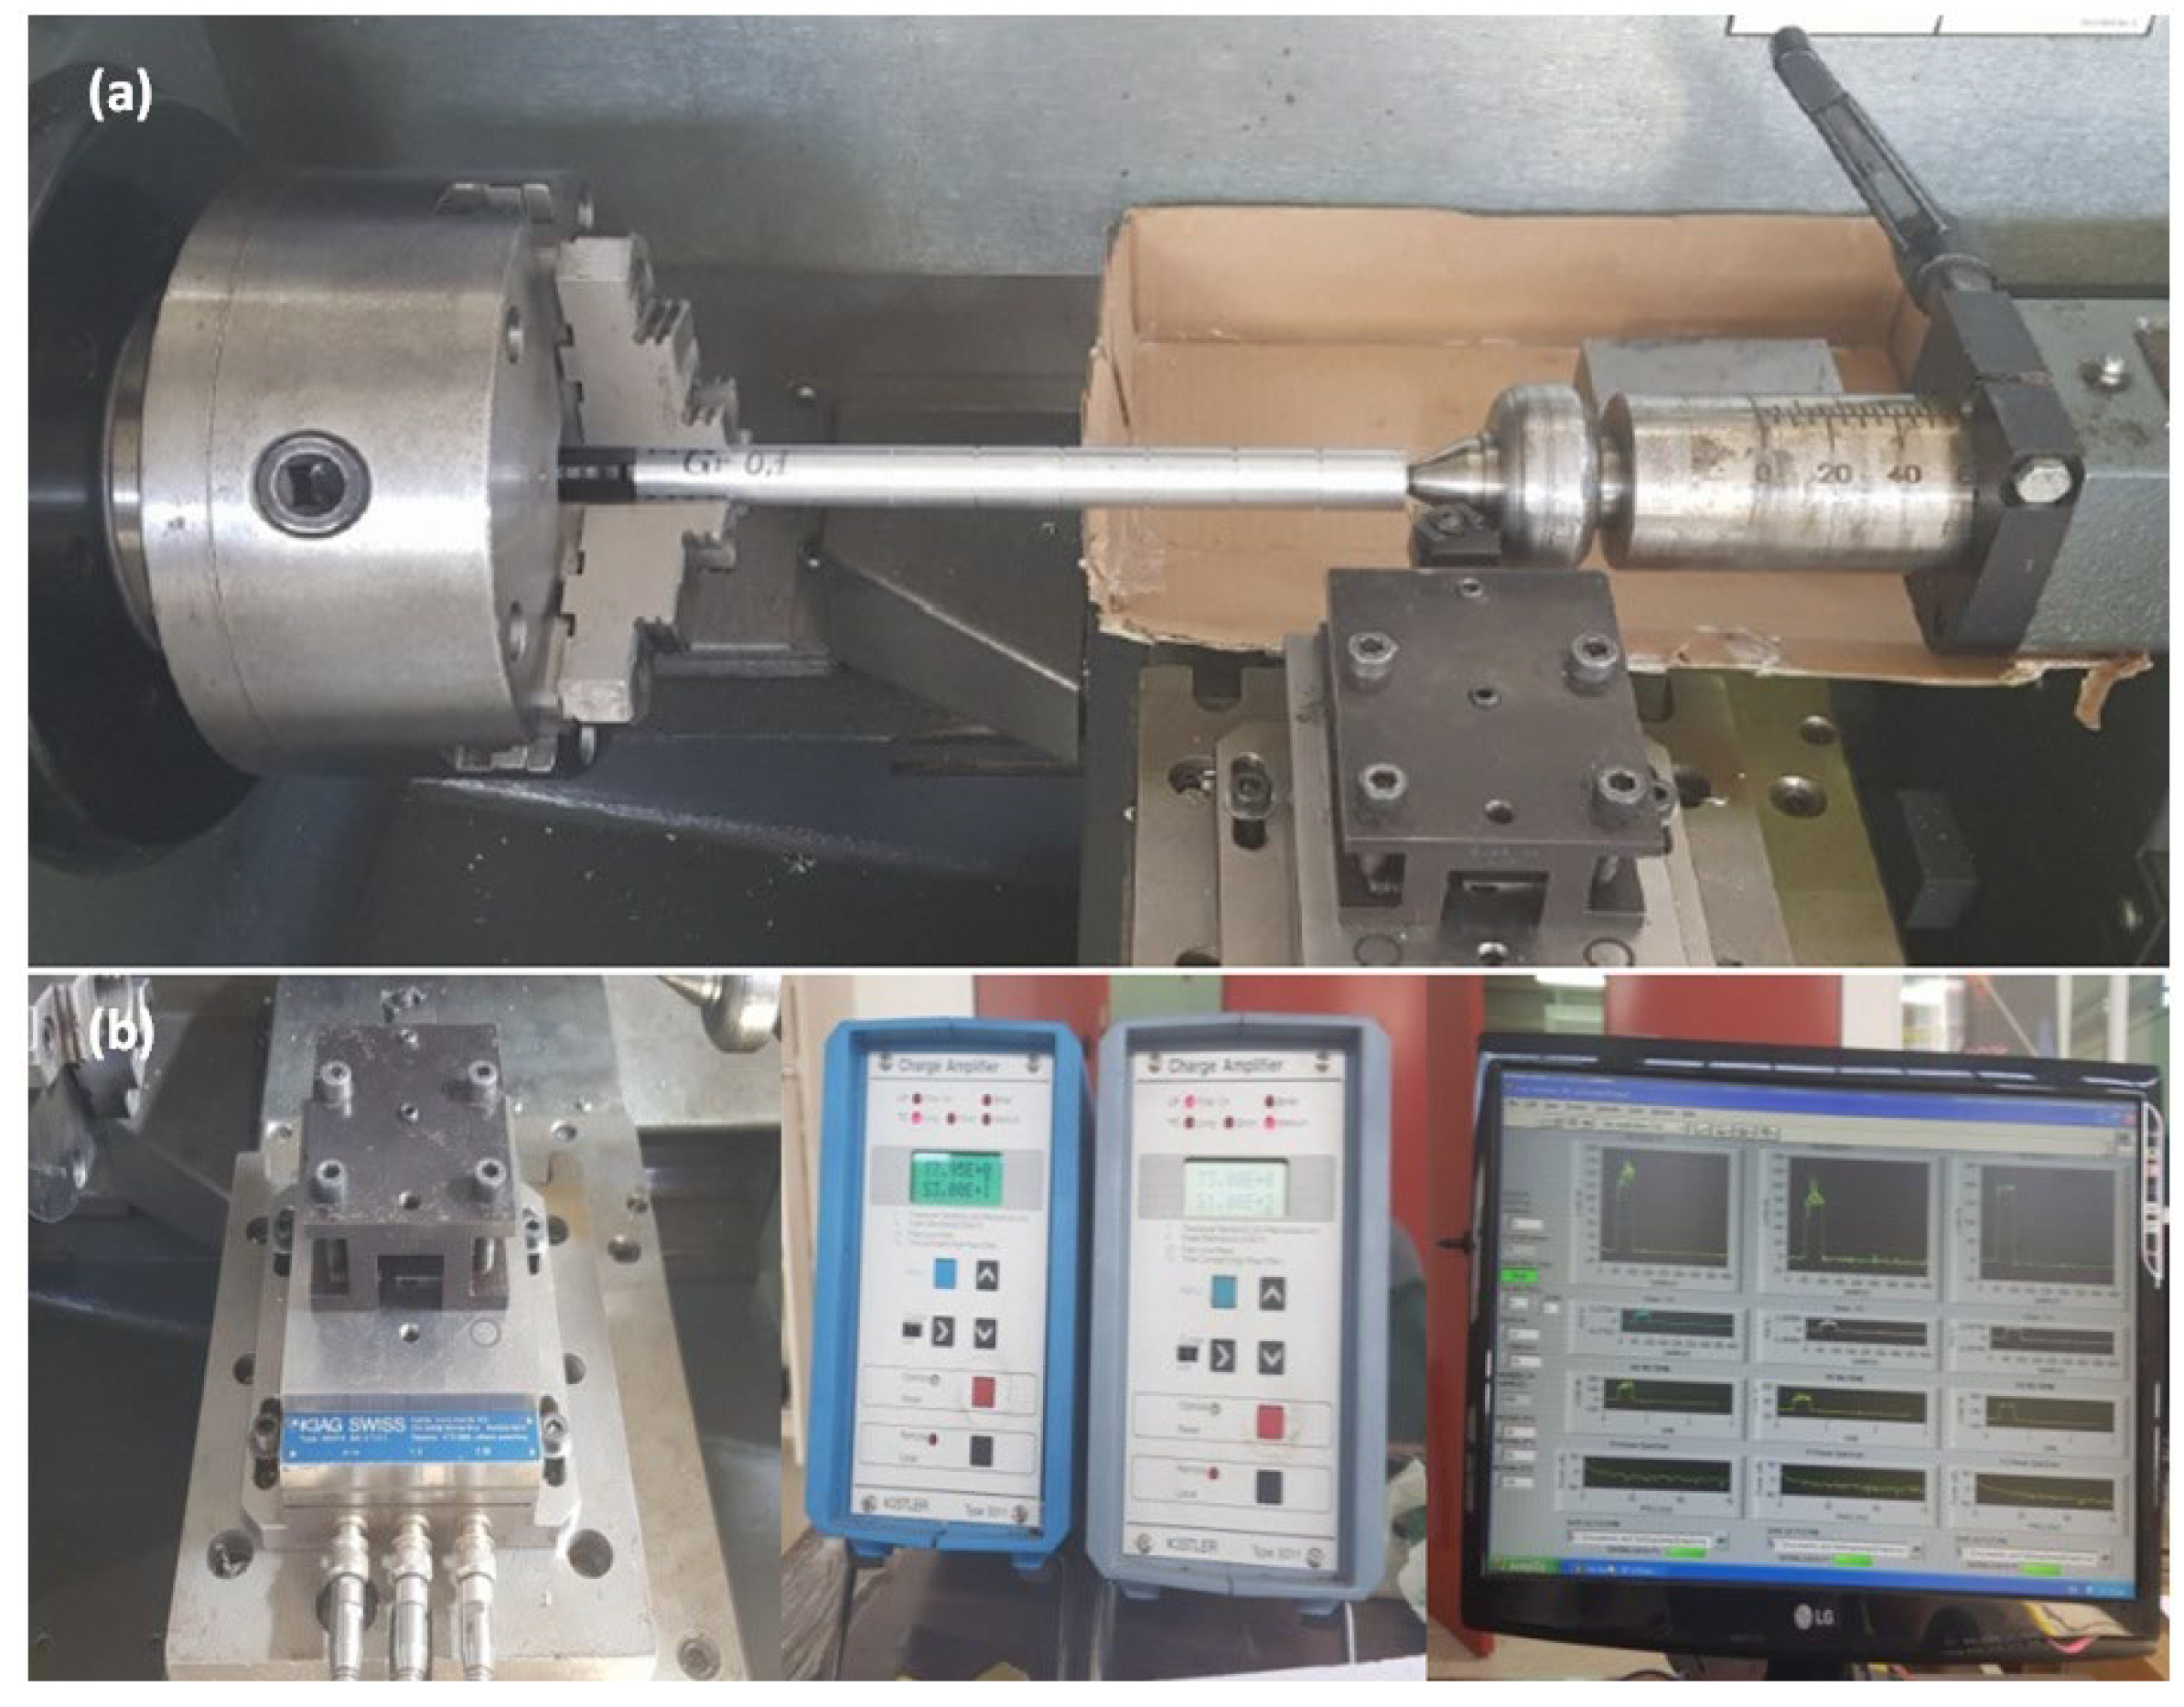
2.3. CNC Turning Set-Up and Measuring Equipment

A Seco® TNMG160404-MF2 TP200 (Fagersta, Sweden) CVD-coated carbide cutting insert was used for conducting the CNC turning experiments. The cutting insert was fixed on its corresponding tool holder MTJNR/L2020K16N (Fagersta, Sweden). Figure 5a shows the cutting insert specifications and Figure 5b illustrates the tool holder and cutting insert assembly.
Dry CNC turning experiments were conducted by employing a HAAS® TL-1 CNC turning center. Cutting forces were measured using the Kistler® 9257A three-component piezoelectric dynamometer accompanied with an analog cutting force charge amplifier; Kistler® type 5011 and data acquisition software LabView® 8.6 were used to gather online measurements during CNC turning. Figure 6a depicts the machining set-up and Figure 6b shows the cutting force measuring system implemented.
For each cutting experiment, the chips removed were collected for further examination to characterize the operation and analyze machinability. Surface roughness was measured using a Taylor Hobson® Surtronic 3+ portable roughness tester (Leicester, UK) with key specifications ±5% accuracy, 2% repeatability and automatic calibration.
The sample length (cut-off) for the roughness measurements was Lc = 0.8 mm. The results of these measurements were further processed using the Talysurf® software accompanying the Taylor Hobson® Surtronic 3+ portable roughness tester. Each of the experimental cylindrical regions was measured three times by rotating the sample 120°, while the mean result was computed to represent arithmetic surface roughness, Ra (μm).

3. Non-Dominated Sorting Genetic Algorithm II (NSGA-II)

A large number of intelligent algorithms have been implemented to constrain and unconstrain engineering optimization tasks where different aspects related to solution quality, convergence speed and space coverage vary based on an algorithm’s functions and operators. The NSGA-II algorithm [25,26] manages to deliver non-dominated Pareto optimal soluions by implementing intelligent operators responsible for preserving elite candidates duting generations evolution, avoiding early stopping owing to local stagnation and premature convergence through population diversity. As a population-based intelligent algorithm, NSGA-II firstly employs standard funstions for conducting selection, crossover (mating) and mutation to produce and handle the genetic material referring to candidate solutions. The algorithm further classifies individuals based on their dominance by performing the non-dominated sorting. NSGA-II enables the inspection and control of the locations of non-dominated solutions through crowding distance for provinding a dense Pareto front to the best possible extent. Thus, the distribution of optimal solutions is uniform based on the problem’s technical attributes. Dominant candidates produce the first Pareto front, and other fronts follow comprising less dominant candidates. The operation evolves until convergence or when stopping criteria are met. This procedure sustains diversity whereas the metric responsible to judge a Pareto front’s density among solutions is the crowding distance. Having several Pareto fronts in play, ranking is finally applied to distinguish the most advantageous non-dominated solutions to be presented in the Pareto front. Based on the properties and promising aspects of NSGA-II, the objectives of this research were accomplished; Fz and Ra were examined through the optimization of process parameter results in regard to Vc, f and α.
It should be mentioned that algorithm-specific parameters for programming the different operators controlling both swarm-based and evolutionary-based intelligent algorithms should be carefully determined for optimizing their performance and guarantee beneficial outputs to the best possible extent.

4. Results and Discussion

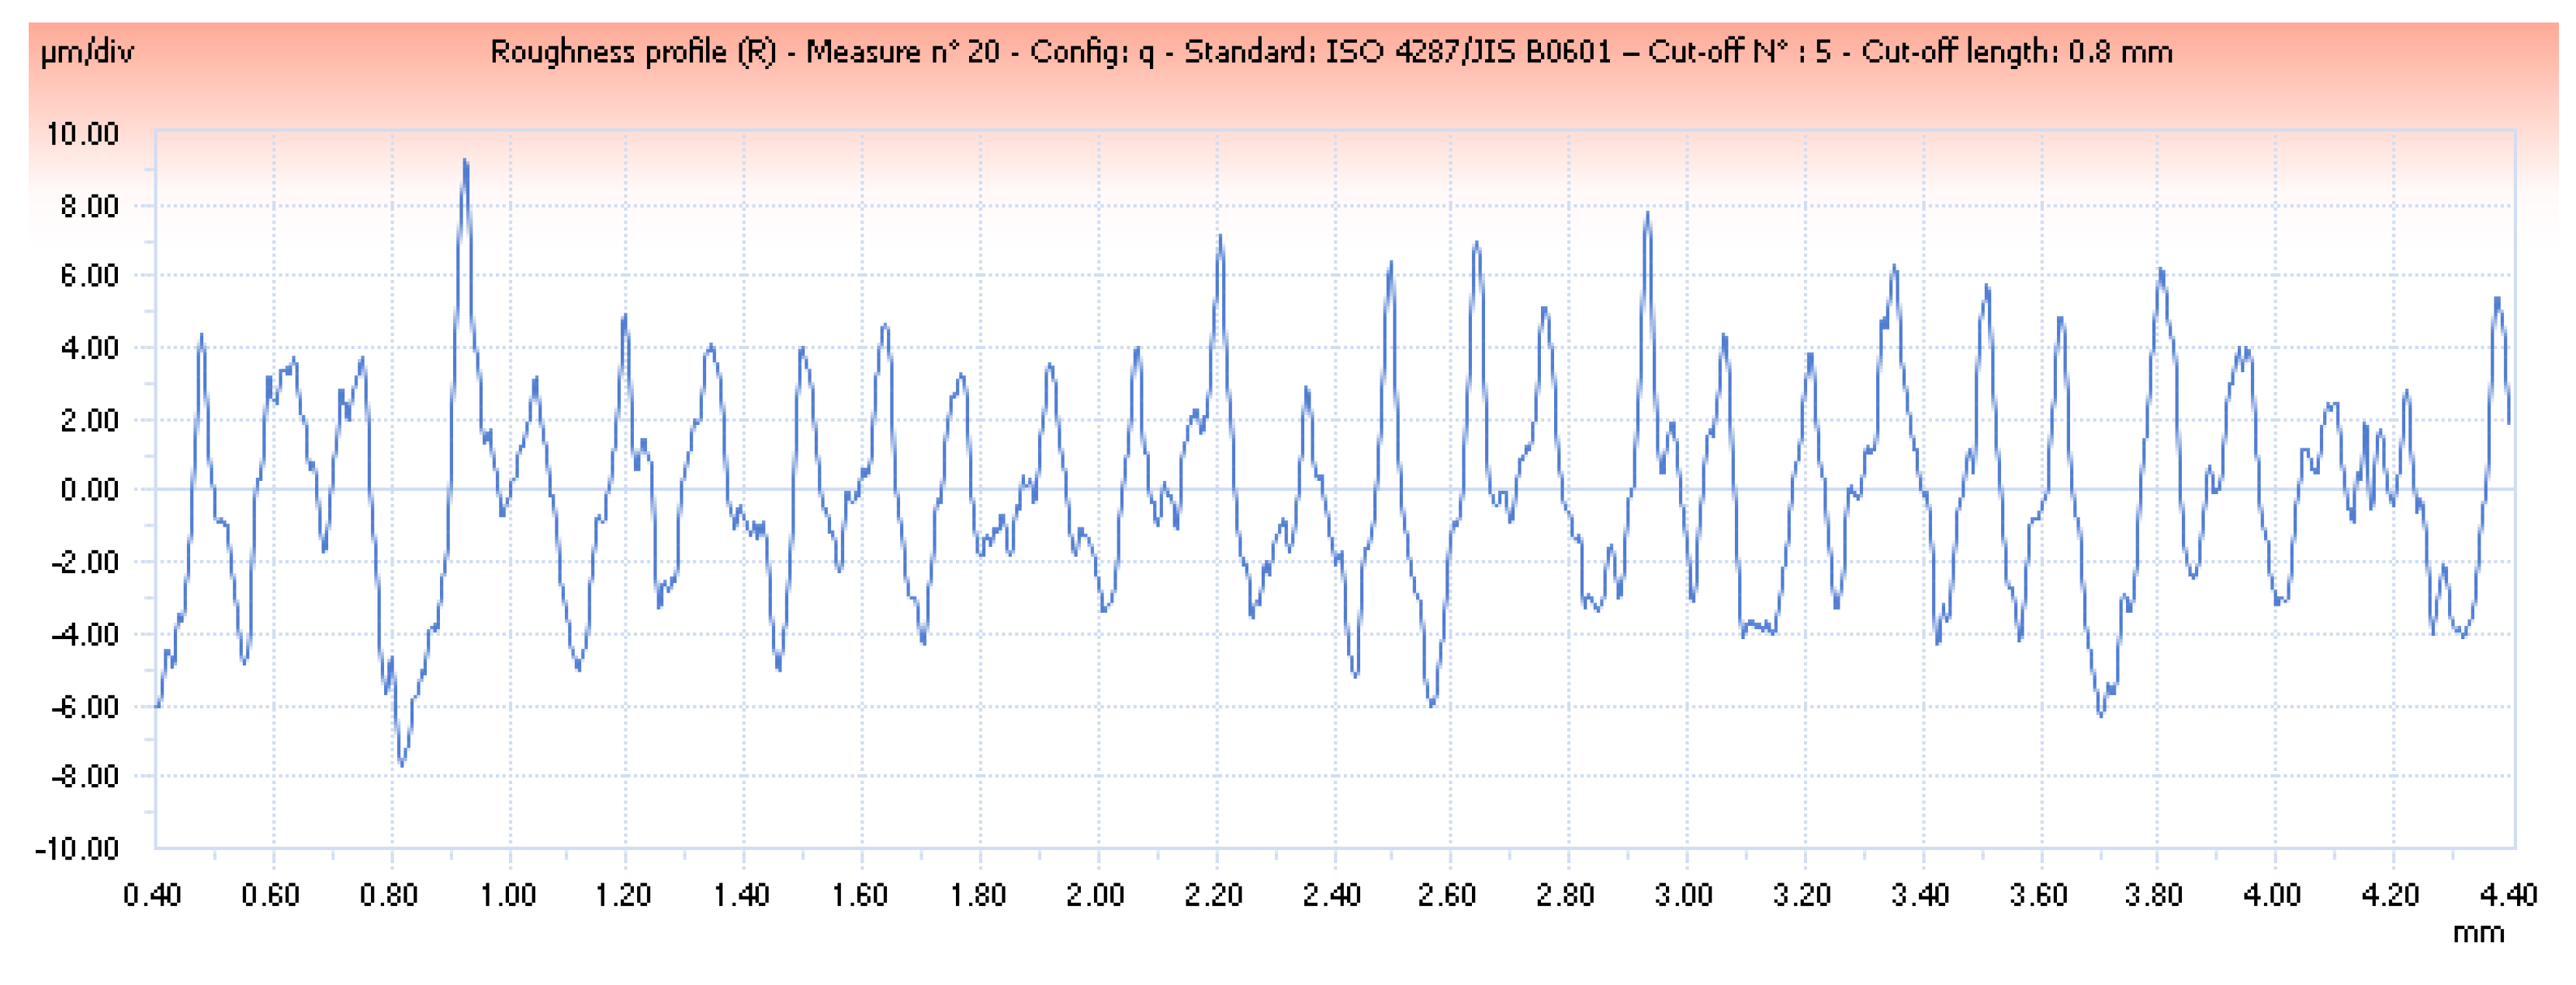
4.1. Experimental Results and Major Observations

With respect to the CCD experimental design presented, Table 3 summarizes the results for Fz and Ra responses, based on the series of experimental tryouts and the values corresponding to cutting conditions (independent parameters) referring to both materials, respectively.
Both materials exhibited their maximum value for main cutting force Fz, equal to 300.40 N and 287.80 N, respectively. These results were obtained at the third experimental run for both reference high-purity Al and Al-Gr0.5% composite. The lowest magnitudes for main cutting force were obtained at the first experimental run: Fz = 46.30 N and Fz = 37.90 N for reference high-purity Al and Al-Gr0.5% composite, respectively. Maximum values regarding surface roughness were reported to the same experimental run (third experiment) with Ra = 11.80 μm and 17.00 μm for high-purity Al and Al-Gr0.5% composite, respectively. As far as surface roughness R was concerned, the lowest resulting value was obtained for Vc equal to 120 m/min, f equal to 0.10 mm/rev and a= 0.75 mm referring to the reference material (eighth experiment) while the advantageous cutting parameter values for Al-Gr0.5% composite were Vc = 60 m/min, f = 0.10 mm/rev and α = 0.50 mm. By looking at the results for Fz and Ra, a clear trade-off was observed that justifies further examination for specifying a parameter range that will maintain improved surface finish and low cutting power consumption through low cutting force magnitude. Figure 7 depicts the plot of main effects on Fz response, whereas Figure 8a,b illustrate the effects for cutting parameters on Ra (μm) referring to high-purity Al (reference material) and Al-Gr0.5% composite, respectively.
Feed rate, f (mm/rev), holds a dominant effect on main cutting force, Fz (N), followed by depth of cut, α (mm), and cutting speed, Vc (m/min). On the contrary, significant variations shown for the cutting parameters while examining the surface roughness Ra (μm) are indicated by the main effects plots. It is evident that the feed rate f (mm/rev) has a major effect on the surface roughness variation with emphasis to its moderate and high levels for both materials. In addition, a notable difference was observed in terms of the aforementioned levels. For high-purity Al, Ra was significantly increased at the second level with a slight decrease at the highest level. This observation is also noted for Ra when turning Al-Gr0.5% composite material; however, the surface roughness further increased until its maximum value was reached at the highest level. The main effects plot corresponding to the main cutting force Fz suggests that moderate cutting speeds, i.e., Vc = 90 m/min, maintain the main cutting force Fz at relatively low magnitudes for both materials examined. Feed rate f and depth of cut α should be determined using low parameter values for reducing cutting force.
Both materials (high-purity Al and composite aluminum Al-Gr0.5%) exhibited notable presence of built-up edge (BUE) during dry cutting. A built-up edge was mainly observed for experiments conducted using low cutting speed and high feed rate. Figure 9a illustrates the built-up edge on the tool tip. Obviously, the built-up edge was experienced owing to the ductility of Al. Surface quality was further degraded owing to the adhesion of BUE fragments on the parts’ turned surfaces (Figure 9b).
Additional machinability indications were derived by examining the chip morphology with reference to cutting conditions and the selected graphene content of 0.5% having the high-purity Al as matrix material. Compared to high-purity Al (reference material’s) continuous and helical-type chips, Al-Gr0.5% produces discontinuous spiral-type chips due to the change of angle of shear plane as Al’s ductility decreases with the graphene nanostructures content. This observation leads to the assumption that by increasing the graphene nanoplatelets (GNPs) content, the chips’ magnitude decreases owing to their increased brittleness. Figure 10 depicts the chips obtained by setting cutting speed Vc equal to 120 m/min, feed rate f 0.1 mm/rev and depth of cut α 0.75 mm. Figure 10a illustrates the chips corresponding to the reference material (high-purity Al) while Figure 10b shows the chips obtained for Al-Gr0.5% composite.
For the different cutting parameter settings, different chip morphology was observed during the experimental tryouts referring to Al-Gr0.5% composite. Figure 11 depicts segments of chips collected after conducting the seventh experiment when setting the cutting speed Vc = 120 m/min, feed rate f = 0.3 mm/rev and depth of cut, α = 0.5 mm for high-purity Al (Figure 11a) and Al-Gr0.5% composite (Figure 11b).

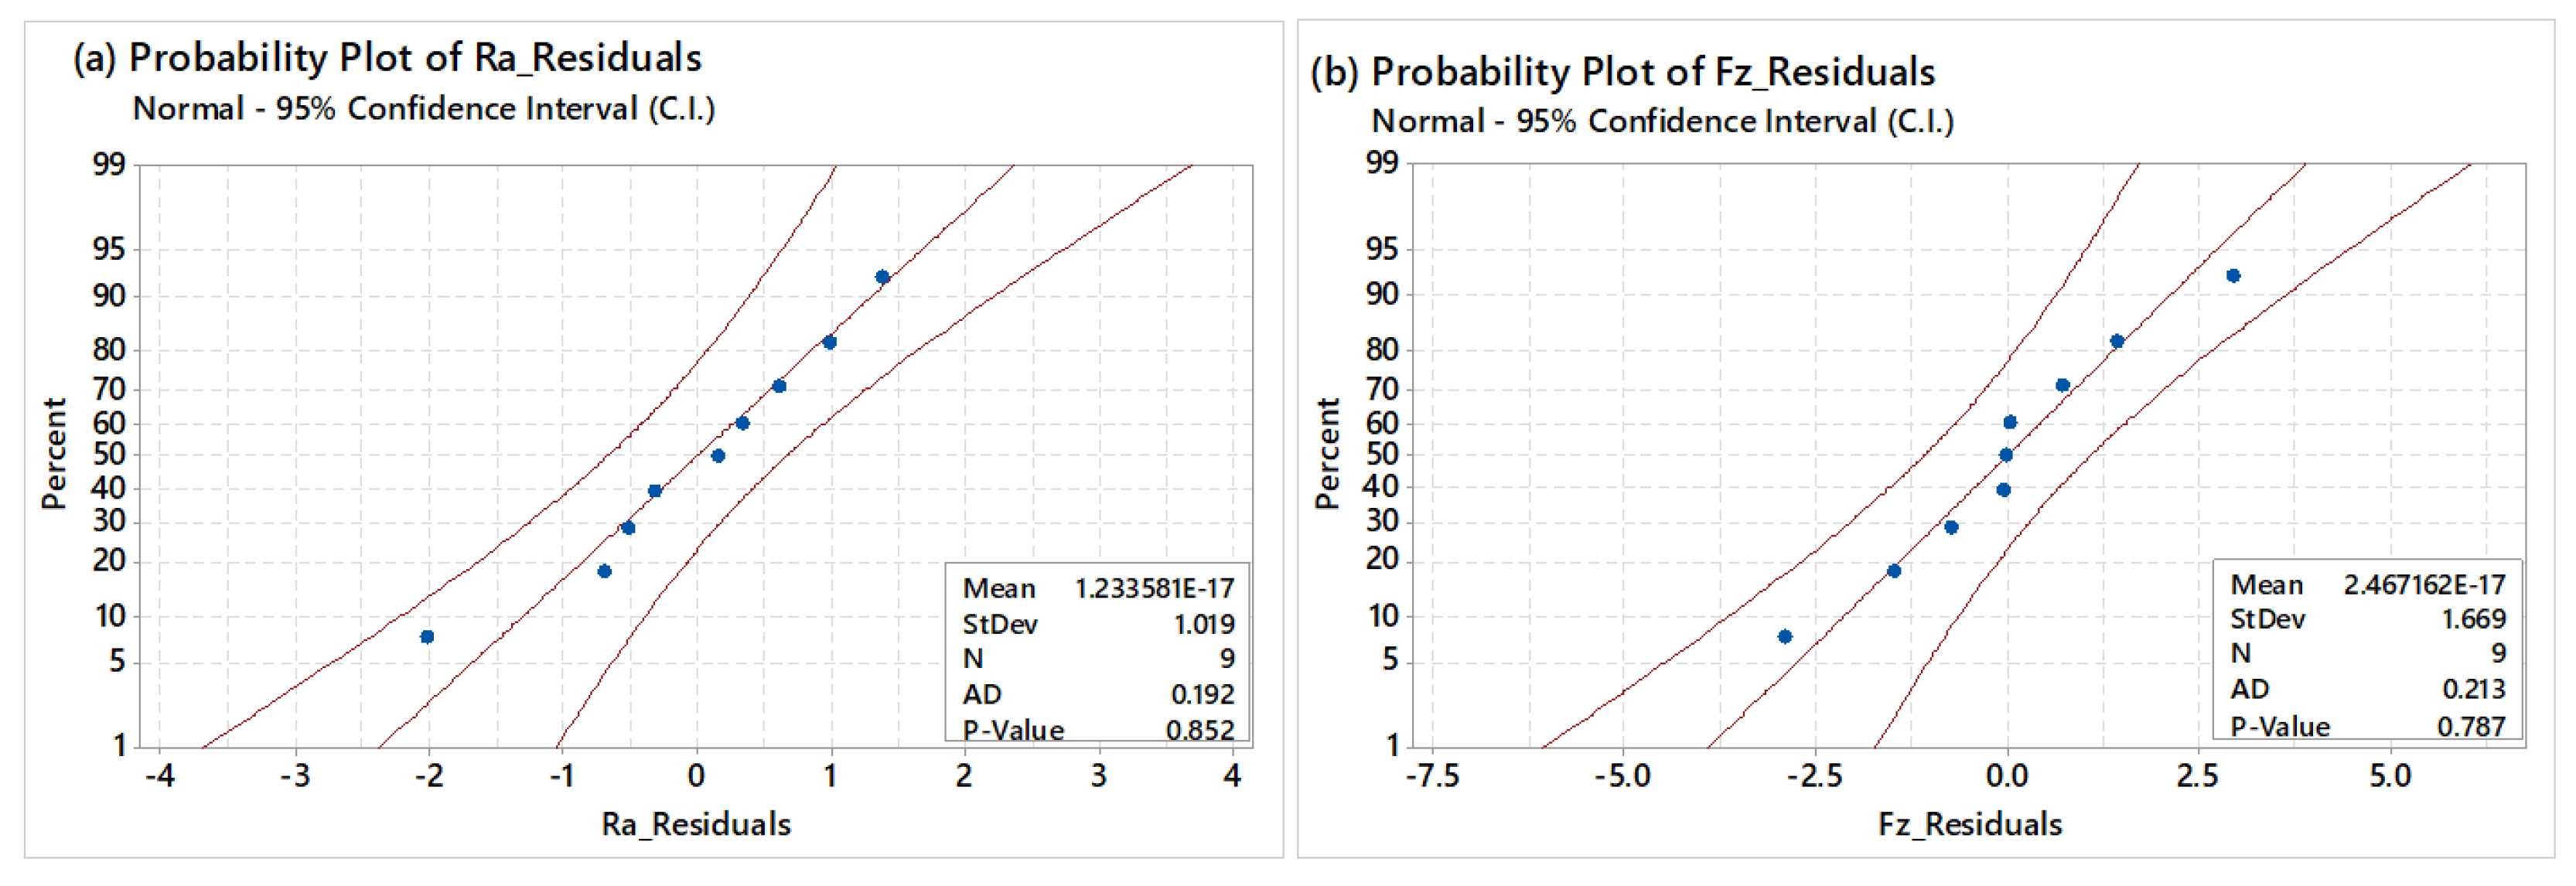
4.2. Analysis of Variance and Response Surface Regression

Additional analysis of the cutting parameter effects was conducted for the material under interest: the Al-Gr0.5%. The machinability variables under interest, Fz and Ra, were investigated through regression second-order full quadratic regression analysis to achieve a reliable correlation among independent variables (cutting conditions) and responses. Full quadratic regression modeling allows for the interactive trend of the process parameters to be simultaneously examined in terms of their combinatorial influence on the selected responses. Figure 12a depicts the interactions among the different levels of the cutting parameters. The high nonlinearity of the problem is clearly presented in the contour plots accompanying the study. Figure 12b illustrates the influence of Vc and f. It is clear that the main cutting force is reduced if setting low feed rates: i.e., 0.1 mm/rev to 0.17 mm/rev under different cutting speed levels. However, a cutting speed range between 60 and 90 m/min seems to be beneficial referring to Al-Gr0.5% composite and the cutting insert employed. Figure 12c shows the influence of Vc and α. With reference to the graph’s colored scale, it is shown that Fz is kept to low levels when operating within a range specified between 60 mm/rev and 100 mm/min for the cutting speed, provided that the depth of cut is to be set with a value between 0.5 mm and 0.7 mm. There is also an advantageous region for reducing cutting force Fz, if the depth of cut is set to a value between 0.6 mm and 0.8 mm when operating with a cutting speed from 115 m/min to 120 m/min. The same observation for lowering the cutting force applies when a cutting speed value between 75 m/min and 110 m/min is used with a depth of cut equal to 1.0 mm. Figure 12d depicts the synergistic effect between feed rate f (mm/rev) and depth of cut α (mm) in the corresponding contour plot. It is clear that a reduced magnitude of main cutting force Fz is obtained for almost the entire experimental range of the depth of cut (0.5 mm to 1.0 mm) when setting a low-to-moderate feed rate (i.e., 0.1 mm/rev to approximately 0.18 mm/rev.
For the interaction effects referring to surface roughness Ra, Figure 13 summarizes the results concerning the interactions among the parameter levels and the effects among the pairs of cutting parameters: Vc × f, Vc × α and f × α. It can be seen that similar findings to those for main cutting force Fz suggest a highly non-linear relation with reference to the experimental levels set for conducting the experiments. Figure 13a illustrates the interactions among the cutting parameters’ pairs. It is observed that profound interactions are found between the experimental levels of cutting speed Vc and depth of cut α, as well as feed rate f and depth of cut, α. The interaction effects of Vc and f levels are shown in Figure 13b. Indications reveal that beneficial results for the surface roughness are obtained by setting low feeds (i.e., 0.10 mm/rev to 0.15 mm/rev) while choosing any value for the cutting speed between 60 and 120 m/min. The contour plot depicted in Figure 13c shows the interaction effect between the cutting speed and depth of cut where advantageous results for the surface roughness are obtained when setting values for the cutting speed between 85 m/min and 120 m/min if the depth of cut is determined within an operational range between 0.6 to 1.00 mm. Low-to-moderate levels for both cutting parameters Vc and α seem to be also beneficial for maintaining low surface roughness. The contour plot referring to the synergistic effect between the feed rate and depth of cut (Figure 13d) indicates that Ra is minimized when setting different values for the cutting depth, but the feed rate should be specified using low and moderate levels, i.e., 0.10 mm/rev and 0.12 mm/rev. Nevertheless, the plot indicates obvious fluctuations concerning the colored regions where the response under question is facilitated.
Figure 14 depicts the resulting contour plots of the interaction effects of Fz for high-purity Al. The general observation suggests that a graphene content of 0.5 wt% does not seem to increase Fz when compared to the analogous results referring to Al-Gr0.5 composite material examined in the study. By observing Figure 14a, the interactions among the levels of the process parameters yield quite similar effects as in the case of Al-Gr0.5%. Figure 14b depicts the effect of cutting speed Vc and feed rate f on the main cutting force. Obviously, Fz remains at low levels for all cutting speed values; however, the feed rate range should be determined using a setting between 0.10 and 0.18 mm/rev. Figure 14c shows the synergistic effect between Vc and α. Given the graph’s colored regions, it is observed that cutting force Fz remains low when setting a value for Vc between 60 and 80 m/min, but the depth of cut should be set to 0.5 to 0.6 mm at maximum. There are also beneficial regions for reducing cutting force Fz, if the depth of cut is set to a value among 0.6 mm and 0.8 mm when operating with high cutting speed, i.e., 120 m/min. The same observation for lowering the cutting force applies when a cutting speed value between 85 m/min and 95 m/min is used with depth of cut equal to 1.0 mm. Figure 14d depicts the synergistic effect between f (mm/rev) and α (mm). According to the indications, it is obvious that Fz is reduced for the entire experimental parameter range referring to the depth of cut, but the feed rate should be maintained at low levels (i.e., 0.1 mm/rev to approximately 0.18 mm/rev).
Figure 15 depicts the interactions and resulting contour plots of the synergistic effects for the objective of the surface roughness (μm) in the case of high-purity Al. Figure 15a depicts the interaction effects among the levels set for the machining of high-purity aluminum. It can be seen that clear difference is observed comparing Figure 13a and Figure 15a. Figure 15b illustrates the effect of Vc and f. It is indicated that advantageous surface roughness results can be delivered by determining a value equal to 0.10 mm/rev or 0.15 mm/rev for feed while the cutting speed should be specified between 60 and 120 m/min as in the case of Al-Gr0.5%. The combinatorial effect concerning cutting speed and depth of cut is illustrated in Figure 15c where indications suggest that surface roughness is reduced when setting moderate-to-high levels for depth of cut: 0.6 to 0.85 mm; but the cutting speed should be high enough. Figure 15d shows the contour plot concerning the effect between the feed rate and depth of cut. It is indicated that Ra can be reduced when setting different values for the depth of cut, but the feed rate should be set using low-to- moderate levels, i.e., 0.10 mm/rev and 0.18 mm/rev. However, the plot indicates obvious fluctuations concerning the colored regions where the response under question is facilitated, as in the case of Al-Gr0.5%.
To further examine and quantify the importance of the cutting parameters on the responses of main cutting force Fz and surface roughness Ra referring to the composite material under interest Al-Gr0.5%, the analysis of variance (ANOVA) was conducted based on the experimental results. The full quadratic response surface regression was selected to generate the second-order mathematical relations that will correlate cutting parameters with cutting force and surface roughness. The full quadratic mathematical relations are given in Equation (1) and Equation (2) for Fz and Ra, respectively.
Fz (N) = 41.8 − 1.045 × Vc + 933 × f + 378 × α + 0.0228 × Vc 2 − 2899 × f2 − 194.1 × α2 + 0.48 × Vc × f + 0.20 × Vc × α + 857 × f × α
Ra (μm) = −19.3 + 0.164 × Vc + 141 × f + 12 × α − 0.914 × Vc × f − 0.072 × Vc × α − 24 × f × α
Both the validity and adequacy of the regression models generated were confirmed by the result of coefficient of determination R2. This indicator as well as the model error estimation and significance of model terms are summarized in Table 4 and Table 5 for main cutting force Fz and surface roughness Ra, respectively, referring to the Al-Gr0.5% composite material. Note that a p-value less than 0.05 (95% confidence interval, C.I.) implies the significance of the model terms. The model’s estimated p-value should be below 0.05 to exhibit significance whereas insignificant lack-of-fit may be observed by obtaining a low model error in terms of its contribution. Both ANOVA Tables (Table 4 and Table 5) report negligible contribution error, 0.04 and 4.72, for the response of main cutting force Fz and surface roughness Ra, respectively. Model adequacy is verified with the correlation coefficient (R2) for both Fz and Ra models having obtained the results of 99.96% and 95.28%, respectively.
Validity and adequacy of regression models were further supported by examining the normality for residuals using the “Anderson–Darling” normality test. The goal was to prove that residuals follow a normal distribution, meaning that an insignificant contribution to the statistical test was achieved. This fact was verified by obtaining a result for p-value beyond the 0.05 based on the predetermined 95% confidence interval (C.I.). Regression models generated for the responses of main cutting force Fz and surface roughness Ra presented results far beyond 0.05. The model for Fz obtained 0.852, whereas the model for Ra obtained 0.787 for p-value. Therefore, both regression models exhibited adequate reliability given their coefficients of determination R2 and p-values for residuals. Figure 16 depicts the residuals’ normal distributions for the regression equations of Fz (Figure 16a) and Ra (Figure 16b).

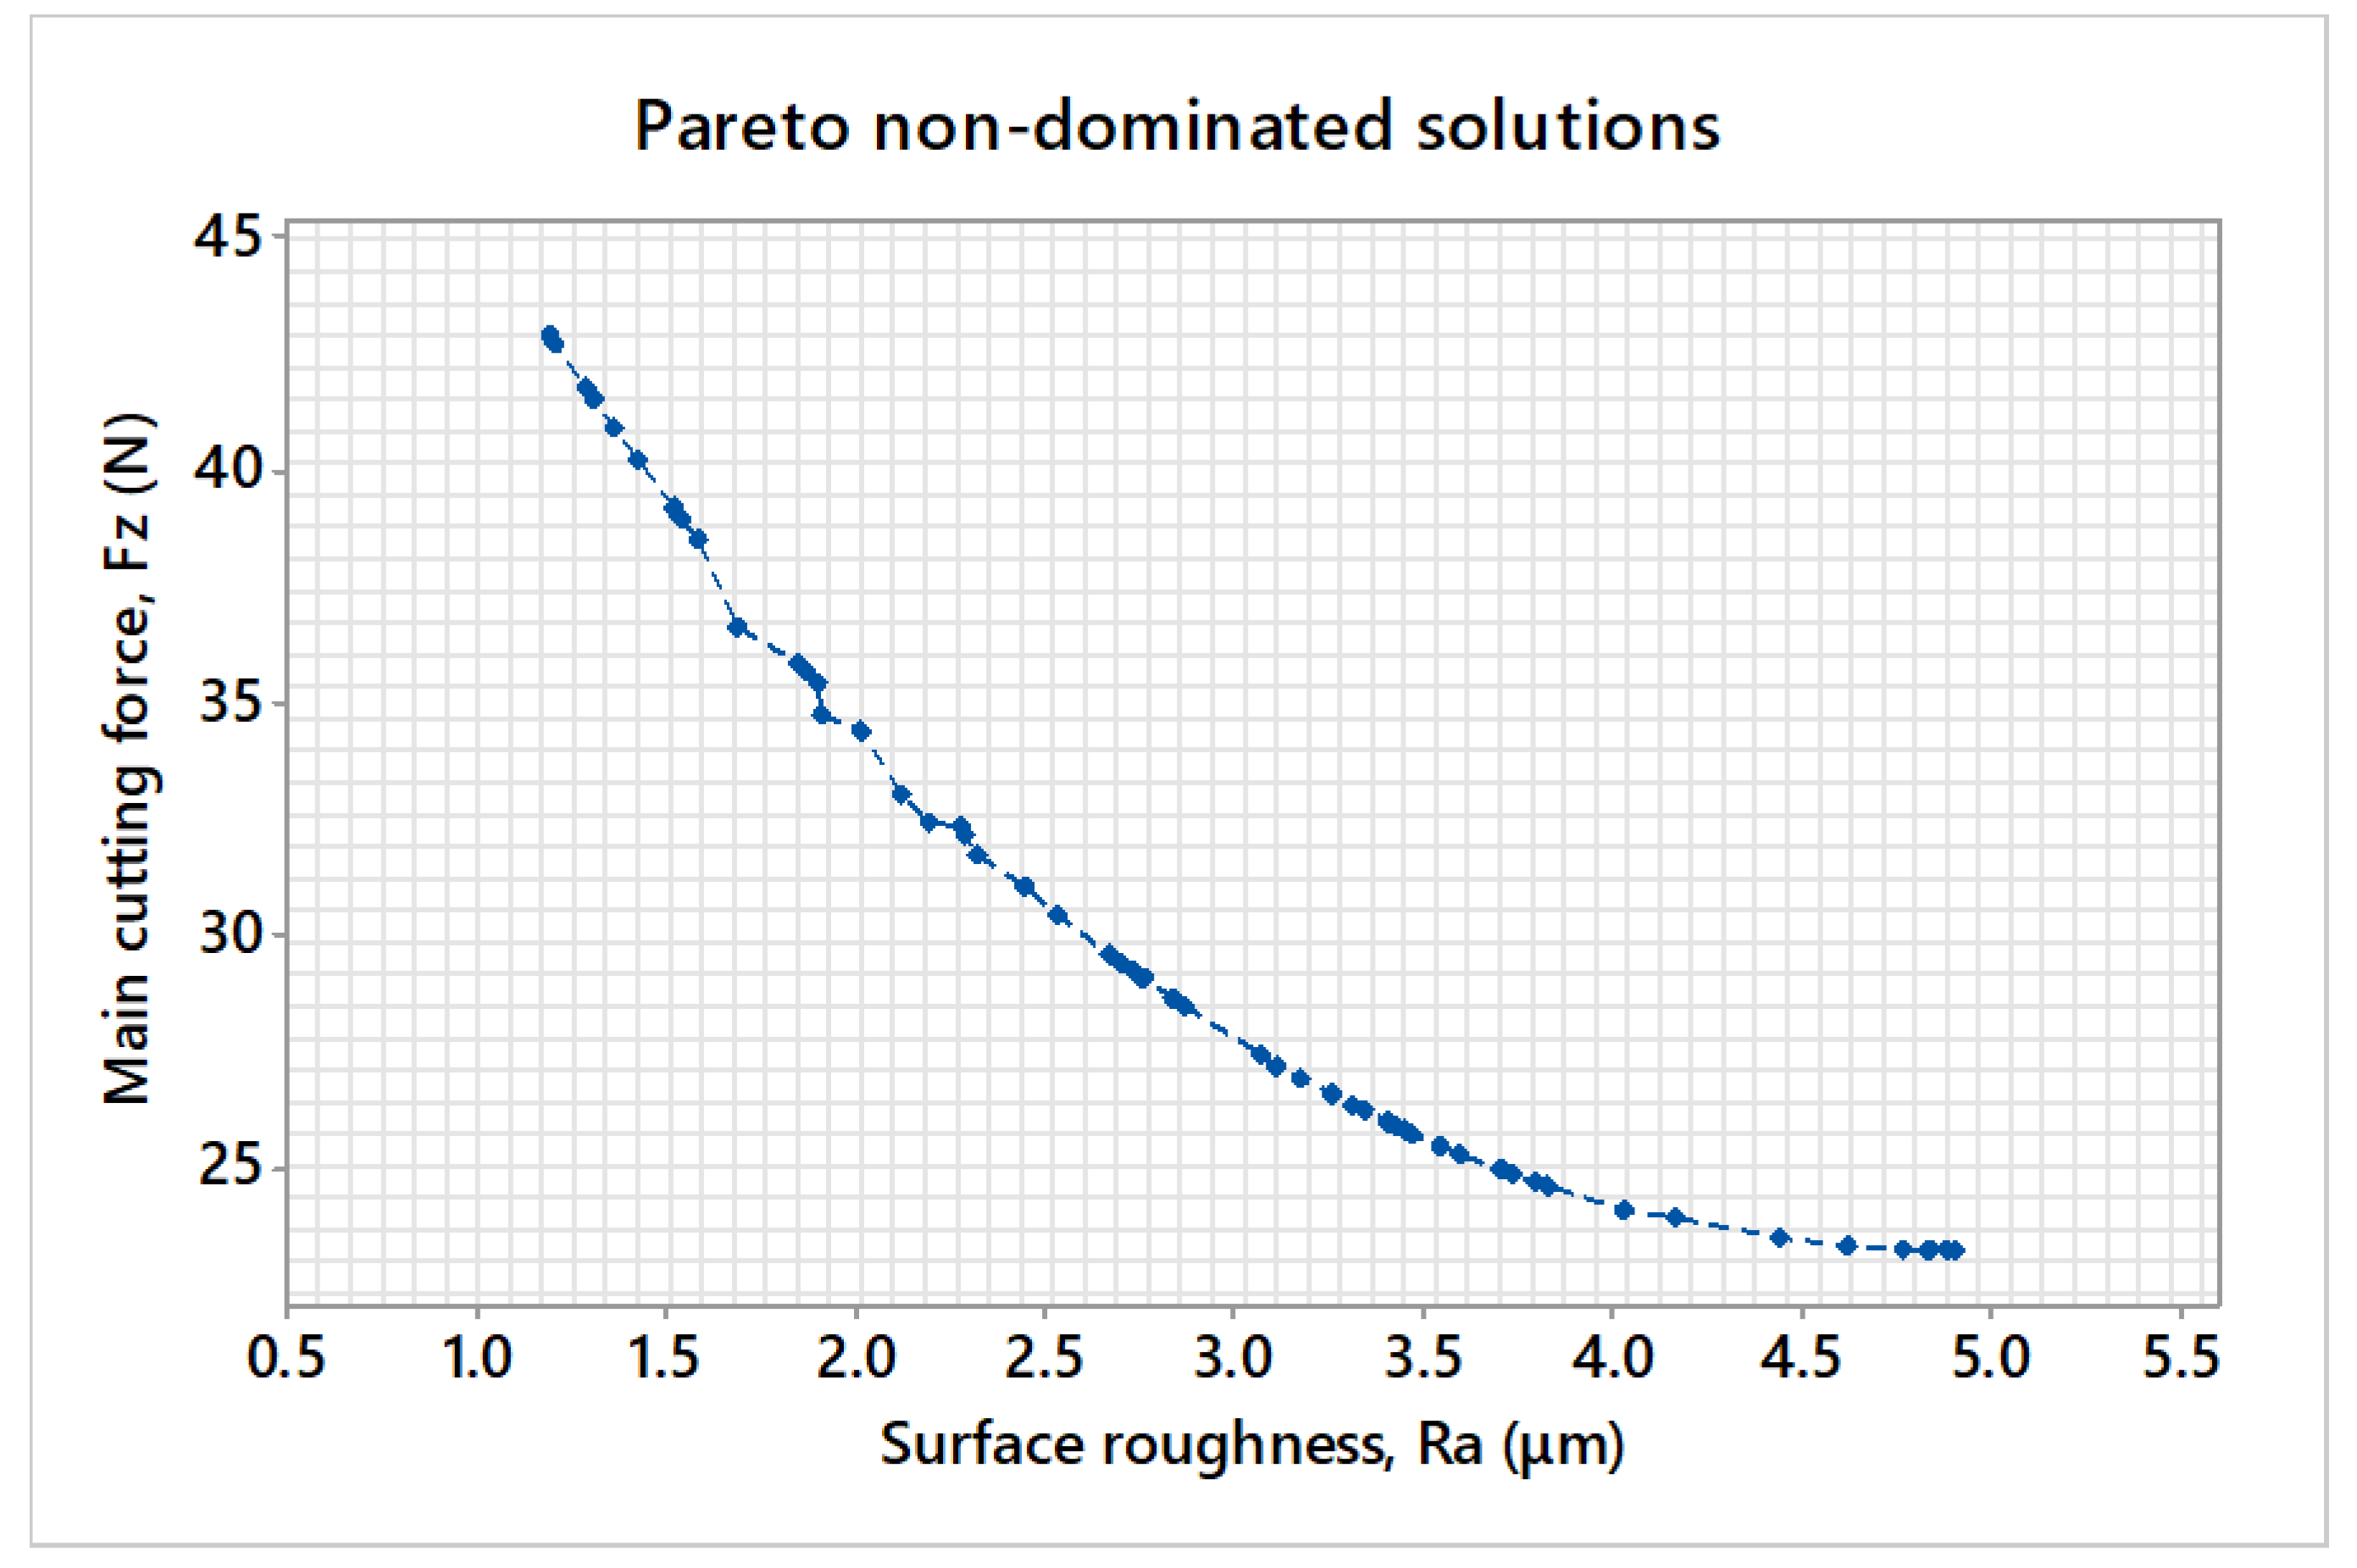
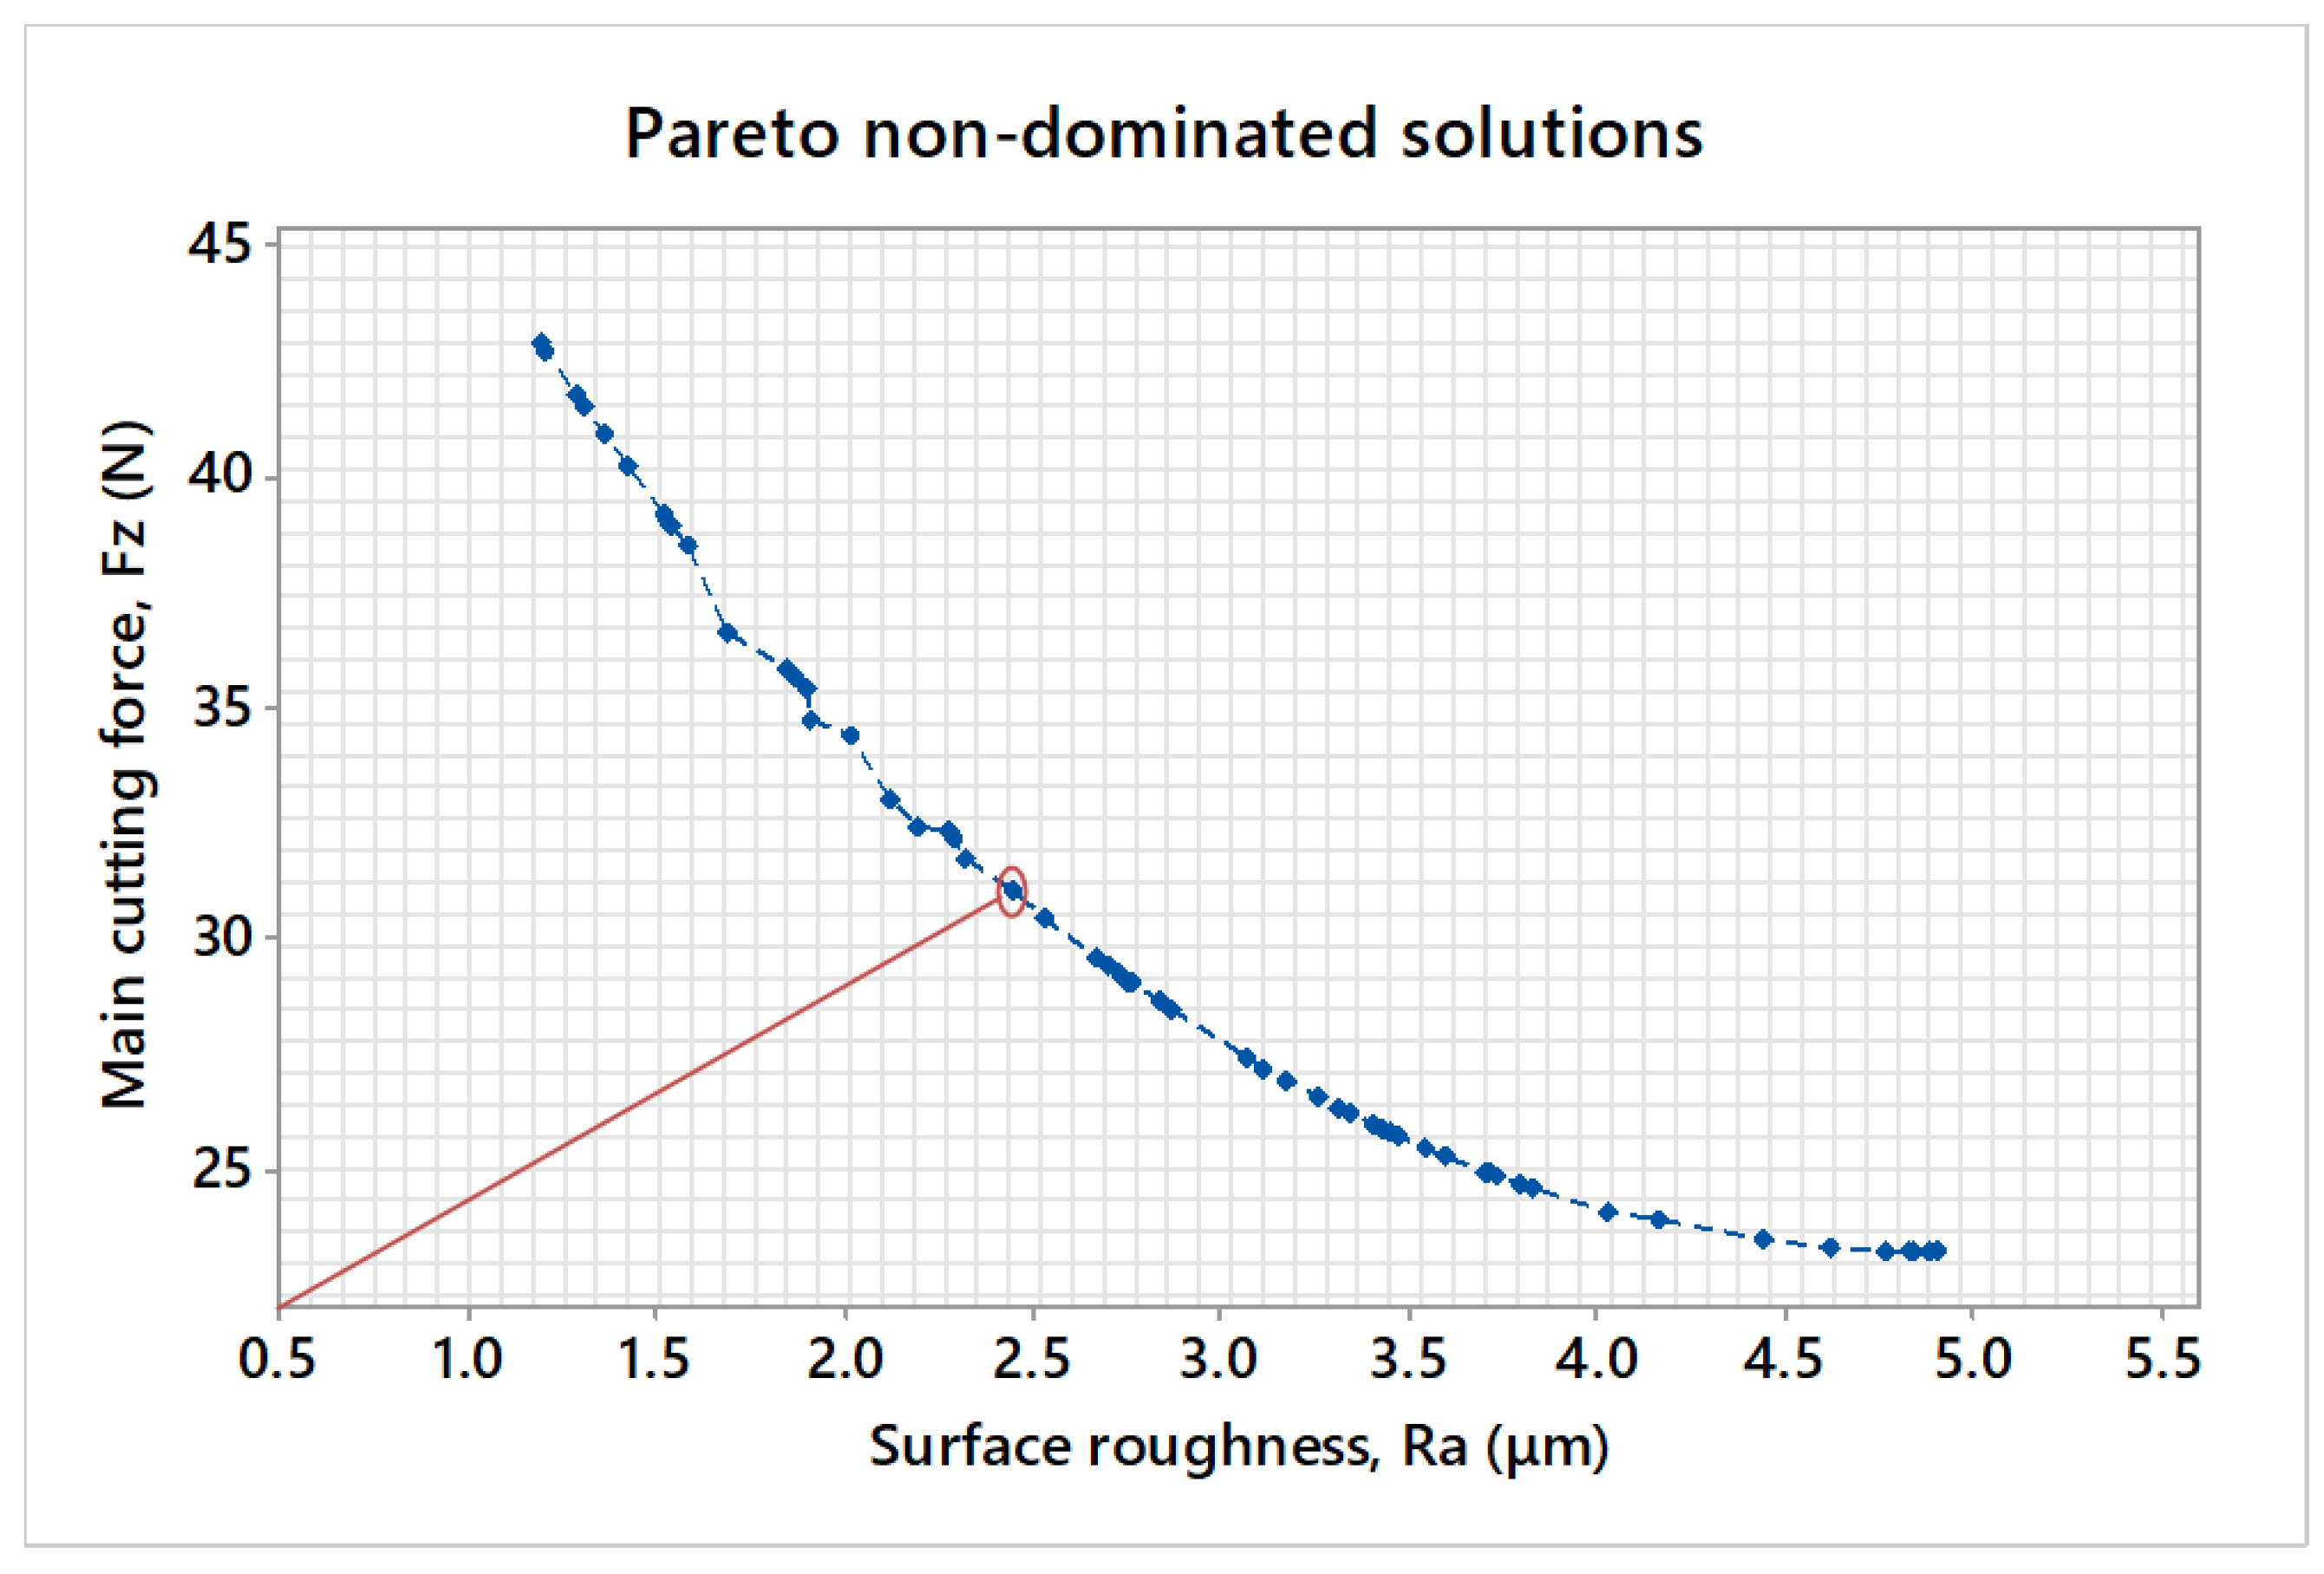
4.3. Implementation of NSGA-II for Multi-Objective Optimization

The full quadratic models derived by the analysis of variance were utilized to represent the parameter optimization domain for the machining variables. Experimental design and statistical analysis were conducted in Minitab® 17. Consequently, the two models acted as the objective functions of the two-criteria optimization problem between the cutting force (Equation (3)) and surface roughness (Equation (4)). The search space for NSGA-II was constrained to the same parameter ranges as introduced to the design of experiments.
minFz(N) = 41.8 − 1.045 × Vc + 933 × f + 378 × α + 0.0228 × Vc 2 − 2899 × f2 − 194.1 × α2 + 0.48 × Vc × f + 0.20 × Vc × α + 857 × f × α
minRa(μm) = −19.3 + 0.164 × Vc + 141 × f + 12 × α − 0.914 × Vc × f − 0.072 × Vc × α − 24 × f × α
The constrained regions for independent variables-cutting conditions are given in Equations (5)–(7) for the cutting speed, feed rate and depth of cut.
Vc (m/min):    60 ≤ Vc ≤ 120
f (mm/rev):   0.1 ≤ f ≤ 0.3
α (mm):   0.5 ≤ α ≤ 1.0
The recommended values for determining the algorithm-specific parameters of NSGA-II were applied. For the algorithm’s storage archive, a value of 70 solutions was determined. The number of iterations was set equal to 1000. These values were determined under the assumption that a relatively low number of stored candidate solutions, combined with a large number of algorithmic iterations, facilitated the update speed of the solutions during the evaluations conducted by NSGA-II. Simulations were performed in MATLAB® R2013a run on a DELL® computer (Intel® core i3−4160 CPU, 3.60 GHz, 64−bit, 12 GB RAM). The Pareto front along with the NSGA−II proposed solutions is illustrated in Figure 17.
By examining the Pareto front provided by applying NSGA-II, a quite uniform distribution of solution points was observed, implying that the general requirements in regard to Fz and Ra may be met. Note that the problem under question is to be constrained to the experimental space presented in this study. The most advantageous solutions were those considered to be closer to the Pareto front’s axes origin when their objectives are to be minimized. The Pareto front obtained indicated a uniform spread of non-dominated solutions, satisfying both objectives. Several solutions covered the central region of the Pareto front, hence minimizing Fz and Ra at the same time. The lowest result for Fz was reported in the 16th solution, where Fz equals to 23.238 N. This run comes with Vc = 111 m/min, f = 0.1 mm/rev, and α = 0.5 mm. The resulting Ra for this solution was equal to 4.885 μm. The lowest result referring to Ra is reported to the 58th solution, equal to 1.196 μm accompanied with Fz result equal to 42.866 N. This solution comes with cutting speed Vc = 60 m/min, feed rate f = 0.1, and depth of cut α = 0.5 mm.

4.4. Confirmatory CNC Dry-Turning Experiment

To estimate the efficiency and practical gain of the NSGA-II application in terms of the non-dominated solutions provided, a confirmatory dry-turning experiment was conducted to examine the results corresponding to the main cutting force and surface roughness. For rigorous comparisons, a non-dominated solution found close to the central region in terms of the objective axes was selected. This non-dominated solution corresponds to Fz equal to 31.107 N and Ra equal to 2.446 μm by setting 78.720 m/min for Vc, 0.1 mm/rev for f and 0.5 mm for α. Figure 18 depicts the location of the selected non-dominated solution.
A new cutting insert tip was mounted for executing the experiment. The confirmatory cut along with its roughness measurement was applied to a cylindrical region close to the work (lathe chuck) to avoid imminent vibrations that could negatively affect the results. Roughness measurements adhere to ISO 4287 standard [27]. Three independent and equidistant peripheral roughness measurements at 120° were taken in the cutting zone. The mean result of these independent measurements was computed to represent the obtained roughness equal to 2.295 μm. Figure 19, Figure 20 and Figure 21 illustrate the independent roughness measurements. By comparing the two values corresponding to surface roughness, namely the selected non-dominated NSGA-II solution equal to 2.446 μm and the measurement equal to 2.295 μm, the difference was equal to 6.173%.
The experimental apparatus for collecting the cutting force signal and data acquisition was implemented during the confirmatory turning experiment. The timespan for conducting the experiment given the length of the cylindrical cutting region, the feed rate and spindle correspondin to cutting speed selected, was approximately 18 s. Figure 22 depicts the trend of the main cutting force signal recorded. The trendline comprises approximately 270 points corresponding to main cutting force record.
To enable the assessment between the non-dominated point’s predicted result for the main cutting force equal to 31.107 N and the main cutting force indications observed and recorded for the actual cutting experiment, the mean of the recorded main cutting force dataset was computed and found equal to 31.131 N by taking into account these indications the difference is equal to 0.077%.

5. Conclusions

This study investigated the effect of the cutting conditions on the major machinability attributes of the main cutting force and surface roughness in the case of a graphene nanoplatelets-reinforced aluminum matrix composite (Al-Gr0.5%) dry CNC turning operation. A central composite design of experiments was formulated by employing embedded statistical software functions to transform an originally formulated L9 Taguchi orthogonal array design to a response surface design of experiments. Machining experiments were performed using a CVD-coated cutting insert (TNMG160404-MF2 TP200, Fagersta, Sweden). Experiments were examined with the aid of statistical analysis, while two regression models with a high degree of correlation between inputs and outputs were generated for predicting the responses and finally the handle by the NSGA-II algorithm to solve a two-objective optimization problem between the two machinability criteria. The study examined tool wear and chip morphology for the composite material under examination as well as the base material, with a high-purity Al grade (Al 96.83%). The important findings of the study are summarized as follows:
  • The machining process of the Al-Gr0.5% composite aluminum material introduced a highly non-linear problem that warrants further research in regard to the optimization of crucial metrics related to productivity and surface finish.
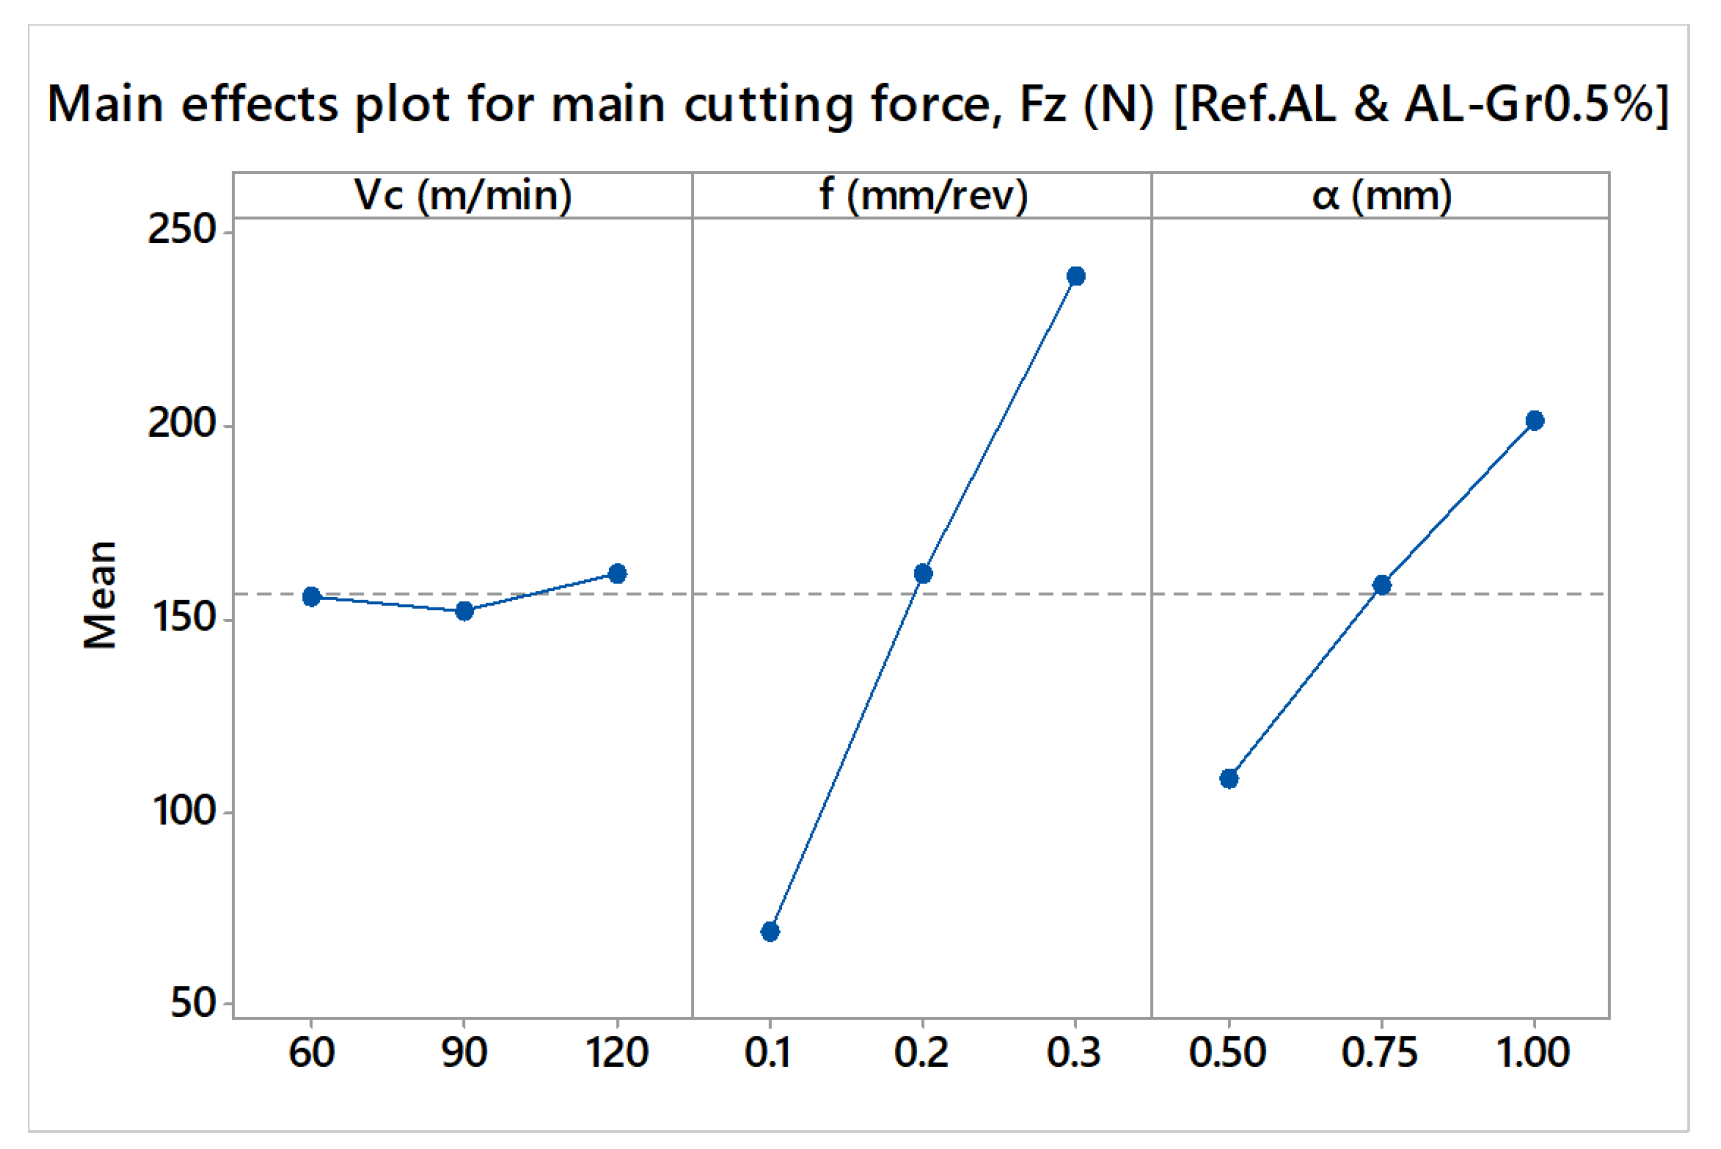
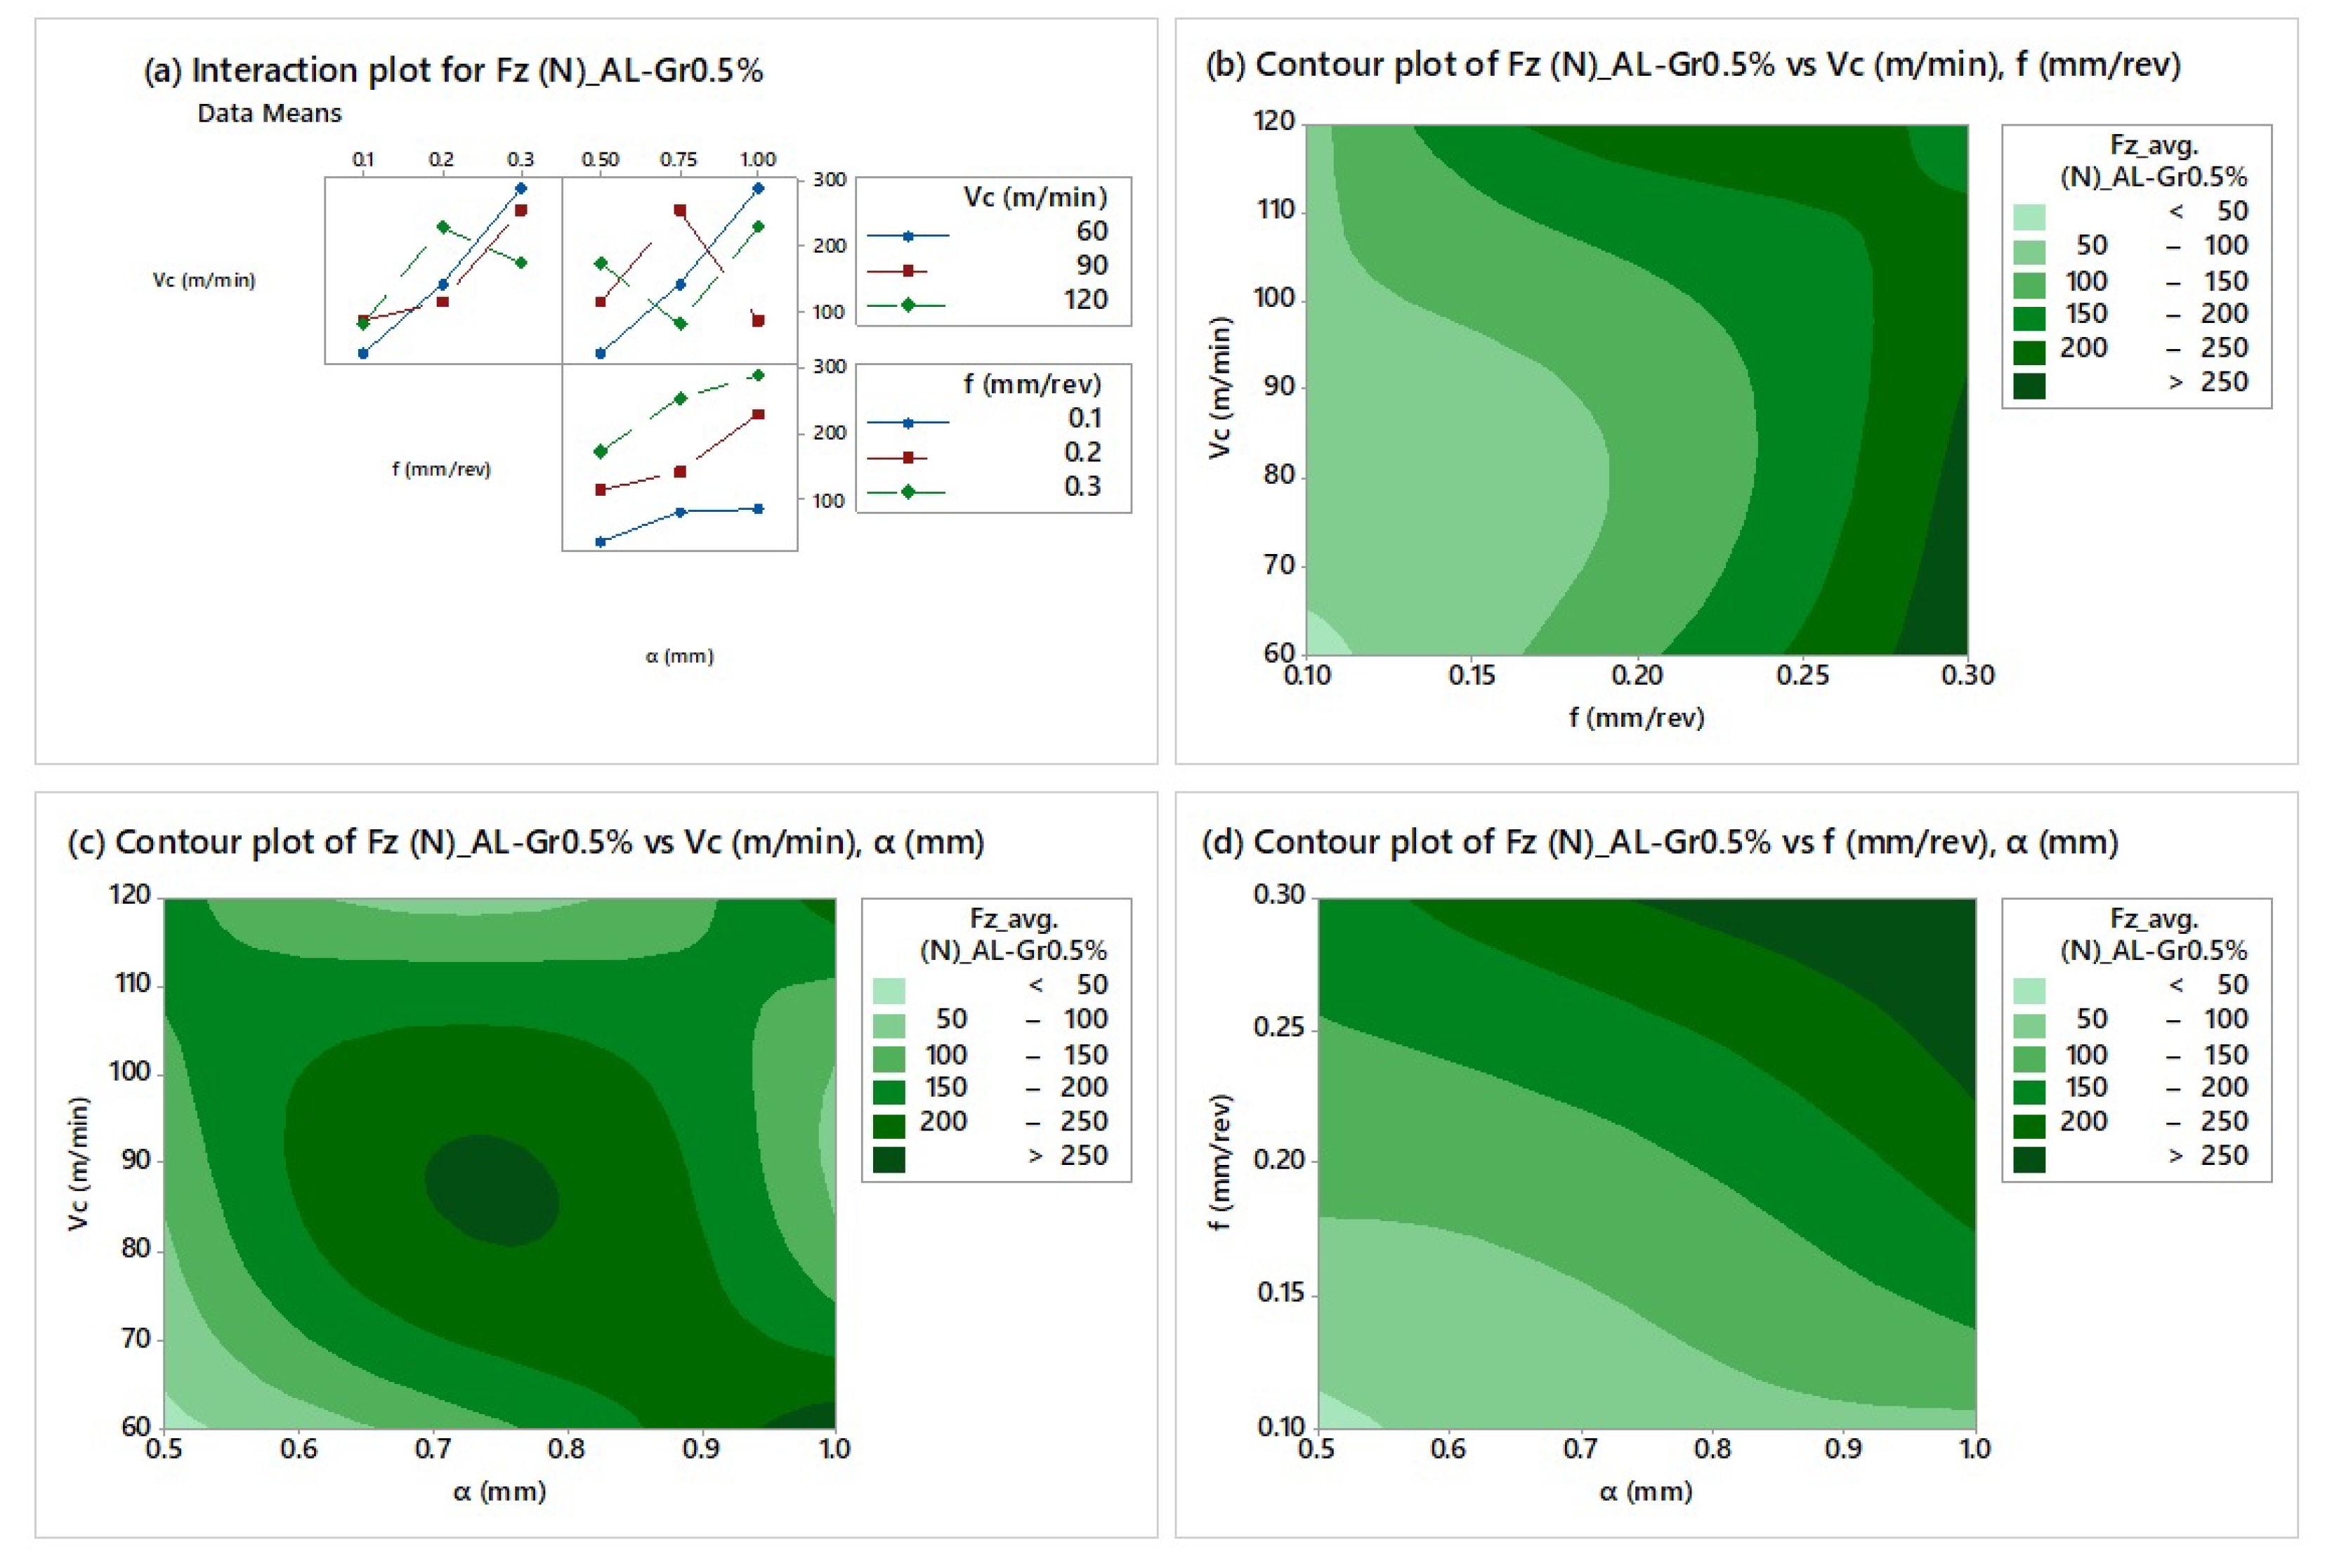
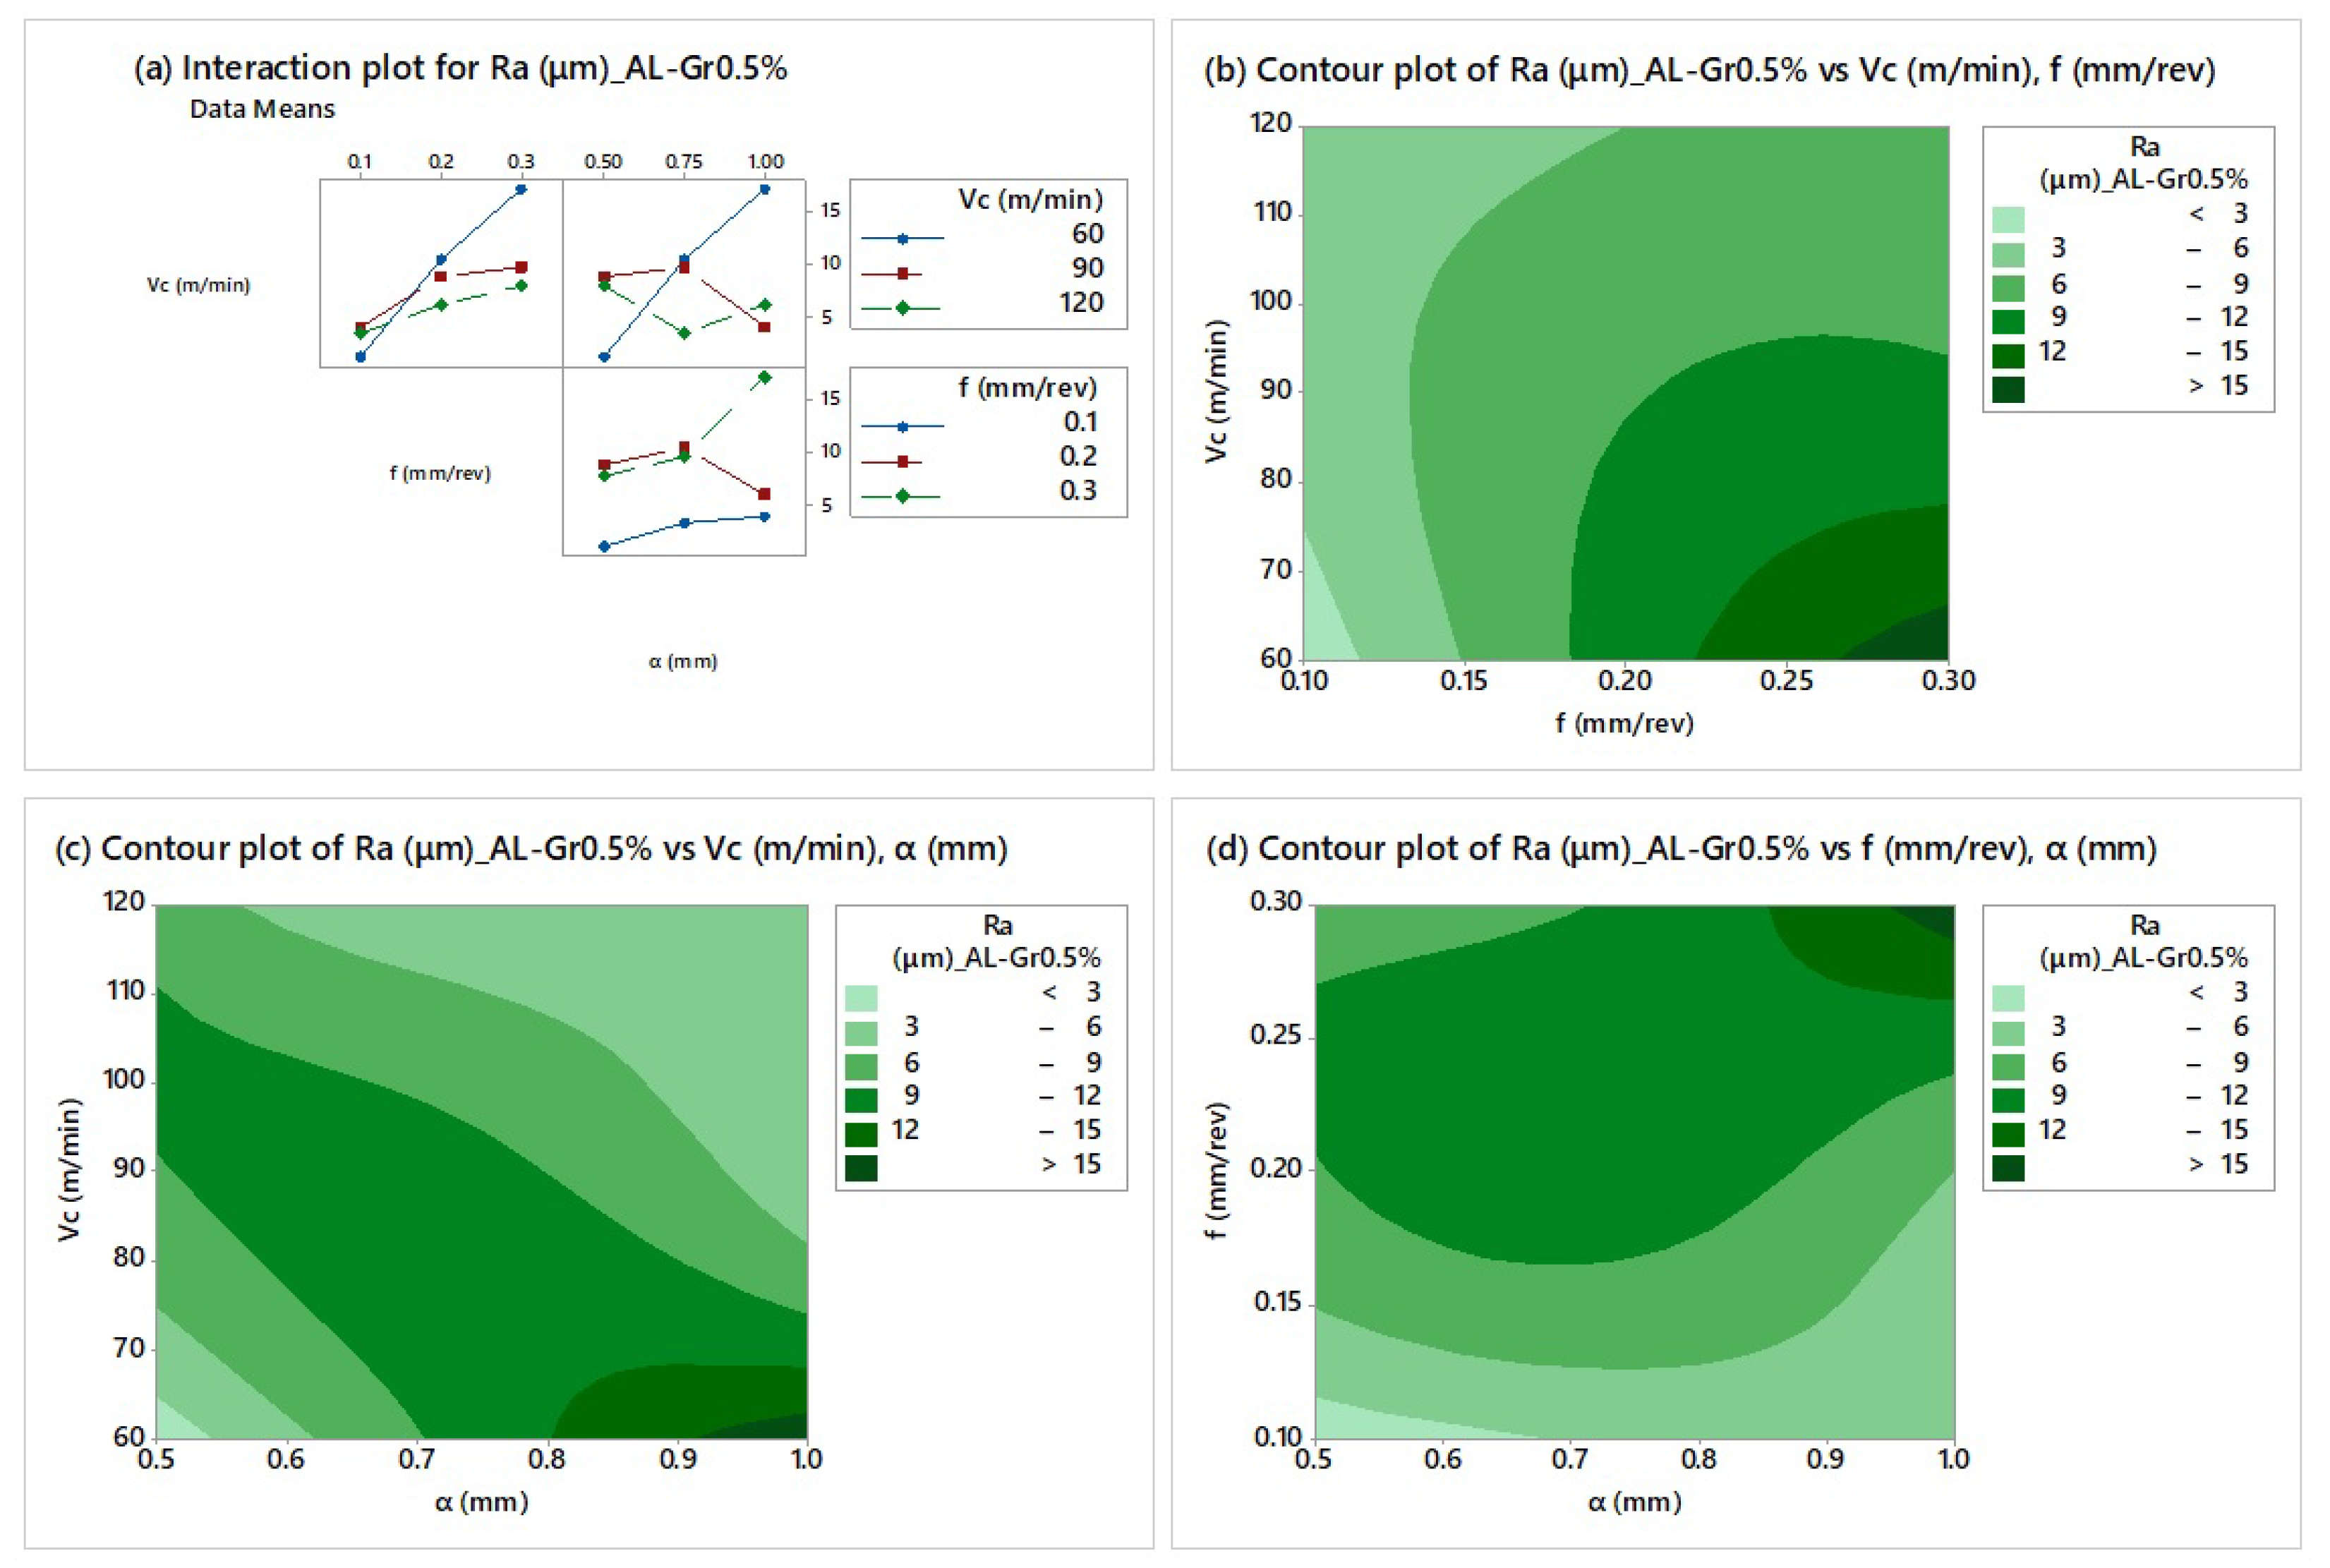
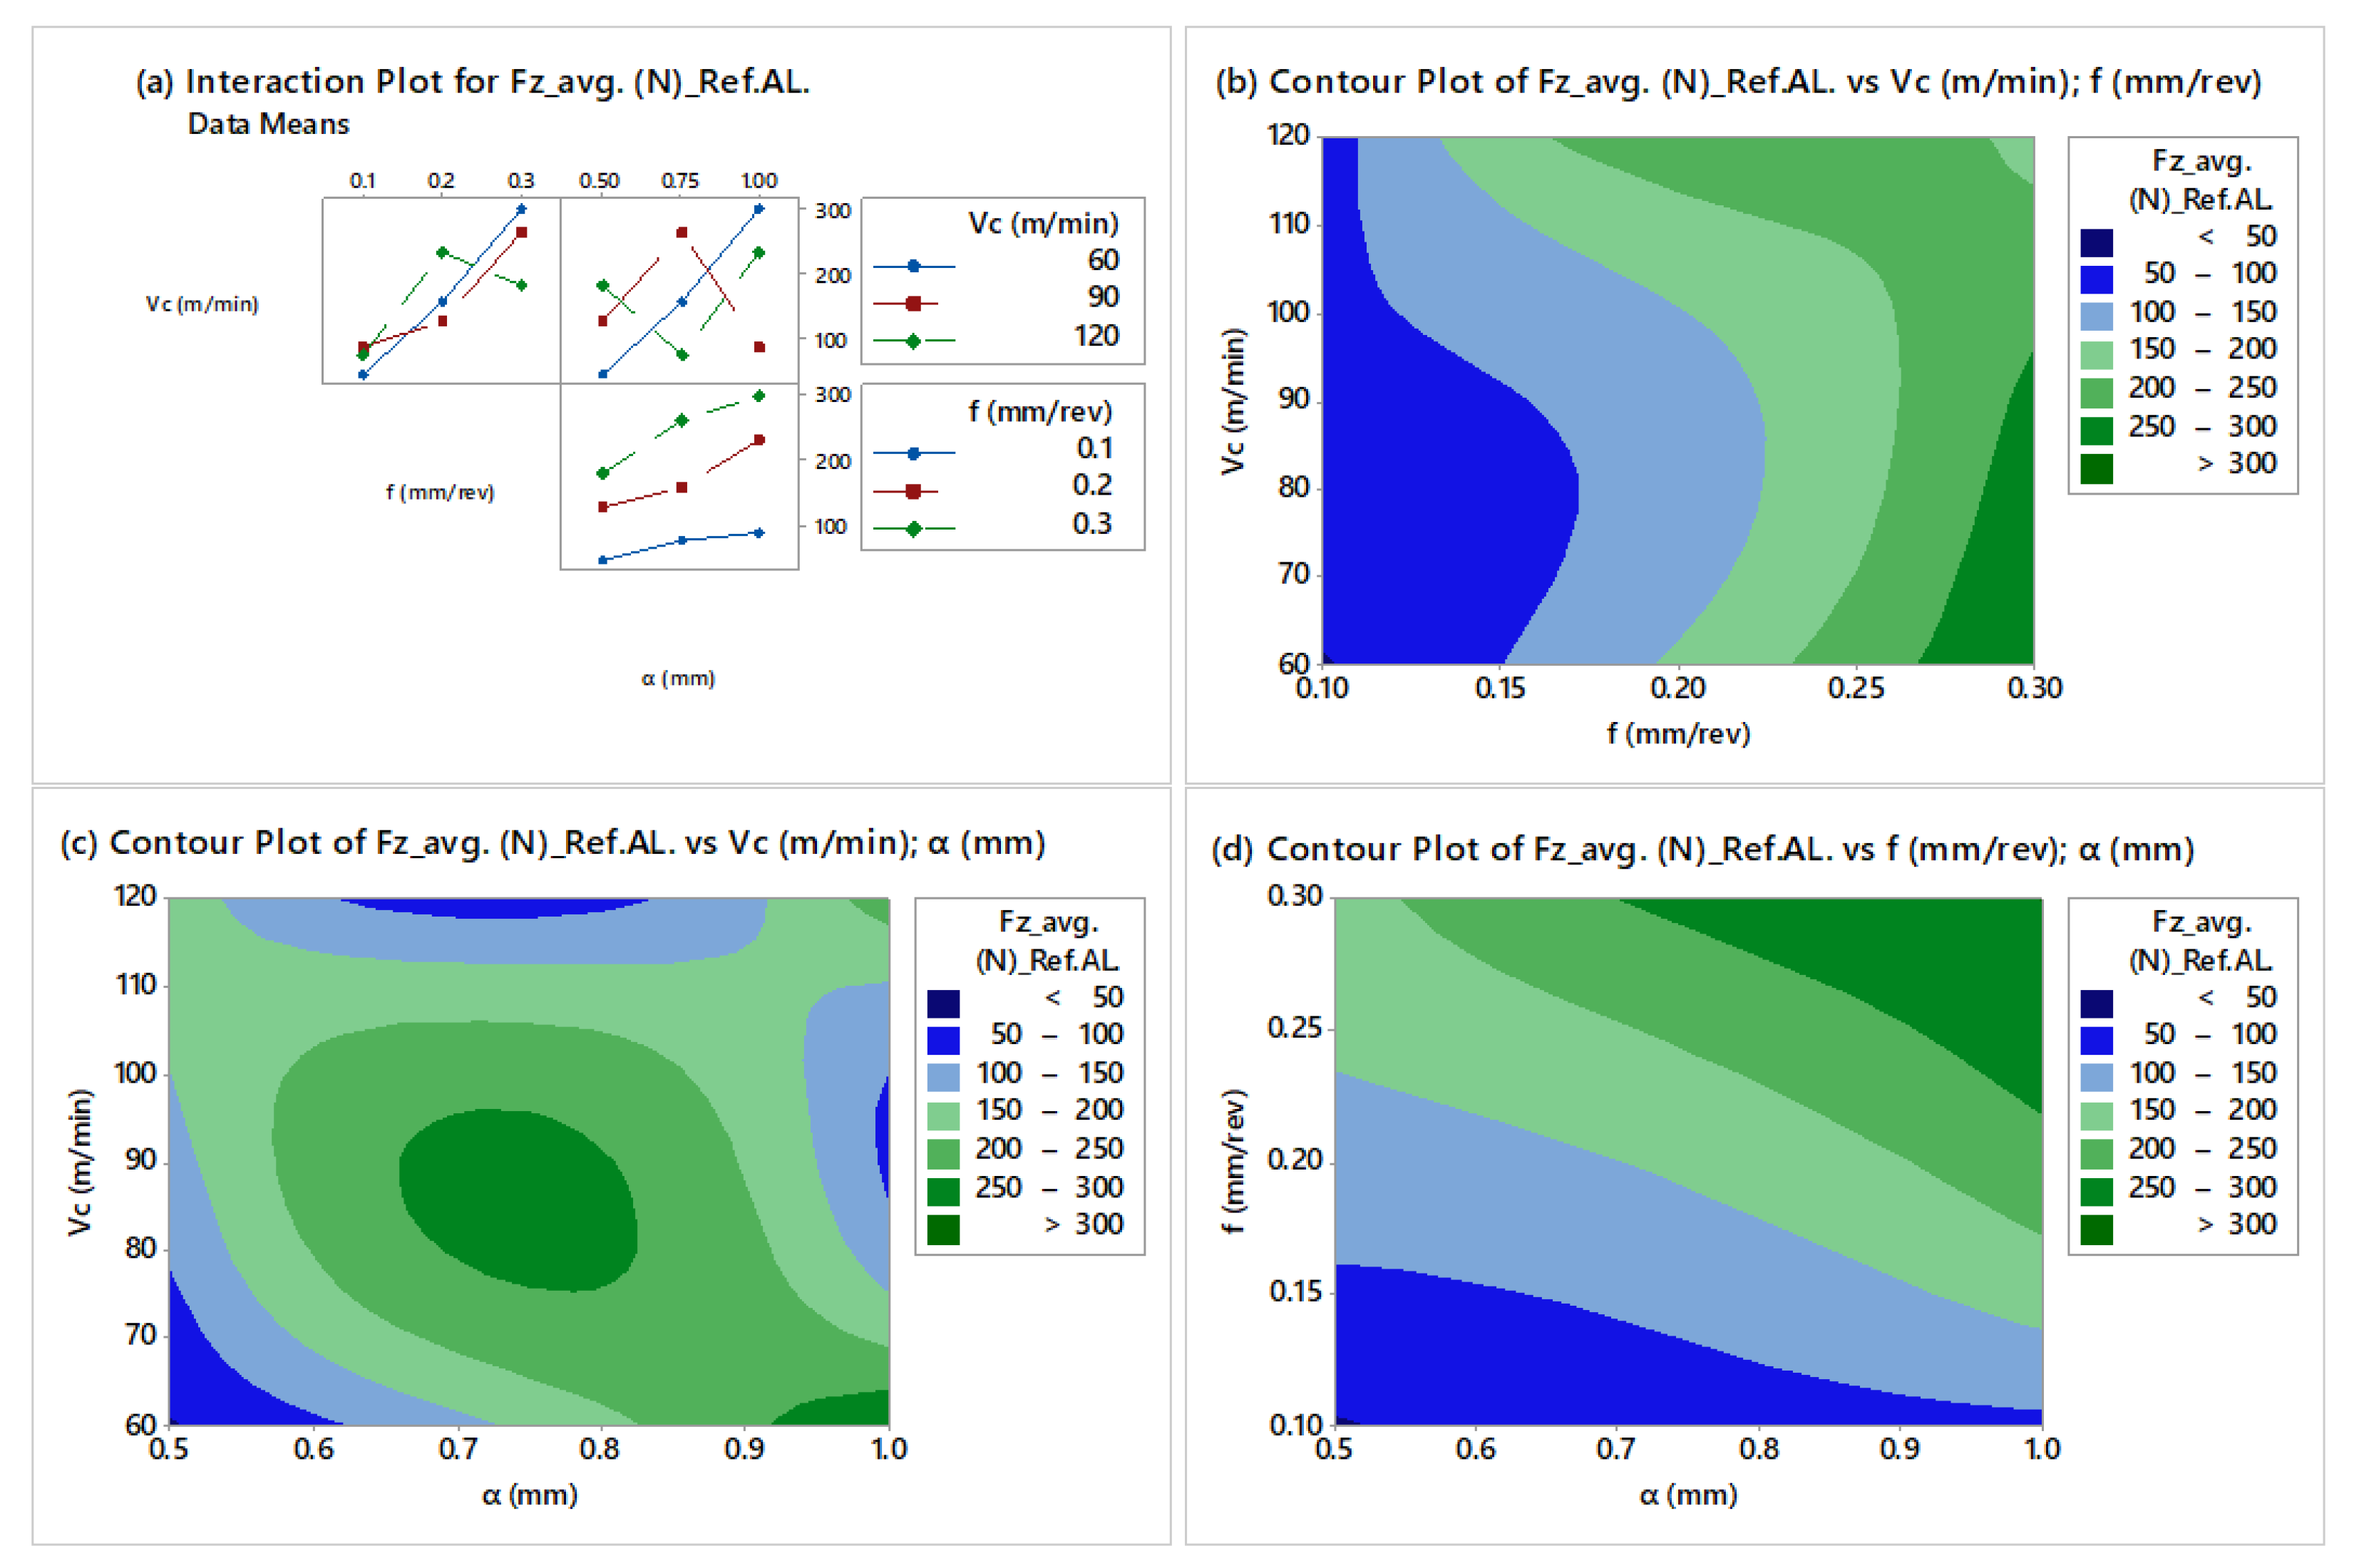
  • Significant variations among the cutting parameters were observed during dry CNC turning of Al-Gr0.5% composite Al. However, it clearly appeared that the feed rate holds a dominant effect on the main cutting force and surface roughness, followed by the depth of cut and cutting speed.
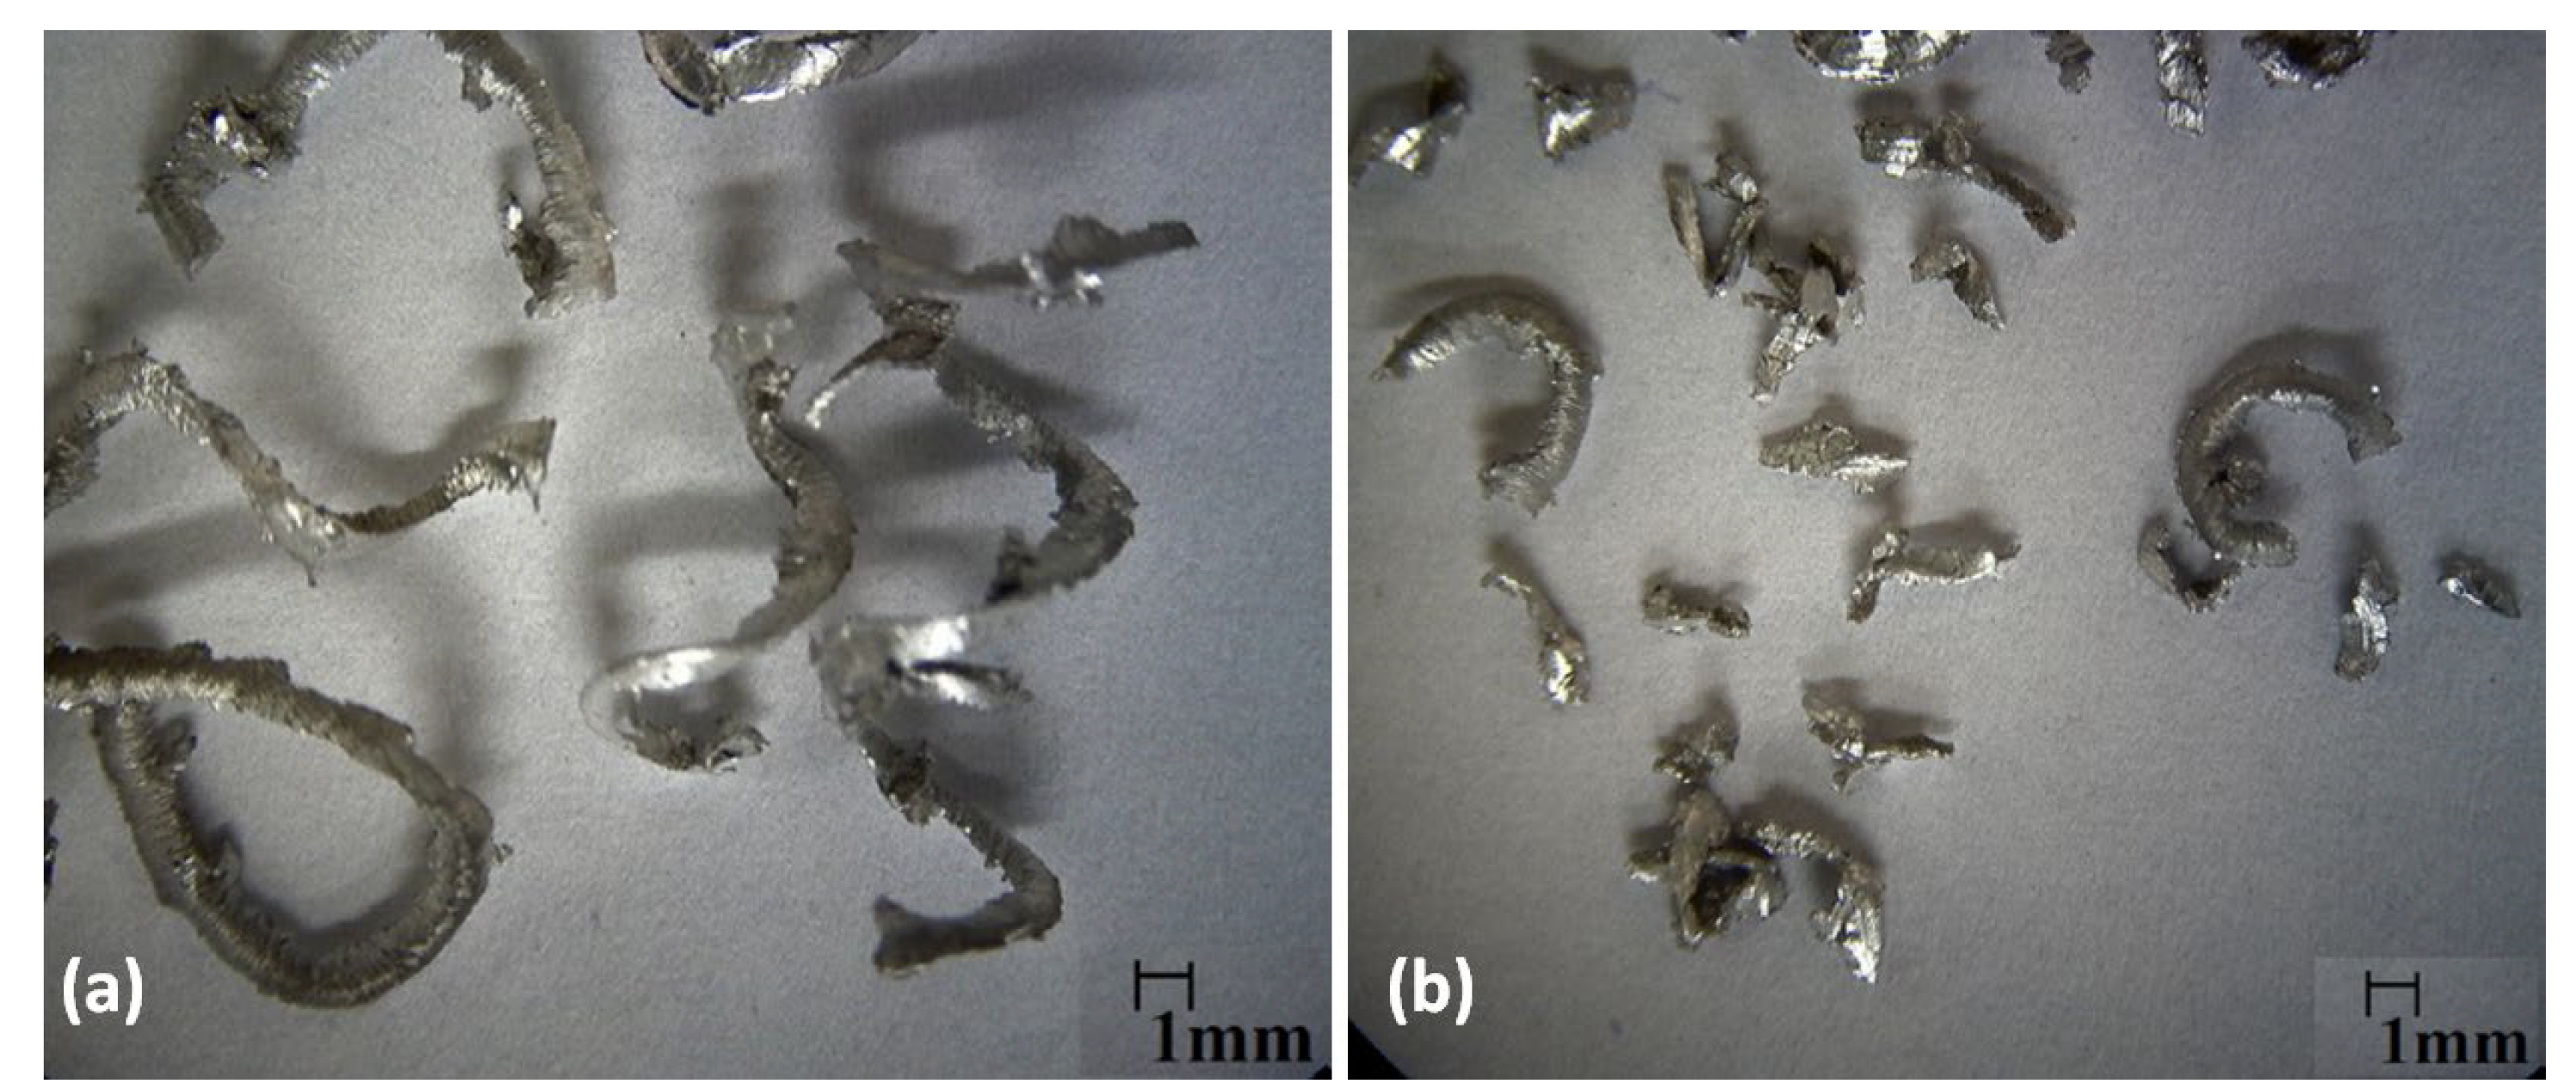
  • Chip formation was influenced by the content of the graphene nanoplatelets when compared to high-purity Al, thus introducing a significant change in terms of the material properties referring to both machinability criteria.
  • The NSGA-II algorithm obtained beneficial non-dominated solutions for process planners to select from, with reference to the production requirements. Both machinability criteria, Fz and Ra, revealed a complex experimental search domain. This observation justifies the need for implementing intelligent algorithms for multi-criteria optimization problems related to machining processes.
  • Confirmatory experimental results were in very good percentage agreement with those proposed by the NSGA-II algorithm. This encourages its application to examine and optimize the machinability aspects of a wide range of engineering materials for conventional and non-conventional material removal processes.
The authors will look further ahead to investigate the different contents of graphene nanoplatelets and implement a variety of cutting insert grades. Further research will test a variety of intelligent algorithms for optimizing performance metrics such as the cutting force, surface finish and power consumption.

Author Contributions

Conceptualization, D.E.M. and N.M.V.; methodology, D.E.M. and N.M.V.; software, N.A.F.; validation, N.A.F.; formal analysis, N.A.F. and D.E.M.; investigation, N.A.F.; Resources, D.E.M.; data curation, N.A.F.; writing—original draft, N.A.F.; writing—review and editing, D.E.M. and N.M.V.; visualization, N.A.F.; supervision, N.M.V.; project administration, N.M.V. All authors have read and agreed to the published version of the manuscript.

Funding

This research received no external funding.

Data Availability Statement

The original contributions presented in this study are included in the article. Further inquiries can be directed to the corresponding authors.

Conflicts of Interest

The authors declare no conflicts of interest.

Abbreviations

The following abbreviations are used in this manuscript:
CCDCentral Composite Design
RSMResponse Surface Methodology
GNPsGraphene Nanoplatelets
BUEBuilt-up edge
ANOVAAnalysis of Variance
C.I.Confidence Interval

References

  1. Rawat, P.; Singh, K.K. An impact behavior analysis of CNT based fiber reinforced composites validated by LS-DYNA: A review. Polym. Compos. 2015, 38, 175–184. [Google Scholar] [CrossRef]
  2. Shrivastava, R.; Singh, K.K. Interlaminar fracture toughness characterization of laminated composites: A review. Polym. Rev. 2019, 60, 542–593. [Google Scholar] [CrossRef]
  3. Boostani, A.F.; Tahamtan, S.; Jiang, Z.Y.; Wei, D.; Yazdani, S.; Azari Khosroshahi, R.; Taherzadeh Mousavian, R.; Xu, J.; Zhang, X.M.; Gong, D. Enhanced tensile properties of aluminium matrix composites reinforced with graphene encapsulated SiC nanoparticles. Compos. Part A Appl. Sci. Manuf. 2015, 68, 155–163. [Google Scholar] [CrossRef]
  4. Gao, M.; Chen, T.; Ma, S.; Wang, H. Endowing a superior synergy of strength and ductility to aluminum matrix composite by dual-structured reinforcement and matrix. Mater. Sci. Eng A 2025, 924, 147820. [Google Scholar] [CrossRef]
  5. Guo, B.; Ni, S.; Shen, R.; Song, M. Fabrication of Ti–Al3Ti core–shell structured particle reinforced Al based composite with promising mechanical properties. Mater. Sci. Eng. A 2015, 639, 269–273. [Google Scholar] [CrossRef]
  6. Gupta, R.; Chaudhari, G.P.; Daniel, B.S.S. Strengthening mechanisms in ultrasonically processed aluminium matrix composite with in-situ Al3Ti by salt addition. Compos. B Eng. 2018, 140, 27–34. [Google Scholar] [CrossRef]
  7. Khosroshahi, N.B.; Mousavian, T.R.; Khosroshahi, R.A.; Brabazon, D. Mechanical properties of rolled A356 based composites reinforced by Cu-coated bimodal ceramic particles. Mater. Des. 2015, 83, 678–688. [Google Scholar] [CrossRef]
  8. Hong, S.-J.; Kim, H.-M.; Huh, D.; Suryanarayana, C.; Chun, B.S. Effect of clustering on the mechanical properties of SiC particulate-reinforced aluminum alloy 2024 metal matrix composites. Mater. Sci. Eng. A 2003, 347, 198–204. [Google Scholar] [CrossRef]
  9. Valibeygloo, N.; Khosroshahi, R.A.; Mousavian, R.T. Microstructural and mechanical properties of Al–4.5 wt% Cu reinforced with alumina nanoparticles by stir casting method. Int. J. Miner. Metall. Mater. 2013, 20, 978–985. [Google Scholar] [CrossRef]
  10. Mohammadpour, M.; Khosroshahi, R.A.; Taherzadeh, R.M.; Brabazon, D. Effect of interfacial-active elements addition on the incorporation of micron-sized SiC particles in molten pure aluminum. Ceram. Int. 2014, 40, 8323–8332. [Google Scholar] [CrossRef]
  11. Huang, Z.; Yan, H. Improved mechanical properties of GNPs/Al composites by eliminating alumina and obtaining a strong bonded GNPs-Al direct contact interface and Mg-rich phases. J. Alloys Compd. 2024, 984, 173982. [Google Scholar] [CrossRef]
  12. Moheimani, S.K.; Dadkhah, M.; Saboori, A. Development of Novel AlSi10Mg Based Nanocomposites: Microstructure, Thermal and Mechanical Properties. Metals 2019, 9, 1000. [Google Scholar] [CrossRef]
  13. Azizi, Z.; Rahmani, K.; Taheri-Behrooz, F. The Influence of Graphene Nanoplatelets Addition on the Electrical and Mechanical Properties of Pure Aluminum Used in High-Capacity Conductors. Metals 2022, 12, 1883. [Google Scholar] [CrossRef]
  14. Na, H.-B.; Xu, L.-H.; Han, G.-C.; Liu, S.-K.; Lu, L.-H. Machinability Research on the Micro-Milling for Graphene Nano-Flakes Reinforced Aluminum Alloy. Metals 2019, 9, 1102. [Google Scholar] [CrossRef]
  15. Ju, B.; Yang, W.; Sun, J.; Han, Z.; Zhang, Q.; Xiu, Z.; Wu, G. Effect of vacancy defects of graphene on the interfacial bonding and strengthening mechanism of graphene/Al composite. Surf. Interfaces 2023, 41, 103272. [Google Scholar] [CrossRef]
  16. Lava Kumar, P.; Lombardi, A.; Byczynski, G.; Narayana Murty, S.V.S.; Murty, B.S.; Bichler, L. Recent advances in aluminium matrix composites reinforced with graphene-based nanomaterial: A critical review. Prog. Mater. Sci. 2022, 128, 100948. [Google Scholar] [CrossRef]
  17. El-Ghaoui, K.; Chatelain, J.-F.; Ouellet-Plamondon, C. Effect of Graphene on Machinability of Glass Fiber Reinforced Polymer (GFRP). J. Manuf. Mater. Process. 2019, 3, 78. [Google Scholar] [CrossRef]
  18. Nasr, M.M.; Anwar, S.; Al-Samhan, A.M.; Ghaleb, M.; Dabwan, A. Milling of Graphene Reinforced Ti6Al4V Nanocomposites: An Artificial Intelligence Based Industry 4.0 Approach. Materials 2020, 13, 5707. [Google Scholar] [CrossRef]
  19. Yu, H.; He, Z.; Li, J.; Li, B.; Xin, J.; Yao, L.; Yan, F. Finite element modeling on micro-machining of graphene-reinforced aluminum matrix composites. Int. J. Adv. Manuf. Technol. 2023, 124, 97–110. [Google Scholar] [CrossRef]
  20. Porwal, H.; Tatarko, P.; Grasso, S.; Khaliq, J.; Dlouhý, I.; Reece, M.J. Graphene reinforced alumina nano-composites. Carbon 2013, 64, 359–369. [Google Scholar] [CrossRef]
  21. Muduli, S.; Mahapatra, T.R.; Murty, A.V.K.; Parimanik, S.R.; Mishra, D.; Padhi, P.C. Supervised Machine Learning Algorithms for Machinability Assessment of Graphene Reinforced Aluminium Metal Matrix Composites. In Smart Technologies for Improved Performance of Manufacturing Systems and Services, 1st ed.; Behera, B.K., Moharana, B.R., Muduli, K., Islam, S.M.N., Eds.; CRC Press: Abingdon, UK, 2023; p. 18. [Google Scholar] [CrossRef]
  22. Ajithkumar, J.P.; Anthony, X.M. Machinability Analysis and Optimization of A17075 based B4C, Graphene and CNT Hybrid Composites. In Emerging Technologies for Sustainability, 1st ed.; Thomas, P.C., Mathai, V.J., Geevarghese, T., Eds.; CRC Press: Boca Raton, FL, USA, 2020; p. 10. [Google Scholar] [CrossRef]
  23. Montgomery, D.C. Design and Analysis of Experiments, 7th ed.; John Wiley & Sons: New York, NY, USA, 2009; ISBN 978-0-470-12866-4. [Google Scholar]
  24. Bhushan, R.K. Optimization of cutting parameters for minimizing power consumption and maximizing tool life during machining of Al alloy SiC particle composites. J. Clean. Prod. 2013, 39, 242–254. [Google Scholar] [CrossRef]
  25. Deb, K.; Jain, H. An Evolutionary Many-Objective Optimization Algorithm Using Reference-Point-Based Nondominated Sorting Approach, Part I: Solving Problems With Box Constraints. IEEE Trans. Evolut. Comput. 2014, 18, 577–601. [Google Scholar] [CrossRef]
  26. Jain, H.; Deb, K. An Evolutionary Many-Objective Optimization Algorithm Using Reference-Point Based Nondominated Sorting Approach, Part II: Handling Constraints and Extending to an Adaptive Approach. IEEE Trans. Evolut. Comput. 2014, 18, 602–622. [Google Scholar] [CrossRef]
  27. ISO 4287:1997/JIS B0601; Geometrical Product Specifications (GPS)—Surface Texture: Profile Method—Terms, Definitions and Surface Texture Parameters. Japanese Standards Association: Tokyo, Japan, 1998.
Figure 1. (a) High-purity Al 96.83%, (b) Graphene nanostructures (GNPs).
Metals 15 00584 g001
Figure 2. (a) Ceramic vessel, (b) Hardened steel split cylindrical mold (c) Laboratory furnace.
Metals 15 00584 g002
Figure 3. (a) VEVOR® high precision infrared thermal camera, (b) KERN® PCB 1000-1 precision electronic scale, (c) Glass container for GNPs.
Metals 15 00584 g003
Figure 4. Workpiece material preparation: (a) Casted specimens for high-purity Al matrix, (b) Roughed-finished reference specimens.
Metals 15 00584 g004
Figure 5. Cutting tool implemented for cutting experiments: (a) SECO® CVD-coated TNMG160404-MF2 TP200 insert, (b) PTJNR/L2020K16N tool holder.
Metals 15 00584 g005
Figure 6. (a) CNC machining set-up for dry-turning experiments, (b) Cutting force measuring equipment accompanied with data acquisition/signal processing software.
Metals 15 00584 g006
Figure 7. Main effects plot for cutting parameters on main cutting force, Fz (N).
Metals 15 00584 g007
Figure 8. Main effects plot for cutting parameters on surface roughness, Ra (μm): (a), high-purity Al -reference material, (b) composite material, Al-Gr0.5%.
Metals 15 00584 g008
Figure 9. Dry CNC turning observations for Al-Gr0.5%: (a) BUE effect on tool tip, (b) welded BUE fragments on the machined surface.
Metals 15 00584 g009
Figure 10. Chip morphology observations: (a) Reference high-purity Al, (b) Al-Gr0.5% composite.
Metals 15 00584 g010
Figure 11. Chip morphology observations: (a) High-purity Al, (b) Al-Gr0.5% composite.
Metals 15 00584 g011
Figure 12. Al-Gr0.5%: Response contour plots for Fz (N): (a) Interaction plot for main cutting force Fz; (b) Contour plot for main cutting force Fz vs. cutting speed Vc and feed rate f; (c) Contour plot for main cutting force Fz vs. cutting speed Vc and depth of cut, α; (d) Contour plot for main cutting force Fz vs. feed rate f and depth of cut α.
Metals 15 00584 g012
Figure 13. Al-Gr0.5%: Response contour plots for Ra: (a) Interaction plot for surface roughness Ra; (b) Contour plot for surface roughness Ra vs. cutting speed Vc and feed rate f; (c) Contour plot for surface roughness Ra vs. cutting speed Vc and depth of cut α; (d) Contour plot for surface roughness Ra vs. feed rate f and depth of cut α.
Metals 15 00584 g013
Figure 14. High-purity Al: Response contour plots for Fz (N): (a) Interaction plot for main cutting force Fz; (b) Contour plot for main cutting force Fz vs. cutting speed Vc and feed rate f; (c) Contour plot for main cutting force Fz vs. cutting speed Vc and depth of cut, α; (d) Contour plot for main cutting force Fz vs. feed rate f and depth of cut α.
Metals 15 00584 g014
Figure 15. High-purity Al: Response contour plots for Ra: (a) Interaction plot for surface roughness Ra; (b) Contour plot for surface roughness Ra vs. cutting speed Vc and feed rate f; (c) Contour plot for surface roughness Ra vs. cutting speed Vc and depth of cut α; (d) Contour plot for surface roughness Ra vs. feed rate f and depth of cut α.
Metals 15 00584 g015
Figure 16. Probability plots for residuals of regression models: (a) main cutting force Fz, (b) surface roughness Ra.
Metals 15 00584 g016
Figure 17. Non-dominated solutions obtained by NSGA−II algorithm.
Metals 15 00584 g017
Figure 18. Location of non-dominated solution applied for conducting the confirmatory experiment.
Metals 15 00584 g018
Figure 19. First measurement for surface roughness: (Ra = 2.139 μm).
Metals 15 00584 g019
Figure 20. Second measurement for surface roughness: (Ra = 2.276 μm).
Metals 15 00584 g020
Figure 21. Third measurement for surface roughness: (Ra = 2.293 μm).
Metals 15 00584 g021
Figure 22. Resulting trend during main cutting force measurement.
Metals 15 00584 g022
Table 1. Face-centered central composite design of experiments (CCD) and parameter levels.
Central Composite Design of Experiments
ParameterSymbolLevel
Low (−1)Center (0)High (1)Unit
Cutting speedVc6090120m/min
Feed ratef0.100.200.30mm/rev
Depth of cutα0.500.751.00mm
Table 2. Spectrographic characterization of high-purity Al, wt%.
AlSiFeCuMgHfMnHg
96.830.180.460.221.060.051.070.00
CrMnZnTiCrGaFeMnFeSiMgMn
1.080.030.020.010.011.5280.6432.14
Table 3. CCD design of experiments and obtained results for Fz and Ra responses (Al).
No.Vc (m/min)f (mm/rev)a (mm)Fz (N)
Al
Ra (μm)
Al
Fz (N)
Al-Gr0.5%
Ra (μm)
Al-Gr0.5%
1600.100.5046.301.8037.901.20
2600.200.75159.105.80141.7010.40
3600.301.00300.4011.80287.8017.00
4900.200.50128.2010.60114.308.80
5900.300.75263.004.60254.309.60
6900.101.0089.103.0087.204.00
71200.300.50181.904.00174.507.80
81200.100.7575.501.0081.603.40
91200.201.00232.704.20228.806.00
Table 4. ANOVA table for response surface regression: Fz (N) vs. Vc, f, a.
SourceDFSeq.SSContribution%Adj.SSAdj.MSF-Val.p-Val.
Model658,811.899.9658,811.8009802.000879.130.001
Linear356,181.495.4944,358.3014,786.101326.150.001
Vc (m/min)151.000.0900369.6000369.600033.150.029
f (mm/rev)143,333.073.6523,643.1023,643.102120.520.001
a (mm)112,797.421.7504653.6004653.600417.380.002
Two-way int.32630.404.4702630.4000876.800078.640.013
Vc × f1136.200.2300077.6000077.600006.960.119
Vc × a12120.403.6000459.4000459.400041.200.023
f × a1373.800.6400373.8000373.800033.530.029
Error222.300.0400022.3000011.10
Total858,834.1100.00
R299.96%
Table 5. ANOVA table for response surface regression: Ra (μm) vs. Vc, f, a.
SourceDFSeq.SSContribution%Adj.SSAdj.MSF-Val.p-Val.
Model6167.49095.28167.49027.914906.720.013
Linear3146.70783.45055.47818.492504.450.019
Vc (m/min)1021.66012.32012.70512.705003.060.022
f (mm/rev)1110.94063.11042.60242.602110.260.085
a (mm)1014.10708.02000.06900.068800.020.091
Two-way int.3020.78311.82020.78306.927601.670.040
Vc × f1018.49610.52008.77708.777102.110.028
Vc × a1001.86701.06000.34400.343800.080.081
f × a1000.42000.24000.42000.420000.100.078
Error2008.30604.72008.30604.1530
Total 100.00
R295.28%
Disclaimer/Publisher’s Note: The statements, opinions and data contained in all publications are solely those of the individual author(s) and contributor(s) and not of MDPI and/or the editor(s). MDPI and/or the editor(s) disclaim responsibility for any injury to people or property resulting from any ideas, methods, instructions or products referred to in the content.

