Article

Theoretical Predictions for the Equation of State of Metal Nickel at Extreme Conditions

1
Institute of Modern Physics, Fudan University, Shanghai 200433, China
2
Applied Ion Beam Physics Laboratory, Fudan University, Shanghai 200433, China
3
State Key Laboratory of Thorium Energy, Shanghai Institute of Applied Physics, Chinese Academy of Sciences, Shanghai 201800, China
*
Authors to whom correspondence should be addressed.
Metals 2025, 15(6), 582; https://doi.org/10.3390/met15060582
Submission received: 31 March 2025 / Revised: 20 May 2025 / Accepted: 21 May 2025 / Published: 24 May 2025
(This article belongs to the Section Computation and Simulation on Metals)

Abstract

A recently developed approach to the partition function with very high efficiency was applied to study the equation of state (EOS) of metal nickel (Ni) up to 3000 K and concurrently 500 GPa. The theoretical results agree very well with previous hydrostatic experiments at room temperature, and at high temperatures, the deviation of our calculated pressures from the latest hydrostatic experiments up to 109 GPa is less than 4.16%, 4.95%, and 5.53% at 1000, 2000, and 3000 K, respectively. Furthermore, an analytical EOS model with only two parameters was developed for common metals at high temperatures, and the analytical EOS of metal Ni was obtained to produce the map of pressure over the temperature–volume plane, which should be helpful to understand the thermodynamic properties of Ni-based alloys.

1. Introduction

In the design of new materials, theoretical predictions of the equation of state (EOS) without experimental data support is crucial to understand the thermodynamic properties. In fact, even for existing materials, the predictions are also necessary since experimental measurement of EOS still confronts some problems, especially at high pressures and high temperatures.
Taking nickel (Ni) as an example, its content is as large as 5% in the Earth’s core [1], where the temperature and pressure reaches 6000 K and 350 GPa, and Ni-based alloys have been widely applied in industries. However, rare experiments concern the EOS of Ni-based alloys, and even for the metal of pure Ni, hydrostatic measurements at room temperature are limited to 156 GPa [2,3,4,5] so far, and at high temperatures, there are only two sets of experiments with pulsed laser to heat the specimen, resulting in the uncertainty of the temperature measurements being as large as ~100 K above 1000 K [3,4], and the results of the two experiments are distinctly different.
According to the ensemble theory, the EOS and all the other thermodynamic properties of materials can be theoretically calculated from the partition function (PF) without any experimental measurement. However, this fundamental approach faces formidable computational challenges: for an N-atom system, a 3N-dimensional configuration integral is required to be solved, rendering it computationally intractable for realistic solids containing ~1023 atoms. In spite of a century of research, this fundamental limitation persists in contemporary materials science.
Quasi-harmonic approximation (QHA) [6,7,8] has emerged as an effective compromise, achieving wide applications by simplifying lattice dynamics through harmonic vibrational modes. However, its inherent assumption of small atomic displacements becomes inadequate at elevated temperatures where an-harmonic effects dominate. In fact, a recent study [9] has quantitatively demonstrated that the accuracy of QHA deteriorates progressively with both increasing temperature and atomic volume. Alternative approaches have also been developed to circumvent this limitation. The particle-in-a-cell model (PCM) [10,11,12] reduces the 3N-dimensional integral into a 3-fold one. Nevertheless, achieving the 3-dimensional integral at the ab initio level remains a technical challenge. Moreover, PCM’s validity is restricted to the conditions above the Debye temperature [13]. A more radical simplification appears in the classical mean field (CMF) [14,15,16,17] method, which reduces the 3-fold integral in PCM into a one-fold spherical approximation. This approach fundamentally assumes isotropic atomic interactions, a significant oversimplification that introduces substantial errors for most crystalline metals. The anisotropic nature of interatomic forces in crystalline systems, particularly along different crystallographic directions, renders CMF’s spherical symmetry assumption physically inappropriate for accurate thermodynamic predictions.
Although the methods mentioned above could be valid in some cases [10,11,12,13,14,15,16,17], they are not universal, and it is unsure which system they are well applicable to. Distinctly different from these methods, a recently developed direct integral approach (DIA) [18] introduces a novel perspective by transforming the 3N-fold integration in PF into a 3N-dimensional effective volume, enabling the PF to be solved with ultra-high efficiency at the ab initio level with high precision. Up to now, DIA has been successfully employed to calculate the EOS and phase transitions of several metals. DIA without any artificial or empirical parameters is applicable to study the thermodynamic properties of any solids in principle. However, considering DIA is a newly developed approach, it needs to be examined by comparing with as many realistic systems as possible.
In the present work, we take Ni as a prototype, and apply DIA to calculate the EOS up to 3000 K and concurrently 500 GPa to further check the reliability of DIA, and simultaneously give theoretical predictions for the EOS at extreme conditions. In order to obtain an analytical EOS of the metal Ni, we applied the widely used Mie–Grüneisen–Debye (MGD) formalism [19,20,21] to fit our calculated results, showing that one of the three parameters in the MGD model, the Debye temperature, could be removed without losing any accuracy of the fitting. Furthermore, a much more simplified and universal model is developed to produce analytical EOS for common metals.

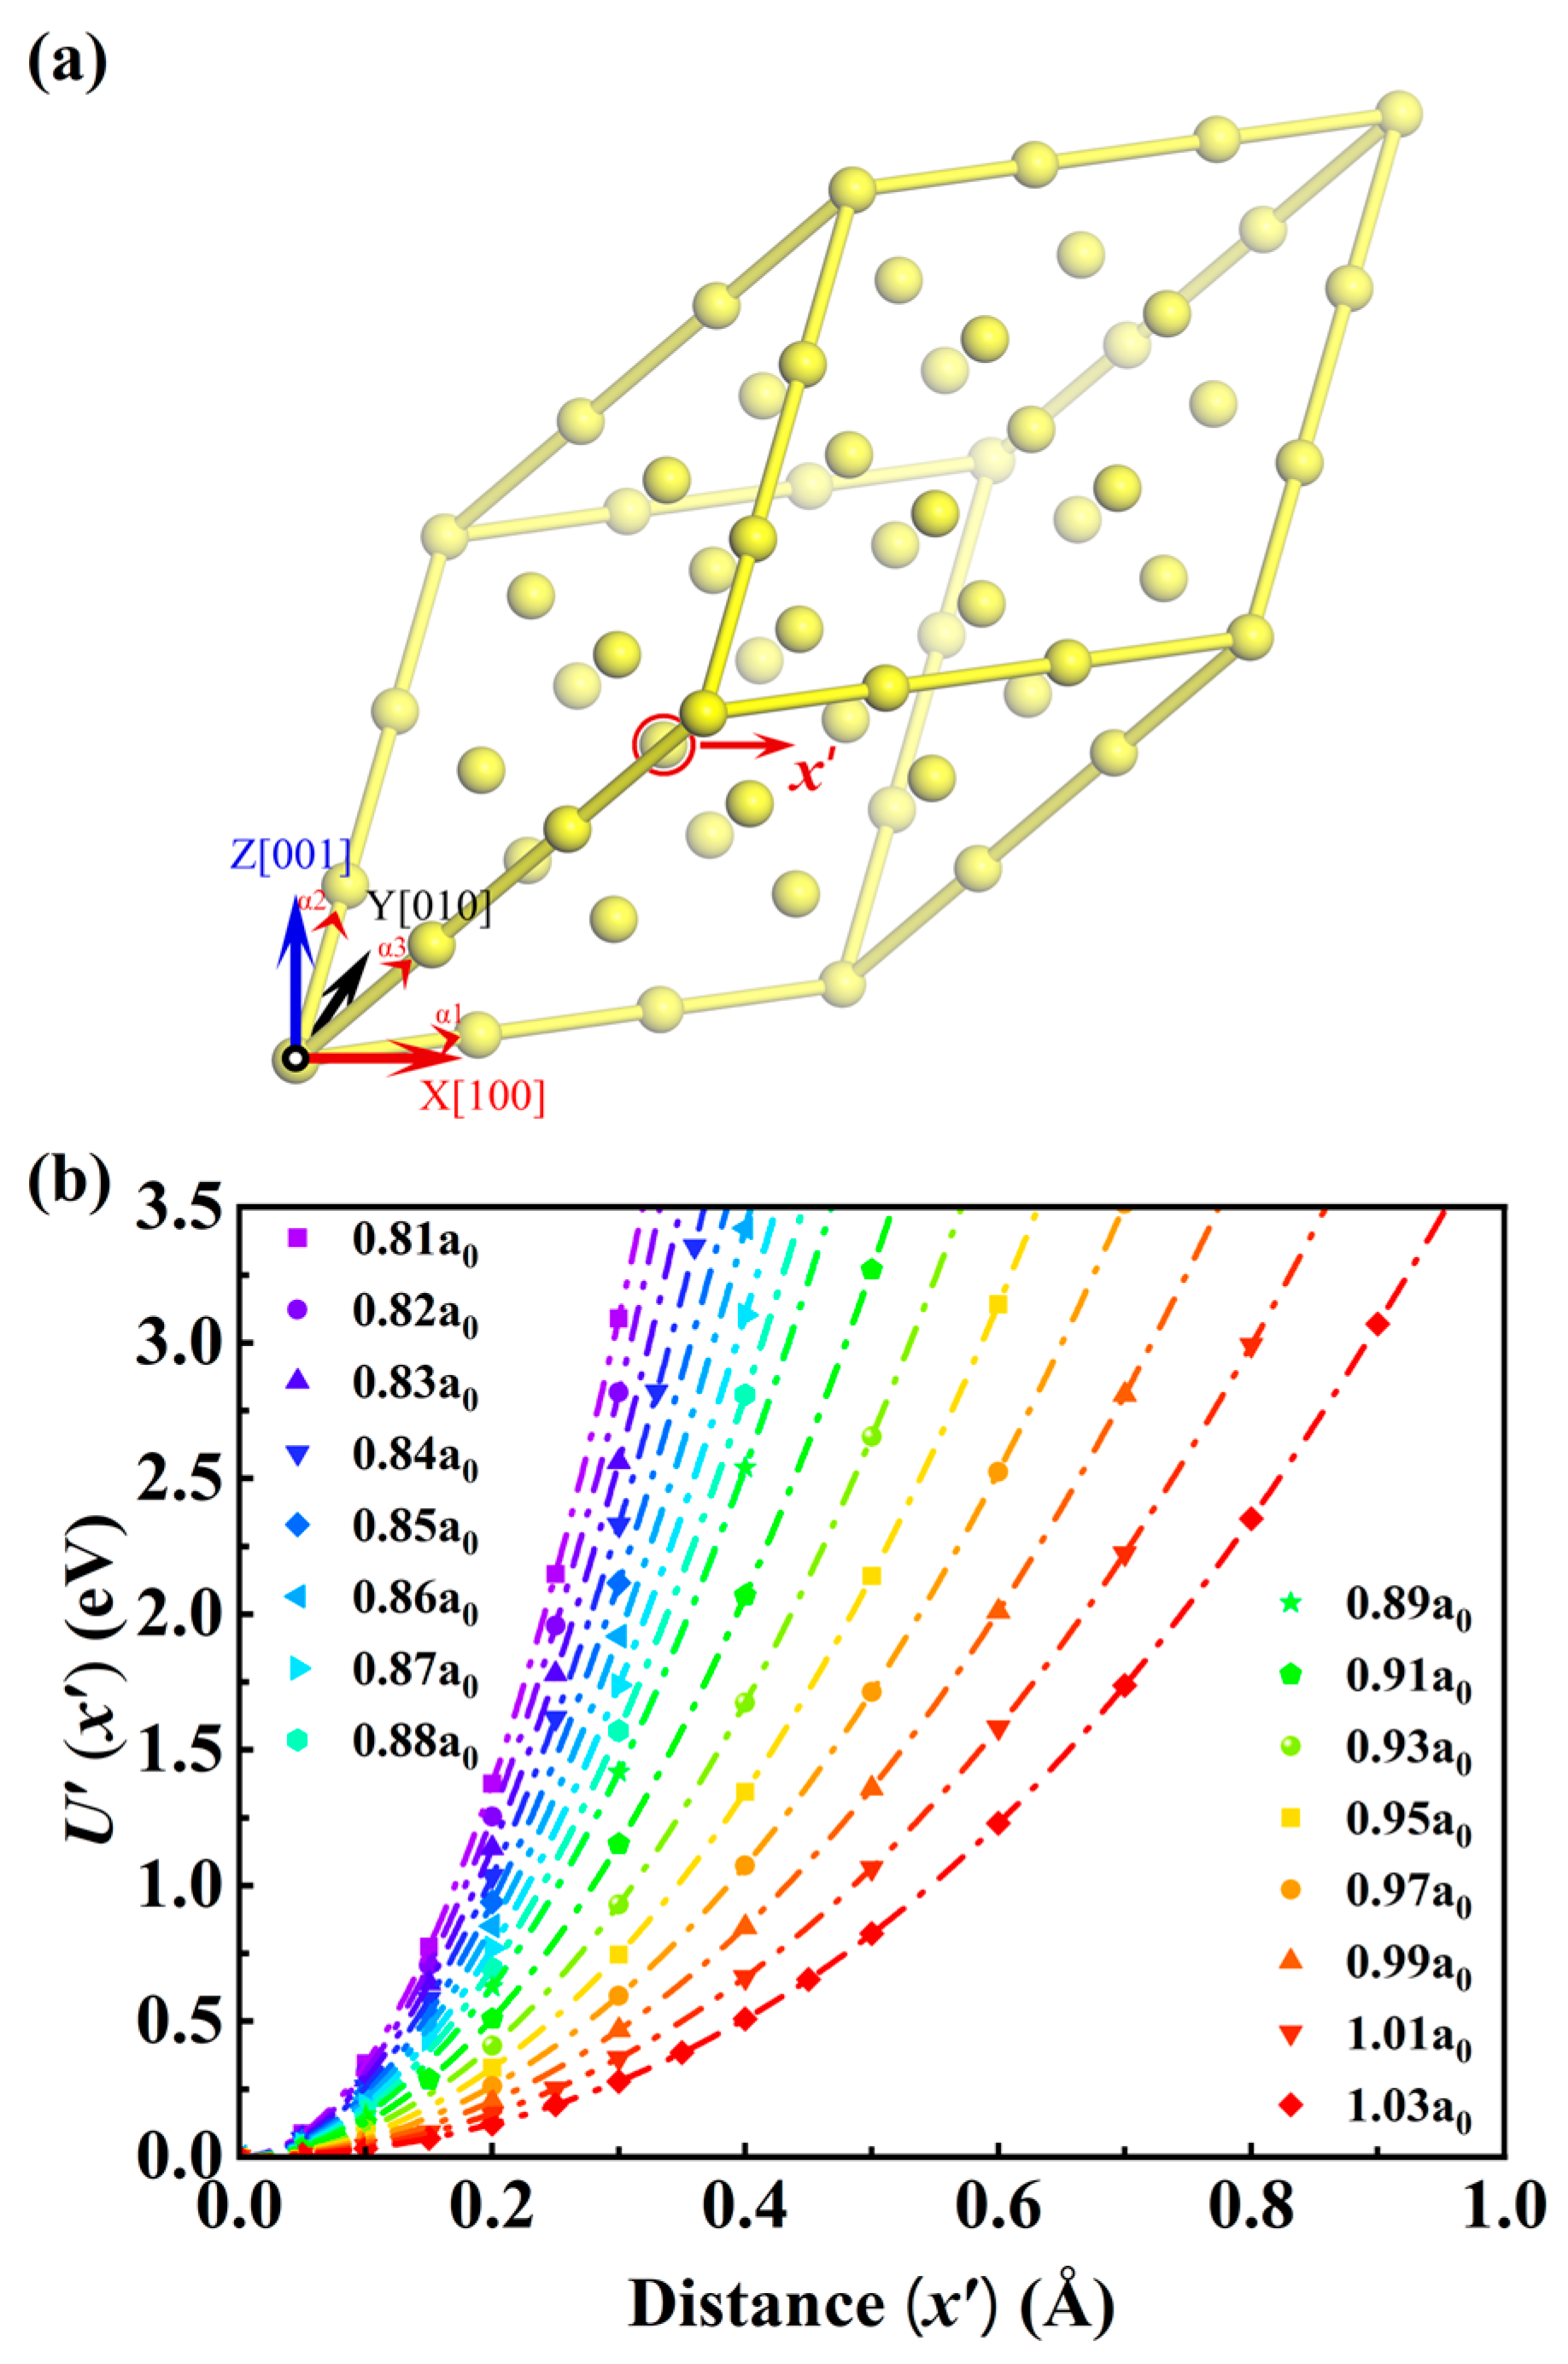
2. Calculation Method

From the ensemble theory, it is known that for a system containing N atoms occupying the spatial position rN = {r1, r2, …, rN}, the PF reads
Z = 1 N ! 2 π m k B T h 2 3 2 N d r N e U r N / k B T ,
in which U(rN) is the interaction energy of the system, and m, h, kB is the atomic mass, Planck constant, and Boltzmann constant, respectively. If the configurational integral
Q = d r N e U r N / k B T
is solved, the pressure (P) as a function of V and T, i.e., the isothermal EOS could be obtained by
P = k B T ln Z V ,
and all the other thermodynamic quantities can also be achieved without any experimental support.
To solve the 3N-dimensional integral in Equation (2), an approach was developed recently by Ning et al. [18], and its essential framework is as follows.
For a crystal in an equilibrium state with the N atoms located at their ideal lattice sites RN = {R1, R2, …, RN} and the total energy of U0(RN), a transformation is firstly introduced,
r N = q N R N ,   U r N = U r N U 0 R N ,
so that rN represents the displacements of atoms away from their equilibrium positions. Then, the Q in Equation (2) is expressed as
Q = e U 0 / k B T d r N e U r N / k B T .
Here, we define a function
F r N = U r N i = 1 N j = x , y , z U 0 r i j 0 ,
and then the 3N-fold integral in Equation (5) turns into
Q = e U 0 / k B T i = 1 N L i x L i y L i z e F r N / k B T ,
in which
L i x = e U 0 r i x 0 / k B T d r i x , L i y = e U 0 r i y 0 / k B T d r i y , L i z = e U 0 r i z 0 / k B T d r i z ,
is defined as the effective length, and rix(riy or riz) is the x (y or z) coordinate of the ith atom away from its ideal lattice site with simultaneously the other two degrees of freedom and all the other atoms fixed at the ideal lattice sites.
Equation (6) could be expanded by a Taylor series as
F r N = F 0 N + i = 1 N j = x , y , z F r i j 0 Δ r i j + i = 1 N j , k = x , y , z 1 2 2 F r i j r i k 0 Δ r i j Δ r i k + = i = 1 N j , k = x , y , z j k 1 2 2 U r N r i j r i k 0 Δ r i j Δ r i k +
Clearly, if U′(rN) changes slow enough with respect to rN, ∂2U′(rN)/∂rijrik and further F(rN) would approach zero, so that the Q of Equation (7) is close to
Q = e U 0 / k B T i = 1 N L i x L i y L i z .
To ensure Equation (10) is a good approximation, the axes of a Cartesian coordinate system should be set as the direction along which U′(rN) changes slowest.
For face-centered cubic metal Ni, if the lattice orientations [100], [010], and [001] are selected as the axes of a Cartesian system, the variations of U′(rN) along all the three axes are the slowest. Thus, Lx is equal to Ly and Lz, so that
Q = e U 0 / k B T L x 3 N .
As shown in Figure 1, a perfect 3 × 3 × 3 supercell containing 27 atoms was constructed for calculating the PF of metal Ni. For a given atomic volume, an arbitrary atom was moved along the [100] direction step by step until the U′(x′) in Equation (4) is larger than 3.5 eV, ensuring convergence of the effective length up to 3000 K. The cubic spline interpolation algorithm [22] is used to smooth U′(x′), then Lx was calculated via Equation (8), following which the corresponding PF could be gained. As shown in Figure 1b, by increasing the lattice constant from 0.81 a0 to 1.03 a0 (a0 = 3. 5236 Å), the PF at 15 volumes can be obtained. For a given temperature, the cubic spline algorithm was again used to fit the PF versus volume data, and from the first-order derivative of the PF as a function of the volume we can obtain the pressure at arbitrary volume.
First principles calculations were performed using the Vienna Ab Initio Simulation Package (VASP) [23,24] to obtain U′(x′), and the computational parameters were set as follows: (1) the projector augmented wave (PAW) pseudopotential [25,26] is used for describing the electron–ion interactions with 3d94s1 selected as the valence orbitals; (2) the Perdew–Burke–Ernzerhof (PBE) [27] exchange–correlation functional within the generalized gradient approximation (GGA) framework is employed to describe the electron–electron interactions; (3) the electronic self-consistency criterion is set as 10−6 eV; (4) a Γ-centered 15 × 15 × 15 k-mesh generated via the Monkhorst–Pack method [28] is adopted to sample the Brillouin zone; (5) the tetrahedron method with Blöchl corrections [25] is used to determine the electron orbital partial occupancy with the plane-wave cutoff energy set as 400 eV; (6) although the magnetic moments of metal Ni were experimentally measured as 0.61 μB at room temperature [29], tests in our calculations showed that 0.61, or 1 μB has negligible effects on the calculated isothermal P-V relationship. For convenience, the tolerant 1 μB was adopted in the present ab initio calculations. The convergence of all these parameters was verified across all the considered volumes with effective length fluctuating below 10−5 Å.

3. Results and Discussion

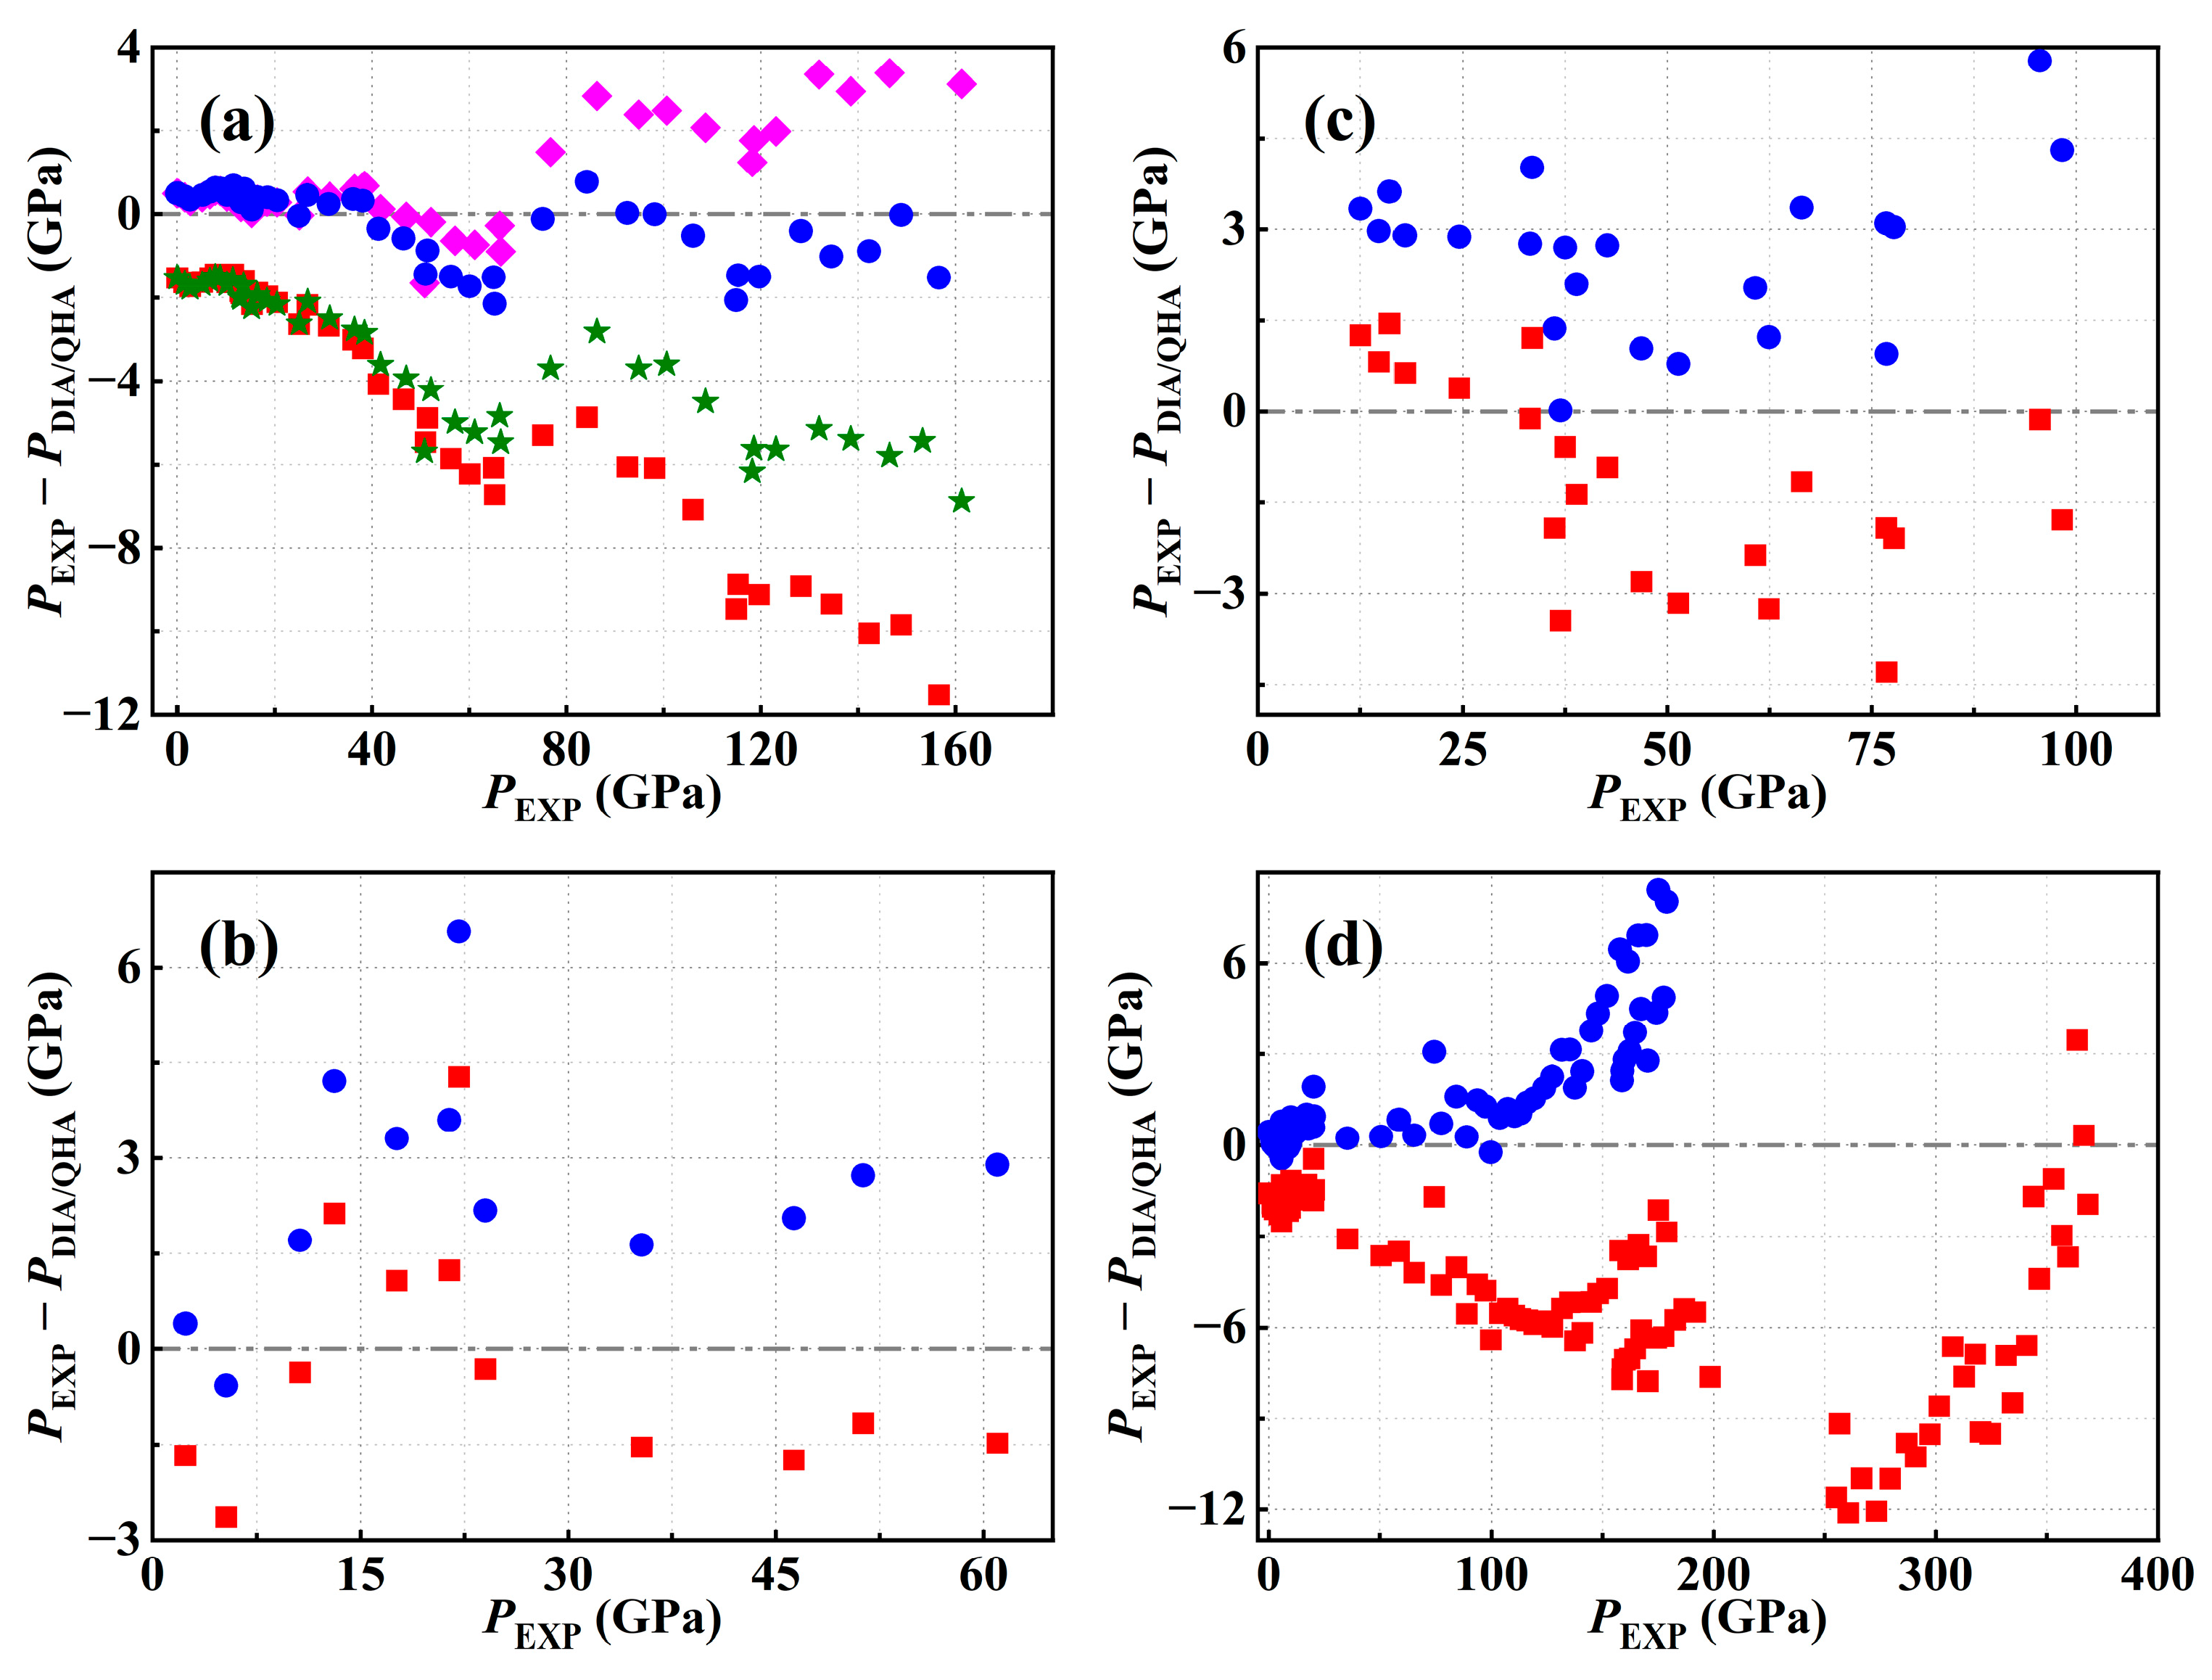
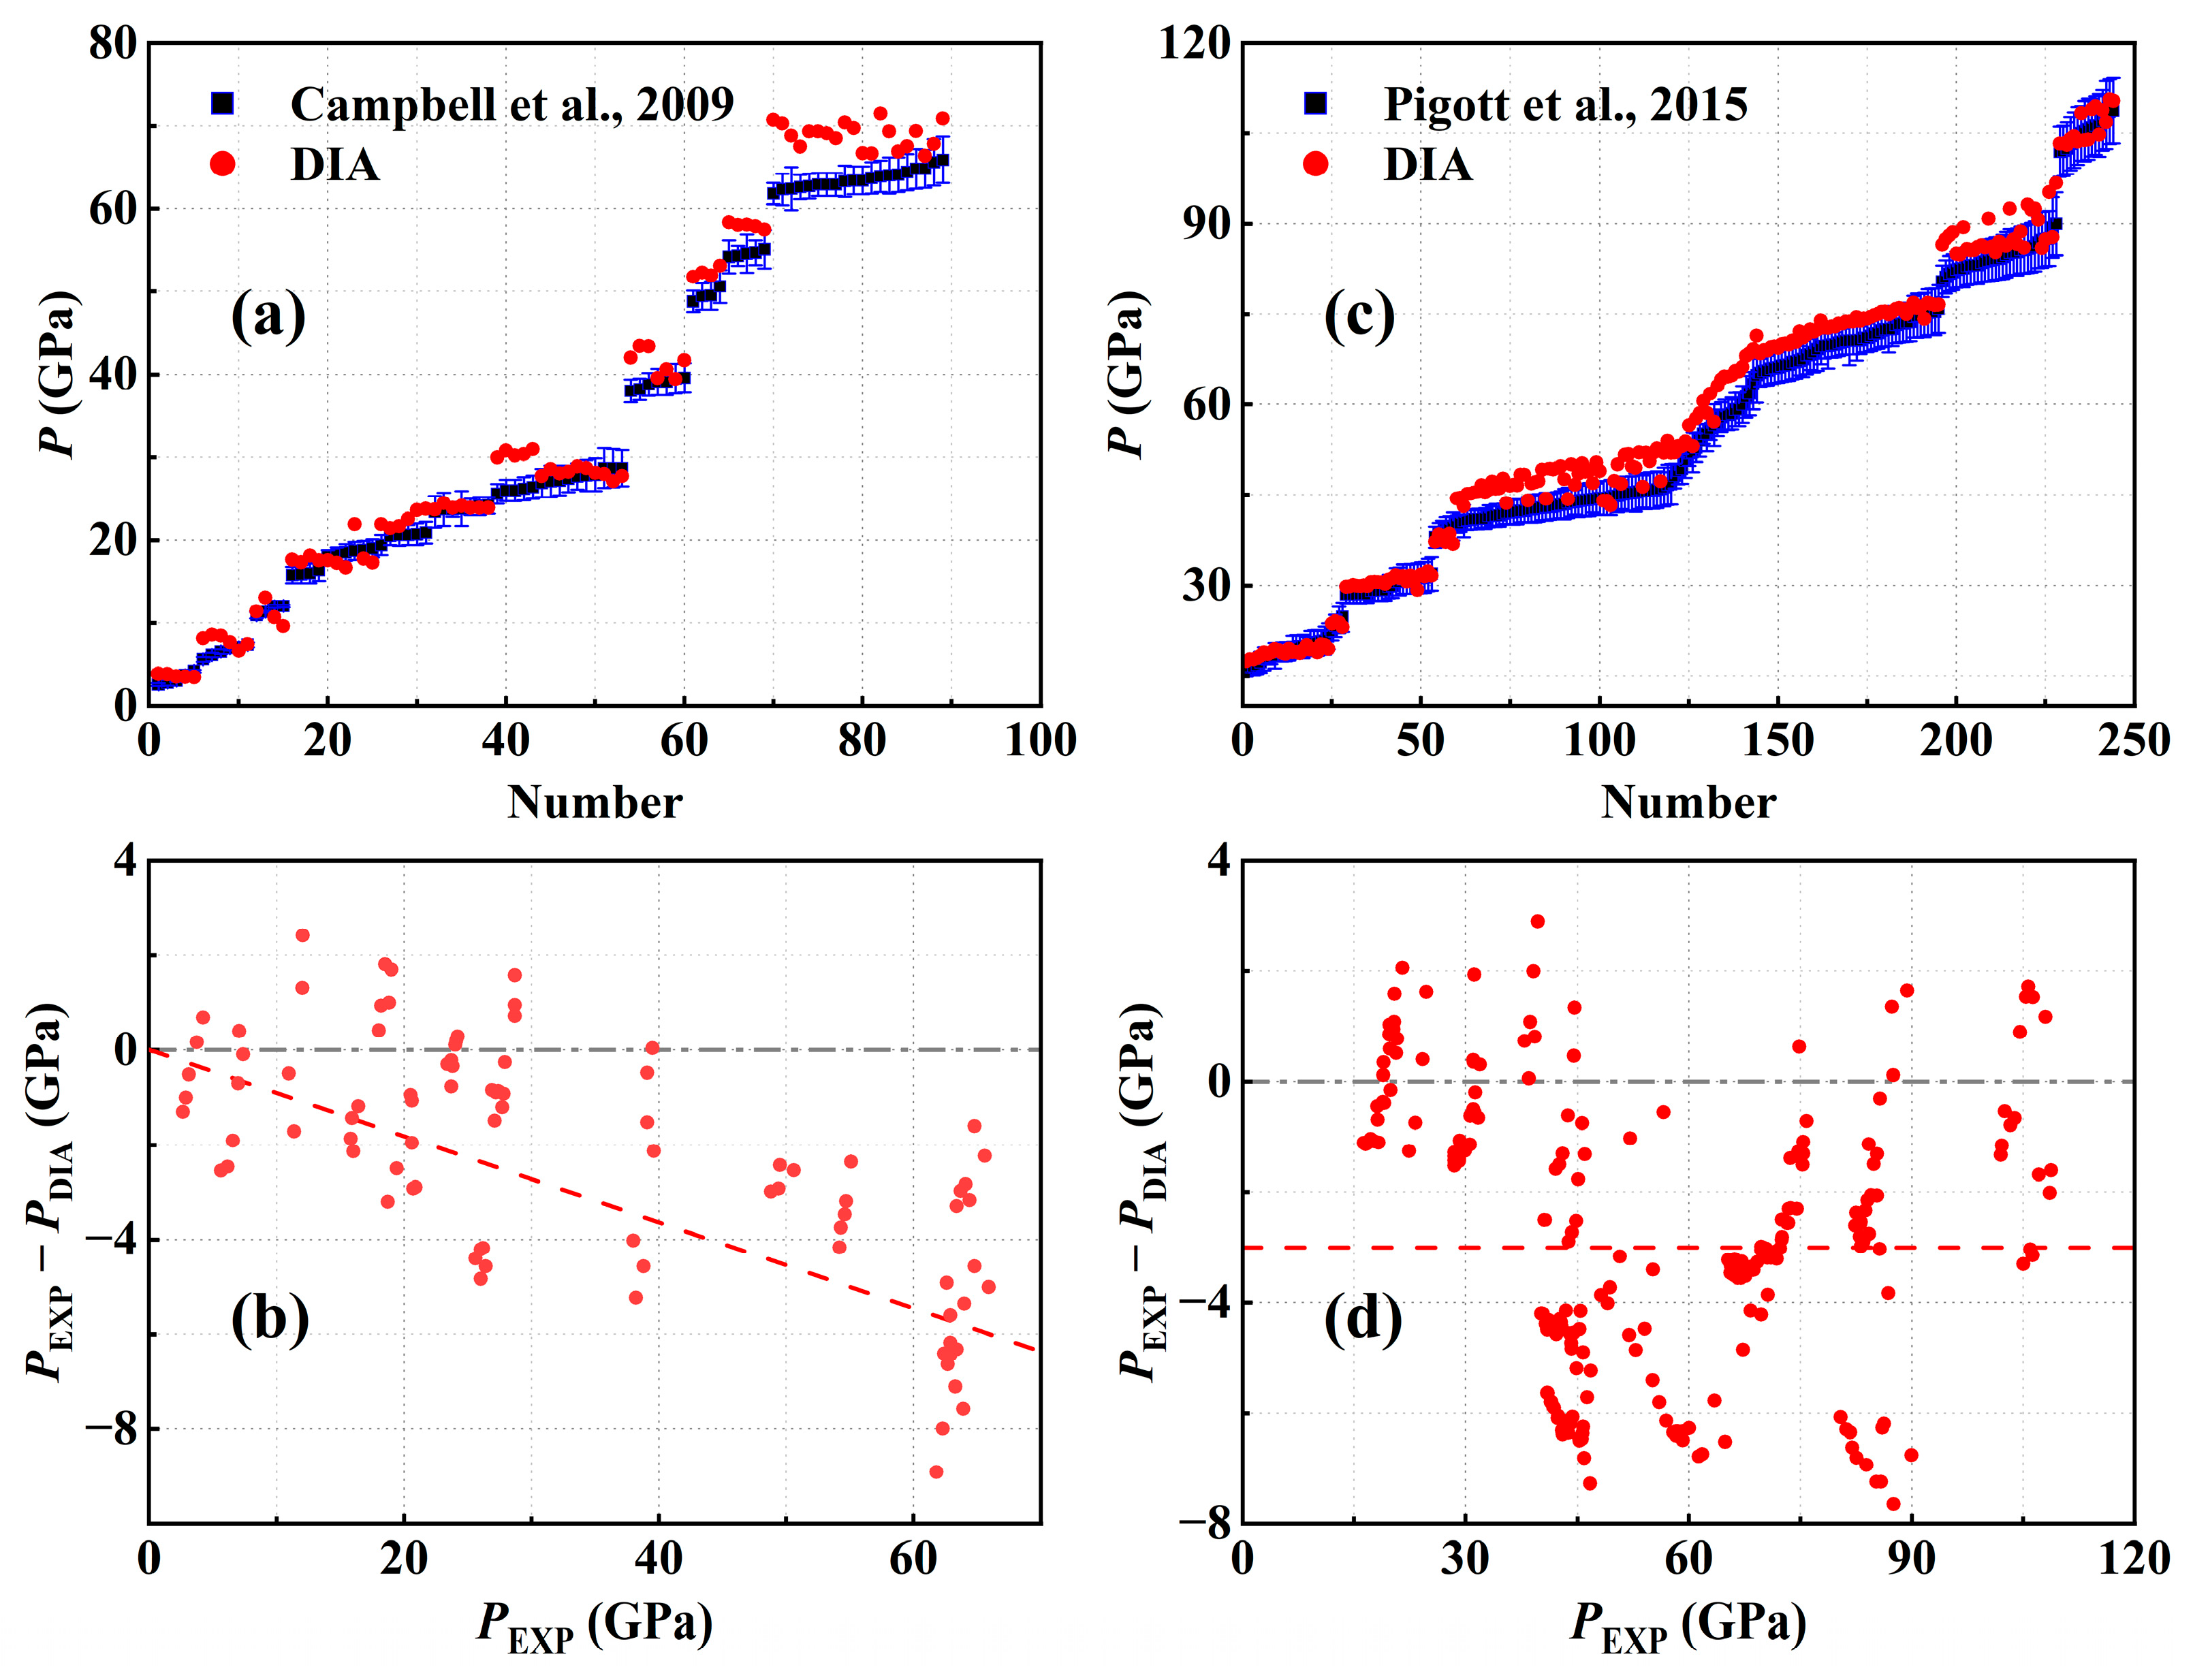
3.1. The Room Temperature Isotherm

Based on DIA, the room temperature P-V relationship of Ni up to 500 GPa is obtained and shown as the red solid line in Figure 2, which includes four sets of experimental data [2,3,4,5] and the results are calculated by QHA [30]. It can be roughly seen that the calculations of both QHA and DIA agree well with the experiments. To specifically inspect the feasibility of DIA, under the same volume, differences between the pressure calculated by DIA (PDIA) or QHA (PQHA) and the experimental measurement (PEXP) are conducted and presented in Figure 3.
In the experiments of Ref. [2], two groups of pressure measurements were provided under two calibrations of the ruby gauge, one of which was established by Mao et al. in 1986 [31], and the other is from Dewaele et al. in 2004 [32]. However, several works [33,34,35,36] have demonstrated that the ruby standard by Mao et al. [31] always underestimates pressures, so we chose the data calibrated by the one of Dewaele et al. to make comparisons with our calculations [32]. As shown in Figure 3a, PDIA is larger than PEXP in the whole pressure range of 0–156.6 GPa, and the difference increases progressively with increasing pressure to ~11 GPa, corresponding to a relative deviation (|PDIAPEXP|/PEXP) of 7.3%. On the other hand, PQHA seems much better than PDIA, and the largest deviation of PQHA from PEXP is about 2.15 GPa, whereas the ruby standard by Dewaele et al. [32] was still proven to underestimate the pressure by subsequent studies of Refs. [36,37]. Under this situation, employing the ruby scale built in Ref. [37] we re-calibrated the pressures in the experiments of Ref. [2]. As shown by the olive stars and magenta diamonds in Figure 3a, the largest deviation of PDIA from the modified PEXP decreases to 6.88 GPa. Meanwhile, the difference between PQHA and the re-calibrated PEXP increases to 3.38 GPa. Evidently, the experimental pressures are directly determined by the accuracy of the ruby scale. In fact, relatively comprehensive parameters of the different ruby gauges developed before 2020 were summarized in Ref. [38], and the authors suggested that a 2.5% uncertainty of the ruby scales should be accepted by the practitioners. Actually, the ruby gauge, as an international practical pressure scale, has been constantly studied, and a new developed one may be built in the near future [39].
As shown in Figure 3b, the differences between PDIA and the PEXP of Ref. [3] distribute evenly around 0, and all the values of |PEXPPQHA| are less than 3 GPa, except for the one at 22.1 GPa, which should result from the accidental error in the experiments since the P-V curve from DIA is continuously progressive. Comparatively, nearly all the PQHA are smaller than the PEXP, and present an average shift of 2.85 GPa.
A larger range of diamond anvil cell (DAC) compressions of Ni up to 98 GPa were reported in Ref. [4]. As shown in Figure 3c, although the deviations of PDIA from the PEXP of Ref. [4] distribute around zero in the whole experimental condition, the differences above 37 GPa are larger than that between PDIA and PEXP of Ref. [3], which may be attributed to the fact that the NaCl pressure transmitting medium (PTM) used in Ref. [3] could supply better hydrostatic conditions than the MgO PTM in Ref. [4]. On the other hand, nearly all the PQHA are larger than the PEXP with an average deviation of 2.59 GPa.
Recently, a set of volume measurements of Ni up to 368 GPa was reported in Ref. [5], but their DAC compressions above >21 GPa were performed without any PTM. As shown in Figure 3d, most of the non-hydrostatic PEXP are smaller than PDIA, which qualitatively indicates the reliability of DIA since the pressures under non-hydrostatic conditions are recognized to be smaller than that under hydrostatic conditions. On the other hand, it is noticed that although PEXP below 21 GPa in Ref. [5] was obtained within the helium PTM, all these hydrostatic PEXP are still smaller than PDIA. As we know that the pressures determined in DAC experiments depend not only on the experimental conditions but also on the accuracy of the adopted pressure standards, it is difficult for us to judge which factor should be attributed for the current difference between PDIA and the hydrostatic PEXP of Ref. [5] since some PEXP < 21 GPa in both Refs. [3,4] are larger than the corresponding PDIA. As the pressure calculated by QHA in Ref. [30] is just up to 180 GPa, comparisons between PQHA and the experiment of Ref. [5] are only within 0–180 GPa. Obviously, nearly all the PEXP are larger than PQHA.
The above discussions show that when compared to the latest two hydrostatic experiments of Refs. [3,4], DIA manifests better than QHA.

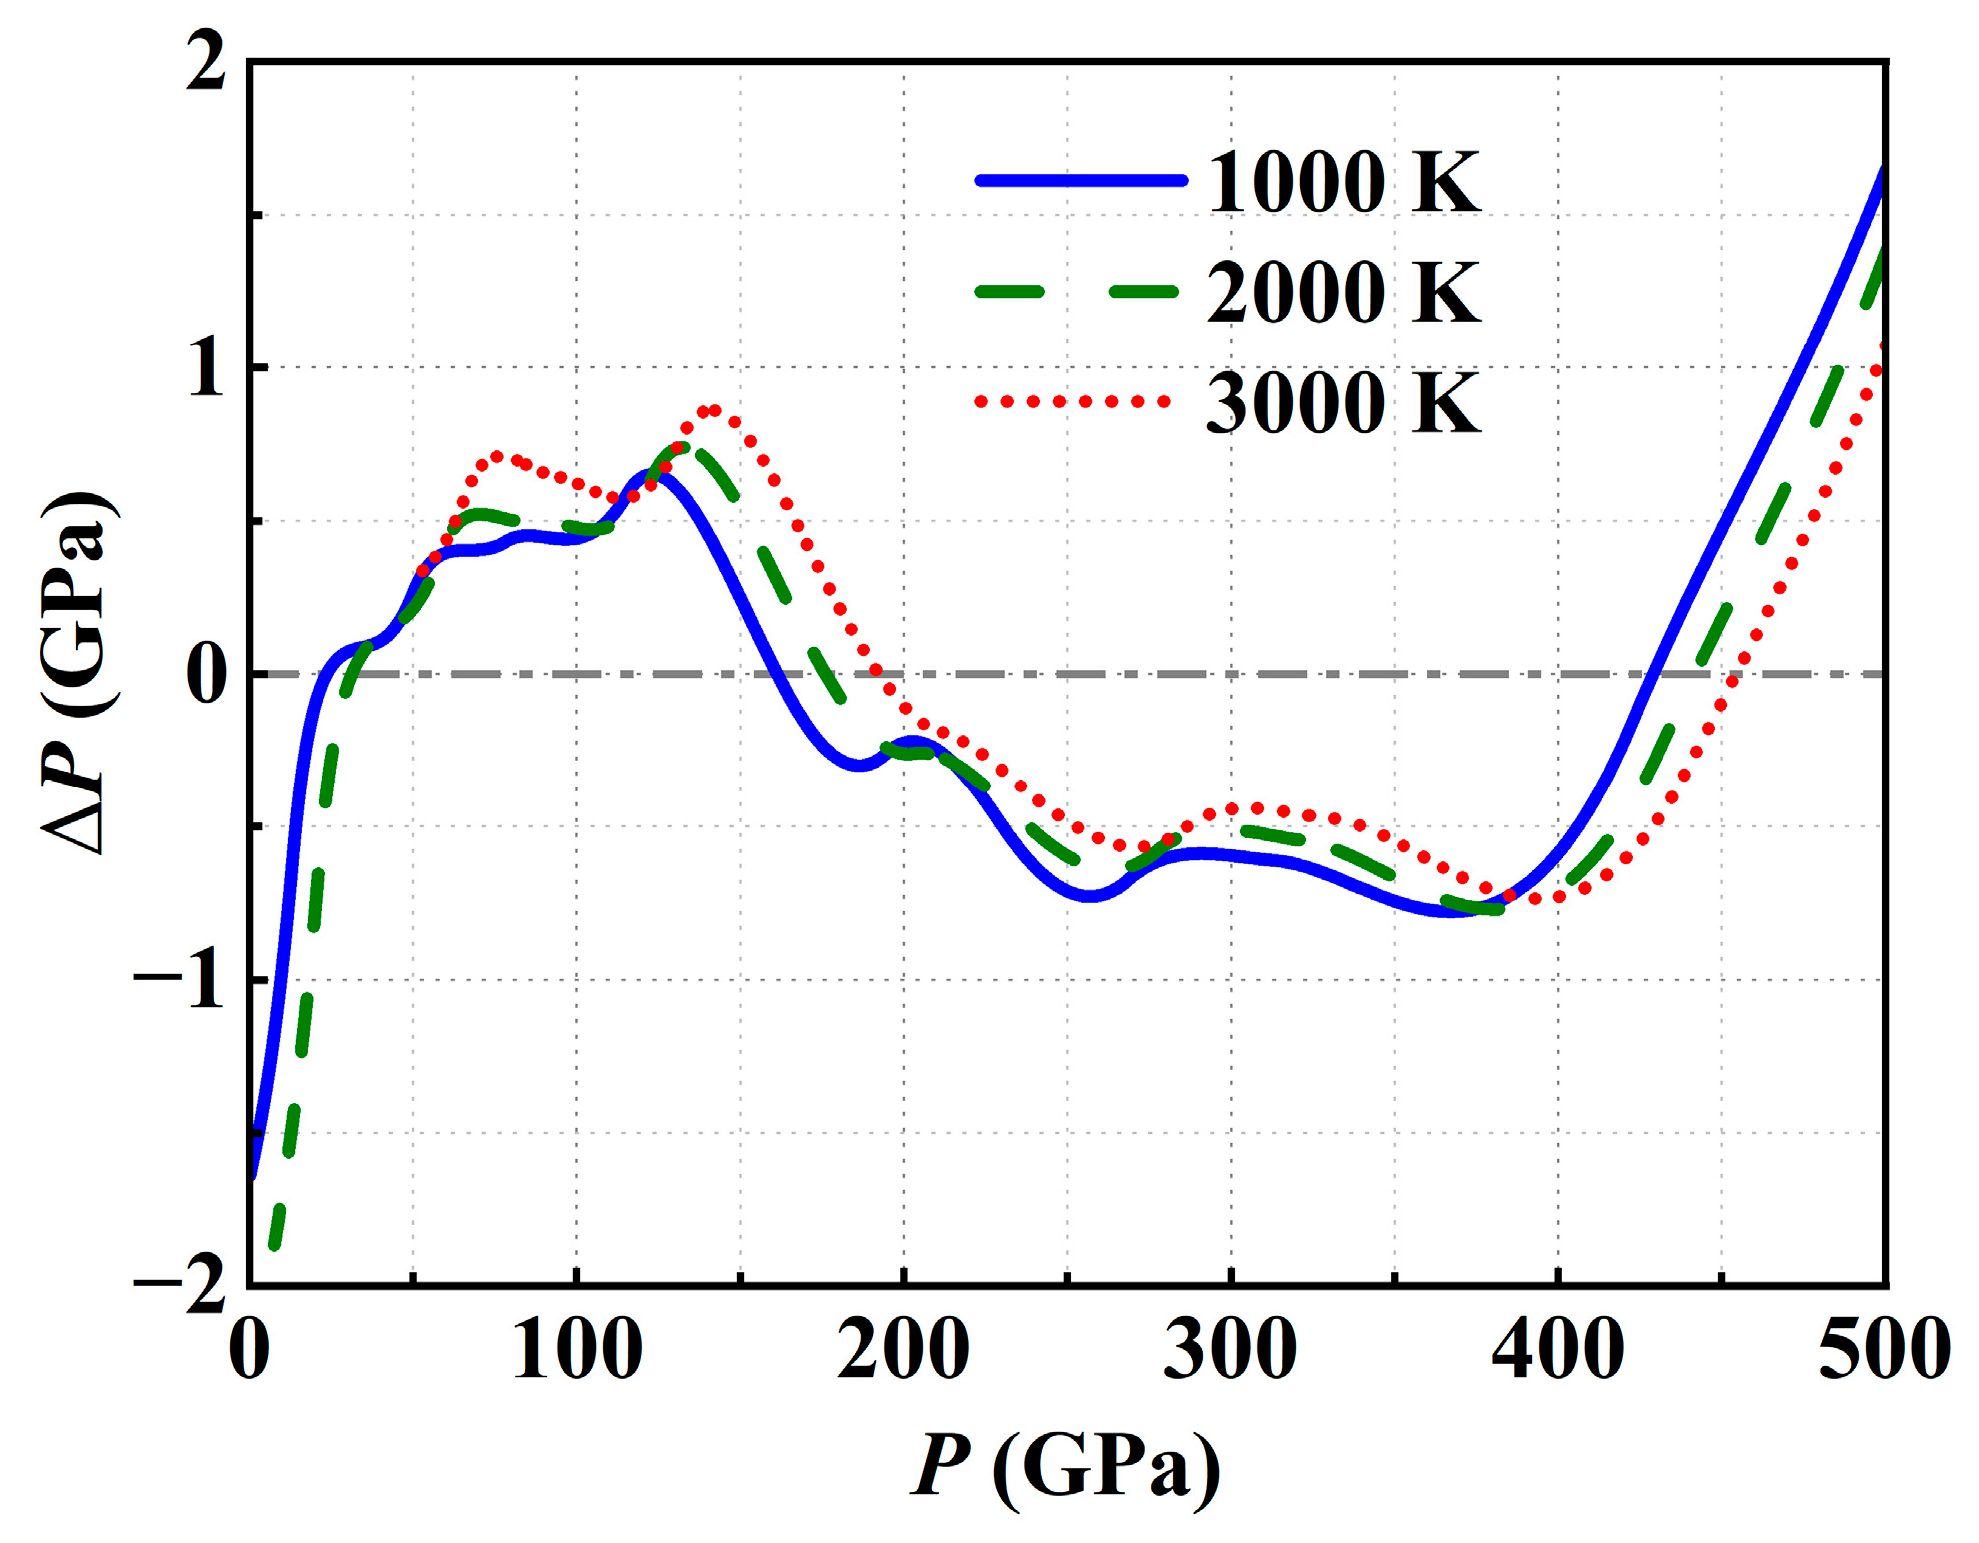
3.2. The High-Temperature Isotherms

On the P-V relationship of Ni at high temperatures (>300 K), Campbell et al. [3] using a multi-anvil press and laser-heated diamond anvil cells (LHDACs) completed a group of measurements with the covered P, T reaching 2457 K and 66 GPa. Pigott et al. [4] using LHDAC achieved the volume measurements of Ni up to 109 GPa and 2941 K. Unfortunately, a large uncertainty of the manipulated temperature is noted in both the experiments of Refs. [3,4], so that the measured P-V-T data are isolated points instead of isotherms. To inspect the feasibility of DIA, we calculated the pressure at each pair of the experimentally measured (V, T) of the Ni sample in Refs. [3,4], and then performed specific comparisons with the experiments. In order to show the differences clearly, we arranged the pressures in Refs. [3,4] in an ascending order mapped by the Arabic numerals shown as the blue symbols in Figure 4a,c, where the red symbols are the corresponding results by DIA (Supplementary Materials, Tables S1 and S2).
From Figure 4b,d, we can see that the deviations of our calculated pressures from the ones in both the experiments of Refs. [3,4] distribute at the two sides of the gray dashed line, but as denoted by the red dashed line in the two figures, PDIA presents an increasing deviation from the PEXP of Ref. [3], while it exhibits an average offset from the PEXP of Ref. [4]. In contrast to the room temperature cases in Figure 3b,c, it is obvious that the deviations of PDIA from the PEXP of both Refs. [3,4] become larger at high temperatures, and the largest |PEXPPQHA| reaches ~8 GPa. It is known that controlling the temperature becomes harder and harder with increasing temperatures; the uncertainty reaches more than 300 K at ~1200 K, and up to 500 K at ~1900 K for the pressure gauges in the two experiments, which may be one of the predominant factors in giving rise to large errors for the experimental pressure determinations.
For realistic applications, having a good command of the isotherms of Ni at high temperatures is demanded. In Refs. [3,4], the measured P-V-T data were fitted by the Mie–Grüneisen–Debye formalism (MGD) [19,20,21], and from the fitted parameters, the isotherms of Ni could be obtained. However, the results in Refs. [3,4] are effective just to 66 GPa, 2457 K, and 109 GPa, 2941 K, respectively. In the present work, we calculated the isotherms of Ni up to 3000 K and simultaneously 500 GPa, which are listed in Table 1. To discuss the differences among the high-temperature isotherms of Ni reported by different experiments and theoretical calculations, the P-V curves of Ni under 1000, 2000, and 3000 K from Refs. [3,4], DIA and QHA are displayed in Figure 5a–c. Since the largest calculated pressure in Ref. [30] is limited to 180 GPa, and according to Ref. [40], solid Ni exists above 7.5 GPa at 2000 K and 50.6 GPa at 3000 K, the comparisons and discussions in this section are just within these conditions. Under the same volume, the differences between PQHA, PEXP of Ref. [3], or Ref. [4] and PDIA at 1000, 2000, and 3000 K are correspondingly displayed in Figure 5d–f, from which we can see that PQHA [30] is relatively close to the PEXP of Ref. [4] in the whole pressure and temperature range with the largest difference of less than 3.2 GPa, whereas both PQHA and PEXP of Ref. [4] are consistently smaller than PDIA. The deviation of PEXP in Ref. [4] (PQHA) from PDIA increases gradually with increasing pressure with the largest relative error ((PEXPPDIA)/PDIA) of 5.25%, 5.78%, and 6.19% (6.58%, 6.64% and 6.65%) at 1000, 2000, and 3000 K, respectively. It is noted that the pressures in the experiment of Ref. [3] were also determined based on the MGD model, but the derived isotherms are far away from the ones reported in Ref. [4]. As shown in Figure 5d–f, the largest relative difference between PEXP in Ref. [3] and PDIA reaches 15.58%, 14.08%, and 12.46% at 1000, 2000, and 3000 K, respectively.
The above discussions show that our high-temperature P-V relationship agrees better with the fitted EOS under the experiment of Ref. [4] than Ref. [3]. In addition, it is noted that QHA is rarely applied to such high temperatures up to 3000 K due to its effectiveness only with respect to small atomic vibrations. Based on the mathematic foundation, the precision of DIA may decrease with increasing temperature, but the accuracy indeed increases with decreasing volume [9], so the predictions for the isotherms of Ni up to 3000 K and simultaneously 500 GPa are expected to be proven by future experiments.

3.3. The Analytical EOS

For practical application of metal Ni, it is necessary to obtain an analytical isothermal EOS based on the calculated results of DIA to determine the pressure for arbitrary volume V and temperature T. For this purpose, the MGD model [19,20,21] should be a good choice since it has been applied successfully to fit experimental data to obtain analytical EOS at high temperatures [3,4]. In this model, the total pressure P is considered to be the summation of thermal pressure Pth and the room temperature one P300K. Pth as a function of V and T is determined by three parameters via the following equations,
P th = γ U T U 300 K V
and
U T = 9 n R θ / 8 + T T / θ 3 0 θ / T x 3 e x 1 dx ,
where R is the gas constant and n is the mole number of atoms confined within volume V. The Grüneisen parameter γ and Debye temperature θ are regarded to be only volume dependent via
γ = γ 0 V / V 0 q
and
θ = θ 0 exp γ 0 γ q ,
in which the quantities with subscript 0 represent the corresponding values at 300 K and one atmospheric pressure. γ0, q, and θ0 are the three parameters to be decided. P300K can be described by the third-order Birch–Murnaghan (BM) [41] EOS
P 300 K = 3 2 K 0 V 0 / V 7 3 V 0 / V 5 3 1 + 3 4 K 0 4 V 0 / V 2 3 1
with K0 and K0′ being the bulk modulus and its pressure derivative at one atmospheric pressure.
Although K0 and K0′ could be easily obtained by fitting experimental data via Equation (16), determining γ0, q, and θ0 will cost too many computer hours because an integral equation (Equation (13)) is involved in the MGD model. Actually, in previous applications of the model [3,4], the parameter θ0 measured by other experiments was pre-introduced. For example, Ref. [4] employed an MGD model fitting the experimental P-V-T data of metal Ni with θ0 of 415 K [42], and γ0 and q were then determined to be 1.98 and 1.3. In fact, the fitted results are insensitive to θ0. When we varied the value of θ0 from 1 to 500 K without changing the value of γ0 and q, the obtained pressures deviate from the original ones with θ0 of 415 K by no more than 0.45 GPa (Figure 6), which is significantly smaller than the uncertainty of the experimental measurements.
It is notable that the internal energy expressed by Equation (13) is based on the harmonic approximation, and tends to be UT = 3nRT when the temperature T is larger than the Debye temperature. It is a fact that the Debye temperature for most solids is in the range of 200–400 K, and therefore the internal energy at temperature above 300 K should be independent of volume and can be simplified as 3nRT. Accordingly, the expression of the thermal pressure Pth can be simplified as
P th = 3 n R T 300 γ 0 V V V 0 q .
Thus, the MGD model is reduced to a simplified one without parameter θ0 and the integral equation Equation (13). We apply this simplified model to calculate the pressure of metal Ni with parameter γ0 and q taken as 1.98 and 1.3 determined in Ref. [4]; the results deviate from the predictions under the MGD model by no more than 0.42 GPa (Figure 6), which is significantly smaller than the uncertainty of the experimental measurements. Furthermore, we obtained an analytical EOS of metal Ni by fitting the calculated results (Table 1) of DIA via the simplified model, showing that the fitted pressure deviates from the original one by no more than 2 GPa (Figure 7). As shown in Table 2, the parameters of the EOS determined by DIA present some difference from the ones determined by fitting experimental data under the MGD model reported in Refs. [3,4]. Relatively, our theoretical parameters are closer to the latter ones.
Applying the analytical EOS of metal Ni, we obtained a map of pressure distribution over the T-V plane shown in Figure 8a, which is similar to the empirical predictions (Figure 8b) based on the MGD fitting experimental data [4]. The isobars in Figure 8a,b indicate clearly that the pressure depends mainly upon the volume instead of the temperature varying from 300 to 3000 K. For a given pressure, the volume expands linearly with the temperature and the expansion rate becomes slower and slower with increasing pressure. When the pressure is larger than 400 GPa, the volume remains nearly unchanged even if the temperature increases from 300 to 3000 K. For arbitrary volume (or pressure) and temperature, the pressure (or the volume) can be easily read from this pressure map.
The difference between our theoretical predictions and the empirical ones take place mainly in the high-pressure region. As shown in Figure 8c, there exists a T-V curve along which our theoretical prediction is the same as the ones of the empirical prediction, and the theoretical pressure is larger than the empirical one by 5 GPa when the pressure is ~200 GPa. As the pressure increases to 500 GPa, the pressure difference reaches 31.1 GPa, which can be understood in consideration of the fact that the empirical predictions using the MGD model are based on the experimental data below 109 GPa, resulting in the corresponding extrapolations perhaps being unreliable, and on the other hand, it is really not sure if the pseudopotential and the exchange–correlation function in the ab initio calculations is still efficient up to 500 GPa.

4. Conclusions

As a recently developed approach to the classical PF, DIA should be applied to more realistic materials to check its reliability. In this work, we applied DIA at the ab initio level to study the EOS of metal Ni up to 3000 K and simultaneously 500 GPa, and obtained an analytical expression of the EOS. The theoretical results are in good agreement with available hydrostatic experiments, suggesting that DIA is a good approximation method and that the predictions under extreme conditions are expected to be confirmed by future experiments. The map of pressure distribution over the T-V plane should be helpful to understand the thermodynamic properties of Ni-based alloys. The simplified EOS model would find its vast applications for obtaining the EOS of various solids by fitting limited experimental or theoretical data, which should be valuable in the field of high-temperature and high-pressure research. It should be pointed out that DIA is based on the classical statistical mechanics, which does not include the quantum effects at low temperatures, so DIA fails to work when the temperature is far below the Debye temperature.

Supplementary Materials

The following supporting information can be downloaded at: https://www.mdpi.com/article/10.3390/met15060582/s1. Supplementary Table S1: To make clear comparisons, the experimental pressures (PEXP) in Ref. [3] were arranged in an ascending order and displayed in column B. Column C, D, and E are the corresponding measured volumes (VEXP), temperatures (TEXP), and the experimental pressure uncertainty (ΔPEXP). At each VEXP and TEXP, the pressures calculated from DIA (PDIA) were exhibited in column F. Supplementary Table S2: Similar to Table S1 except for the experimental data taken from Ref. [4].

Author Contributions

Conceptualization S.W., Y.T., B.N., H.Z. and X.N.; Data curation S.W., H.Z. and X.N.; Formal analysis S.W., Y.T., H.Z. and X.N.; Investigation S.W., Y.T., B.N., H.Z. and X.N.; Methodology B.N. and X.N.; Project administration X.N.; Supervision X.N.; Visualization S.W., H.Z. and X.N.; Writing—original draft S.W.; Writing—review & editing S.W., Y.T., B.N., H.Z. and X.N. All authors have read and agreed to the published version of the manuscript.

Funding

This research received no external funding.

Data Availability Statement

The original contributions presented in this study are included in the article/Supplementary Materials. Further inquiries can be directed to the corresponding authors.

Conflicts of Interest

The authors have no conflicts of interest.

References

  1. Holland, H.D.; Turekian, K.K. Treatise on Geochemistry; Elsevier: Amsterdam, The Netherlands, 2013; Volume 3, pp. 559–577. [Google Scholar]
  2. Dewaele, A.; Torrent, M.; Loubeyre, P.; Mezouar, M. Compression curves of transition metals in the Mbar range: Experiments and projector augmented-wave calculations. Phys. Rev. B 2008, 78, 104102. [Google Scholar] [CrossRef]
  3. Campbell, A.J.; Danielson, L.; Righter, K.; Seagle, C.T.; Wang, Y.; Prakapenka, V.B. High pressure effects on the iron–iron oxide and nickel–nickel oxide oxygen fugacity buffers. Earth Planet. Sci. Lett. 2009, 286, 556. [Google Scholar] [CrossRef]
  4. Pigott, J.S.; Ditmer, D.A.; Fischer, R.A.; Reaman, D.M.; Hrubiak, R.; Meng, Y.; Davis, R.J.; Panero, W.R. High-pressure, high-temperature equations of state using nanofabricated controlled-geometry Ni/SiO2/Ni double hot-plate samples. Geophys. Res. Lett. 2015, 42, 10. [Google Scholar] [CrossRef]
  5. Hirao, N.; Akahama, Y.; Ohishi, Y. Equations of state of iron and nickel to the pressure at the center of the Earth. Matter Radiat. Extremes 2022, 7, 038403. [Google Scholar] [CrossRef]
  6. Karki, B.B.; Wentzcovitch, R.M.; de Gironcoli, S.; Baroni, S. High-pressure lattice dynamics and thermoelasticity of MgO. Phys. Rev. B 2000, 61, 8793. [Google Scholar] [CrossRef]
  7. Togo, A.; Tanaka, I. First principles phonon calculations in materials science. Scr. Mater. 2015, 108, 1–5. [Google Scholar] [CrossRef]
  8. Hoja, J.; Reilly, A.M.; Tkatchenko, A. First-principles modeling of molecular crystals: Structures and stabilities, temperature and pressure. Wiley Interdiscip. Rev. Comput. Mol. Sci. 2017, 7, e1294. [Google Scholar] [CrossRef]
  9. Gong, L.-C.; Ning, B.-Y.; Ming, C.; Weng, T.-C.; Ning, X.-J. How accurate for phonon models to predict the thermodynamics properties of crystals. J. Phys. Condens. Matter 2020, 33, 085901. [Google Scholar] [CrossRef]
  10. Wasserman, E.; Stixrude, L.; Cohen, R.E. Thermal properties of iron at high pressures and temperatures. Phys. Rev. B 1996, 53, 8296. [Google Scholar] [CrossRef]
  11. Cohen, R.E.; Gülseren, O. Thermal equation of state of tantalum. Phys. Rev. B 2001, 63, 224101. [Google Scholar] [CrossRef]
  12. Gannarelli, C.M.S.; Alfe, D.; Gillan, M.J. The particle-in-cell model for ab initio thermodynamics: Implications for the elastic anisotropy of the Earth’s inner core. Phys. Earth Planet. Inter. 2003, 139, 243. [Google Scholar] [CrossRef]
  13. Xiang, S.; Xi, F.; Bi, Y.; Xu, J.A.; Geng, H.; Cai, L.; Liu, J. Ab initio thermodynamics beyond the quasiharmonic approximation: W as a prototype. Phys. Rev. B 2010, 81, 014301. [Google Scholar] [CrossRef]
  14. Wang, Y. Classical mean-field approach for thermodynamics: Ab initio thermophysical properties of cerium. Phys. Rev. B 2000, 61, R11863. [Google Scholar] [CrossRef]
  15. Wang, Y.; Chen, D.; Zhang, X. Calculated equation of state of Al, Cu, Ta, Mo, and W to 1000 GPa. Phys. Rev. Lett. 2000, 84, 3220. [Google Scholar] [CrossRef]
  16. Wang, Y.; Ahuja, R.; Johansson, B. Reduction of shock-wave data with mean-field potential approach. J. Appl. Phys. 2002, 92, 6616. [Google Scholar] [CrossRef]
  17. Wang, Y.; Liu, Z.K.; Chen, L.Q.; Burakovsky, L.; Preston, D.L.; Luo, W.; Ahuja, R. Mean-field potential calculations of shock-compressed porous carbon. Phys. Rev. B 2005, 71, 054110. [Google Scholar] [CrossRef]
  18. Ning, B.-Y.; Gong, L.-C.; Weng, T.-C.; Ning, X.-J. Efficient approaches to solutions of partition function for condensed matters. J. Phys. Condens. Matter 2020, 33, 115901. [Google Scholar] [CrossRef]
  19. Fei, Y.; Mao, H.K.; Shu, J.; Hu, J. P-V-T equation of state of magnesiowüstite (Mg0.6Fe0.4)O. Phys. Chem. Miner. 1992, 18, 416. [Google Scholar] [CrossRef]
  20. Jackson, I.; Rigden, S.M. Analysis of P-V-T data: constraints on the thermoelastic properties of high-pressure minerals. Phys. Earth Planet. Inter. 1996, 96, 85. [Google Scholar] [CrossRef]
  21. Dewaele, A.; Loubeyre, P.; Occelli, F.; Mezouar, M.; Dorogokupets, P.I.; Torrent, M. Quasihydrostatic equation of state of iron above 2 Mbar. Phys. Rev. Lett. 2006, 97, 215504. [Google Scholar] [CrossRef]
  22. Dierckx, P. An algorithm for smoothing, differentiation and integration of experimental data using spline functions. J. Comput. Appl. Math. 1975, 1, 165. [Google Scholar] [CrossRef]
  23. Kresse, G.; Furthmüller, J. Efficiency of ab-initio total energy calculations for metals and semiconductors using a plane-wave basis set. Comput. Mater. Sci 1996, 6, 15. [Google Scholar] [CrossRef]
  24. Kresse, G.; Furthmüller, J. Efficient iterative schemes for ab initio total-energy calculations using a plane-wave basis set. Phys. Rev. B 1996, 54, 11169. [Google Scholar] [CrossRef] [PubMed]
  25. Blöchl, P.E. Projector augmented-wave method. Phys. Rev. B 1994, 50, 17953. [Google Scholar] [CrossRef]
  26. Kresse, G.; Joubert, D. From ultrasoft pseudopotentials to the projector augmented-wave method. Phys. Rev. B 1999, 59, 1758. [Google Scholar] [CrossRef]
  27. Perdew, J.P.; Burke, K.; Ernzerhof, M. Generalized gradient approximation made simple. Phys. Rev. Lett. 1996, 77, 3865. [Google Scholar] [CrossRef]
  28. Monkhorst, H.J.; Pack, J.D. Special points for Brillouin-zone integrations. Phys. Rev. B 1976, 13, 5188. [Google Scholar] [CrossRef]
  29. Kittel, C. Introduction to Solid State Physics; John Wiley and Sons: Hoboken, NJ, USA, 1986. [Google Scholar]
  30. Zeng, Z.-Y.; Hu, C.-E.; Cai, L.-C.; Jing, F.-Q. Ab initio study of lattice dynamics and thermal equation of state of Ni. Physica B 2012, 407, 330. [Google Scholar] [CrossRef]
  31. Mao, H.K.; Xu, J.; Bell, P.M. Calibration of the ruby pressure gauge to 800 kbar under quasi-hydrostatic conditions. J. Geophys. Res. Solid Earth 1986, 91, 4673. [Google Scholar] [CrossRef]
  32. Dewaele, A.; Loubeyre, P.; Mezouar, M. Equations of state of six metals above 94 GPa. Phys. Rev. B 2004, 70, 094112. [Google Scholar] [CrossRef]
  33. Holzapfel, W.B. Refinement of the ruby luminescence pressure scale. J. Appl. Phys. 2003, 93, 1813. [Google Scholar] [CrossRef]
  34. Kunc, K.; Loa, I.; Syassen, K. Equation of state and phonon frequency calculations of diamond at high pressures. Phys. Rev. B 2003, 68, 094107. [Google Scholar] [CrossRef]
  35. Chijioke, A.D.; Nellis, W.J.; Soldatov, A.; Silvera, I.F. The ruby pressure standard to 150GPa. J. Appl. Phys. 2005, 98, 114905. [Google Scholar] [CrossRef]
  36. Dorogokupets, P.I.; Oganov, A.R. Ruby, metals, and MgO as alternative pressure scales: A semiempirical description of shock-wave, ultrasonic, x-ray, and thermochemical data at high temperatures and pressures. Phys. Rev. B 2007, 75, 024115. [Google Scholar] [CrossRef]
  37. Sokolova, T.S.; Dorogokupets, P.I.; Litasov, K.D. Self-consistent pressure scales based on the equations of state for ruby, diamond, MgO, B2–NaCl, as well as Au, Pt, and other metals to 4 Mbar and 3000 K. Russ. Geol. Geophys. 2013, 54, 181. [Google Scholar] [CrossRef]
  38. Shen, G.; Wang, Y.; Dewaele, A.; Wu, C.; Fratanduono, D.E.; Eggert, J.; IPPS Task Group. Toward an international practical pressure scale: A proposal for an IPPS ruby gauge (IPPS-Ruby2020). High Pressure Res. 2020, 40, 299. [Google Scholar] [CrossRef]
  39. Prut, V.V. Ruby High Pressure Scale. Russ. Phys. J. 2022, 65, 1172. [Google Scholar] [CrossRef]
  40. Boccato, S.; Torchio, R.; Kantor, I.; Morard, G.; Anzellini, S.; Giampaoli, R.; Briggs, R.; Smareglia, A.; Irifune, T.; Pascarelli, S. The Melting Curve of Nickel Up to 100 GPa Explored by XAS. J. Geophys. Res. Solid Earth 2017, 122, 9921. [Google Scholar] [CrossRef]
  41. Birch, F. Elasticity and constitution of the Earth’s interior. J. Geophys. Res. 1952, 57, 227. [Google Scholar] [CrossRef]
  42. Barin, I.; Knacke, O.; Kubaschewski, O. Thermochemical Properties of Inorganic Substances, 2nd ed.; Springer: Berlin, Germany, 1991. [Google Scholar]
Figure 1. (color online) (a) A 3 × 3 × 3 supercell of Ni with the lattice vectors α1 = a0(0.5, 0.5, 0), α2 = a0(0, 0.5, 0.5), and α3 = a0(0.5, 0, 0.5), in which an arbitrary atom in the red circle is moved away along the [100] direction step by step; (b) for a series of volumes with lattice constant ac changed from 0.81 a0 to 1.03 a0, the total energy U′(x′) of each structure changes with the distance of the moved atom away from its equilibrium position x′.
Metals 15 00582 g001
Figure 2. (color line) Room temperature (300 K) P-V relationship of Ni calculated from DIA (red solid line) and QHA [30] (yellow dashed line). The scattered points are experimental measurements from Ref. [2] (blue dots), Ref. [3] (magenta squares), Ref. [4] (black forks), and Ref. [5] (olive stars).
Metals 15 00582 g002
Figure 3. (color online) Under the same volume, deviation of the calculated pressure PDIA or PQHA [30] from the experimental measurements PEXP of Ref. [2] (a), Ref. [3] (b), Ref. [4] (c), and Ref. [5] (d). Values of PEXPPDIA and PEXPPQHA are displayed as the red squares and blue dots, respectively. Differences between the re-calibrated pressures in Ref. [2] and PDIA, or PQHA are represented by the olive stars and magenta diamonds in (a), respectively.
Metals 15 00582 g003
Figure 4. (color online) (a) Under the same volume and temperature, PDIA (red dots) and PEXP of Ref. [3] (blues squares) are exhibited; (b) difference between PDIA and PEXP of Ref. [3]; items (c,d) are similar to (a,b), respectively, except that PEXP corresponds to Ref. [4].
Metals 15 00582 g004
Figure 5. (color online) Isothermal P-V relationship of Ni at 1000 (a), 2000 (b), and 3000 K (c), reported in Ref. [3] (olive dashed dotted line) and Ref. [4] (magenta solid line), and calculated by QHA [30] (black short dashed line) and DIA (red dashed line). Under the same volume, the pressure differences between the values in Refs. [3,4,30] and those calculated by DIA are correspondingly shown in (df).
Metals 15 00582 g005
Figure 6. (color online) The pressure difference (ΔP) between the results of the MGD model with θ0 of 415 K and the ones with different value of θ0 (solid line), or the results of the simplified model (black short dotted line) as a function of pressure P at 1000 K (a), 2000 K (b), and 3000 K (c).
Metals 15 00582 g006
Figure 7. (color online) The difference of pressure (ΔP) between the analytical EOS prediction and the original results of DIA as a function of pressure P for different temperatures.
Metals 15 00582 g007
Figure 8. (color online) Map of the pressure distribution over the T-V plane obtained by fitting the DIA results with the simplified model (a), and from the MGD model based on the experimental results of Ref. [4] (b). The pressure difference (ΔP) map by (a,b), and the solid lines are separated by 5 GPa (c).
Metals 15 00582 g008
Table 1. Based on DIA, the calculated volume (Å3/atom) of Ni as a function of the temperature and pressure.
P (GPa)300 K500 K1000 K1500 K2000 K2500 K3000 K
0.000111.032811.132411.400011.7070
1010.494410.569710.776310.999211.2423
2010.090410.146810.297710.465010.6542
309.76569.81319.936410.067910.209110.3625
409.48849.52999.63659.74799.86519.9890
509.24449.28099.37509.47359.57589.6822
609.03179.06409.14649.23219.32199.41649.5146
708.84138.87078.94549.02219.10139.18359.2693
808.66888.69568.76418.83438.90638.98039.0565
908.51278.53738.59998.66418.73008.79788.8674
1008.36938.39198.44988.50918.56988.63218.6958
1108.23588.25678.31068.36598.42258.48048.5394
1208.11278.13168.18098.23238.28548.33968.3949
1307.99938.01698.06228.10928.15788.20808.2599
1407.89387.91037.95267.99628.04118.08728.1346
1507.79467.81047.85037.89127.93317.97608.0200
1607.70087.71607.75407.79277.83227.87257.9137
1707.61147.62617.66277.69967.73717.77527.8142
1807.52587.54017.57557.61107.64697.68327.7202
1907.44377.45757.49207.52647.56097.59587.6311
2007.36607.37907.41207.44527.47867.51237.5463
2107.29287.30517.33647.36807.40007.43237.4651
2207.22357.23527.26487.29497.32547.35637.3876
2307.15747.16857.19667.22527.25447.28397.3138
2407.09367.10437.13127.15867.18647.21477.2435
2507.03197.04227.06817.09447.12127.14847.1760
2606.97206.98207.00707.03257.05847.08467.1112
2706.91416.92366.94796.97266.99767.02307.0487
2806.85856.86776.89106.91476.93896.96356.9884
2906.80506.81386.83636.85926.88256.90616.9302
3006.75346.76196.78376.80586.82836.85116.8742
3106.70346.71176.73296.75446.77616.79816.8204
3206.65516.66326.68386.70466.72576.74706.7686
3306.60856.61646.63636.65656.67696.69756.7185
3406.56336.57106.59046.61006.62986.64986.6700
3506.51946.52696.54596.56506.58426.60366.6232
3606.47676.48416.50266.52126.53996.55886.5779
3706.43526.44246.46056.47866.49696.51546.5339
3806.39476.40176.41946.43726.45516.47316.4912
3906.35516.36206.37946.39686.41436.43196.4496
4006.31656.32336.34036.35736.37456.39176.4090
4106.27876.28536.30206.31876.33566.35256.3695
4206.24166.24826.26466.28106.29756.31416.3308
4306.20566.21206.22796.24406.26036.27666.2930
4406.17066.17686.19236.20806.22396.23996.2560
4506.13646.14246.15766.17306.18846.20416.2198
4606.10316.10906.12386.13886.15396.16926.1846
4706.07056.07636.09076.10546.12026.13516.1502
4806.03876.04436.05856.07276.08726.10186.1165
4906.00766.01306.02696.04086.05506.06926.0837
5005.97705.98245.99596.00966.02346.03746.0515
Table 2. The parameters in the MGD model (or the simplified one) determined by experimental data (or DIA calculations).
DIACampbell et al. [3]Pigott et al. [4]
V03/atom)10.972 (0)10.93910.926
K0 (GPa)197.256 (0.126)179 (3)201 (6)
K04.626 (0.001)4.3 (0.2)4.4 (0.3)
θ0 (K)/415415
γ02.014 (0.002)2.50 (0.06)1.98 (0.08)
q0.745 (0.002)11.3 (0.2)
Disclaimer/Publisher’s Note: The statements, opinions and data contained in all publications are solely those of the individual author(s) and contributor(s) and not of MDPI and/or the editor(s). MDPI and/or the editor(s) disclaim responsibility for any injury to people or property resulting from any ideas, methods, instructions or products referred to in the content.

