Abstract
During the continuous casting process, the submerged entry nozzle (SEN) should be maintained at the geometric center of the mold. However, in actual production, factors such as deformation of the tundish bottom and inaccurate positioning of the traversing car occasionally cause SEN offset. SEN offset can make the molten steel flow field in the mold asymmetric, increasing the risks of slag entrainment on the surface of the casting blank and breakout accidents. To evaluate the influence of different SEN offsets on the mold flow field, this study uses a slab continuous casting mold with a cross-section of 920 mm × 200 mm from a specific factory as the research object. Mathematical simulations were used to investigate the influence of SEN offsets (including width-direction and thickness-direction offsets) on the flow behavior of molten steel in the mold. A physical water model at a 1:1 scale was established for verification. Two parameters, the symmetry index (S) and the bias flow index (N), were introduced to quantitatively evaluate the symmetry of the flow field, and the rationality of the liquid-level fluctuation under this flow field was verified using the F-number (proposed by Japanese experts for mold level fluctuation control) from the index model. The results show the following: when the SEN offset in the thickness direction increases from 0 to 50 mm, the longitudinal symmetry index (Sy) of the molten steel flow field in the mold decreases from 0.969 to 0.704—a reduction of 27.4%; the longitudinal bias flow index (Ny) of molten steel level fluctuation increases from 0.007 to 0.186, representing a 25.6-fold increase, and the F-number rises from 4.297 to 8.482; when the SEN offset in the width direction increases from 0 to 20 mm, the transverse-axis symmetry index (Sx) of the flow field decreases gradually from 0.969 to 0.753 at a 20 mm offset, which is a reduction of approximately 22.29%; the transverse-axis bias flow index (Nx) increases from 0.015 to 0.174 at a 20 mm offset—an increase of 10.6 times; and the F-number increases from 4.297 to 5.548. Considering the comprehensive evaluation of horizontal/vertical symmetry indices, bias flow indices, and F-numbers under the two working conditions, the width-direction SEN offset has the most significant impact on the symmetry of the molten steel flow field.
1. Introduction
In contemporary steelmaking, continuous casting technology is a fundamental process that significantly influences the efficient production of high-quality steel strands, with profound effects on both product quality and manufacturing productivity [1,2]. The submerged entry nozzle (SEN), which is a crucial component in continuous casting systems, is responsible for the precise delivery of molten steel from the tundish into the mold cavity [3]. Accurate alignment of the SEN is a fundamental requirement for controlling the casting process, as it ensures uniformity and symmetry of the flow field within the mold, which are crucial factors for achieving high-quality strand solidification [4,5]. However, in practical continuous casting operations, numerous adverse factors frequently disrupt the optimal functioning of the SEN. For instance, the bottom of the intermediate ladle is subjected to prolonged high-temperature molten steel erosion and mechanical stress, making it prone to deformation [6]. Additionally, the traversing car struggles to maintain accurate positioning during frequent operations due to precision deviations in the positioning system or wear and tear of the equipment [7,8]. These factors can easily lead to SEN offset, disrupting the originally stable and symmetrical flow field of molten steel in the mold, resulting in a substantial increase in the risk of slag rolled on the surface of the continuous casting billet, which affects both the purity and surface quality of the billet, while also greatly increasing the likelihood of steel leakage accidents [9,10,11,12].
In the realm of steel continuous casting, the homogeneity of the flow field within the mold is of paramount importance for the quality of the cast billets. Numerous researchers have extensively examined the factors influencing the flow field within the mold, analyzing their implications from various perspectives. Li and colleagues [13] developed a transient SEN clogging model for slab casting by integrating discrete phase modeling (DPM) and volume-of-fluid (VOF) approaches. This model analyzes the effects of clogging on flow patterns, argon bubble distribution, and fluctuations at the slag–steel interface. González-Solórzano and colleagues [14,15] investigated and analyzed the liquid steel flow characteristics in a slab mold by combining physical and numerical simulations. They focused on two types of submerged water ports, studying the flow dynamics in both unobstructed and clogged states, and examined the formation of a biased, asymmetric flow field in the mold when the ports were clogged. Gonzalez-Trejo and colleagues [16] used particle image velocimetry (PIV) in water modeling experiments to quantify the effects of sliding gate valve (SGV) positions (unobstructed, partially blocked, and severely blocked) on SEN jet turbulence and mold recirculation patterns. Cedillo V and colleagues [17] employed both mathematical and physical simulation methods to investigate the effect of sliding spout valve opening on molten steel flow in the mold, utilizing water modeling and computational fluid dynamics approaches. Li and colleagues [18] constructed a 0.5:1 scale physical model with plexiglass-induced SEN blockages, systematically examining the effects of clogging progression on flow patterns and slag entrainment behavior. Wu and colleagues [19] utilized wavelet transform-energy analysis in water modeling to evaluate biased flows resulting from asymmetric SEN clogging, identifying the migration of vortex centers toward narrow face regions under severe blockage conditions. Wang and colleagues [20] established mathematical models for thin slab mold flow asymmetry, introducing quantitative indices (maximum deviation ratio and deviation frequency) to characterize the effects of SEN parameters on flow deflection.
Generally, the deflected flow phenomena caused by issues such as SEN blockages, incomplete opening of the sliding spout valve, or blowing have been more extensively studied by previous researchers. However, the issue of SEN offset has been less frequently addressed [21,22,23]. This study employs a combination of numerical and physical simulations to investigate the asymmetry of steel flow behavior in the mold under conditions of SEN offset (both width- and thickness-direction offsets). A mathematical model of the slab-section mold was established, and Fluent software was used to simulate the flow field under SEN offset conditions. Additionally, a 1:1 scale physical water model was constructed to measure liquid surface flow rates and fluctuations. The symmetry index (S) and bias flow index (N) are introduced to quantitatively assess the symmetry of the flow field. The degree of asymmetry is analyzed by comparing the liquid surface flow rate and fluctuations between the abnormal and normal flow fields. Furthermore, an index model F-number is proposed to validate the reasonableness of liquid surface fluctuations within the flow field.
2. Mathematical–Physical Modeling of the Mold
2.1. Mathematical Modeling
2.1.1. Basic Fluid Assumptions
The continuous casting process is characterized by complex interactions among heat transfer, fluid flow, phase transitions, and gas–liquid interactions within the mold, which renders the precise simulation of molten steel flow behavior highly challenging [24]. To achieve the specific research objectives, the following assumptions are made regarding the steel flow and transport phenomena [25]:
(1) The molten steel within the mold is modeled as a continuous, viscous, incompressible fluid.
(2) The flow and temperature fields are assumed to be in a steady state, with the minimum temperatures exceeding the liquidus temperature.
(3) The effects of mold oscillation and taper on flow patterns are ignored.
(4) The presence of a solidified shell is neglected.
(5) The molten steel is assumed to be homogeneous throughout the entire domain.
(6) A constant casting speed is maintained throughout the process.
2.1.2. Control Equations
Model control equations: The flow inside a mold is a complex flow and heat transfer problem [26], and the basic equations describing the flow and heat transfer inside a mold include the continuity equation, momentum equation, k- equation, energy equation, and VOF model [27,28,29,30]. The flow in the mold is assumed to be steady state, and the density is constant.
(1) The continuity equation:
(2) Momentum equation (math):
(3) The k- equation:
(4) equation:
(5) Energy equation:
In the formula, , is the velocity in the direction of i and j; and are the coordinate values in the directions of i and j; is the fluid density; P is the pressure; is the effective viscosity coefficient; is the turbulent viscosity; is the laminar viscosity; is the gravitational acceleration in the direction of i; k is the turbulence kinetic energy; is the dissipation rate of the turbulence kinetic energy; G is the kinetic energy of the turbulent pulsating capacity; is the specific heat capacity; T is the fluid temperature; is the effective temperature diffusion coefficient; and is the source term. i and j, taking values 1, 2, and 3, represent the coordinate directions. The standard two-equation turbulence model was used to determine the effective viscosity coefficient to keep the equation closed. , , , , , are empirical constants.
(6) VOF model equations:
In this paper, the transient behavior of steel liquid at the free liquid surface of the mold is characterized by the VOF model; it is calculated by sharing the same set of momentum equations with two different fluids, where one of them acts as the main fluid, which is the first phase, and the other fluid acts as the secondary fluid, which is the second phase [31]. In the simulation, the region above the free liquid level is defined as gas, and the interface between the two fluids is the free liquid level of the mold. Therefore, the shape and magnitude of the fluctuation of the free liquid surface can be modeled by the VOF model.
The sum of the volume fractions of air and liquid steel in each calculation cell is 1. The formula is as follows:
The tracking of the gas–liquid interface is realized by the following continuity equation:
The volume fraction function is as follows:
In the formula, is the volume fraction of liquid steel and air; is the integral number of liquid steel; and are the densities of liquid steel and air, respectively; and are the viscosity coefficients of liquid steel and air molecules.
2.1.3. Model and Boundary Conditions
(1) Inlet: The SEN velocity magnitude is calculated from a combination of SEN dimensions, pulling velocity, and mold outlet dimensions, using velocity-inlet conditions, with a turbulence intensity of 5%.
(2) Exit: The exit is set as the bottom of the model calculation area, using outflow boundary conditions, and the exit static pressure is set to 0.
(3) Wall: The model wall is set as a standard wall function and a no-slip boundary condition, and the upper surface of the steel water is set as the free surface to set the slip boundary condition.
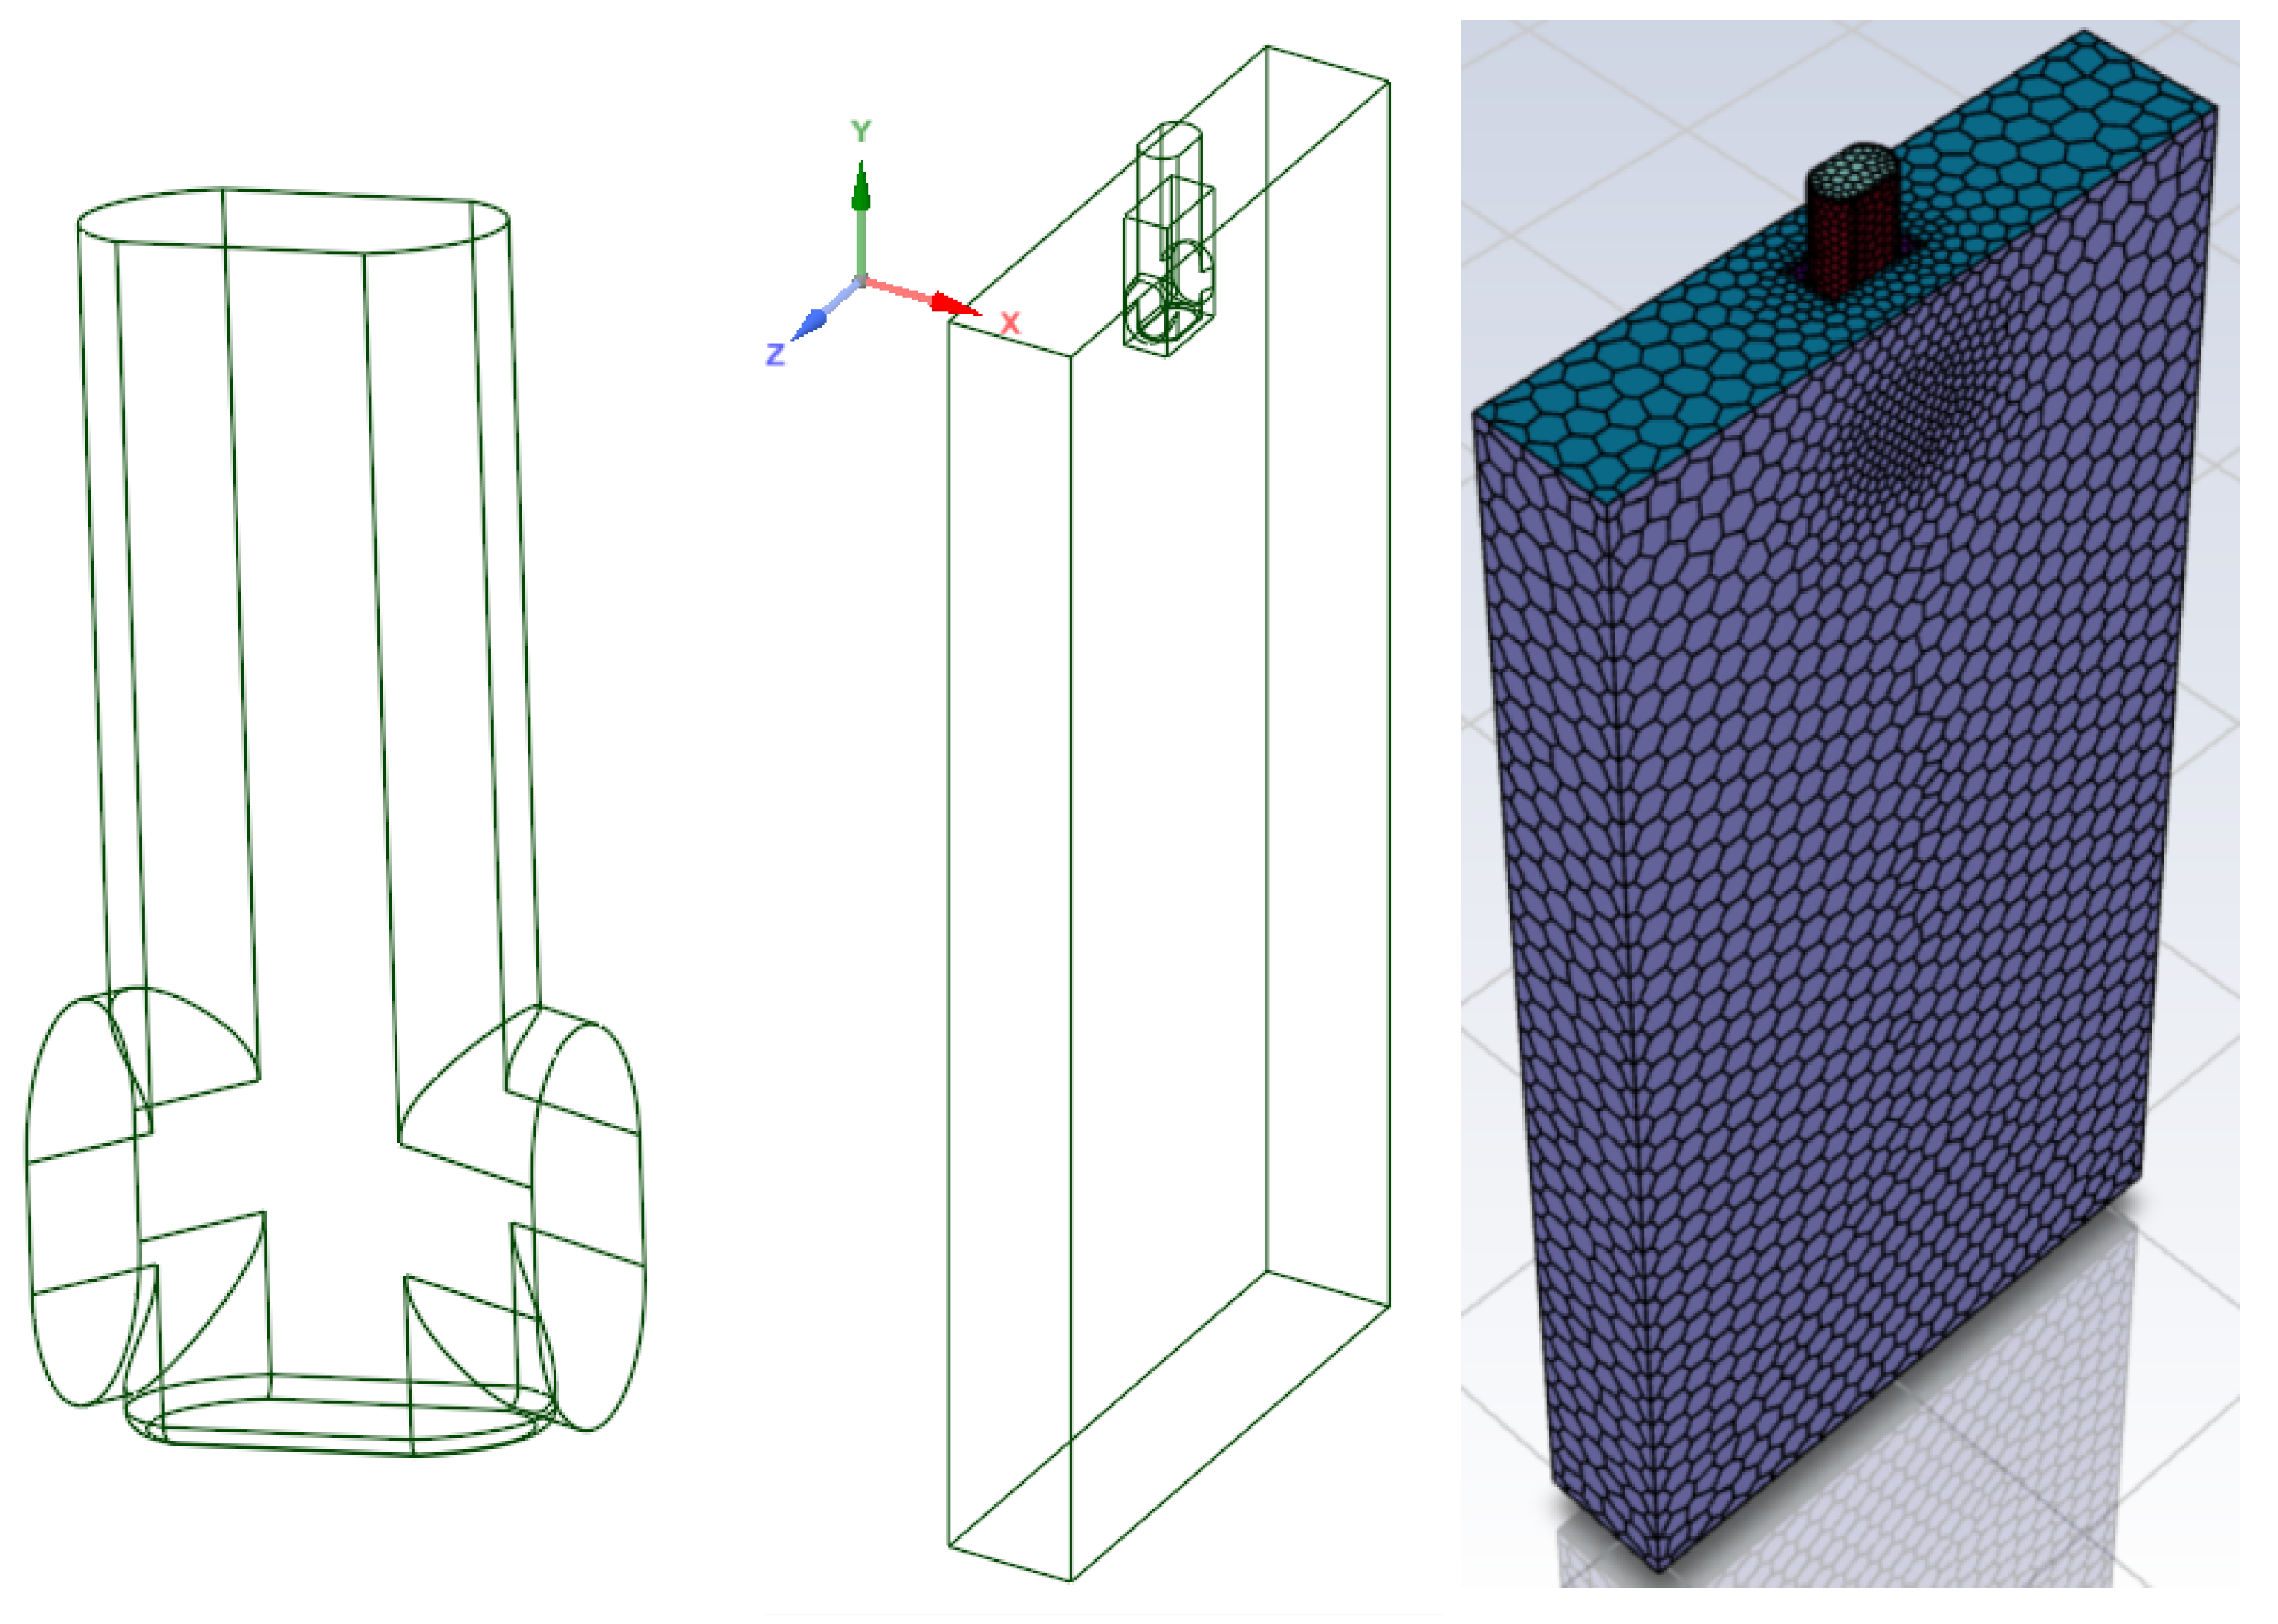
(4) Pre-processing: The SpaceClaim mapping software is used to construct the three-dimensional structure of the water outlet and the mold, and establish the mathematical model of the mold with a slab section of 920 mm × 200 mm. In order to avoid the influence of the reflux at the bottom of the mold on the calculations, the length of the mold is set to 2000 mm, so as to ensure the full development of the flow field. In order to make the calculation accurate, the model was divided into polyhedral structured meshes using the meshing module in Fluent Meshing. The mesh size was controlled within 2 mm to ensure data accuracy. The model and mesh are shown in Figure 1.
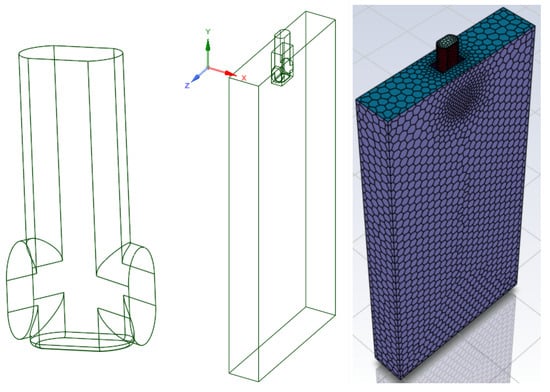
Figure 1.
SEN and mold model.
(5) Calculation: All model equations are solved by Fluent software, and the SIMPLE algorithm is used in the calculation process.
(6) The process and physical property parameters are listed below in Table 1:

Table 1.
Process and physical property parameters.
2.2. Physical Modeling
The experimental setup was designed based on similarity principles. The prototype mold had cross-sectional dimensions of 920 mm × 200 mm, and the model was constructed at a 1:1 geometric scale ratio relative to the prototype, with water employed to simulate molten steel. Given that the fluid dynamics in the mold (dominated by inertial, viscous, and gravitational forces) necessitate Froude number similarity between the water model and the prototype, the following relationship for volumetric flow rate was derived [32]:
In the following formula, , denote the velocities of the liquid phase in the water model and the prototype, respectively; is the gravitational acceleration; , are the characteristic dimensions of the water model and the prototype, respectively; is the geometric similarity ratio between the water model and the prototype; , are the volumetric flow rates of the liquid phase in the water model and the prototype, respectively.
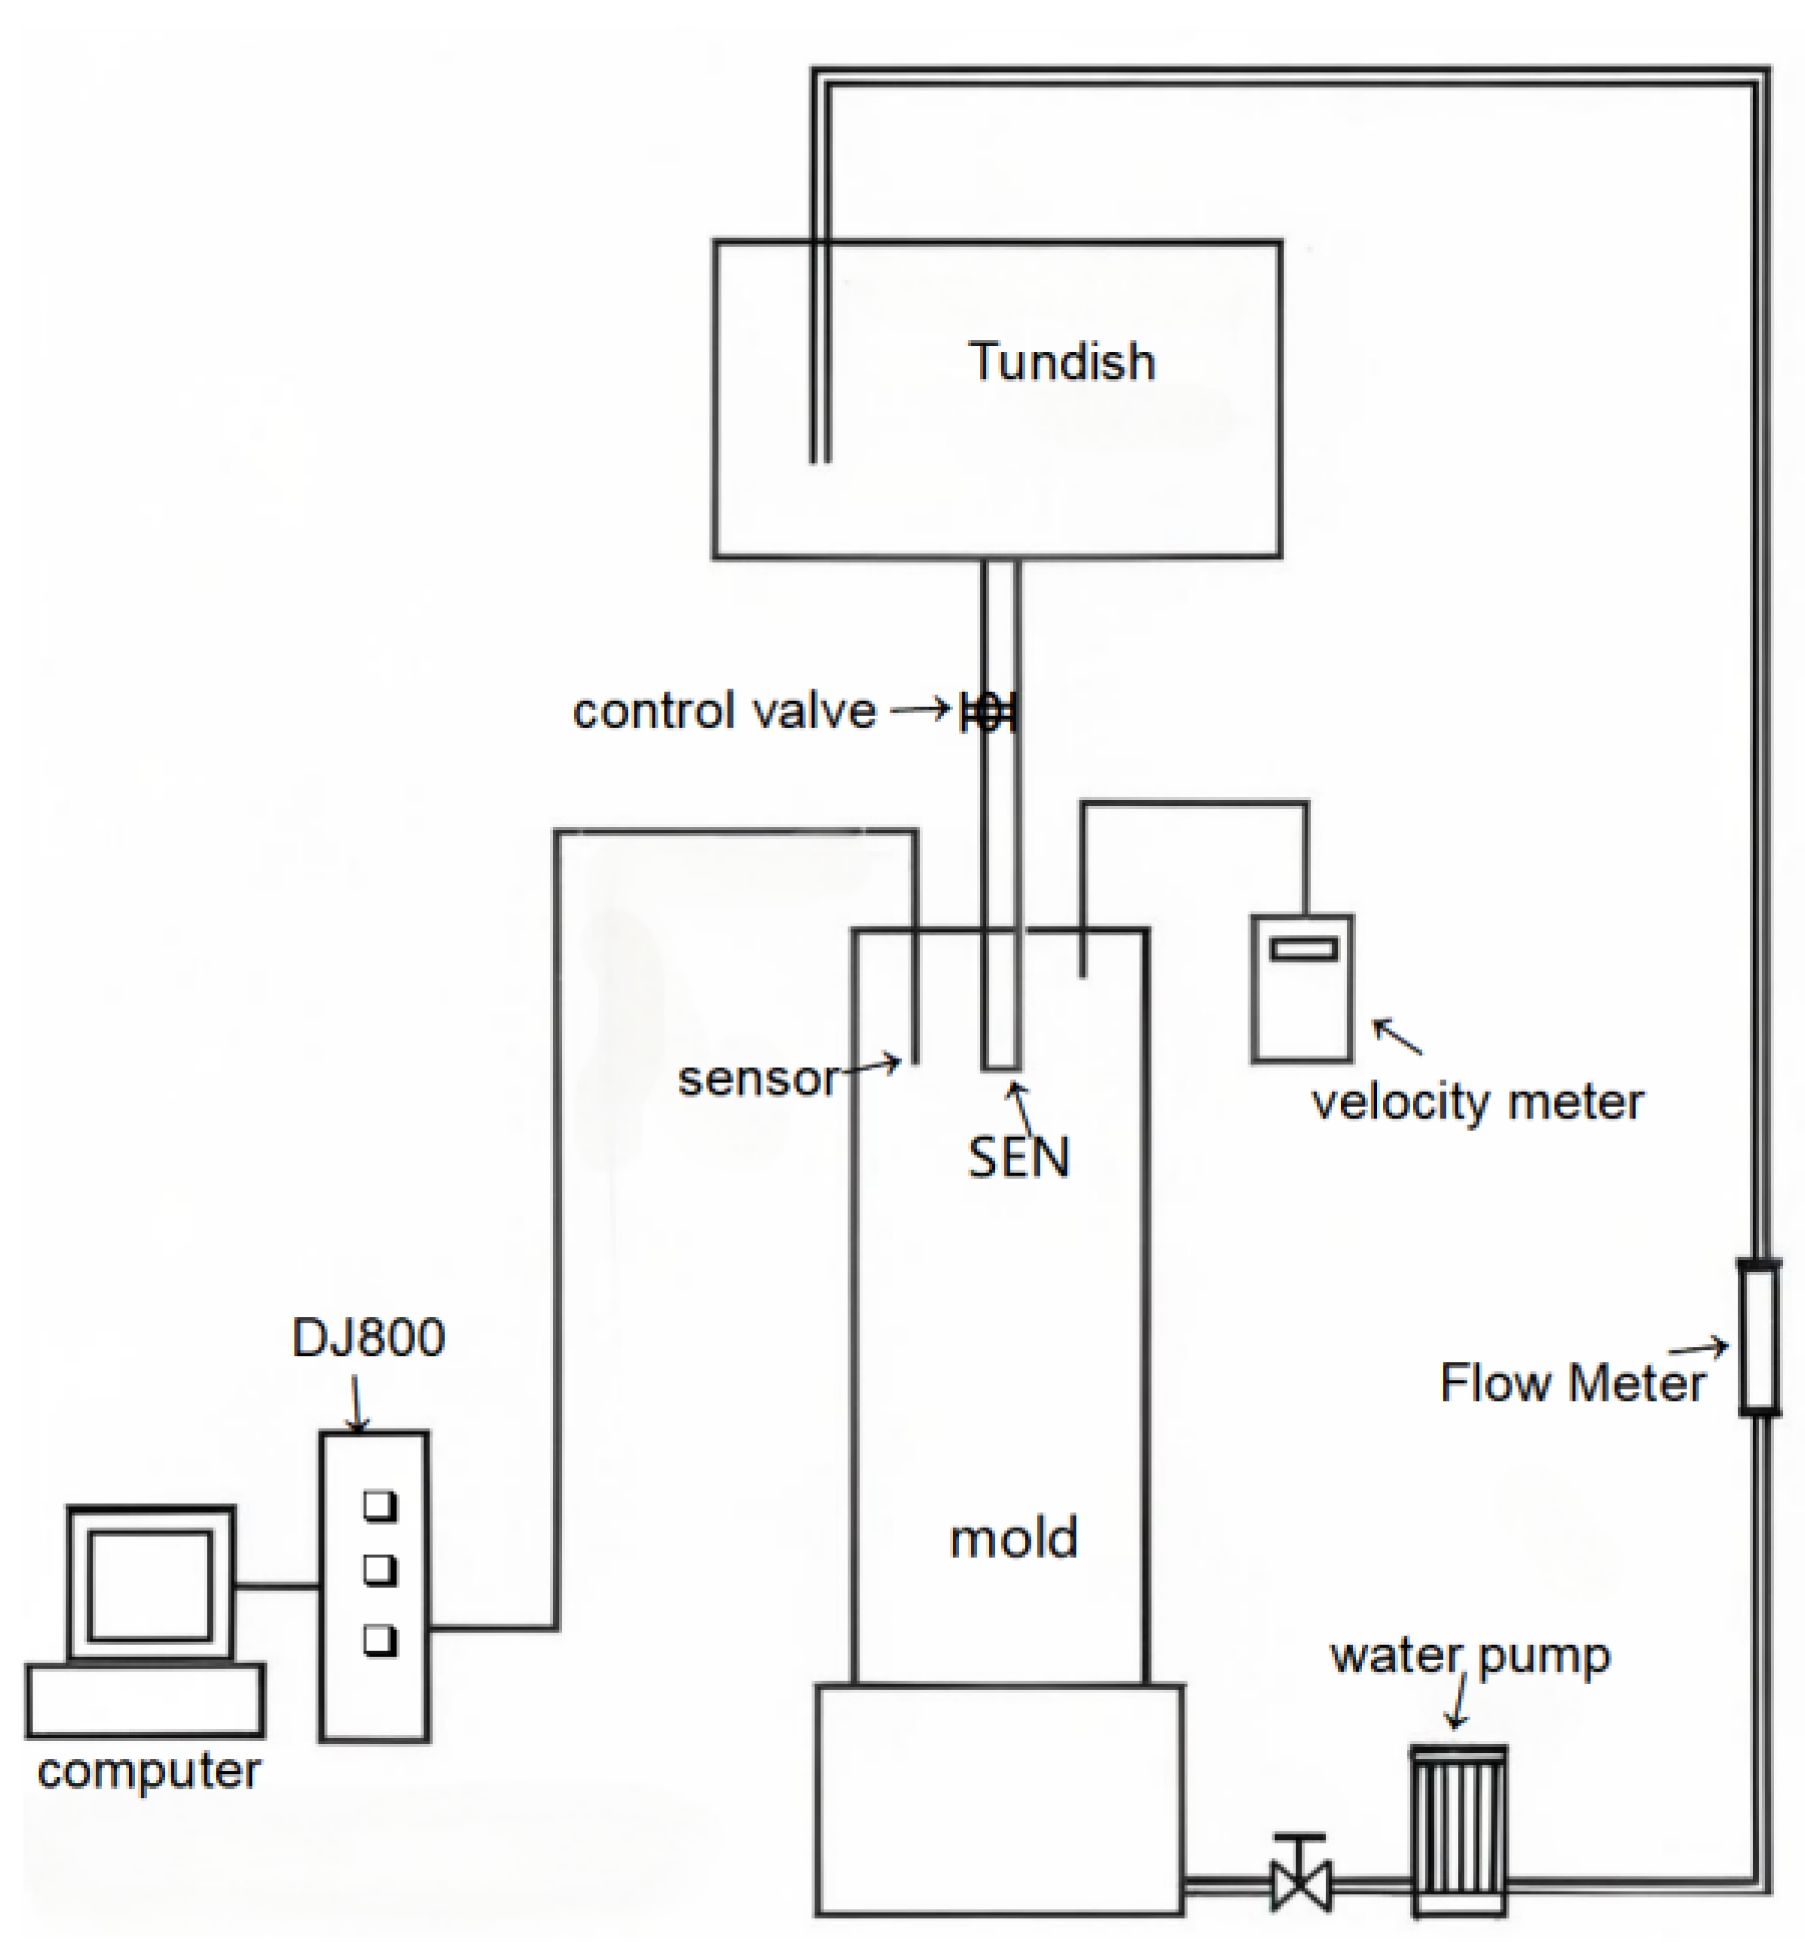
The schematic diagram of the mold model is shown in Figure 2. Liquid-level fluctuation and liquid level flow rate were monitored by using the DJ800 wave height meter (China Institute of Water Resources, Beijing, China) and a hand-held flow rate meter.

Figure 2.
Schematic diagram of the physical water model.
2.3. Experimental Program and Methodology
Mathematical simulation is used to study the influence law of SEN offset (including width-direction offset and thickness-direction offset) working conditions on the liquid steel flow behavior in the mold, and a 1:1 physical water model is established for verification. To quantitatively assess the asymmetric flow of molten steel in the mold, two parameters—symmetry index (S) and bias flow index (N)—are introduced as evaluation indices. The validity of liquid-level fluctuations under this flow field is then verified using the index model F-number.
2.3.1. Symmetry Index (S)
The symmetric exponential formula for the steel flow velocity at the mold level is as follows:
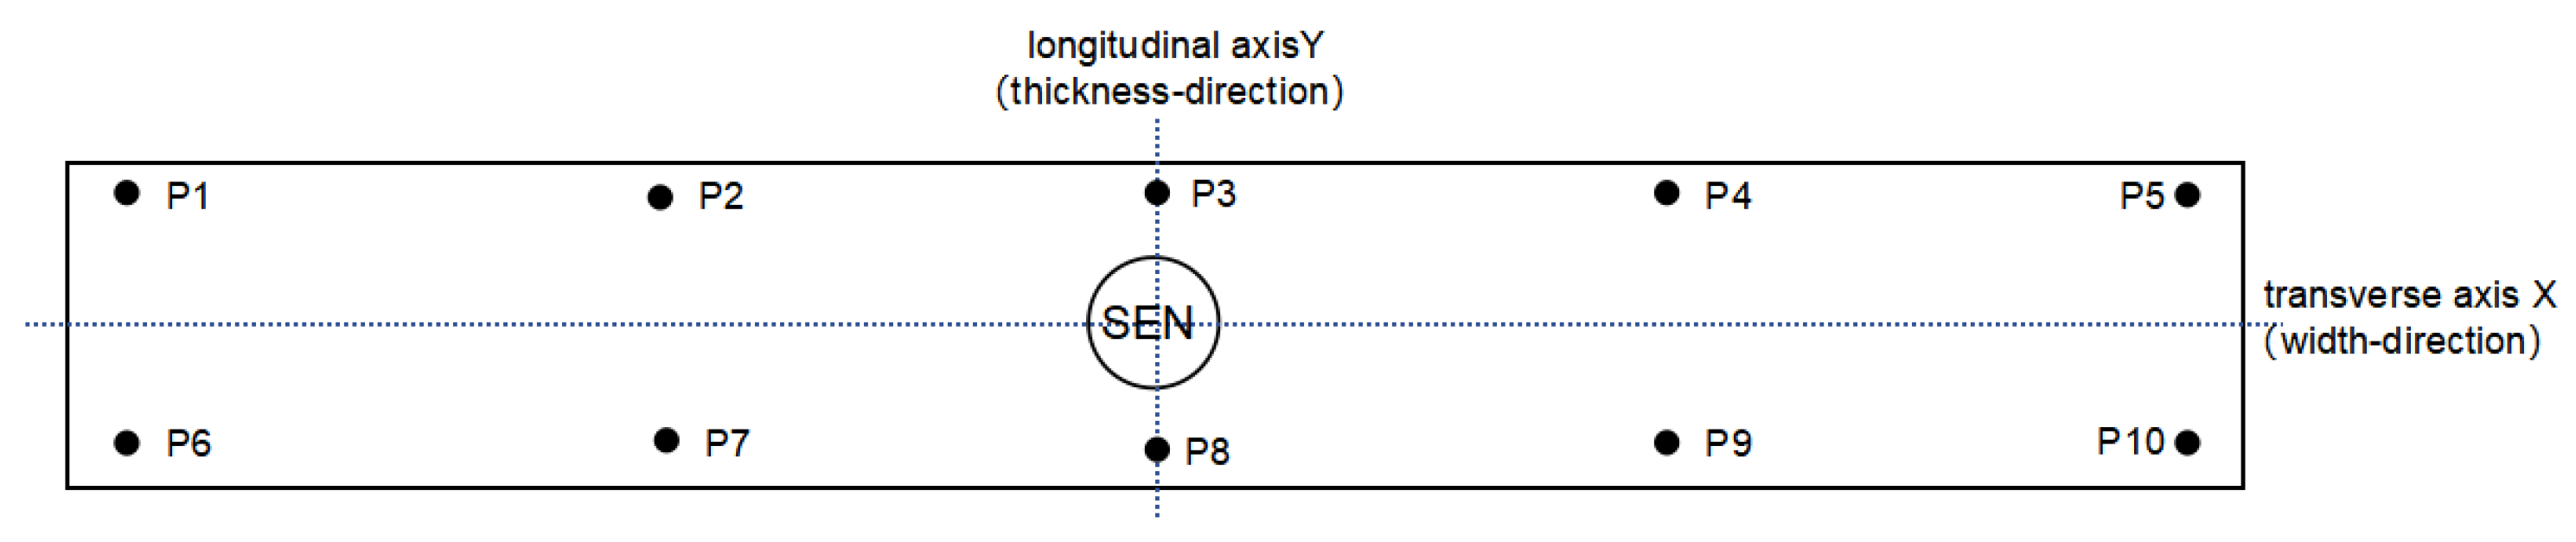
In the formula, v is the characteristic point velocity; means the symmetrical characteristic point. Symmetry index is used to quantitatively describe the degree of symmetry of the mold steel liquid surface flow field; the closer the value is to 1, indicating that the symmetry of the flow field is better. The symmetry index feature points are selected in two ways, namely, horizontal-axis symmetry and vertical-axis symmetry. Taking the top view of the mold as the standard, the upper edge is defined as the inner wide side of the mold, the lower edge is defined as the outer wide side of the mold, and the left and right edges are defined as the left and right narrow sides, respectively. The transverse-axis symmetry feature point speed calculation of the symmetry index is expressed as . These feature points are located along the water outlet wall surface and the mold’s wide face, at the midpoint between the two sides, that is, 78.5 mm from the mold’s transverse axis. A straight line parallel to the mold’s wide face is drawn. Five monitoring points are placed along each line; the distance between each two monitoring points is equal. These lines are positioned at distances of 0 m, 0.2 m, and 0.4 m from the SEN.
The transverse-axis symmetry feature point is defined along the upper edge, the lower edge corresponds to the mold’s wide surface, and the left and right edges represent the left and right narrow faces, respectively. The longitudinal-axis-symmetric feature point pairs are P1 and P6, P2 and P7, P3 and P8, P4 and P9, and P5 and P10. The longitudinal-axis-symmetrical feature points are P1 and P5, P2 and P4, P6 and P10, and P7 and P9, as shown in Figure 3. The symmetry index calculated from the speeds of the symmetric feature points is expressed as .
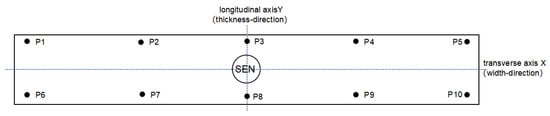
Figure 3.
Schematic diagram of the location of the symmetry index characteristic points.
2.3.2. Bias Flow Index (N)
In the continuous casting production process, the characteristics of liquid-level fluctuations in the mold are one of the key factors in ensuring casting quality. For slab continuous casting machines, conventional production requirements specify that liquid-level fluctuations in the mold should remain within a range of ±2 mm [33]. The following equation defines the bias flow index for liquid-level fluctuations in the upper part of the mold:
In the formula, is the liquid-level fluctuation value at the symmetric position characteristic point; is the average liquid-level fluctuation value at the symmetric position characteristic point; denotes the label of the symmetric position characteristic point.
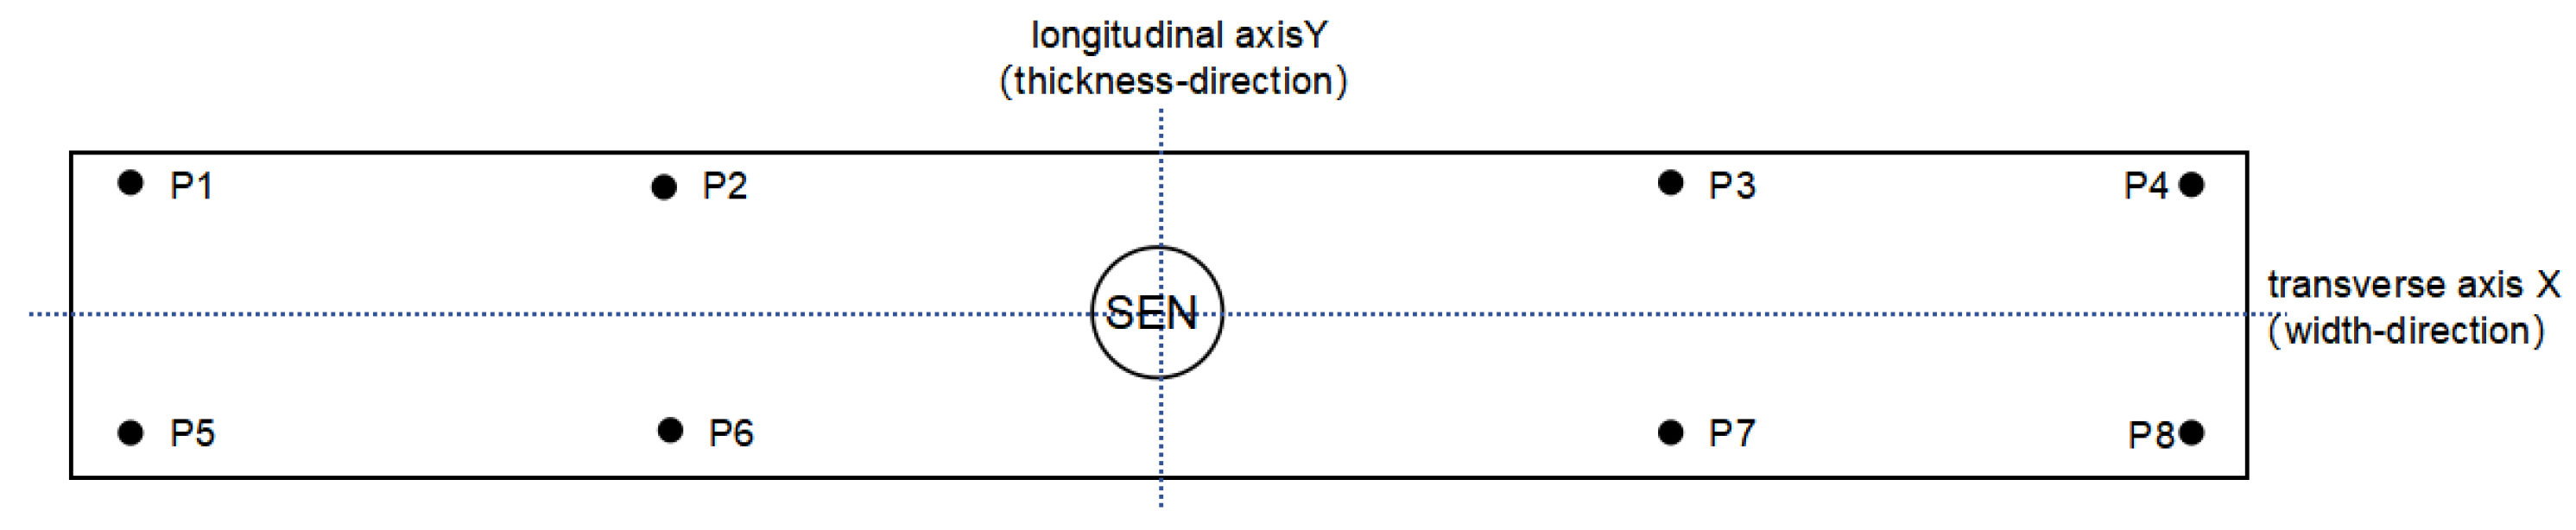
Similarly, when calculating the bias flow index, two symmetric methods are adopted, namely, transverse-axis-symmetric and longitudinal-axis-symmetric. The feature points P1∼P10 are all located 15 mm below the liquid surface. Among these, the transverse-axis-symmetric feature point pairs are P1 and P5, P2 and P6, P3 and P7, and P4 and P8. The longitudinal-axis-symmetric feature point pairs are P1 and P4, P2 and P3, P5 and P8, and P6 and P7, forming four groups. The bias flow index calculated from the horizontal-axis symmetric feature points is denoted as , and the bias flow index calculated from the vertical-axis symmetric feature points is denoted as , in order to analyze the asymmetric flow caused by different reasons. The bias flow index feature points are shown in Figure 4.
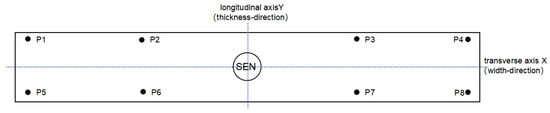
Figure 4.
Schematic diagram of the location of the bias index characteristic points.
2.3.3. F-Number
Toshio Teshima and Teshima proposed the use of the F-number to reflect the fluctuation of the free surface on the basis of a water modeling study. Slagging can be reduced or avoided by controlling the range of F. A higher F-number indicates more intense fluctuations at the slag interface, increasing the likelihood of exposed liquid surface and slag entrapment. Conversely, a lower F-number results in a significant reduction in fluctuation amplitude, but if it is too small, it may cause difficulties in melting the protective slag due to insufficient heat supply at the steel–slag interface. Studies have shown that when the F-number is within the range of 3 to 5, billet surface defects are minimized, and the likelihood of slag roll-up in the mold is significantly reduced. The expression for the F-number is as follows:
In the formula, is the density of molten steel; denotes throughput; is the molten steel flow strand impact mold side speed; is the molten steel flow strand impact mold side angle; D is the distance from the impact point of the mold side to the interface of the steel–slag.
3. Results and Discussion
3.1. Characteristics of Molten Steel Flow Behavior in the Mold Under Symmetric Conditions
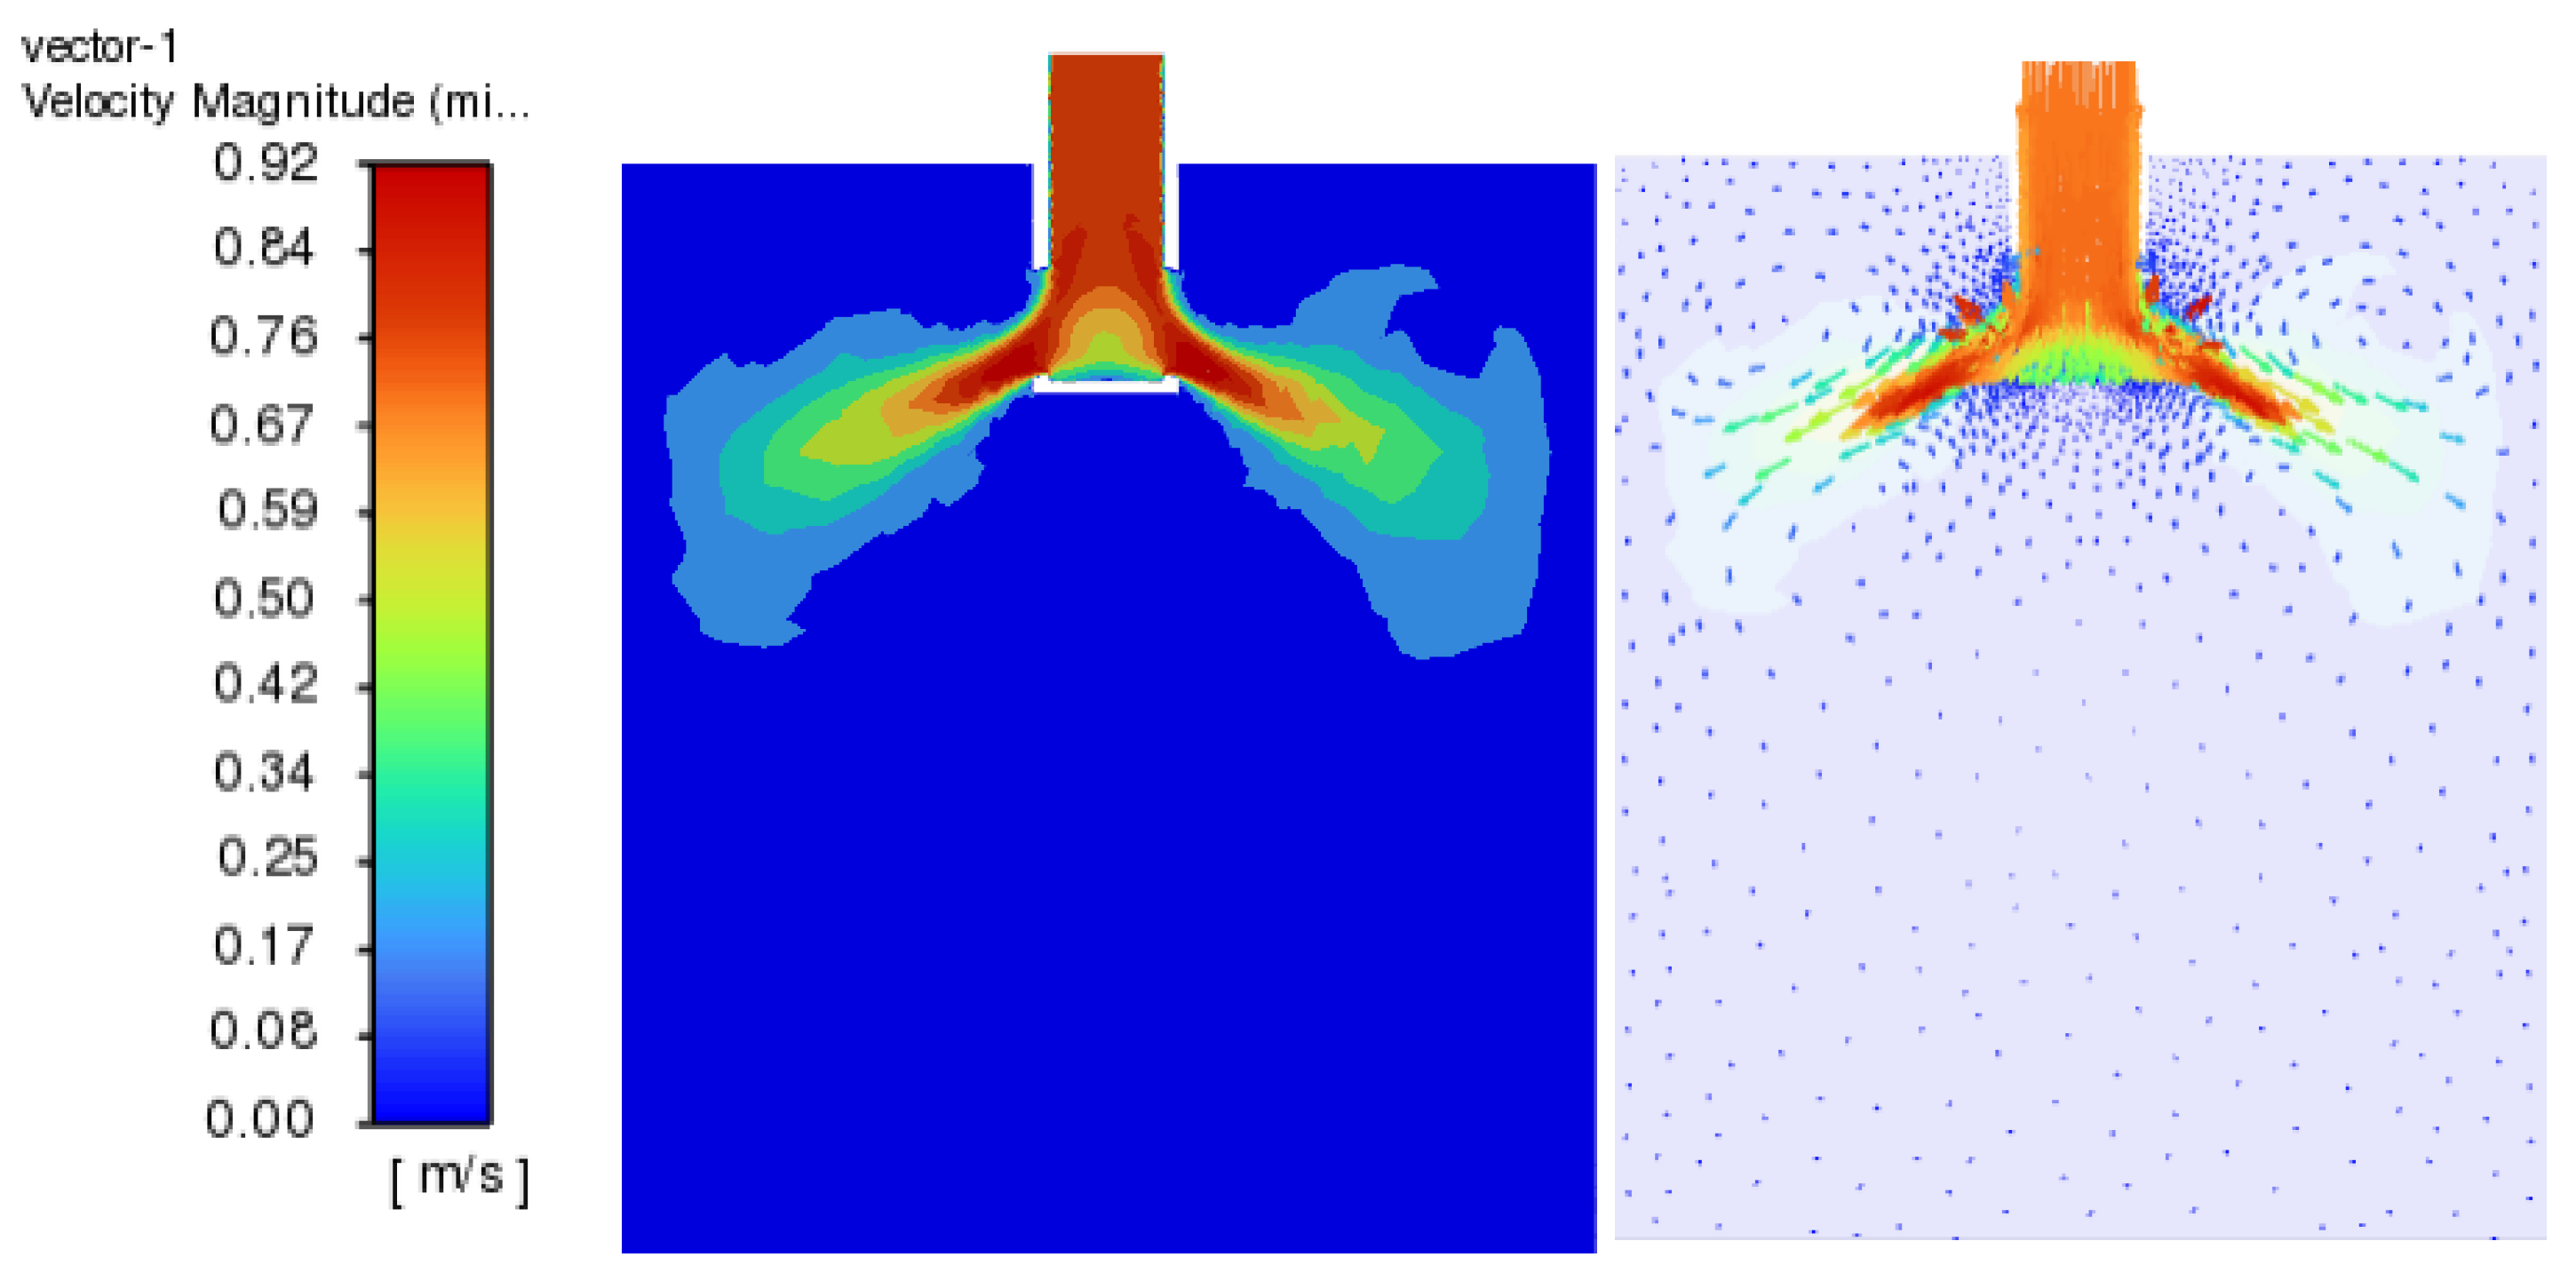
For the 200 mm × 920 mm section, with a pulling speed of 2 m/min, Fluent software was used to simulate the molten steel flow behavior within the slab mold. Figure 5 shows the velocity cloud and vector diagram of the transverse center section of the mold under symmetric conditions. It is observed that the velocity cloud and vector diagrams on the left and right sides of the molten steel in the mold are basically the same. After the liquid steel enters the mold, the velocity at the exit of the SEN is at its maximum, and with the flow of the liquid steel in the mold, the velocity of the liquid steel decreases. From the velocity vector diagram, it is evident that the liquid steel flows into the mold from both sides of the SEN ports. The main streams on the left and right sides move obliquely upward toward the narrow faces and, near the narrow faces, split into upward and downward recirculating flows. These form two main recirculation zones in the upper and lower regions, resulting in a total of four symmetrically distributed main recirculation areas.

Figure 5.
Velocity cloud and vector map of the transverse center section.
The velocity cloud and vector diagram of the liquid surface of the mold under symmetric conditions are shown in Figure 6. It can be seen that the flow strand that rushes diagonally upward to the narrow surface of the mold from the SEN is dispersed into two flow strands after arriving at the liquid surface; one strand continues to rush to the narrow surface of the mold, and the other strand rushes to the SEN. A small reflux region occurs in the vicinity of the SEN because of the impact on the wall of the spout and the change in the direction of the flow.
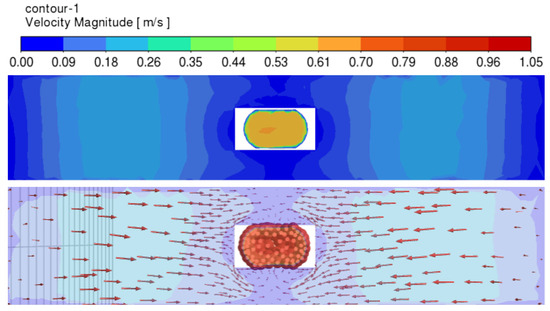
Figure 6.
Velocity cloud and vector diagram of the free liquid surface.
3.1.1. Symmetry Index
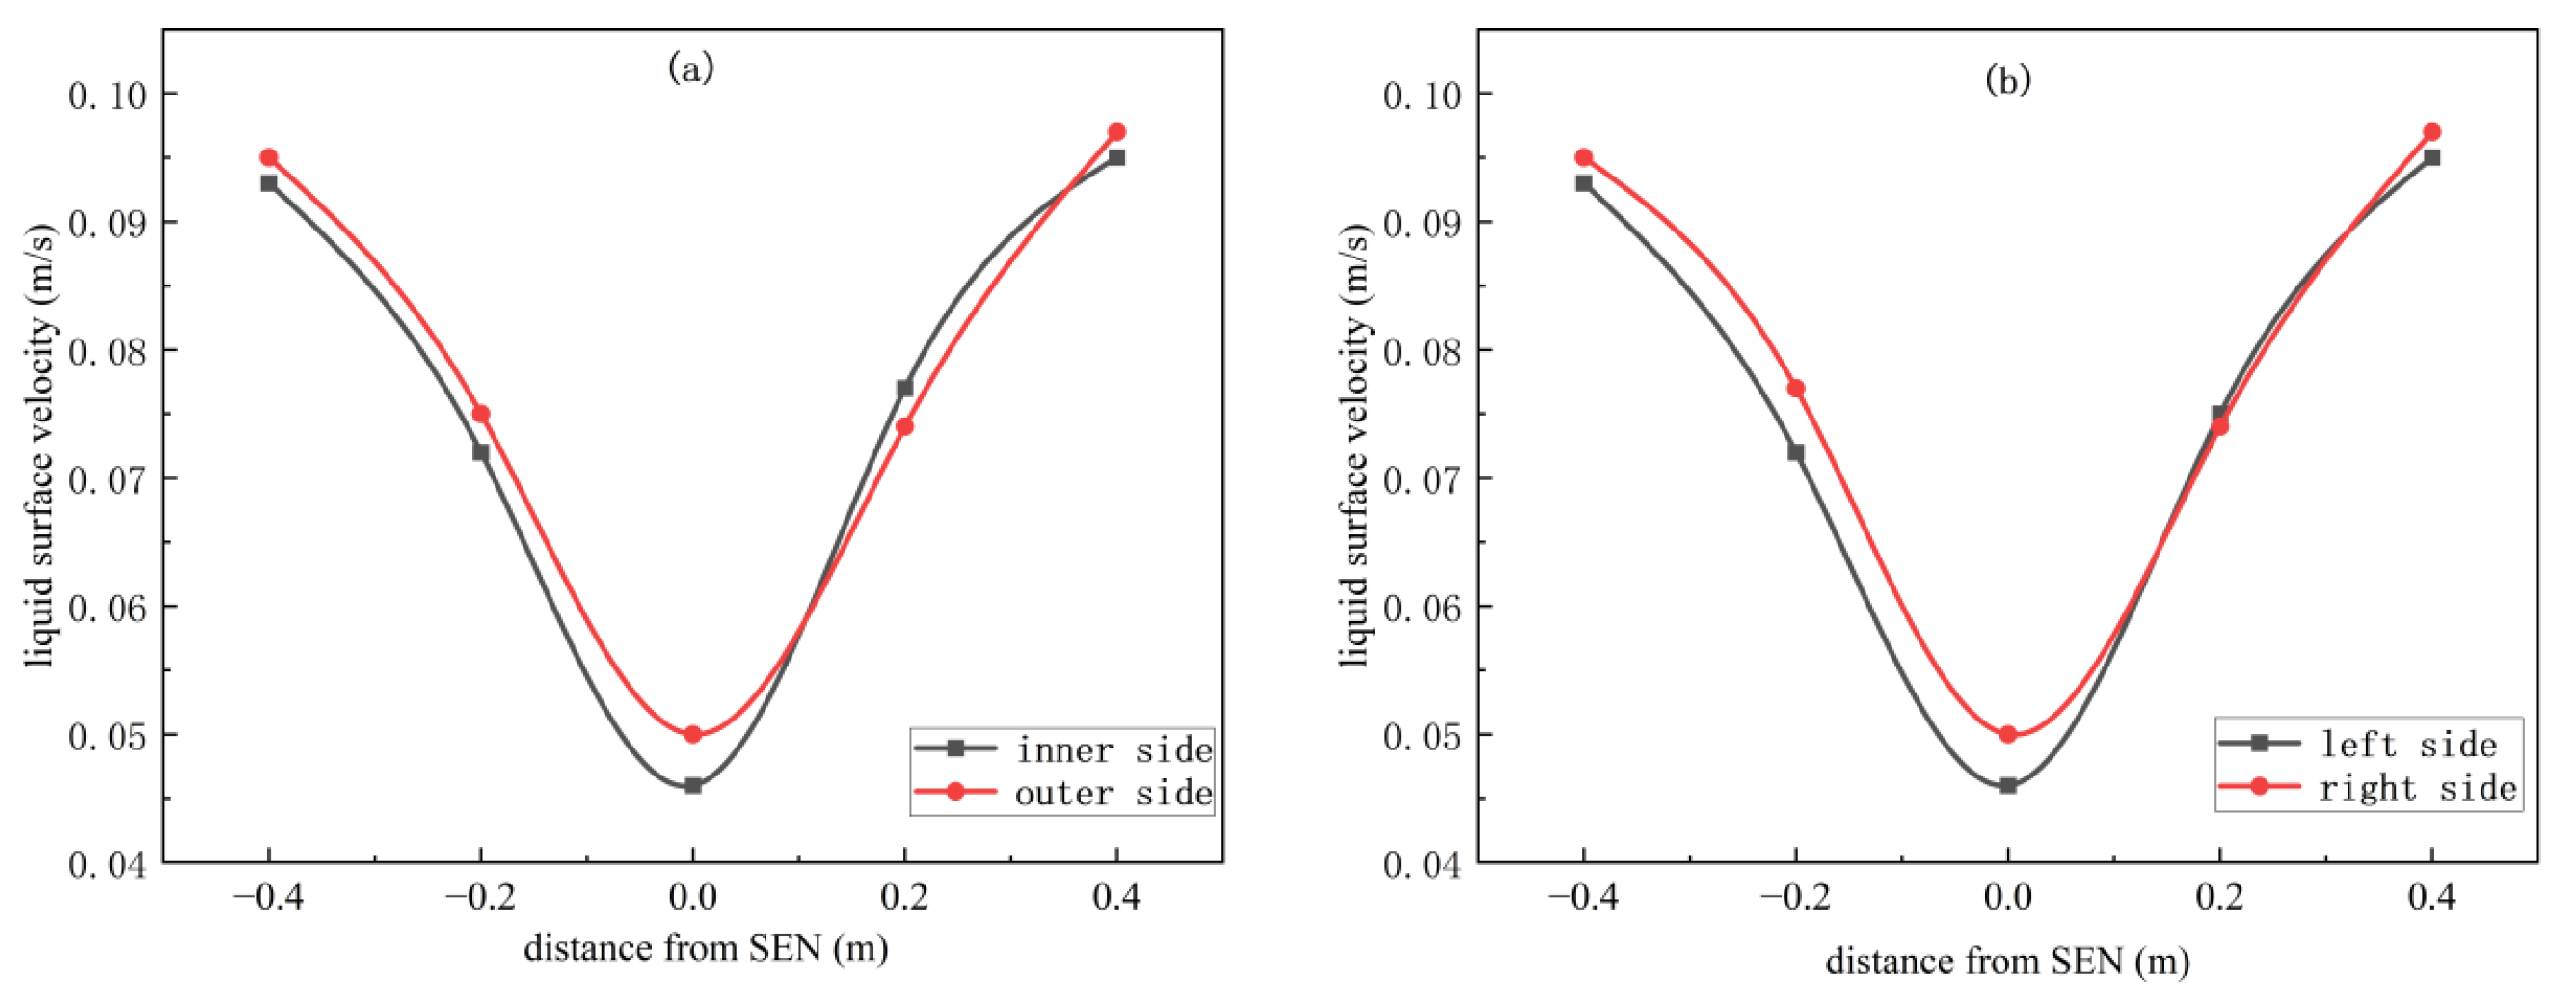
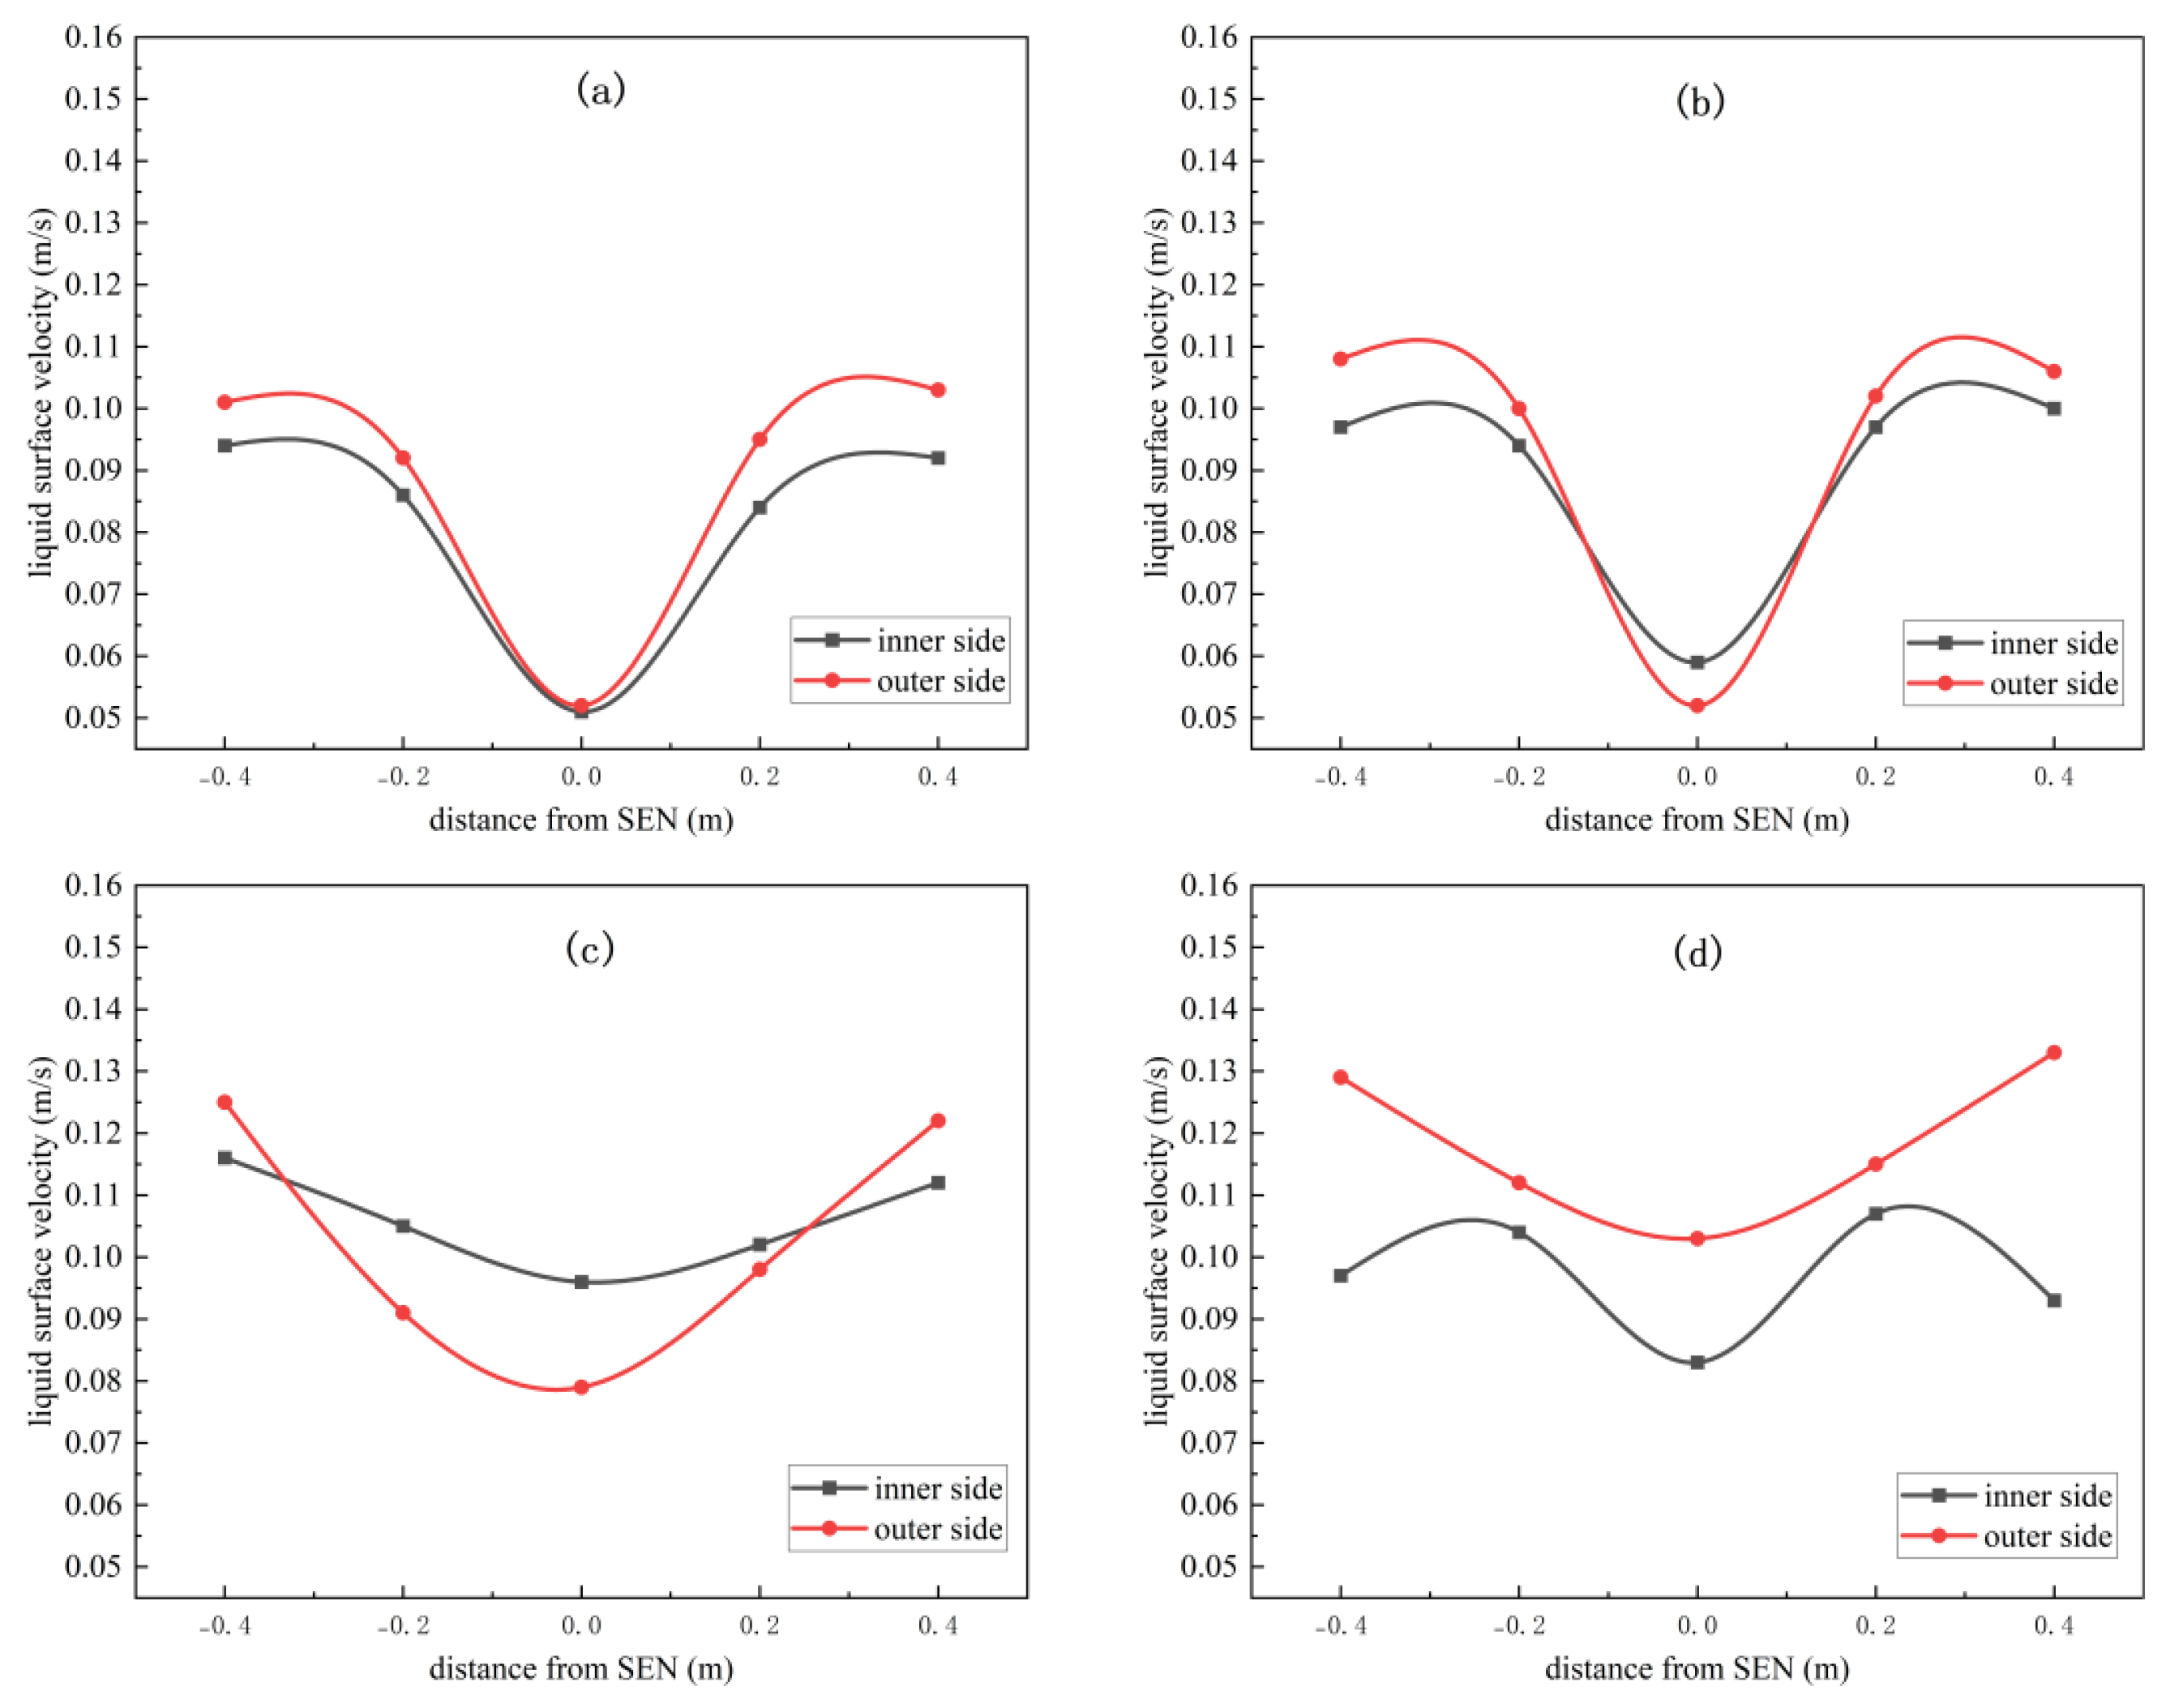
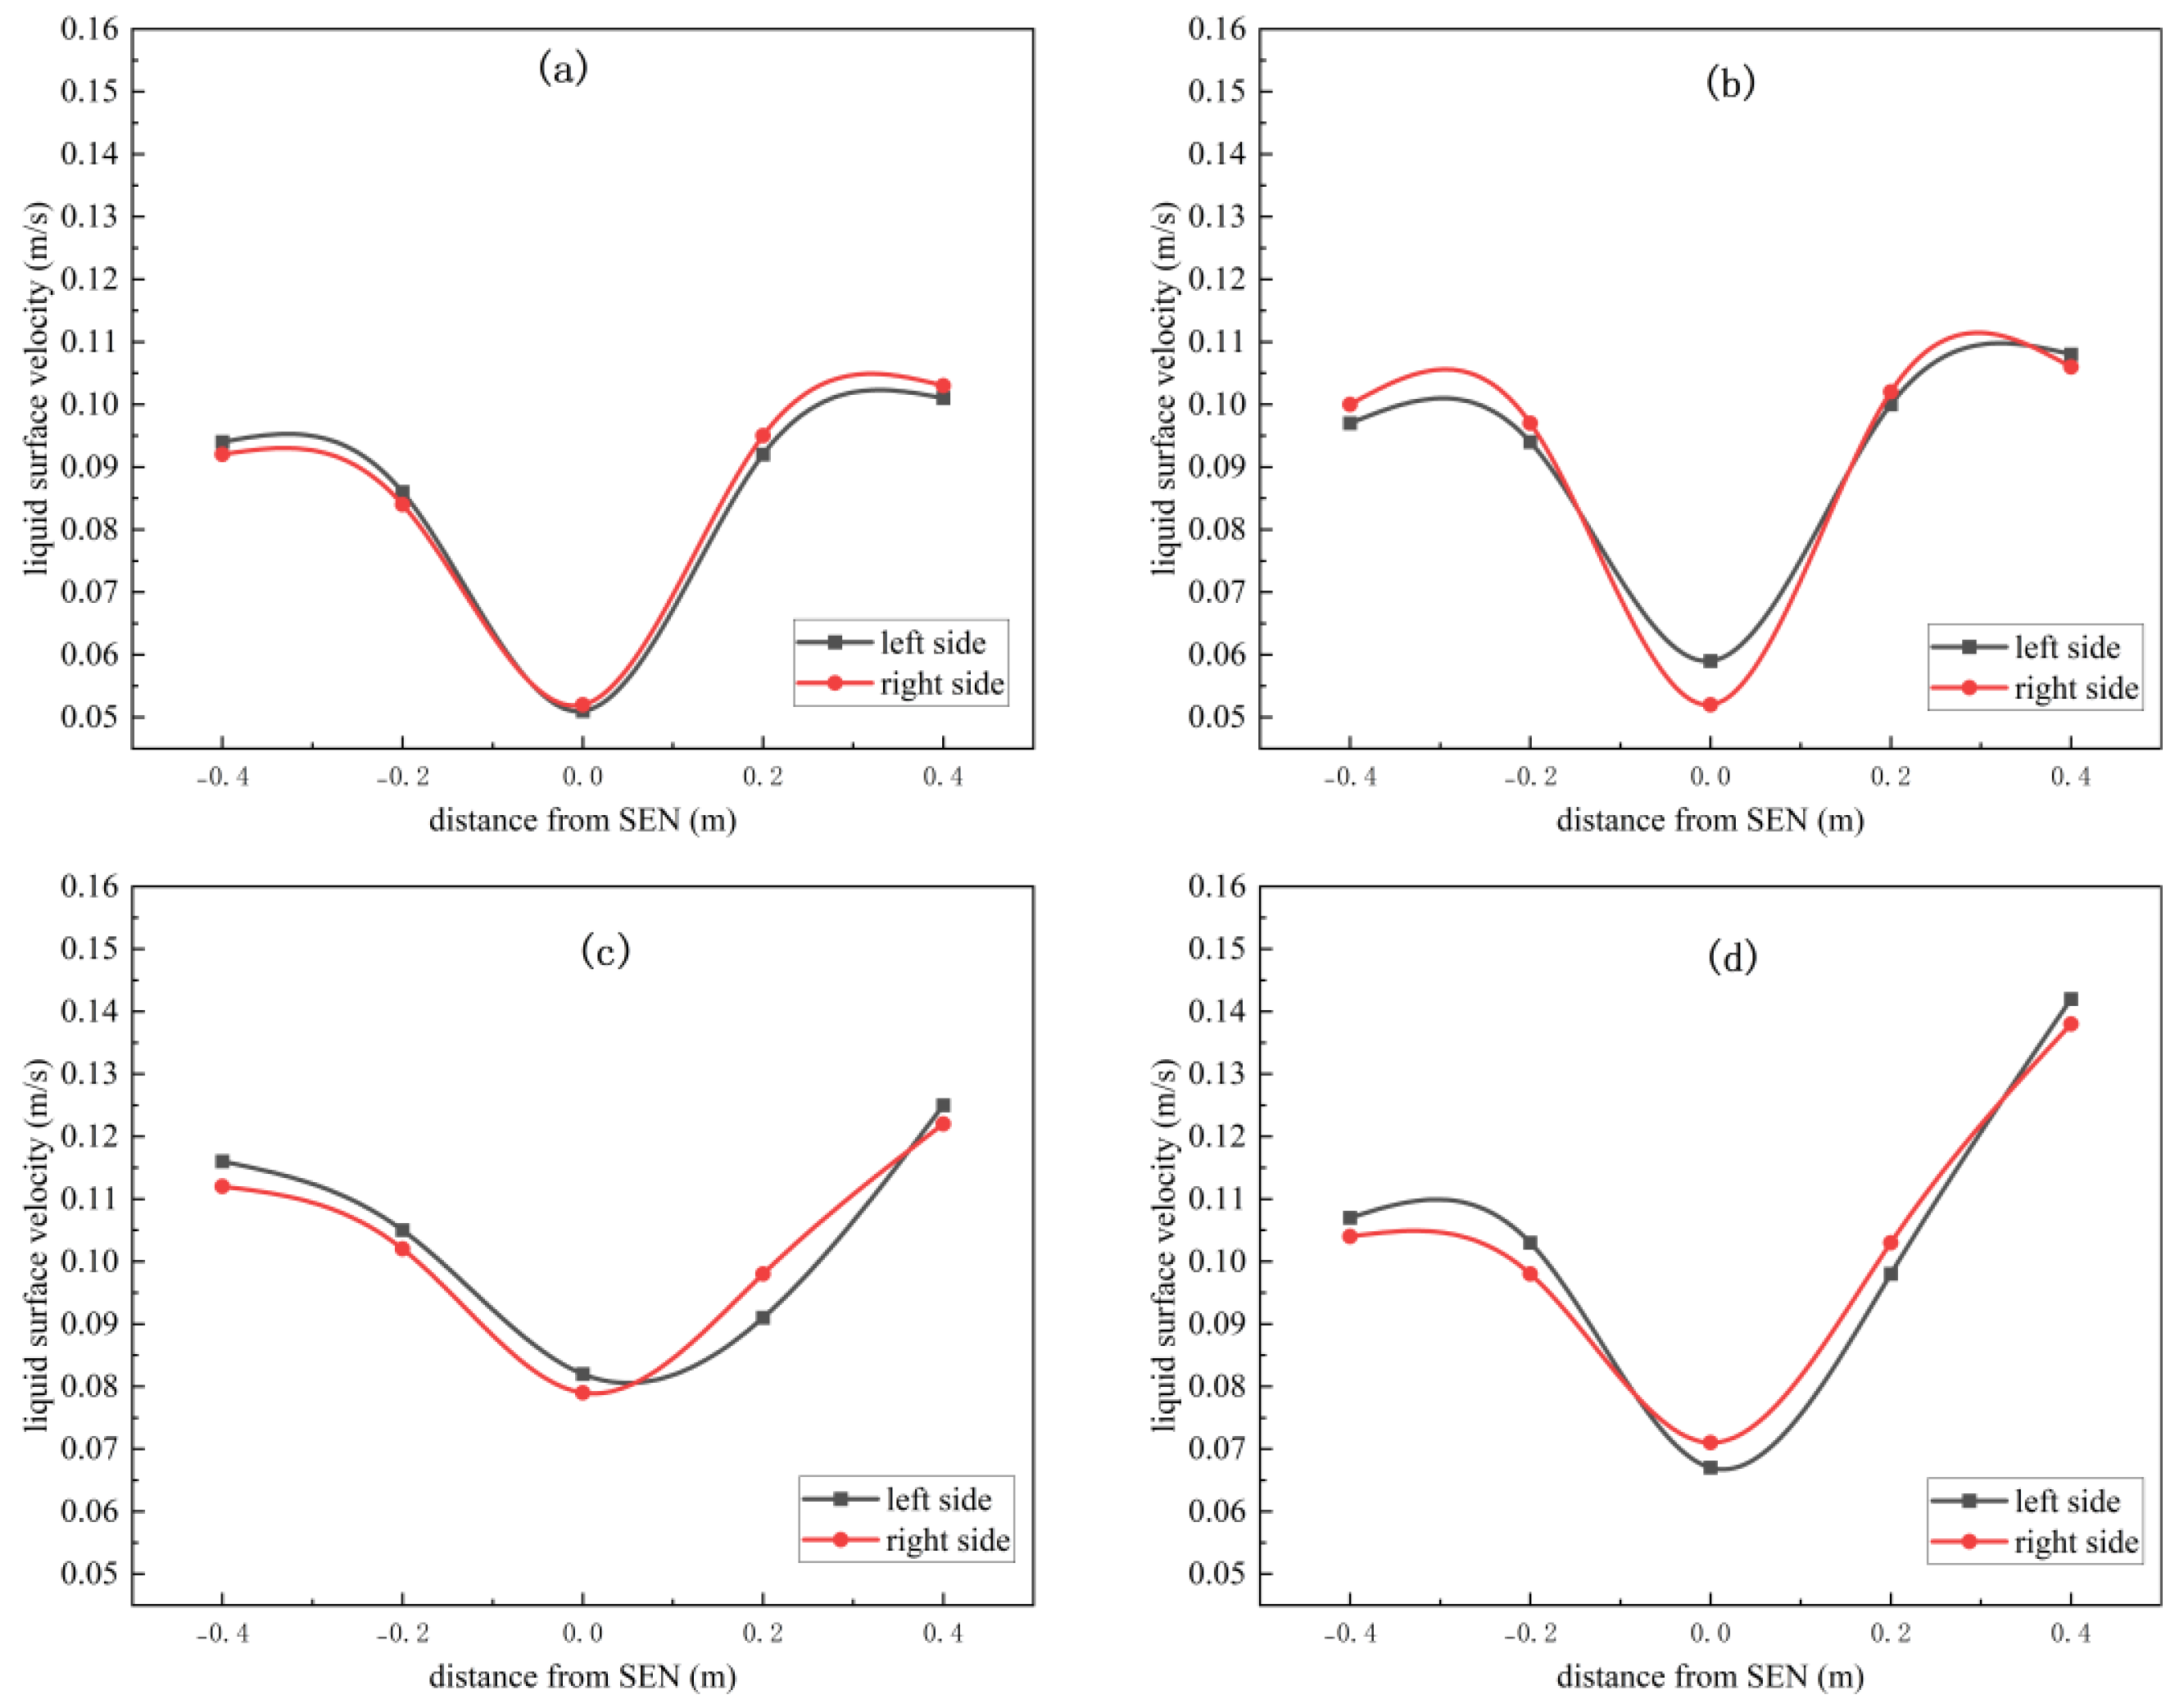
The transverse-axis symmetry index and the longitudinal-axis symmetry index under symmetric conditions are calculated to establish a reference benchmark for the subsequent in-depth analysis of asymmetric flow behavior. Figure 7 shows the velocity distribution of the transverse-axis-symmetric characteristic points and the longitudinal-axis-symmetric characteristic points on the free liquid surface. From Figure 7a, it can be seen that the liquid surface velocity climbs to the maximum value when it is closer to the narrow surface, and the velocity values are nearly the same at the symmetric feature points on both the inner and outer sides. Along the mold’s narrow face and the centerline of the water outlet, the velocity increases as the flow converges toward the narrow wall of the mold. The distribution of the liquid steel flow rate is nearly identical on both sides. The surface flow rates at the symmetry points are shown in Table 2. According to Formula (12), calculated under the symmetric conditions of the liquid surface flow rate, the symmetry index results are listed in Table 3. Among them, the transverse-axis symmetry index () is 0.962, the longitudinal-axis symmetry index () is 0.969, and both are close to 1. This result shows that, under symmetric conditions, the distribution of the liquid steel velocity field in the mold has good symmetry.
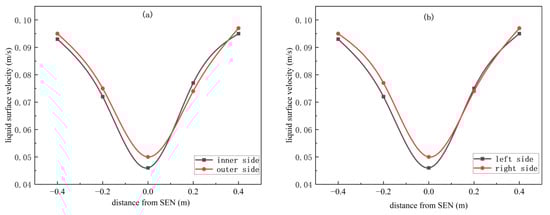
Figure 7.
Velocity distribution at characteristic points on the free liquid surface. (a) Points that are symmetric with respect to the transverse axis. (b) Points that are symmetric with respect to the longitudinal axis.
Table 2.
Velocity values at the characteristic points of the free liquid level.
Table 3.
Symmetry index under symmetric conditions.
3.1.2. Bias Flow Index
Liquid-level fluctuations in the water simulation experiment were calculated based on wave height meter measurements. Table 4 shows the wave height values at each characteristic point under symmetrical conditions.
Table 4.
Liquid-level fluctuation values at characteristic points under symmetrical conditions.
Under symmetrical conditions, the values of the longitudinal bias flow index () and the transverse-axis bias flow index () are calculated according to Equation (13), and the results are shown in Table 5. It is evident that both and values are close to zero, indicating that the symmetry of the liquid steel flow behavior within the mold is well-maintained.
Table 5.
Bias flow index under symmetric conditions.
3.1.3. F-Number
From Formula (16), it can be seen that four main parameters affect the liquid-level fluctuation F-number, that is, the velocity of molten steel impacting the mold side, Ve, steel flow, QL, steel impact on the side of the mold angle, , and the distance from the impact point to the free liquid surface, D. The above parameters by mathematical simulation and water model experiments, each parameter and the number of F as shown in Table 6, the value of F-number of the normal symmetry of the SEN for the 4.297, the value of F-number in the 3–5 range, indicating that the liquid-level fluctuation is more reasonable. It is in the range of 3–5, which indicates that the liquid-level fluctuation is more reasonable.
Table 6.
F-numbers under symmetric conditions.
3.2. Effect of Orifice Offset on Liquid Steel Flow Behavior in the Mold
During the actual production process, factors such as the intermediate ladle bottom deformation and the traverse car positioning are not allowed, and the phenomenon of SEN offset occasionally occurs. SEN offset will cause the molten steel flow field in the mold to become asymmetric, increasing the risk of slag being rolled onto the billet surface and the likelihood of steel leakage accidents. Therefore, this paper investigates the influence of SEN offset (including width-direction offset, thickness-direction offset) on the liquid steel flow behavior in the mold under two working conditions.
3.2.1. SEN Offset Along the WIDTH Direction
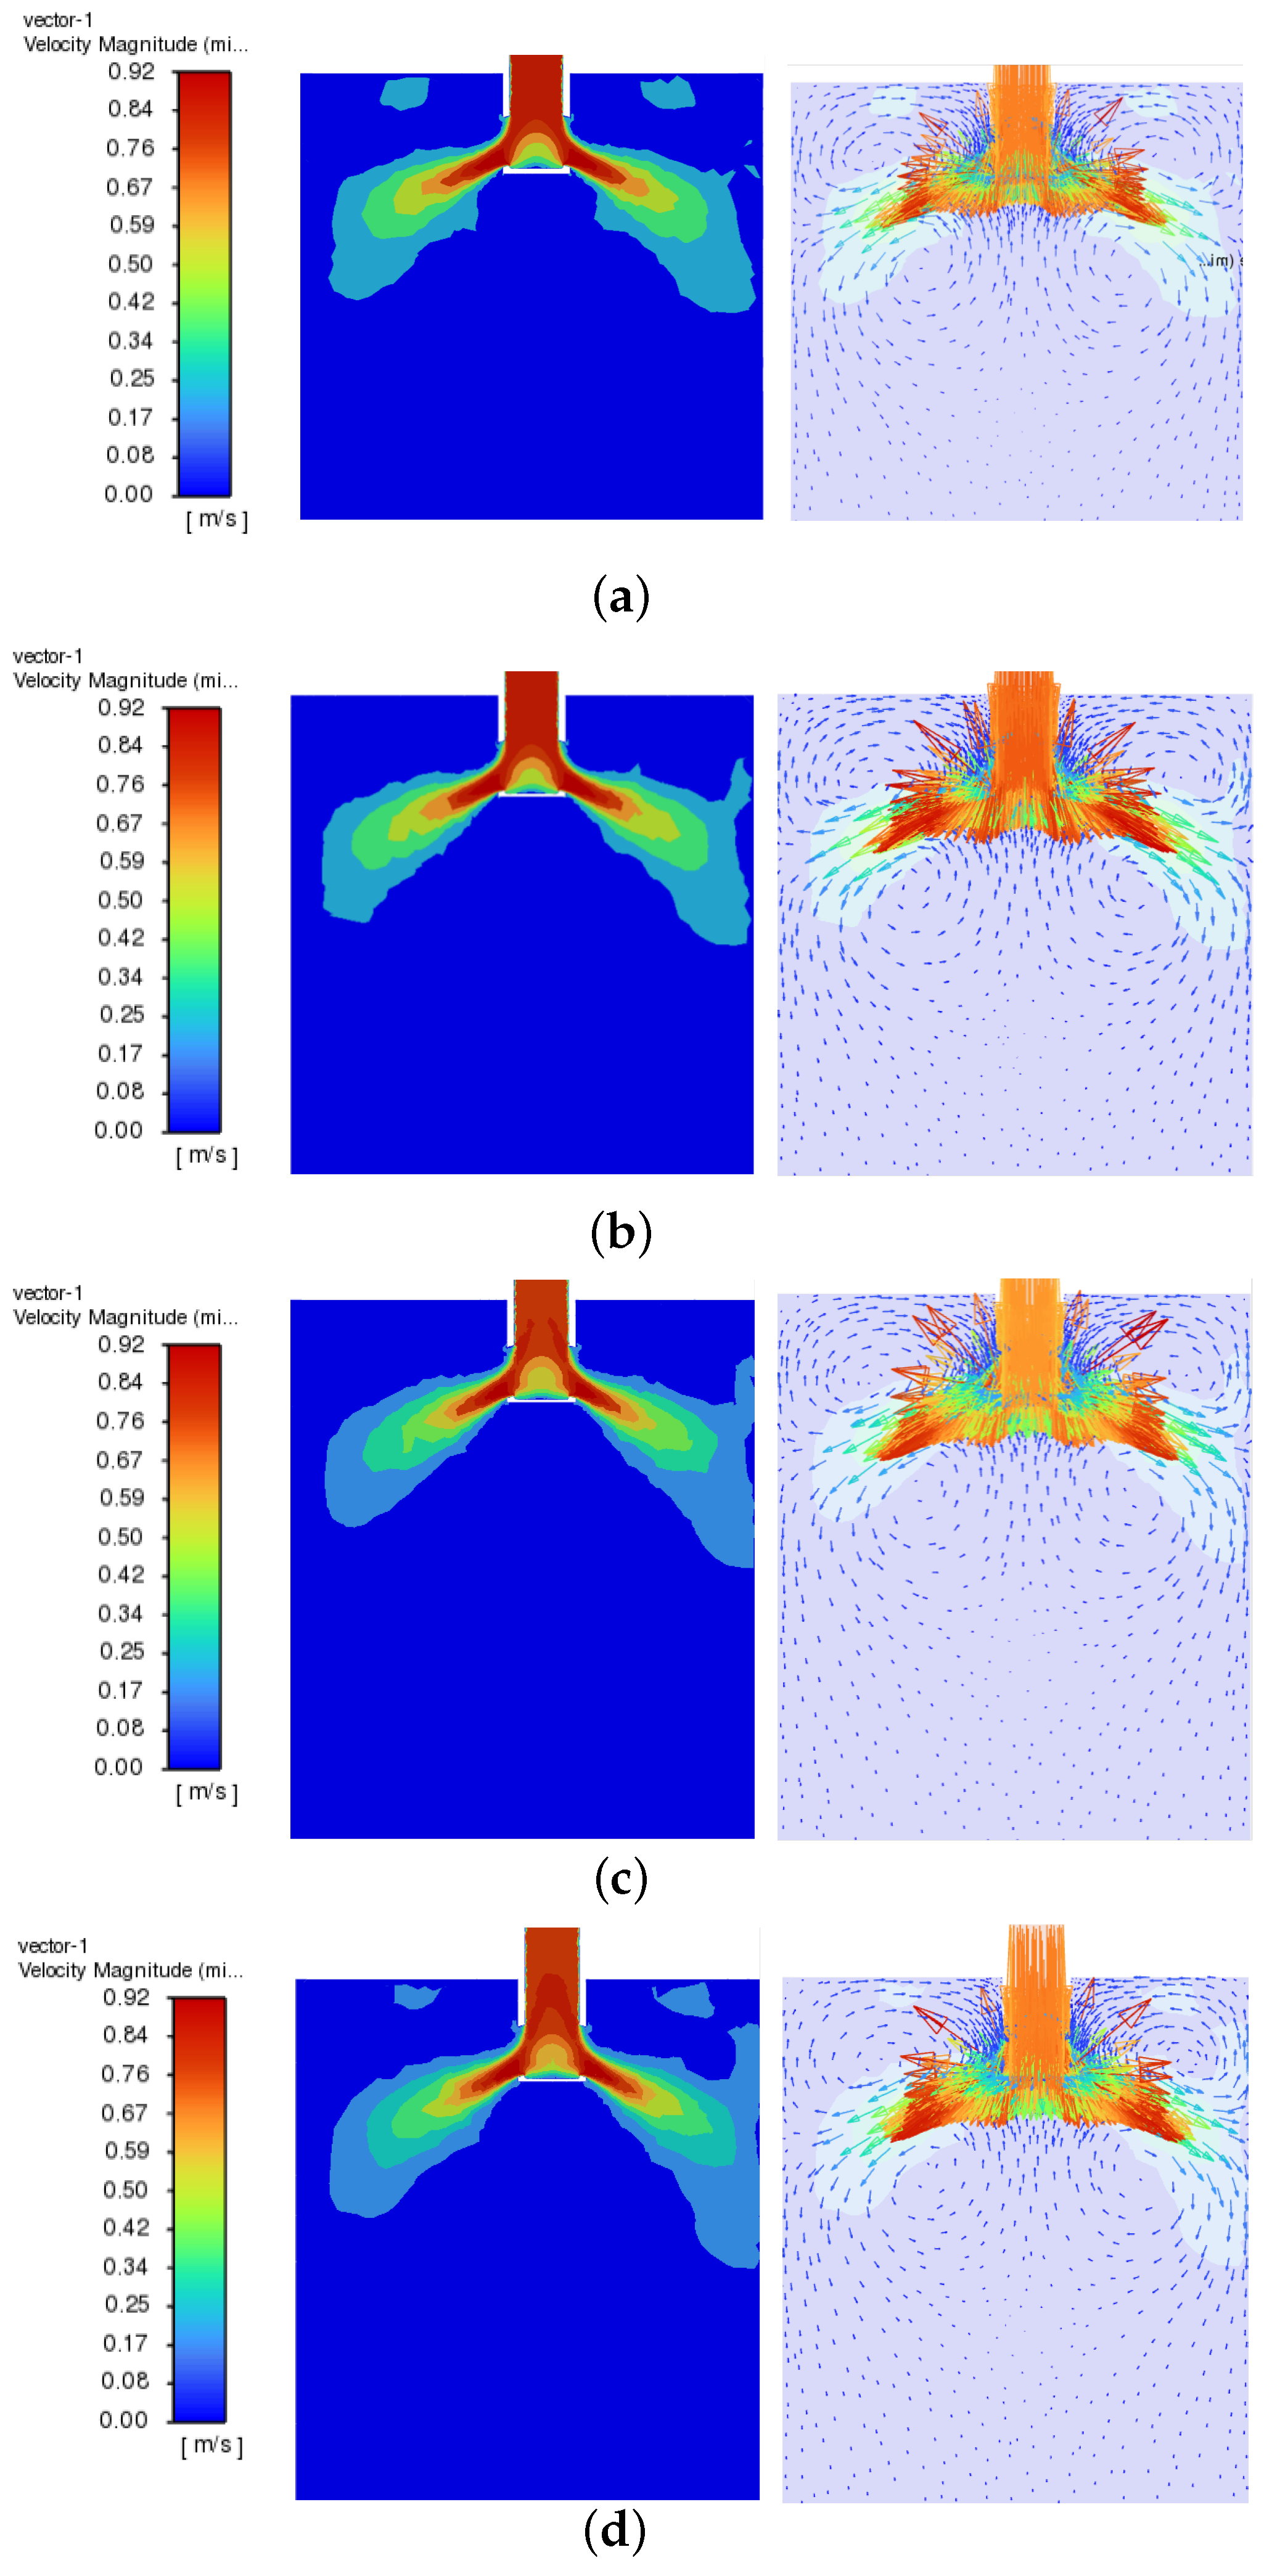
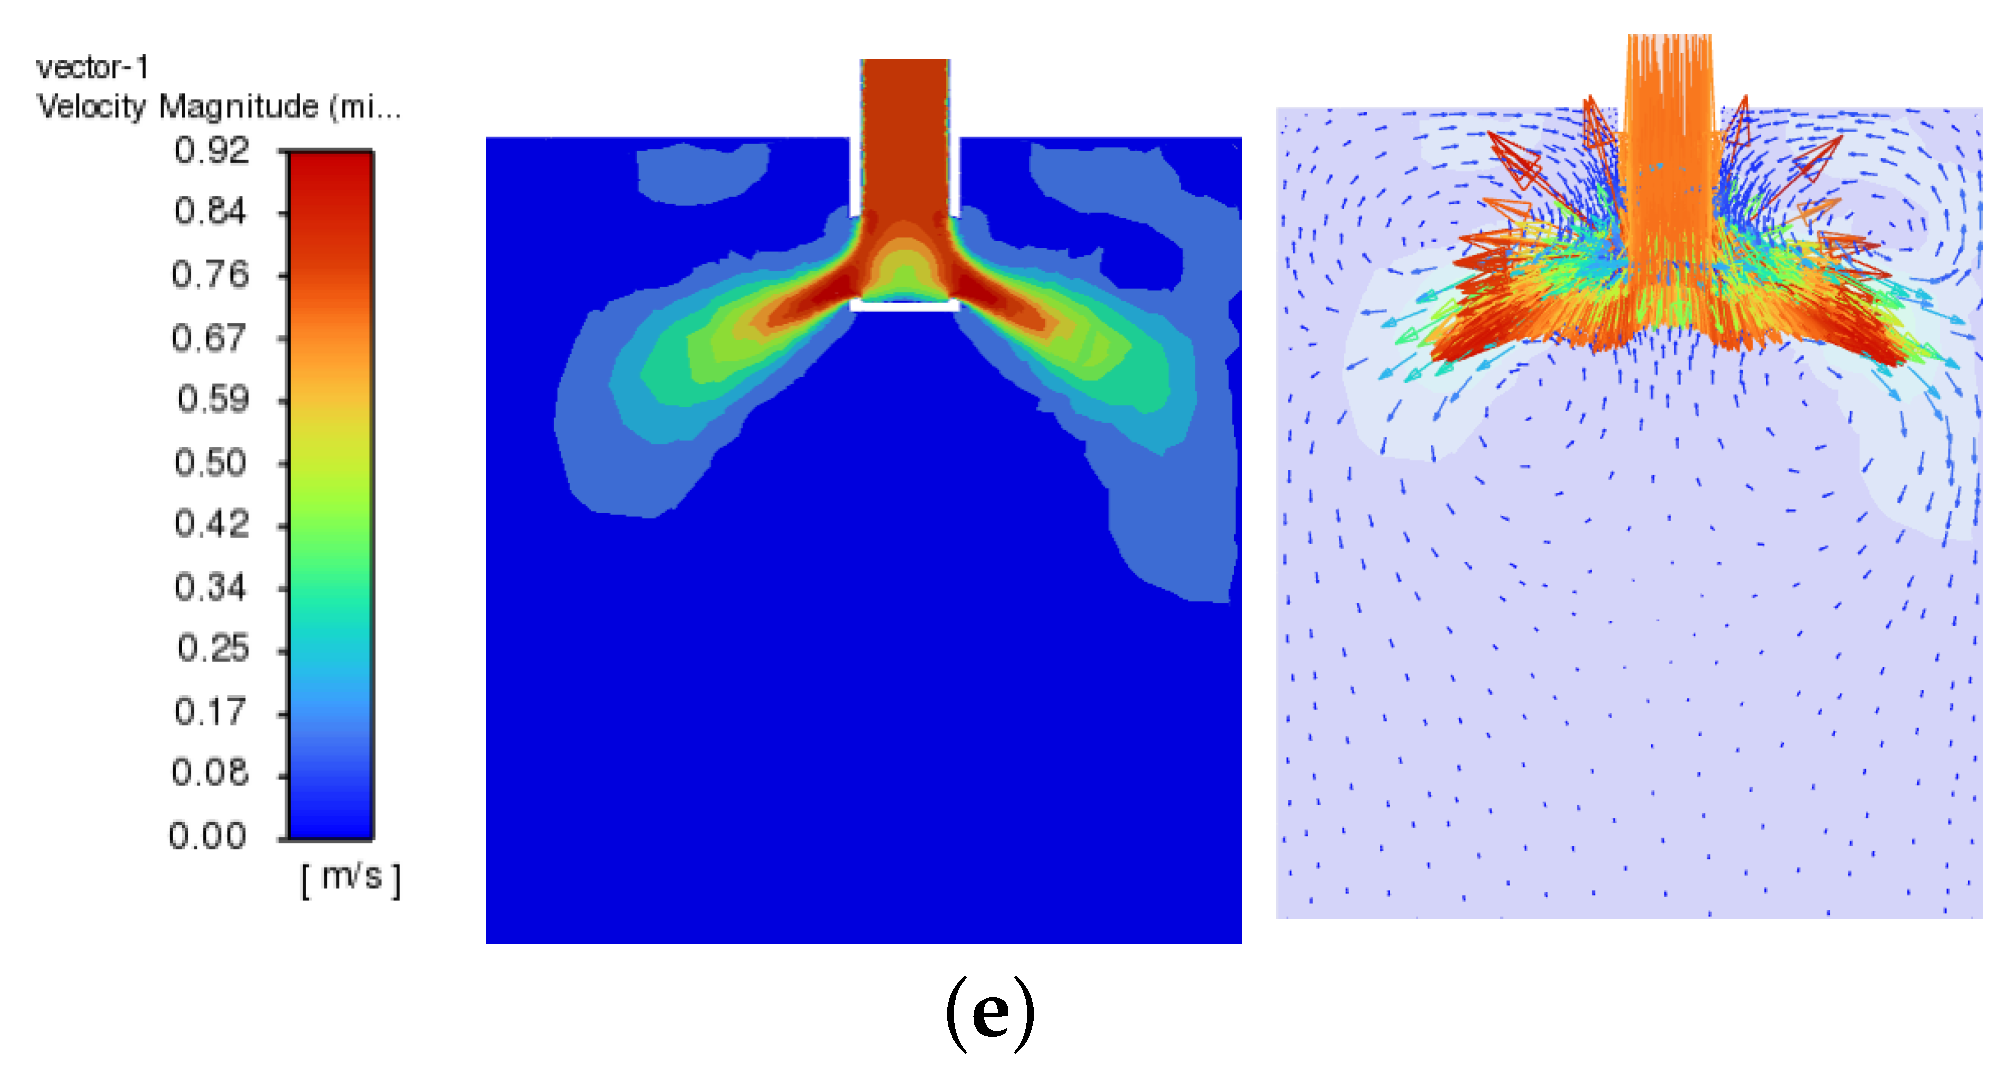
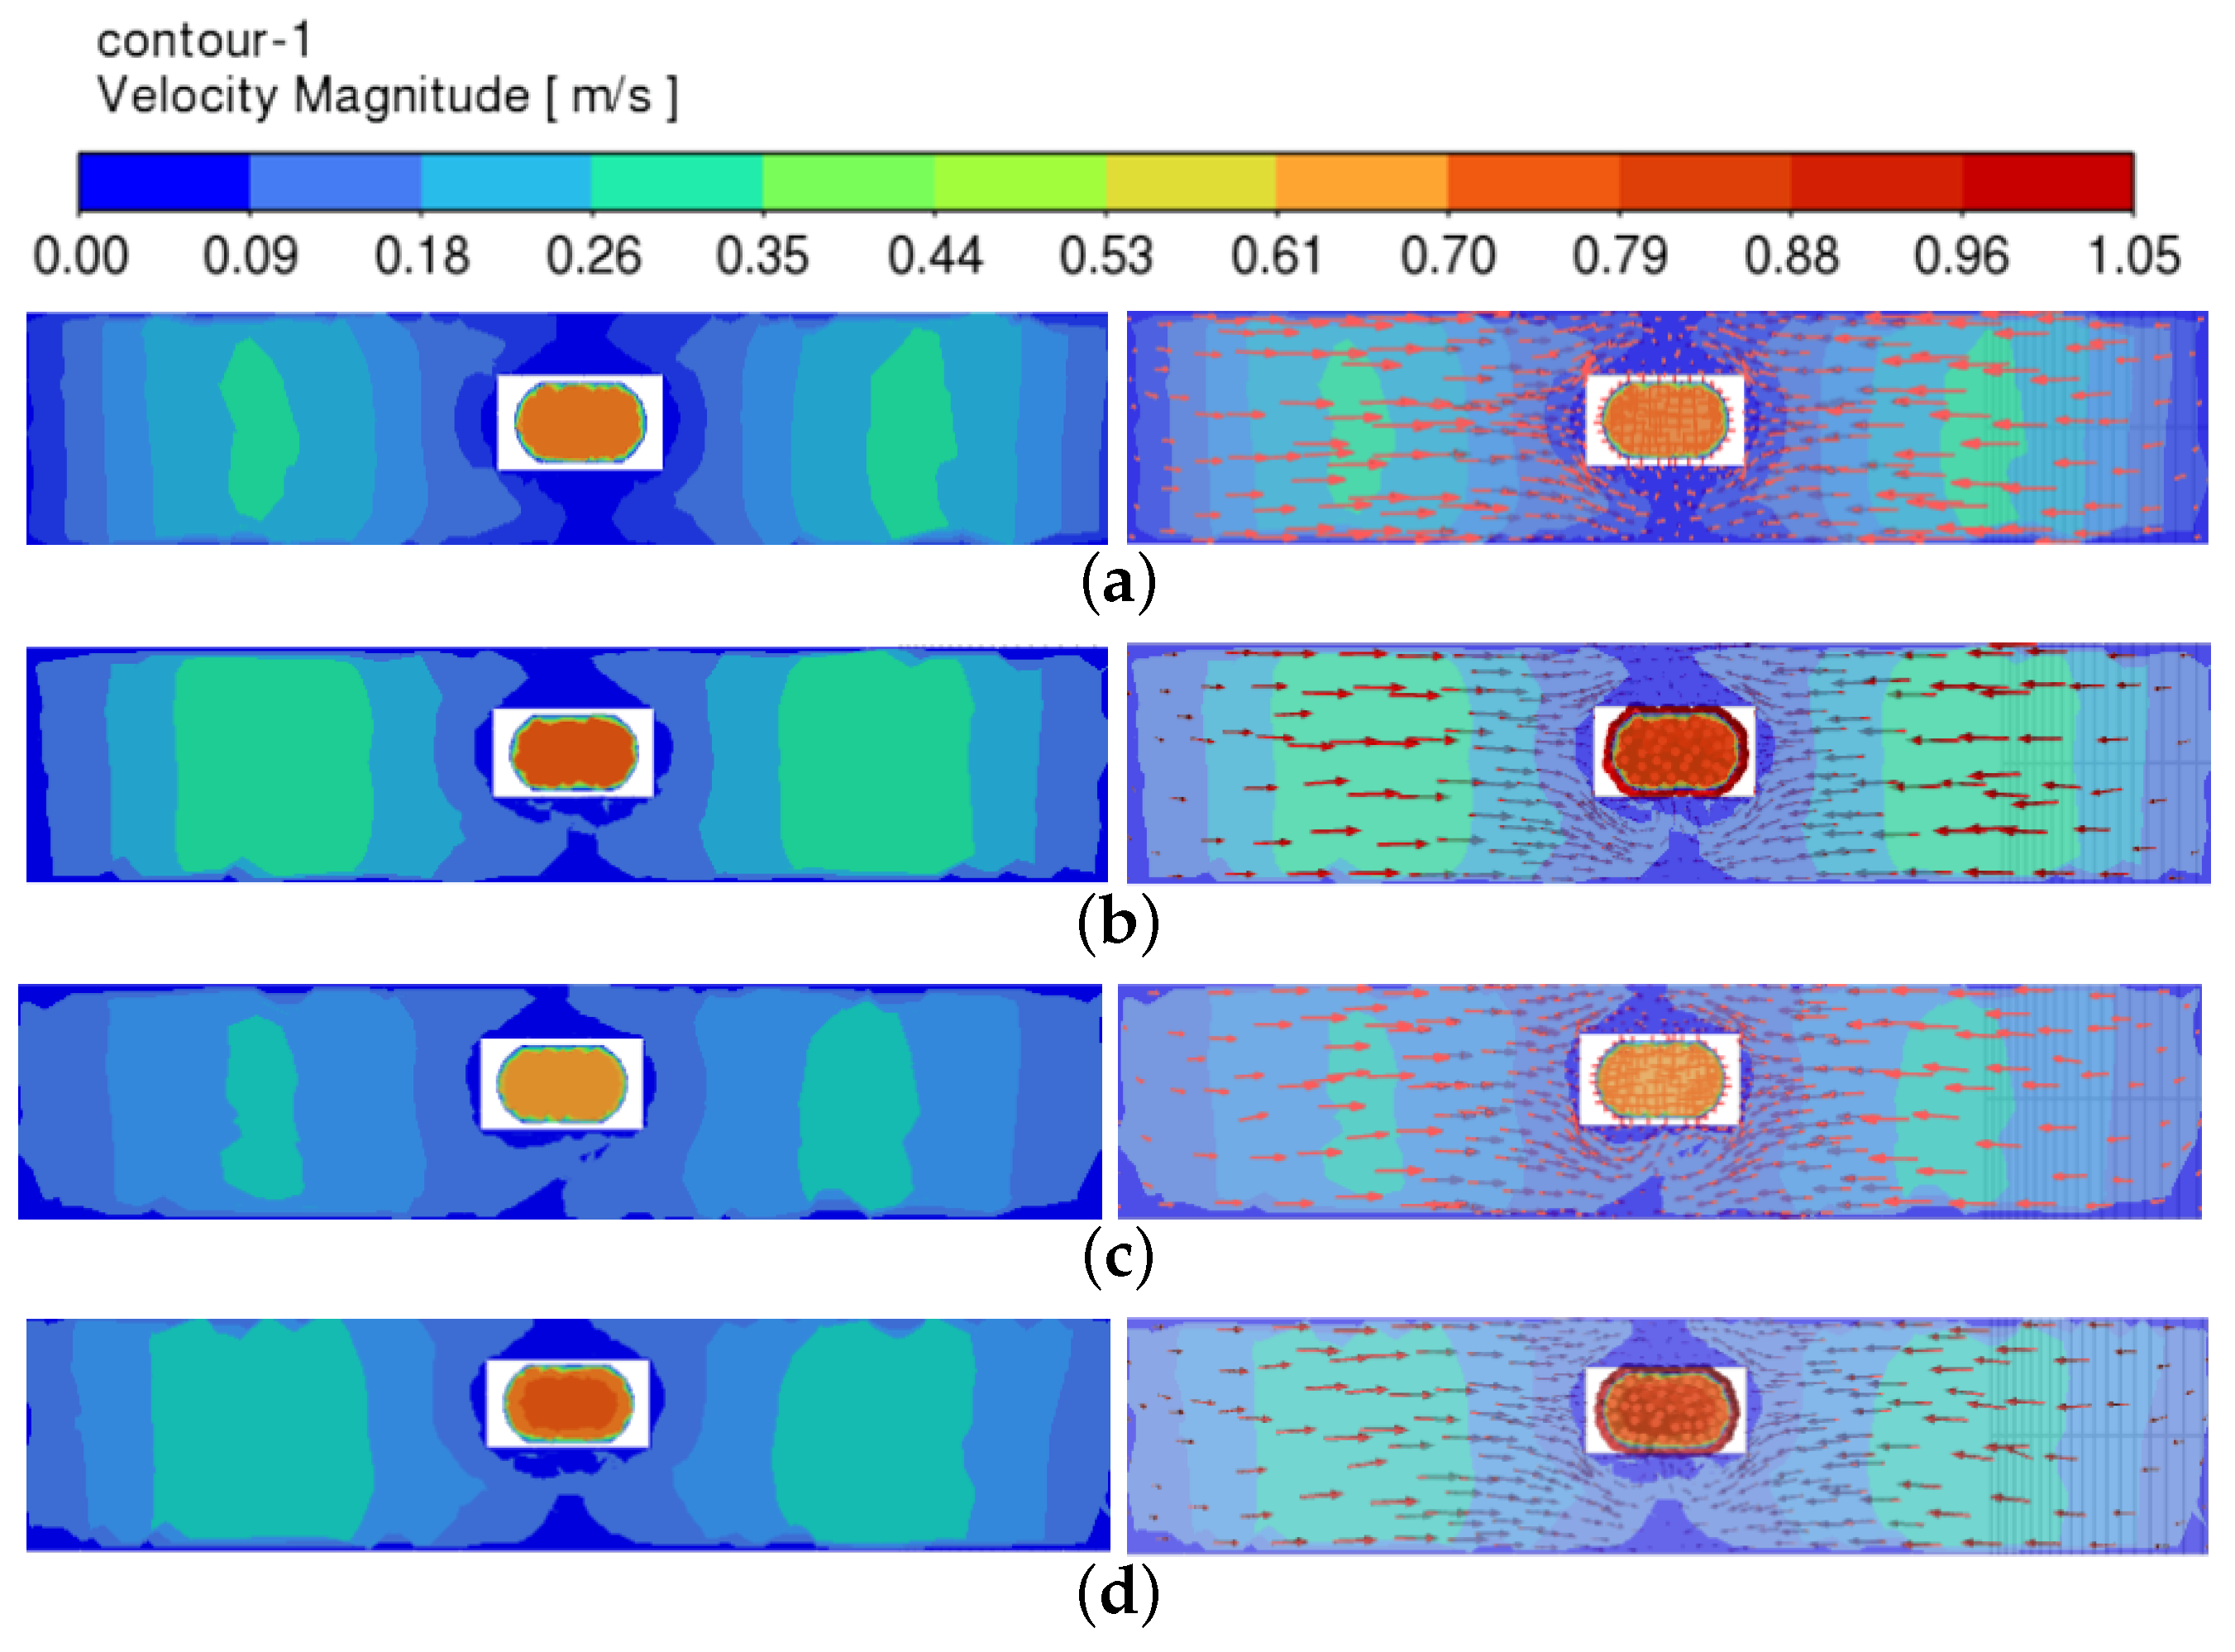
Figure 8 shows the velocity cloud and vector diagrams of the liquid steel at the transverse center section of the mold when the submerged entry nozzle (SEN) is shifted to the right by 10 mm, 20 mm, 30 mm, 40 mm, and 50 mm along the width direction. As shown in the figure, despite the SEN being shifted along the width direction, the flow field distribution within the mold maintains the typical double-loop flow structure. However, the SEN offset causes asymmetry in the circulating flow between the left and right sides of the mold. As the degree of offset increases from 10 mm to 50 mm, the asymmetry between the left and right sides of the flow field becomes more pronounced. This asymmetry arises because, when the SEN is offset to the right, the flow distance for the strand exiting the right side of the SEN to reach the narrow wall of the mold is shortened. Consequently, the strand moves more quickly along the inclination of the right side hole of the SEN toward the narrow wall, resulting in the impact point on the narrow side of the mold shifting upward relative to the symmetric condition. This upward shift increases the impact force on the right-side narrow wall of the mold. On the other hand, for the flow strand exiting from the left side of the SEN, the distance to the narrow wall increases. As a result, the impact point of the strand shifts downward, reducing the impact force on the left-side narrow wall of the mold. This phenomenon becomes more pronounced as the degree of SEN offset increases.


Figure 8.
Velocity cloud diagrams and vector diagrams of the central section under different degrees of offset. (a) Offset of 10 mm. (b) Offset of 20 mm. (c) Offset of 30 mm. (d) Offset of 40 mm. (e) Offset of 50 mm.
When the water outlet is shifted along the width direction, it induces asymmetry in both the liquid steel flow field within the mold and the liquid surface flow velocity on either side of the water outlet. The velocity cloud and vector diagram of the free liquid surface of the liquid steel in the mold are shown in Figure 9. As illustrated in the figure, with the water outlet offset to the right along the transverse axis, a significant difference in the liquid surface velocity between the left and right sides of the water outlet becomes apparent. The reason for this asymmetry is that when the water spout is shifted to the right along the transverse axis, the flow strand on the right side of the spout travels a shorter distance to reach the narrow surface of the mold. As a result, the shear force generated by the reflux, which occurs after the flow strand impacts the narrow surface, is significantly larger on the right side compared to the left side of the spout. This disparity in the shear forces on either side of the water outlet ultimately leads to the observed asymmetry in the liquid surface velocity on the left and right sides of the water outlet.
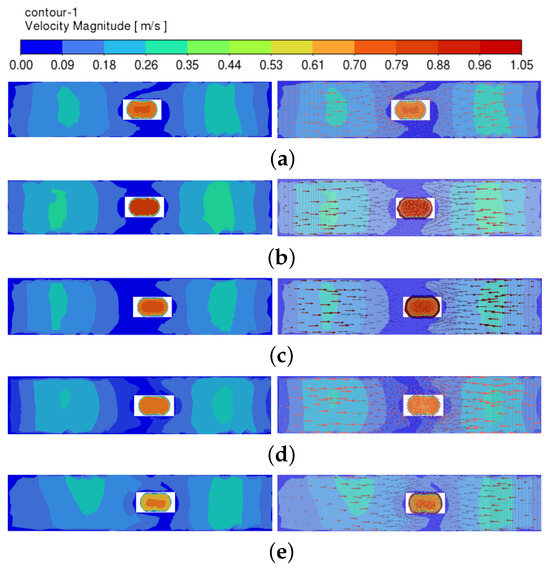
Figure 9.
Velocity cloud and vector diagram of the free liquid surface under different degrees of offset. (a) Offset of 10 mm. (b) Offset of 20. (c) Offset of 30 mm. (d) Offset of 40 mm. (e) Offset of 50 mm.
- (1)
- Symmetry index
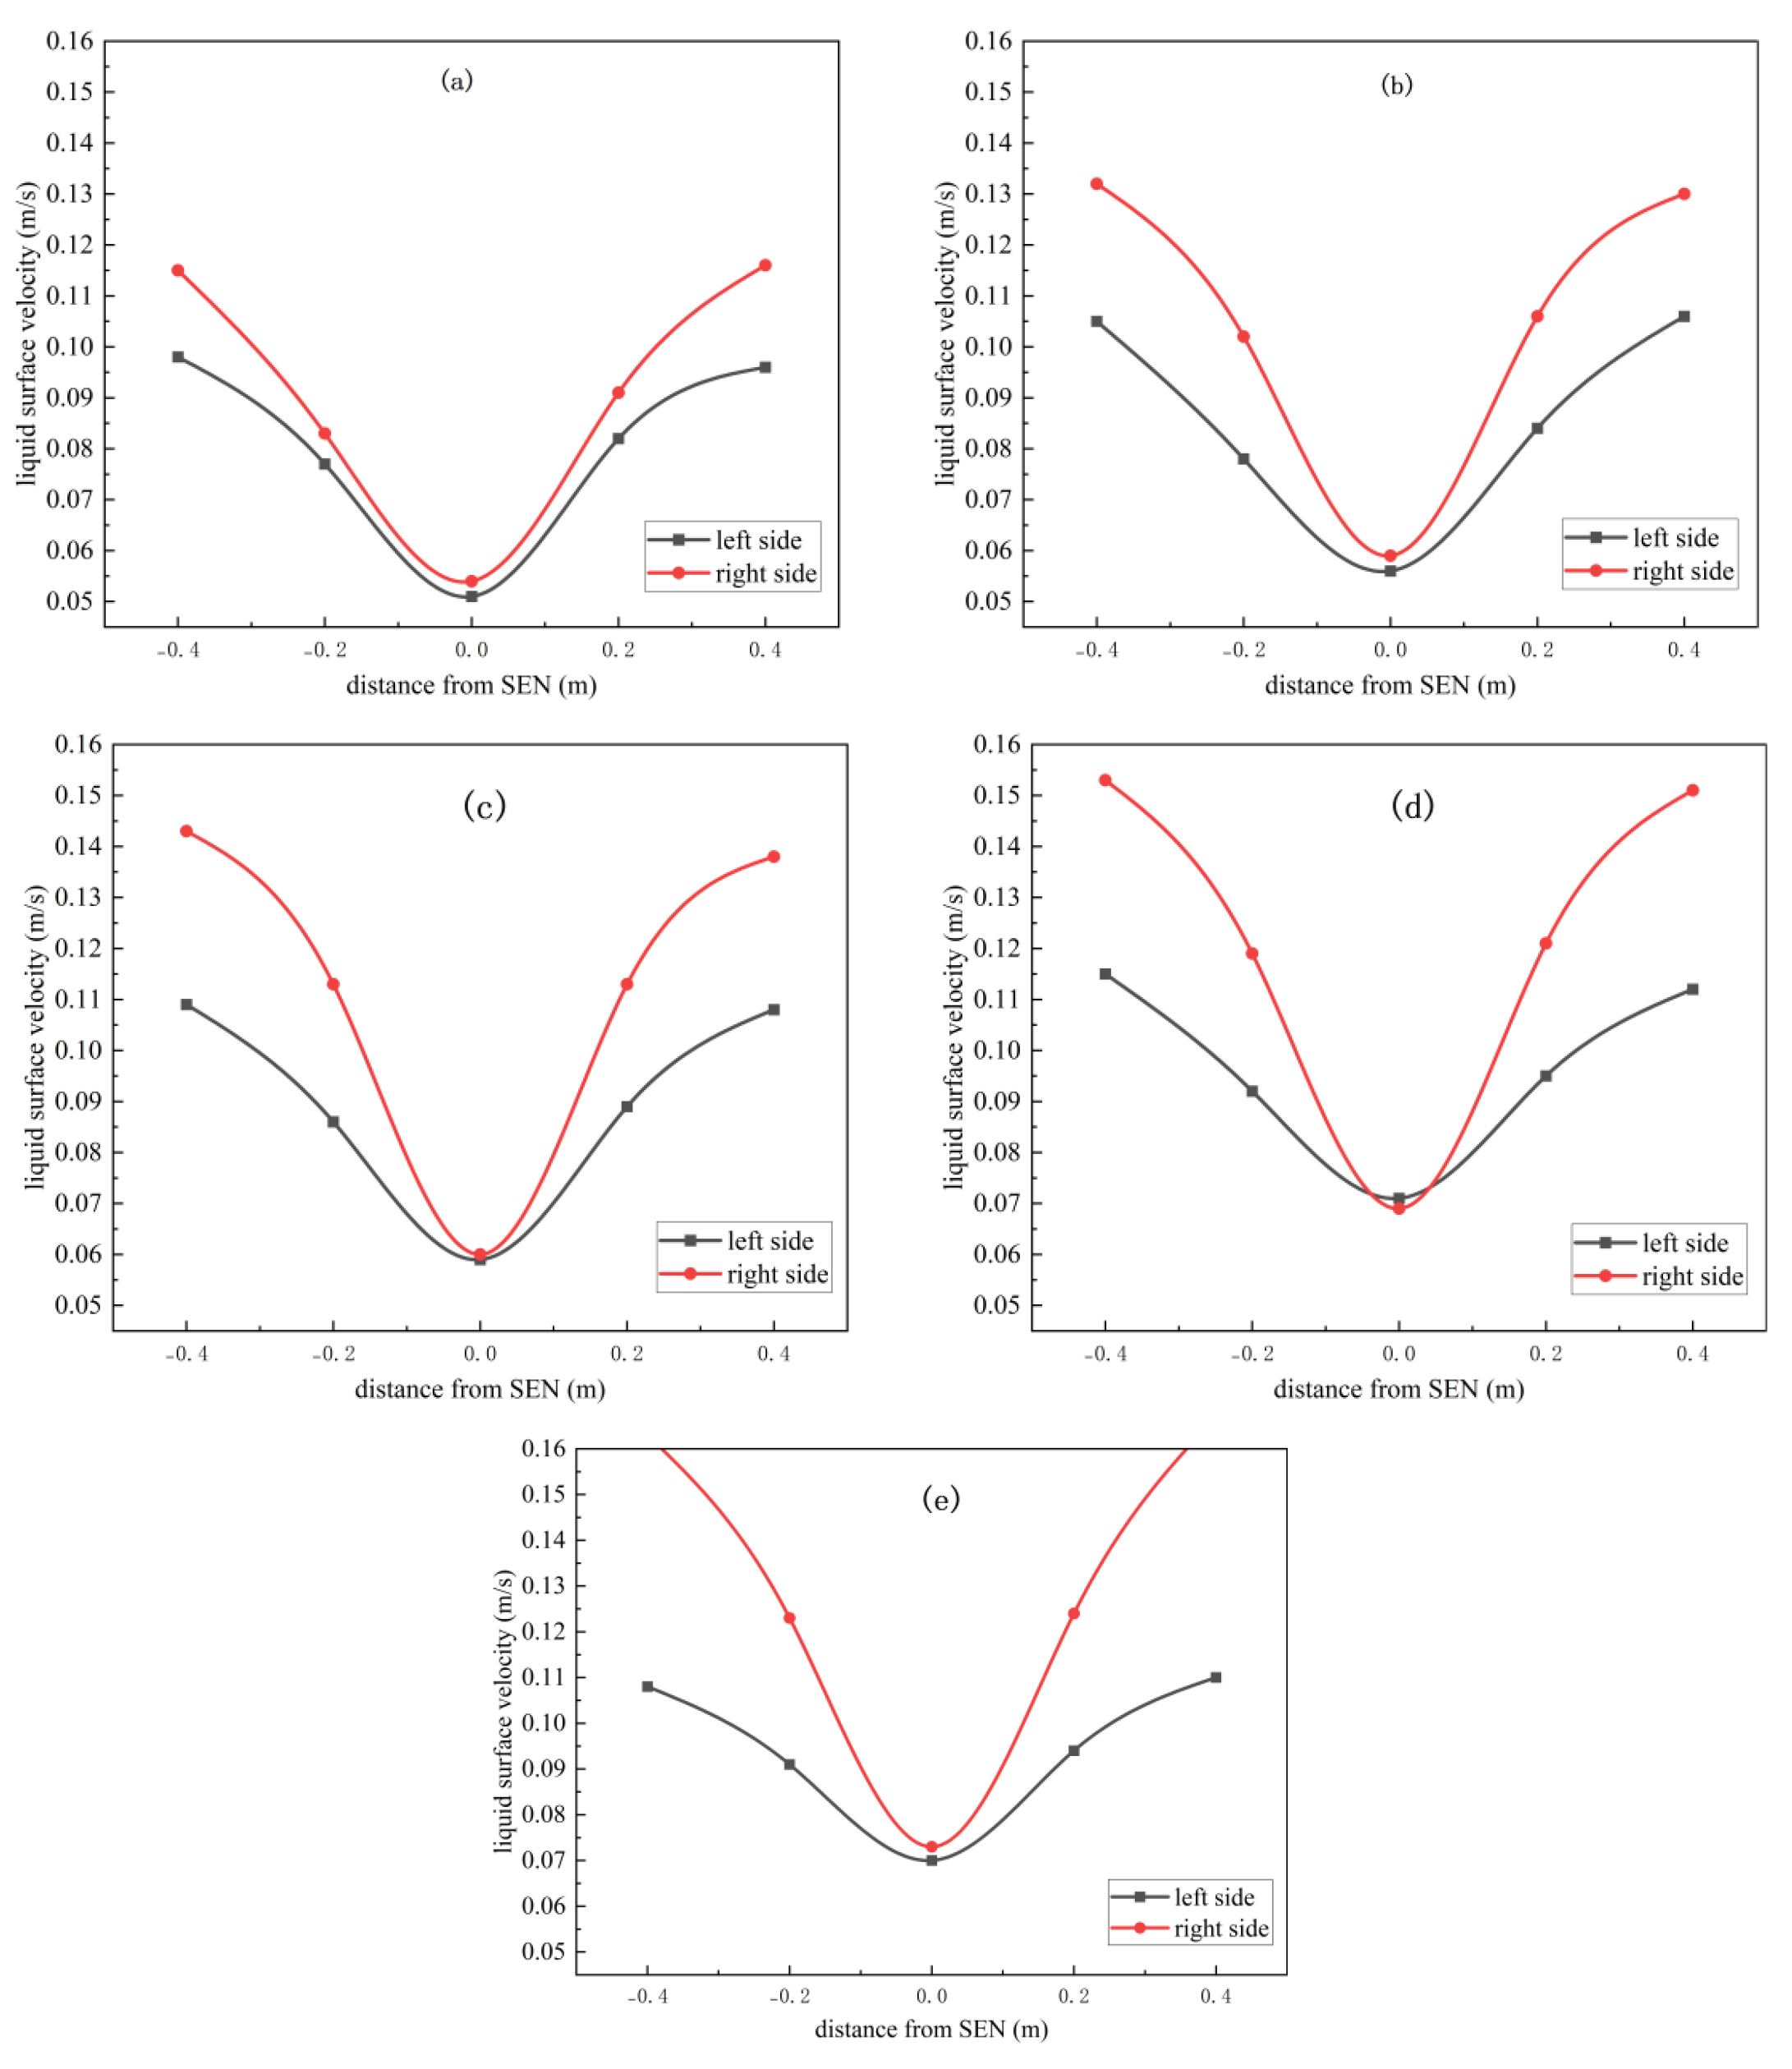
Figure 10 and Figure 11 show the velocity distributions of the transverse-axis and longitudinal-axis-symmetric feature points of the free liquid surface, respectively.
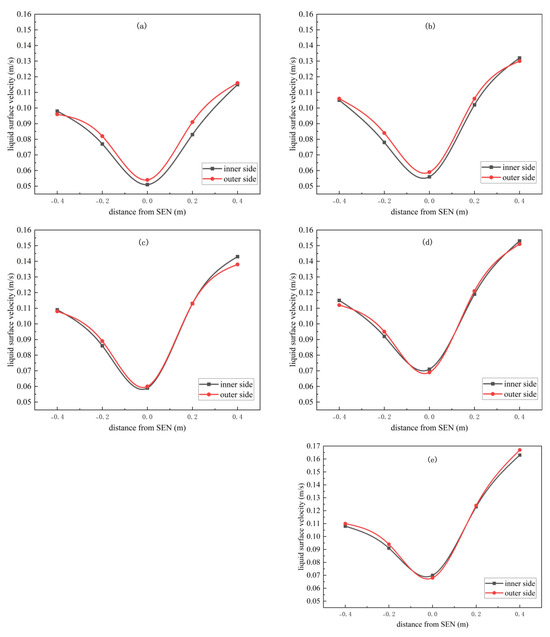
Figure 10.
Velocity distribution of transverse-axis-symmetric feature points under different degrees of offset. (a) Offset of 10 mm. (b) Offset of 20 mm. (c) Offset of 30 mm. (d) Offset of 40 mm. (e) Offset of 50 mm.
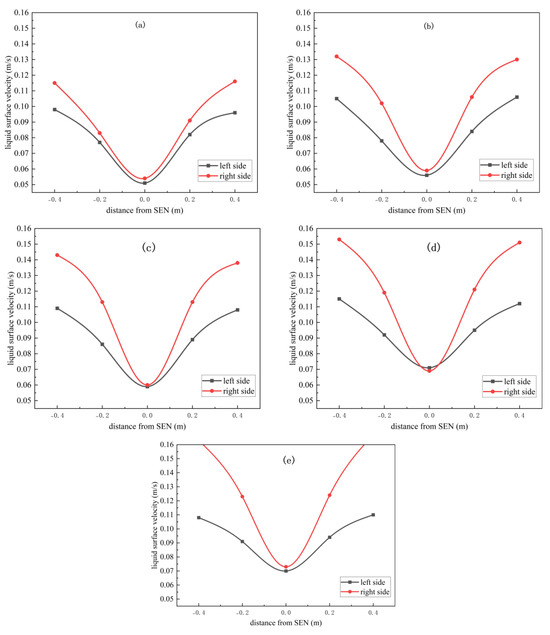
Figure 11.
Velocity distribution of longitudinal-axis-symmetric feature points under different degrees of offset. (a) Offset of 10 mm. (b) Offset of 20 mm. (c) Offset of 30 mm. (d) Offset of 40 mm. (e) Offset of 50 mm.
When the SEN is offset to the right along the transverse-axis direction, the velocity distributions in the inner and outer sides of the SEN do not show any significant change, and the velocity distribution plots of the transverse-axis-symmetric feature points have a high degree of overlap. This indicates that the offset of the mold along the transverse-axis direction has little effect on the symmetry of the flow field in the mold at the inner and outer sides of the SEN. On the left and right sides of the SEN, the flow field of steel inside the mold changes significantly, and the velocity distributions of the longitudinal-axis-symmetric feature points also show significant differences with the degree of SEN offset. Therefore, under the condition that the SEN is offset along the transverse axis, the longitudinal-axis symmetry index is calculated and analyzed in this paper.
Based on the longitudinal-axis-symmetric characteristic point velocity, the longitudinal-axis symmetry index is calculated according to Equation (12) when the SEN is offset along the transverse-axis direction, as shown in Table 7. It can be seen from the data in the table that, as the SEN offset along the transverse axis increases to the right from 0 to 50 mm, the longitudinal-axis symmetry index () of the molten steel flow field in the mold decreases from 0.969 to 0.704 (a reduction of 27.4%). The data show that with the increasing degree of SEN offset along the horizontal axis, the longitudinal-axis symmetry of the liquid steel flow in the mold gradually decreases. This irregular change in the liquid steel flow rate and flow direction leads to an uneven distribution of the temperature field in the mold, which makes the advancing speed of the solidification front of the billet inconsistent.
Table 7.
The longitudinal axis symmetry index.
- (2)
- Bias flow index
Table 8 shows the liquid-level fluctuation values at the characteristic points when the SEN is shifted to the right along the width direction by 10 mm, 20 mm, 30 mm, 40 mm, and 50 mm. As can be seen from the table, with the increase in the degree of SEN offset to the right, the liquid-level fluctuation values at characteristic points near the narrow side increase. The right side of the SEN characteristic points (P4, P8) shows the largest increase in the liquid-level fluctuation value of the steel liquid, while at the center position of the mold, the amplitude of liquid-level fluctuation first declines and then gradually rises.
Table 8.
Liquid-level fluctuation values at characteristic points of transverse-axis offset.
The reason for this is the offset of the SEN to the right side of the mold, so that the distance from the right-side flow streams of the SEN to the narrow face decreases, intensifying the liquid surface fluctuations near the narrow face and increasing the renewal rate of the steel liquid. The liquid surface near the narrow side of the fluctuations intensifies, and the liquid steel renewal rate accelerates.
When the SEN is offset to the right along the transverse axis, the velocity distributions of the inner and outer sides of the SEN show a high degree of overlap. In this case, the longitudinal-axis bias flow index is calculated only for the liquid surface fluctuation value of the symmetric characteristic point of the longitudinal axis; the calculation results are listed in Table 9. It can be seen from the data that, with the gradual increase in the degree of SEN offset to the right along the width, the longitudinal bias flow index () of the liquid surface fluctuation of the steel liquid in the mold increases from 0.007 to 0.186 (an increase of about 2557%). It can be seen that, with the increase in the degree of SEN offset along the width, the longitudinal-axis bias flow index of the steel liquid flow field in the mold rises sharply, meaning the asymmetry of the flow field increases significantly. This may lead to an uneven distribution of the protective slag on the liquid surface, with some areas being covered by overly thick or overly thin slag, thereby increasing the risk of slag roll-up in the mold.
Table 9.
The longitudinal axis bias flow index.
- (3)
- F-number
When the SEN is offset to the right along the width direction by 10 mm, 20 mm, 30 mm, 40 mm, and 50 mm, the four major factors influencing the F-number value continue to change, as shown in the Table 10. With increasing offset, the F-number rises from 4.297 under normal conditions to 8.482—an increase of about 97.4%. This indicates that the fluctuation of the steel-slag interface is becoming increasingly violent, and the risk of exposed liquid steel or even rolled slag is growing.
Table 10.
The value of the F-number.
3.2.2. SEN Offset Along the Thickness Direction
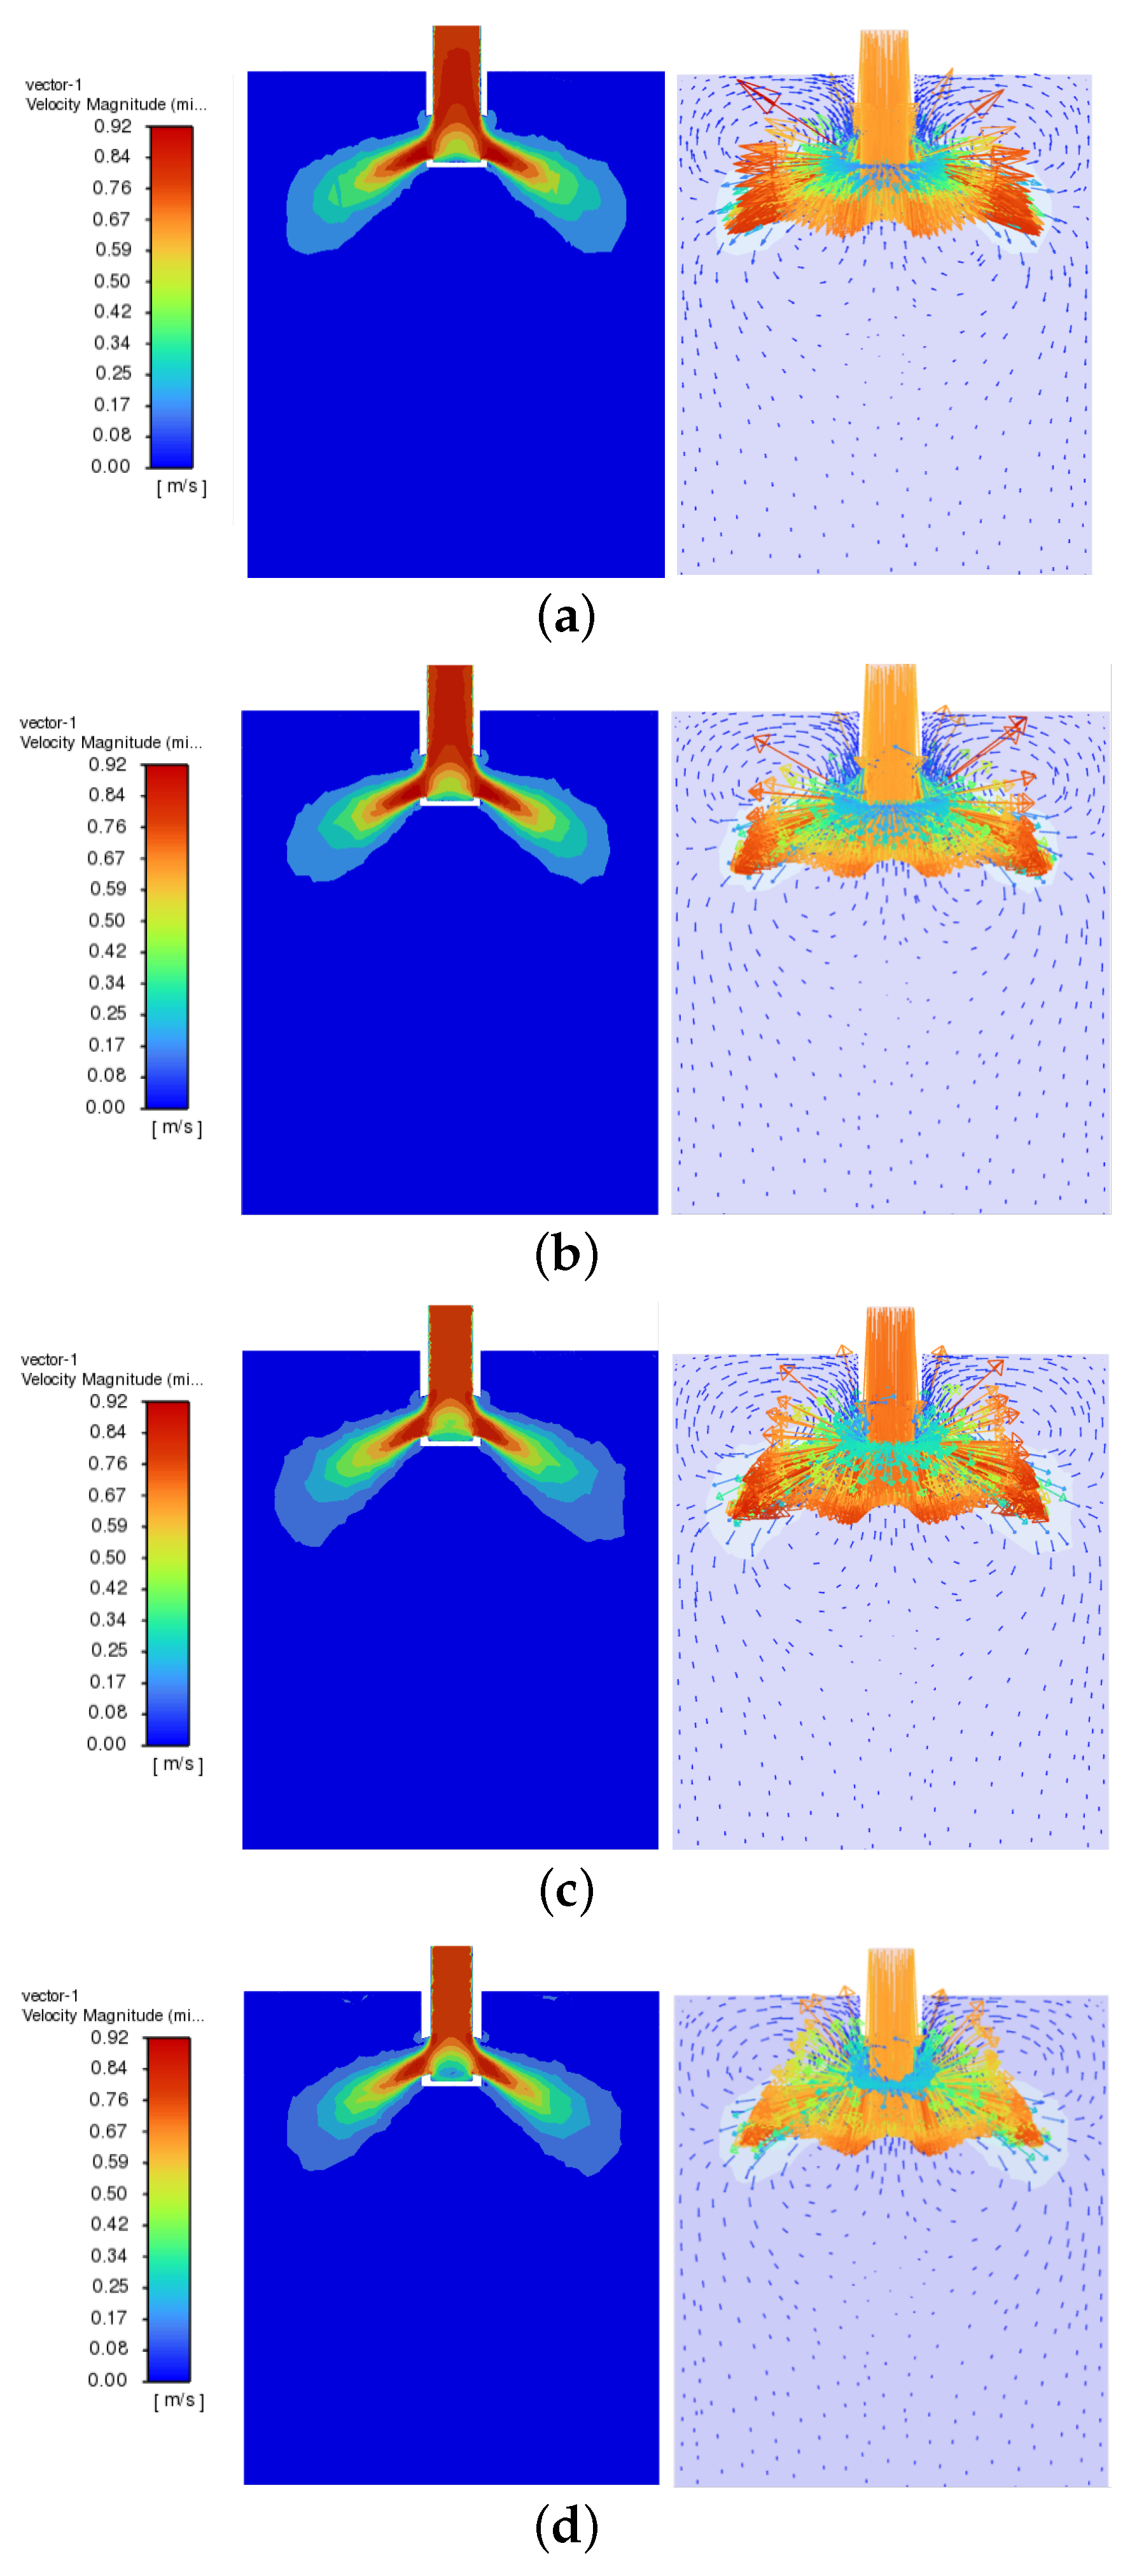
When the SEN is shifted inward along the thickness direction by 5 mm, 10 mm, 15 mm, and 20 mm, the liquid steel velocity cloud and vector diagram in the transverse center section of the mold are shown in Figure 12.
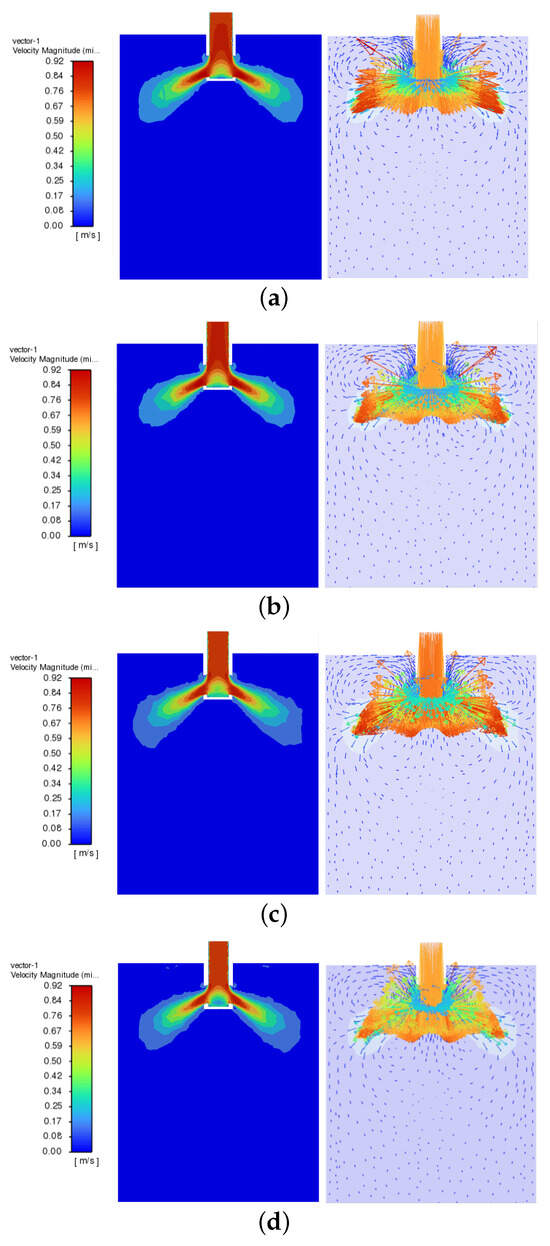
Figure 12.
Velocity cloud and vector diagram of the center section under different degrees of offset. (a) Offset of 5 mm. (b) Offset of 10 mm. (c) Offset of 15 mm. (d) Offset of 20 mm.
As seen in the figure, even though the SEN is shifted along the thickness direction, the flow field distribution within the mold still retains the typical double-loop flow structure. However, the transverse center section of the mold is displaced from the center of the SEN due to the shift. Consequently, the transverse center section no longer represents the central section of the main flow strand directly exiting the SEN, but rather the tangent section of the diffusion zone of the flow strand. As the degree of displacement increases from 5 mm to 20 mm, the transverse center section of the mold gradually shifts toward the side where the main flow strand spreads toward the wide side of the mold. This results in a spreading pattern of the flow strands in the flow field diagram, which becomes increasingly pronounced with the increasing degree of offset. However, in terms of the symmetry of the liquid steel flow field distribution within the mold, when the SEN is shifted along the longitudinal axis, the symmetry between the left and right sides of the SEN remains well-maintained, and no significant asymmetric flow phenomena are observed.
The free liquid surface velocity cloud and vector diagram of the steel liquid in the mold with SEN offset along the thickness direction are shown in Figure 13. As illustrated in the figure, when the SEN is offset inward along the longitudinal axis, noticeable differences appear in the liquid surface flow field on the inside and outside sides of the SEN. Specifically, the area in front of the SEN expands, providing more space for the flow strands returning toward the SEN. As a result, the portion of the flow strand that directly impacts the SEN decreases. In this expanded region, the left and right flow strands (rushing toward the SEN) now have enough space to interact with each other. This interaction leads to a more complex flow pattern, as the strands can spread out and influence one another more significantly than under symmetric conditions.
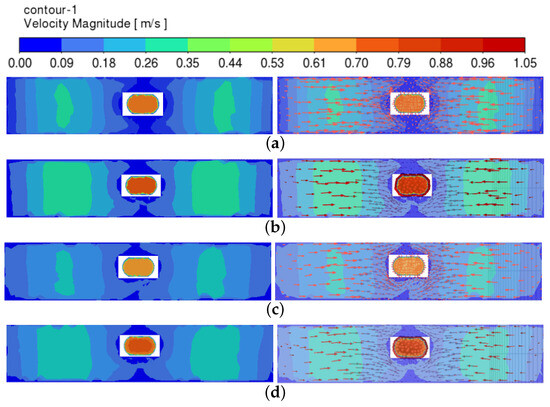
Figure 13.
Velocity cloud and vector diagram of the free liquid surface under different degrees of offset. (a) Offset of 5 mm. (b) Offset of 10 mm. (c) Offset of 15 mm. (d) Offset of 20 mm.
- (1)
- Symmetry index
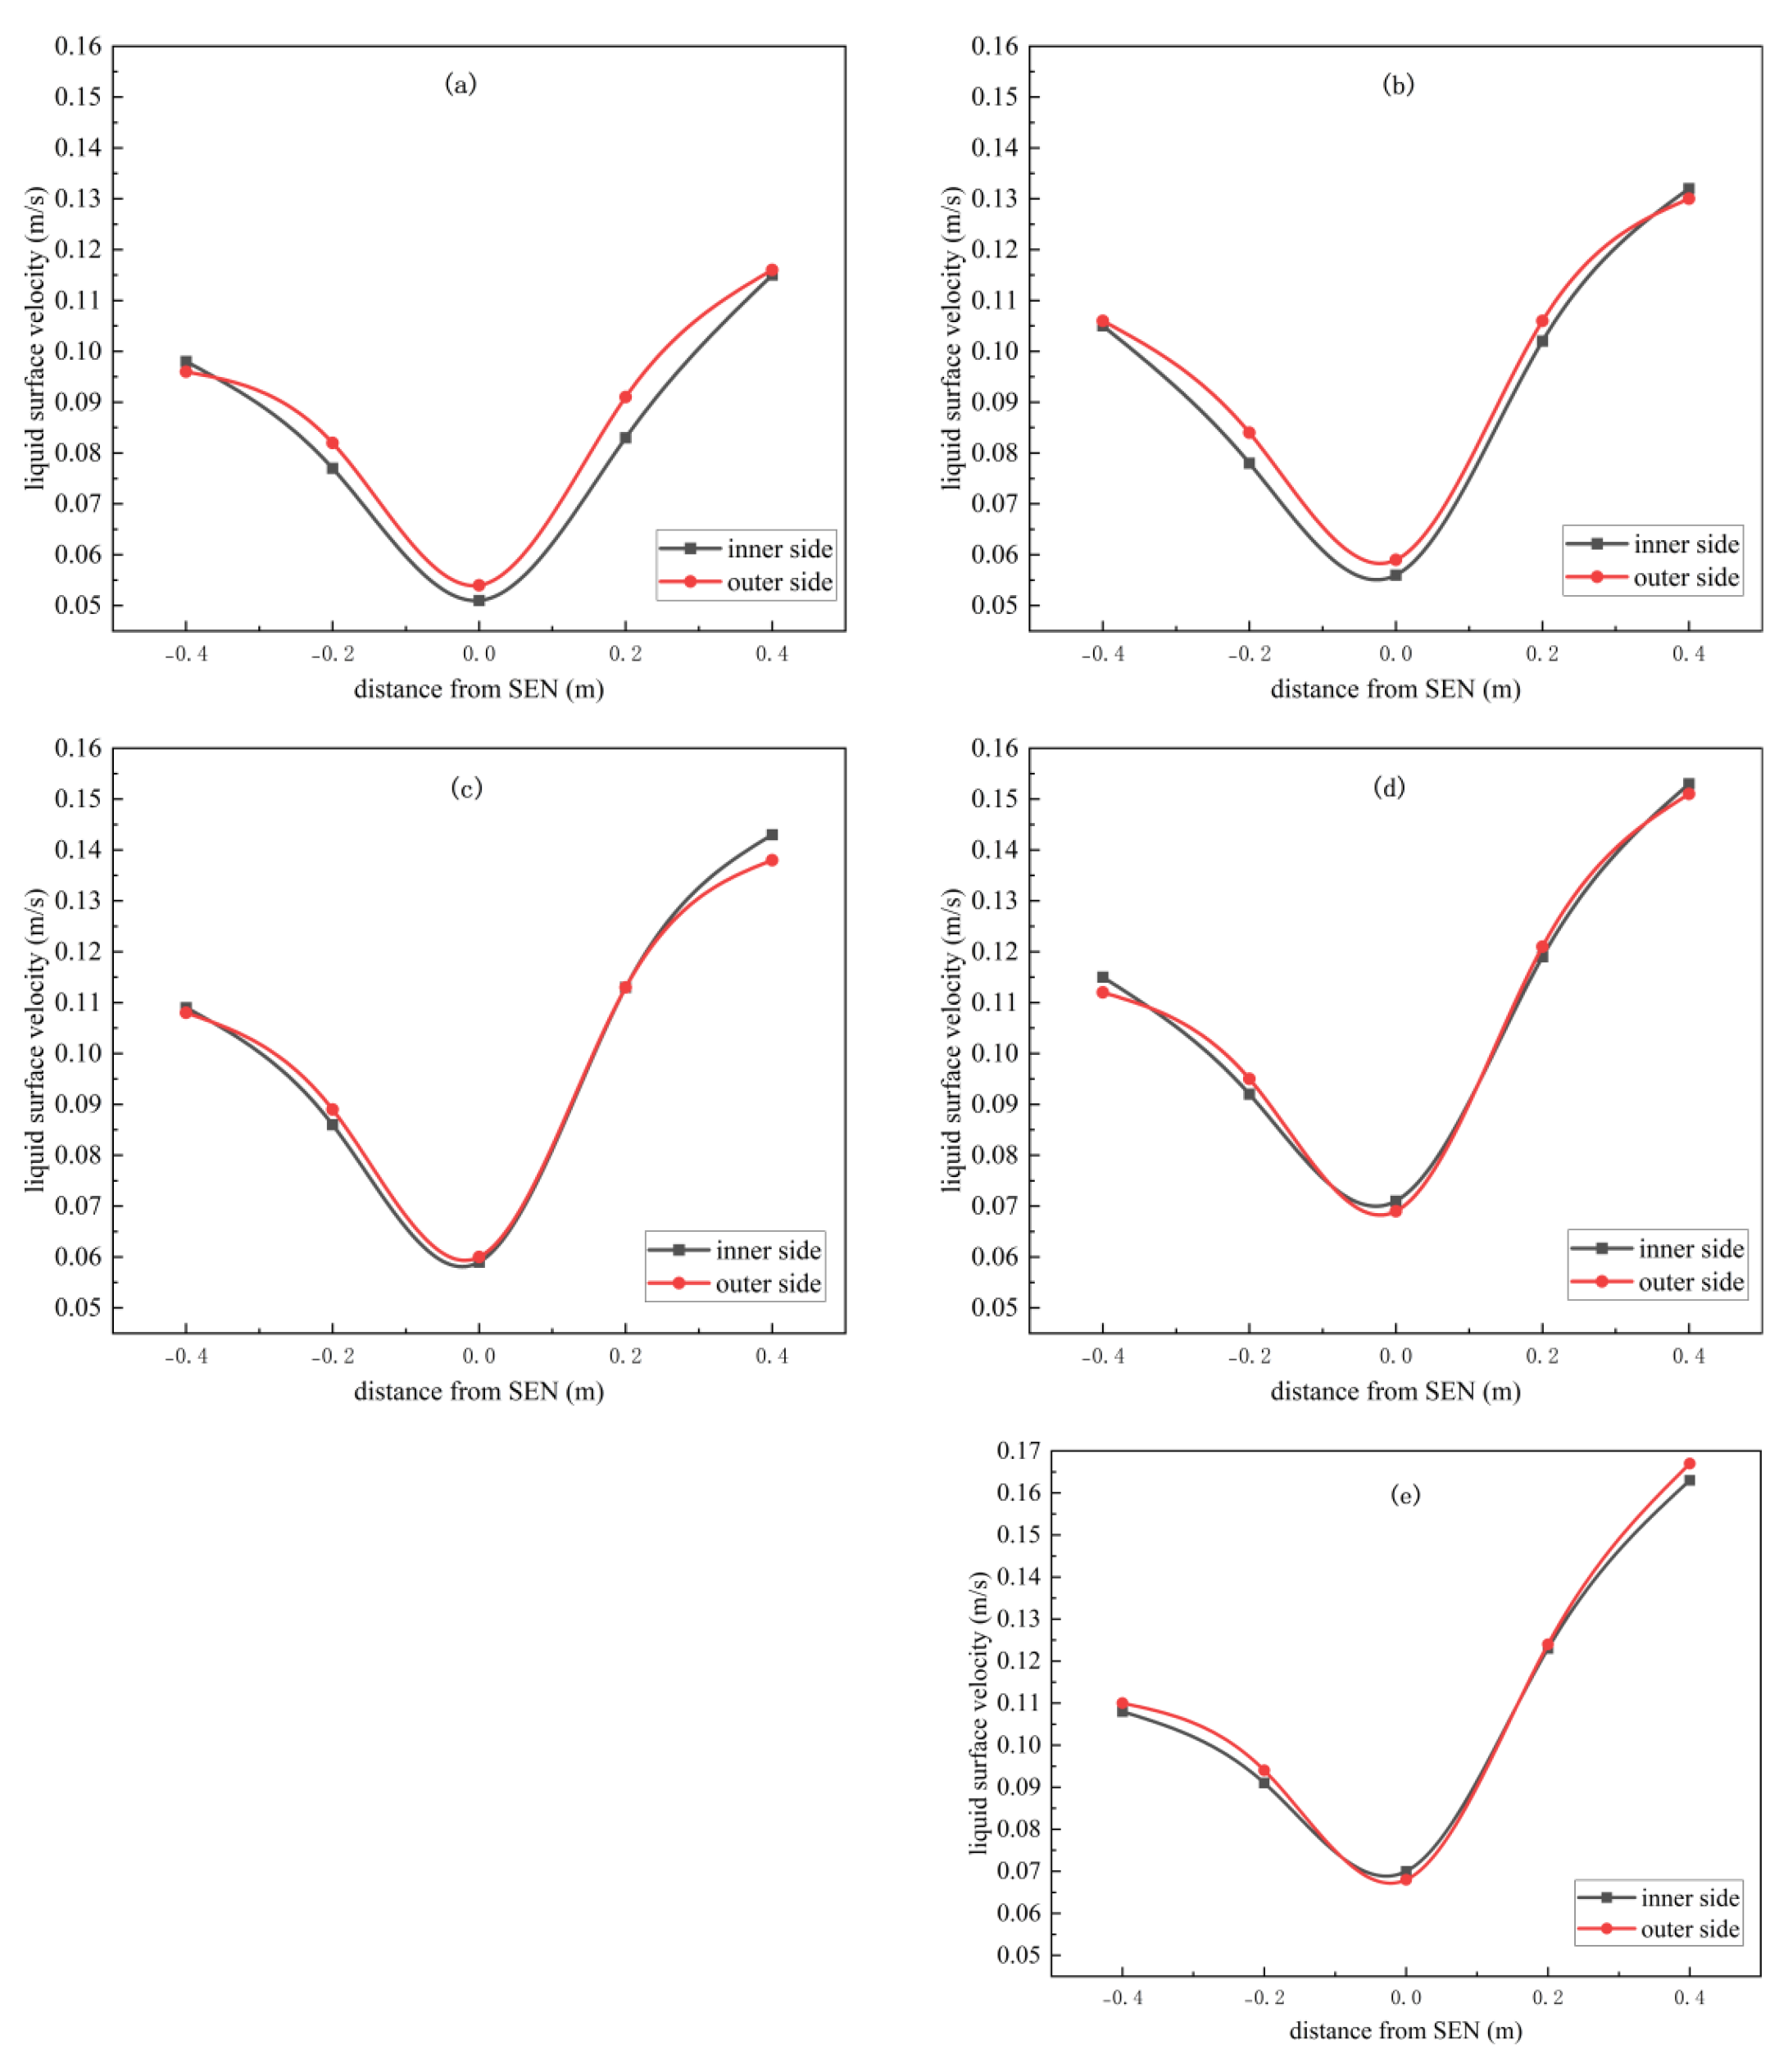
Figure 14 demonstrates the velocity distribution at the transverse-axis-symmetric characteristic point of the free liquid surface, and Figure 15 demonstrates the velocity distribution at the longitudinal-axis-symmetric characteristic point. When the SEN is offset in the direction parallel to the narrow side of the mold, the distribution of the liquid steel flow field in the mold on the left and right sides of the SEN does not change significantly. From the velocity distribution graphs of the symmetric feature points along the longitudinal axis, the overlap between the left and right sides is extremely high. This indicates that the offset of the mold along the longitudinal axis has a small effect on the symmetry of the flow field inside the mold on the left and right sides of the SEN. In contrast, the steel flow field inside the mold changes significantly at the inner and outer sides of the SEN. With the change in the degree of SEN offset, the velocity distribution of the symmetric characteristic points of the transverse axis also produces a significant difference. Therefore, under the condition that the SEN is offset along the longitudinal axis, this paper only calculates and analyzes its transverse-axis symmetry index.
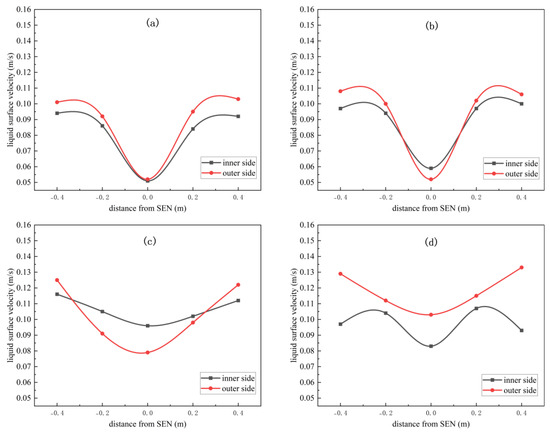
Figure 14.
Velocity distribution of transverse-axis-symmetric feature points under different degrees of offset. (a) Offset of 5 mm. (b) Offset of 10 mm. (c) Offset of 15 mm. (d) Offset of 20 mm.
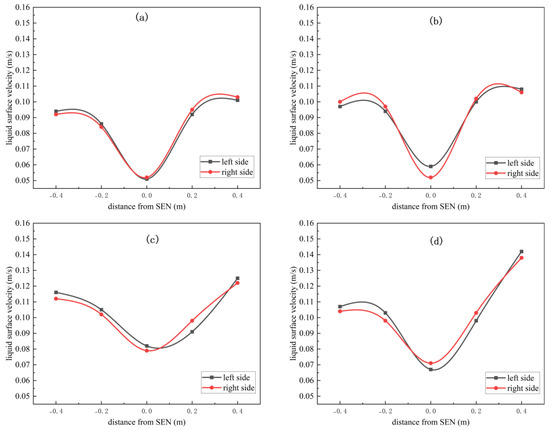
Figure 15.
Velocity distribution of longitudinalaxis-symmetric feature points under different degrees of offset. (a) Offset of 5 mm. (b) Offset of 10 mm. (c) Offset of 15 mm. (d) Offset of 20 mm.
Based on the transverse-axis-symmetric characteristic point velocity, the transverse-axis symmetry index () is calculated according to Equation (13) for the case of the water opening offset along the longitudinal axis, and the results are shown in Table 11. As the degree of nozzle offset inward along the longitudinal axis increases from 0 to 20 mm, the transverse-axis symmetry index () of the liquid steel flow field in the mold decreases from 0.969 to 0.823 at 20 mm offset (a decrease of 15.1%). This indicates that with the deepening of the degree of offset along the thickness of the nozzle, the symmetry of the liquid steel flow in the mold in the transverse direction reduces.
Table 11.
The transverse-axis symmetry index.
- (2)
- Bias flow index
Table 12 shows the fluctuation values of the liquid level at the characteristic points when the SEN is shifted inward along the longitudinal axis by 5 mm, 10 mm, 15 mm, and 20 mm. From the data in the table, it can be seen that as the degree of SEN offset along the longitudinal axis increases, the liquid-level fluctuations at the four characteristic points farther from the SEN—P1, P4, P5, and P8—intensify, while the fluctuations at the four points closer to the SEN—P2, P3, P6, and P7—remain smaller. We will now analyze the reason. Because the SEN is offset toward the back side of the mold, the time for the SEN outflow stream to reach the characteristic points on the back side of the mold is shortened. At the far-side characteristic points P1, P4, P5, and P8, liquid surface fluctuations are aggravated due to the increased liquid steel renewal speed. The SEN position offset also causes the space between the SEN port and the mold-wide surface near the narrow area to become narrower, restricting the liquid steel flow at the near-port characteristic points, resulting in little change in liquid-level fluctuation.
Table 12.
Liquid-level fluctuation values at the characteristic point when the longitudinal axis of the water outlet is shifted.
According to the previous analysis, the liquid-level fluctuation value of the transverse-axis-symmetric characteristic point is also calculated, and the transverse-axis bias flow index () is listed in Table 13. With the gradual increase in the degree of offset along the thickness direction of the water opening from 0 to 20 mm, the transverse-axis bias flow index () of the liquid-level fluctuation of the liquid steel in the mold increases from the initial 0.015 to 0.145 at 20 mm, with a growth rate of about 867%. It can be seen that, with the increasing degree of SEN offset along the longitudinal axis, the transverse-axis bias flow index of the liquid steel flow field in the mold increases significantly, indicating that the asymmetry of the flow field also increases.
Table 13.
The transverse-axis bias flow index.
- (3)
- F-number
Table 14 presents the F-number data corresponding to SEN offsets of 5 mm, 10 mm, 15 mm, and 20 mm inward along the thickness direction. As the offset increases, the value of the F-number increases from 4.297 at normal to 5.548, which is an increase of about 29.1%. Although the change in the factors affecting the F-number due to the SEN offset in the thickness direction is small, and the increase in the F-number is limited, it still exceeds the reasonable range of 3 to 5.
Table 14.
The value of the F-number.
4. Conclusions
This paper combines mathematical and physical models to investigate, in-depth, the characteristics of the liquid flow field and surface fluctuations in the mold under SEN offset conditions (both in the width and thickness directions). The corresponding symmetry index, bias index, and exponential model F-number are obtained. Using these indices, the asymmetry of the liquid steel flow field in the mold under different working conditions is quantitatively analyzed. The main conclusions are summarized as follows:
(1) The rightward offset of the SEN along the width direction exacerbates the longitudinal-axis asymmetry of the liquid steel flow in the mold. As the offset increases from 0 to 50 mm, the longitudinal-axis symmetry index () of the liquid steel flow field decreases from 0.969 to 0.704, representing a reduction of 27.4%.
(2) The rightward offset of the SEN along the width direction significantly disrupts the symmetry of longitudinal liquid-level fluctuations in the mold. As the offset increases from 0 to 50 mm, the longitudinal bias flow index () of liquid-level fluctuation rises from 0.007 to 0.186 (a 25.6-fold increase); the F-number increases from 4.297 to 8.482, representing a rise of approximately 97.4%.
(3) The inward offset of SEN along the thickness direction worsens the transverse asymmetry of the liquid steel flow in the mold. As the offset increases from 0 to 20 mm, the transverse-axis symmetry index () of the liquid steel flow field decreases gradually from 0.969 to 0.823, representing a reduction of about 15.1% at 20 mm offset.
(4) The inward offset of SEN along the thickness direction undermines the transverse-axis symmetry of the liquid-level fluctuation in the mold. As the offset increases from 0 to 20 mm, the transverse-axis bias flow index () rises sharply from 0.015 to 0.145 (an 8.67-fold increase), and the F-number increases from 4.297 to 5.548, representing an increase of about 29.1%.
Author Contributions
Conceptualization, P.X., R.W., L.Z. and C.C.; methodology, P.X., R.W. and L.Z.; software, P.X. and R.W.; validation, P.X., R.W. and C.C.; formal analysis, P.X., R.W. and L.Z.; investigation, P.X., R.W., L.Z. and C.C.; resources, L.Z. and C.C.; data curation, P.X., R.W. and L.Z.; writing—original draft preparation, P.X. and R.W.; writing—review and editing, L.Z. and C.C.; visualization, P.X., R.W. and C.C.; supervision, L.Z. and C.C.; project administration, P.X. and L.Z. All authors have read and agreed to the published version of the manuscript.
Funding
This research was supported by the National Natural Science Foundation of China project (no. 52474358) and the Hebei Province Innovation Capacity Enhancement Fund (no. 24461002D).
Data Availability Statement
The data presented in this study are available upon request from the corresponding author. The data are not publicly available due to privacy restrictions.
Acknowledgments
The authors acknowledge HBIS Company Limited and the Yanzhao Iron and Steel Laboratory. Their generous sponsorship and technical assistance provided crucial resources for the experiments and significantly contributed to the progress and outcomes of the research.
Conflicts of Interest
The authors declare no conflicts of interest.
References
- Guthrie, R.I.L.; Isac, M.M. Continuous Casting Practices for Steel: Past, Present and Future. Metals 2022, 12, 862. [Google Scholar] [CrossRef]
- Louhenkilpi, S. Continuous casting of steel. In Treatise on Process Metallurgy; Elsevier: Amsterdam, The Netherlands, 2024; pp. 343–383. [Google Scholar] [CrossRef]
- Du, F.; Li, T.; Zeng, Y.; Zhang, K. Influence of Nozzle Design on Flow Characteristic in the Continuous Casting Machinery. Coatings 2022, 12, 631. [Google Scholar] [CrossRef]
- Chiwo, F.S.; Susunaga-Notario, A.d.C.; Betancourt-Cantera, J.A.; Pérez-Bustamante, R.; Mercado-Lemus, V.H.; Méndez-Lozoya, J.; Barrera-Cardiel, G.; García-Herrera, J.E.; Arcos-Gutiérrez, H.; Garduño, I.E. Design and Optimization of the Internal Geometry of a Nozzle for a Thin-Slab Continuous Casting Mold. Designs 2024, 8, 2. [Google Scholar] [CrossRef]
- Gan, M.; Pan, W.; Wang, Q.; Zhang, X.; He, S. Effect of exit shape of submerged entry nozzle on flow field and slag entrainment in continuous casting mold. Metall. Mater. Trans. B 2020, 51, 2862–2870. [Google Scholar] [CrossRef]
- Wang, Q.; Tan, C.; Huang, A.; Yan, W.; Gu, H.Z.; He, Z.; Li, G.Q. Numerical Simulation on Refractory Wear and Inclusion Formation in Continuous Casting Tundish. Metall. Mater. Trans. B 2021, 52, 1344–1356. [Google Scholar] [CrossRef]
- Zhao, L.P.; Dou, R.S.; Yin, J.J.; Yao, Y.Y. Intelligent prediction method of quality for continuous casting process. In Proceedings of the IEEE Advanced Information Management, Communications, Electronic and Automation Control Conference (IMCEC), Xi’an, China, 3–5 October 2016; IEEE: Piscataway, NJ, USA, 2016; pp. 1761–1764. [Google Scholar]
- Zhou, D.; Xu, K.; Lv, Z.; Yang, J.; Li, M.; He, F.; Xu, G. Intelligent Manufacturing Technology in the Steel Industry of China: A Review. Sensors 2022, 22, 8194. [Google Scholar] [CrossRef]
- Xu, P.; Zhou, Y.; Chen, D.; Long, M.; Duan, H. Optimization of submerged entry nozzle parameters for ultra-high casting speed continuous casting mold of billet. J. Iron Steel Res. Int. 2022, 29, 44–52. [Google Scholar] [CrossRef]
- Cao, J.; Li, Y.; Lin, W.; Che, J.; Zhou, F.; Tan, Y.; Li, D.; Dang, J.; Chen, C. Assessment of Inclusion Removal Ability in Refining Slags Containing Ce2O3. Crystals 2023, 13, 202. [Google Scholar] [CrossRef]
- Zhang, K.T.; Liu, J.H.; Cui, H. Effect of flow field on surface slag entrainment and inclusion adsorption in a continuous casting mold. Steel Res. Int. 2020, 91, 1900437. [Google Scholar] [CrossRef]
- Jiang, D.B.; Peng, X.X.; Ren, Y.; Yang, W.; Zhang, L.F. Water modeling on slag entrainment in the slab continuous casting mold. Metall. Res. Technol. 2022, 119, 601. [Google Scholar] [CrossRef]
- Li, Y.; He, W.; Zhao, C.; Liu, J.; Yang, Z.; Zhao, Y.; Yang, J. Mathematical Modeling of Transient Submerged Entry Nozzle Clogging and Its Effect on Flow Field, Bubble Distribution and Interface Fluctuation in Slab Continuous Casting Mold. Metals 2024, 14, 742. [Google Scholar] [CrossRef]
- González-Solórzano, M.G.; Dávila, R.M.; Guarneros, J.; Calderón-Ramos, I.; Muñiz-Valdés, C.R.; Nájera-Bastida, A. Unsteady Fluid Flows in the Slab Mold Using Anticlogging Nozzles. Fluids 2022, 7, 288. [Google Scholar] [CrossRef]
- González-Solórzano, M.G.; Morales, R.D.; Gutiérrez, E.; Guarneros, J.; Chattopadhyay, K. Analysis of fluid flow of liquid steel through clogged nozzles: Thermodynamic analysis and flow simulations. Steel Res. Int. 2020, 91, 2000049. [Google Scholar] [CrossRef]
- Gonzalez-Trejo, J.; Miranda-Tello, R.; Gabbasov, R.; Real-Ramirez, C.A.; Cervantes-de-la-Torre, F. Experimental Analysis of the Influence of the Sliding-Gate Valve on Submerged Entry Nozzle Outlet Jets. Fluids 2024, 9, 30. [Google Scholar] [CrossRef]
- Cedillo, V.; Morales, D.R. Biased flows in slab molds induced by slide gates. Part I: Experimental measurements and flow simulation. Ironmak. Steelmak. 2018, 45, 204–214. [Google Scholar] [CrossRef]
- Li, G.; Lu, C.; Gan, M.J.; Wang, Q.Q.; He, S.P. Influence of Submerged Entry Nozzle Clogging on the Flow Field and Slag Entrainment in the Continuous Casting Mold by the Physical Model. Metall. Mater. Trans. B 2022, 53, 1436–1445. [Google Scholar] [CrossRef]
- Wang, Z.D.; Liu, J.R.; Heng, C.; Sun, H.; Wang, Y.Z. Effect of SEN Asymmetric Clogging on Mold Level Fluctuation and Mold Slag Distribution During Continuous Casting. Metall. Mater. Trans. 2024, 55, 2932–2947. [Google Scholar] [CrossRef]
- Wang, T.J.; Li, K.; Li, S.H.; Wang, L.J.; Yang, J.; Feng, L.H. Asymmetric flow behavior of molten steel in thin slab continuous casting mold. Metall. Mater. Trans. 2023, 54, 3542–3553. [Google Scholar] [CrossRef]
- Lee, W.J.; Kim, J.G.; Jung, J.I.; Huh, K.Y. Prediction of nozzle clogging through fluid–structure interaction in the continuous steel casting process. Steel Res. Int. 2021, 92, 2000549. [Google Scholar] [CrossRef]
- Hua, C.; Wang, M.; Bao, Y. Effect of nozzle clogging on the fluid flow pattern in a billet mold with particle image velocimetry technology. Metall. Mater. Trans. B 2020, 51, 2871–2881. [Google Scholar] [CrossRef]
- Zhang, H.; Fang, Q.; Xiao, T.P.; Ni, H.W.; Liu, C.S. Optimization of the flow in a slab mold with argon blowing by divergent bifurcated SEN. ISIJ Int. 2019, 59, 86–92. [Google Scholar] [CrossRef]
- Javurek, M.; Wincor, R. Bubbly mold flow in continuous casting: Comparison of numerical flow simulations with water model measurements. Steel Res. Int. 2022, 91, 2000415. [Google Scholar] [CrossRef]
- Qiu, D.; Zhang, Z.; Li, X.; Lv, M.; Mi, X.; Xi, X. Numerical Simulation of the Flow Field in an Ultrahigh-Speed Continuous Casting Billet Mold. Metals 2023, 13, 964. [Google Scholar] [CrossRef]
- Jiang, P.; Yang, J.; Zhang, T.; Xu, G.; Liu, H.; Zhou, J.; Qin, W. Optimization of Flow Field in Slab Continuous Casting Mold with Medium Width Using High Temperature Measurement and Numerical Simulation for Automobile Exposed Panel Production. Metals 2020, 10, 9. [Google Scholar] [CrossRef]
- Du, F.; Zhao, J.; Zheng, Y.; Li, T.; Zheng, G. Research on the Influence of Process Parameters on the Flow Field in Mold. Coatings 2022, 12, 1547. [Google Scholar] [CrossRef]
- Yin, Y.; Zhang, J. Mathematical modeling on transient multiphase flow and slag entrainment in continuously casting mold with double-ruler EMBr through LES+VOF+DPM method. ISIJ Int. 2021, 61, 853–864. [Google Scholar] [CrossRef]
- Lee, J.H.; Han, S.; Cho, H.J.; Park, I.S. Numerical and experimental study of the meniscus vortex core in a water model of continuous casting mold. Metall. Mater. Trans. B 2021, 52, 178–189. [Google Scholar] [CrossRef]
- Chen, W.; Ren, Y.; Zhang, L.F.; Scheller, P.R. Numerical simulation of steel and argon gas two-phase flow in continuous casting using LES+ VOF+ DPM model. JOM 2019, 71, 1158–1168. [Google Scholar] [CrossRef]
- Yang, H.; Vanka, S.P.; Thomas, B.G. Mathematical modeling of multiphase flow in steel continuous casting. ISIJ Int. 2019, 59, 956–972. [Google Scholar] [CrossRef]
- Li, G.; Tu, L.; Wang, Q.; Zhang, X.; He, S. Fluid Flow in Continuous Casting Mold for Ultra-Wide Slab. Materials 2023, 16, 1135. [Google Scholar] [CrossRef]
- Wang, Z.D.; Shan, Q.L.; Gao, Y.; Pan, H.W.; Lu, B.X.; Wen, J.W.; Cui, H. Physical simulation of mold level fluctuation characteristics. Metall. Mater. Trans. B 2023, 54, 2591–2604. [Google Scholar] [CrossRef]


Disclaimer/Publisher’s Note: The statements, opinions and data contained in all publications are solely those of the individual author(s) and contributor(s) and not of MDPI and/or the editor(s). MDPI and/or the editor(s) disclaim responsibility for any injury to people or property resulting from any ideas, methods, instructions or products referred to in the content. |
© 2025 by the authors. Licensee MDPI, Basel, Switzerland. This article is an open access article distributed under the terms and conditions of the Creative Commons Attribution (CC BY) license (https://creativecommons.org/licenses/by/4.0/).