Article

Corrosion Resistance and Surface Conductivity of 446 Stainless Steel with Electrochemical Cr-Enrichment and Nitridation for Proton Exchange Membrane Fuel Cell (PEMFC) Bipolar Plates

Institute of Materials, School of Materials Science and Engineering, Shanghai University, 149 Yanchang Road, Shanghai 200072, China
*
Author to whom correspondence should be addressed.
Metals 2025, 15(5), 566; https://doi.org/10.3390/met15050566
Submission received: 14 April 2025 / Revised: 15 May 2025 / Accepted: 19 May 2025 / Published: 21 May 2025

Abstract

:
The development of bipolar plate materials with enhanced corrosion resistance and surface conductivity is critical for the commercial application of proton exchange membrane fuel cells (PEMFCs). The corrosion behavior and surface conductivity of electrochemically nitrided 446 stainless steel with and without the pretreatment of Cr-enrichment were investigated in the simulated PEMFC anode and cathode environments (i.e., 0.5 mol L−1 H2SO4 + 2 ppm HF solution bubbled with hydrogen or air at 80 °C) using scanning electron microscopy (SEM), X-ray photoelectron spectroscopy (XPS), inductively coupled plasma–mass spectrometry (ICP-MS), and electrochemical measurement techniques. Extending the nitriding time from 5 to 30 min enhances the surface conductivity but reduces the corrosion resistance. After the pretreatment and 30 min of nitridation, a thin film formed on the specimen surface, which mainly consists of Cr-nitrides and -oxides with atomic fractions of 0.42 and 0.37, respectively. The Cr-enriched and nitrided specimen shows spontaneous passivation in both the simulated cathode and anode environments and higher corrosion potentials, lower passive current densities, and larger polarization resistances in comparison with the directly nitrided specimens. Its stable current densities are about 0.26 and −0.39 μA cm−2 after 5 h of polarization tests at 0.6 VSCE in the cathode environment and at −0.1 VSCE in the anode environment, respectively. Its contact resistance is about 5.0 mΩ cm2 under 1.4 MPa, which is close to that of the specimen directly nitrided for 120 min and slightly decreases after the potentiostatic polarization tests. These results indicate that Cr-rich pretreatment improves not only the corrosion resistance and surface conductivity of nitrided specimens but also the efficiency of electrochemical nitridation.

1. Introduction

Proton exchange membrane fuel cells (PEMFCs) have attracted considerable interest due to their high energy conversion efficiency and zero emissions [1,2,3]. Bipolar plates are a critical component of PEMFC stacks [4]. Stainless steel has been widely investigated as a bipolar plate material due to its low cost and superior mechanical properties [5,6,7]. However, the surface corrosion and passivation of stainless steel bipolar plates during operation can elevate the interfacial contact resistance (ICR), resulting in an increase in energy losses [8,9]. Additionally, the cations released during corrosion can degrade membrane durability and the power output of fuel cells [10,11]. At present, bare bipolar plates of stainless steel fail to meet the requirements of both corrosion resistance and ICR performance [12]. To tackle this challenge, Cr-nitride coatings have been widely employed to enhance the corrosion resistance and surface conductivity of stainless steel [13,14,15,16,17]. However, these coating techniques are often costly and technologically demanding, and their reliability can be compromised by defects such as pinholes and microcracks [18,19,20]. Recently, electrochemical nitridation has emerged as a promising alternative, enabling the direct formation of a uniform Cr-nitride layer on stainless steel and thereby improving both the corrosion resistance and surface conductivity [21].
Many researchers have prepared Cr-nitride layers on stainless steels via electrochemical nitridation [22,23,24,25,26]. Typically, stainless steel surfaces are covered by an oxide film (or passive film) consisting of a Cr-rich inner layer and an Fe-rich outer layer [27,28,29]. The nitridation mechanism involves the electrochemical reduction of nitrate ions (NO3) adsorbed on the metal surface and the diffusion of reduced N atoms into the oxide film and metal surface to form Cr-nitrides [30,31,32,33,34,35]. Wang [23] reported that electrochemical nitridation can also lead to the formation of small amounts of Fe-N compounds. One major limitation of electrochemical nitridation is its long processing time. The nitridation efficiency is largely related to the chemical compositions and processing parameters. Wang [33] achieved the optimal corrosion resistance and surface conductivity with 4 h of nitriding treatment, whereas our previous work improved these properties by 2 h of treatment [36]. Regulating the chemical composition of the passive film, particularly by Cr-enrichment, is found to reduce the nitriding time and enhance the effectiveness of the electrochemical nitridation process.
Chemical or electrochemical surface modification treatments are commonly employed to enhance the corrosion resistance of stainless steel by forming Cr-rich oxide films. Noh [37] significantly enhanced the Cr-enrichment on the surface of 316 stainless steel through passivation treatment in 25 wt.% HNO3 solution. Wang [38] found that HNO3 passivation markedly improves the pitting resistance of 316 L stainless steel. O’Laoire [39] investigated various passivation solutions and demonstrated that HNO3 treatment is the most effective at increasing the Cr content in the passive film. Li [40] suggested that HNO3 passivation of high-nitrogen austenitic stainless steel promotes the Cr-oxide enrichment, thereby improving the pitting resistance. Wang, Lynch, and Maurice [41,42,43,44] demonstrated that H2SO4 electrochemical passivation selectively dissolves iron oxides, thereby leading to Cr- and Mo-enrichments. Compared to traditional methods, electropolishing enables rapid and efficient Cr-enrichment. For example, Lee [45] employed a mixed solution of H3PO4 and H2SO4 for electropolishing and achieved a passive film with a Cr2O3/Fe2O3 ratio of about 2.58. Numerous studies have reported similar Cr-enrichment on stainless steels and alloys through electropolishing in mixed acid electrolytes [46,47,48,49,50,51]. However, these methods typically rely on high concentrations of H3PO4 and H2SO4, leading to resource waste and the issue of waste liquid treatment [52]. Suzuki [53] highlighted the advantages of HNO3 electrolytic treatment over conventional electropolishing for Cr-enrichment. The XPS depth profile revealed that the Cr content increases to approximately 38% in the outermost passive layer on SUS436L stainless steel after HNO3 treatment, resulting in a pitting potential that is much higher than that of SUS316L stainless steel. These results demonstrate that HNO3 electrolytic treatment enables rapid Cr-enrichment and greatly enhances the corrosion resistance, which represents an efficient and cost-effective surface modification method for stainless steels.
According to previous studies [54,55], 446 stainless steel displays active corrosion states in the simulated PEMFC anode environments with pH values of 0 and 3. After polarization at 0.6 VSCE for 5 h in the simulated PEMFC cathode environment with pH = 3, the ICR values are about 19.4 and 6.6 mΩ cm2 for 446 stainless steel without and with electrochemical nitridation treatment. It is clear that electrochemical nitridation greatly improves the surface conductivity of 446 stainless steel, but further efforts are still needed to enhance the corrosion resistance. This work investigates the influence of Cr-enrichment on the electrochemical nitridation of 446 stainless steel and subsequent corrosion resistance and surface conductivity in simulated PEMFC environments. It is demonstrated that Cr-enriched pretreatment prior to nitridation significantly enhances the spontaneous passivation ability, corrosion resistance, and surface conductivity and shortens the necessary nitriding time, which will be an effective and efficient strategy for optimizing stainless steel bipolar plates. The results provide technical guidance for the application of electrochemical nitridation to stainless steel bipolar plates.

2. Experimental Section

2.1. Material and Surface Modification

The experimental material is a 0.7 mm thick 446 stainless steel plate, whose chemical composition is given in Table 1. The steel was wire-cut into square specimens with a side size of 10 or 15 mm. For the electrochemical testing, the specimen was welded with a copper wire, encapsulated in epoxy resin with an exposure of 1 cm2, ground to 600# with SiC sandpaper, and cleaned with anhydrous alcohol and distilled water. The specifications and suppliers of some of the experimental equipment and materials are shown in Table 2. The electrochemical Cr-rich pretreatment was performed in 25 wt.% HNO3 solution at 50 °C under an anodic current density of 0.1 A cm−2 for 1 min using a DC power supply. The electrochemical nitridation treatment was carried out in 0.1 mol L−1 HNO3 + 0.5 mol L−1 KNO3 solution at 25 °C under a cathodic potential of −0.7 VSCE for 5 to 30 min.

2.2. Interfacial Contact Resistance Measurement

The contact resistance was measured according to the literature [56,57]. The specimen was placed between carbon paper (Toray, TGP-H-060, Tokyo, Japan) and positioned between two cylindrical gold-plated copper columns with an end surface of 1 cm2. The pressure was applied incrementally by adding weights in the range of 40 to 160 N cm−2. A digital micro-ohmmeter (ZY9987, Shanghai, China) recorded the resistance (R1). The contact resistance between the gold-plated copper columns and carbon paper (R2) was determined separately by applying the same pressure to the carbon paper alone. RICR between the specimen and carbon paper was calculated as follows [54]:
R I C R = ( R 1 R 2 ) × A 2
where A is the surface area of the copper column. The bulk resistances of the specimen and carbon paper were ignored.

2.3. Electrochemical Corrosion Measurements

The PEMFC cathode and anode environments were simulated with the 0.5 mol L−1 H2SO4 + 2 ppm HF (pH = 0) solution bubbled with air and H2, respectively, at 80 °C. After the surface treatments, the specimens were rinsed with distilled water and dried with cold air. The electrochemical tests were performed on a Princeton multi-channel electrochemical workstation (PARSTAT MC 1000) in a three-electrode cell with a gas inlet and a water-sealed outlet. The cell was immersed in a water bath. The specimen, a platinum sheet, and a saturated mercurous sulfate electrode (MSE) served as the working electrode, counter electrode, and reference electrode, respectively. All potentials are relative to the saturated calomel electrode (SCE) here after being converted by ESCE = EMSE + 0.374 V [58]. The specimen was immersed in the simulated environment for 1 h to reach a relatively steady corrosion state. Subsequently, the electrochemical impedance spectroscopy (EIS) was measured under the free corrosion condition with a 10 mV (rms) AC amplitude and a frequency range of 99 kHz to 10 mHz. The data were analyzed by using ZsimpWin software 3.60. The potentiodynamic polarization was conducted with a potential scan rate of 20 mV min−1, starting from the open circuit potential and terminating at a current density of 1 mA cm−2. To ensure experimental reproducibility, all measurements were conducted in triplicate. According to the literature [59], the potentiostatic polarization tests were carried out for 5 h under the typical PEMFC working conditions bubbled with air at 0.6 VSCE or with H2 at −0.1 VSCE.

2.4. Surface and Solution Analyses

The surface images were obtained using a JEOL JSM-IT800 scanning electron microscope (SEM) (Tokyo, Japan). The accelerating voltage was set at 15 kV, with a working distance of approximately 8.85 mm. The analysis was conducted in high vacuum mode (HV) using a secondary electron detector. The spot size (probe current number) was set to 500, and the emission current was 56 μA. The scan time per image was approximately 20.6 s, and the scan speed was level 9. The electron source was a thermal field emission gun (TFE).
X-ray photoelectron spectroscopy (XPS, ThermoFisher ESCALAB 250Xi, Waltham, MA, USA) was employed to investigate the surface film composition, using a monochromatic Al Kα source (12.5 kV, 16 mA) for excitation. The analyses were conducted for the mechanically polished, Cr-enriched, and electrochemically nitrided specimens, as well as those after 5 h of potentiostatic polarization at −0.1 VSCE in the anode environment and at 0.6 VSCE in the cathode environment. The tests were performed under a vacuum of approximately 2 × 10⁻⁸ mbar at 21.22 eV pass energy for the high-resolution scan. All peaks were calibrated with the C 1s peak (284.8 eV). The XPS spectra were fitted via Avantage software (Version 5.5.2) applying Shirley background subtraction and deconvolution to obtain the high-resolution spectra of Fe 2p3/2, Cr 2p3/2, O 1s, N 1s, and Mo 3d.
After the potentiostatic polarization tests in the simulated anode and cathode environments, the metallic ion contents in the solution were measured using inductively coupled plasma–mass spectrometry (ICP-MS, Agilent 7700, Santa Clara, CA, USA). The instrument was operated under the following conditions: the tRF power was set to 1.55 kW, and the RF matching voltage was 1.80 V. The auxiliary gas, carrier gas, and makeup gas flow rates were 1.50 L min−1, 0.71 L min−1, and 0.48 L min−1, respectively. The sample uptake time was 45 s, followed by a stabilization time of 30 s. The integration time per mass was 0.90 s.

3. Results

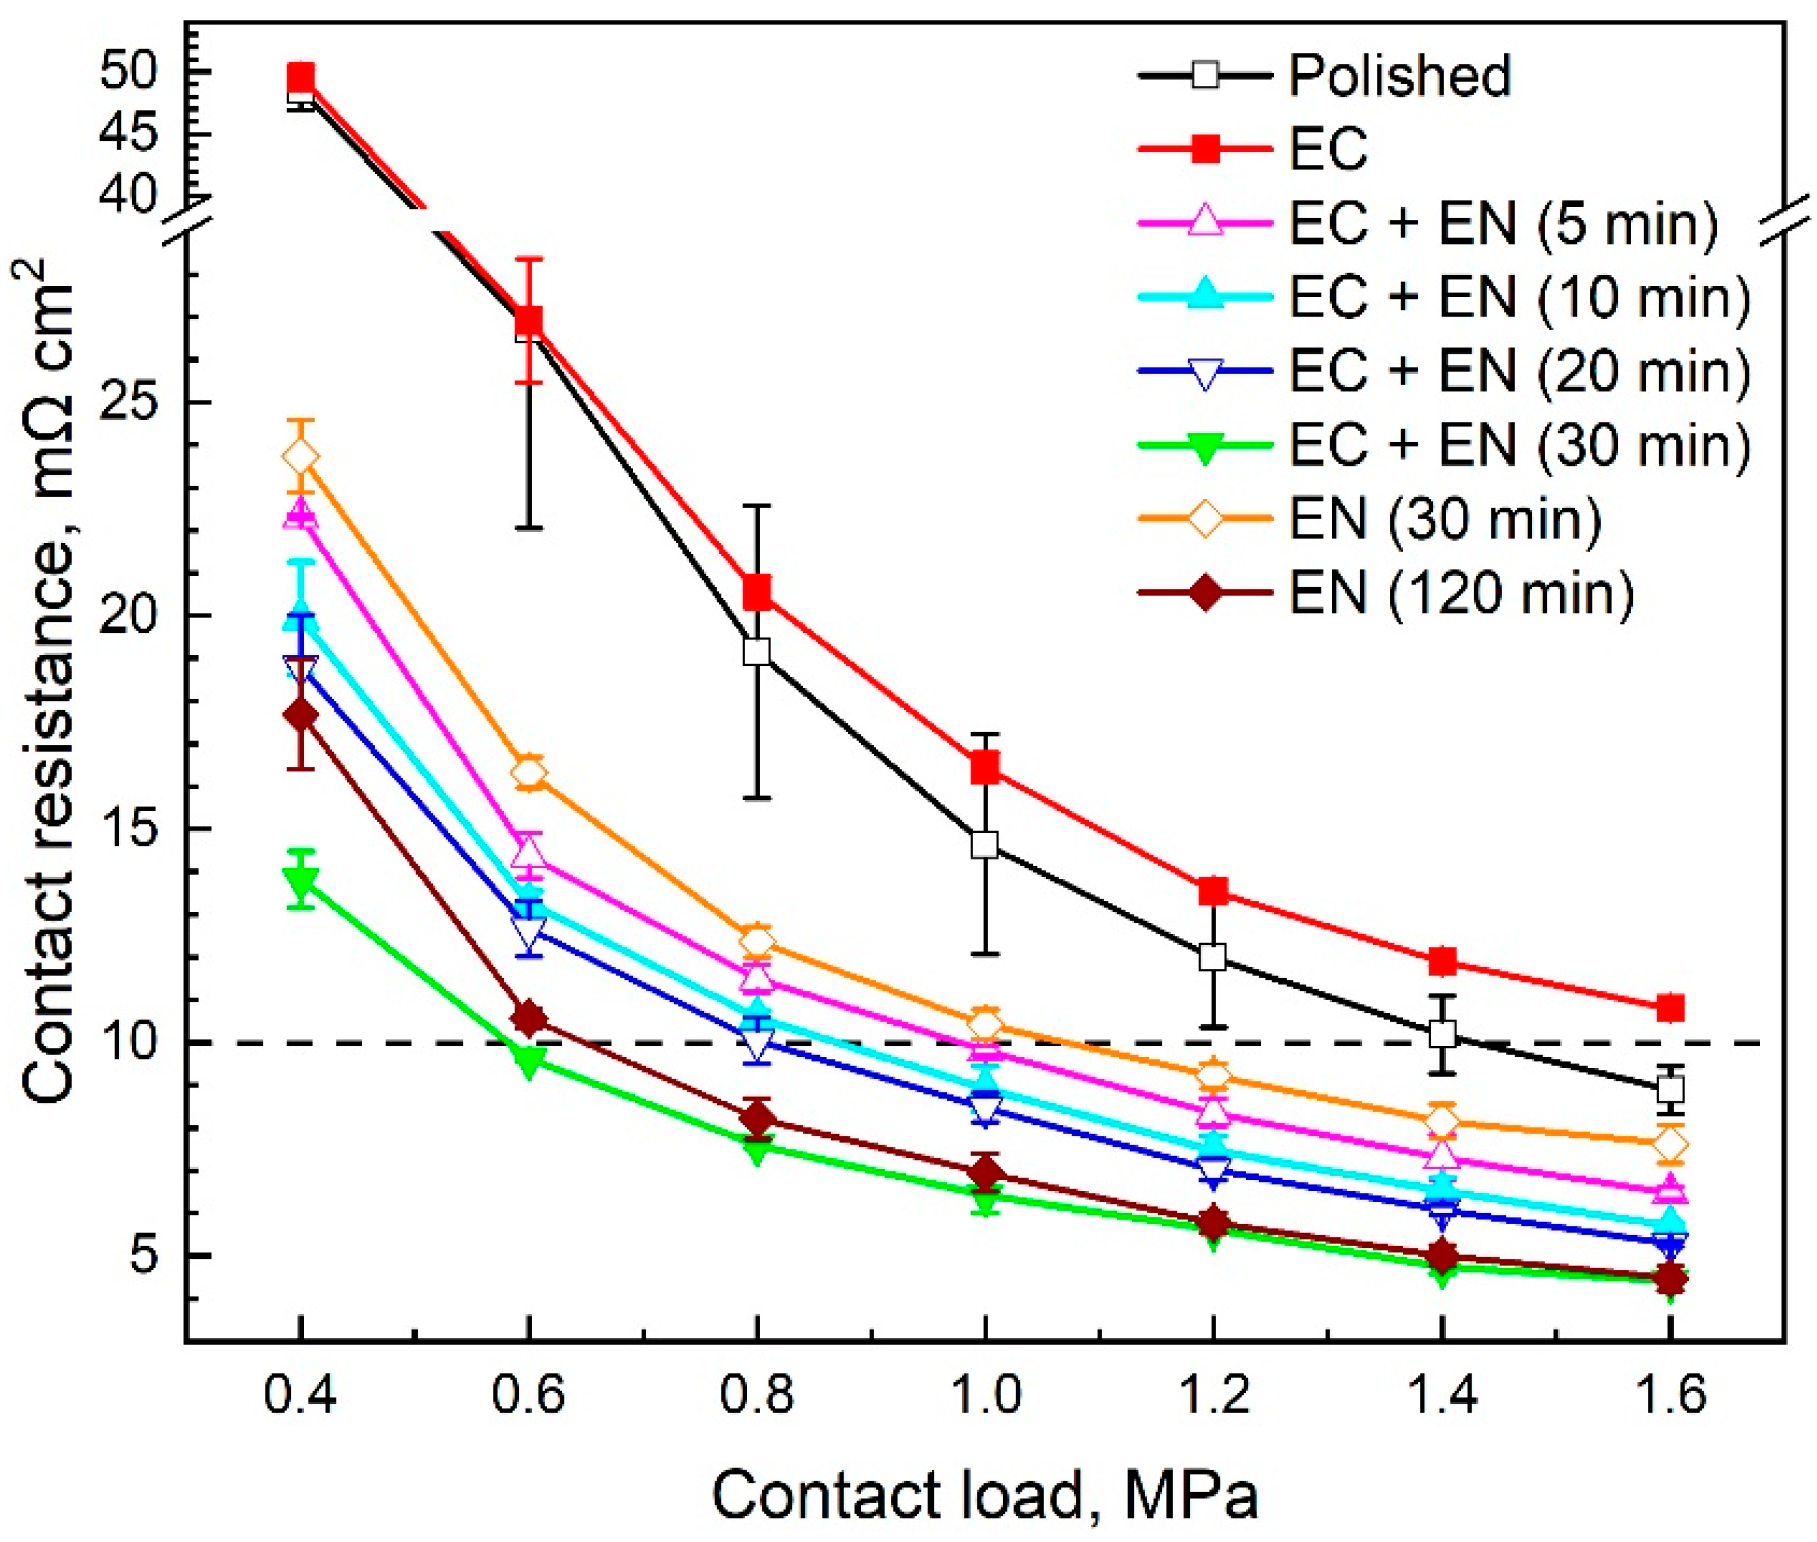
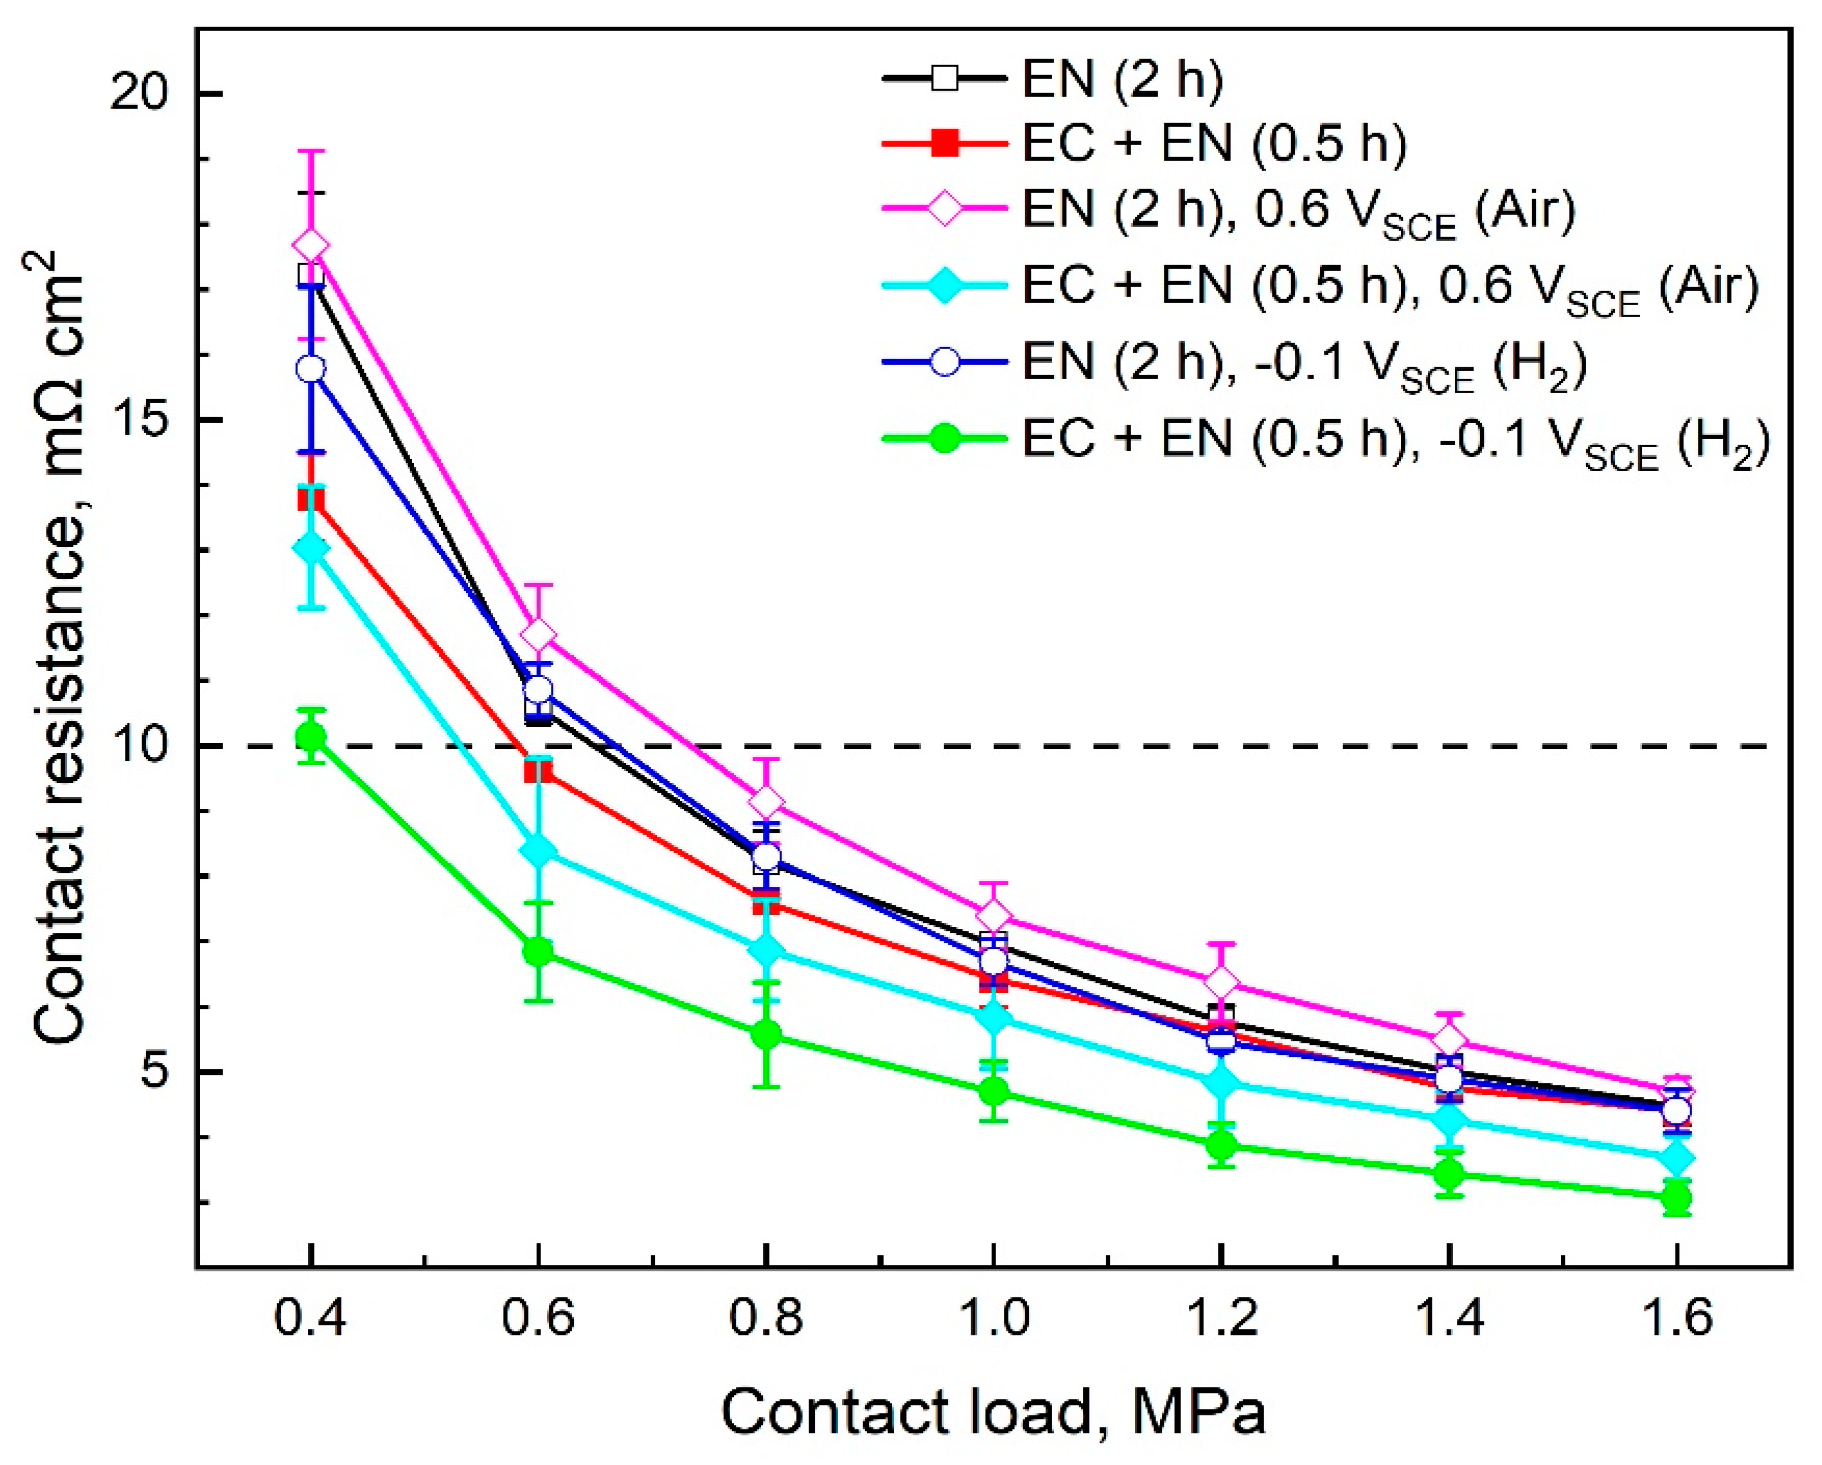
3.1. Surface Conductivity

Figure 1 gives the ICR variation with the pressure for the polished specimens after the direct electrochemical nitridation, electrochemical Cr-enrichment, and subsequent electrochemical nitridation treatments for different times. In comparison with the polished specimen [51], the Cr-enriched specimen displays a noticeable increase in the contact resistance. For instance, the ICR value changes from approximately 10.2 to 11.9 mΩ cm2 at 1.4 MPa after the electrochemical Cr-enrichment. However, the subsequent electrochemical nitridation for 5, 10, 20, and 30 min progressively reduces the ICR value to approximately 7.3, 6.5, 6.1, and 4.7 mΩ cm2 at 1.4 MPa, respectively. These results demonstrate the significant enhancement in the surface conductivity with an increase in the nitriding time. For a simple comparison, Figure 1 also presents the ICR values of the polished specimens after the direct electrochemical nitridation for 30 and 120 min without the Cr-rich pretreatment [36]. The specimen nitrided directly for 30 min shows a higher contact resistance than the Cr-enriched specimen nitrided for 5 min. The specimen nitrided directly for 120 min has a comparable contact resistance to the Cr-enriched specimen nitrided for 30 min. For example, the ICR values are approximately 8.2 and 5.0 mΩ cm2 at 1.4 MPa for the specimens nitrided directly for 30 and 120 min. These results indicate that the Cr-rich pretreatment substantially shortens the nitriding time under the same contact resistance conditions. In addition, the ICR values of all nitrided specimens with and without the Cr-rich pretreatment are lower than 10 mΩ cm2 at 1.4 MPa.
Figure 2 presents the ICR values for the specimens nitrided directly for 2 h and the Cr-enriched specimens nitrided for 0.5 h after the polarization tests for 5 h at 0.6 or −0.1 VSCE in 0.5 mol L−1 H2SO4 + 2 ppm HF solutions bubbled with air or H2 at 80 °C, respectively. For a simple comparison, the ICR values in Figure 1 for two fresh specimens without the polarization tests are also given in Figure 2. The directly nitrided specimens show a negligible change in the contact resistance after the polarization in the H2-bubbled solution, with an ICR value of approximately 4.9 mΩ cm2 at 1.4 MPa. However, the polarization in the air-bubbled solution leads to a slight increase in the ICR value from approximately 5.0 to 5.5 mΩ cm2 at 1.4 MPa. In contrast, after the polarization in both H2 and air environments, the Cr-enriched and nitrided specimens display noticeable decreases in the ICR values from approximately 4.7 mΩ cm2 to 3.4 and 4.3 mΩ cm2 at 1.4 MPa, respectively. Evidently, all nitrided specimens, especially the Cr-enriched and nitrided specimens, have ICR values that are much lower than 10 mΩ cm2 after polarization in the simulated PEMFC cathode and anode environments.

3.2. Electrochemical Corrosion Behavior

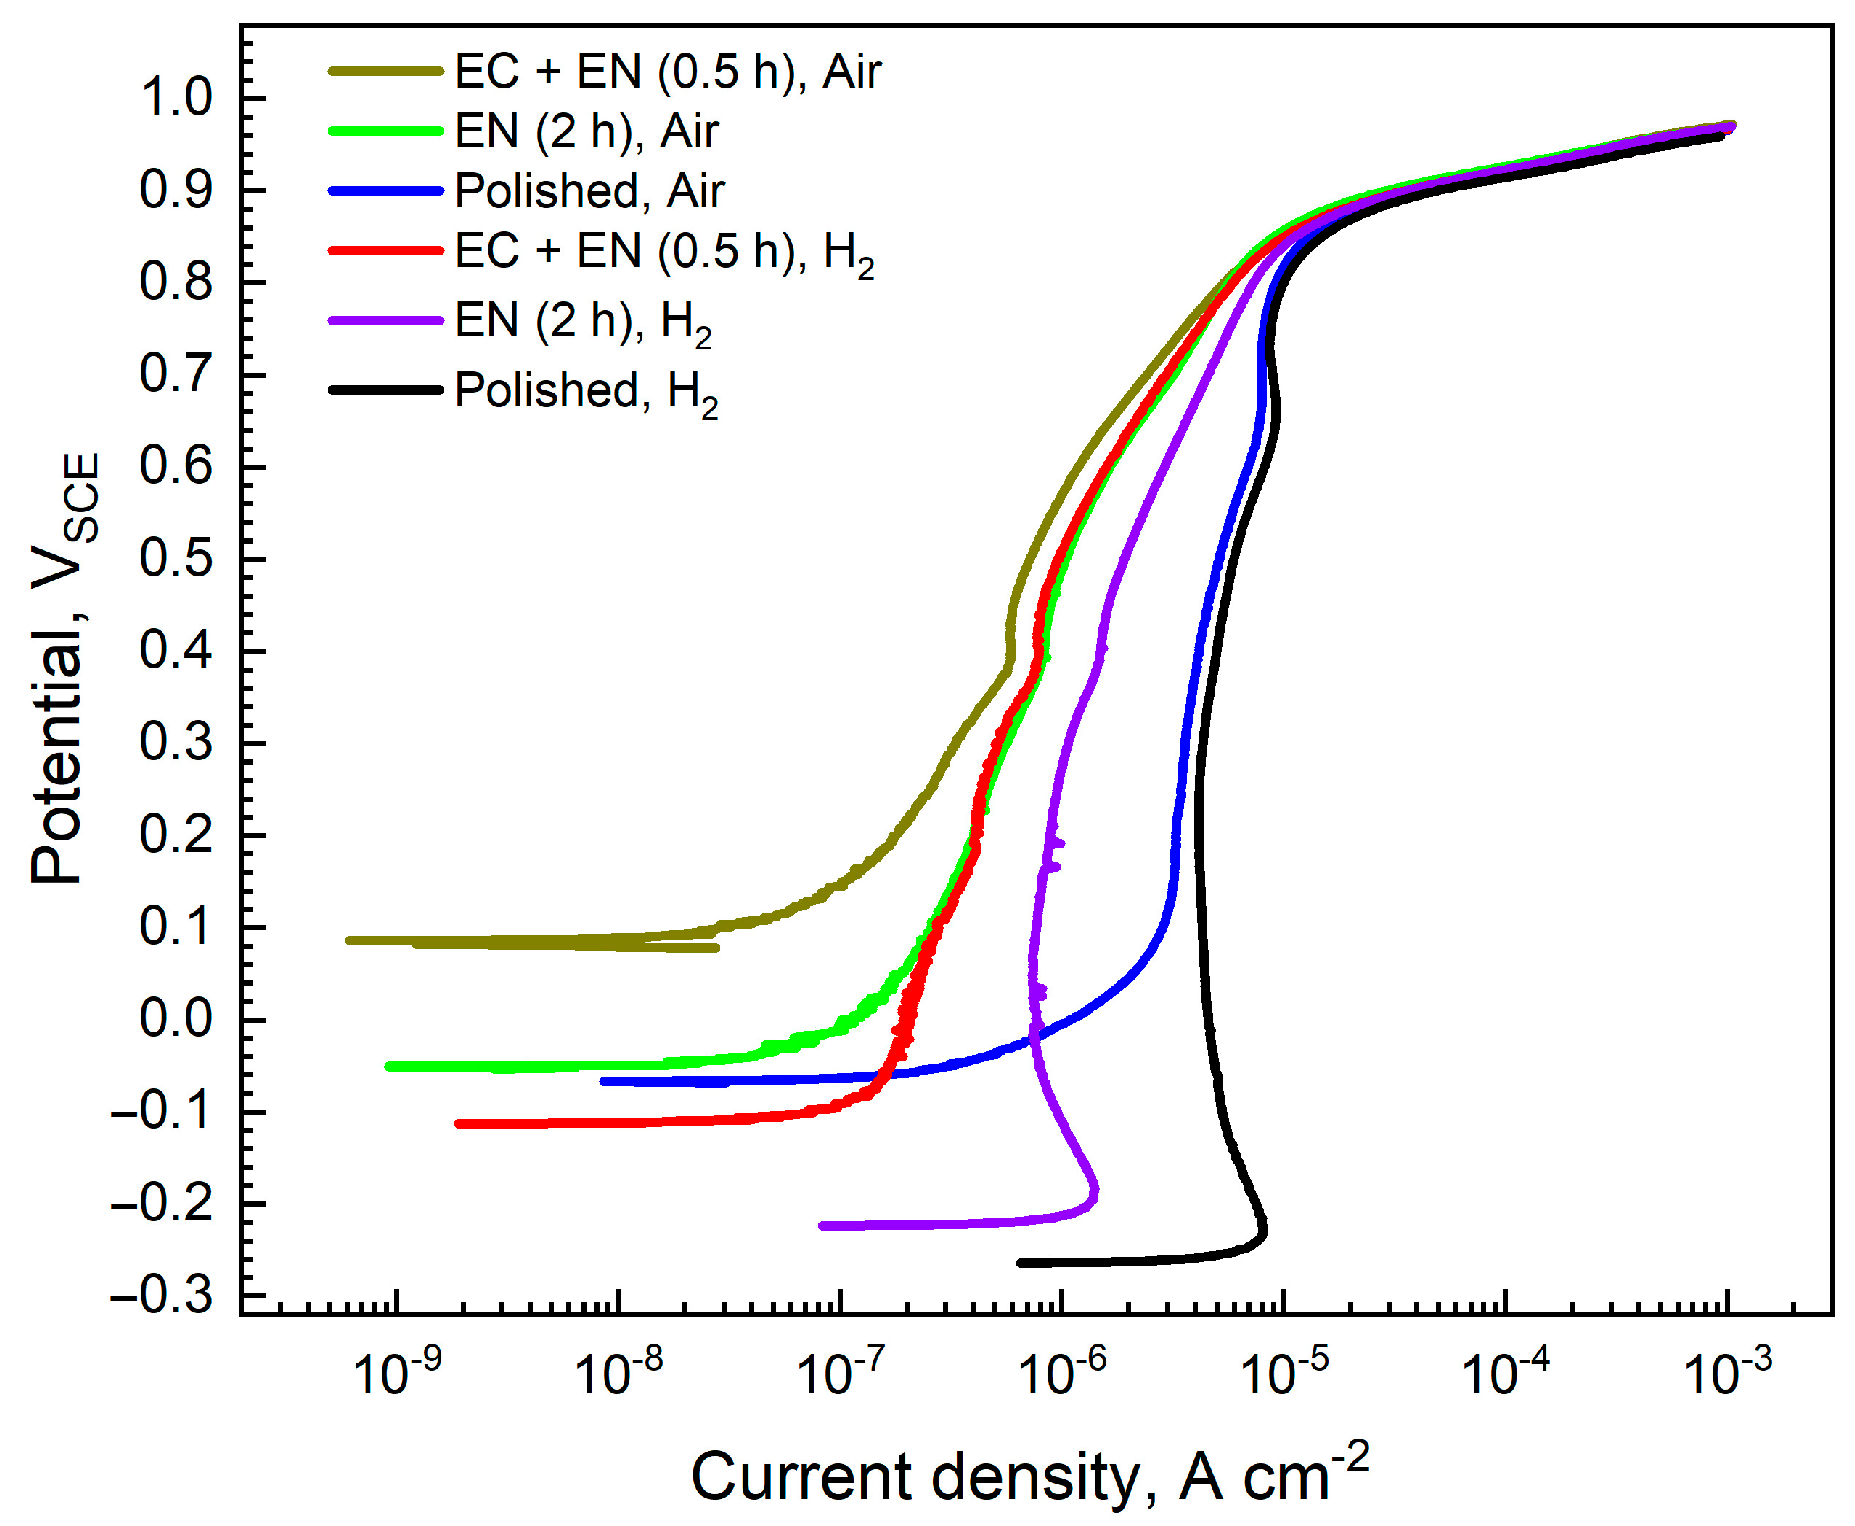
3.2.1. Anodic Polarization Curves

Figure 3 presents the potentiodynamic polarization curves of the polished specimens before and after being directly nitrided for 2 h or Cr-rich pretreated and subsequently nitrided for 0.5 h in the simulated PEMFC cathode and anode environments, respectively. The corresponding electrochemical parameters extracted from the polarization curves are summarized in Table 3. In the air-bubbled solution, both nitrided specimens with and without Cr-enrichment display spontaneous passivation features, but the Cr-enriched and nitrided specimen has a significantly higher corrosion potential (Ecorr) and lower passive current densities. At 0.6 VSCE, the passive current density (i0.6V) values of the nitrided specimens without and with Cr-enrichment are about 1.66 and 1.18 μA cm−2, respectively. In the H2-bubbled solution, both the polished and nitrided specimens without Cr-rich pretreatment are in the active corrosion state and show a weak active–passive transition peak. The current densities of the active peak (ipeak) are approximately 8.14 and 1.40 μA cm−2, respectively, while the stable passive region is from −0.05 to 0.80 VSCE. The ipeak value for the polished specimen is much higher than that of the nitrided specimen. In contrast, the Cr-enriched and nitrided specimen can spontaneously passivate and presents a higher corrosion potential and lower passive current densities. For example, the current density at −0.1 VSCE (i−0.1V) is reduced from about 0.95 to 0.07 μA cm−2 in the presence of the electrochemical Cr-rich pretreatment for the nitrided specimen. These results indicate that the electrochemical Cr-rich pretreatment significantly enhances the corrosion resistance of the nitrided specimens in the simulated PEMFC cathode and anode environments. It is clear that there are no active peaks in the polarization curves, and the current densities at typical working potentials nearly reach the target value of 1 μA cm−2.
As shown in Figure 3, the corrosion resistance of the specimens is lower in the H2 environment than in the air environment. To investigate the effect of the nitriding time on the corrosion resistance, the polarization curves were measured for the Cr-enriched specimens after electrochemical nitridation for 0 to 30 min in solutions bubbled with H2 and are shown in Figure 4. The corresponding electrochemical parameters are listed in Table 3. It is seen that all specimens have similar characteristics of spontaneous passivation. However, the electrochemical nitridation results in lower corrosion potentials and larger passive current densities for the Cr-enriched specimens, indicating a certain degree of deterioration in the corrosion resistance. With the extension of the nitriding time from 5 to 30 min, the corrosion potential shifts progressively in the negative direction and reaches approximately −0.11 VSCE at 30 min, while the polarization curve, especially at the potentials lower than 0.2 VSCE, shifts to the right direction. These results indicate that the corrosion resistance of the Cr-enriched specimen is gradually reduced with the extension of the nitriding time.
Figure 5 gives the potentiostatic polarization curves for the different specimens at 0.6 and −0.1 VSCE for 5 h in solutions bubbled with air or H2 to observe their corrosion resistance at typical working potentials in the PEMFC cathode and anode environments, respectively. The corresponding stable current density (i5h) values after 5 h of polarization are summarized in Table 4. In solutions bubbled with air, the current densities of all specimens rapidly decrease from the beginning of immersion and then gradually become stable primarily due to the formation of passive films on the specimen surfaces [55]. After 5 h of polarization at 0.6 VSCE, the stable values of the current density are approximately 1.02, 0.48, 0.26, and 0.14 μA cm−2 for the polished, 120 min nitrided, and Cr-enriched and 30 or 5 min nitrided specimens, respectively. These results indicate that electrochemical nitridation significantly reduces the passive dissolution rate of the polished specimen. The Cr-enriched specimens with 5 and 30 min of electrochemical nitridation have much lower dissolution rates than the specimen with direct nitridation for 120 min. With the extension of the nitriding time from 5 to 30 min, the dissolution rate of the Cr-enriched specimen increases to some extent.
In solutions bubbled with H2, the current densities gradually change from the initial positive values to negative values for the polished, 120 min nitrided, and Cr-enriched and 30 min nitrided specimens, which display stable values of about −0.05, −0.22, and −0.39 μA cm−2, respectively, after 5 h of polarization at −0.1 VSCE. It is clear that these three specimens are in the anodic polarization state at the beginning because their initial corrosion potentials are lower than −0.1 VSCE, as shown in Figure 3. The growth of the passive film during polarization tends to shift the corrosion potentials in the positive direction, potentially exceeding the applied potential of –0.1 VSCE. Consequently, a positive to negative transition appears for the polarization current at −0.1 VSCE. This indicates that the corrosion states of the specimens change from anodic to cathodic polarization. As a result, their corrosion appears to be inhibited to a certain extent. In contrast, the Cr-enriched and 5 min nitrided specimen is in a cathodic polarization state since the beginning of testing at −0.1 VSCE due to the higher initial corrosion potential, as shown in Figure 4. Its cathodic current density gradually decreases with time and attains a stable value of approximately −0.40 μA cm−2 after 5 h.

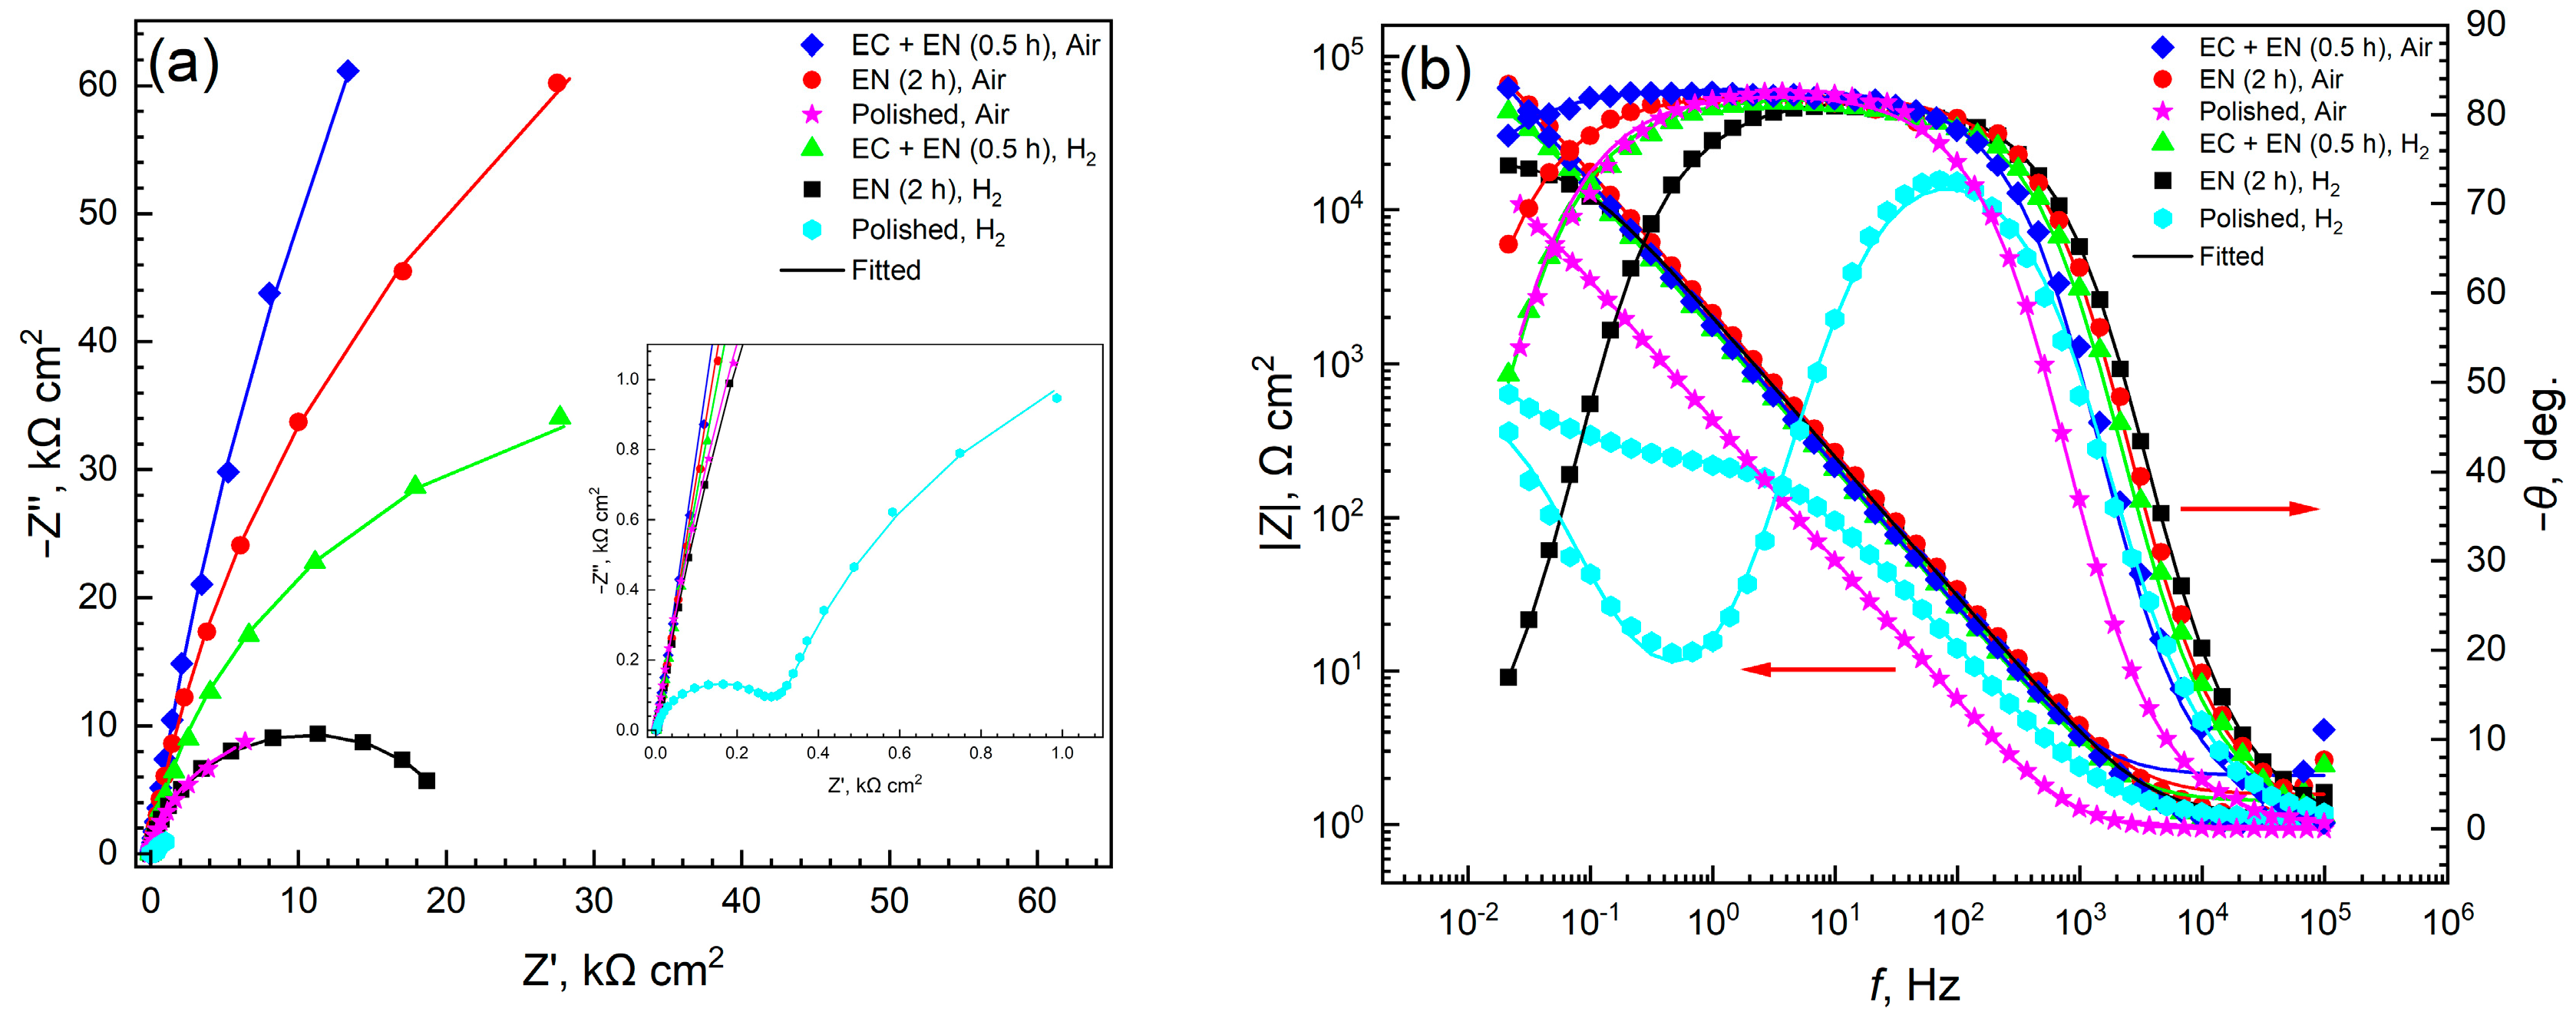
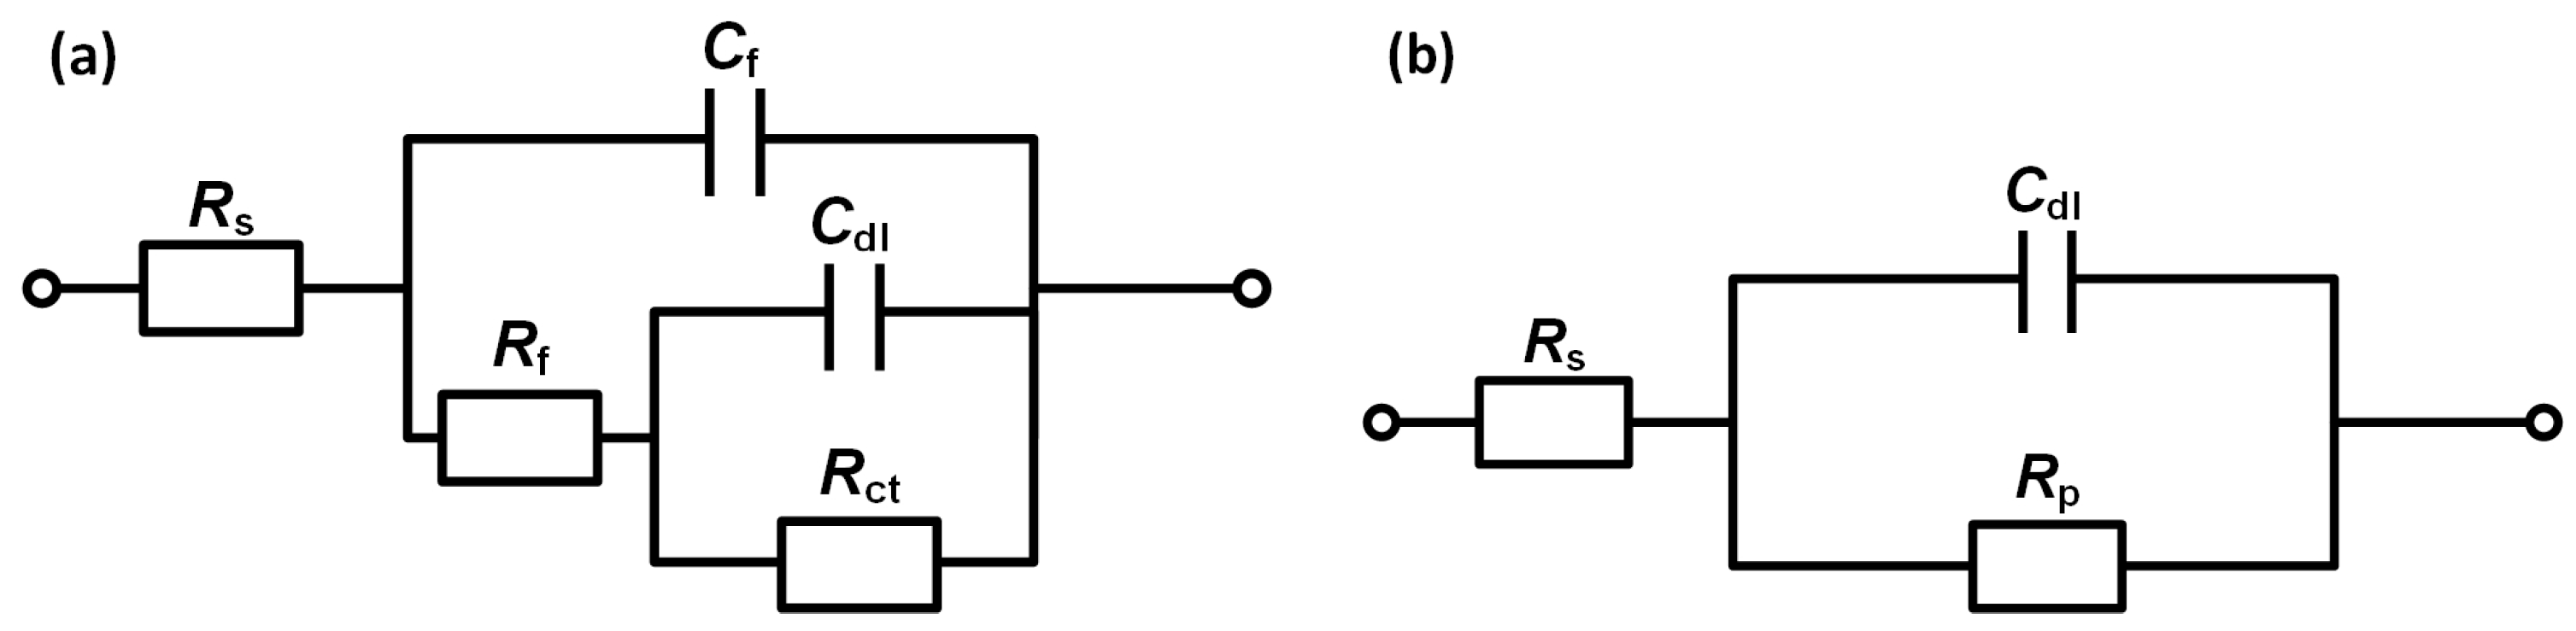
3.2.2. EIS Characteristics

Figure 6 presents the EIS spectra of the polished specimens before and after being nitrided directly for 2 h or Cr-enriched and nitrided for 30 min under free corrosion conditions in solutions bubbled with air or H2. The dots and solid lines represent the experimental data and the fitted values, respectively. As shown in Figure 6a, the Nyquist plots of all specimens are composed of incomplete capacitive semicircles over the entire frequency range in both environments except the polished one under the H2 environment. Under the same surface treatment conditions, the capacitive arc radius is significantly larger for the specimens in solution bubbled with air than with H2, indicating a higher impedance value for the corrosion in the presence of air [36]. The polished specimen shows two depressed capacitive semicircles at the high and low frequency regions under the H2 environment. In addition, the nitrided specimens with the Cr-rich pretreatment have larger impedance values in both environments under free corrosion conditions than the directly nitrided specimens, which indicates that Cr-enrichment significantly enhances the corrosion resistance of the nitrided specimens [36].
Figure 6b shows that the Bode plots of all specimens exhibit similar characteristics except the polished one under the H2 environment. The responses of the passive film and charge transfer process overlap together due to their similar time constants. The phase angle curves almost present a platform below 100 Hz. In contrast, the polished specimen tested shows two separated time constants under the H2 environment. The electrochemical Cr-rich pretreatment slightly enlarges the platform and noticeably the phase angle values at the low-frequency end for the nitrided specimens in both environments. These results indicate that the Cr-rich pretreatment significantly enhances the corrosion resistance of the nitrided specimen by forming a more protective product film on the surface.

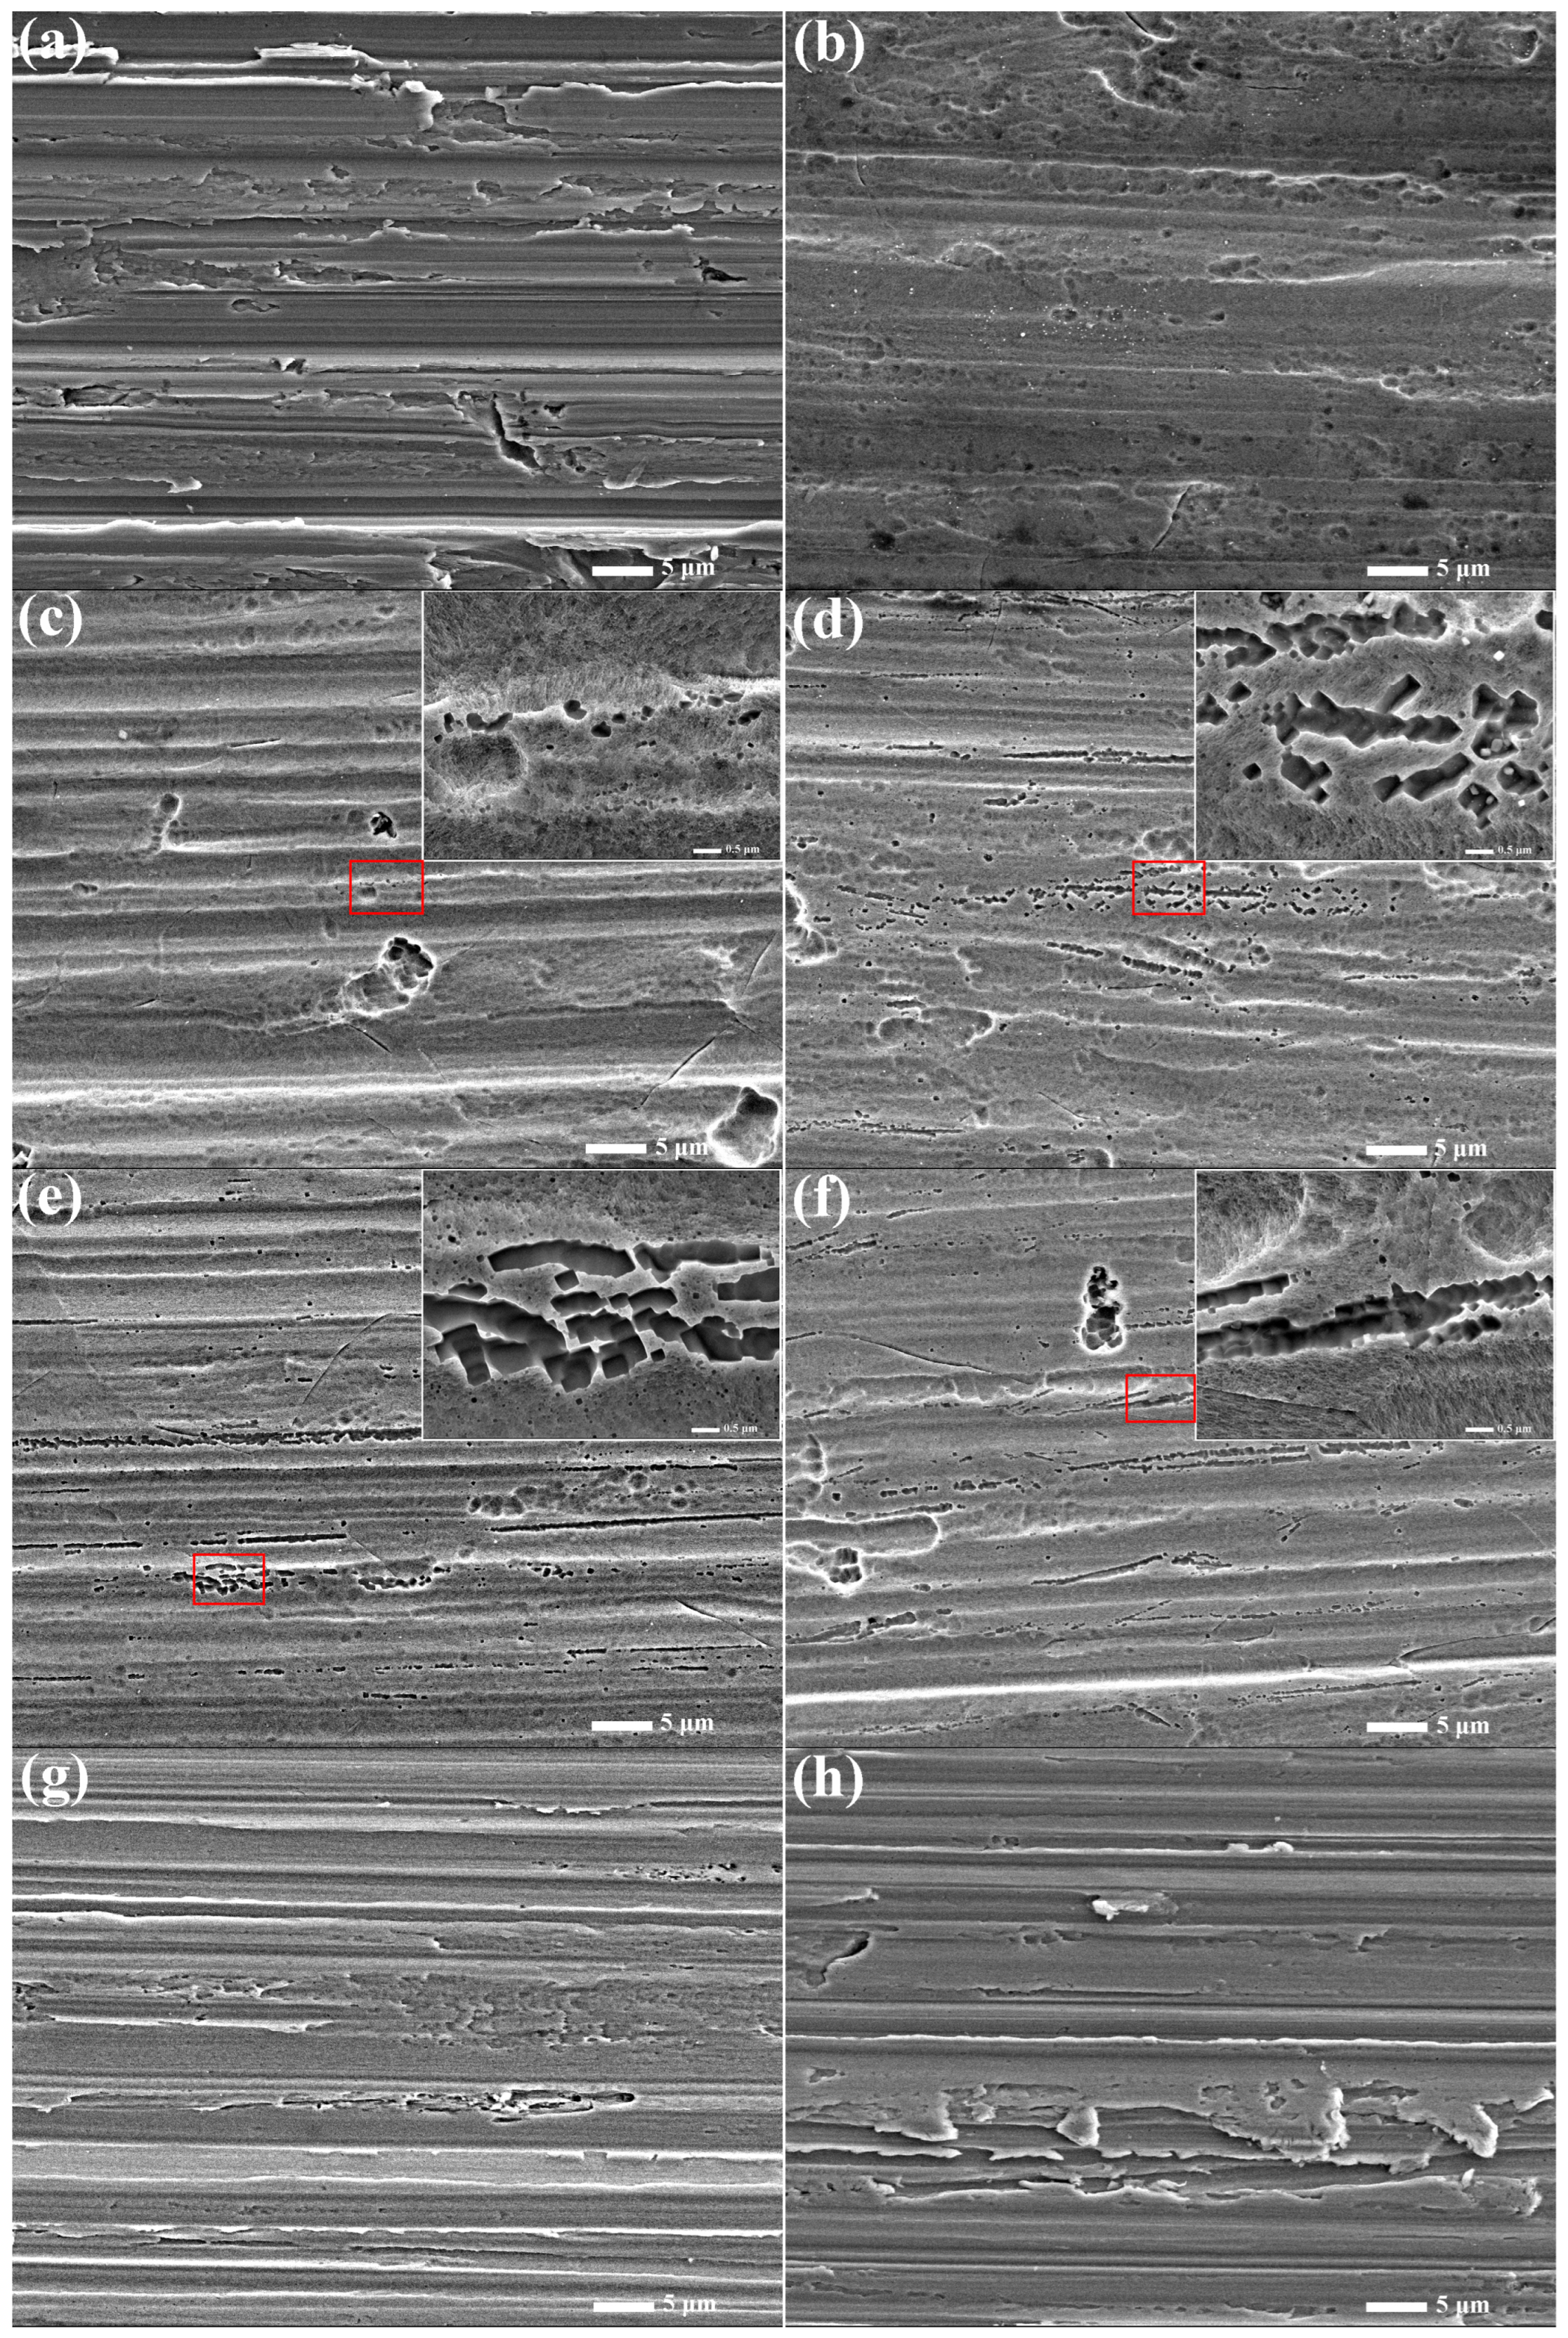
3.3. Surface Morphology

Figure 7 presents the SEM surface morphologies of specimens with different treatments and potentiostatic polarization tests. In Figure 7a, the mechanically polished specimen has the typical grinding marks. Some scratches display irregular serrated edges. As shown in Figure 7b, the electrochemical Cr-rich treatment produces anodic dissolution on the specimen surface and then forms a smoother surface with the blunting or disappearance of serrated scratch edges. It is clear that the Cr-rich treatment reduces the surface inhomogeneity. In Figure 7c,d, the electrochemical nitridation produces uneven dissolution on the Cr-rich pretreated specimen surfaces and then forms numerous tiny pits, especially at the scratch regions with higher grinding stress [60,61]. As the nitriding time is prolonged from 5 to 30 min, the pits slightly enlarge and coalesce together, but they are still very shallow and small. In Figure 7e,f, the surface morphologies of the specimens with the Cr-rich pretreatment and 0.5 h of electrochemical nitridation have insignificant changes after 5 h of potentiostatic polarization at −0.1 and 0.6 VSCE in solutions bubbled with H2 and air, respectively. For a simple comparison, Figure 7g,f give the surface morphologies of the specimens nitrided directly for 2 h and subsequently polarized for 5 h at −0.1 and 0.6 VSCE in solutions bubbled with H2 and air, respectively. It is seen that the scratches and serrated edges on the surface almost show no changes after the potentiostatic polarization tests in both environments. In addition, there are no pits on the surface of the directly nitrided specimen, which is different from those of the Cr-rich pretreated and nitrided specimen in Figure 7c,d. This indicates that some oxidized species formed during the Cr-rich pretreatment undergo partial dissolution during the electrochemical nitriding process. This should be the main reason for the formation of tiny pits in Figure 7c,d.

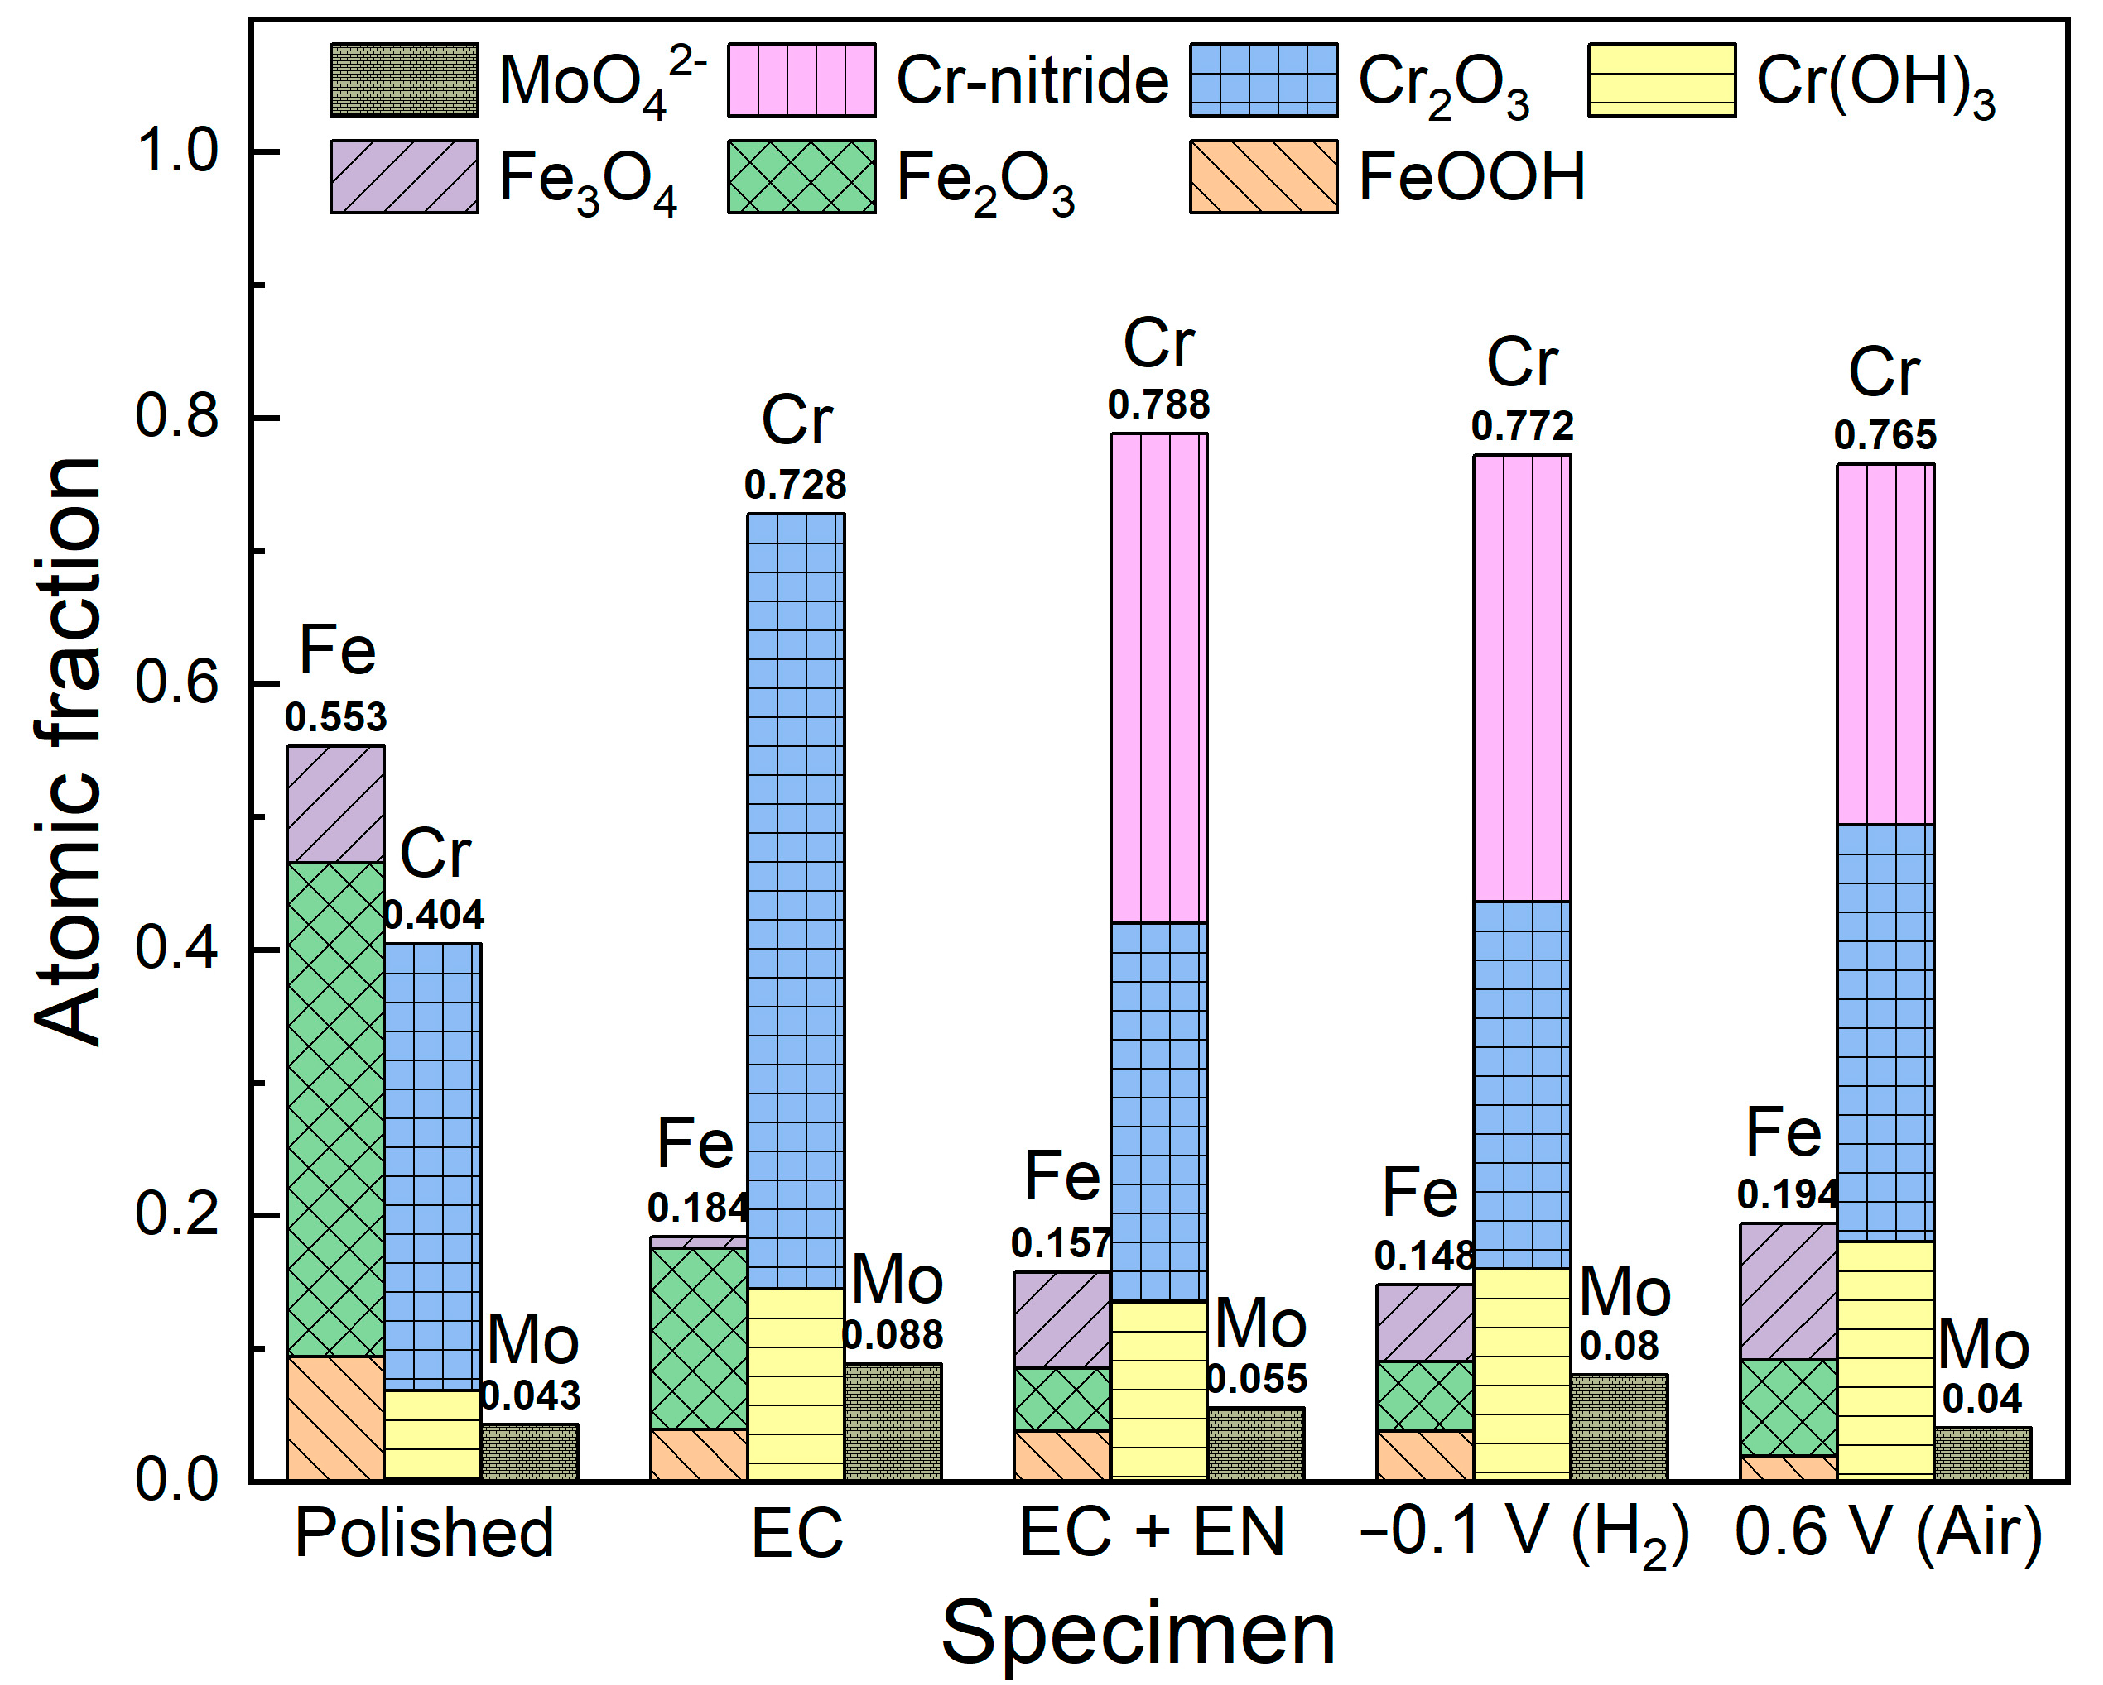
3.4. XPS Analysis of Different Specimen Surfaces

Figure 8 presents the XPS spectra of Cr 2p3/2, Fe 2p3/2, O 1s, Mo 3d, and N 1s for the specimens with different treatments and tests. As shown in Figure 8a, the Cr 2p3/2 spectra can be fitted with four components, i.e., metallic state Cr (574.1 ± 0.33 eV), Cr2O3 (576.3 ± 1.05 eV), Cr(OH)3 (578.2 ± 0.35 eV), and Cr-nitrides (575.7 ± 0.60 eV) [62,63,64,65]. For the polished specimen, mainly Cr2O3 and a small amount of Cr(OH)3 are formed on the surface in ambient air. After the electrochemical Cr-rich treatment, the intensity of Cr2O3 increases significantly, while the metallic Cr peak becomes very weak. These findings indicate that a thicker oxide film with more Cr2O3 forms on the specimen surface. After the Cr-rich pretreatment and nitridation, a noticeable Cr-nitride peak appears, while the intensity of Cr2O3 decreases markedly and the intensity of metallic Cr is enhanced slightly. These indicate that some oxides dissolve and/or transform into Cr-nitrides in the electrochemical nitriding process [36]. After 5 h of potentiostatic polarization tests in solutions bubbled with H2 at −0.1 VSCE and with air at 0.6 VSCE, the response peaks of Cr-components display insignificant changes.
Figure 8b shows that the Fe 2p3/2 spectra comprise four main components including metallic state Fe (707.0 ± 0.36 eV), Fe3O4 (708.2 ± 0.84 eV), Fe2O3 (710.4 ± 1.26 eV), and FeOOH (711.9 ± 1.08 eV) [66,67,68]. The response peaks of Fe2O3 and metallic Fe are relatively stronger than those of the other Fe-species on the polished specimen surface. After the electrochemical Cr-rich treatment, the peak intensities of all Fe-components decrease significantly, which indicates that the preferential dissolution took place for Fe and its oxides. After the Cr-rich pretreatment and nitridation, the intensity of the Fe3O4 peak greatly increases, while the Fe2O3 peak markedly weakens. These results suggest that Fe2O3 is either converted into Fe3O4 or dissolved during electrochemical nitridation, which is responsible for the formation of the small pits observed in Figure 7c,d. For the Cr-rich pretreated and nitrided specimen, the intensity of the Fe3O4 peak slightly decreases after 5 h of polarization at −0.1 VSCE in the solution bubbled with H2, whereas the intensities of the Fe3O4 and Fe2O3 peaks increase to some extent.
In Figure 8c, the O 1s spectra consist of three components corresponding to O2− (530.4 ± 0.42 eV), OH (531.6 ± 0.25 eV), and adsorbed H2O (532.5 ± 0.42 eV) [69,70]. For the mechanically polished specimen, the response peak of O2− is much stronger than that of OH, indicating that the oxides are the dominant species in the air-formed thin film on the surface. After the Cr-rich treatment, the relative intensities of the OH and H2O peaks are clearly enhanced, indicating that the content of hydroxides increases to some extent in the thin product film on the surface. After the Cr-rich and subsequent nitriding treatments, the intensities of the H2O and O2− peaks slightly decrease due to the formation of nitrides [36]. For the specimen with Cr-rich and nitridation treatment, there are very slight changes in the peaks of O-species after 5 h of polarization at −0.1 VSCE in the solution bubbled with H2, whereas the intensity of the O2− peak increases clearly after 5 h of polarization at 0.6 VSCE in the solution bubbled with air due to the greater amount of oxides formed on the passive film [55].
In Figure 8d, the Mo 3d spectra comprise the Mo 3d3/2 and Mo 3d5/2 orbitals, which are deconvoluted into the components corresponding to metallic Mo (227.8 ± 0.32 eV and 231.0 ± 0.39 eV) and MoO42− (232.1 ± 0.32 eV and 235.4 ± 0.57 eV) [55]. For the mechanically polished specimen, there is a very small amount of MoO42− formed on the surface. After the Cr-rich treatment, the intensity of the MoO42− peak increases significantly, indicating that there is more oxidized MoO42− product formed on the specimen surface. After the Cr-rich and subsequent nitriding treatments, the metallic Mo peaks become stronger, whereas the MoO42− peaks become weaker. After 5 h of polarization in the solution bubbled with H2, the intensities of both the metallic Mo and MoO42− peaks increase to some extent. However, after 5 h of polarization in the solution bubbled with air, the intensities of the MoO42− peaks decrease slightly.
Figure 8e presents the overlapped signals of the N 1s and Mo 3p3/2 energy levels [32,71,72]. The N 1s spectra consist of three components, i.e., NH3 (399.7 ± 0.36 eV), nitrides (396.3 ± 0.91 eV), and NH4+ (401.80 ± 0.27 eV) [22,31]. For the mechanically polished specimen, only a weak NH3 signal is detected. After the Cr-rich treatment, a strong MoO42− peak (399.1 ± 0.64 eV) emerges [73]. For the Cr-rich and nitridation-treated specimen, the weak peaks of nitride and metallic Mo (394.0 ± 0.05 eV) appear in addition to the peaks of MoO42− and NH3. After 5 h of polarization in the solution bubbled with H2, a strong NH4+ peak appears due to the cathodic reduction state. However, after 5 h of polarization in the solution bubbled with air, the MoO42− peak becomes weaker and no NH4+ peak can be observed.
Figure 9 presents the atomic fractions for the oxidized products of the alloying elements Fe, Cr, and Mo on the surfaces of different specimens, obtained from the fitting of the XPS spectra [74]. For the polished specimen, a thin air-formed oxide film is primarily composed of Fe and Cr oxides on the surface [27,75], in which the fractions of Fe2O3 and Cr2O3 are about 0.37 and 0.34, respectively. After the Cr-rich treatment, the fraction of Fe-oxides is significantly reduced to about 0.18, whereas the fractions of Cr2O3 and Cr(OH)3 markedly increase to about 0.58 and 0.15, respectively. The total fraction of Cr-species reaches about 0.73, and the Cr/Fe ratio increases from 0.73 to 3.96. Additionally, the MoO42− content increases slightly from approximately 0.04 to 0.09. After the Cr-rich and nitridation treatments, the Fe-oxide fraction is further decreased to approximately 0.16, while the fractions of Cr2O3 and MoO42− decrease to 0.29 and 0.06, respectively. The thin film is mainly composed of Cr oxides and nitrides on the specimen surface, with the atomic fractions of approximately 0.42 and 0.37, respectively. For the Cr-rich and nitridation treated specimen, after 5 h of polarization at −0.1 VSCE in the H2-bubbled solution, the fraction of Cr-nitrides is slightly decreased to about 0.34, i.e., a reduction of approximately 8%. The MoO42− fraction is increased slightly to about 0.08. The overall change in the composition of the thin film on the specimen surface is very small. However, after 5 h of polarization at 0.6 VSCE in the air-bubbled solution, the Cr-nitride fraction decreases to about 0.27, i.e., a reduction of approximately 26%. The fractions of Fe and Cr oxides increase slightly to 0.19 and 0.49, respectively. The MoO42− fraction slightly declines to 0.04.

3.5. Release of Metallic Ions

Figure 10 presents the release amounts of Fe, Cr, and Mo measured by ICP-MS after 5 h of potentiostatic polarization at −0.1 or 0.6 VSCE in solutions bubbled with H2 or air, respectively, for the polished specimens without and with Cr-rich pretreatment and 30 min of electrochemical nitridation. To avoid the ambiguity associated with concentration (e.g., μg L−1), the metal release is reported as an area-specific amount. The data are expressed in μg·cm−2, which represents the amount of metal released per unit surface area from the specimen. Overall, the release amounts of metallic ions are very small from all the specimens. A further comparison indicates that the dissolution of Fe is significantly higher than that of Cr, and the Mo dissolution remains negligible. After the electrochemical Cr-rich and nitridation treatments, the release amounts of Fe and Cr in the H2-bubbled solution are reduced from approximately 28.1 and 2.3 μg cm−2 to 18.2 and 1.1 μg cm−2, respectively, whereas the Mo release amount is slightly increased from about 0.2 to 0.4 μg cm−2. In the air-bubbled solution, the release amounts of Fe and Cr are decreased from approximately 31.7 and 3.1 μg cm−2 to 11.7 and 0.8 μg cm−2, respectively, while the Mo release amount is enlarged slightly from about 0.2 to 0.3 μg cm−2.

4. Discussion

4.1. Surface Conductivity and Corrosion Resistance

Based on the characteristics of the EIS spectra in Figure 6, two equivalent circuit models were proposed in Figure 11 for fitting analysis. The model in Figure 11a was employed for the polished specimen under the H2 environment because its impedance spectrum exhibits two distinct time constants. In the models, Rs denotes the solution resistance; Rf and Cf correspond to the resistance and capacitance of the corrosion product film on the specimen surface; and Rct and Cdl represent the charge transfer resistance and double-layer capacitance, respectively. The simplified model in Figure 11b was employed for the other specimens because the two time constants merge together, where Rp refers to the overall polarization resistance of Rf and Rct. In view of the non-ideal capacitive behavior at the specimen/electrolyte interface, the ideal capacitance elements Cf and Cdl were replaced with constant phase elements (CPEs) during the fitting process. The impedance of CPE is given by the following [36]:
Z C P E = 1 Y 0 ( j ω ) α
where Y0 is the admittance of the CPE, ω is the angular frequency, j is an imaginary unit, and α is the exponent. The fitted results are summarized in Table 2. The chi-square (χ2) values are on the order of magnitude of 10−3, indicating that the fitting results are reliable.
As seen from Table 5, the electrochemical Cr-rich pretreatment significantly enhances the Rp values of the nitrided specimens in both air- and hydrogen-bubbled solutions, which increase from 2.21 × 10⁵ and 2.15 × 10⁴ Ω cm2 to 7.79 × 10⁵ and 8.12 × 10⁴ Ω cm2, respectively. As shown in Figure 1 and Table 5, the polished specimen exhibits relatively poor corrosion resistance, especially in the 0.5 mol L−1 H2SO4 + 2 ppm HF solution bubbled with H2, where a pronounced active-to-passive transition is observed, and the corresponding Rp (Rp = Rf + Rct) value is only 4.1 × 10³ Ω cm2. In contrast, electrochemical nitridation significantly improves the corrosion resistance of 446 stainless steel, especially under the Cr-rich pretreatment condition. Furthermore, Figure 10 shows that the corrosion rates and the release amounts of metallic ions are significantly reduced in both simulated environments after the electrochemical Cr-rich and nitridation treatments. In particular, the total release of metallic ions is reduced by approximately 63% in the simulated cathode environment. Together with the potentiostatic polarization results in Table 4, these confirm that the electrochemical Cr-rich pretreatment markedly enhances the corrosion resistance of the nitrided specimens in the simulated PEMFC cathode and anode environments, effectively reducing their corrosion rates. This can be mainly attributed to the following factors: (1) Surface roughness and defects [54]. As observed in Figure 7, the electrochemical pretreatment not only effectively removes surface defects such as scratches and deformation layers introduced by mechanical polishing but also produces a smoother surface with reduced roughness (i.e., lower actual surface area). These are unfavorable for the corrosion on the specimen surface to some extent [54]. (2) Protective oxide layer. The electrochemical pretreatment produces a protective Cr-rich oxide layer on the surface, in which the atomic fraction of Cr2O3 reaches about 0.58 (Figure 9). Although the amount of Cr-oxides decreases noticeably after the electrochemical nitriding treatment, the remaining oxide layer still protects the metallic substrate from corrosion to a certain extent, as shown in Figure 4. (3) Mixed layer of nitrides and oxides. According to a prior report [36], the total atomic fraction of Cr2O3 and Cr-nitrides on the specimen surface nitrided directly for 2 h is approximately 0.63. In comparison, this total fraction increases to approximately 0.66 (Figure 9) for the specimen nitrided for 0.5 h after the Cr-rich pretreatment. It is apparent that the surface layer with more Cr2O3 and Cr-nitrides has better protective properties [33,49].
Figure 1 and Figure 2 indicate that the electrochemical Cr-rich treatment slightly enlarges the contact resistance of the specimen surface, which primarily results from the formation of the oxide layer (Figure 8) and the smoother surface (Figure 7) [54]. However, the enrichment of Cr-oxide in the surface layer is conducive to forming Cr-nitrides. Under the same electrochemical nitridation conditions, the atomic fraction of Cr-nitride is approximately 0.33 in the surface film for the specimen nitrided directly for 2 h [36] but increases to approximately 0.37 for the specimen nitrided for 0.5 h under Cr-rich pretreated conditions (Figure 9), which is beneficial for enhancing surface conductivity. At the same time, it is also seen form Figure 9 that the Cr2O3 content on the pretreated specimen surface significantly decreases after the electrochemical nitridation. These findings suggest that the Cr-rich oxide film participates in the nitriding process and partially transforms into Cr-nitride. At present, it is still hard to clearly elucidate the action of the Cr-rich oxide film. Nevertheless, it is noted that the contact resistance values are much lower than 10 mΩ cm2 for both nitrided specimens after the polarization tests at the typical working potentials in the simulated PEMFC cathode and anode environments, especially under the Cr-rich pretreated conditions.

4.2. Effect of Nitriding Time

As for the electrochemical Cr-rich pretreated specimen, prolonging the nitriding time from 0 to 30 min results in a gradual reduction in the ICR value in Figure 1 but a significant enlargement of the passive current density in Figure 4, i.e., a higher surface conductivity but a lower corrosion rate. These changes can be mainly attributed to the following two factors. On the one hand, the Cr-rich oxide film dissolves to some extent during electrochemical nitridation, as observed from the appearance of small pits in Figure 7c,d. This will lead to the reduction in both Cr-oxides and the film thickness on the surface of the Cr-rich pretreated specimen, as confirmed by the results in Figure 9 and the enhanced metallic responses in Figure 8a,b. On the other hand, since the electrochemical nitridation takes place under cathodic polarization conditions, some metallic oxides are reduced simultaneously [76]. For instance, Fe2O3 and Cr2O3 are reduced to Fe3O4 and Cr-nitride, respectively. These are likely to be the main reasons for the decrease in the Fe2O3 and Cr2O3 contents and the slight increase in the Fe3O4 content after the electrochemical nitridation, as shown in Figure 9. Additionally, the active nitrogen species generated during the electrochemical nitriding process diffuse inward to the substrate surface, where they preferentially react with metallic Cr to form nitrides. As a result, with a prolongation of the nitriding time, the Cr-nitrides will gradually accumulate in the surface layer of the specimen, whereas the oxides Fe2O3 and Cr2O3 have the opposite variation tendency. Clearly, these changes contribute positively to the surface conductivity but will deteriorate the corrosion resistance to some extent except the nitrides. Consequently, the combined effect of these factors results in the opposite changes over the nitriding time for the surface conductivity and corrosion resistance of the nitrided specimens.
In summary, the Cr-rich pretreatment significantly improves not only the corrosion resistance and surface conductivity of nitrided 446 stainless steel but also the nitridation efficiency, which is valuable for the development and application of stainless steel bipolar plates in PEMFCs. However, the nitriding time has the opposite effect on the surface conductivity and corrosion resistance. It is essential to optimize the nitriding time to achieve a balance between these properties in practical applications.

5. Conclusions

The effect of Cr-rich pretreatment and electrochemical nitridation on the corrosion behavior and surface conductivity of 446 stainless steel was investigated in the simulated PEMFC cathode and anode environments (i.e., 0.5 mol L−1 H2SO4 + 2 ppm HF solution bubbled with air or H2 at 80 °C). The main conclusions are summarized as follows:
(1)
The electrochemical Cr-rich pretreatment produces an oxide film with a Cr/Fe ratio of approximately 4.0 on the specimen surface. For the Cr-rich pretreated and nitrided specimens, the extension of the nitriding time from 5 to 30 min results in the enhancement of surface conductivity but the degradation of corrosion resistance to some extent. After 0.5 h of electrochemical nitridation, a thin mixed layer of oxides and nitrides forms on the specimen surface, which mainly consists of Cr-oxide and -nitride with atomic fractions of 0.42 and 0.37, respectively.
(2)
After 2 h of direct nitridation, the specimen displays an active corrosion state in the simulated anode environment. In contrast, after Cr-rich pretreatment and 0.5 h of nitridation, the specimen can spontaneously passivate in the simulated cathode and anode environments, which results in a significantly higher corrosion potential and polarization resistance as well as a lower passive current density. The Cr-rich pretreatment enhances the corrosion resistance of nitrided specimens under free corrosion conditions.
(3)
For the specimens with Cr-rich pretreatment and 0.5 h of nitridation, after 5 h of polarization at 0.6 VSCE in the simulated cathode environment, the stable current density and the ICR value at 1.4 MPa are approximately 0.26 μA cm−2 and 4.3 mΩ cm2, respectively. Whereas, after 5 h of polarization at −0.1 VSCE in the simulated anode environment, the specimens are in the cathodic polarization state. The stable current density and the ICR value at 1.4 MPa are approximately −0.39 μA cm−2 and 3.4 mΩ cm2, respectively. The Cr-rich pretreatment improves the corrosion resistance and surface conductivity of the nitrided specimens under typical PEMFC working potential conditions.
(4)
After 5 h of polarization tests at 0.6 and −0.1 VSCE in the simulated cathode and anode environments, the release amounts of Fe are significantly higher than those of Cr and Mo. There are many Cr-nitrides remaining on the surface film, with atomic fractions of about 0.27 and 0.34, respectively.

Author Contributions

Conceptualization, R.X. and M.L.; methodology, R.X.; software, R.X.; validation, Y.Z., R.Z. and M.L.; formal analysis, R.X., Y.Z. and R.Z.; investigation, R.X.; resources, M.L.; data curation, R.Z.; writing—original draft preparation, R.X.; writing—review and editing, R.X.; visualization, Y.Z.; supervision, M.L. All authors have read and agreed to the published version of the manuscript.

Funding

This research received no external funding.

Data Availability Statement

The original contributions presented in this study are included in the article. Further inquiries can be directed to the corresponding author.

Conflicts of Interest

The authors declare no conflicts of interest.

References

  1. Jiao, K.; Xuan, J.; Du, Q.; Bao, Z.; Xie, B.; Wang, B.; Zhao, Y.; Fan, L.; Wang, H.; Hou, Z.; et al. Designing the next generation of proton-exchange membrane fuel cells. Nature 2021, 595, 361–369. [Google Scholar] [CrossRef] [PubMed]
  2. Ogungbemi, E.; Ijaodola, O.; Khatib, F.N.; Wilberforce, T.; El Hassan, Z.; Thompson, J.; Ramadan, M.; Olabi, A.G. Fuel cell membranes–Pros and cons. Energy 2019, 172, 155–172. [Google Scholar] [CrossRef]
  3. Wilberforce, T.; Ijaodola, O.; Baroutaji, A.; Ogungbemi, E.; Olabi, A.G. Effect of Bipolar Plate Material on Proton Exchange Membrane Fuel Cell Performance. Energies 2022, 15, 1886. [Google Scholar] [CrossRef]
  4. Li, H.M.; Bi, F.F.; Dong, L.; Xu, Z.T.; Li, X.B.; Zhou, F.; Fan, C.Y.; Shi, W.Y.; Peng, L.F.; Lai, X.M. A novel ex-situ accelerated evaluation method for metallic bipolar plates in proton exchange membrane fuel cells. J. Power Sources 2023, 580, 233374. [Google Scholar] [CrossRef]
  5. Xuan, J.; Xin, Y.; Xu, L.; Guo, M.; Huang, L.; Zhang, Y.; Zhao, Y.; Liu, Y.; Li, L.; Xue, L.; et al. Effects of fluoride ions on corrosion performance and surface properties of SS304 in simulated PEMFC cathodic environments. Renew. Energy 2023, 212, 769–778. [Google Scholar] [CrossRef]
  6. Xuan, J.; Liu, Y.; Xu, L.; Bai, S.; Xin, Y.; Wang, L.; Zhang, G.; Su, Y.; Xue, L.; Li, L. Investigation of acidity on corrosion behavior and surface properties of SS304 in simulated PEMFC cathode environments. Int. J. Hydrogen Energy 2022, 47, 22938–22951. [Google Scholar] [CrossRef]
  7. Novalin, T.; Eriksson, B.; Proch, S.; Bexell, U.; Moffatt, C.; Westlinder, J.; Lagergren, C.; Lindbergh, G.; Wreland Lindström, R. Concepts for preventing metal dissolution from stainless-steel bipolar plates in PEM fuel cells. Energy Conv. Manag. 2022, 253, 115153. [Google Scholar] [CrossRef]
  8. Yang, L.X.; Liu, R.J.; Wang, Y.; Liu, H.J.; Zeng, C.L.; Fu, C. Corrosion and interfacial contact resistance of nanocrystalline β-Nb2N coating on 430 FSS bipolar plates in the simulated PEMFC anode environment. Int. J. Hydrogen Energy 2021, 46, 32206–32214. [Google Scholar] [CrossRef]
  9. Mani, S.P.; Agilan, P.; Kalaiarasan, M.; Ravichandran, K.; Rajendran, N.; Meng, Y. Effect of multilayer CrN/CrAlN coating on the corrosion and contact resistance behavior of 316L SS bipolar plate for high temperature proton exchange membrane fuel cell. J. Mater. Sci. Technol. 2022, 97, 134–146. [Google Scholar] [CrossRef]
  10. Wang, H.; Sweikart, M.A.; Turner, J.A. Stainless steel as bipolar plate material for polymer electrolyte membrane fuel cells. J. Power Sources 2003, 115, 243–251. [Google Scholar] [CrossRef]
  11. Meng, W.; Zhu, H.; Wang, X.; Li, G.; Fan, Y.; Sun, D.; Kong, F. Electrochemical Behavior and Surface Conductivity of C/TiC Nanocomposite Coating on Titanium for PEMFC Bipolar Plate. Metals 2022, 12, 771. [Google Scholar] [CrossRef]
  12. Leng, Y.; Ming, P.; Yang, D.; Zhang, C. Stainless steel bipolar plates for proton exchange membrane fuel cells: Materials, flow channel design and forming processes. J. Power Sources 2020, 451, 227783. [Google Scholar] [CrossRef]
  13. Forouzanmehr, M.; Reza Kashyzadeh, K.; Borjali, A.; Ivanov, A.; Jafarnode, M.; Gan, T.H.; Wang, B.; Chizari, M. Detection and Analysis of Corrosion and Contact Resistance Faults of TiN and CrN Coatings on 410 Stainless Steel as Bipolar Plates in PEM Fuel Cells. Sensors 2022, 22, 750. [Google Scholar] [CrossRef]
  14. Li, S.; Jin, R.; Li, S.; Wang, L.; Xie, Z.; Li, X.; Wang, Z. High corrosion resistance and conductivity of Al2O3/CrN coating for metal bipolar plates in PEMFCs: Al2O3 hinders CrN columnar crystals growth. Int. J. Hydrogen Energy 2024, 50, 805–816. [Google Scholar] [CrossRef]
  15. Cheng, H.; Luo, H.; Wang, X.; Pan, Z.; Zhao, Q.; Dong, C.; Li, X. Improving the performance of titanium bipolar plate in proton exchange membrane water electrolysis environment by nitrogen-chromium composite cathode plasma electrolytic deposition. Int. J. Hydrogen Energy 2023, 48, 38557–38568. [Google Scholar] [CrossRef]
  16. Haye, E.; Deschamps, F.; Caldarella, G.; Piedboeuf, M.-L.; Lafort, A.; Cornil, H.; Colomer, J.-F.; Pireaux, J.-J.; Job, N. Formable chromium nitride coatings for proton exchange membrane fuel cell stainless steel bipolar plates. Int. J. Hydrogen Energy 2020, 45, 15358–15365. [Google Scholar] [CrossRef]
  17. Chen, Q.; Su, M.; Pang, G.; Zhou, Q.; Liang, D.; Zhang, E. Improving the corrosion resistance and conductivity of 316L bipolar plates used for PEMFCs by applying Cr/CrN multilayer coating. Appl. Surf. Sci. 2025, 689, 162573. [Google Scholar] [CrossRef]
  18. Choi, J.-H.; Eun Kang, H.; Kim, D.-J.; Soo Yoon, Y. A Comprehensive Review of Stainless-Steel Bipolar Plate Coatings and Their Role in Mitigating Corrosion in Aggressive Proton-Exchange Membrane Fuel Cells Environments. Chem. Eng. J. 2024, 493, 152662. [Google Scholar] [CrossRef]
  19. Liu, R.; Jia, Q.; Zhang, B.; Lai, Z.; Chen, L. Protective coatings for metal bipolar plates of fuel cells: A review. Int. J. Hydrogen Energy 2022, 47, 22915–22937. [Google Scholar] [CrossRef]
  20. Zhu, H.; Wang, X.; Meng, W.; Kong, F. Effects of Heat Treatment on Microstructures and Properties of Cold Rolled Ti-0.3Ni Sheets as Bipolar Plates for PEMFC. Metals 2022, 12, 792. [Google Scholar] [CrossRef]
  21. Pugal Mani, S.; Rajendran, N. Corrosion and interfacial contact resistance behavior of electrochemically nitrided 316L SS bipolar plates for proton exchange membrane fuel cells. Energy 2017, 133, 1050–1062. [Google Scholar] [CrossRef]
  22. Willenbruch, R.D.; Clayton, C.R.; Oversluizen, M.; Kim, D.; Lu, Y. An XPS and electrochemical study of the influence of molybdenum and nitrogen on the passivity of austenitic stainless steel. Corros. Sci. 1990, 31, 179–190. [Google Scholar] [CrossRef]
  23. Wang, H.; Teeter, G.; Turner, J.A. Modifying a stainless steel via electrochemical nitridation. J. Mater. Chem. A 2011, 21, 2064–2066. [Google Scholar] [CrossRef]
  24. Lv, J.; Liang, T. Improved corrosion resistance of 316L stainless steel by nanocrystalline and electrochemical nitridation in artificial saliva solution. Appl. Surf. Sci. 2015, 359, 158–165. [Google Scholar] [CrossRef]
  25. Lv, J.; Liang, T.; Luo, H. Effect of grain refinement and electrochemical nitridation on corrosion resistance of the 316L stainless steel for bipolar plates in PEMFCs environment. J. Power Sources 2015, 293, 692–697. [Google Scholar] [CrossRef]
  26. Jinlong, L.; Jin, H.; Tongxiang, L. The effect of electrochemical nitridation on the corrosion resistance of the passive films formed on the 2205 duplex stainless steel. Mater. Lett. 2019, 256, 126640. [Google Scholar] [CrossRef]
  27. Olsson, C.O.A.; Landolt, D. Passive films on stainless steels—Chemistry, structure and growth. Electrochim. Acta 2003, 48, 1093–1104. [Google Scholar] [CrossRef]
  28. Tian, H.; Wang, J.; Liu, Z.; Han, P. Effect of Nitrogen on the Corrosion Resistance of 6Mo Super Austenitic Stainless Steel. Metals 2024, 14, 391. [Google Scholar] [CrossRef]
  29. Villegas-Tovar, J.; Gaona-Tiburcio, C.; Lara-Banda, M.; Maldonado-Bandala, E.; Baltazar-Zamora, M.A.; Cabral-Miramontes, J.; Nieves-Mendoza, D.; Olguin-Coca, J.; Estupiñan-Lopez, F.; Almeraya-Calderón, F. Electrochemical Corrosion Behavior of Passivated Precipitation Hardening Stainless Steels for Aerospace Applications. Metals 2023, 13, 835. [Google Scholar] [CrossRef]
  30. Kim, D.; Clayton, C.; Oversluizen, M. On the question of nitrate formation by N-containing austenitic stainless steels. Mater. Sci. Eng. A 1994, 186, 163–169. [Google Scholar] [CrossRef]
  31. Clayton, C.R.; Halada, G.P.; Kearns, J.R. Passivity of high-nitrogen stainless alloys: The role of metal oxyanions and salt films. Mater. Sci. Eng. A 1995, 198, 135–144. [Google Scholar] [CrossRef]
  32. Halada, G.; Kim, D.; Clayton, C. Influence of nitrogen on electrochemical passivation of high-nickel stainless steels and thin molybdenum-nickel films. Corrosion 1996, 52, 36–46. [Google Scholar] [CrossRef]
  33. Wang, H.; Turner, J.A. Electrochemical nitridation of a stainless steel for PEMFC bipolar plates. Int. J. Hydrogen Energy 2011, 36, 13008–13013. [Google Scholar] [CrossRef]
  34. Wang, H.; Turner, J.A. Modifying a Stainless Steel for PEMFC Bipolar Plates via Electrochemical Nitridation. Fuel Cells 2013, 13, 917–921. [Google Scholar] [CrossRef]
  35. Mani, S.P.; Anandan, C.; Rajendran, N. Formation of a protective nitride layer by electrochemical nitridation on 316L SS bipolar plates for a proton exchange membrane fuel cell (PEMFC). RSC Adv. 2015, 5, 64466–64470. [Google Scholar] [CrossRef]
  36. Xu, R.; Zhang, H.; Jin, X.; Zhang, N.; Li, M. Effect of potential on corrosion behavior and contact resistance of electrochemically nitrided 446 stainless steel in simulated cathode environment of proton exchange membrane fuel cell. J. Solid State Electrochem. 2025; in press. [Google Scholar] [CrossRef]
  37. Noh, J.; Laycock, N.; Gao, W.; Wells, D. Effects of nitric acid passivation on the pitting resistance of 316 stainless steel. Corros. Sci. 2000, 42, 2069–2084. [Google Scholar] [CrossRef]
  38. Wang, X.Y.; Wu, Y.S.; Zhang, L.; Yu, Z.Y. Atomic force microscopy and X-ray photoelectron spectroscopy study on the passive film for Type 316L stainless steel. Corrosion 2001, 57, 540–546. [Google Scholar] [CrossRef]
  39. O’Laoire, C.; Timmins, B.; Kremer, L.; Holmes, J.D.; Morris, M.A. Analysis of the Acid Passivation of Stainless Steel. Anal. Lett. 2006, 39, 2255–2271. [Google Scholar] [CrossRef]
  40. Li, J.; Wang, Q.; Yang, Y.; Wu, Z.; Tan, L.; Ren, Y.; Yang, K. Enhancing Pitting Corrosion Resistance of Severely Cold-Worked High Nitrogen Austenitic Stainless Steel by Nitric Acid Passivation. J. Electrochem. Soc. 2019, 166, C365–C374. [Google Scholar] [CrossRef]
  41. Wang, Z.; Di-Franco, F.; Seyeux, A.; Zanna, S.; Maurice, V.; Marcus, P. Passivation-Induced Physicochemical Alterations of the Native Surface Oxide Film on 316L Austenitic Stainless Steel. J. Electrochem. Soc. 2019, 166, C3376–C3388. [Google Scholar] [CrossRef]
  42. Wang, Z.C.; Paschalidou, E.M.; Seyeux, A.; Zanna, S.; Maurice, V.; Marcus, P. Mechanisms of Cr and Mo Enrichments in the Passive Oxide Film on 316L Austenitic Stainless Steel. Front. Mater. 2019, 6, 232. [Google Scholar] [CrossRef]
  43. Lynch, B.; Wang, Z.; Ma, L.; Paschalidou, E.-M.; Wiame, F.; Maurice, V.; Marcus, P. Passivation-Induced Cr and Mo Enrichments of 316L Stainless Steel Surfaces and Effects of Controlled Pre-Oxidation. J. Electrochem. Soc. 2020, 167, 141509. [Google Scholar] [CrossRef]
  44. Maurice, V.; Peng, H.; Klein, L.H.; Seyeux, A.; Zanna, S.; Marcus, P. Effects of molybdenum on the composition and nanoscale morphology of passivated austenitic stainless steel surfaces. Faraday Discuss. 2015, 180, 151–170. [Google Scholar] [CrossRef]
  45. Lee, S.-J.; Lai, J.-J. The effects of electropolishing (EP) process parameters on corrosion resistance of 316L stainless steel. J. Mater. Process. Technol. 2003, 140, 206–210. [Google Scholar] [CrossRef]
  46. Acquesta, A.; Monetta, T. Green Approach for Electropolishing Surface Treatments of Additive Manufactured Parts: A Comprehensive Review. Metals 2023, 13, 874. [Google Scholar] [CrossRef]
  47. Lebedeva, O.; Kultin, D.; Zakharov, A.; Kustov, L. Advantages of Electrochemical Polishing of Metals and Alloys in Ionic Liquids. Metals 2021, 11, 959. [Google Scholar] [CrossRef]
  48. Han, Y.; Mei, J.; Peng, Q.; Han, E.-H.; Ke, W. Effect of electropolishing on corrosion of Alloy 600 in high temperature water. Corros. Sci. 2015, 98, 72–80. [Google Scholar] [CrossRef]
  49. Xu, Y.; Mao, Y.; Ijaz, M.H.; Ibrahim, M.E.; Le, S.; Wang, F.; Jiang, J.; Chi, D.; An, M.; Song, S.; et al. Review—Principles and Applications of Electrochemical Polishing. J. Electrochem. Soc. 2024, 171, 093506. [Google Scholar] [CrossRef]
  50. Mu, J.; Sun, T.; Leung, C.L.A.; Oliveira, J.P.; Wu, Y.; Wang, H.; Wang, H. Application of electrochemical polishing in surface treatment of additively manufactured structures: A review. Prog. Mater. Sci. 2023, 136, 101109. [Google Scholar] [CrossRef]
  51. Ur Rahman, Z.; Deen, K.M.; Cano, L.; Haider, W. The effects of parametric changes in electropolishing process on surface properties of 316L stainless steel. Appl. Surf. Sci. 2017, 410, 432–444. [Google Scholar] [CrossRef]
  52. Łyczkowska-Widłak, E.; Lochyński, P.; Nawrat, G. Electrochemical Polishing of Austenitic Stainless Steels. Materials 2020, 13, 2557. [Google Scholar] [CrossRef] [PubMed]
  53. Suzuki, R.; Yokoyama, Y.; Shibano, T.; Sugiura, T.; Katori, N. Development of Electropolishing-Based Corrosion Resistance Technique for Ferritic Stainless Steel. SAE Int. J. Mater. Manuf. 2016, 9, 474–481. [Google Scholar] [CrossRef]
  54. Xu, R.; Jin, X.; Bi, H.; Zhang, Z.; Li, M. Effect of surface roughness on contact resistance and electrochemical corrosion behavior of 446 stainless steel in simulated anode environments for proton exchange membrane fuel cell. J. Solid State Electrochem. 2024, 28, 3087–3098. [Google Scholar] [CrossRef]
  55. Tan, Z.; Xu, R.; Bi, H.; Zhang, Z.; Li, M. Effects of potential on corrosion behavior and contact resistance of 446 stainless steel in simulated proton exchange membrane fuel cell cathode environment. J. Solid State Electrochem. 2023, 27, 1993–2003. [Google Scholar] [CrossRef]
  56. Chen, M.; Ding, J.C.; Kwon, S.-H.; Wang, Q.; Zhang, S. Corrosion resistance and conductivity of NbN-coated 316L stainless steel bipolar plates for proton exchange membrane fuel cells. Corros. Sci. 2022, 196, 110042. [Google Scholar] [CrossRef]
  57. Yan, P.; Ying, T.; Yang, Y.; Cao, F.; Li, Y.; Wang, J.; Zeng, X. Investigation of anodized Ta/Ag coating on magnesium bipolar plate for lightweight proton exchange membrane fuel cells. Corros. Sci. 2022, 197, 110086. [Google Scholar] [CrossRef]
  58. Inzelt, G.; Lewenstam, A.; Scholz, F. Handbook of Reference Electrodes; Springer: Heidelberg, Germany, 2013; pp. 112–118. [Google Scholar] [CrossRef]
  59. Wang, Y.; Northwood, D.O. Effects of O2 and H2 on the corrosion of SS316L metallic bipolar plate materials in simulated anode and cathode environments of PEM fuel cells. Electrochim. Acta 2007, 52, 6793–6798. [Google Scholar] [CrossRef]
  60. Hou, Z.; Xiu, S.; Sun, C.; Zou, X.; Yao, Y. Enhancing the surface integrity and SCC resistance of 304 austenitic stainless steel by pre-stress grinding. J. Mater. Res. Technol. 2023, 25, 2890–2902. [Google Scholar] [CrossRef]
  61. Yang, C.; Jiang, X.; Zhang, W.; Wang, X. Effect of surface nanocrystallization induced by mechanical grinding treatment on stress corrosion cracking behavior of 316 L austenitic stainless steel in boiling MgCl2 solution. Mater. Charact. 2024, 218, 114458. [Google Scholar] [CrossRef]
  62. Luo, H.; Dong, C.; Xiao, K.; Li, X. The passive behaviour of ferritic stainless steel containing alloyed tin in acidic media. RSC Adv. 2016, 6, 9940–9949. [Google Scholar] [CrossRef]
  63. Marcus, P.; Grimal, J.M. The anodic dissolution and passivation of NiCrFe alloys studied by ESCA. Corros. Sci. 1992, 33, 805–814. [Google Scholar] [CrossRef]
  64. Marcus, P.; Bussell, M.E. XPS study of the passive films formed on nitrogen-implanted austenitic stainless steels. Appl. Surf. Sci. 1992, 59, 7–21. [Google Scholar] [CrossRef]
  65. Lippitz, A.; Hübert, T. XPS investigations of chromium nitride thin films. Surf. Coat. Tech. 2005, 200, 250–253. [Google Scholar] [CrossRef]
  66. Zeng, H.; Yang, Y.; Zeng, M.; Li, M. Effect of dissolved oxygen on electrochemical corrosion behavior of 2205 duplex stainless steel in hot concentrated seawater. J. Mater. Sci. Technol. 2021, 66, 177–185. [Google Scholar] [CrossRef]
  67. Yang, Y.; Zeng, H.; Xin, S.; Hou, X.; Li, M. Electrochemical corrosion behavior of 2205 duplex stainless steel in hot concentrated seawater under vacuum conditions. Corros. Sci. 2020, 165, 108383. [Google Scholar] [CrossRef]
  68. Biesinger, M.C.; Payne, B.P.; Grosvenor, A.P.; Lau, L.W.M.; Gerson, A.R.; Smart, R.S.C. Resolving surface chemical states in XPS analysis of first row transition metals, oxides and hydroxides: Cr, Mn, Fe, Co and Ni. Appl. Surf. Sci. 2011, 257, 2717–2730. [Google Scholar] [CrossRef]
  69. Ma, J.; Zhang, B.; Fu, Y.; Hu, X.; Cao, X.; Pan, Z.; Wei, Y.; Luo, H.; Li, X. Effect of cold deformation on corrosion behavior of selective laser melted 316L stainless steel bipolar plates in a simulated environment for proton exchange membrane fuel cells. Corros. Sci. 2022, 201, 110257. [Google Scholar] [CrossRef]
  70. Kong, D.; Ni, X.; Dong, C.; Zhang, L.; Man, C.; Yao, J.; Xiao, K.; Li, X. Heat treatment effect on the microstructure and corrosion behavior of 316L stainless steel fabricated by selective laser melting for proton exchange membrane fuel cells. Electrochim. Acta 2018, 276, 293–303. [Google Scholar] [CrossRef]
  71. Olefjord, I.; Wegrelius, L. The influence of nitrogen on the passivation of stainless steels. Corros. Sci. 1996, 38, 1203–1220. [Google Scholar] [CrossRef]
  72. Chao, K.L.; Liao, H.Y.; Shyue, J.J.; Lian, S.S. Corrosion Behavior of High Nitrogen Nickel-Free Fe-16Cr-Mn-Mo-N Stainless Steels. Metall. Mater. Trans. B. 2014, 45, 381–391. [Google Scholar] [CrossRef]
  73. Patterson, T.A.; Carver, J.C.; Leyden, D.E.; Hercules, D.M. A surface study of cobalt-molybdena-alumina catalysts using x-ray photoelectron spectroscopy. J. Phys. Chem. 1976, 80, 1700–1708. [Google Scholar] [CrossRef]
  74. Fajardo, S.; Llorente, I.; Jiménez, J.A.; Bastidas, J.M.; Bastidas, D.M. Effect of Mn additions on the corrosion behaviour of TWIP Fe-Mn-Al-Si austenitic steel in chloride solution. Corros. Sci. 2019, 154, 246–253. [Google Scholar] [CrossRef]
  75. Graham, M.J.; Bardwell, J.A.; Sproule, G.I.; Mitchell, D.F.; MacDougall, B.R. The growth and stability of passive films. Corros. Sci. 1993, 35, 13–18. [Google Scholar] [CrossRef]
  76. Kocijan, A.; Donik, Č.; Jenko, M. Electrochemical and XPS studies of the passive film formed on stainless steels in borate buffer and chloride solutions. Corros. Sci. 2007, 49, 2083–2098. [Google Scholar] [CrossRef]
Figure 1. Variation in the ICR with pressure for the polished specimens before and after the electrochemical Cr-enrichment (EC) and/or electrochemical nitridation (EN) treatments for 5 to 120 min (reconstructed data for polished specimens from Ref. [54]; electrochemically nitrided specimens (120 min) from Ref. [36]).
Metals 15 00566 g001
Figure 2. Variation in the ICR with pressure for the specimens nitrided directly for 2 h and the Cr-enriched specimens nitrided for 0.5 h before and after 5 h of polarization at 0.6 or −0.1 VSCE in 0.5 mol L−1 H2SO4 + 2 ppm HF solutions bubbled with air or H2 at 80 °C, respectively.
Metals 15 00566 g002
Figure 3. Anodic polarization curves in 0.5 mol L−1 H2SO4 + 2 ppm HF solutions bubbled with air or H2 at 80 °C for the polished specimens before and after 2 h of electrochemical nitridation (EN) or electrochemical Cr-rich pretreatment (EC) and 0.5 h of EN. (Reconstructed data for polished specimen under H2 condition from Ref. [54]).
Metals 15 00566 g003
Figure 4. Anodic polarization curves in 0.5 mol L−1 H2SO4 + 2 ppm HF solution bubbled with H2 at 80 °C for the specimens nitrided for 0 to 30 min after the electrochemical Cr-rich pretreatment.
Metals 15 00566 g004
Figure 5. Potentiostatic polarization curves at –0.1 VSCE in the H2 environment (a) and 0.6 VSCE in the air environment (b) in 0.5 mol L−1 H2SO4 + 2 ppm HF solution at 80 °C for the polished specimens with 120 min of electrochemical nitridation (EN) or electrochemical Cr-rich pretreatment (EC) and 5 or 30 min of EN.
Metals 15 00566 g005
Figure 6. EIS spectra in 0.5 mol L−1 H2SO4 + 2 ppm HF solution bubbled with air or H2 at 80 °C for the polished specimens before and after 2 h of electrochemical nitriding (EN) or electrochemical Cr-rich pretreatment (EC) and 0.5 h of EN: (a) Nyquist plot; (b) Bode plot. (Reconstructed data for polished specimen under H2 condition from Ref. [54]).
Metals 15 00566 g006
Figure 7. SEM surface morphologies for the specimens with different treatments and tests: (a) mechanical polishing, (b) electrochemical Cr-rich treatment (EC), (c,d) EC + 5 and 30 min of electrochemical nitridation (EN), respectively, (e,f) EC + 0.5 h of EN + 5 h of polarization in solutions bubbled with H2 at −0.1 VSCE and with air at 0.6 VSCE, respectively, (g,h) 2 h of EN + 5 h of polarization in solutions bubbled with H2 at −0.1 VSCE and with air at 0.6 VSCE, respectively.
Metals 15 00566 g007
Figure 8. Detailed XPS spectra of (a) Cr 2p3/2, (b) Fe 2p3/2, (c) O 1s, (d) Mo 3d, and (e) N 1s/Mo 3p3/2 for the specimens with different treatments and tests, i.e., mechanical polishing, electrochemical Cr-rich treatment (EC), EC + 0.5 h of electrochemical nitridation (EN), EC + 0.5 h of EN + 5 h of polarization in solutions bubbled with H2 at −0.1 VSCE and with air at 0.6 VSCE.
Metals 15 00566 g008
Figure 9. The composition of oxidized species for the specimens with different treatments and tests including mechanical polishing, electrochemical Cr-rich treatment (EC), electrochemical Cr-rich treatment and 30 min of nitridation (EC + EN), and after EC + EN + 5 h of polarization at −1 and 0.6 VSCE in solutions bubbled with H2 or air.
Metals 15 00566 g009
Figure 10. The release amounts of Fe, Cr, and Mo in the solution after 5 h of polarization at −0.1 and 0.6 VSCE in solutions bubbled with H2 or air, respectively, for the polished specimens without and with electrochemical Cr-rich pretreatment (EC) and 30 min of electrochemical nitridation (EN).
Metals 15 00566 g010
Figure 11. Equivalent circuit models used to fit the EIS spectra of specimens: (a) for the polished specimen in the H2 environment; (b) for all specimens except the polished one in the H2 environment.
Metals 15 00566 g011
Table 1. Elemental composition of 446 stainless steel (wt.%).
CSiMnPSCuNiCrMoNFe
0.010.430.210.0230.0050.142.0827.383.670.017Bal.
Table 2. Experimental equipment and materials.
CategoryElectrochemical WorkstationChemical Reagent446 Stainless Steel SheetReference
Electrode
Model/TypePARSTAT
MC 1000
AR-232-01
SupplierPrinceton Applied Research (Oak Ridge, TN, USA)Sinopharm Chemical Reagent Co., Ltd. (Shanghai, China)Baoshan Iron & Steel Co., Ltd. (Shanghai, China)INESA Scientific Instrument Co., Ltd. (Shanghai, China)
Table 3. Electrochemical parameters extracted from the potentiodynamic polarization curves in Figure 3 and Figure 4.
SpecimenEcorr
(vs. SCE)
ipeak
(μA cm2)
i−0.1V
(μA cm2)
i0.6V
(μA cm2)
Polished, H2−0.268.145.288.20
Polished, Air−0.07--6.93
EN (2 h), H2−0.221.400.952.91
EN (2 h), Air−0.05--1.66
EC + EN (0.5 h), H2−0.11-0.071.59
EC + EN (0.5 h), Air0.09--1.18
EC + EN (0 min), H20.15--0.91
EC + EN (5 min), H20.11--1.18
EC + EN (10 min), H20.07--1.26
EC + EN (20 min), H20.03--1.42
Table 4. Electrochemical parameters extracted from the potentiostatic polarization curves in Figure 5.
Specimen (H2)i5h (μA cm2)Specimen (Air)i5h (μA cm2)
Polished−0.05Polished1.02
EN (120 min)−0.22EN (120 min)0.48
EC + EN (5 min)−0.40EC + EN (5 min)0.14
EC + EN (30 min)−0.39EC + EN (30 min)0.26
Table 5. Fitted results of the EIS spectra in Figure 6 for the polished specimens before and after 2 h of electrochemical nitriding (EN) or electrochemical Cr-rich pretreatment (EC) and 0.5 h of EN. (The data for the polished specimen under H2 conditions were extracted from Ref. [54]).
SpecimenRs
Ω cm2
Y0-dl
Ω−1 cm−2 sn
αdlRp or Rct
Ω cm2
Y0-f
Ω−1 cm−2 sn
αfRf
Ω cm2
χ2
EC + EN (0.5 h), Air2.081.01 × 10−40.927.79 × 105---7.33 × 10⁻³
EN (2 h), Air1.578.61 × 10−50.922.21 × 105---2.74 × 10⁻³
Polished, Air1.134.27 × 10−40.922.17 × 104---6.55 × 10⁻⁴
EC + EN (0.5 h), H21.411.11 × 10−40.918.12 × 104---2.81 × 10⁻³
EN (2 h), H21.189.25 × 10−50.922.15 × 104---1.58 × 10⁻³
Polished, H21.607.21 × 10−30.843.80 × 1031.85 × 10−40.893.12 × 1021.25 × 10−3
Disclaimer/Publisher’s Note: The statements, opinions and data contained in all publications are solely those of the individual author(s) and contributor(s) and not of MDPI and/or the editor(s). MDPI and/or the editor(s) disclaim responsibility for any injury to people or property resulting from any ideas, methods, instructions or products referred to in the content.

