Article

Physical Property Prediction of High-Temperature Nickel and Iron–Nickel Superalloys Using Direct and Inverse Composition Machine Learning Models

by
Jaka Fajar Fatriansyah
1,*,
Dzaky Iman Ajiputro
1,
Agrin Febrian Pradana
1,
Rio Sudwitama Persadanta Kaban
1,
Andreas Federico
1,
Muhammad Anis
1,
Dedi Priadi
1 and
Nicolas Gascoin
2
1
Department of Metallurgical and Materials Engineering, Faculty of Engineering, Universitas Indonesia, Depok 16424, West Java, Indonesia
2
INSA Centre Val de Loire, University of Orléans, PRISME, UR4229, F-18020 Bourges, France
*
Author to whom correspondence should be addressed.
Metals 2025, 15(5), 565; https://doi.org/10.3390/met15050565
Submission received: 2 April 2025 / Revised: 10 May 2025 / Accepted: 16 May 2025 / Published: 21 May 2025
(This article belongs to the Section Structural Integrity of Metals)

Abstract

Superalloys are a class of materials renowned for their exceptional ability to retain mechanical properties at elevated temperatures. Nickel superalloys, with a nickel content ranging from 38% to 76%, and iron–nickel superalloys (15–60% iron, 25–45% nickel) are extensively employed within the aviation industry due to their resilience in harsh operating environments. These components encounter extreme temperatures during operation, significantly impacting their tensile strength and melting point. Furthermore, high-speed rotation and abrasive conditions necessitate materials with superior hardness. Consequently, material modifications are crucial to ensure that gas turbine components meet their required properties. Machine learning (ML) and deep learning (DL) offer promising solutions for the design of materials with tailored tensile strength, hardness, and melting point properties. This study investigates the efficacy of direct and inverse machine learning models in predicting crucial material properties and composition, respectively. The model with the most favorable prediction accuracy is identified through the systematic variation of key parameters. The findings show that a fully connected feed-forward Artificial Neural Network (ANN) with three hidden layers using ReLU activation functions performs better than the other models. This capability is leveraged to modify the composition of INCONEL-718, successfully achieving significant enhancements in tensile strength (1592 MPa), hardness (152 HRB), and melting point (1665 °C).

1. Introduction

Superalloys have emerged as a critical material class, playing a pivotal role in various technological advancements. Within the aerospace field, superalloys have demonstrably contributed to significant improvements in aircraft performance. Over the past two decades, their implementation has resulted in reductions in jet fuel consumption of up to 15–20%. Additionally, superalloys have facilitated substantial increases in engine thrust (force) by up to 60%. Notably, advancements in superalloy technology have also led to enhancements in their maximum temperature resistance of up to 50% [1]. Despite these remarkable achievements, turbine components’ extreme operating conditions and environments continue to pose significant challenges. These harsh conditions can still lead to component failures, necessitating superalloys’ ongoing development and optimizations [2].
Jet engines operate under exceptionally demanding conditions, characterized by high pressures and temperatures exceeding 1300 °C. These extreme environments present a significant challenge for material selection, as many conventional materials lose their structural integrity at such elevated temperatures [1]. To ensure reliable operation, gas turbine engine components need a combination of superior mechanical properties, including strength and toughness. These properties are crucial in preventing catastrophic failures within the engine. Specifically, high tensile strength is paramount for resisting material deformation and potential fracture under high-temperature loads [3]. Furthermore, exceptional hardness is essential for enhancing wear resistance against erosion and particle impact within the turbine environment [4]. From a physical property’s perspective, a high melting point is critical to prevent softening or melting events caused by thermal-induced phase changes at elevated temperatures.
Recently, the utilization of superalloys has become appealing for discussion due to their characteristics making them suitable for use in gas turbine engines. Nickel superalloys and iron–nickel superalloys are the types of materials that are widely used in gas turbine engines for airplanes. Due to their high strength and corrosion properties, creep, and stress rupture resistance, nickel superalloys are the most widely used materials in extremely high-temperature applications (>800 °C) [5]. Meanwhile, iron–nickel superalloys are commonly used for components operated at lower temperatures (615–815 °C). However, this alloy also has low thermal expansion, which makes it suitable for use for turbine blades [1,6].
The utilization of the machine learning (ML) method in materials science has been used for several decades and has shown a positive impact on the development and discovery of new materials [7]. It has also been extensively used in the demanding aerospace sector when dealing with extreme temperature applications. The utilization of machine learning in data-based analysis has been helping researchers to optimize and accelerate the materials development process rather than the experimental method, which needs several years to be implemented [8]. Therefore, Ling et al., implemented this method, in particular for predicting nickel superalloys’ strength and creep rupture [9]. Furthermore, the hardness properties of materials must be a concern when selecting materials. Khatavkar et al. discussed the prediction of the Vickers hardness in nickel superalloys and cobalt by using high-level image processing techniques combined with machine learning with Gaussian Process Regression (GPR). Their research resulted in precise and applicative results, because the machine learning model had been trained with experimental data [10].
Therefore, this study will optimize the nickel superalloy and iron–nickel superalloy tensile strength, hardness properties, and melting point, according to their chemical composition. This study also conducts the reverse prediction of chemical composition based on the alloys’ tensile strength, hardness, and melting point. All data are generated from the National Institute for Materials Science (NIMS) database and are processed using machine learning methods. So far, despite the growing use of machine learning in materials selection, most studies have focused on predicting single material properties. The simultaneous prediction of multi-strength, hardness, and melting point—properties that are all essential in aerospace-grade superalloys—and optimizing these properties is very important. In addition, inverse model approaches, which are essential for alloy optimization, remain underexplored. The inverse model provides information about the specific compositions that correspond to predefined property requirements, thereby aligning with accelerated materials design. The unique value of our research is that it contributes a dual machine learning framework that combines forward and inverse models to predict and design superalloys with optimized tensile strength, hardness, and melting point performance. In addition, this study embeds feature importance analysis on the trained C2P models to determine which alloy elements significantly affect the target properties. This insight can be used to inform the inverse design engineer, thus prioritizing the most significant elements in the P2C model to achieve the desired properties. This data-driven composition tuning supports a closed-loop optimization strategy aligned with accelerated materials design.

2. Materials and Methods

Machine learning models predict the material properties by training the dataset according to the model that has been created [10]. Training data uses two parameters, which are the epoch and batch size. The epoch is the number of cycles the learning algorithm will employ on the entire dataset, while the batch size is the number of data samples that pass through the learning algorithm over a certain time. This process uses the Scikit-learn library to simplify the training of datasets [11]. Machine learning and artificial intelligence employ innovative approaches to data representation; this method involves learning through layered structures, where each layer represents a step in a multi-layered neural network. By mimicking the human brain’s neural networks, deep learning aims to achieve highly accurate model predictions.
This study investigates the optimization of mechanical and physical properties for nickel and iron–nickel superalloys using machine learning. The dataset was obtained from MatNavi NIMS, a globally recognized repository for experimental data which offers extensive information on various material properties including tensile strength, hardness, creep, creep rupture, fatigue density, toughness, and elasticity modulus, encompassing both ferrous and non-ferrous materials [11]. From this database, a total of 310 samples of nickel-based and 280 samples of iron–nickel-based superalloys were selected. Each data entry includes the chemical composition of 18 alloy elements and three target properties: the tensile strength, hardness, and melting point. Prior to training the model, the data entered a series of preprocessing steps to ensure consistency. These included the removal of incomplete or null entries, the normalization of numerical values, and the elimination of outliers that fell outside reasonable physical limits. The resulting dataset provided a clean, standardized base for the machine learning model.
In this work, the collected data underwent initial characterization through a statistical descriptive table. Descriptive statistical analysis was also performed to understand the distribution and variability of key features such as the chemical composition, tensile strength, hardness, and melting point. These steps ensured that the dataset was clean, consistent, and suitable for subsequent machine learning modeling.
Subsequently, the data were prepared for machine learning training using two approximation approaches: Composition-to-Properties (C2P) and Properties-to-Composition (P2C). Within the C2P framework, the model was trained with chemical composition data (input) to predict mechanical and physical properties such as the tensile strength, hardness, and melting point (output). Conversely, the P2C approach utilized tensile strength, hardness, and melting point data (input) to predict the corresponding chemical composition (output). The types of models used in this study were Artificial Neural Networks (ANN), K-Nearest Neighbor (KNN), and Support Vector Machine (SVM). KNN and SVM were chosen as representatives of simple models. The performances of those machine learning models were optimized by using grid search hyperparameter tuning. The tuning process was used to create a machine learning program that could create all possible combinations between each parameter.
In this study, a fully connected feed-forward artificial neural network (ANN) model was implemented. The ANN consists of an input layer corresponding to the number of input feature-compositions (18 for C2P and three for P2C), three hidden layers with 64, 128, and 64 neurons, respectively, and an output layer with either three property values (for C2P) or 18 compositional elements (for P2C). The ReLU (Rectified Linear Unit) function was used as the activation function in each hidden layer. The model network was trained using the Adam optimizer, with a learning rate of 0.001, batch size of 32, and 200 training epochs. The loss function used was the Mean Squared Error (MSE), and the model was built using TensorFlow and evaluated using five-fold cross-validation to ensure performance consistency and to reduce overfitting risks.
A bidirectional machine learning framework for predicting and designing superalloys based on composition and properties (as shown in Figure 1)—Composition-to-Properties (C2P) and Properties-to-Composition (P2C)—is the focus of this paper. The C2P model is used to predict mechanical and physical properties (tensile strength, hardness, melting point) from already known alloy compositions and serves not only as a predictive tool, but also as a basis for meaningfully understanding the correlation of each compositional element to the target properties. On the other hand, the P2C model serves as an inverse design model, where it predicts the combination of chemical compositions based on desired properties. This approach is essential for practical alloy development, where engineers start with performance requirements and look for compositions that satisfy them.
Furthermore, importantly, the feature importance is performed on the trained C2P model to identify which alloy elements most significantly impact properties, and these elements are then sought after in the inverse design step. For example, if Molybdenum (Mo) highly affects the tensile strength, its composition is explored more deeply during P2C prediction. This feedback approach creates a closed-loop workflow that imitates real-world materials design: forward learning enables understanding, while inverse learning enables discovery.

3. Results and Discussion

Table 1 presents statistical descriptions of the nickel and Table 2 corresponds to the iron–nickel superalloys dataset. These tables characterize the entire dataset, encompassing both nickel and iron–nickel superalloys. The analysis aimed to assess the data’s quality and suitability for further investigation. As shown in Table 1 and Table 2, the dataset included data for two material types tested across a broad temperature range, spanning from 25 °C (lowest) to 1000 °C (highest). The temperature range reflects the operational environment of materials, allowing for the exploration of their mechanical and physical properties under extreme conditions [12,13,14].
The analysis of the iron–nickel superalloy dataset revealed a tensile strength range of 70–1348 MPa, with an average value of 716.08 MPa and a standard deviation of 299.05 MPa. The high standard deviation for tensile strength indicated a distribution not closely centered around the average value. This variation could be attributed to the influence of test temperature on tensile strength. In contrast, the standard deviation for the hardness (12.11) and melting point (54.24) remained relatively low. The hardness of the nickel superalloys ranged from 73 to 112 HRB, and the melting point ranged from 1230 to 1413 °C. The iron–nickel superalloys exhibited a tensile strength range of 58–1100 MPa, with an average of 492.33 MPa and a high standard deviation of 215.71 MPa. The hardness of these superalloys ranged from 70 to 108 HRB, with an average of 86.97 HRB and a standard deviation of 11.03. The melting point for the iron–nickel superalloys ranged from 1230 to 1450 °C, with an average of 1324.86 °C and a standard deviation of 76.86 °C.

3.1. Performance of Composition-to-Properties (C2P) Predictions

To ensure a fair comparison, each model was trained with fixed parameters: a test size value set to 0.2 (20% of the data) and random state set to 42. The model was run five times to ensure the reliability of model. To ensure robustness and reduce overfitting, the model accuracy was evaluated by five-fold cross-validation. This study’s results indicate the mean R2 values across folds, offering a dependable assessment of generalization performance. Although metrics like The Root Mean Squared Error (RMSE) or mean absolute error (MAE) may provide additional insights, R2 was deemed adequate and comprehensible for evaluating the model efficacy in this context.
For the KNN model, the number of neighbors (K) served as the primary parameter. K represents the number of data points closest to the predicted point, and these nearest neighbors influence the prediction’s characteristics. To evaluate the KNN model, each property (tensile strength, hardness, and melting point) was predicted separately using various K values. The determination of the K parameter value was assisted by using fine-tuning to find out the optimal number of K that results in maximum accuracy. However, for the K-Nearest Neighbor (KNN) model, the distribution of tensile strength data points was not too close to the regression line, and there were several outlier data points generated from the KNN modeling process. Outliers were modeling results where the predicted data did not match or was not even close to the actual data. Outliers in tensile strength modeling were formed due to significant differences in testing temperatures, leading to less accurate data reading by the model. Therefore, the accuracy of the data reading (R2 score) given in Equation (1) by the model was less accurate, as shown in Table 3.
R 2 = 1 i y i f i 2 i y i y ¯ 2
where n is number of data points, y i is the value of the nth data point, f i is the predicted value, and y ¯ is the mean of the data.
Regarding the Support Vector Regression (SVR) model for C2P predictions, the RBF (Radial Basis Function) kernel was employed in this study. The RBF kernel incorporates several parameters, including C (regularization parameter) and gamma. To identify the optimal configuration, the study investigated five variations for each parameter: C (0.1, 1, 10, 100, 1000) and gamma (1, 0.1, 0.01, 0.001, 0.0001). All 25 possible parameter combinations were explored to determine the configuration that yielded the most accurate predictions model. Fine-tuned hyperparameter selection was also used to shorten the trial-and-error process, where the program provided optimal hyperparameter results from the trial-and-error process performed by the model algorithm. The limitation of Support Vector Regression (SVR) is that this model exhibited the lowest accuracy value. This is attributed to the disparate and wide-ranging composition data, which impacted the prediction of material composition, as shown in Table 3. Lastly, the ANN model employed various hyperparameters, including the batch size, epoch, learning rate, activation function, optimizer, and the structure of the network (input layer, hidden layers, and output layer). To optimize the model performance, this study evaluated the ANN with different hyperparameter configurations. Then, all C2P prediction models were compared to determine the most optimal model to predict the mechanical and physical properties of the nickel superalloy and iron–nickel superalloy. According to the prediction that was made, the ANN model had the most accurate result compared to the two other models. This was due to the complexity of the data used in the modeling, because the ANN model was more optimal for those types of data.

3.2. Performance of Properties-to-Composition (P2C) Predictions

The KNN model, the same as for C2P, used K as the main parameter. K was determined by using fine-tuning similar to that used for the SVR model. This could save the modeling time required to obtain the most optimal model with the best accuracy. In predicting the nickel superalloy, the main elements of the nickel superalloy showed a better accuracy value than the SVR model. The accuracy value was more than 0.90, which meant that the model had high accuracy, similar to the actual composition data.
The SVR model has been developed according to a method similar to the C2P model by implementing the kernel function. In this study, the type of kernel function was RBF. The kernel function that was used involved several parameters, which were C and varied gamma. The study tried to combine all existing parameters until the most optimal combined parameters result in the most accurate model was obtained by separating the model for each predicted composition. This model used fine-tuning to determine the most optimal parameter. This library worked automatically to find the parameters with the best accuracy for saving time.
The ANN model used several parameters, similar to C2P predictions. The parameters used in P2C predictions adjusted the feature dimension and label used. Besides this, the input and output layers also adjusted the properties and composition. The used input had six characteristics and the output had eighteen compositions. The order of the hidden layers were also different according to the input and output layer changes from the smallest dimension to the biggest dimension. According to the prediction that was made, the ANN model had the most accurate result, rather than the two other models, as shown in Table 4.

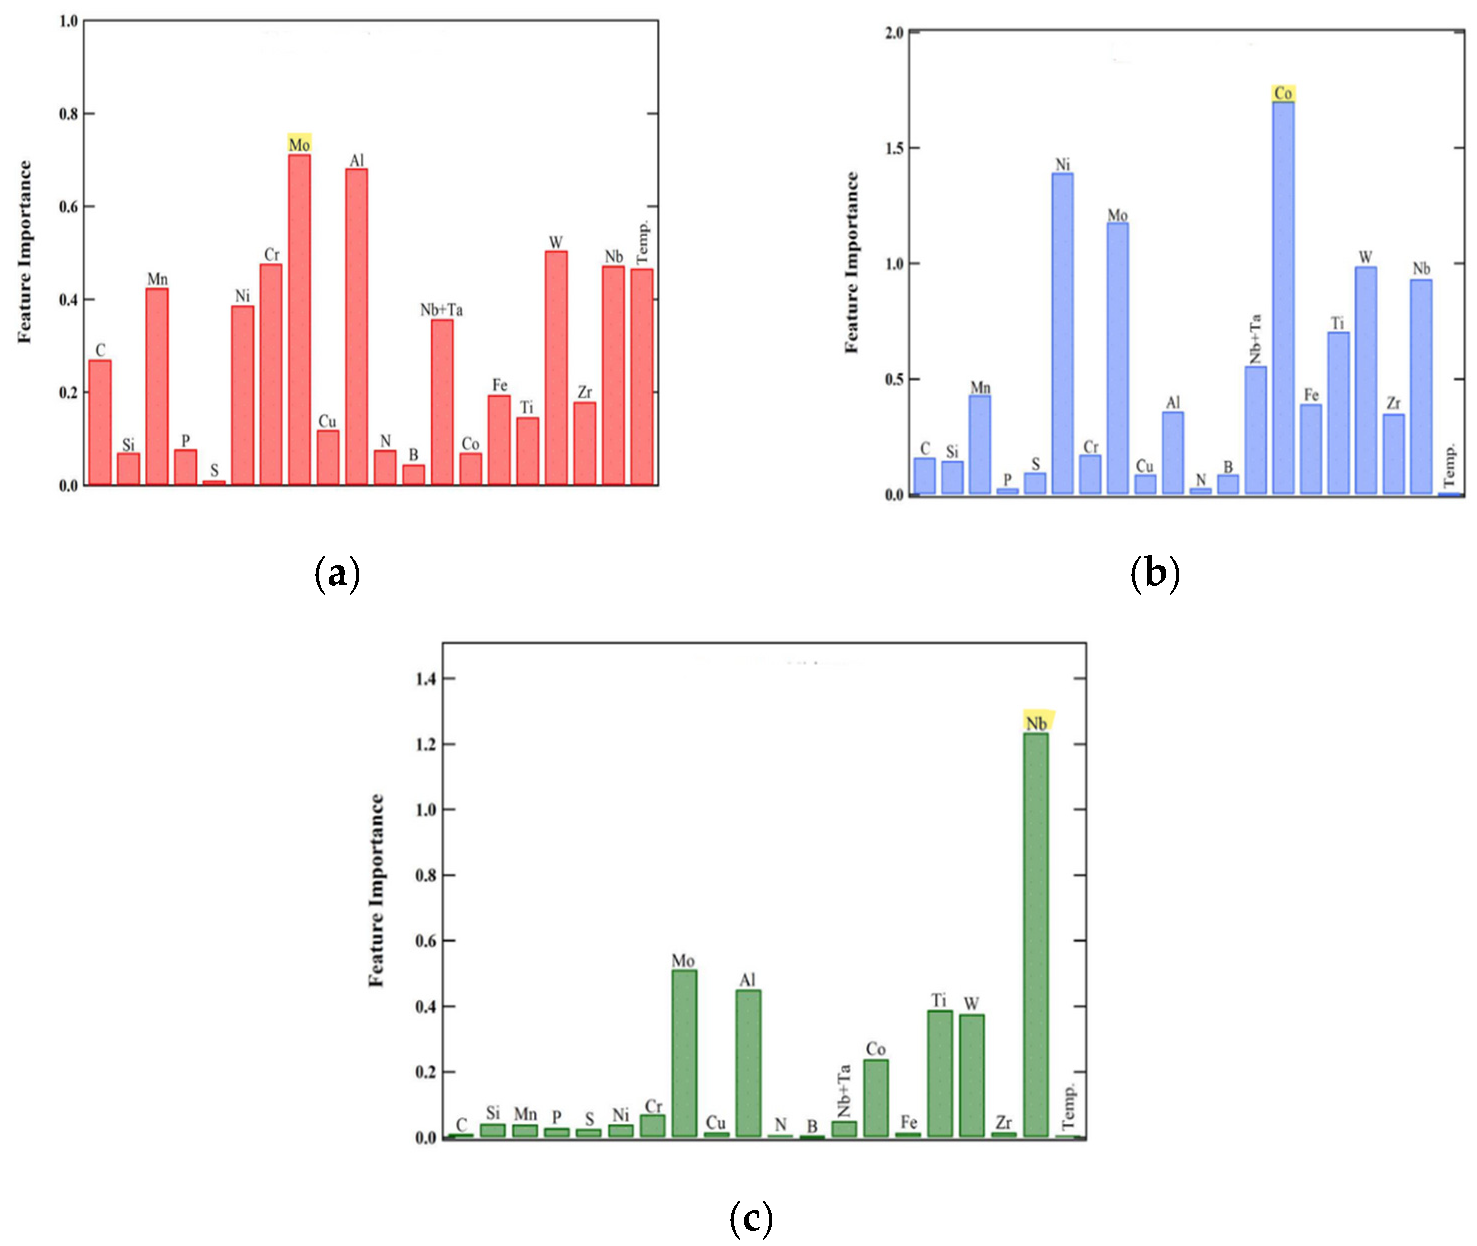
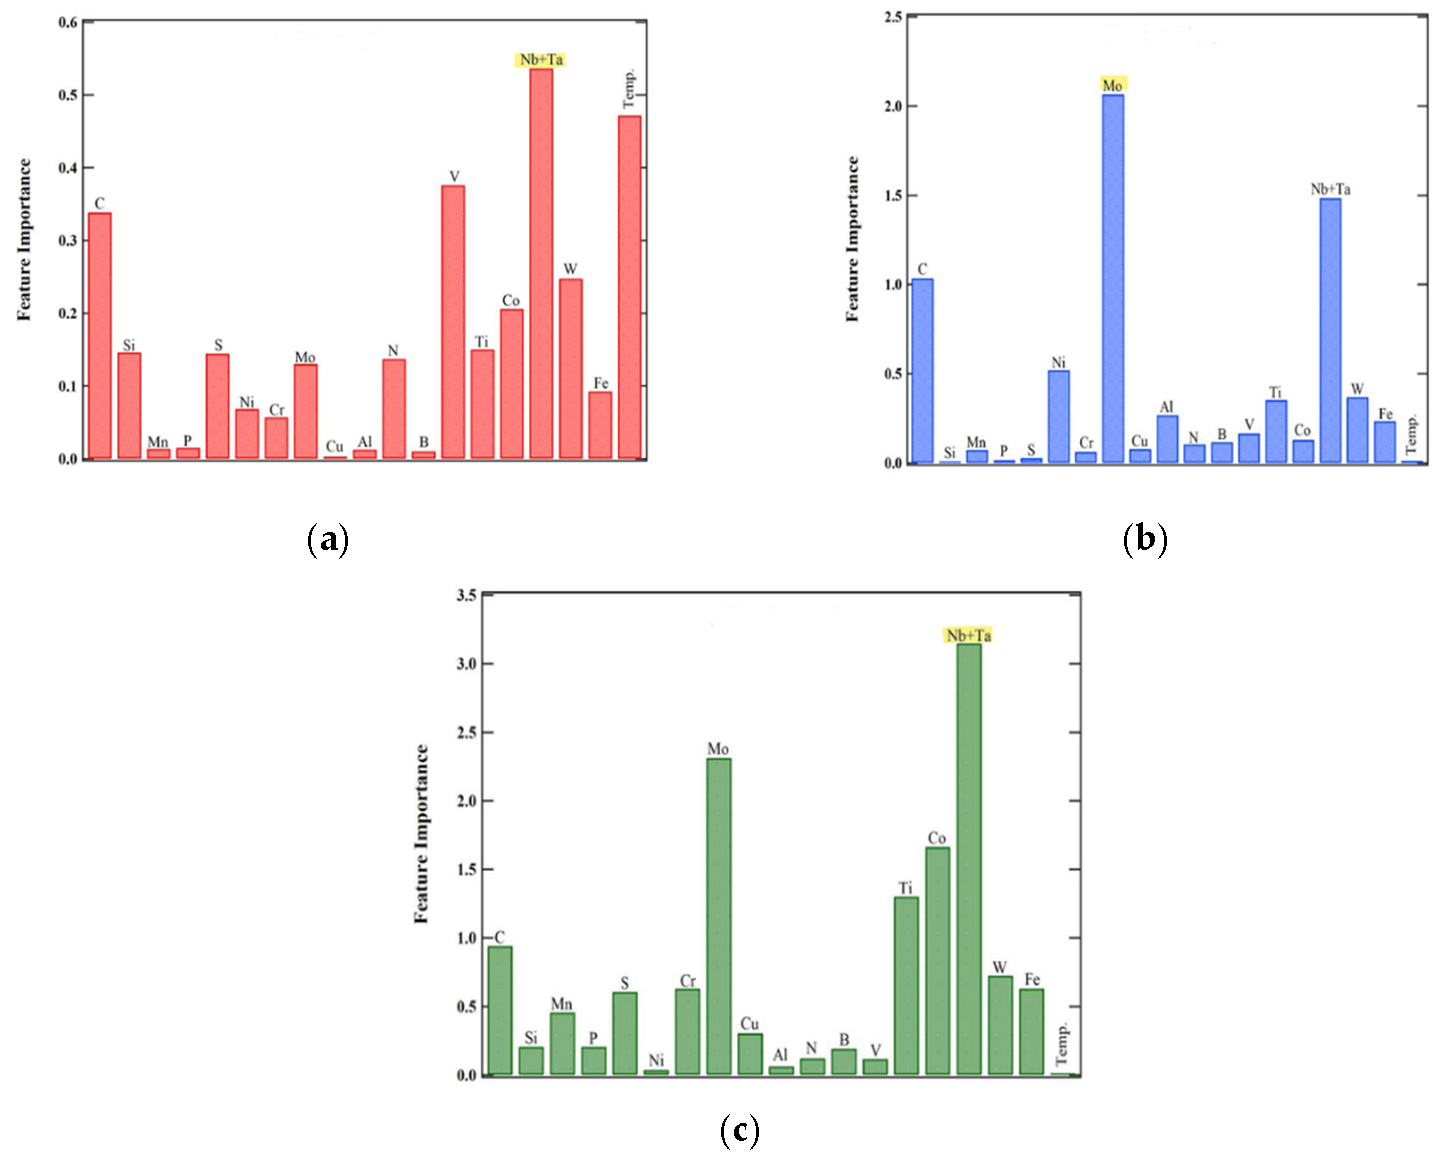
3.3. Feature Importance

In this study, the feature importance technique was used to determine the contribution of each input feature toward the output generated by the machine learning model to verify the prediction results on the correlation matrix. Feature importance was implemented toward three outputs of the physical and mechanical properties of the nickel superalloy and iron–nickel superalloy to determine the contribution level of each feature toward each property [15,16]. Higher feature importance values indicate that the feature significantly influences the properties of the materials.
According to the results, molybdenum (Mo) has the greatest feature importance for tensile strength, cobalt (Co) for hardness properties, and niobium (Nb) for the melting point. Mo could initiate solid solution strengthening for the gamma prime phase as a precipitate that increases the strength of the alloy [16,17]. Co has a role in reducing the solubility of aluminium (Al) and titanium (Ti), as some of it precipitates on the gamma phase to increase the alloy’s hardness [18]. Additionally, Nb has a role in assisting in the formation of NbC carbide, which has an extreme melting point (3490 °C) that can help to increase the melting point of the nickel superalloy [19]. In addition, the iron–nickel superalloy that results in the highest feature importance is Nb + Ta and Mo. The addition of Nb + Ta resulted in good improvement in the strength of the alloy by creating the carbide. Besides this, the carbide can increase resistance to high temperatures.
However, Nb + Ta is less effective, because of the difficulties in separating the alloy’s elements. The addition of a grain refiner or hardener could be used [20,21]; however, Nb and Ta are not commonly used as alloy elements. Therefore, in this study, vanadium was used to increase the tensile strength of the iron–nickel superalloy. Meanwhile, Nb + Ta was still used to scrutinize the correlation with the melting point of the iron–nickel superalloy. Another element, Molybdenum (Mo), increases the mechanical properties of iron–nickel superalloys using the solid solution-strengthening mechanism on the gamma and gamma prime phase [22]. Moreover, Molybdenum (Mo) is one of the carbide formers in iron–nickel superalloys, which can help control grain refinement when the superalloy is in high-temperature conditions [22]. Figure 2 and Figure 3 shows the feature importance diagram for all the properties of both the nickel superalloy and iron–nickel superalloy.

3.4. Study Case

In this study, a study case has been conducted not only to create forward-design modeling, but also to create inverse-design modeling. The modeling process utilized the predictive results of the physical and mechanical properties from forward-design modeling as an input to conduct inverse-design modeling in the form of chemical composition in inverse-design. This method was done to ensure and obtain the most optimal and accurate prediction result according to the desired target. The purpose of this study is to increase the physical and mechanical properties of superalloys.
According to the prediction result of the machine learning models, the ANN model is the chosen model for predicting the physical and mechanical properties of the nickel superalloy and iron–nickel superalloy. The prediction is carried out by modifying the input composition according to the most influential feature importance result. In this study, the study case was conducted toward INCONEL-718 materials, and the properties such as the tensile strength, hardness, and melting point were improved. These materials are commonly applied on gas turbine engines or airplanes. Hence, this study was carried out to modify the chemical composition of these materials and improve these properties to increase the resistance when operated in extreme conditions.
The results show the prediction of the tensile strength properties of INC-718, with the composition modification based on feature importance. From the top five best feature importance data points, three different composition modification experiments were conducted, including Mo, Al, and W. From the results of nine predictions, the best tensile strength value increased to 1592 MPa with the addition of 9 wt.% Mo. According to the literature review that was conducted, the addition of Mo can trigger a solid solution-strengthening mechanism in the gamma prime phase to increase the strength of the material. In addition to tensile strength, predictions were also made to increase the hardness of INC-718 with the modification of three different compositions, including Co, Nb, and Mo. Based on the prediction results, it was found that the addition of 3 wt.% Nb can increase the hardness of INC-718 to 152 HRB.
The present study serves as a computational design framework, and the optimized INCONEL-718 compositions generated from the model predictions remain empirically unvalidated. The anticipated enhancements in tensile strength, hardness, and melting point are therefore conjectural at this juncture. Subsequent research will concentrate on the experimental synthesis and evaluation of the anticipated compositions to validate the accuracy and practical utility of the model results. These initiatives are presently being developed in conjunction with experimental laboratories.

4. Conclusions

Based on the research conducted and the discussions held, this study investigated the predictions of the physical and mechanical properties of nickel and iron–nickel-based superalloys for demanding aerospace applications facing extremely high temperature conditions. The program employed utilizes a machine learning model that aims to shorten the time and costs incurred in the traditional trial-and-error process commonly used in the experimental process to find the right composition to improve these properties.
Among the investigated models, the Artificial Neural Network (ANN) achieved the highest average prediction accuracy, reaching a value of 0.9, which signifies a close approximation to perfect prediction. This superior performance of the ANN model can be attributed to its ability to extract and utilize key information from large datasets during the prediction process. This capability is advantageous compared to the other models employed in this study.
The optimized ANN model demonstrates its applicability in predicting the physical and mechanical properties of superalloys. The model’s effectiveness was further validated by its successful application in improving the properties of INCONEL-718. Notably, the selection of elements for modification was guided by the model’s feature importance analysis.
The addition of 9 wt.% molybdenum (Mo) resulted in a significant increase in the tensile strength of INCONEL-718 to 1592 MPa. Similarly, the inclusion of 3 wt.% niobium (Nb) effectively enhanced the hardness of INCONEL-718 to 152 HRB. Furthermore, the addition of 15 wt.% titanium (Ti) successfully elevated the melting point of INCONEL-718 to 1665 °C.

Author Contributions

Conceptualization, J.F.F.; Methodology, J.F.F., D.I.A.; Software, D.I.A., A.F.P., A.F.; Validation, D.I.A.; Formal analysis, D.I.A., A.F.; Investigation, D.I.A.; Resources, J.F.F., A.F.P., M.A., D.P., N.G.; Data curation, D.I.A., R.S.P.K.; Writing—original draft preparation, J.F.F., D.I.A., R.S.P.K.; Writing—review and editing, J.F.F., D.I.A., R.S.P.K., A.F.P., N.G.; Visualization, A.F.P., R.S.P.K.; Supervision, J.F.F., M.A., D.P., N.G.; Project administration, J.F.F., A.F.P.; Funding acquisition, J.F.F. All authors have read and agreed to the published version of the manuscript.

Funding

This research is funded by Directorate of Research and Development, Universitas Indonesia under Hibah PUTI 2024 (Grant No. NKB-504/UN2.RST/HKP.05.00/2024).

Data Availability Statement

The raw data supporting the conclusions of this article will be made available by the authors on request.

Conflicts of Interest

The authors declare no conflicts of interest.

References

  1. Mouritz, A.P. Introduction to Aerospace Materials; Woodhead Publishing: Sawston, UK, 2012. [Google Scholar]
  2. Swain, B.; Mallick, P.; Patel, S.; Roshan, R.; Mohapatra, S.S.; Bhuyan, S.; Priyadarshini, M.; Behera, B.; Samal, S.; Behera, A. Failure analysis and materials development of gas turbine blades. Mater. Today Proc. 2020, 33, 5143–5146. [Google Scholar] [CrossRef]
  3. Yang, G.X.; Xu, Y.F.; Jiang, L.; Liang, S.H. High temperature tensile properties and fracture behavior of cast nickel-base K445 superalloy. Prog. Nat. Sci. Mater. Int. 2011, 21, 418–425. [Google Scholar] [CrossRef]
  4. Faria, A.C.L.; Benassi, U.M.; Rodrigues, R.C.S.; Ribeiro, R.F.; de Mattos, M.d.G.C. Analysis of the relationship between the surface hardness and Wear resistance of indirect composites used as veneer materials. Braz. Dent. J. 2007, 18, 60–64. [Google Scholar] [CrossRef] [PubMed]
  5. Donachie, M.J.; Donachie, S.J. Superalloys: A Technical Guide, 2nd ed.; ASM International: Detroit, MI, USA, 2022; Available online: https://www.google.com/books?hl=en&lr=&id=vjCJ5pI1QpkC&oi=fnd&pg=PR1&dq=M.+J.+Donachie+and+S.+J.+Donachie,+Superalloys:+A+Technical+Guide,+2nd+ed.+ASM+International,+2002.&ots=LKiZHfm1V6&sig=kTgRpSTRiRbKDp8EGJB9g92vop8 (accessed on 27 November 2022).
  6. Ganji, D.K.; Rajyalakshmi, G. Influence of Alloying Compositions on the Properties of Nickel-Based Superalloys: A Review. In Recent Advances in Mechanical Engineering Select Proceedings of NCAME 2019; Springer: Berlin/Heidelberg, Germany, 2020; pp. 537–555. [Google Scholar] [CrossRef]
  7. Liu, Y.; Zhao, T.; Ju, W.; Shi, S. Materials discovery and design using machine learning. J. Mater. 2017, 3, 159–177. [Google Scholar] [CrossRef]
  8. Zhou, T.; Song, Z.; Sundmacher, K. Big data creates new opportunities for materials research: A review on methods and applications of machine learning for materials design. Engineering 2019, 5, 1017–1026. [Google Scholar] [CrossRef]
  9. Ling, J.; Antono, E.; Bajaj, S.; Paradiso, S.; Hutchinson, M.; Meredig, B.; Gibbons, B.M. Machine Learning for Alloy Composition and Process Optimization. In Proceedings of the ASME Turbo Expo, Oslo, Norway, 11–15 June 2018; Volume 6. [Google Scholar] [CrossRef]
  10. Khatavkar, N.; Swetlana, S.; Singh, A.K. Accelerated prediction of Vickers hardness of Co- and Ni-based superalloys from microstructure and composition using advanced image processing techniques and machine learning. Acta Mater 2020, 196, 295–303. [Google Scholar] [CrossRef]
  11. Pedregosa, F.; Varoquaux, G.; Gramfort, A.; Michel, V.; Thirion, B.; Grisel, O.; Blondel, M.; Prettenhofer, P.; Weiss, R.; Dubourg, V.; et al. Scikit-learn: Machine learning in Python. J. Mach. Learn. Res. 2011, 12, 2825–2830. [Google Scholar]
  12. Fatriansyah, J.F.; Matari, T.; Harjanto, S. The preparation of activated carbon from coconut shell charcoal by novel mechano-chemical activation. In Materials Science Forum; Trans Tech Publications Ltd.: Wollerau, Switzerland, 2018; Volume 929, pp. 50–55. [Google Scholar]
  13. Bai, G.; Li, J.; Hu, R.; Tang, Z.; Xue, X.; Fu, H. Effect of temperature on tensile behavior of Ni–Cr–W based superalloy. Mater. Sci. Eng. A 2011, 528, 1974–1978. [Google Scholar] [CrossRef]
  14. Dhaneswara, D.; Fatriansyah, J.F.; Mahagnyana, A.B.; Delayori, F.; Putranto, D.A.; Anwar, S.U.A.A. The Role of Modification SBA-15 Mesoporous Silica with CPTMS in Cd Adsorptions. In IOP Conference Series: Materials Science and Engineering; IOP Publishing: Bristol, UK, 2018; Volume 299, p. 012063. [Google Scholar]
  15. Singh Nain, S.; Sai, R.; Sihag, P.; Vambol, S.; Vambol, V. Use of machine learning algorithm for the better prediction of SR peculiarities of WEDM of Nimonic-90 superalloy. Arch. Mater. Sci. Eng. 2019, 95, 12–19. [Google Scholar] [CrossRef]
  16. Caldwell, E.C.; Fela, F.J.; Fuchs, G.E. The segregation of elements in high-refractory-content single-crystal nickel-based superalloys. JOM 2004, 56, 44–48. [Google Scholar] [CrossRef]
  17. Liang, Z.; Paul, J.D.H.; Stark, A.; Bezold, A.; Neumeier, S.; Göken, M.; Pyczak, F. High-Temperature CoNi-Based Superalloys Strengthened by γ′-(Ni,Co)3(Cr,Al,Ti,X): The Effect of Refractory Elements. Metall. Mater. Trans. A 2022, 54, 1620–1634. [Google Scholar] [CrossRef]
  18. Retima, M.; Bouyegh, S.; Chadli, H. Effect of the heat treatment on the microstructural evolution of the nickel based superalloy. Metalurgija 2011, 17, 71–77. [Google Scholar]
  19. Niobium(IV) Carbide|AMERICAN ELEMENTS®. Available online: https://www.americanelements.com/niobium-iv-carbide-12069-94-2 (accessed on 9 June 2023).
  20. Smith, G.D.; Patel, S.J. The role of niobium in wrought precipitation-hardened nickel-base alloys. Superalloys 2005, 718, 135–154. [Google Scholar]
  21. Niobium Tantalum Alloy|AMERICAN ELEMENTS®. Available online: https://www.americanelements.com/niobium-tantalum-alloy (accessed on 8 June 2023).
  22. Liu, L.; Huang, T.; Xiong, Y.; Yang, A.; Zhao, Z.; Zhang, R.; Li, J. Grain refinement of superalloy K4169 by addition of refiners: Cast structure and refinement mechanisms. Mater. Sci. Eng. A 2005, 394, 1–8. [Google Scholar] [CrossRef]
Figure 1. Bidirectional machine learning framework for predicting and designing superalloys based on composition and properties.
Metals 15 00565 g001
Figure 2. Feature importance of nickel superalloy: (a) Tensile strength; (b) Hardness; (c) Tensile Melting Point. The highlights show the most important feature.
Metals 15 00565 g002
Figure 3. Feature importance of iron–nickel Superalloy: (a) Tensile strength; (b) Hardness; (c) Tensile Melting Point. The highlights show the most important feature.
Metals 15 00565 g003
Table 1. Dataset characteristics of nickel superalloy.
Nickel Superalloy
FeatureUnitMeanMinMaxStd. Dev
Cwt.%0.080.030.150.03
Siwt.%0.160.010.490.13
Mnwt.%0.1600.490.17
Pwt.%000.010
Swt.%0.0100.020
Niwt.%64.2946.975.6310.36
Crwt.%16.5212.221.42.57
Mowt.%3.22092.77
Cuwt.%0.0200.160.04
Alwt.%2.2906.32.11
Nwt.%0.0200.280.06
Bwt.%0.0100.020
Nb + Tawt.%0.6702.690.92
Cowt.%7.68028.889.98
Fewt.%03.0209.263.47
Tiwt.%1.640.013.471.25
Wwt.%0.1902.610.55
Zrwt.%0.0200.150.04
Nbwt.%0.0400.970.19
Test Temperature°C586.65251000303.79
Tensile StrengthMPa716.08701348299.05
HardnessHRB101.017311212.11
Melting Point°C1341.431230141354.24
Elongation%29.45012728.28
Reduction of Area%35.3119927.14
0.2% Proof StressMPa471.0638878253.12
Table 2. Dataset characteristics of iron–nickel superalloy.
Iron–Nickel Superalloy
FeatureUnitMeanMinMaxStd. Dev
Cwt.%0.120.020.430.12
Siwt.%0.560.140.940.18
Mnwt.%1.280.831.910.28
Pwt.%0.010.010.020
Swt.%0.0100.020
Niwt.%27.3919.7334.455.77
Crwt.%19.240.8821.524.15
Mowt.%1.3704.261.59
Cuwt.%0.0900.340.1
Alwt.%0.430.0150.95
Nwt.%0.050.010.190.06
Bwt.%0.0200.50.09
Vwt.%0.0300.320.09
Tiwt.%0.4502.160.61
Cowt.%7.15020.19.36
Nb + Tawt.%0.7704.481.38
Wwt.%1.104.231.56
Fewt.%39.9324.2264.749.96
Test Temperaturewt.%493.53251000289.99
Tensile Strengthwt.%492.33581100215.71
Hardnesswt.%86.977010811.03
Melting Pointwt.%1324.861230145076.86
Elongationwt.%45.131012923.15
Reduction of Areawt.%53.04139720.72
0.2% Proof Stresswt.%244.1735812155
Table 3. The five-fold average of the R2 score comparison of all C2P model results.
Nickel Superalloy
PropertiesANNKNNSVR
Tensile Strength0.91 ± 0.040.81 ± 0.020.82 ± 0.01
Hardness0.94 ± 0.020.94 ± 0.040.90 ± 0.01
Melting Point0.94 ± 0.030.92 ± 0.030.91 ± 0.03
Iron–nickel Superalloy
PropertiesANNKNNSVR
Tensile Strength0.91 ± 0.060.72 ± 0.040.81 ± 0.03
Hardness0.92 ± 0.030.94 ± 0.020.9 ± 0.03
Melting Point0.91 ± 0.080.97 ± 0.010.9 ± 0.03
Table 4. The five-fold average of R2 score comparison of all P2C model results.
CompositionModel
ANNKNNSVR
Nickel Superalloy
C0.82 ± 0.070.75 ± 0.040.70 ± 0.01
Si0.71 ± 0.080.52 ± 0.040.68 ± 0.01
Mn0.88 ± 0.060.87 ± 0.020.91 ± 0.03
P0.72 ± 0.090.65 ± 0.020.65 ± 0.02
Ni0.95 ± 0.030.95 ± 0.030.91 ± 0.02
Cr0.91 ± 0.040.87 ± 0.040.82 ± 0.01
Mo0.95 ± 0.080.95 ± 0.020.93 ± 0.01
Cu0.53 ± 0.070.51 ± 0.010.44 ± 0.01
Al0.94 ± 0.090.95 ± 0.020.91 ± 0.02
N0.81 ± 0.090.97 ± 0.010.67 ± 0.02
B0.71 ± 0.070.65 ± 0.020.66 ± 0.02
Nb + Ta0.94 ± 0.050.95 ± 0.010.92 ± 0.02
Co0.96 ± 0.030.94 ± 0.010.91 ± 0.02
Fe0.93 ± 0.030.94 ± 0.020.91 ± 0.02
Ti0.94 ± 0.030.9389 ± 0.020.9658 ± 0.02
W0.96 ± 0.020.8255 ± 0.030.9345 ± 0.02
Zr0.91 ± 0.040.8799 ± 0.050.887 ± 0.06
Nb0.95 ± 0.030.95 ± 0.030.9235 ± 0.01
Iron–nickel Superalloy
C0.974 ± 0.010.96 ± 0.010.90 ± 0.04
Si0.80 ± 0.060.70 ± 0.190.72 ± 0.11
Mn0.74 ± 0.070.72 ± 0.100.74 ± 0.09
P0.30 ± 0.190.3119 ± 0.230.35 ± 0.12
S0.34 ± 0.240.52 ± 0.120.42 ± 0.14
Ni0.94 ± 0.010.95 ± 0.010.91 ± 0.01
Cr0.82 ± 0.100.71 ± 0.090.41 ± 0.05
Mo0.96 ± 0.010.94 ± 0.010.91 ± 0.01
Cu0.55 ± 0.230.61 ± 0.220.61 ± 0.12
Al0.25 ± 0.120.26 ± 0.230.43 ± 0.09
N0.92 ± 0.030.91 ± 0.010.91 ± 0.03
Nb + Ta0.97 ± 0.010.96 ± 0.010.91 ± 0.04
Co0.95 ± 0.020.96 ± 0.010.92 ± 0.04
Fe0.91 ± 0.020.91 ± 0.010.85 ± 0.09
Ti0.95 ± 0.020.95 ± 0.010.92 ± 0.03
W0.95 ± 0.030.94 ± 0.010.91 ± 0.03
V0.93 ± 0.020.94 ± 0.020.93 ± 0.02
Disclaimer/Publisher’s Note: The statements, opinions and data contained in all publications are solely those of the individual author(s) and contributor(s) and not of MDPI and/or the editor(s). MDPI and/or the editor(s) disclaim responsibility for any injury to people or property resulting from any ideas, methods, instructions or products referred to in the content.

