Article

Crystal Plasticity Finite Element Simulation of Tensile Fracture of 316L Stainless Steel Produced by Selective Laser Melting

by
Guowei Zeng
1,
Ziyang Huang
1,
Bei Deng
1 and
Rui Ge
2,*
1
Hubei Province Key Laboratory of Systems Science in Metallurgical Process, Wuhan University of Science and Technology, Wuhan 430081, China
2
State Key Laboratory of Advanced Refractory Materials (Wuhan), Wuhan University of Science and Technology, Wuhan 430081, China
*
Author to whom correspondence should be addressed.
Metals 2025, 15(5), 567; https://doi.org/10.3390/met15050567
Submission received: 23 April 2025 / Revised: 18 May 2025 / Accepted: 18 May 2025 / Published: 21 May 2025
(This article belongs to the Special Issue Multi-scale Simulation of Metallic Materials (2nd Edition))

Abstract

Selective Laser Melting (SLM) of 316L stainless steel exhibits great potential prospects for engineering applications due to its high strength, high forming freedom, and low material waste. However, due to the unique processing technology of additive manufacturing, challenges related to the microstructure and differences in the mechanical properties of the formed parts are inevitable. To investigate the influence of building direction and grain boundary strength on the fracture parameters of SLM 316L stainless steel, electron backscatter diffraction (EBSD) experiments were conducted to characterize the microstructure of SLM 316L stainless-steel specimens. A representative volume element (RVE) model reflecting the microstructure of SLM 316L stainless steel was established based on a combination of the crystal plastic finite element method (CPFEM) and UMAT subroutine technology. The crystal plasticity parameters were determined by comparing the results of tensile tests. Cohesive elements were employed and inserted at the grain boundaries of the polycrystalline RVE to simulate the intergranular fracture behavior of SLM 316L stainless steel under uniaxial tensile loading. The damage and fracture mechanisms of the material at the microscale were analyzed. The simulated tensile stress–strain curves were in good agreement with the experimental results; hence, the combined CPFEM model is suitable for characterizing the mechanical response and fracture behavior of the SLM 316L stainless steel. The results revealed that cracks initiate at stress concentration sites and propagate along grain boundaries with increasing external load, ultimately leading to rupture. Additionally, the building direction influences the location of microcracks and their propagation significantly.

1. Introduction

Additive manufacturing presents promising development prospects owing to its distinct advantages: the rapid fabrication of complex structural components, seamless integration of design and manufacturing processes, customization capabilities for individual components, and precise control over localized component properties. Among additive manufacturing technologies, Selective Laser Melting (SLM) stands out for its ability to produce components with superior precision and quality. SLM 316L stainless steel not only exhibits high strength, exceptional forming freedom, and minimized raw material waste, but also demonstrates excellent toughness and superior corrosion resistance. While maintaining mechanical performance comparable to conventionally produced alternatives, it offers significantly reduced costs, thereby facilitating its widespread adoption across aerospace, shipbuilding, medical device manufacturing, and various other industrial sectors [1,2,3].
In additive manufacturing processes, microstructural variations emerge in components compared to traditional castings due to process parameters, operational procedures, and other influencing factors. These variations manifest as distinctive grain orientations, heterogeneous grain sizes, and defects such as porosity and inclusions. Such microstructural differences directly influence the mechanical behavior of components and represent the primary constraints limiting the broader implementation of additive manufacturing technologies. Consequently, extensive research efforts have focused on elucidating the relationships between process parameters, resultant microstructural characteristics, and mechanical properties through systematic experimental investigations. Song et al. [4] evaluated five distinct scanning strategies to establish correlations between the microstructural features, crystallographic morphology, and mechanical properties of SLM 316L stainless steel. Their findings revealed that scanning strategies exert significant influence on microstructural development, grain growth behavior, grain size distribution, and consequent mechanical properties. The implementation of specific scanning methodologies promotes the formation of equiaxed grain structures, thereby enhancing both tensile strength and ductility in SLM 316L stainless-steel components. Jaskari et al. [5] conducted comprehensive analyses on the microstructure, defect characteristics, and mechanical properties of SLM 316L stainless-steel specimens fabricated using varying volume energy densities. Their research demonstrated that low-energy-density processing conditions generate increased porosity and unfused powder defects, resulting in diminished elongation properties. However, these detrimental phenomena can be effectively mitigated by employing higher-energy-density parameters during fabrication. The research by Zhai et al. [6] demonstrated that incorporating titanium alloy as an additive element during stainless-steel processing refines grain structure (reducing average grain size from 16.7 μm to 0.8 μm) without inducing the formation of detrimental intermediate phases at the grain boundaries in SLM 316L stainless-steel specimens. This microstructural refinement concurrently produces significant enhancements in ultimate tensile strength. Piazza et al. [7] investigated the influences of component geometry and laser power parameters on porosity development and melt pool characteristics in SLM 316L stainless-steel specimens. In complementary research, Fri et al. [8] performed detailed metallographic examinations and heat treatment studies on SLM 316L samples at various temperatures (650 °C, 800 °C, and 1050 °C), characterizing the material’s microstructural evolution. Their results confirmed that SLM-produced 316L stainless steel exhibits excellent high-temperature stability that is directly attributable to its distinctive microstructural features. To further elucidate process–microstructure–property relationships in additive manufacturing, Zinovieva et al. [9] examined the effects of scanning patterns on microstructural development and mechanical behavior in SLM 316L stainless steel. Comparing unidirectional and bidirectional scanning strategies, they observed that bidirectional scanning produced microstructures with more pronounced Gaussian and cube crystallographic texture distributions. In contrast, unidirectional scanning resulted in coarser grain structures, more prominent texture patterns, and anisotropic properties. Researchers conducted experimental studies using uniaxial tensile testing [10] and ultrasonic wave velocity methods [11] to obtain the elastic constants of 316L steel under different scanning strategies. Due to the different degrees of shear and tensile forces affecting the interfaces between deposited layers in different printing directions, additively manufactured metals also exhibit significant anisotropic behavior [12,13,14]. Currently, the reasons for the orthotropic nature of additively manufactured 316L are complex and deserve further investigation.
It is evident that the majority of scholarly research has concentrated on the influence of microstructure on the tensile properties of SLM 316L stainless steel, with comparatively limited investigation into fracture and fatigue behaviors. Suryawanshi et al. [15] conducted a comprehensive evaluation of tensile properties, fracture characteristics, and fatigue crack propagation in SLM 316L stainless steel, benchmarking against conventionally manufactured (CM) austenitic 316L stainless steel. Their experimental findings revealed that SLM 316L stainless steel possesses yield strength compared to its CM counterpart, though at the expense of diminished ductility. Byun et al. [16] employed scanning electron microscopy coupled with electron backscatter diffraction (EBSD) techniques to perform in situ tensile testing on SLM 316L stainless-steel specimens. The EBSD analysis demonstrated that complex microstructural features—encompassing grain morphology, grain orientation differentials, and porosity—exert profound influence on tensile deformation mechanisms and fracture processes. Solberg et al. [17] investigated fatigue behavior in SLM 316L stainless steel through the dual perspectives of internal porosity and surface roughness. Their research established that surface roughness predominantly governs fatigue microcrack initiation under high-cycle fatigue conditions, whereas internal porosity emerges as the principal driver of microcrack formation in low-cycle fatigue regimes.
Experimental methodologies are valuable and constrained by significant drawbacks, including high costs, extensive time requirements, and numerous confounding variables. In contrast, finite element methods are computationally efficient and cost-effective. Contemporary research predominantly utilizes the crystal plastic finite element method (CPFEM) in conjunction with representative volume elements (RVEs) to simulate the mechanical behavior of SLM 316L stainless steel. Ahmadi et al. [18] developed an advanced simulation framework incorporating both grain structure and melt pool characteristics to examine how various specialized microstructures influence the mechanical properties of SLM 316L stainless steel. They integrated cohesive zone elements (CZMs) into their model to simulate mechanical behavior, though notably, their approach did not account for the actual microstructural configurations of test specimens. Cai et al. [19] pioneered an integrated approach combining CPFEM and CZM to investigate the effects of microstructural morphology, grain dimensions, crystallographic orientation, and temperature on the mechanical properties of TWIP steel. Their research conclusively demonstrated that grain boundaries exhibit greater brittleness than grain interiors, resulting in preferential microcrack nucleation at the interfaces between grains. Furthermore, building direction has been shown to significantly impact the mechanical properties of SLM 316L stainless steel [20,21]. This anisotropic behavior stems primarily from preferential grain orientation in the building direction, a critical factor that demands explicit consideration in numerical simulations. In recent years, Nazari-Onlaghi et al. [22] have used various crystal plasticity finite element simulations to model the deformation process of alloys, and Wang et al. [23] inferred that inhomogeneous grain distribution would lead to plastic anisotropy in the stress levels of tensile and compressive behaviors. Therefore, the crystal plasticity finite element method encompasses fundamental aspects of materials science, including lattice structures, dislocation theory, and stress–strain relationships. The application of this method to investigate intragranular microstructure and mechanical behavior provides direct insights into deformation mechanisms under external loading conditions. Consequently, employing crystal plasticity finite element analysis to examine how microstructure and building direction influence fracture behavior in SLM 316L stainless steel contributes to advancing our understanding of damage and failure mechanisms in additively manufactured metallic materials.
This research aims to establish CPFE models and calibrate material parameters based on data obtained from uniaxial tensile experiments and EBSD characterization. Combining CZMs, the proposed CPFE models accurately capture the actual microstructural features of the material, enable the simulation of fracture behavior, and facilitate in-depth analysis of how microstructural characteristics influence fracture mechanisms in SLM 316L stainless steel.
Section 2 presents a brief description of the specimen fabrication of the SLM 316L material and the test methodology, including the methodology of the printing process, the EBSD experiment, and the uniaxial tensile test at room temperature. Section 3 presents and analyzes the uniaxial mechanical properties and microstructure characteristics (EBSD). Section 4 develops a computational framework, integrating crystal plasticity theory with cohesive zone (CZM) element formulations, and outlines the numerical model theory, construct, simulation conditions, substructure model technology, and the results of both the RVE and compact tension tests. Finally, Section 5 summarizes the conclusions and future research directions.

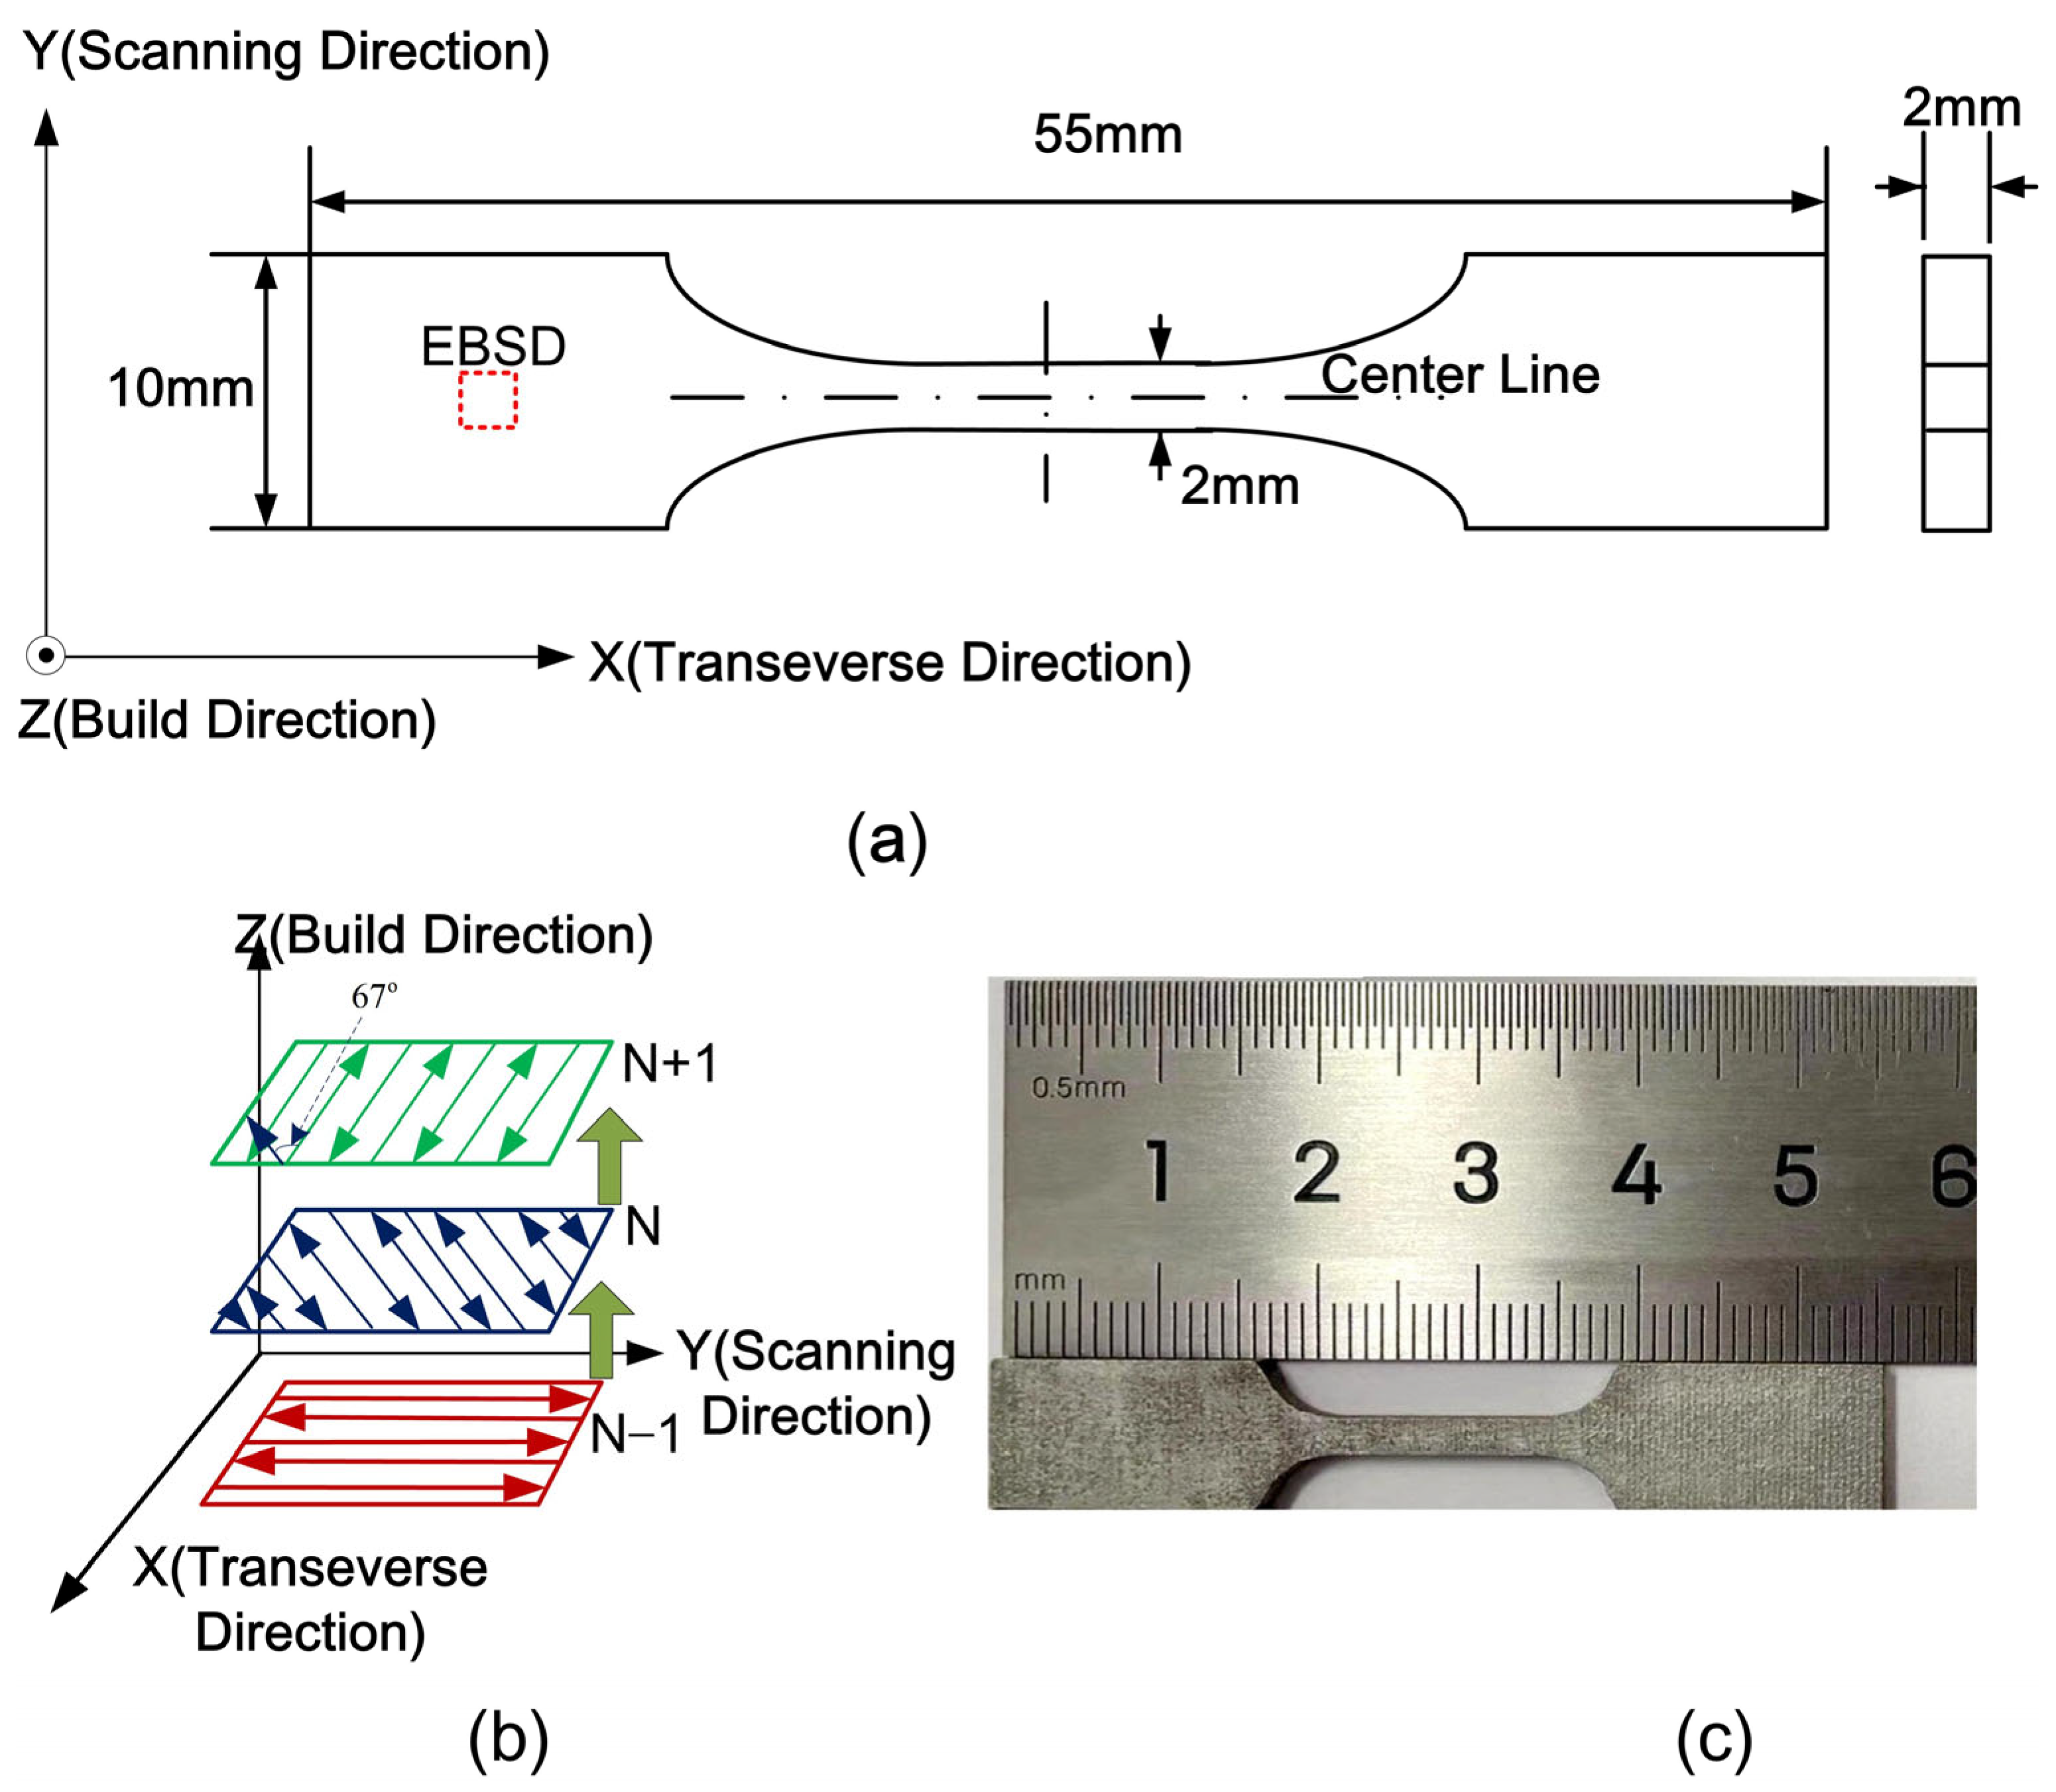
2. Specimen Preparation and Experimental Method

SLM316L stainless steel is an austenitic stainless steel with low carbon content, exhibiting excellent corrosion resistance and weldability. The powder size distribution for 316L is determined according to the previous work [15]. The diameter of particles is between 10 μm and 45 μm. Its chemical composition by mass fraction is shown in Table 1.
The SLM316L stainless-steel specimens used in this study were custom-fabricated via the Shenzhen Speed Platform using an SLM280 3D printer manufactured by Sino-Swiss Metals (ZRapid Tech, Suzhou, China). Prior to the experiment, the specimens were treated to ensure good surface conditions and to confirm that they were intact without obvious notches. The dimensional parameters of the specimens are shown in Figure 1a. There are many printing parameters that affect the forming of SLM technology. After a series of trials, the SLM printing parameters used in this study were determined (laser power: 225 W; scanning speed: 1000 mm/s; hatch spacing: 90 µm; powder layer thickness: 30 µm; laser beam diameter: 70 µm). The scanning strategy is illustrated in Figure 1b. Before the experiment, the oxygen concentration in the forming chamber was reduced to below 1000 ppm; 316L stainless steel was used as the base plate, and argon gas was employed as the protective gas. During printing, the layers were rotated by 67° successively. Through layer-by-layer accumulation, the SLM 316L specimens were successfully fabricated according to the two-dimensional data imported into the software before testing. The formed specimen is shown in Figure 1c.
Building upon the work of Suryawanshi et al. [15] and Wang et al. [23], this study conducted room-temperature quasi-static tensile experiments on SLM316L stainless steel in accordance with the previous work [15] at a strain rate of 0.00033 s−1 (with a crosshead speed of 0.11 mm/min). Uniaxial tensile tests were conducted at room temperature using an MTS universal material testing machine (Eden Prairie, MN, USA). The tensile direction of the specimens was along the X-axis (TD direction), and the experimental data were automatically recorded by a computer.
Electron backscatter diffraction (EBSD) has emerged as a critical microstructural characterization methodology in materials science. The successful implementation of this technique necessitates rigorous specimen preparation protocols to achieve both compliance with analytical requirements and optimal data quality [24,25]. The preparation process typically involves sequential mechanical polishing, followed by final chemo-mechanical treatment to obtain ultra-smooth surfaces with minimal topographical variations. Moreover, the meticulous execution of these preparatory stages proves essential for eliminating residual surface damage that could otherwise generate crystallographic artifacts during pattern acquisition. First, a wire-cutting machine was used to cut the complete specimens to obtain samples of appropriate size for the experiment. Then, to ensure that the cut specimen surfaces were flat and smooth, sandpapers of different grit sizes were used to repeatedly perform coarse and fine grinding on the surfaces to be examined. Finally, to ensure the quality of specimen preparation, an electrolytic polishing machine was used for electrolytic polishing treatment. Using a trial-and-error method, parameters of 3 V voltage and 15 A current were set for a 45 s processing treatment. Microstructural observations were conducted using an Apreo S HiVac field-emission scanning electron microscope (FEI company, Hillsborough, OR, USA).

3. Experimental Results and Discussion
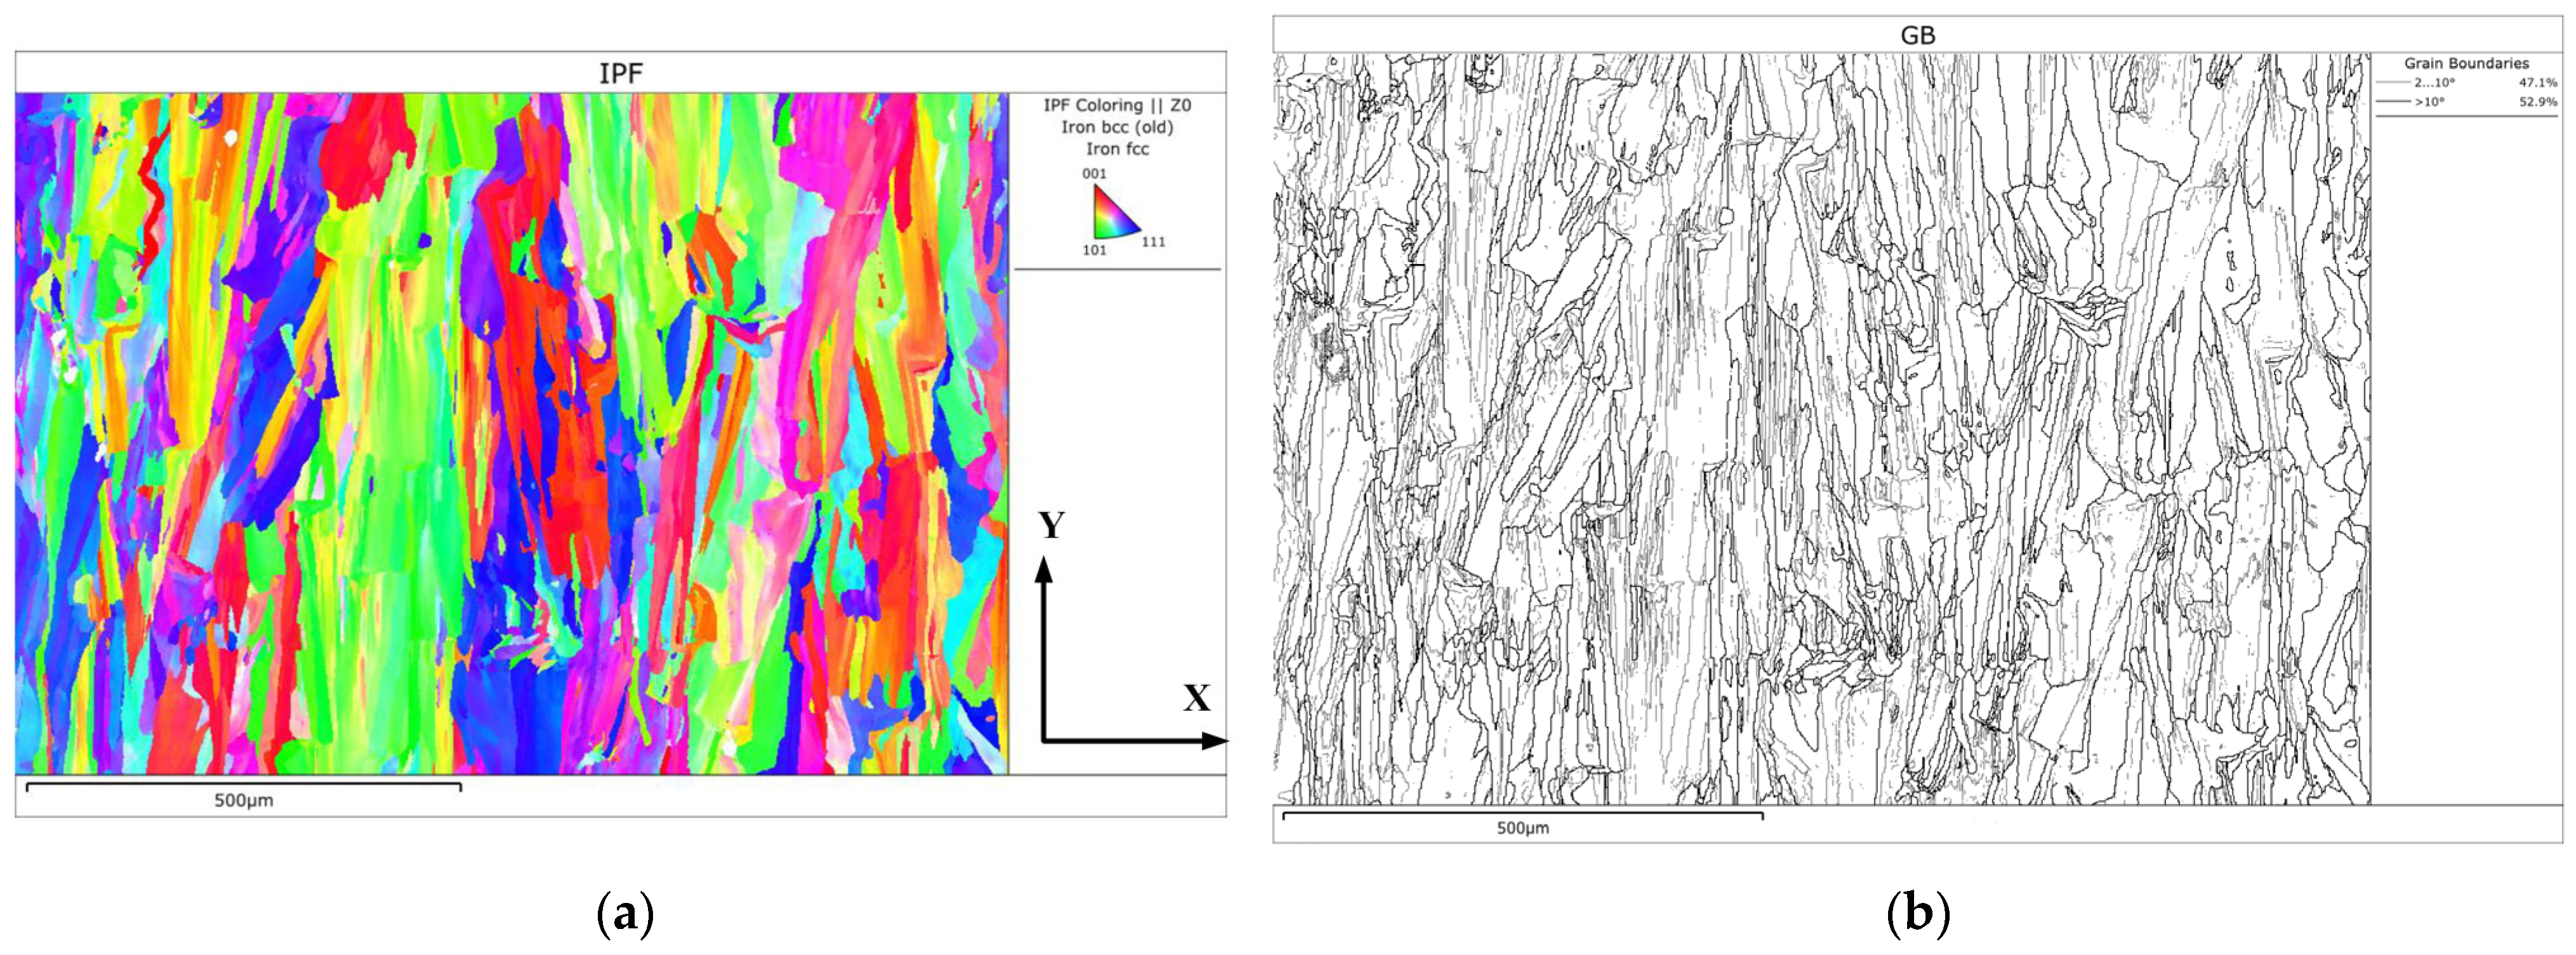
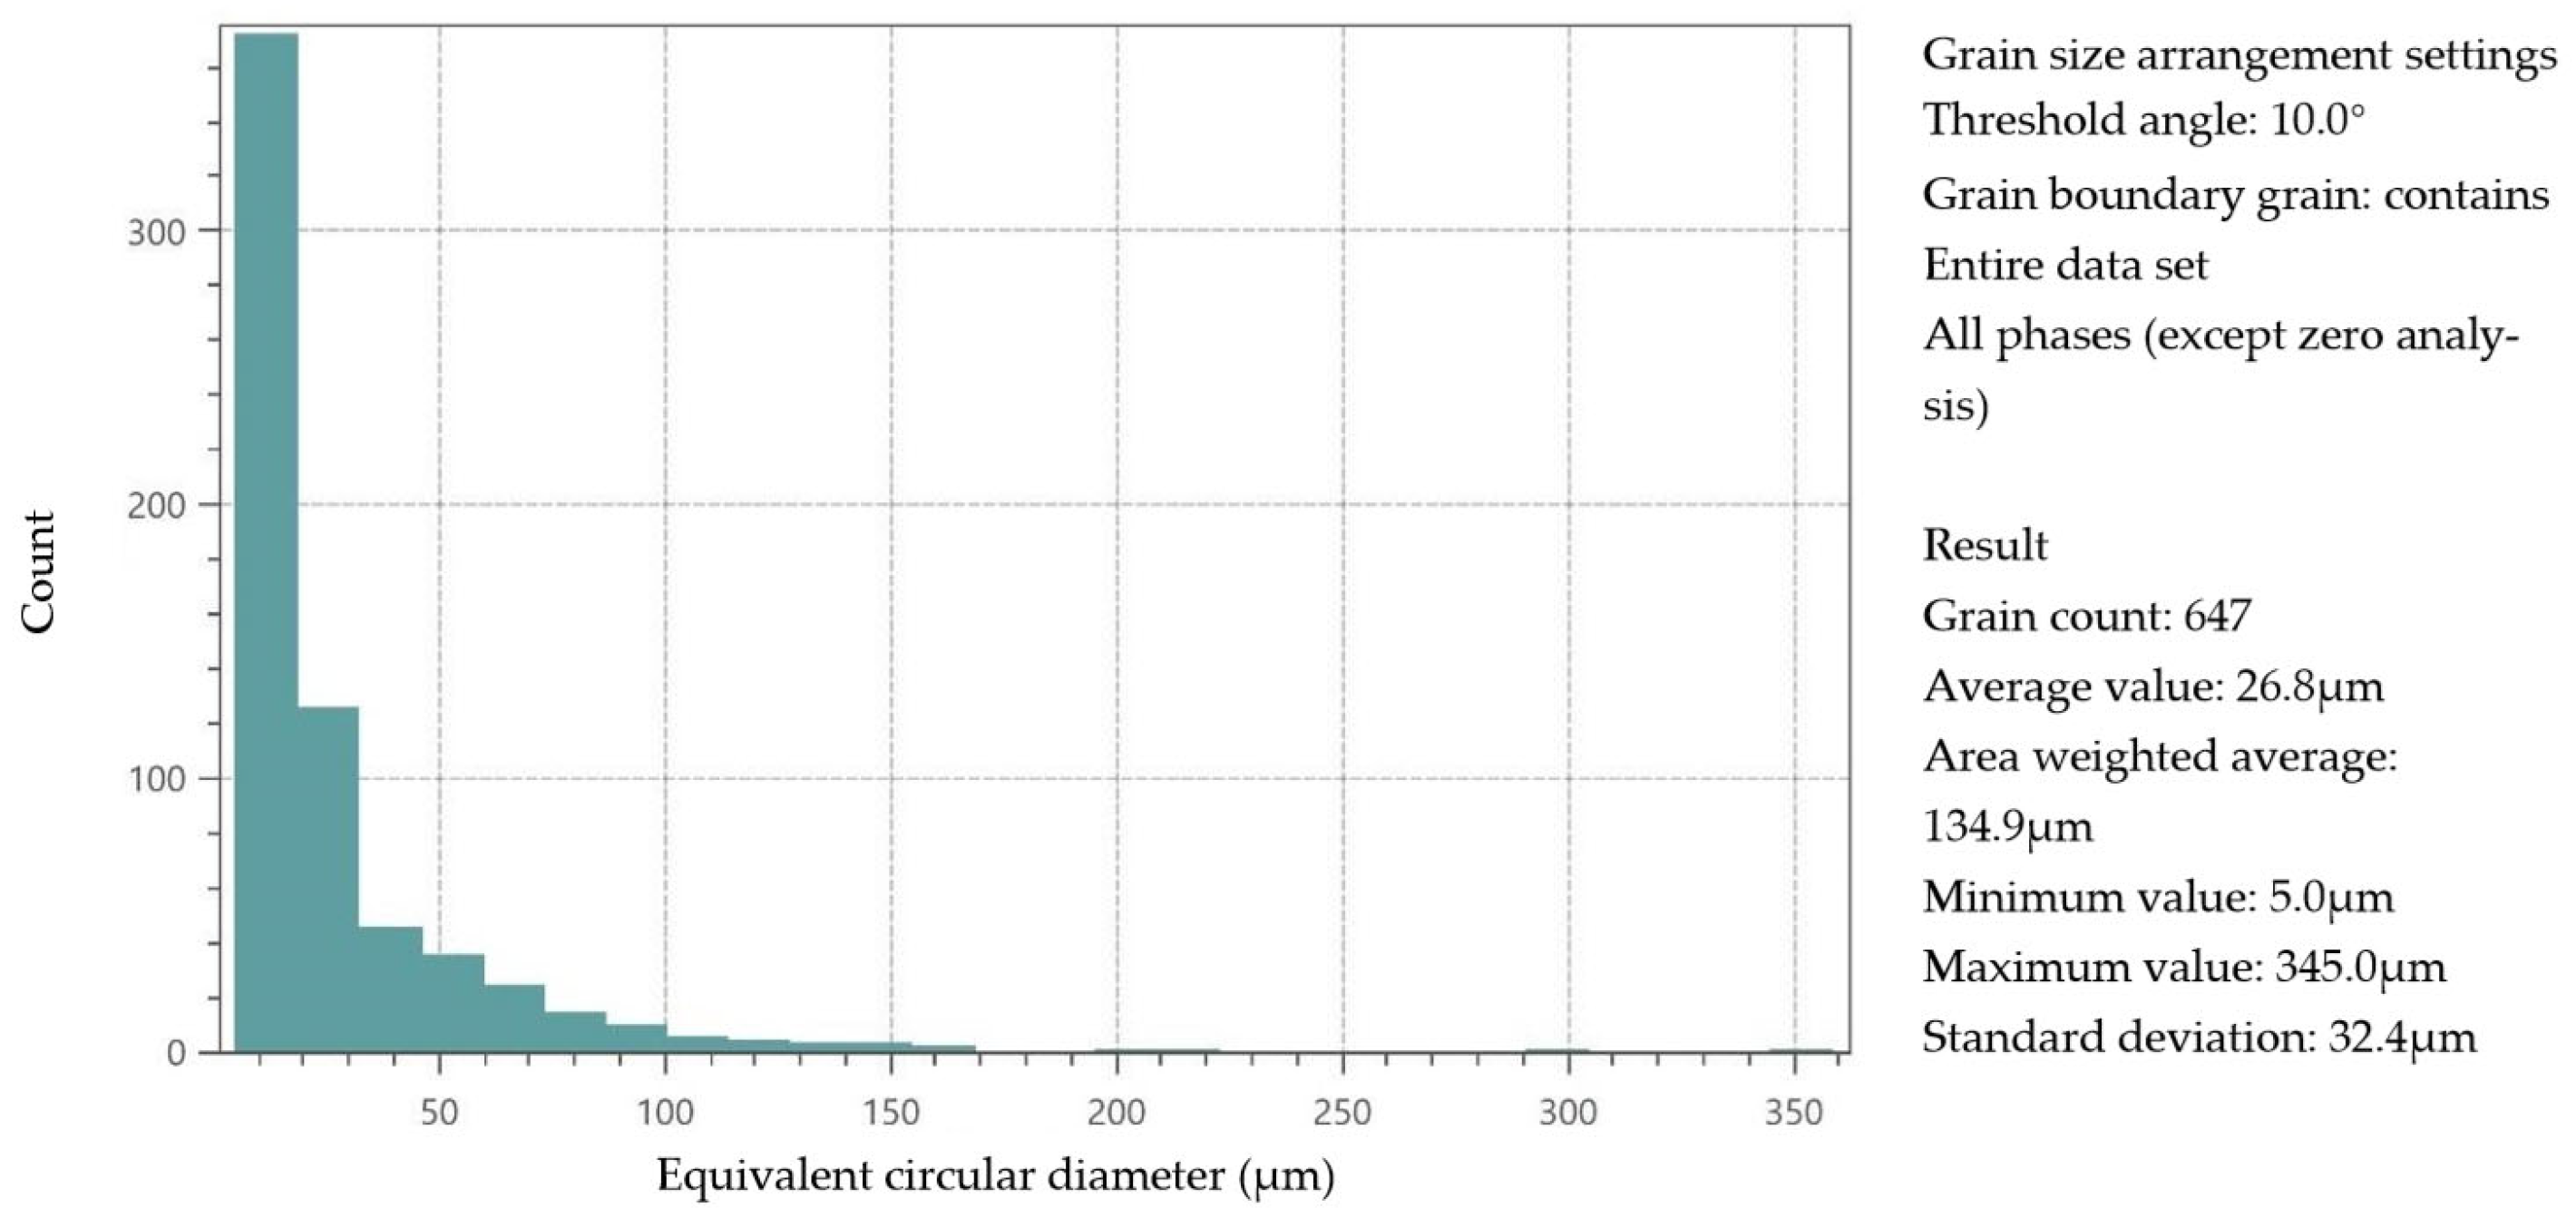
3.1. Microstructure

Figure 2 presents EBSD images of the X-Y plane of the test sample. Figure 2a displays the EBSD inverse pole figure (IPF) of the SLM316L stainless steel. The image clearly demonstrates that the grain morphology of SLM316L stainless steel differs markedly from the coarse grains typically observed in traditionally cast stainless steel. While traditionally cast stainless steel predominantly exhibits regular block-shaped grains, SLM316L stainless steel features elongated grains aligned along the TD direction, frequently spanning multiple melt pools [26]. The diverse colors in the figure represent varying grain orientations, indicating that grain orientations within the X-Y plane do not follow any apparent distribution pattern. However, in some large grain, it can be observed that there are still some continuous trends, and they are distributed along the same direction holistically. It can be observed that although the orientations of the grains are not entirely the same, there are still some continuous trends, and overall, they are distributed along the same direction. Figure 2b illustrates the EBSD grain boundary quality map of the SLM316L stainless steel, where solid lines denote high-angle grain boundaries (>10°) and dashed lines indicate low-angle grain boundaries (2–10°). The analysis of this plane’s EBSD image reveals a uniform distribution of both high-angle and low-angle grain boundaries, with high-angle boundaries slightly predominating. Notably, low-angle boundaries typically correlate with high-density dislocations within the material structure.
With the entire region serving as the analytical focus, comprehensive grain size distribution data were extracted and statistically analyzed. Figure 3 illustrates the grain size distribution of the fabricated sample. The average grain size throughout the dataset is 26.8 μm, which is considerably smaller than traditionally cast samples. Characteristically, the grain size distribution in the additively manufactured sample is dominated by fine grains (<50 μm), which constitute over 80% of the total population, although larger grains (>50 μm) are also present. Significantly, these larger grains typically function as the primary facilitators of slip occurrence in the material.

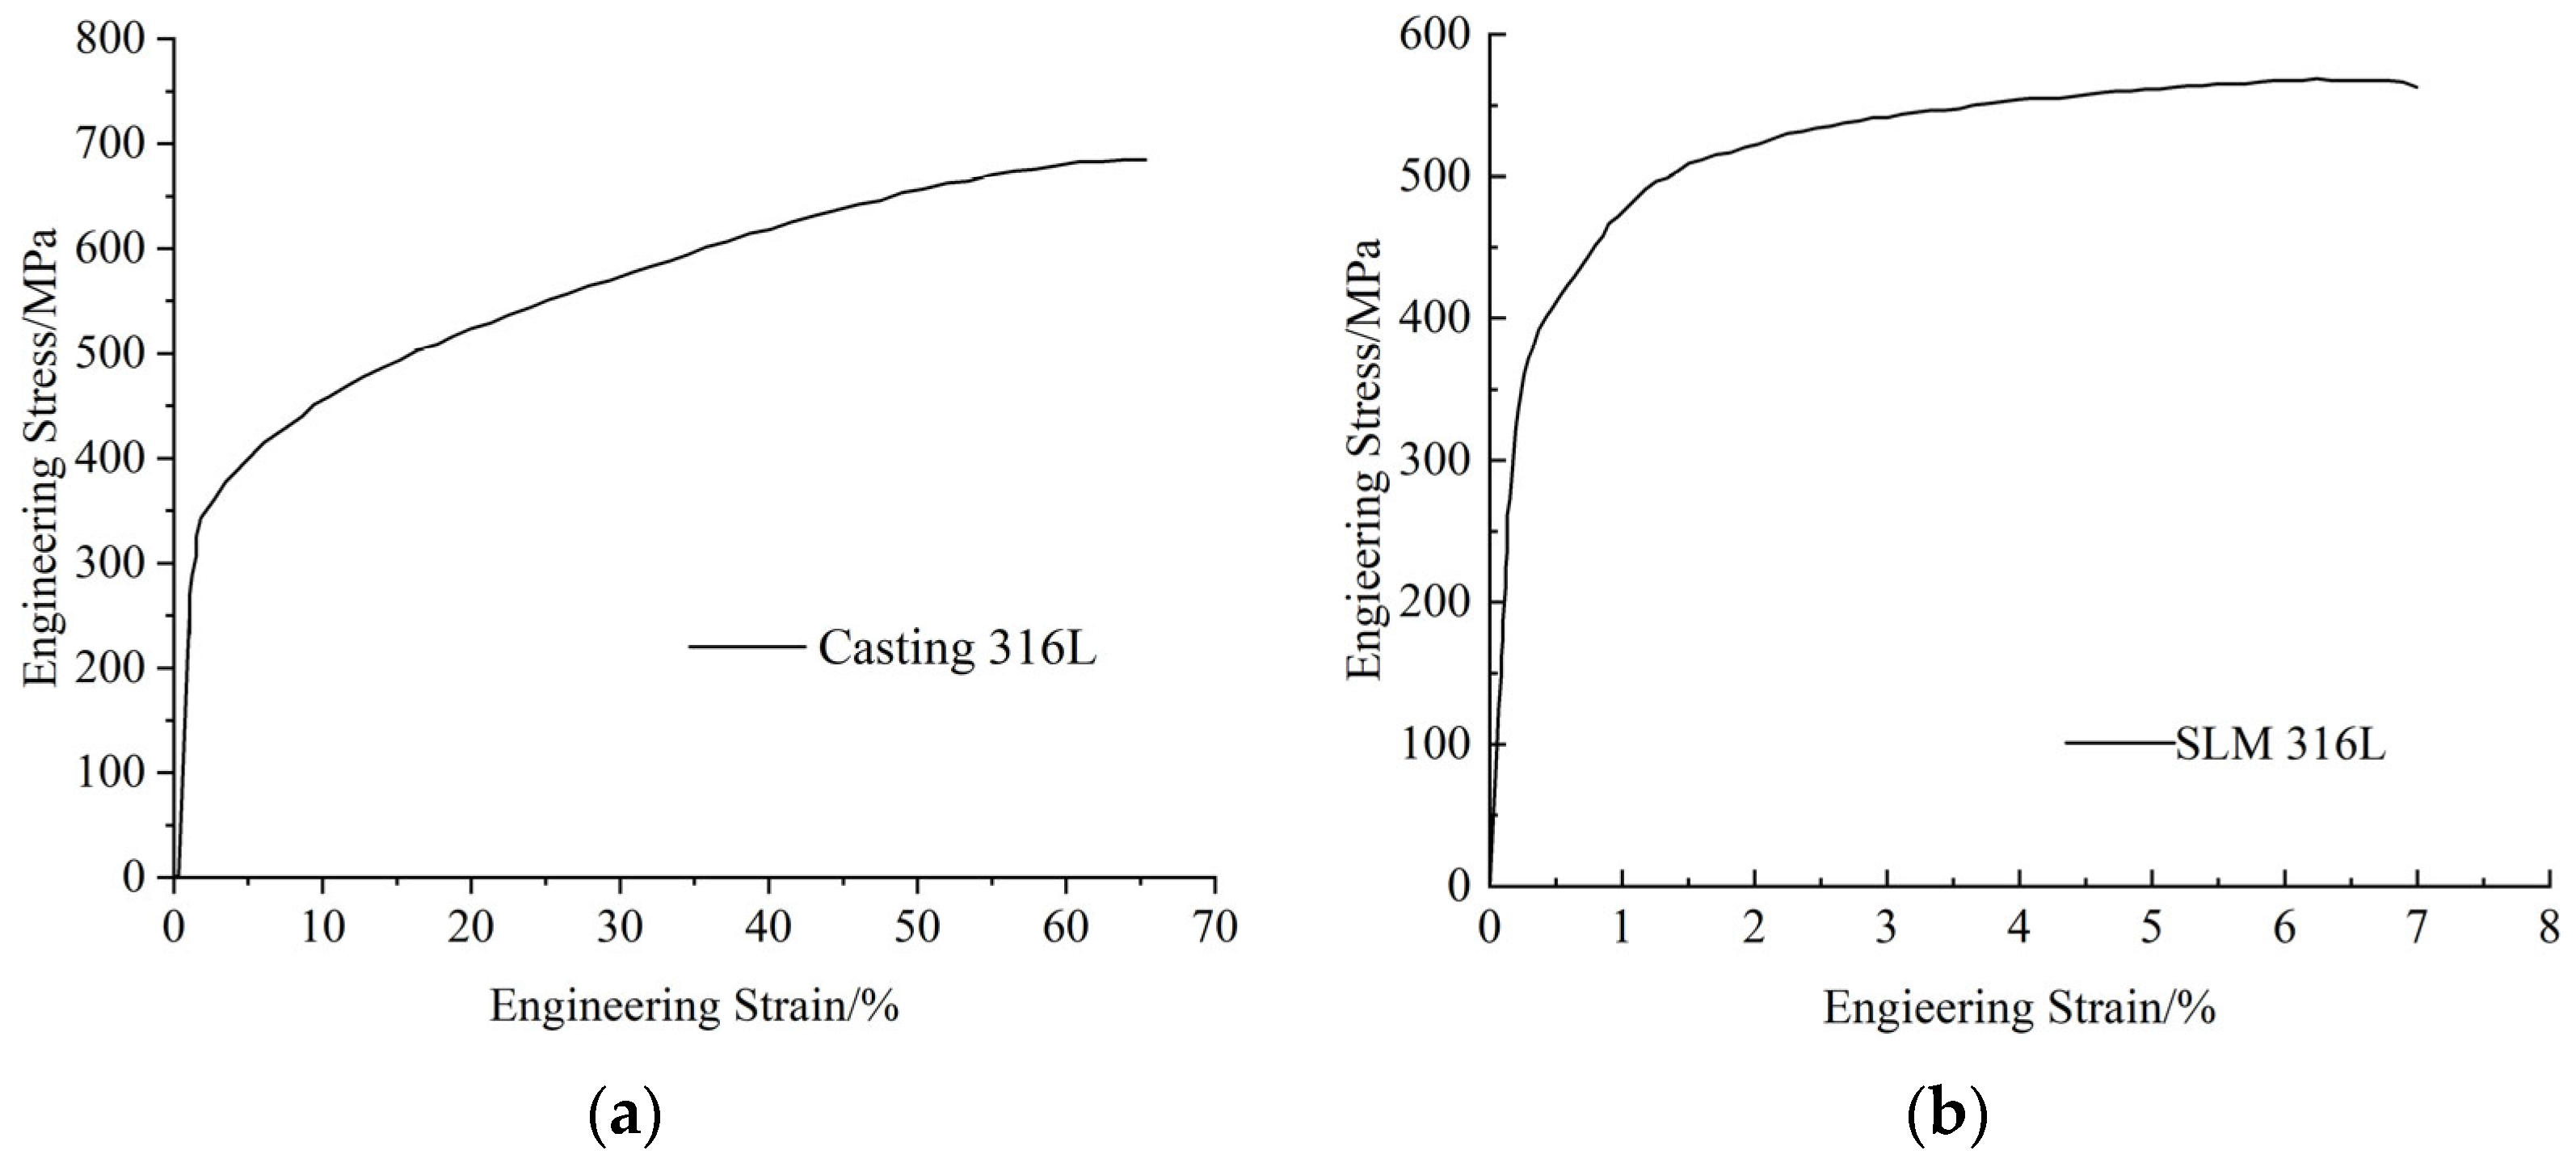
3.2. Tensile Property

Figure 4a illustrates the measured engineering stress–strain curves, juxtaposed with results from traditionally cast 316L stainless steel (Figure 4b) obtained by Suryawanshi et al. [15]. As can be seen from Figure 4, compared with the traditionally cast 316L specimen, SLM316L stainless-steel specimens demonstrate markedly different mechanical behavior compared to their traditionally cast counterparts. During the elastic regime, stress values escalate rapidly with increasing applied load, approaching the material’s elastic strength while maintaining a robust linear stress–strain relationship. Following elastic deformation, the specimen enters an extended plastic hardening phase characterized by a significantly reduced but steady stress growth rate. At elevated stress levels, localized reduction in the specimen’s cross-sectional area (necking) occurs, ultimately leading to fracture at a specific location.
Table 2 summarizes the tensile properties of both the SLM316L specimens and reference traditionally cast 316L specimens. The SLM316L stainless steel exhibits a yield strength of 362 MPa, tensile strength of 556 MPa, and elongation of 7.5%, whereas the traditionally cast 316L stainless steel demonstrates a yield strength of 306 MPa, tensile strength of 685 MPa, and remarkably higher elongation of 65%. These comparative data reveal that while SLM316L stainless steel possesses superior yield strength, it underperforms in terms of tensile strength and ductility relative to its traditionally cast counterpart.

4. Finite Element Simulation and Verification

4.1. Crystal Plasticity Model

4.1.1. Kinematics

In this paper, based on Huang’s work, a phenomenological rate-dependent plastic constitutive model of the crystal is used to simulate the mechanical response inside the grain. Hill presented a mathematical description of crystal geometry and kinematics in the theory of crystal plasticity. Crystal grains usually undergo lattice rotation and elastic deformation under external loads. If the single crystal has no elastic deformation at all and causes slippage, the gradient of total deformation F is given by
F = F e F p
where gradient elastic deformation F e is mainly caused by rigid rotation, and F p is plastic deformation gradient caused by shear slip of the crystal along the sliding direction. The plastic deformation gradient satisfies the following equation:
L p = a = 1 n   γ ˙ α s a m a
where s a and m a are the slip direction in the reference coordinated system and the sliding surface normal direction.

4.1.2. Constitutive Equations

The stretching rate of the lattice and the Jouman rate of Cauchy stress has a relationship:
σ * + σ ( I : D * ) = L : D *
where I and L are the unit tensor and the elastic modulus tensor.
During the slip process, the slip process satisfies SCHMID’s law:
τ ( α ) = m * ( α ) · ρ 0 ρ σ · s * ( α )
where ρ 0 is a reference configuration material density and ρ is the density of the current configuration.

4.1.3. Hardening Laws

According to Schmid’s law, each slip system’s slip rates of rate-dependent crystalline materials are defined as
γ ( α ) · = γ 0 ( α ) · s g n ( τ ( α ) / g ( α ) ) τ ( α ) / g ( α ) n
n is the rate sensitivity index. Here, g ( α ) is denoted by
g · = β = 1 N h α β γ β ·
where h α β is slip-enhanced modulus. When α = β , the hardening mode is self-hardening, and when α β , the hardening mode is latent-hardening. Self-hardening is adopted as
  h α α = h = h 0 s e c h 2 h 0 γ τ s τ 0
where h 0 represents the initial hardening modulus, τ 0 denotes the material’s initial yield stress, and τ s signifies the critical shear stress required for plastic flow to occur. The term γ corresponds to the sum of accumulated shear strain across all slip systems.
The relationship between the self-hardening modulus and latent-hardening modulus is expressed as
h α β = q h γ α β
Here, q is a constant that characterizes the proportional relationship between self-hardening and latent-hardening mechanisms.
In 1991, Bassani and Wu introduced a distinctive expression to describe the hardening modulus of crystalline materials. This formulation encompasses the three characteristic stages of crystal material hardening:
h α α = h 0 h s sec h 2 h 0 h s γ α τ s τ 0 + h s G γ β ; β α
h α β = q h α α β α
The parameter h s introduced in this model represents the hardening modulus during the initial stage of easy slip processes in the hardening phase. The function G pertains to interaction hardening and is defined as
G γ α ; β α = 1 + β α f α β t a n h γ α γ 0
As one of the earliest and most widely implemented crystal plasticity models, this exponential formulation has been extensively utilized in research and subsequently enhanced by numerous investigators. The present study likewise employs this crystal plasticity model as a primary research tool. The aforementioned crystal plasticity formulation is implemented through Huang’s UMAT subroutine, which assigns the specific crystal plasticity parameters.

4.1.4. Cohesive Zone Model

The cohesive zone model integrated within Abaqus software 6.14 represents a powerful analytical tool for investigating fracture behavior and has gained widespread adoption in research examining failure mechanisms, particularly delamination in composite materials. In this section, we implement a bilinear cohesive zone model utilizing zero-thickness cohesive elements to simulate both the initiation and propagation of cracks along grain boundaries during tensile loading. The theoretical foundations and physical principles governing these elements are comprehensively documented in the Abaqus manual and thus will not be reiterated here.
Within the Abaqus environment, users can define the maximum threshold value for the damage variable to determine the fate of cohesive elements upon failure. The default setting of 1.0 dictates that when the damage variable reaches this value, the software automatically removes failed cohesive elements from the model, effectively completing the simulation of material fracture processes. For analytical purposes, the SDEG variable, which can be selected in the output settings analysis step, provides real-time tracking of the damage variable, enabling researchers to precisely monitor both the spatial distribution and temporal progression of damage accumulation throughout the loading sequence.

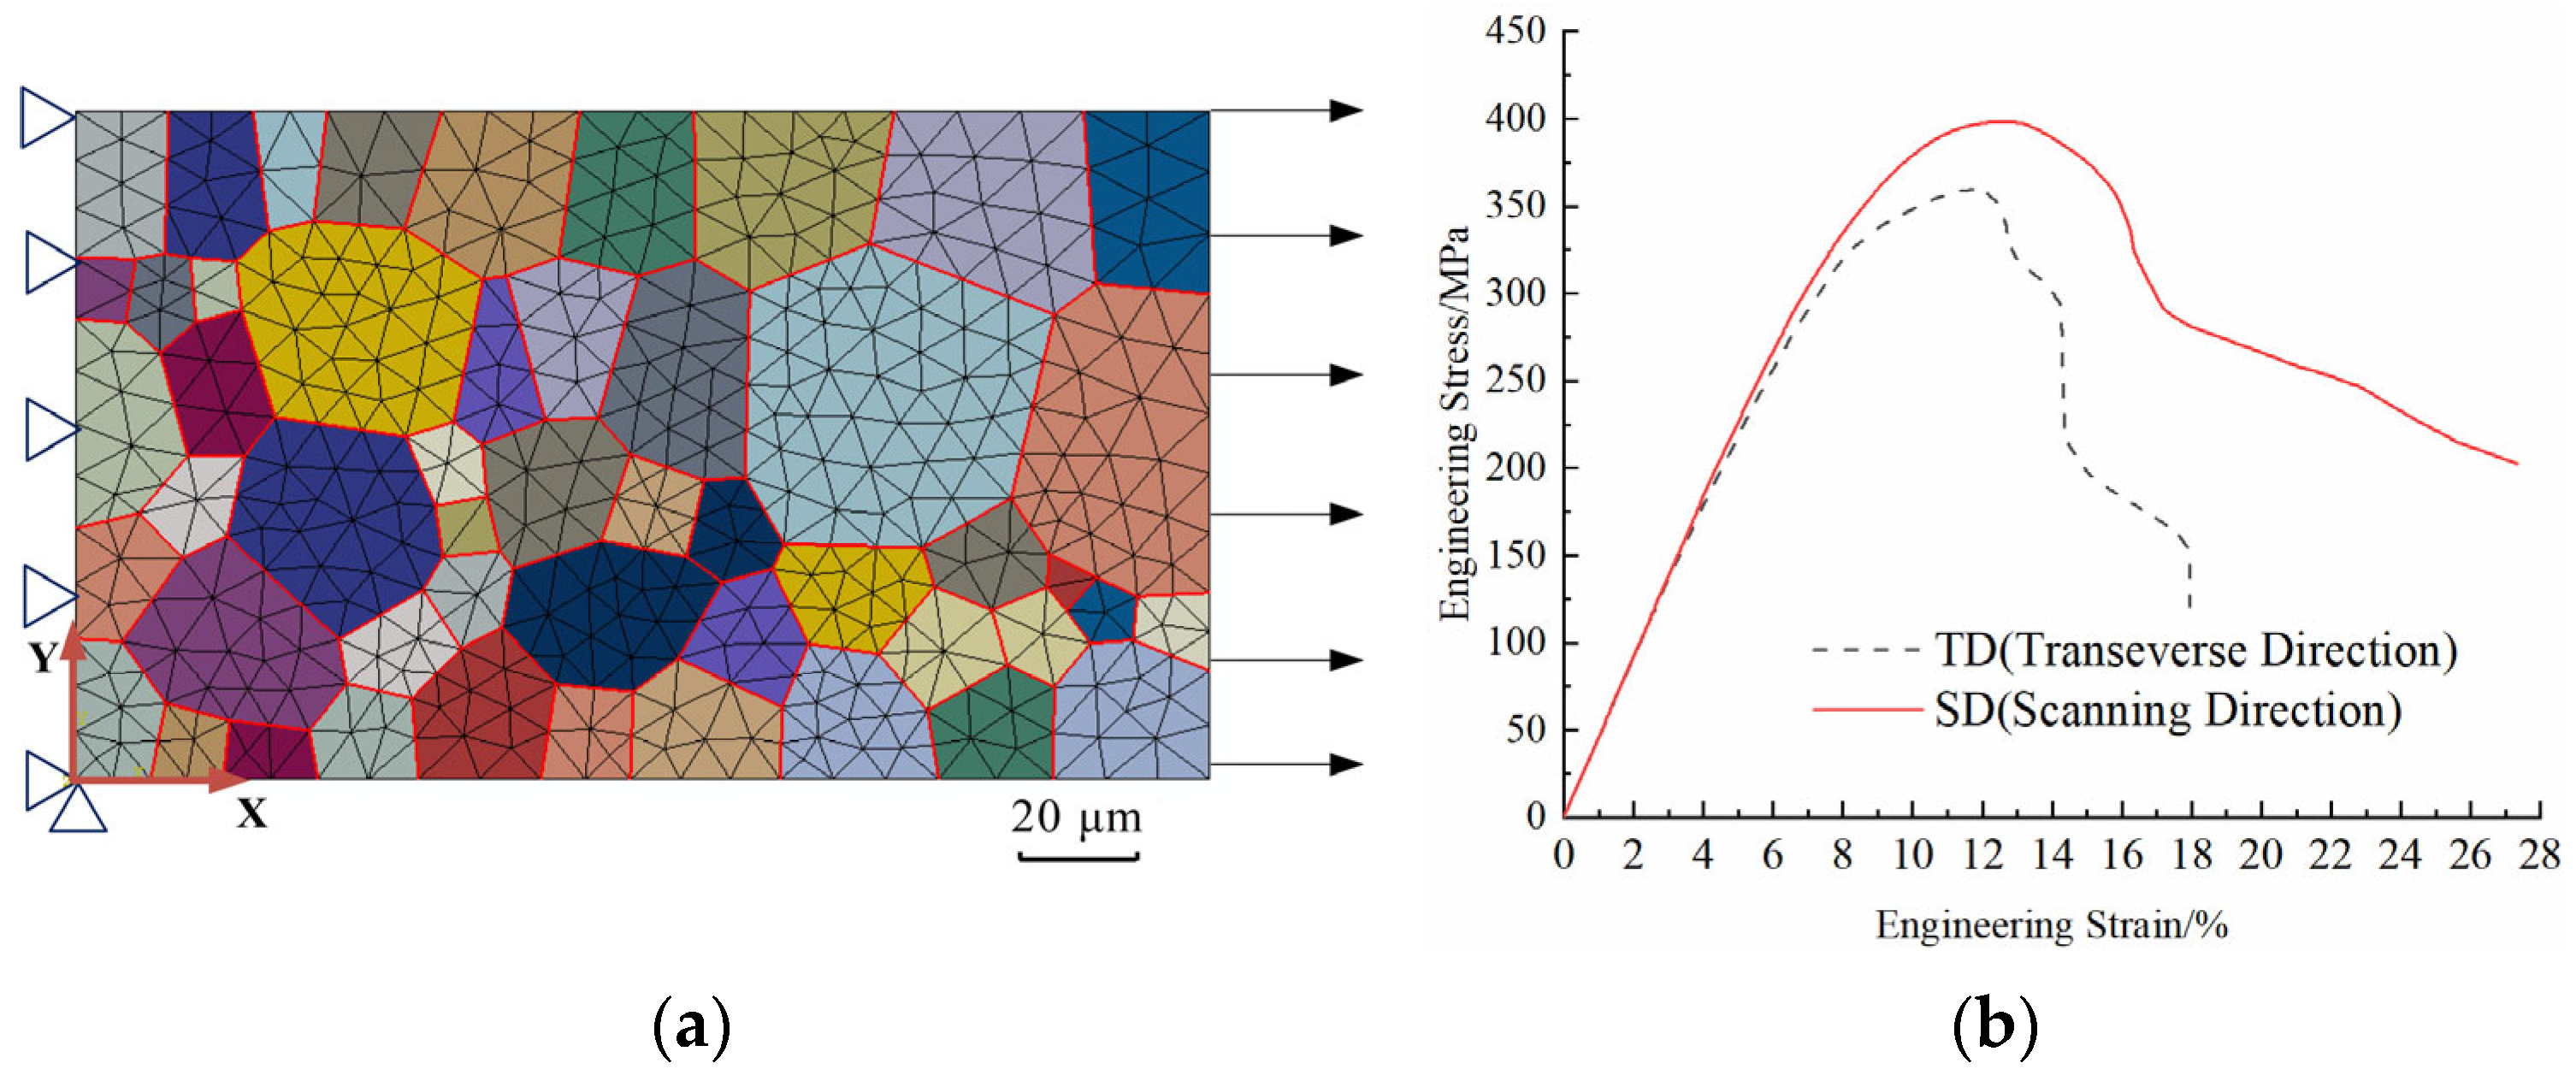
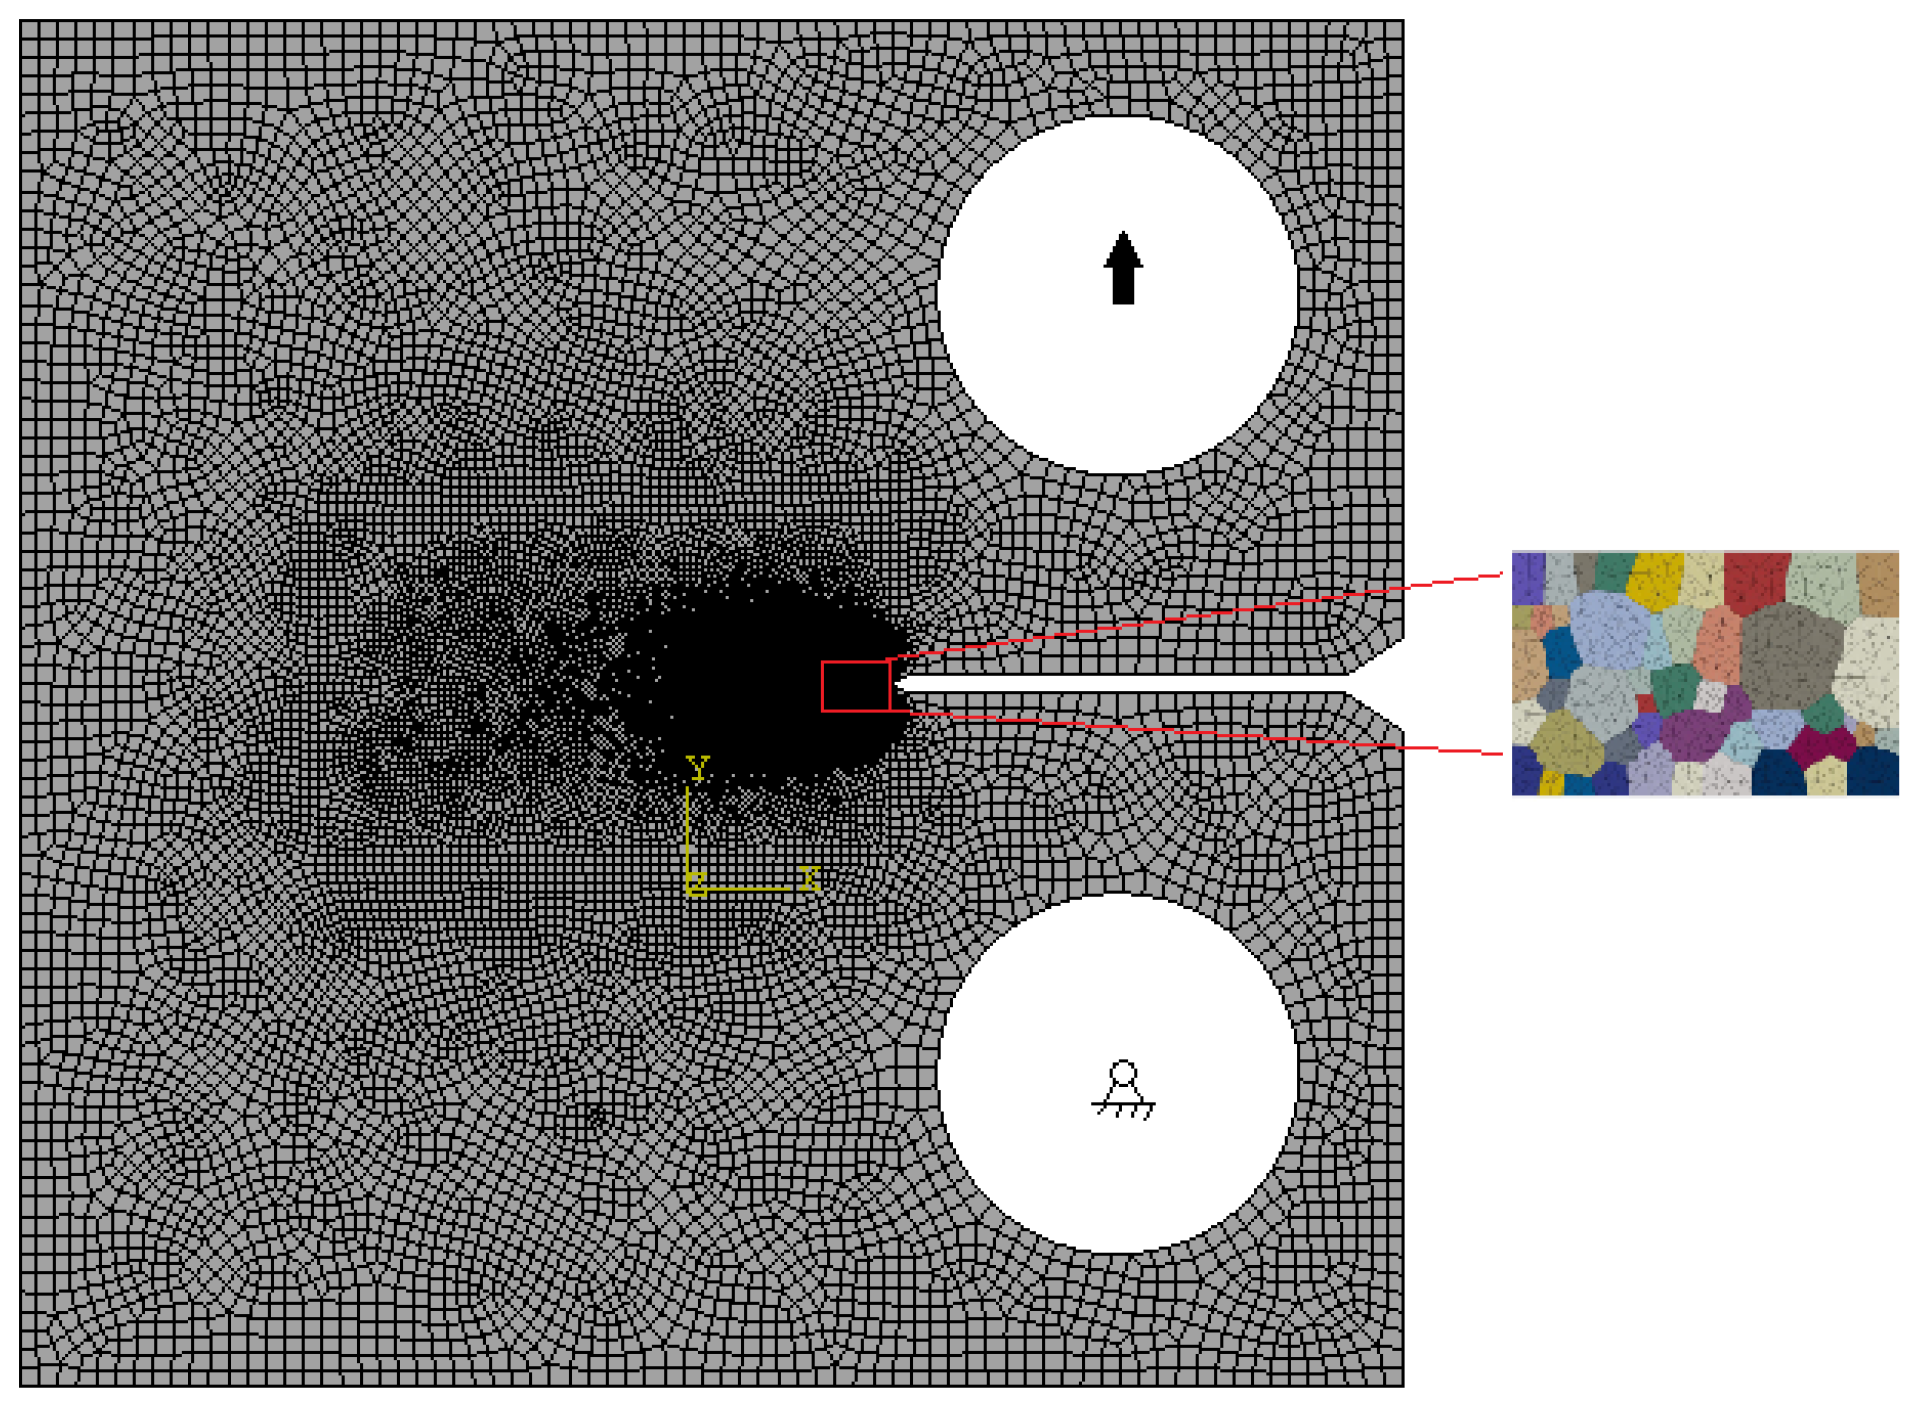
4.2. Finite Element Model of Representative Volume Element

The representative volume element was constructed using the Voronoi tessellation method [27,28], with Neper 4.7.0 [29,30,31] employed to generate a Voronoi structure comprising 50 distinct grains. Based on experimentally determined grain size measurements, we developed a structural model measuring 0.2 mm in length and 0.12 mm in width. As shown in Figure 5a, each uniquely colored set represents an individual grain, with all 50 single crystal grains collectively constituting the representative volume element of the polycrystalline structure. The random crystallographic orientation data acquired from our EBSD experiments were processed and systematically assigned to each grain set through orientation parameters specified in the UMAT subroutine configuration.
The numerical model utilized CPE3 mesh elements. In order to balance the calculation efficiency and the number of elements, mesh independence studies were conducted. The initial mesh size is set to 10 μm, and the density is gradually increased. After each refinement, the Von Mises stress of the observation point is recorded. Finally, the mesh size is optimally set to 4.8 μm. To eliminate rigid body motion during load application, we implemented strategic boundary constraints. Specifically, the boundary conditions included the following: displacement constraints on the left boundary plane: U x = 0 ; fixed nodal constraints at the origin located at the lower left corner: U x = U y = 0 . For load application, all nodes on the right boundary plane were coupled and subjected to displacement-controlled tensile strain to simulate uniaxial tension. The loading strain rate is consistent with the experiment.
For the accurate numerical simulation of SLM316L stainless steel, we implemented customized material parameters in the UMAT subroutine [32], with specific parameter sets assigned to individual grains. The elastic modulus of SLM316L stainless steel was precisely determined from tensile test stress–strain data to be C 11 = C 12 = C 44 = 206 GPa The remaining crystal plasticity parameters were established through an optimization process that minimized the mean square deviation between the experimental and simulated stress–strain curves. The complete set of optimized crystal plasticity parameters is presented in Table 3. In the simulation process, SLM316L is considered as having static recrystallization with no phase transformation.
Figure 5b presents a comparative analysis of the tensile stress–strain response obtained from experimental testing versus finite element simulation. The results demonstrate excellent correlation between experimental and simulated values across the full deformation range, with minor discrepancies remaining well within acceptable tolerance limits for crystal plasticity modeling.

4.3. SLM316L Stainless Steel—Fracture Behavior Simulation

In order to simulate the fracture behavior, the grain boundaries of the RVEs were realized by combining the COH2D4 cohesive elements between adjacent grains in the model shown in Figure 6a. The models in Figure 5 and Figure 6 maintain consistency in boundary condition settings and grain size.
The crystal plasticity parameters employed in this section are consistent with those established in the preceding section. For the cohesive element parameters, it was essential to define the normal stiffness K n n , tangential stiffness K s s = K t t , maximum normal and tangential traction forces t n 0 = t s 0 = t t 0 , and energy dissipation rates G n . These specific values are comprehensively detailed in Table 4. The cohesive element thickness was configured at 0.001 mm for all simulations.
The representative volume elements were configured with two distinct sets of crystallographic orientations. The transverse direction (TD) is basically consistent with the EBSD experimental measurements. Since SLM 316L stainless steel belongs to the face-centered cubic (FCC) structure of austenite, its grain orientation has a high degree of symmetry, and Euler angles within 90° can fully express all grain orientations. A normal distribution probability is used to control the range of Euler angle values, with the specific distribution shown in Table 5. For the scanning direction (SD), the above method is used to randomly generate grain orientations for each grain.
Following the computational analysis of both RVE model sets, the stress–strain curves of different grain directions are presented in Figure 6b. During the elastic deformation stage, the RVE models in the TD direction and the SD direction exhibit the same mechanical response, indicating that grain orientation has almost no influence on the mechanical properties of the material in the elastic deformation stage. However, in the subsequent plastic deformation stage, the yield strength and fracture limit in the SD direction are somewhat higher than those in the TD direction.
Figure 7 illustrates the von Mises stress distribution contour maps for both orientation configurations at the point of computational non-convergence, which corresponds to material failure. The stress contours reveal pronounced heterogeneity in the internal stress distribution across models with different forming directions. While fracture locations vary among different grain boundaries depending on crystallographic orientation, a consistent pattern emerges where fractures in both models initiate at triple junctions—locations where three grain boundaries intersect. A significant disparity in fracture elongation is evident between the two orientation configurations: the SD-direction model demonstrates substantially greater ductility, achieving approximately 27% elongation before failure, whereas the TD-direction model exhibits limited elongation of only about 18%. These computational findings corroborate existing experimental research, which has established that specimens fabricated in the SD direction possess enhanced ductility compared to their TD-direction counterparts. In all cases, fractures initiate at grain boundaries and subsequently propagate along these interfaces until complete material separation occurs.
To elucidate the progressive fracture behavior of the RVE model under uniaxial tensile loading, we extracted and analyzed the damage variable (SDEG) contour maps throughout the crack propagation process, as illustrated in Figure 8. These sequential images capture the complete evolution from crack initiation through propagation to ultimate fracture under sustained uniaxial tension. Five critical stages representing characteristic mechanical behaviors were selected for comprehensive analysis.
At 7.3% tensile strain, the cohesive elements begin to exhibit initial stiffness degradation, signaling the onset of crack nucleation. Although no macroscopically visible cracks or significant cohesive element deformation are apparent at this stage, incipient micro-cracks have formed at the locations highlighted in red, with stiffness degradation quantitatively detectable through numerical analysis. As tensile strain progresses to 9.5%, the cohesive elements manifest substantial stiffness deterioration, with micro-cracks becoming clearly visible at triple junctions where the grain boundaries intersect. These crack initiation sites correspond precisely to regions of stress concentration, conforming to the well-established experimental observation that fracture nucleation preferentially occurs in high-stress regions. Despite this progressive damage to cohesive elements and associated micro-crack formation, the global stress–strain response of the RVE model remains in the strain hardening regime. With continued external loading, cohesive element degradation intensifies and propagates to additional locations, gradually dominating the mechanical response. When tensile strain reaches 14.4%, cohesive elements near a second stress concentration region experience complete degradation (SDEG = 1), indicating total loss of load-bearing capacity. In accordance with the simulation parameters, these failed cohesive elements are removed from the model, resulting in distinct, observable cracks. During subsequent deformation, these primary cracks propagate continuously along grain boundaries with increasing strain, while secondary micro-cracks simultaneously develop throughout other regions of the model. The proliferation of these multiple crack networks progressively diminishes the model’s residual strength, initiating a load-shedding process that ultimately culminates in complete material fracture.

4.4. Influence of Grain Boundary Strength

Grain boundaries, the interfacial regions between adjacent crystalline grains, play a pivotal role in determining both the strength and ductility of metallic materials. The intrinsic strength of these boundaries governs their structural stability and resistance to tensile deformation, thereby significantly influencing the overall mechanical integrity and deformation behavior of the material. In this study, we hypothesized that stainless-steel specimens fabricated using varied process parameters during additive manufacturing would develop fundamentally different grain boundary characteristics and strengths.
To systematically investigate this hypothesis within our computational framework, we maintained the cohesive model parameters established in the preceding section while strategically varying the maximum traction forces of the cohesive elements across three distinct values: 500 MPa, 550 MPa, and 600 MPa. Throughout these simulations, crystal plasticity parameter settings remained constant, while crystallographic orientations were configured to represent both TD (transverse direction) and SD (scanning direction) forming orientations. The resulting stress–strain responses from these six distinct RVE model configurations are illustrated in Figure 9.
The analysis of these results reveals a consistent and significant trend: models with an SD forming direction consistently demonstrate superior mechanical performance, exhibiting both enhanced strength and improved ductility compared to their TD counterparts. This observation underscores that crystallographic orientation and forming direction exert a more profound influence on overall mechanical behavior than variations in grain boundary strength. Comparative assessment of the stress–strain curves further indicates that incremental increases in maximum traction force (from 500 MPa to 550 MPa to 600 MPa) correlate with progressive improvements in both material strength and ductility.
Notably, however, when the maximum traction force reaches 600 MPa, the material exhibits negligible additional enhancement in mechanical strength. This plateau effect emerges because at such elevated grain boundary strengths, the interfaces no longer constitute the limiting factor in determining fracture strength. Instead, extensive plastic shear strain accumulates within the grain interiors, shifting the dominant failure mechanism from interfacial separation to intragranular deformation. In this regime, the crystal plasticity characteristics become the primary determinant of material strength. During continued loading, widespread crystallographic slip occurs across numerous grains throughout the microstructure, ultimately triggering load redistribution and the onset of material softening behavior.

4.5. Fracture Performance Parameter Simulation

The RVE (representative volume element) finite element model provides a sophisticated framework for simulating material mechanical behavior at the mesoscopic scale, effectively characterizing the microscopic mechanical properties of materials under uniaxial tensile loading. In this section, we implement a hierarchical submodeling technique to systematically map the stress–strain responses derived from our RVE models to a macroscopic CT (compact tension) specimen model, thereby facilitating a comprehensive analysis of material mechanical performance at the macroscopic scale.
The material constitutive relationships established through RVE model simulations are strategically incorporated into the CT specimen finite element model depicted in Figure 10. Specifically, the region surrounding the crack tip is designated as the submodel domain, wherein the mechanical response characteristics obtained from the RVE model under uniaxial tension are implemented as the governing elastoplastic constitutive behavior. The remaining portions of the model are assigned the macroscopic mechanical properties of the SLM316L stainless-steel specimen. The CT specimen finite element model is dimensioned with planar measurements of 75 mm × 75 mm and a uniform thickness of 5 mm. Boundary conditions are configured with fixed constraints applied to the coupling point of the lower circular aperture, while the coupling point of the upper circular aperture is subjected to a prescribed displacement of 1 mm. A seam definition is implemented at the crack tip, accompanied by a graduated mesh refinement pattern that progressively increases element density toward the crack tip region. The computational domain is discretized using CPS4 elements (four-node bilinear plane stress quadrilateral elements).
Figure 11 illustrates six distinct curves representing the J-integral evolution obtained from simulations utilizing the various RVE-derived stress–strain relationships described previously. All simulation results demonstrate consistent behavioral patterns: as the material approaches the fracture threshold, the J-integral values exhibit a pronounced rapid increase, corresponding to significant plastic deformation accumulation in the vicinity of the crack tip. This accelerated growth continues until specific grain boundaries initiate fracture and subsequent load redistribution occurs, at which point the J-integral values transition to a relative plateau. Notably, the J-integral magnitudes associated with models incorporating the SD forming direction consistently surpass those of their TD-direction counterparts across all simulation scenarios. The results further demonstrate that increasing maximum traction force values correlate with enhanced resistance to fracture initiation. When the maximum traction force exceeds a critical threshold, grain boundaries develop substantial resistance to crack propagation, causing the dominant fracture mechanism to transition from interfacial separation to intragranular plastic slip. Collectively, these computational findings establish that specimens fabricated in the SD forming direction exhibit superior comprehensive mechanical performance characteristics, including enhanced yield strength, fracture resistance, elongation capacity, and overall fracture toughness.

5. Conclusions

Based on crystal plasticity finite element theory, room-temperature uniaxial tensile experiments, materials science experiments, and crystal plasticity finite element simulations were conducted to investigate the microscopic mechanical behavior and fracture properties of SLM316L stainless steel. The main conclusions are as follows:
(1)
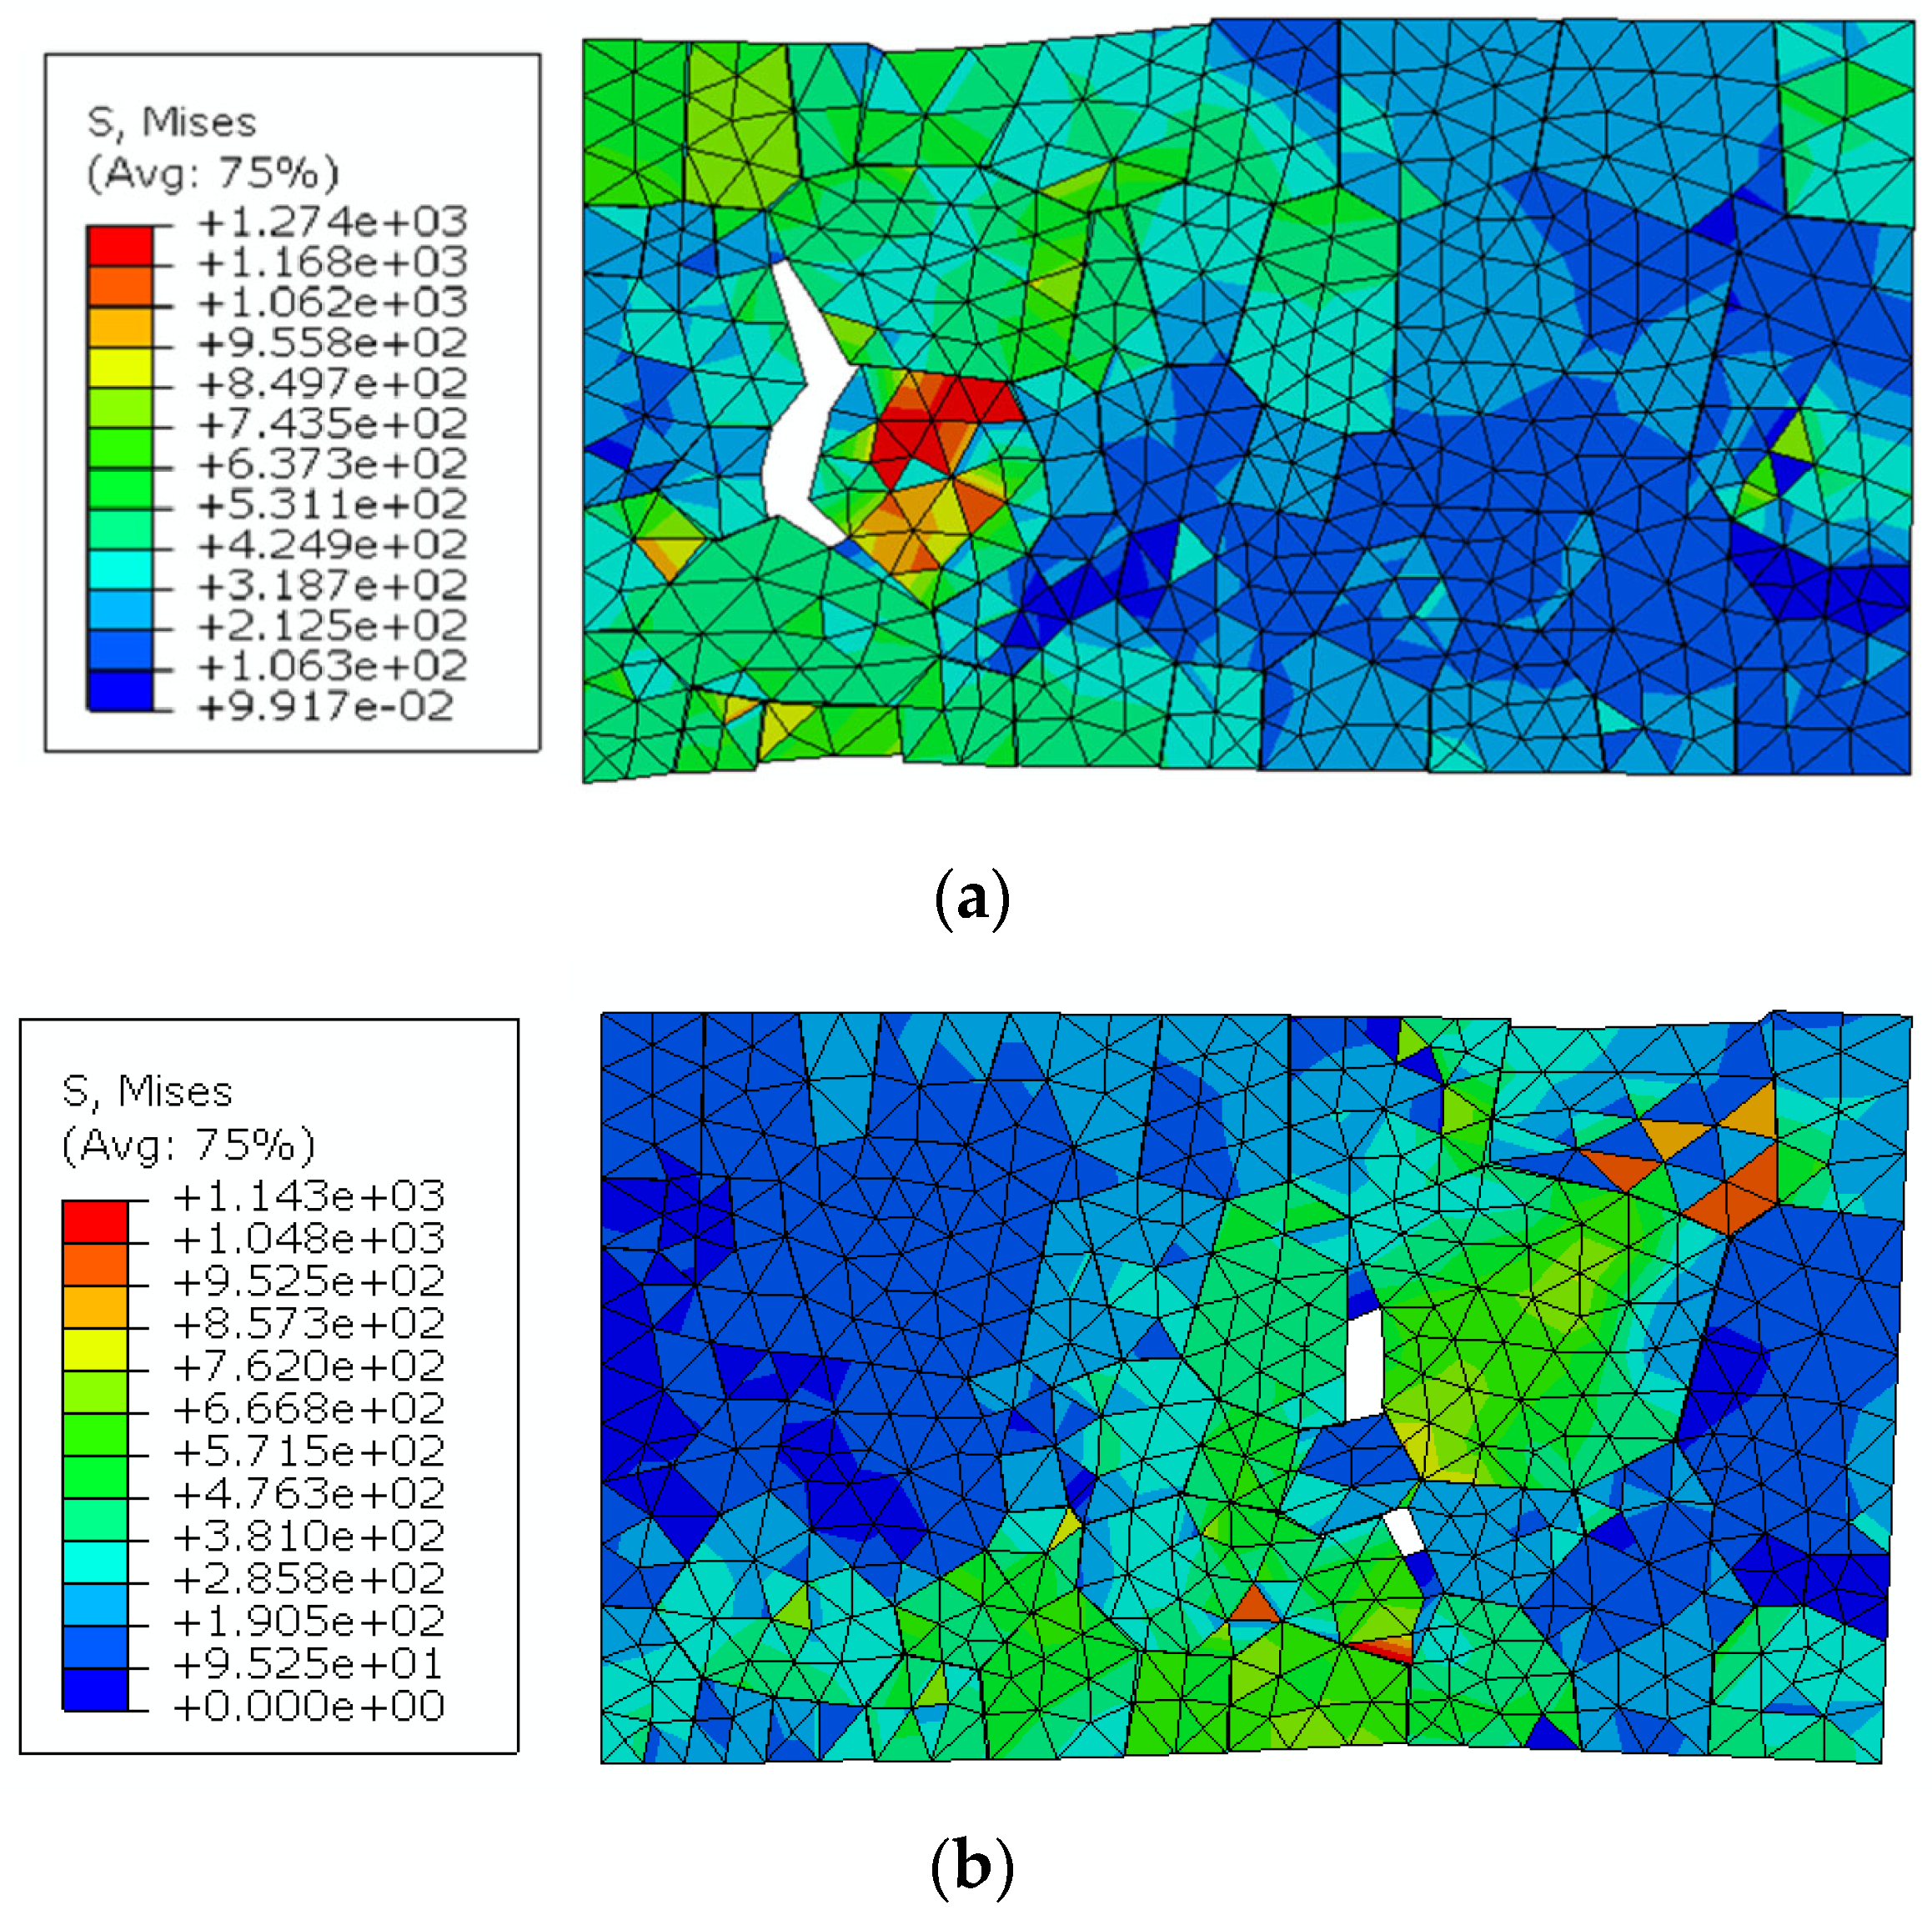
The RVE model exhibited significant anisotropy at the mesoscopic level. Considering microstructural characteristics, under uniaxial tensile loading, several stress concentration regions appeared, predominantly at triple-grain boundaries. The extracted accumulated plastic shear strain shows a banded distribution, forming a 45° angle with the loading direction. The extracted cumulative plastic shear strain also indicated that grains accumulate varying degrees of plastic shear strain under external loading based on different activated slip systems, showing strong dependence on grain orientation.
(2)
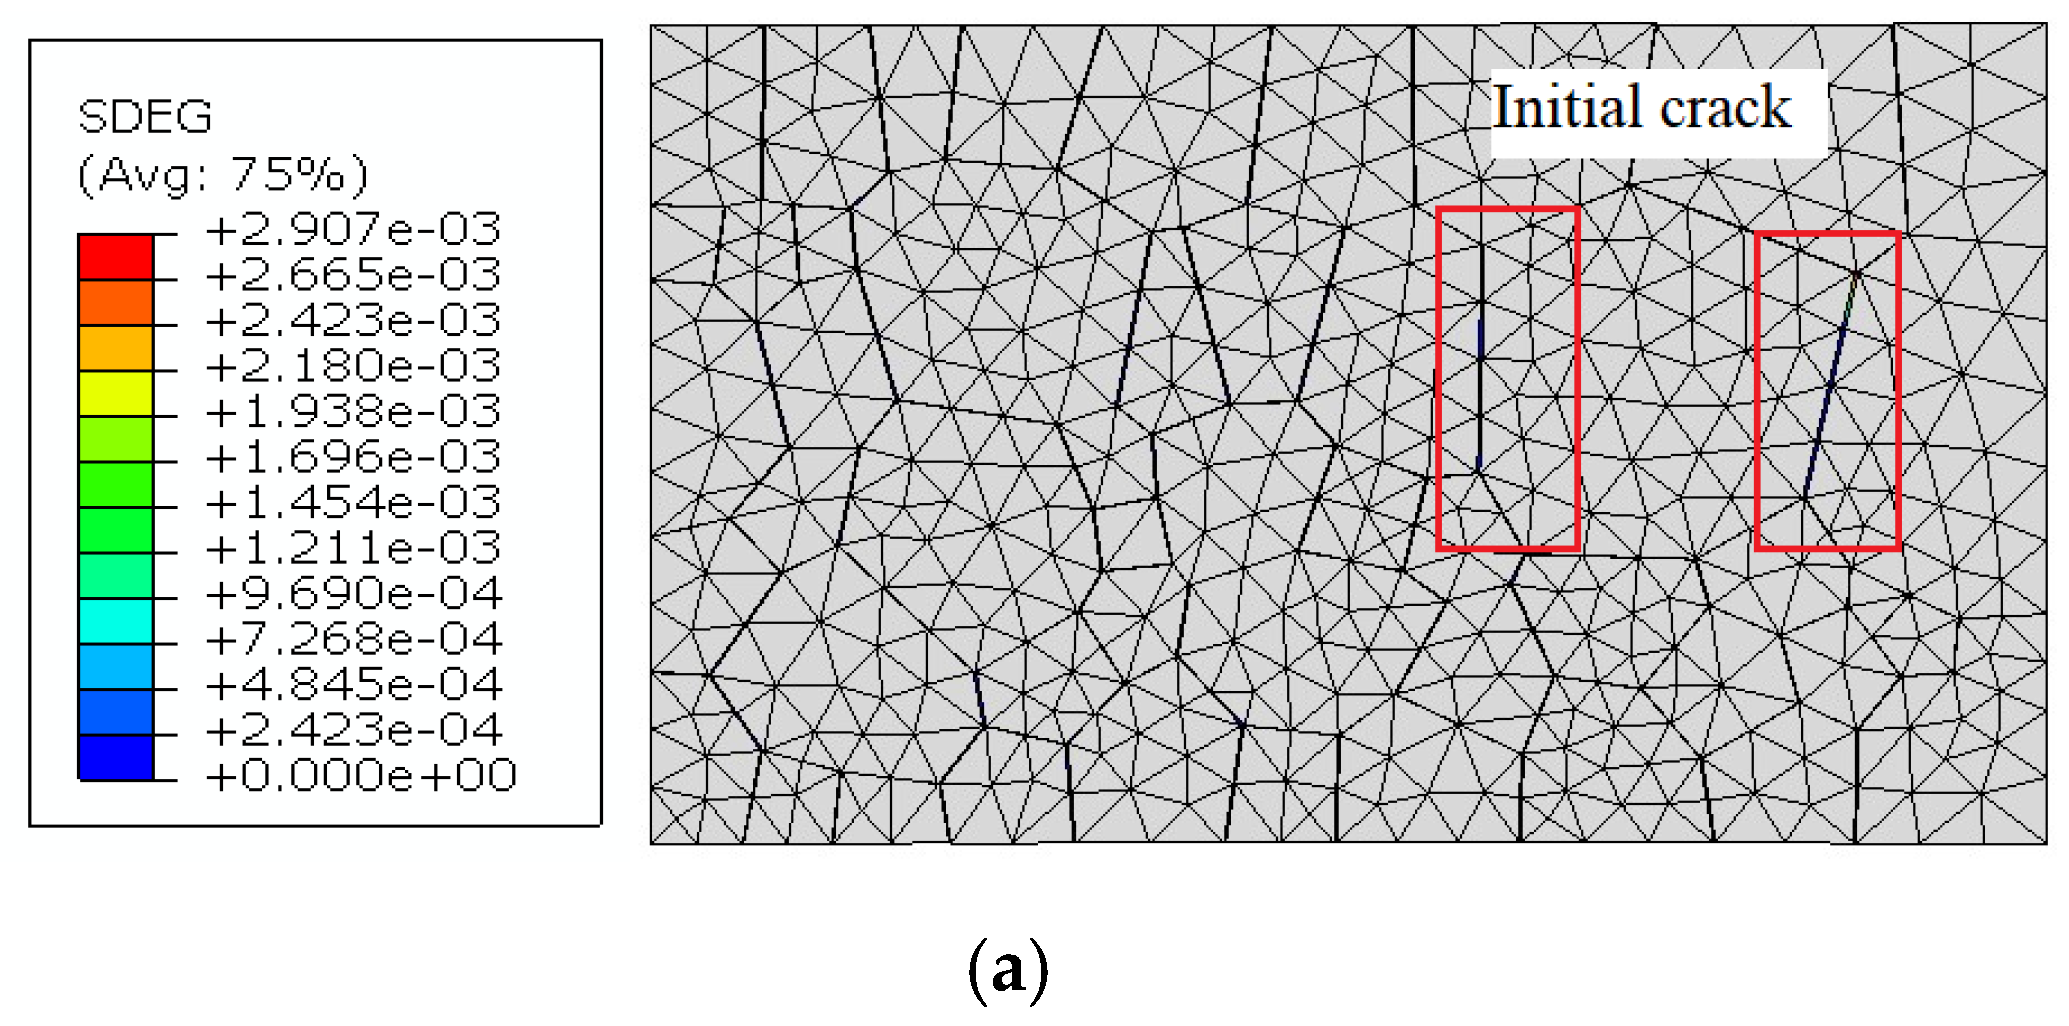
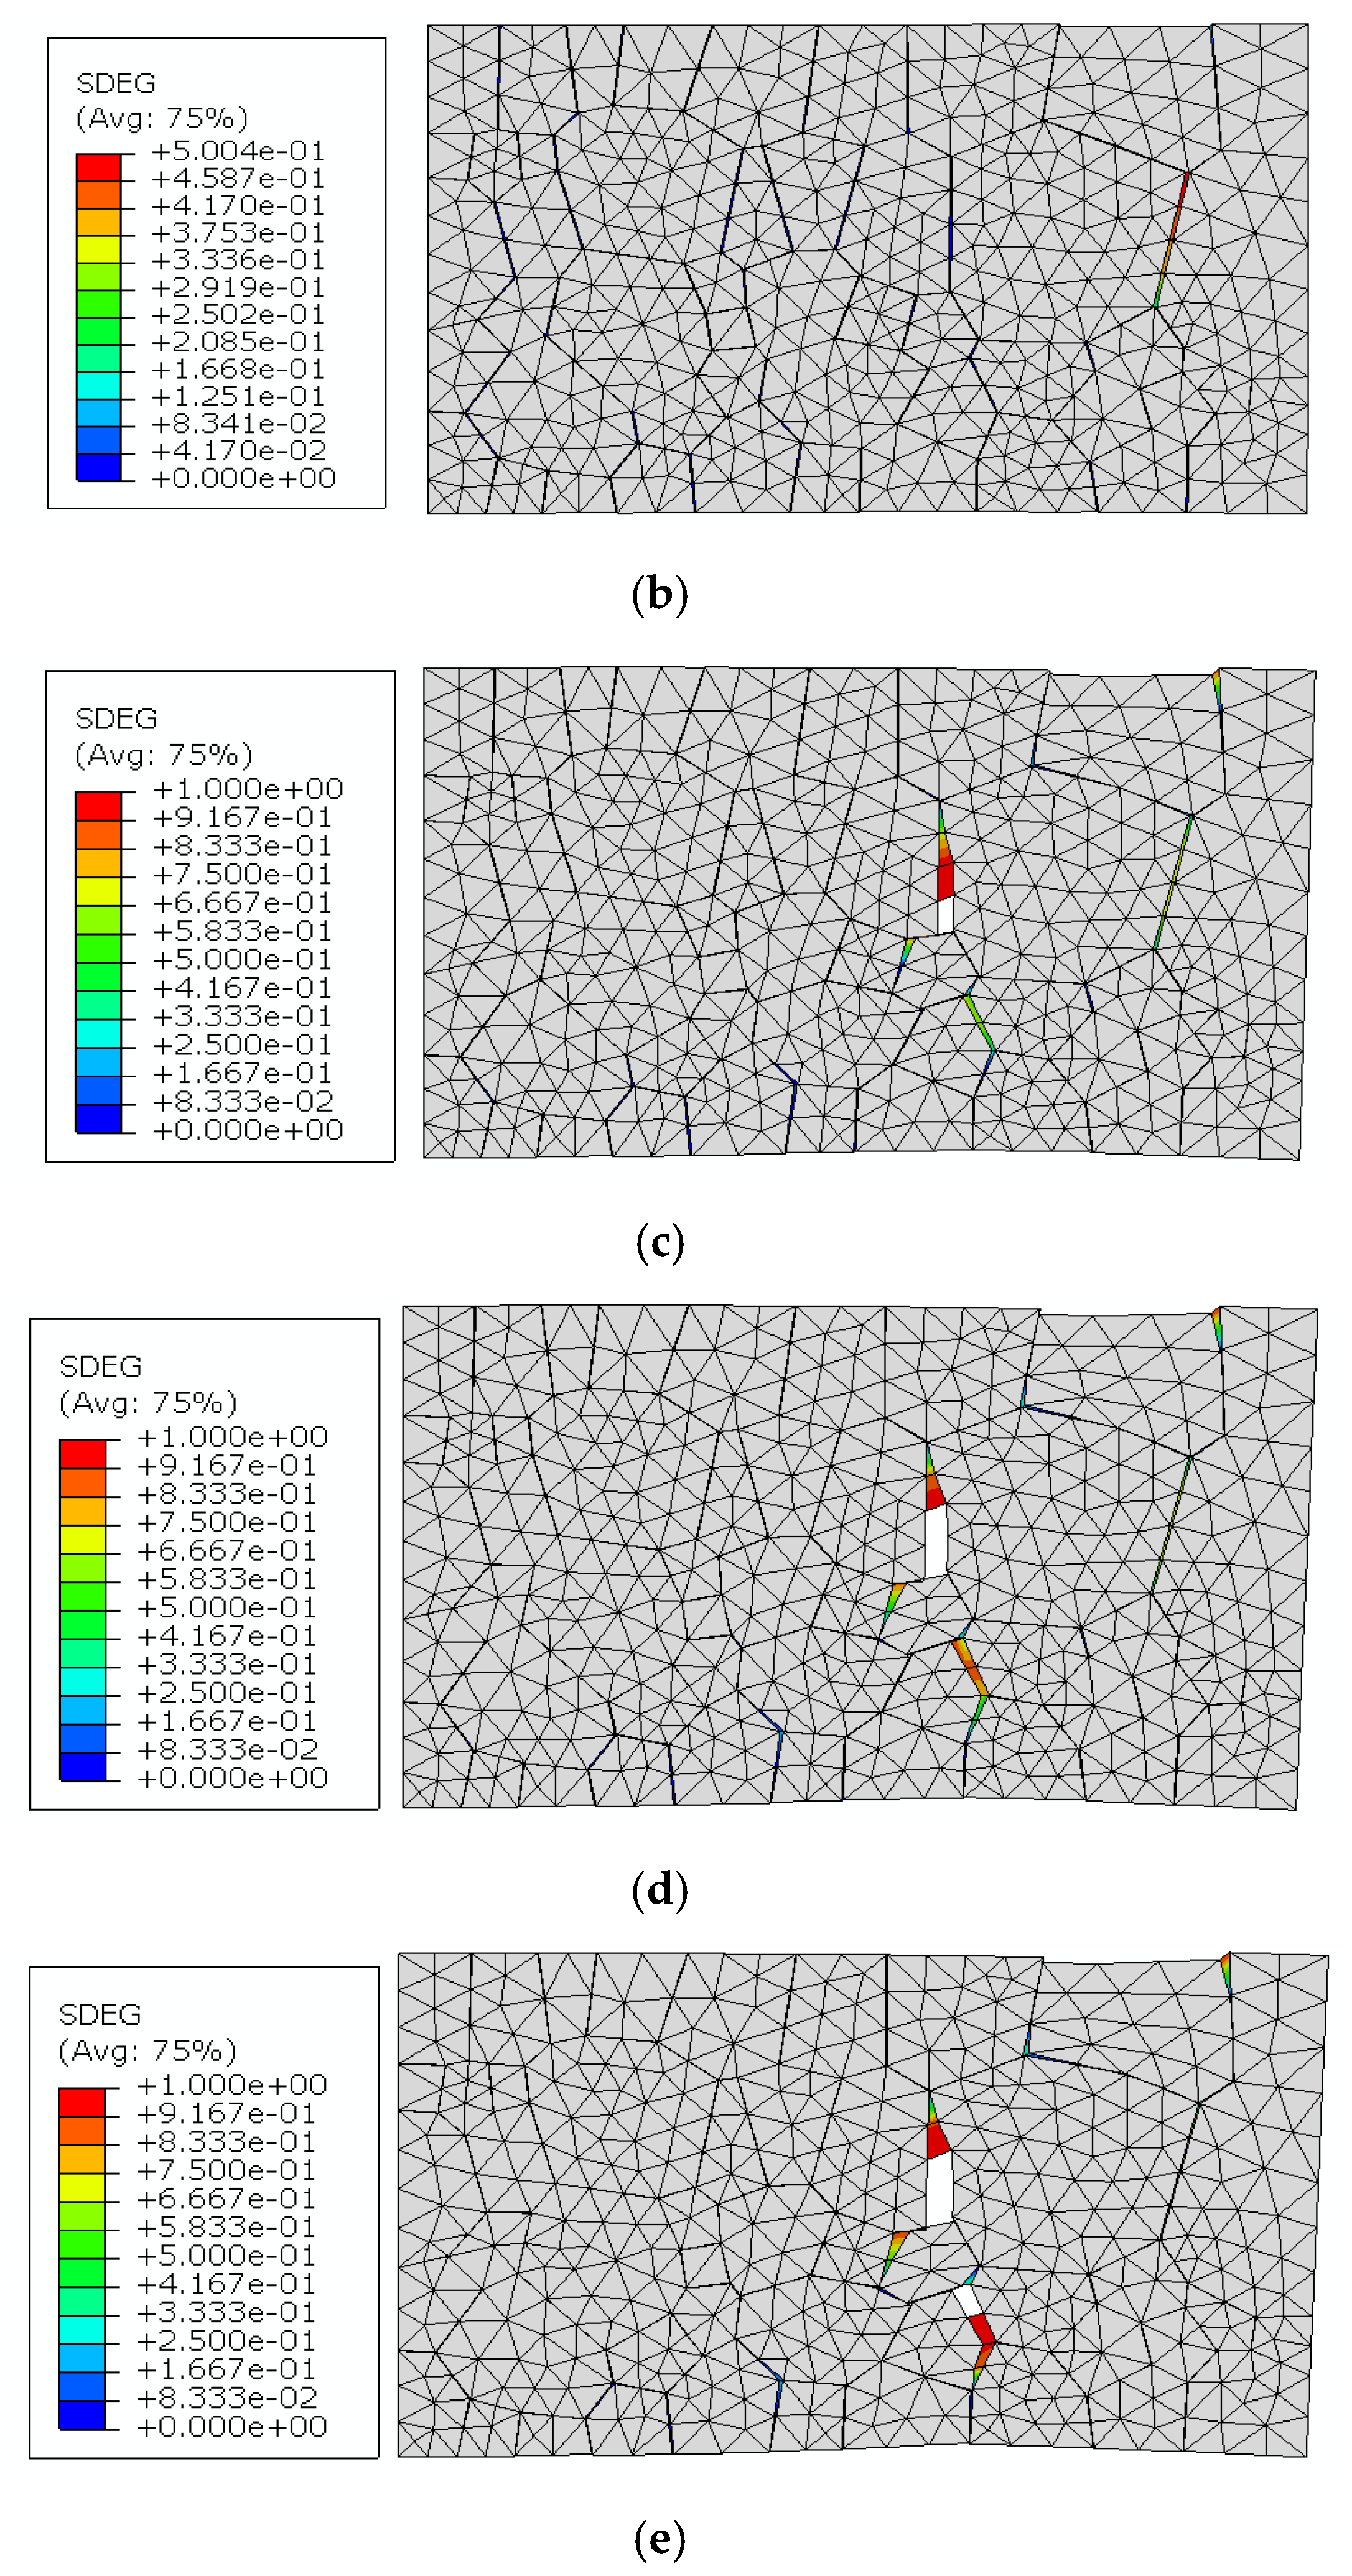
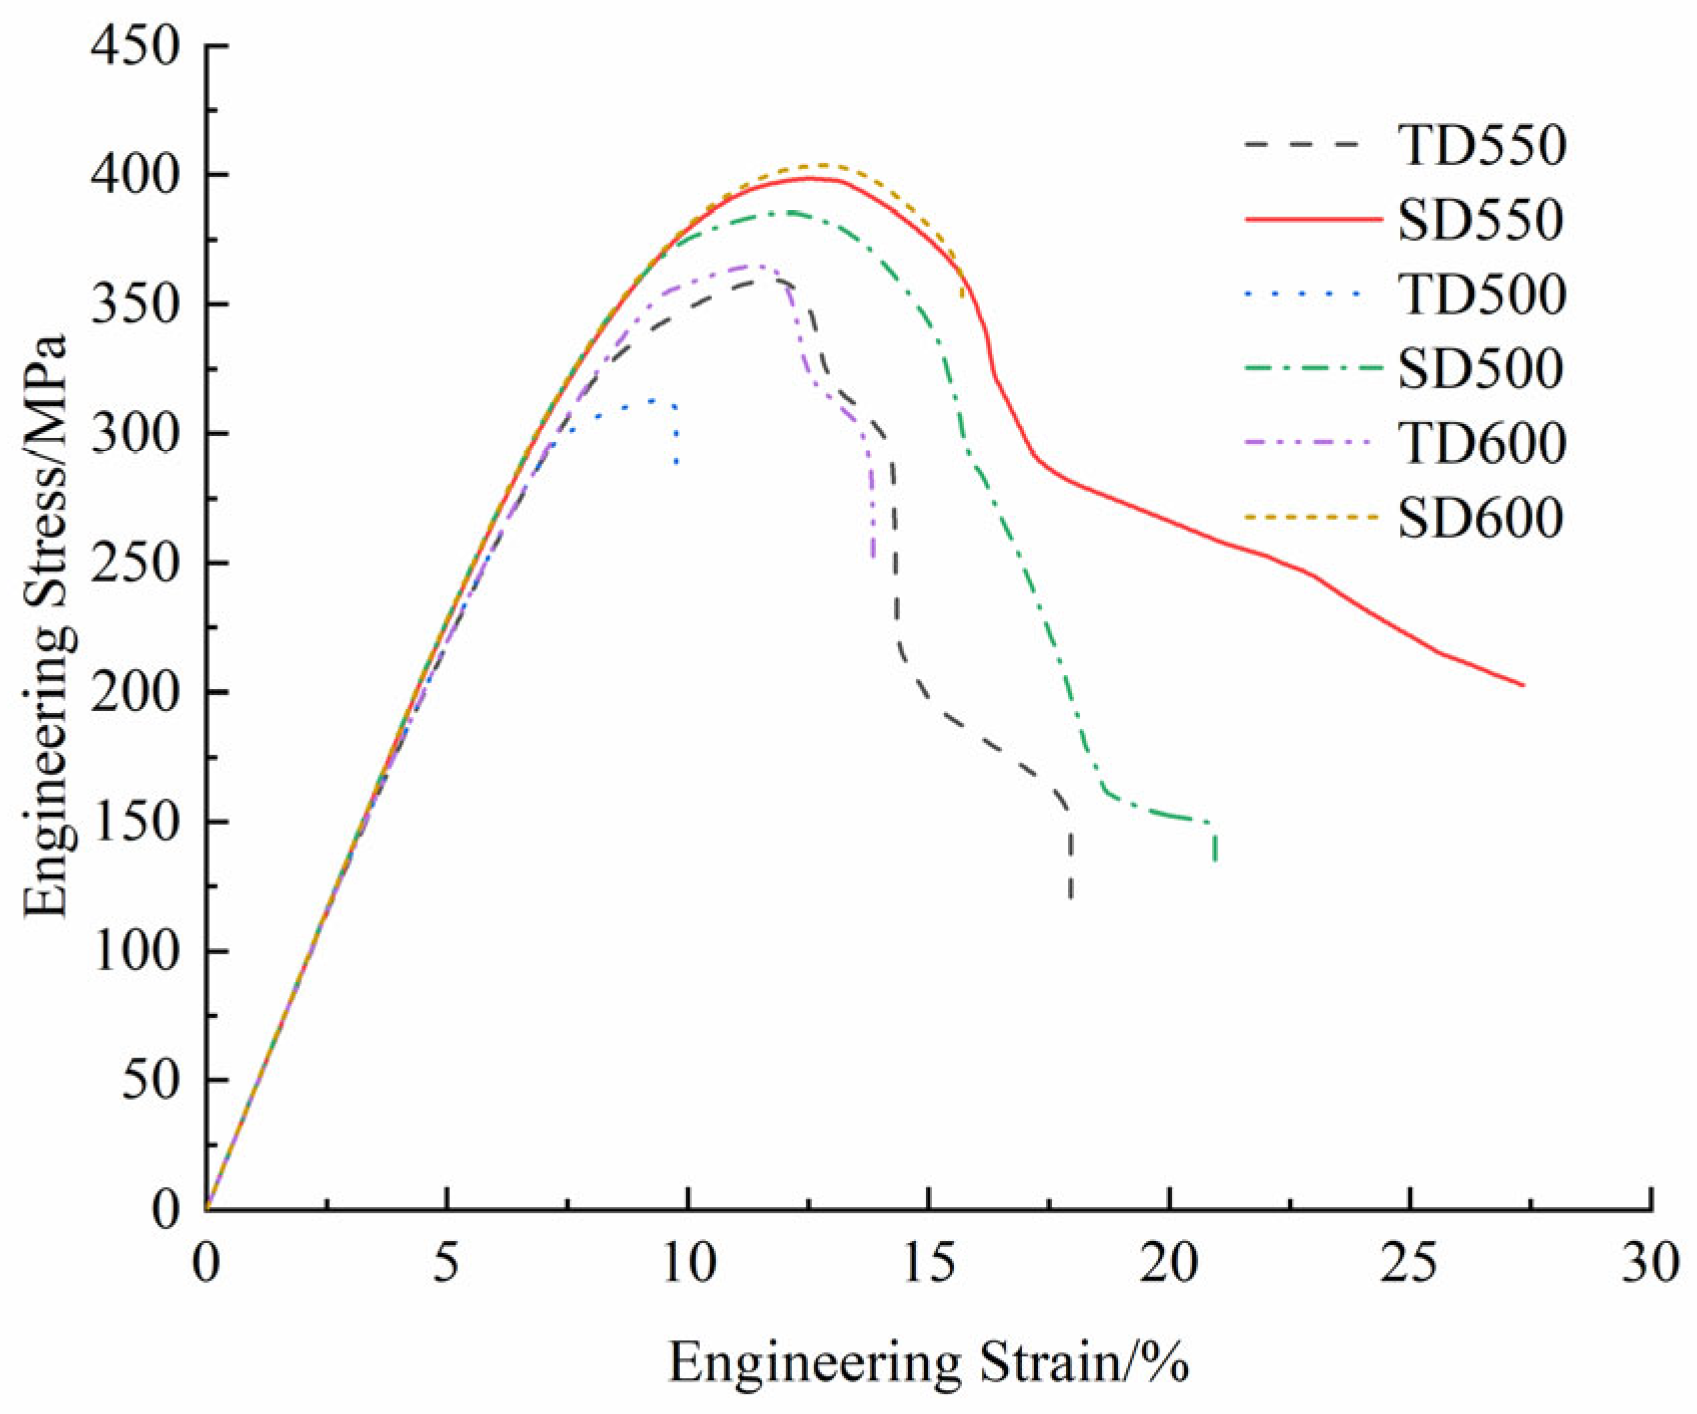
Generally, grain boundaries tend to be more brittle than grains. Building upon the established RVE model, cohesive elements were inserted at grain boundaries to simulate fracture behavior, creating an RVE model that reflects forming direction and grain boundary strength. The SD-direction model had an elongation of about 27%, while the TD-direction model had an elongation of only about 18%. The model in the SD direction exhibited delayed fracture compared to the TD direction, and also demonstrated greater elongation at final fracture than the TD-direction model. This is attributed to grain orientations in the SD direction inhibiting slip and dislocation within the grains. Furthermore, the results showed that when the corresponding tensile strain was 9.5%, the cohesive elements had already shown significant stiffness degradation, with microcracks appearing at the triple-grain junctions. When the tensile strain was 14.4%, the cohesive elements failed and macroscopic cracks occurred.
(3)
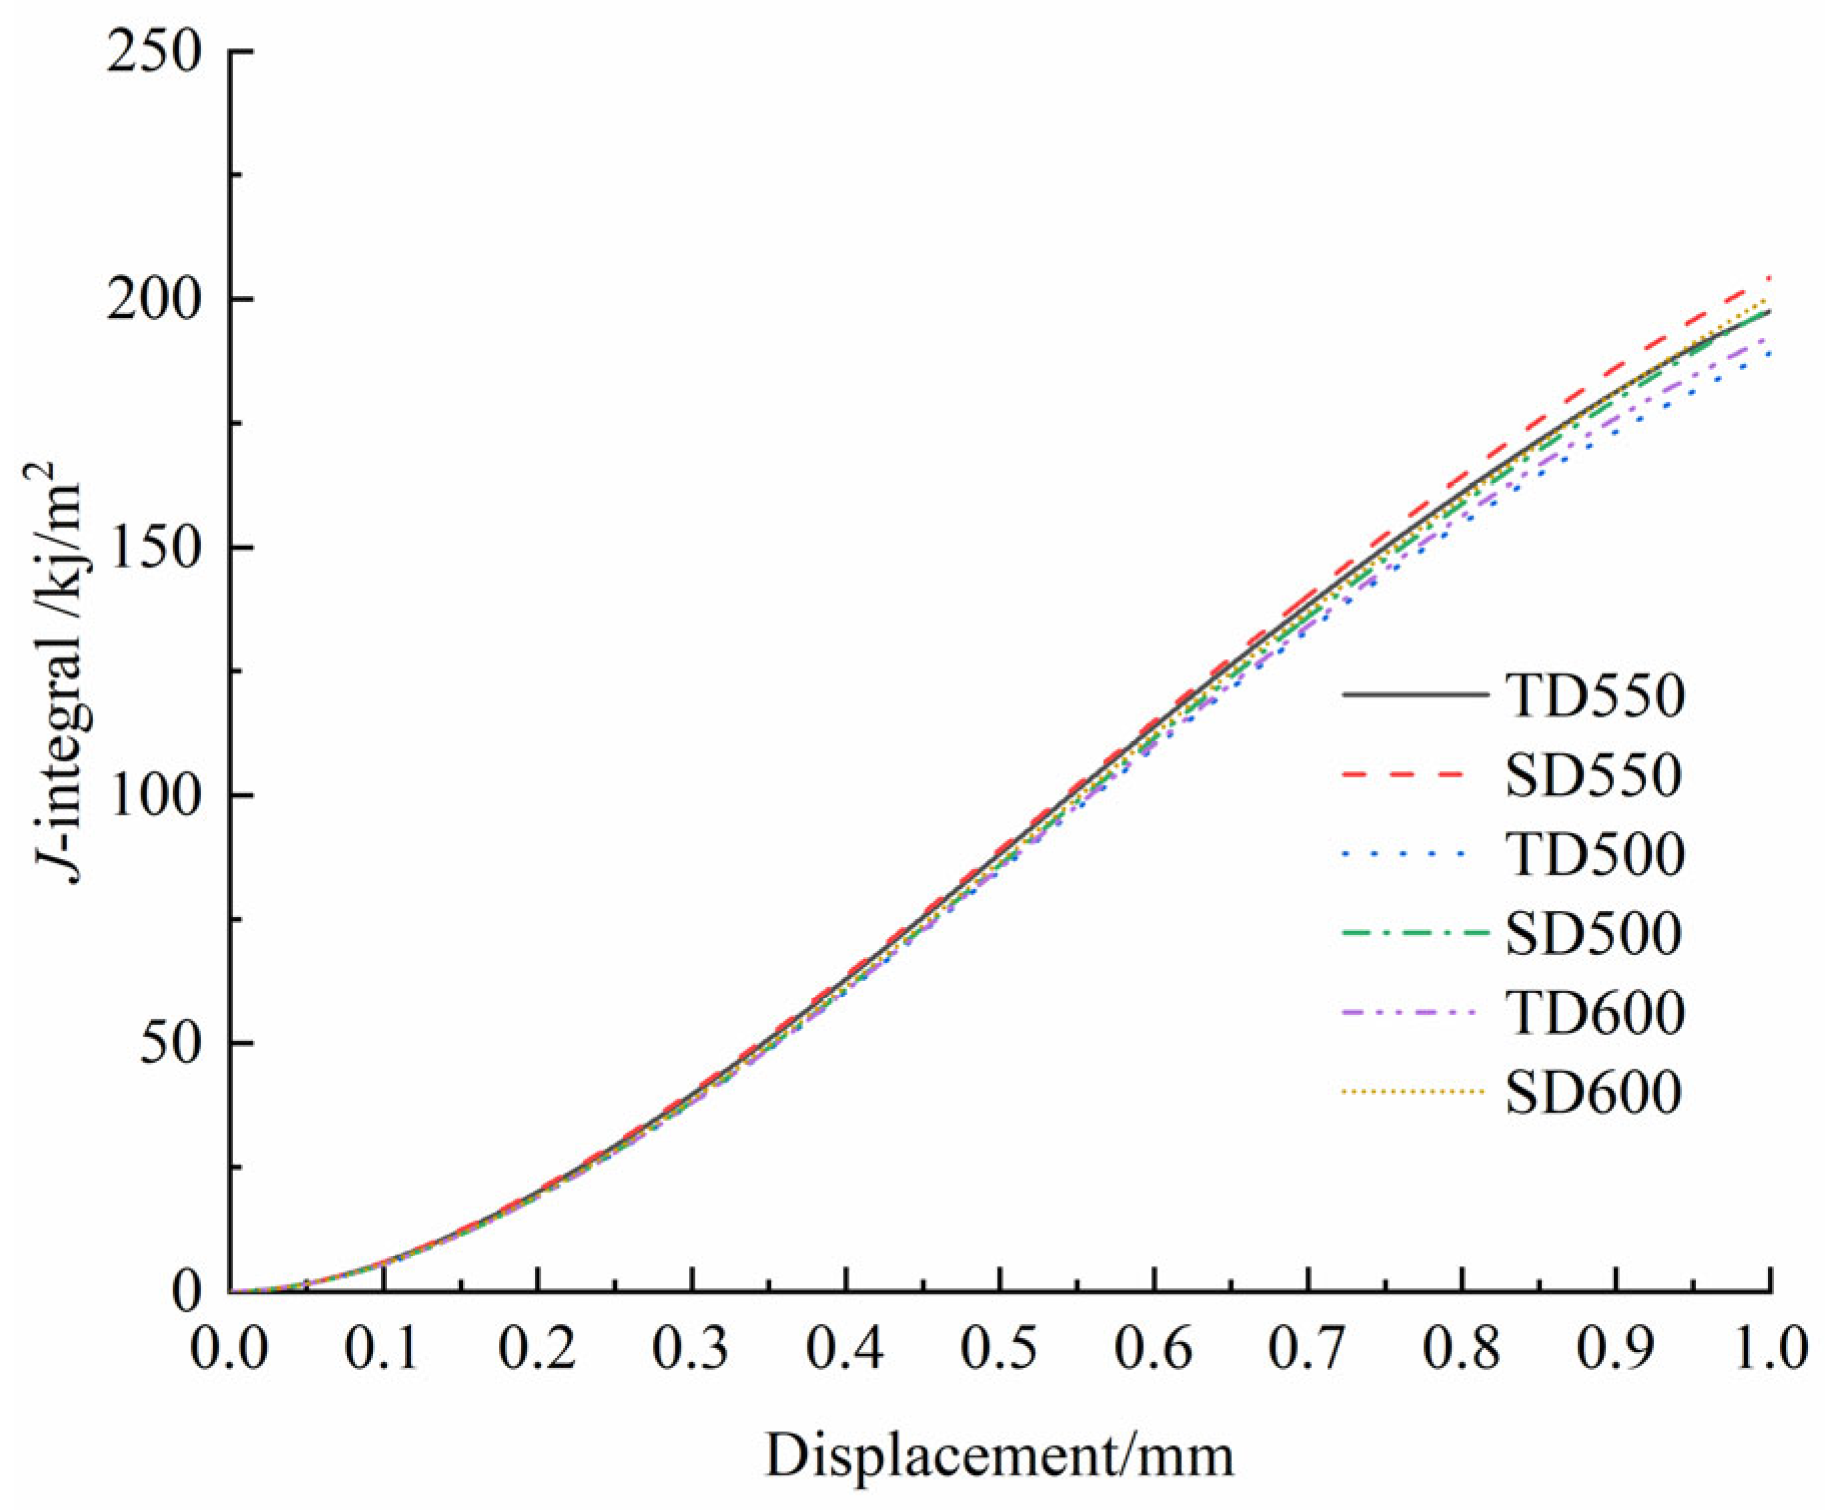
The J-integral of the material simulated by combining the macroscopic CT model and the RVE model during the loading process indicated that the maximum traction force of the cohesive elements also affects the fracture properties of the material. Compared to high grain boundary strength, weaker grain boundary strength caused the cohesive elements in the model to reach the threshold earlier, i.e., the model began to fracture with damage. However, the cohesive elements are no longer the main factor for fracture occurrence when the maximum traction force reaches 600 MPa; they are replaced by the plastic slip within the grains.
In future research, more detailed EBSD and SEM tests will be conducted to replicate and modify the proposed FE model, particularly considering the actual morphology of grain growth in SLM316L stainless steel. A CPFE-CZM model is suggested to enhance the calculation accuracy based on comparisons in the tensile tests. Furthermore, a 3D FE model considering X-Y, Y-Z, and X-Z should be calibrated and validated.

Author Contributions

G.Z.: conceptualization, methodology, resources, validation, and supervision; Z.H.: writing—original draft, experimental study; B.D.: methodology, writing—editing and review; R.G.: validation, supervision, and visualization. All authors have read and agreed to the published version of the manuscript.

Funding

This research was funded by Key Project of Education Department of Hubei Province [grant D20211108] and Hubei Province Key Research and Development Plan Project [grant 2023BAA019-2].

Data Availability Statement

The original contributions presented in this study are included in the article. Further inquiries can be directed to the corresponding author.

Conflicts of Interest

The authors declare no conflicts of interest.

References

  1. Wong, K.V.; Hernandez, A. A review of additive manufacturing. Int. Sch. Res. Not. 2012, 2012, 208760. [Google Scholar] [CrossRef]
  2. Abdulhameed, O.; Al-Ahmari, A.; Ameen, W.; Mian, S.H. Additive manufacturing: Challenges, trends, and applications. Adv. Mech. Eng. 2019, 11, 1687814018822880. [Google Scholar] [CrossRef]
  3. Frazier, W.E. Metal additive manufacturing: A review. J. Mater. Eng. Perform. 2014, 23, 1917–1928. [Google Scholar] [CrossRef]
  4. Song, Y.N.; Sun, Q.; Guo, K.; Liu, F.; Ma, J. Effect of scanning strategies on the microstructure and mechanical behavior of 316L stainless steel fabricated by selective laser melting. Mater. Sci. Eng. A 2020, 793, 139879. [Google Scholar] [CrossRef]
  5. Jaskari, M.; Ghosh, S.; Miettunen, I.; Karjalainen, L.P. Tensile properties and deformation of AISI 316l additively manufactured with various energy densities. Materials 2021, 14, 5809. [Google Scholar] [CrossRef]
  6. Zhai, W.; Zhou, W.; Nai, S.M.L. Grain refinement of 316L stainless steel through in-situ alloying with Ti in additive manufacturing. Mater. Sci. Eng. A 2022, 840, 142912. [Google Scholar] [CrossRef]
  7. Piazza, S.; Merrigan, B.; Dowling, D.P.; Monaghan, M.; Lennon, A.; Purcell, P.J. The effects of geometry and laser power on the porosity and melt pool formation in additively manufactured 316L stainless steel. Int. J. Adv. Manuf. Technol. 2020, 111, 1457–1470. [Google Scholar] [CrossRef]
  8. Fri, K.; Laazizi, A.; Bensada, M.; Diyer, Z.; Bahram, A. Microstructural and heat treatment analysis of 316L elaborated by SLM additive manufacturing process. Int. J. Adv. Manuf. Technol. 2023, 124, 2289–2297. [Google Scholar] [CrossRef]
  9. Zinovieva, O.; Romanova, V.; Balokhonov, R. Effects of scanning pattern on the grain structure and elastic properties of additively manufactured 316L austenitic stainless steel. Mater. Sci. Eng. A 2022, 832, 142447. [Google Scholar] [CrossRef]
  10. Zhang, L.; Ma, Q.; Ding, J.; Qu, S.; Fu, J.; Fu, M.W.; Song, X.; Wang, M.Y. Design of elastically isotropic shell lattices from anisotropic constitutive materials for additive manufacturing. Addit. Manuf. 2022, 59, 103185. [Google Scholar] [CrossRef]
  11. Javidrad, H.R.; Salemi, S. Determination of elastic constants of additive manufactured Inconel 625 specimens using an ultrasonic technique. Int. J. Adv. Manuf. Tech. 2020, 107, 4597–4607. [Google Scholar] [CrossRef]
  12. Zinovieva, O.; Zinoviev, A.; Patel, M.N.; Molotnikov, A.; Easton, M.A. Modelling grain refinement under additive manufacturing solidification conditions using high performance cellular automata. Mater. Des. 2024, 245, 113248. [Google Scholar] [CrossRef]
  13. Barkia, B.; Vallet, M.; Tanguy, A.; Auger, T.; Héripré, E. New insights into microstructure evolution and deformation mechanisms in additively manufactured 316L stainless steel. Mater. Sci. Eng. A 2025, 934, 148327. [Google Scholar] [CrossRef]
  14. Li, J.N.; Gao, D.; Lu, Y.; Hao, Z.P.; Wang, Z.Q. Mechanical properties and microstructure evolution of additive manufactured 316L stainless steel under dynamic loading. Mater. Sci. Eng. A 2022, 855, 143896. [Google Scholar] [CrossRef]
  15. Suryawanshi, J.; Prashanth, K.G.; Ramamurty, U. Mechanical behavior of selective laser melted 316L stainless steel. Mater. Sci. Eng. A 2017, 696, 113–121. [Google Scholar] [CrossRef]
  16. Byun, T.S.; Gussev, M.N.; Lach, T.G. Deformation and Fracture Behavior of Additively Manufactured 316L Stainless Steel. JOM 2024, 76, 362–378. [Google Scholar] [CrossRef]
  17. Solberg, K.; Guan, S.; Razavi, S.M.J.; Welo, T.; Chan, K.C.; Berto, F. Fatigue of additively manufactured 316L stainless steel: The influence of porosity and surface roughness. Fatigue Fract. Eng. Mater. Struct. 2019, 42, 2043–2052. [Google Scholar] [CrossRef]
  18. Ahmadi, A.; Mirzaeifar, R.; Moghaddam, N.S.; Turabi, A.S.; Karaca, H.E.; Elahinia, M. Effect of manufacturing parameters on mechanical properties of 316L stainless steel parts fabricated by selective laser melting: A computational framework. Mater. Des. 2016, 112, 328–338. [Google Scholar] [CrossRef]
  19. Cai, W.; Sun, C.; Wang, C.; Gao, Y.; Chen, K. Modelling of the intergranular fracture of TWIP steels working at high temperature by using CZM–CPFE method. Int. J. Plast. 2022, 156, 103366. [Google Scholar] [CrossRef]
  20. Marattukalam, J.J.; Karlsson, D.; Pacheco, V.; Beran, P.; Wiklund, U.; Jansson, U.; Hjörvarsson, B.; Sahlberg, M. The effect of laser scanning strategies on texture, mechanical properties, and site-specific grain orientation in selective laser melted 316L SS. Mater. Des. 2020, 193, 108852. [Google Scholar] [CrossRef]
  21. Zhao, C.; Bai, Y.; Zhang, Y.; Wang, H.; Chen, C.; Shi, J. Influence of scanning strategy and building direction on microstructure and corrosion behaviour of selective laser melted 316L stainless steel. Mater. Des. 2021, 209, 109999. [Google Scholar] [CrossRef]
  22. Nazari-Onlaghi, S.; Li, G.; Vanmeensel, K.; Seefeldt, M. Deformation texture in LPBF 316L studied by different crystal plasticity models. Mater. Sci. Eng. A 2025, 924, 147769. [Google Scholar] [CrossRef]
  23. Wang, Z.; Jiang, B.; Wu, S.; Liu, W. Anisotropic tension-compression asymmetry in SLM 316L stainless steel. Int. J. Mech. Sci. 2023, 246, 108139. [Google Scholar] [CrossRef]
  24. Nowell, M.M.; Witt, R.A.; True, B.W. EBSD sample preparation: Techniques, tips, and tricks. Microsc. Today 2005, 13, 44–49. [Google Scholar] [CrossRef]
  25. Wilkinson, A.J.; Britton, T.B. Strains, planes, and EBSD in materials science. Mater. Today 2012, 15, 366–376. [Google Scholar] [CrossRef]
  26. Andani, M.T.; Karamooz-Ravari, M.R.; Mirzaeifar, R.; Ni, J. Micromechanics modeling of metallic alloys 3D printed by selective laser melting. Mater. Des. 2018, 137, 204–213. [Google Scholar] [CrossRef]
  27. Aurenhammer, F.; Klein, R. Voronoi Diagrams. In Handbook of Computational Geometry; Sack, J.R., Urrutia, J., Eds.; Elsevier: Amsterdam, The Netherlands, 2000; pp. 201–290. [Google Scholar]
  28. Du, Q.; Faber, V.; Gunzburger, M. Centroidal Voronoi tessellations: Applications and algorithms. SIAM Rev. 1999, 41, 637–676. [Google Scholar] [CrossRef]
  29. Quey, R.; Dawson, P.R.; Barbe, F. Large-scale 3D random polycrystals for the finite element method: Generation, meshing and remeshing. Comput. Methods Appl. Mech. Eng. 2011, 200, 1729–1745. [Google Scholar] [CrossRef]
  30. Quey, R.; Renversade, L. Optimal polyhedral description of 3D polycrystals: Method and application to statistical and synchrotron X-ray diffraction data. Comput. Methods Appl. Mech. Eng. 2018, 330, 308–325. [Google Scholar] [CrossRef]
  31. Quey, R.; Villani, A.; Maurice, C. Nearly uniform sampling of crystal orientations. J. Appl. Crystallogr. 2018, 51, 1162–1173. [Google Scholar] [CrossRef]
  32. Huang, Y. A User-Material Subroutine Incorporating Single Crystal Plasticity in the ABAQUS Finite Element Program. Ph.D. Thesis, Harvard University, Cambridge, MA, USA, 1991. [Google Scholar]
Figure 1. Specimen fabrication: (a) schematic diagram of specimen dimensions; (b) SLM scanning strategy; (c) fabricated specimen.
Metals 15 00567 g001
Figure 2. EBSD images of the fabricated sample: (a) EBSD inverse pole figure (IPF); (b) EBSD grain boundary quality map.
Metals 15 00567 g002
Figure 3. Grain size distribution along the X-Y plane of the fabricated sample.
Metals 15 00567 g003
Figure 4. Engineering stress–strain curves: (a) cast 316L stainless steel [15]; (b) SLM316L stainless steel.
Metals 15 00567 g004
Figure 5. Calibration of representative volume element model (RVE): (a) meshing and boundary condition of FE model; (b) comparison of tensile stress–strain curves obtained from experiment and simulation.
Metals 15 00567 g005
Figure 6. RVEs combined with cohesive zone elements: (a) meshing and boundary conditions of FE model (red lines represent CZM elements); (b) comparative stress–strain response curves for RVE models with different grain orientations.
Metals 15 00567 g006
Figure 7. Von Mises stress distribution contour maps of RVE models: (a) SD; (b) TD.
Metals 15 00567 g007
Figure 8. Evolution of damage variable (SDEG) distribution in cohesive elements for the TD-direction model: (a) ɛ = 7.3%; (b) ɛ = 9.5%; (c) ɛ = 14.4%; (d) ɛ = 16.6%; (e) ɛ = 17.9%.
Metals 15 00567 g008aMetals 15 00567 g008b
Figure 9. Comparative stress–strain responses of RVE models with varying cohesive element parameters.
Metals 15 00567 g009
Figure 10. Finite element model of the CT specimen.
Metals 15 00567 g010
Figure 11. J-integral evolution curves obtained from CT specimen finite element simulations.
Metals 15 00567 g011
Table 1. Chemical composition of SLM316L stainless steel (weight percentage %).
Type of ElementCrNiMnMoCSiFe
Content proportions16–1810–1422–30.031Remainder
Table 2. Comparative tensile properties of SLM316L stainless steel and traditionally cast 316L stainless steel.
SampleYield Strength/MPaTensile Strength/MPaElongation/%
SLM316L3625567.5
Rolled316L30668565
Table 3. Crystal plasticity parameters of SLM316L stainless steel.
Material ParameterParameter Value
C i i i i /MPa206,000
C i i i j /MPa206,000
C i j i j /MPa206,000
h 0 /MPa171
τ s /MPa214
τ 0 /MPa156
n 59
q 1.11
γ ( α ) 0.001
Table 4. Cohesive element parameter configurations.
Material ParameterNumerical Value
K n n /MPa206,000
K s s /MPa78,000
K t t /MPa78,000
t n 0 /MPa550
t s 0 /MPa550
t t 0 /MPa550
G n 5.5
Table 5. The distribution probability of Euler angle values.
Euler Angle±7.5°±15°±22.5°±45°
φ 1 0.3820.6820.8660.954
ϕ ****
φ 2 0.3820.6820.8660.954
* means the data along the RD (100) direction actually measured by EBSD experiment.
Disclaimer/Publisher’s Note: The statements, opinions and data contained in all publications are solely those of the individual author(s) and contributor(s) and not of MDPI and/or the editor(s). MDPI and/or the editor(s) disclaim responsibility for any injury to people or property resulting from any ideas, methods, instructions or products referred to in the content.

