Article

Investigation of Microstructural Evolution of Silicon Steel Weldment After Post-Weld Heat Treatment—Simulation and Experimental Study

1
Department of Materials Science and Engineering, National Tsing Hua University, 101, Sec. 2, Kuang-Fu Road, Hsinchu 300044, Taiwan
2
High Entropy Materials Center, National Tsing Hua University, 101, Sec. 2, Kuang-Fu Road, Hsinchu 300044, Taiwan
3
Iron and Steel Research & Development Department, China Steel Corporation, No. 1, Chung Kang Road, Hsiao Kang District, Kaohsiung 812401, Taiwan
*
Author to whom correspondence should be addressed.
Metals 2025, 15(5), 549; https://doi.org/10.3390/met15050549
Submission received: 14 April 2025 / Revised: 9 May 2025 / Accepted: 13 May 2025 / Published: 15 May 2025

Abstract

:
It is important to control the microstructure and properties of a weld for the continuous production of silicon steel sheets. Post-weld heat treatment (PWHT) can be applied to adjust the weld properties; however, research on its application to silicon steel weldments remains limited. This study investigated the microstructure and hardness evolution of the weld after PWHT for high-silicon steel, with Inconel 82 used as the filler material. The weldment contained FCC phase and BCC phase regions, and PWHT were conducted at 520, 620, 720, and 920 °C for 8 h. Experimental observations indicate that G-phase precipitations in FCC phase could increase its hardness, and it peaked at 620 °C with an average hardness of 259 HV. By contrast, the BCC phase region was subjected to martensitic transformation and its hardness increased from 305 to 335 HV after PWHT at 920 °C. To elucidate microstructure evolutions, CALPHAD-based simulations successfully predicted BCC to FCC phase transformation at 920 °C, peak G-phase precipitation at 620 °C, and elemental diffusion at the BCC and FCC interface. The findings indicate that CALPHAD-based simulations offer a robust approach that can be extended to understand the effect of PWHT.

Graphical Abstract

1. Introduction

Silicon steel (Si steel) is a ferromagnetic alloy widely used in power conversion systems due to its excellent magnetic properties. The addition of 2.0–3.5 wt.% Si improves the magnetic performance while maintaining an optimal balance between cost, magnetic efficiency, and processability. As a result, silicon steel is the dominant material for magnetic cores in motors and transformers, accounting for approximately 80% of the global soft magnetic materials market [1,2,3]. Conventionally, Si steel is manufactured in thin sheets ranging from 1 mm to 0.2 mm in thickness, which are stacked together to form magnetic cores [3,4]. To enhance productivity in Si steel strip production, individual steel plates are welded together to facilitate continuous processing [5,6,7]. However, the heterogeneity in mechanical properties across the welded joint poses a significant challenge, particularly when the material is subjected to bending, stretching, or compression during processing. This variation can lead to localized failure, making the control of fusion zone (FZ) ductility a critical factor in ensuring process stability and large-scale manufacturability [6,7]. To investigate the microstructure within the weld bead (WB), Ni-based filler wire is considered a potential candidate for welding Si steel plates [5,8]. It offers an optimal research platform for analyzing elemental distribution and the complex microstructural evolution induced by laser stirring and non-equilibrium solidification during laser welding. However, in practical applications, the dilution of Ni-based filler coupled with the rapid solidification effects of laser welding, leading to the formation of a highly heterogeneous and inhomogeneous microstructure within the WB [5,9,10]. This microstructural heterogeneity can serve as a preferential site for crack initiation and propagation, ultimately compromising the mechanical integrity of the weldment [5,11,12]. To mitigate these issues, PWHT is commonly employed to refine the microstructure and improve the mechanical properties of the FZ [13,14,15].
In recent years, the advance in computational thermodynamics and kinetic simulations has significantly enhanced the understanding of microstructure evolution, reducing the extensive experimental trials in process optimization. These approaches have streamlined the optimization of processing parameters, thereby accelerating the development of new materials and improving existing ones. Thermo-Calc, a software package based on the calculation of phase diagrams (CALPHAD) methodology, is commonly employed for the thermodynamic and kinetic analysis of multicomponent alloy systems. It enables the prediction of phase equilibria, phase formation, and transformation behavior under various thermal conditions [16,17]. The software also incorporates specialized modules for specific simulations. DICTRA is a one-dimensional diffusion simulation tool, allowing the modeling of diffusion-controlled phase transformations, interdiffusion, and homogenization in multicomponent alloys based on thermodynamic and kinetic data [17,18]. TC-PRISMA, a precipitation module, allows for the prediction of nucleation, growth, and the coarsening behavior of precipitates under thermal treatment [17]. Several studies have demonstrated the effectiveness of simulation-based approaches in the understanding of alloy systems [19,20], elemental diffusion mechanisms [21,22], and precipitate evolution [23,24]. These capabilities contribute to the development of desirable microstructures and mechanical performance [25,26,27]. Nonetheless, experimental validation remains essential, particularly for complex material systems such as welded joints. The presence of non-equilibrium solidification, non-equilibrium solidification, non-uniform elemental segregation, and microstructural heterogeneity in weldments presents challenges for modeling. These factors necessitate the integration of computational predictions with experimental observations to verify the reliability and applicability of simulation models.
Studies focused on PWHT for Si steel weldments remain relatively scarce in the literature. This work has systematically investigated the microstructural transformations and the evolution of mechanical properties in Si steel weldments subjected to PWHT. CALPHAD-based computational tools, including Thermo-Calc, DICTRA, and TC-PRISMA, were employed to simulate the microstructural evolution during PWHT. Furthermore, hardness measurements were performed to establish a comprehensive correlation between the evolution of microstructure and property. By integrating computational and experimental approaches, this study provides a valuable insight into the effect of PWHT processes for Si steel weldments.

2. Materials and Experimental Procedures

In this study, high-silicon steel plates with a thickness of 2 mm were chosen as the base metal. Ni-based alloy Inconel 82 with a diameter of 1 mm was adopted as the welding filler. An electron probe micro-analyzer (EPMA, JXA-iHP200F Field Emission EPMA, JEOL, Tokyo, Japan) was used to quantitatively analyze the chemical compositions of steel plate and filler wire. The Si steel composition (in wt.%) is 3.0 Si, 0.6 Al, <0.01 C, with Fe as the balance, while the filler wire contains 0.008 C, 22.0 Cr, 3.0 Mn, 3.0 Nb, and Ni as the balance. Two steel plates were joined through single-square-groove welding. The solid-state laser power was kept at 5 kW, and the travel speed of the laser head is 6.5 m/min. Inconel 82 feeding rate was 4 m/min. Figure 1 shows the laser welding system and a schematic diagram of laser welding.
After welding, the specimen was cut transverse to the weld joint by wire-cutting. The cross section of the weldment was subjected to mechanical grinding from 120 to 4000 grids of SiC sandpaper. Subsequently, electrochemical polishing was performed before electron backscatter diffraction (EBSD) analysis to remove near-surface residual stress induced upon mechanical grinding, ensuring accurate microstructural characterization. Electrochemical polishing was carried out at 20 V and at a temperature below −10 °C. The etching solutions were comprised of HClO4 and CH3OH with volume ratio of 1:3. ZEISS Gemini 300 (Oberkochen, Germany) field emission scanning electron microscope (SEM) equipped with energy-dispersive X-ray spectroscopy (EDS) detector and EBSD were utilized in the analyses. The detectors operated under 20 kV acceleration voltage and 120 μm aperture. EDS was used for quantitative composition analysis in the selected area. Secondary electron image (SEI) and backscattered electron image (BEI) were used to investigate the welds morphology. Crystallographic data obtained from EBSD were processed and indexed using Aztec software (ver. 6.1, Oxford Instruments, Abingdon, UK), which allows the identification of grain structure, phase map, and kernel average misorientation (KAM). KAM can be used to infer the density of GNDs, which play a crucial role in mechanical stability by maintaining localized misorientation and influencing overall material properties [28]. The GND density can be calculated from EBSD data by using the following Equation (1) [29]:
ρ G N D = α b × d < θ > d x
where α is the constant related to dislocation type and generally assumed to be 3; b is the burger’s vector measured from TEM diffraction pattern; and d < θ >/dx is the disorientation gradient calculated from KAM map [29,30,31].
To determine appropriate heat treatment parameters, a duration of 8 h was selected, considering the time constraints of industrial continuous processing. CALPHAD-based computational techniques, Thermo-Calc 2025a, were applied for phase diagram calculation. For equilibrium phase fraction simulation, TC-PRISMA module and DICTRA module in Thermo-Calc software were used for determining the heat treatment parameters and predicting the microstructure evolution. The TCFE11 and MOBFE6 database in Thermo-Calc were selected. The chemical composition for Thermo-Calc input was accomplished by EDS. It is noteworthy that the carbon content is neglectable since it is extremely low and hard to be measured accurately from EDS, and thus, carbon is not taken into consideration.
Microhardness measurements were performed within the WB using SHIMADZU HMV-G31-FA-S-HC hardness tester (Kyoto, Japan) in accordance with ASTM E384-22 [32], with a 50 g load and 10 s dwell time. Since the FZ is composed of different structures, the samples need to conduct EBSD phase mapping after hardness test to ensure the position of tested points. Thus, the sample preparation is the same as EBSD.

3. Results and Discussion

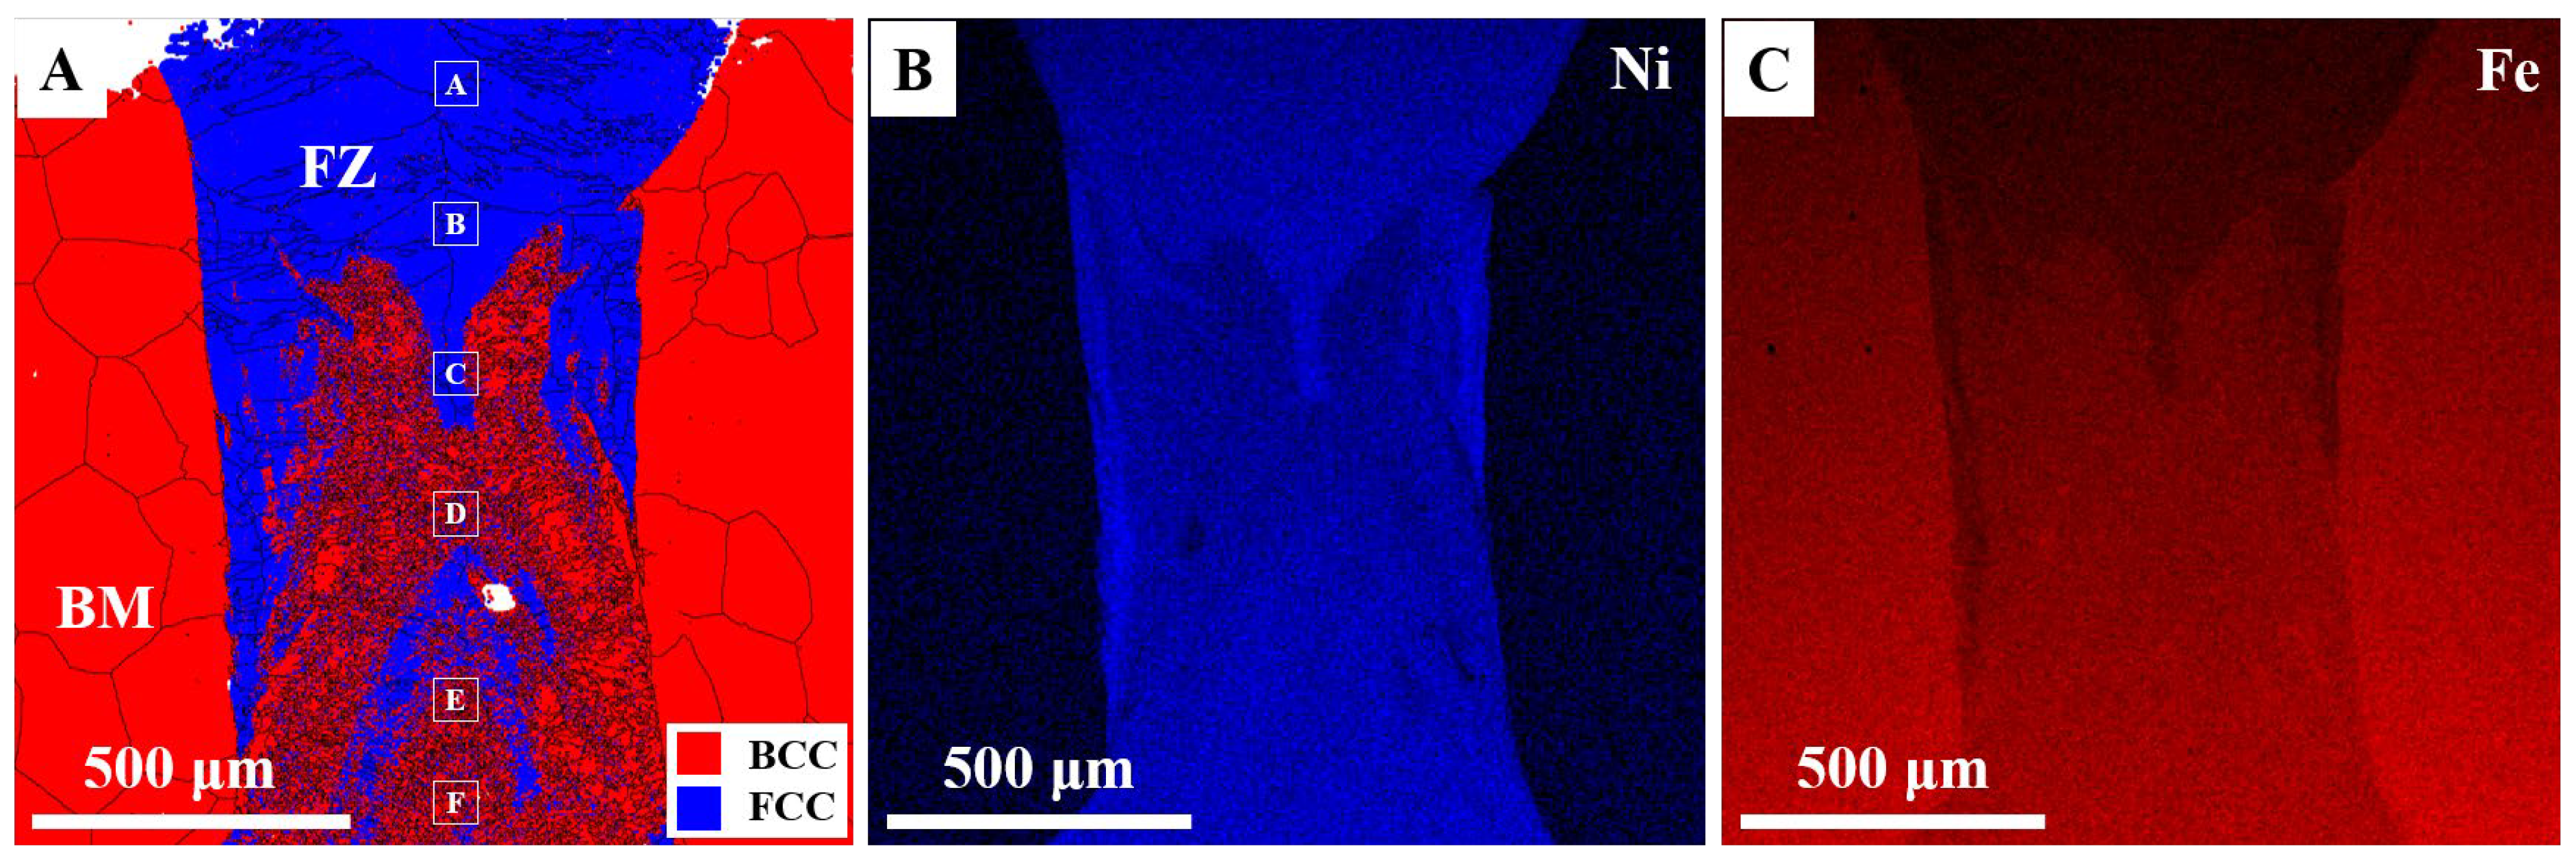
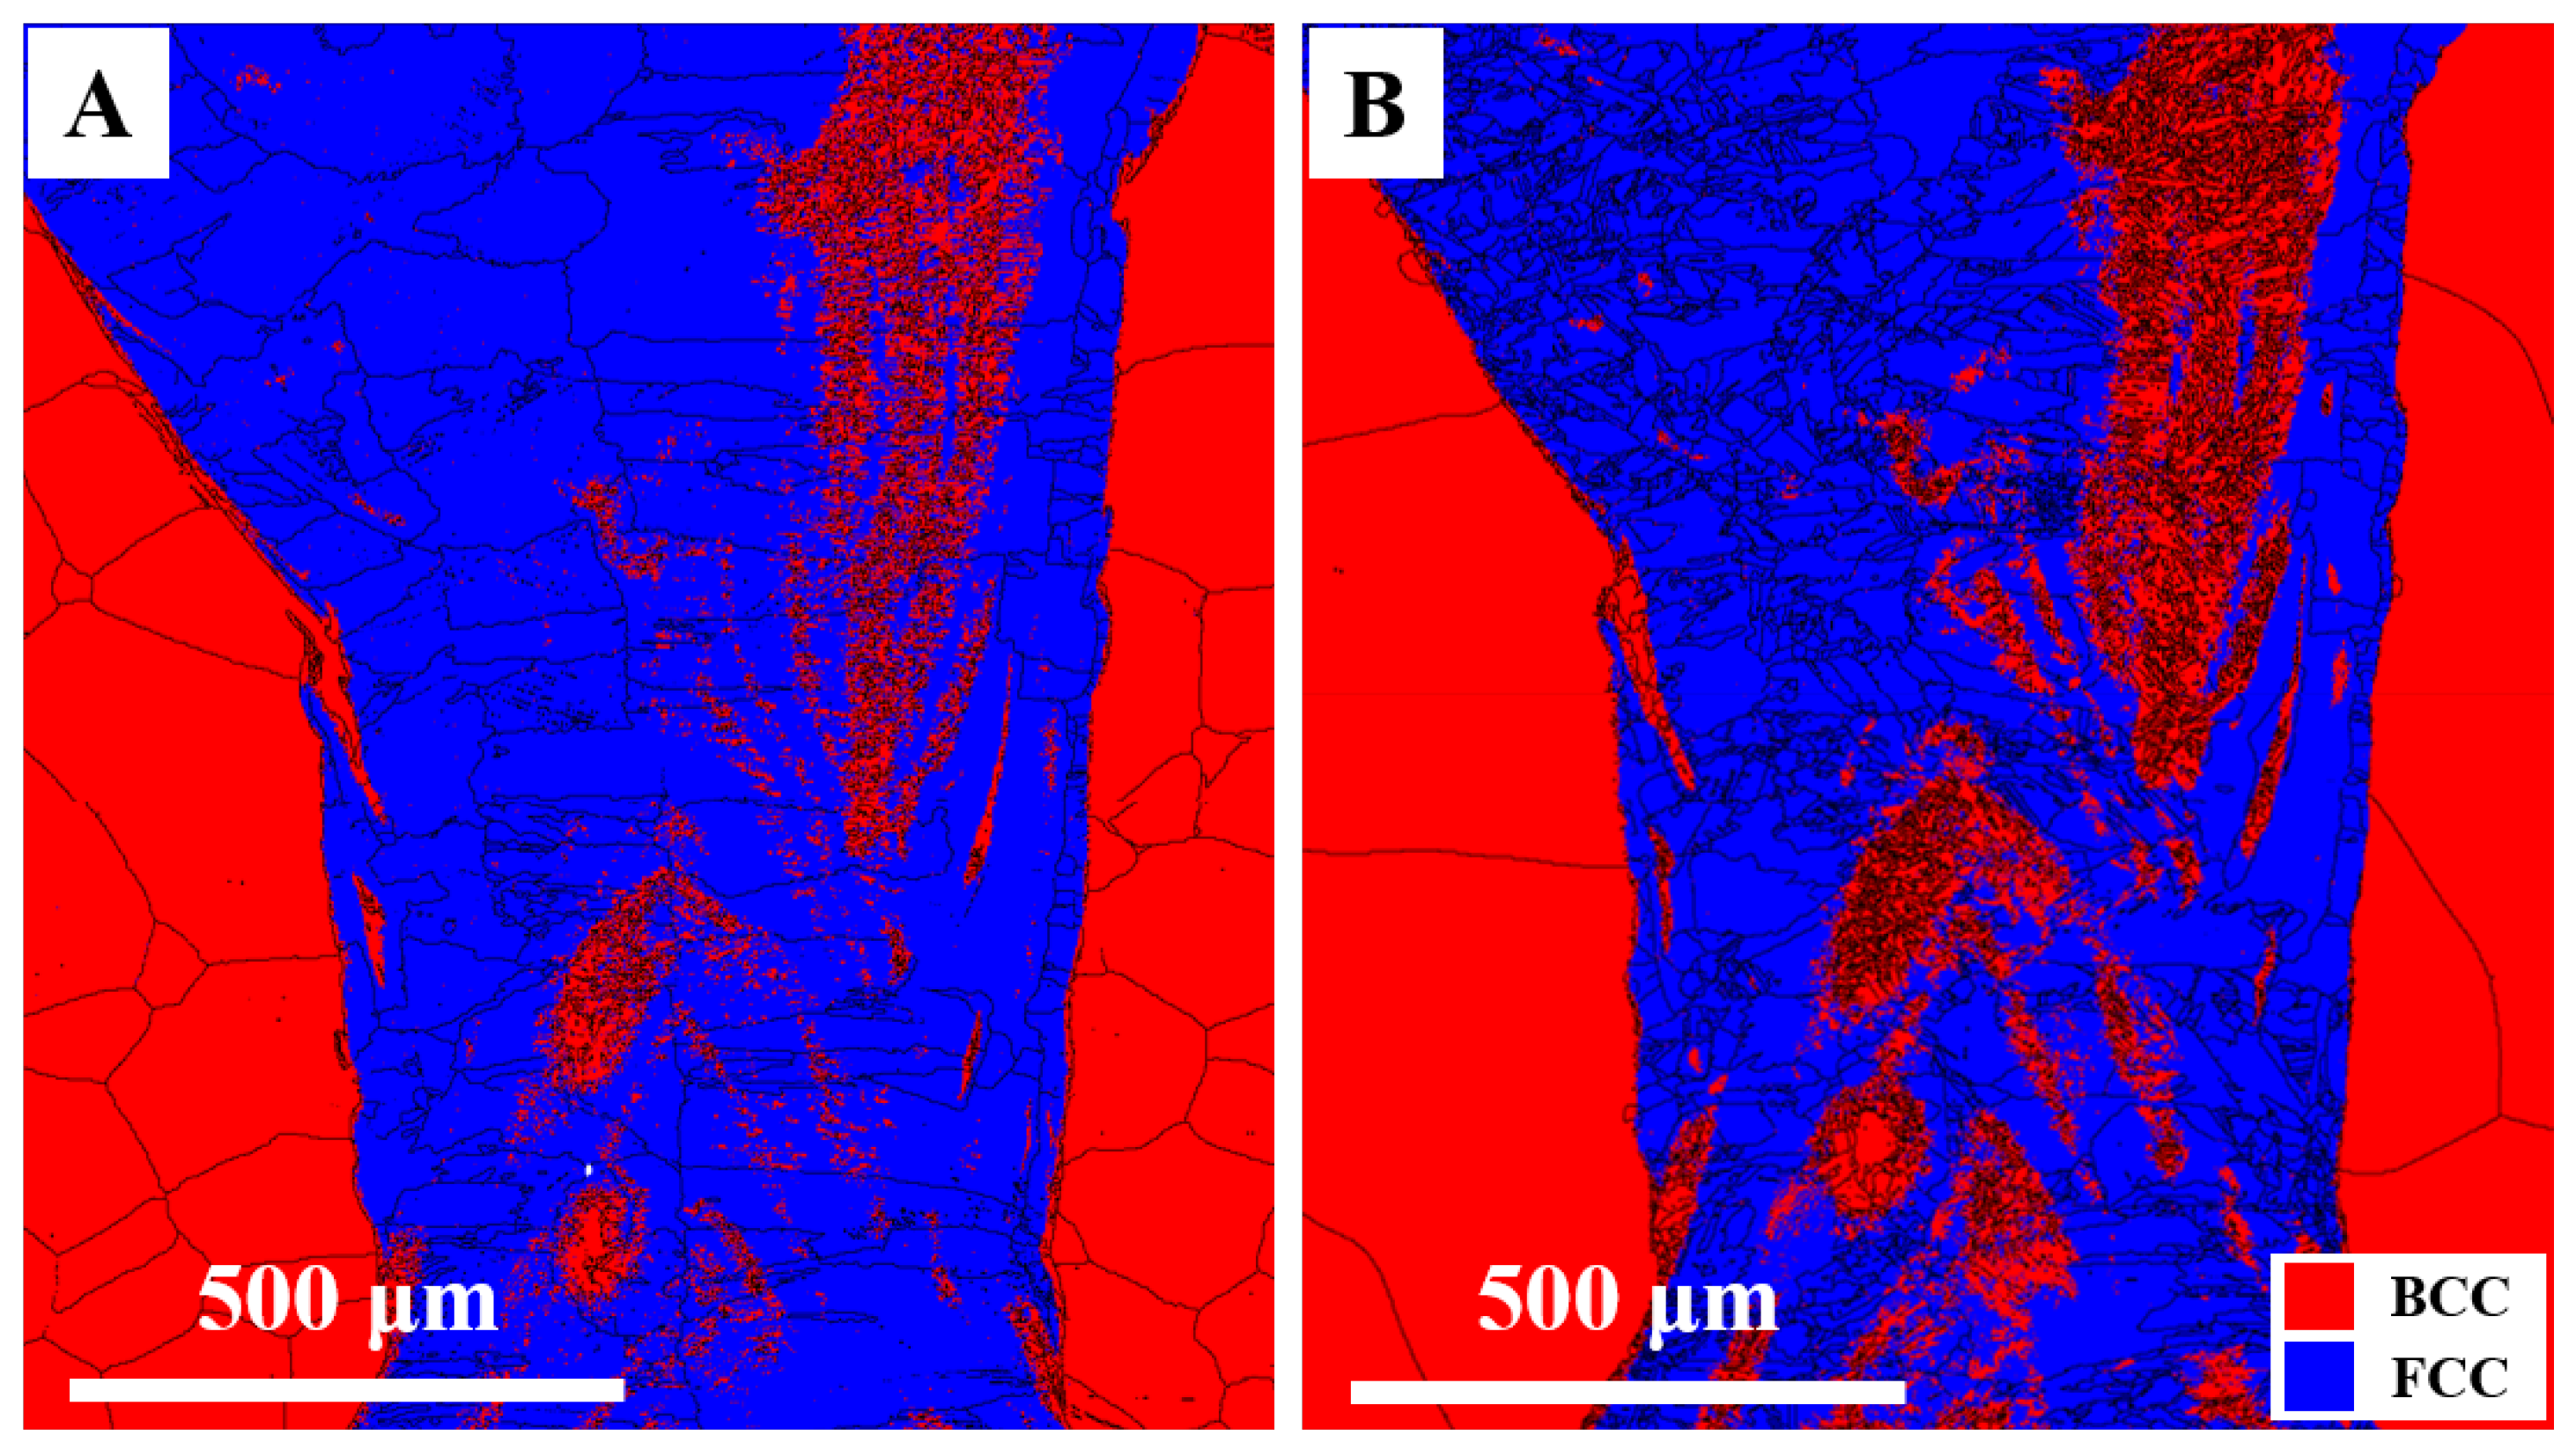
3.1. As-Welded Fusion Zone Structure

The phase map and EDS mapping of the weldment are shown in Figure 2; both the FZ and base metal (BM) are indicated. No distinct heat-affected zone (HAZ) is observed in the BM adjacent to the FZ. This absence of an HAZ was attributed to the low heat input for laser welding, which limited the heat transfer to the BM and minimized the formation of the HAZ [33]. Both the phase map and EDS mapping reveal variations in elements and phases distribution, primarily due to the insufficient mixing of the base metal and filler material during welding, as well as the rapid solidification process. In the phase map, the red and blue colors correspond to the BCC and FCC structures, respectively. The upper region of the weldment is predominantly composed of the FCC phase, while the lower region consists primarily of the BCC phase, with some FCC dispersing randomly. Characterized by a high dislocation density of approximately 1014~1016 m−2 [34,35], our previous work [12] has identified this BCC phase within the FZ as martensite. The elemental distribution maps in Figure 2B,C illustrate that nickel (Ni) from the Inconel 82 filler wire primarily accumulated in the upper region of the FZ and along the fusion boundary. The elemental distribution within the weld pool was mainly influenced by recoil pressure during high-power laser welding. The intense laser energy induced rapid evaporation, generating recoil pressure that drove the molten base metal and filler material upward. This results in the accumulation of filler elements in the upper region of the molten pool. In contrast, the bottom region would then be mainly refilled by the melted based metal as the laser moving forward [36].
Notably, the upper portion of the FZ, which exhibits a higher Ni content, corresponds to the austenite-dominated region, suggesting that phase distribution in the FZ was primarily influenced by the extent of Ni-based filler dilution during welding. Table 1 presents quantitative chemical analyses along the central portion of the weld labelled in Figure 2A; Figure 3 illustrates the variation in Fe and Ni chemical composition along the weld bead and their correlation with the corresponding phase distribution. The results clearly show the elemental dilution within the FZ. The elements from filler wire dominated near the weld pool surface, forming FCC phase in this region, whereas the bottom area presents a high content of Fe results in the formation of BCC phase. The averaged chemical compositions of the BCC and FCC regions are listed in Table 1. These compositions were subsequently used as input parameters for the Thermo-Calc simulations to predict equilibrium phase formations, providing a valuable reference for determining PWHT temperatures.
Figure 4A–H present the microstructure within the FCC region. A dendritic network was observed due to elemental segregation during the non-equilibrium solidification. Figure 4B presents a higher magnification of the FCC area and its EDS mapping results in Figure 4C–F demonstrate that the interdendritic particles were enriched with Si, Ni, and Nb. These particles were identified as G-phase, as shown in Figure 4G,H. According to Scheil solidification simulations (Figure 4I), the G-phase formed during the final stage of non-equilibrium solidification. The volume fraction of G-phase in the as-welded condition was estimated to be 1.4 vol% by ImageJ software (ver. 1.53s). The G-phase is a complex ternary silicide with an FCC (Fm-3m) structure comprising 116 atoms per unit cell. Due to elemental substitution, its stoichiometry varies; in this study, it is represented as A16M6Si7 (A = Fe, Ni; M = Nb, Mn). The formation of G-phase precipitates has been extensively investigated through the prolonged thermal aging in duplex stainless steel [37,38,39]. While G-phase is known to contribute to precipitation strengthening [40,41], limited studies have focused on its role in Si steel weldment.
In the BCC region, the phase map and inverse pole figure (IPF) presented in Figure 5A,B demonstrate the presence of an irregularly dispersed FCC phase within the BCC martensitic matrix, and no G-phase precipitates were detected in this region. The EDS mapping in Figure 5C–F reveal that Ni, Nb, and Si were concentrated in the FCC regions, while Fe was depleted in these areas. Therefore, the formation of these FCC phases was attributed to the elemental segregation during solidification. According to Figure 5C–F, Ni, Nb, and Si tend to accumulate in interdendritic regions. Furthermore, Ni is a strong austenite stabilizer, and its enrichment could promote the formation of the FCC phase during the final stage of non-equilibrium solidification, particularly at interdendritic sites. Table 2 shows the quantitative chemical analysis of interdendritic FCC, and the martensitic matrix labelled in Figure 5A. The results indicate that the variation in Ni content was significantly greater than that of other alloying elements.

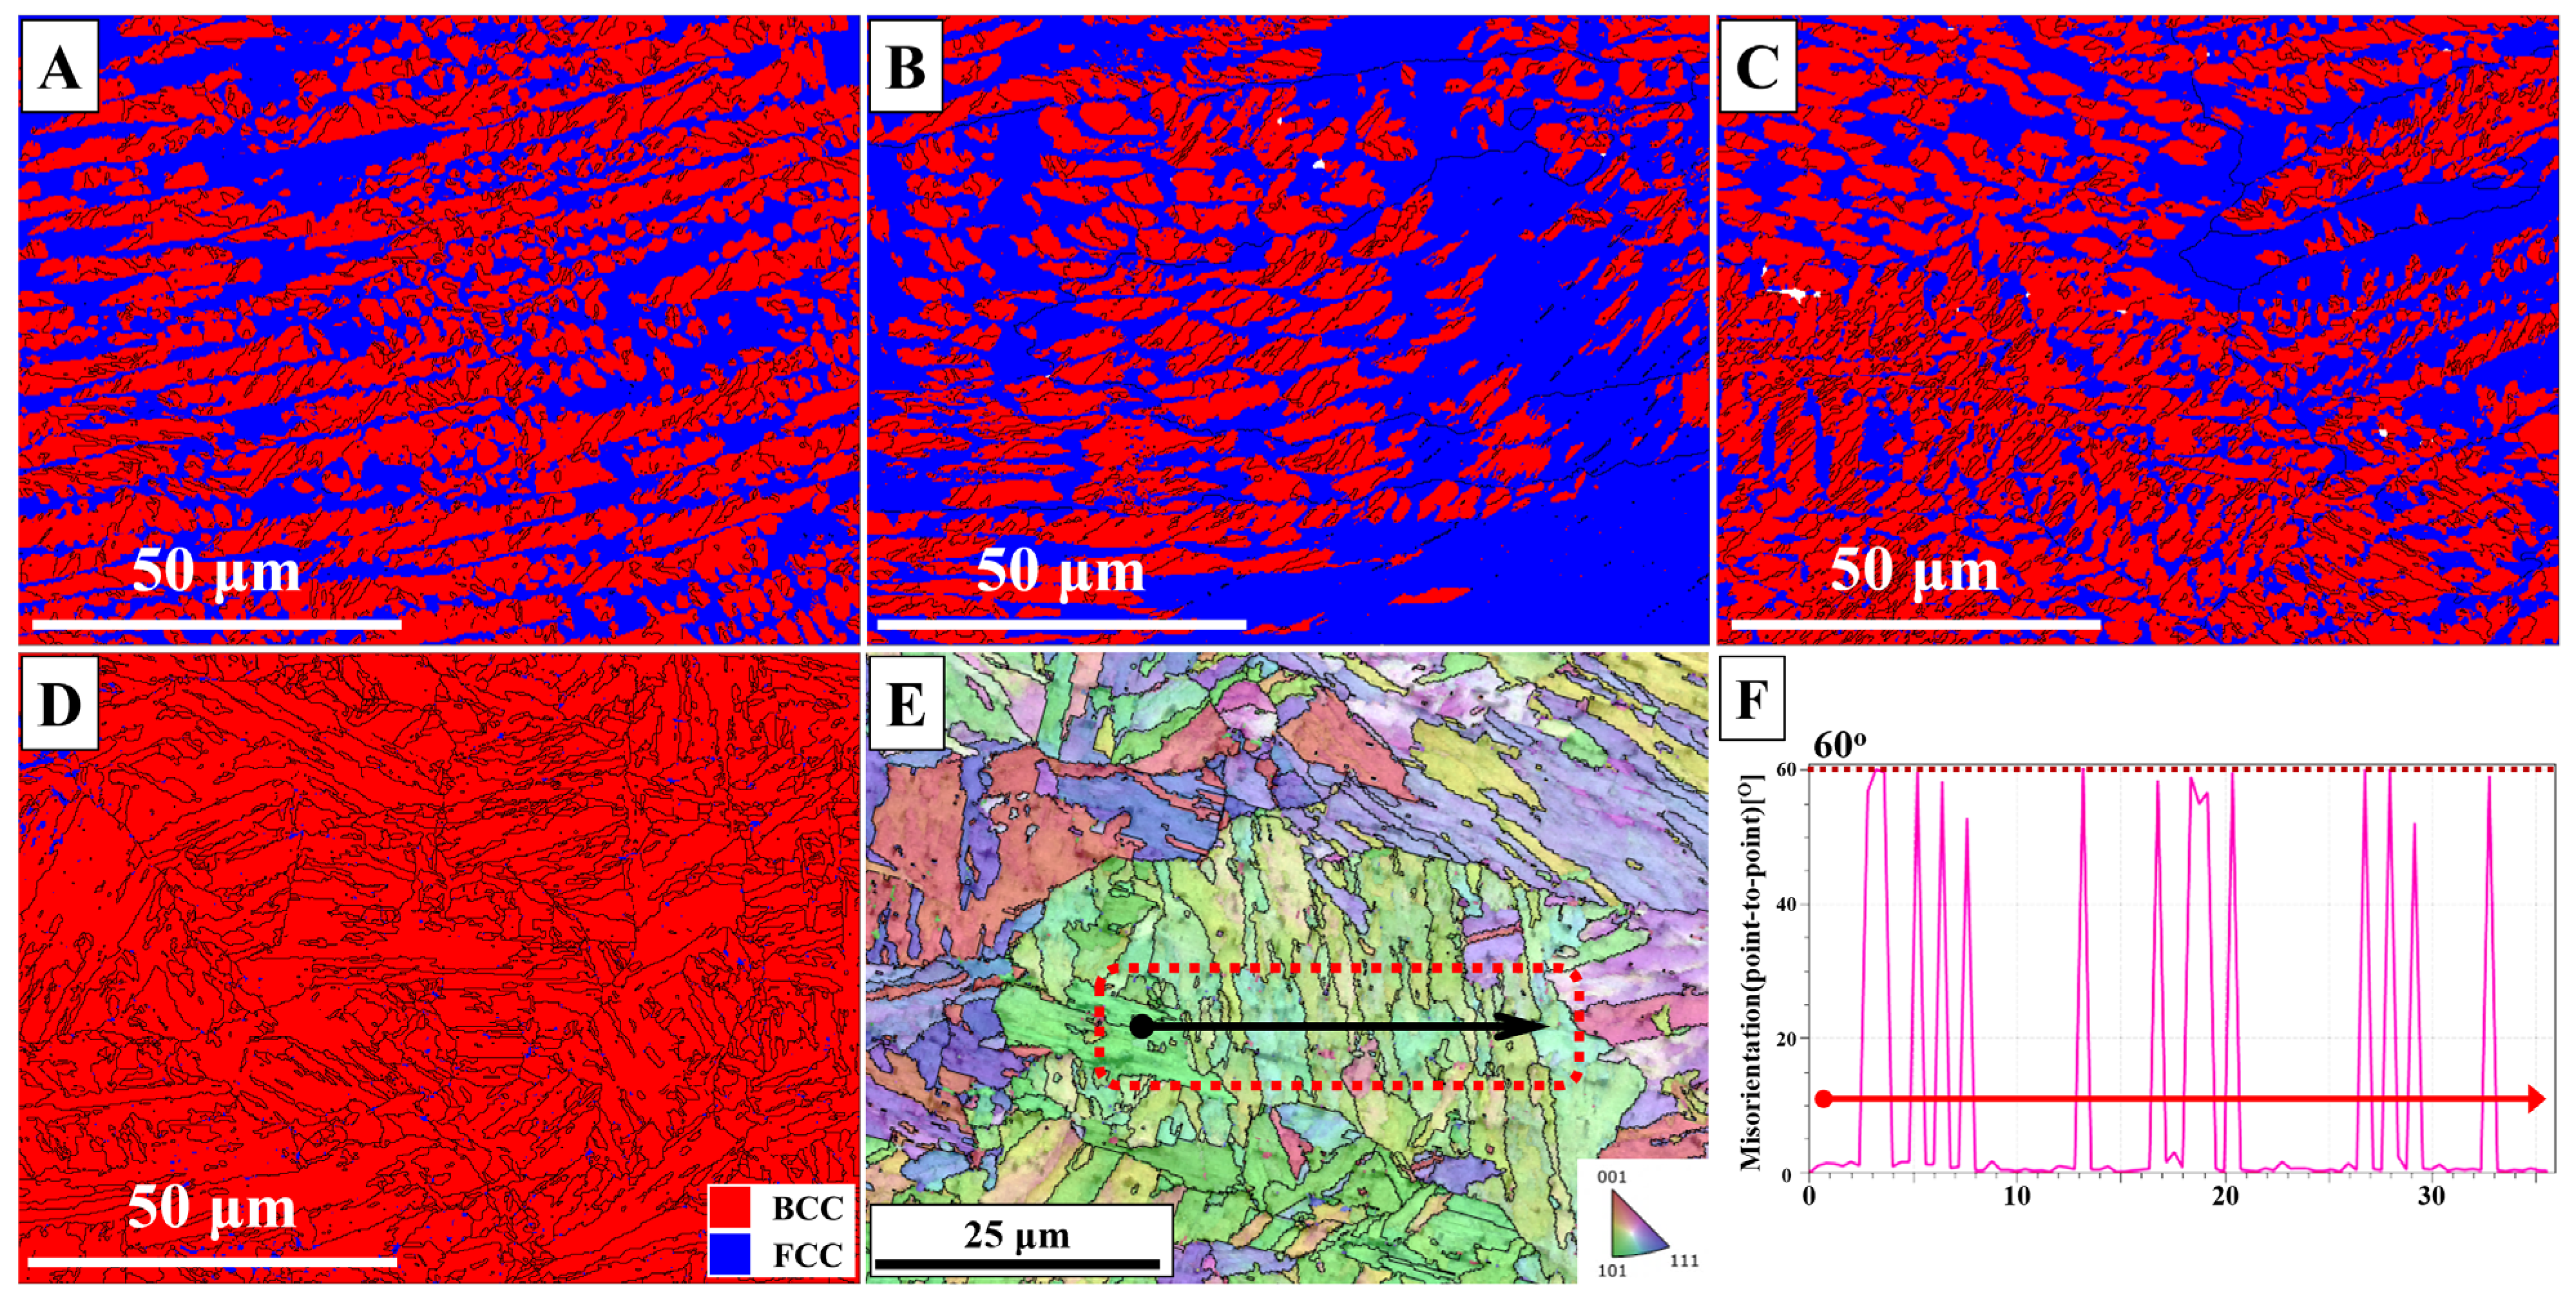
3.2. Microstructure Evolution After Post Weld Heat Treatment

The PWHT temperatures were determined using Thermo-Calc one-axis equilibrium phase diagrams. The simulations were focused on separate regions of FCC and BCC phases, with composition inputs referenced from Table 1.
The equilibrium phase fraction of the FCC region as a function of temperature is shown in Figure 6A. The simulation results indicate that the FCC austenite was the dominant stable phase, while the G-phase precipitates formed at lower temperatures until approximately 720 °C. Within the temperature range of 700–990 °C, G-phase could dissolve, and C14-Laves phase would gradually form. So, the PWHT temperatures of 520 °C, 620 °C, and 720 °C were selected for 8 h heat treatment, since 8 h is an industrially viable processing duration, followed by air cooling.
The equilibrium phase fraction of the BCC region as a function of temperature is shown in Figure 6B. The BCC structure remained stable at temperatures below 750 °C and could fully transform into austenite at 920 °C. Therefore, an 8 h heat treatment at 920 °C was chosen for experimental work.
Figure 7A,B present the phase maps of the same cross-sectional plane before and after 8 h heat treatment at 920 °C. The phase maps indicate that the overall macrostructure within the FZ remained unchanged. The BCC and FCC phases remain dispersed in a convection-like pattern within the weld pool. Therefore, it can be inferred that phase separation resulting from heterogeneous mixing during laser welding is not readily eliminated, even at a heat treatment temperature of 920 °C.
To understand microstructural evolution in the FCC region, the FCC matrix composition was used for precipitation simulation by TC-PRISMA. Simulation results suggest that the G-phase fraction increased after 8 h of heat treatment, from 1.4 vol% to approximately 1.9 vol% at 520 °C, and peaked at 2.3 vol% at 620 °C. The G-phase volume fraction was evaluated using SEM, as shown in Figure 8A–D, and quantified using ImageJ software. The G-phase volume fractions were measured as 1.4 vol% in the as-welded condition, and 1.5 vol%, 2.5 vol%, 2.2 vol%, and 1.9 vol% after annealing at 520 °C, 620 °C, 720 °C, and 920 °C, respectively. This result shows that the G-phase fraction increased with the annealing temperature, reaching a maximum at 620 °C, followed by a decline at higher temperatures. Notably, the measured G-phase fractions at 520 °C and 620 °C (1.5 vol% and 2.5 vol%, respectively) are in close agreement with the TC-PRISMA simulation predictions, validating the model’s accuracy in this temperature range. The increase in G-phase volume fraction at 620 °C can be attributed to several factors. From a thermodynamic perspective, as illustrated in Figure 6A, the G-phase content was still below its equilibrium fraction (~3 vol%) in the 500–650 °C range, indicating that equilibrium condition was not reached experimentally after 8 h of PWHT. Kinetically, based on previous studies on the diffusivity of G-phase-enriched elements (Nb, Mn, Si, and Ni) in FCC iron [42,43,44,45], their diffusion coefficients could increase by approximately two orders of magnitude as the temperature rose from 520 °C to 620 °C. This could accelerate elemental diffusion and promote the growth of the G-phase. Furthermore, the high residual stress inherent to the laser welding process may promote G-phase nucleation and growth during subsequent annealing [40,46,47]. The decrease in the G-phase fraction above 720 °C is attributed to its dissolution, as predicted by the equilibrium phase diagram.
However, experimental results suggest that the G-phase did not completely dissolve after 720 °C. Additionally, the expected precipitation of C14-Laves at elevated temperatures was not observed. To further investigate this phenomenon, EBSD and EDS mapping were conducted on the 920 °C-treated sample, as shown in Figure 9A–C. The elemental mapping in Figure 9B reveals that the precipitate was enriched with Ni, Mn, and Si. The phase map in Figure 9C highlights the remaining G-phase in yellow, confirming its persistence in the FCC region even after an 8 h treatment at 920 °C. As shown in Figure 9D, the chemical composition of the interdendritic precipitates was employed for equilibrium phase simulations. The results demonstrate that the G-phase, which formed under non-equilibrium solidification, could remain stable up to approximately 1400 °C without complete dissolution in the matrix. The existence of the G-phase, enriched with Nb, may suppress the nucleation of C14-Laves, which likewise contain a high content of Nb. This could suggest a competitive relationship between the G-phase and C14-Laves in nucleation and growth processes [15,48].
The microstructural evolution within the BCC region was examined using EBSD. Phase maps of the BCC region after different PWHT conditions are shown in Figure 10A–D. The microstructural morphology of the 920 °C-annealed sample exhibits a typical martensitic twin structure with lath-shaped crystallites, as indicated in Figure 10E,F [49,50], and the interdendritic FCC phase has disappeared.
At elevated temperatures, the atomic mobility increases, facilitating elemental diffusion from the regions of high concentration to low concentration. To further investigate this phenomenon, DICTRA simulations were performed. The simulation model was constructed as a single-phase FCC system, justified by the equilibrium phase diagram, which suggests that the BCC matrix may undergo partial or complete transformation into FCC. This assumption simplified the computational model and enhanced simulation efficiency. A schematic of the simulation setup is provided in Figure 11A,B. The single-cell width was set to 10 μm, and the chemical compositions at the FCC interdendritic sites and BCC matrix were used as input parameters (Table 2). The variation in Ni concentration as a function of distance after 0, 4, and 8 h of isothermal treatment at 720 °C and 920 °C is illustrated in Figure 11C,D. DICTRA results, as shown in Figure 11C, reveal that the Ni concentration profile remained unchanged after 720 °C heat treatment for 8 h, inferring that the interdendritic FCC phase remained stable. By contrast, Figure 11D reveals a decrease in Ni concentration at interdendritic sites, from 19 wt.% to approximately 17.5 wt.%, with Ni diffusion extending about 3 μm into the BCC matrix after 920 °C annealing for 8 h. This implies that phase transformation and homogenization may have occurred in this region.
The dissolution of interdendritic FCC can be explained by equilibrium phase diagram (Figure 6B), at 920 °C; complete austenitic transformation took place in this region. Upon cooling, the region transforms into a single-phase BCC (martensite) structure. By contrast, at 720 °C, there were BCC and FCC phases, and austenite-stabilizing elements would remain within the interdendritic regions [51]. The experimental results in Figure 10C,D are consistent with the DICTRA simulation predictions, validating the effectiveness of the single-phase simulation approach for predicting the homogenization behavior of the welded joint. Furthermore, DICTRA simulations predict that the diffusion distance of Ni from the interdendritic region into the BCC matrix was approximately 3 μm, which was insufficient to achieve complete homogenization of the weld joint. This prediction also aligns with the macrostructural observations in Figure 7.

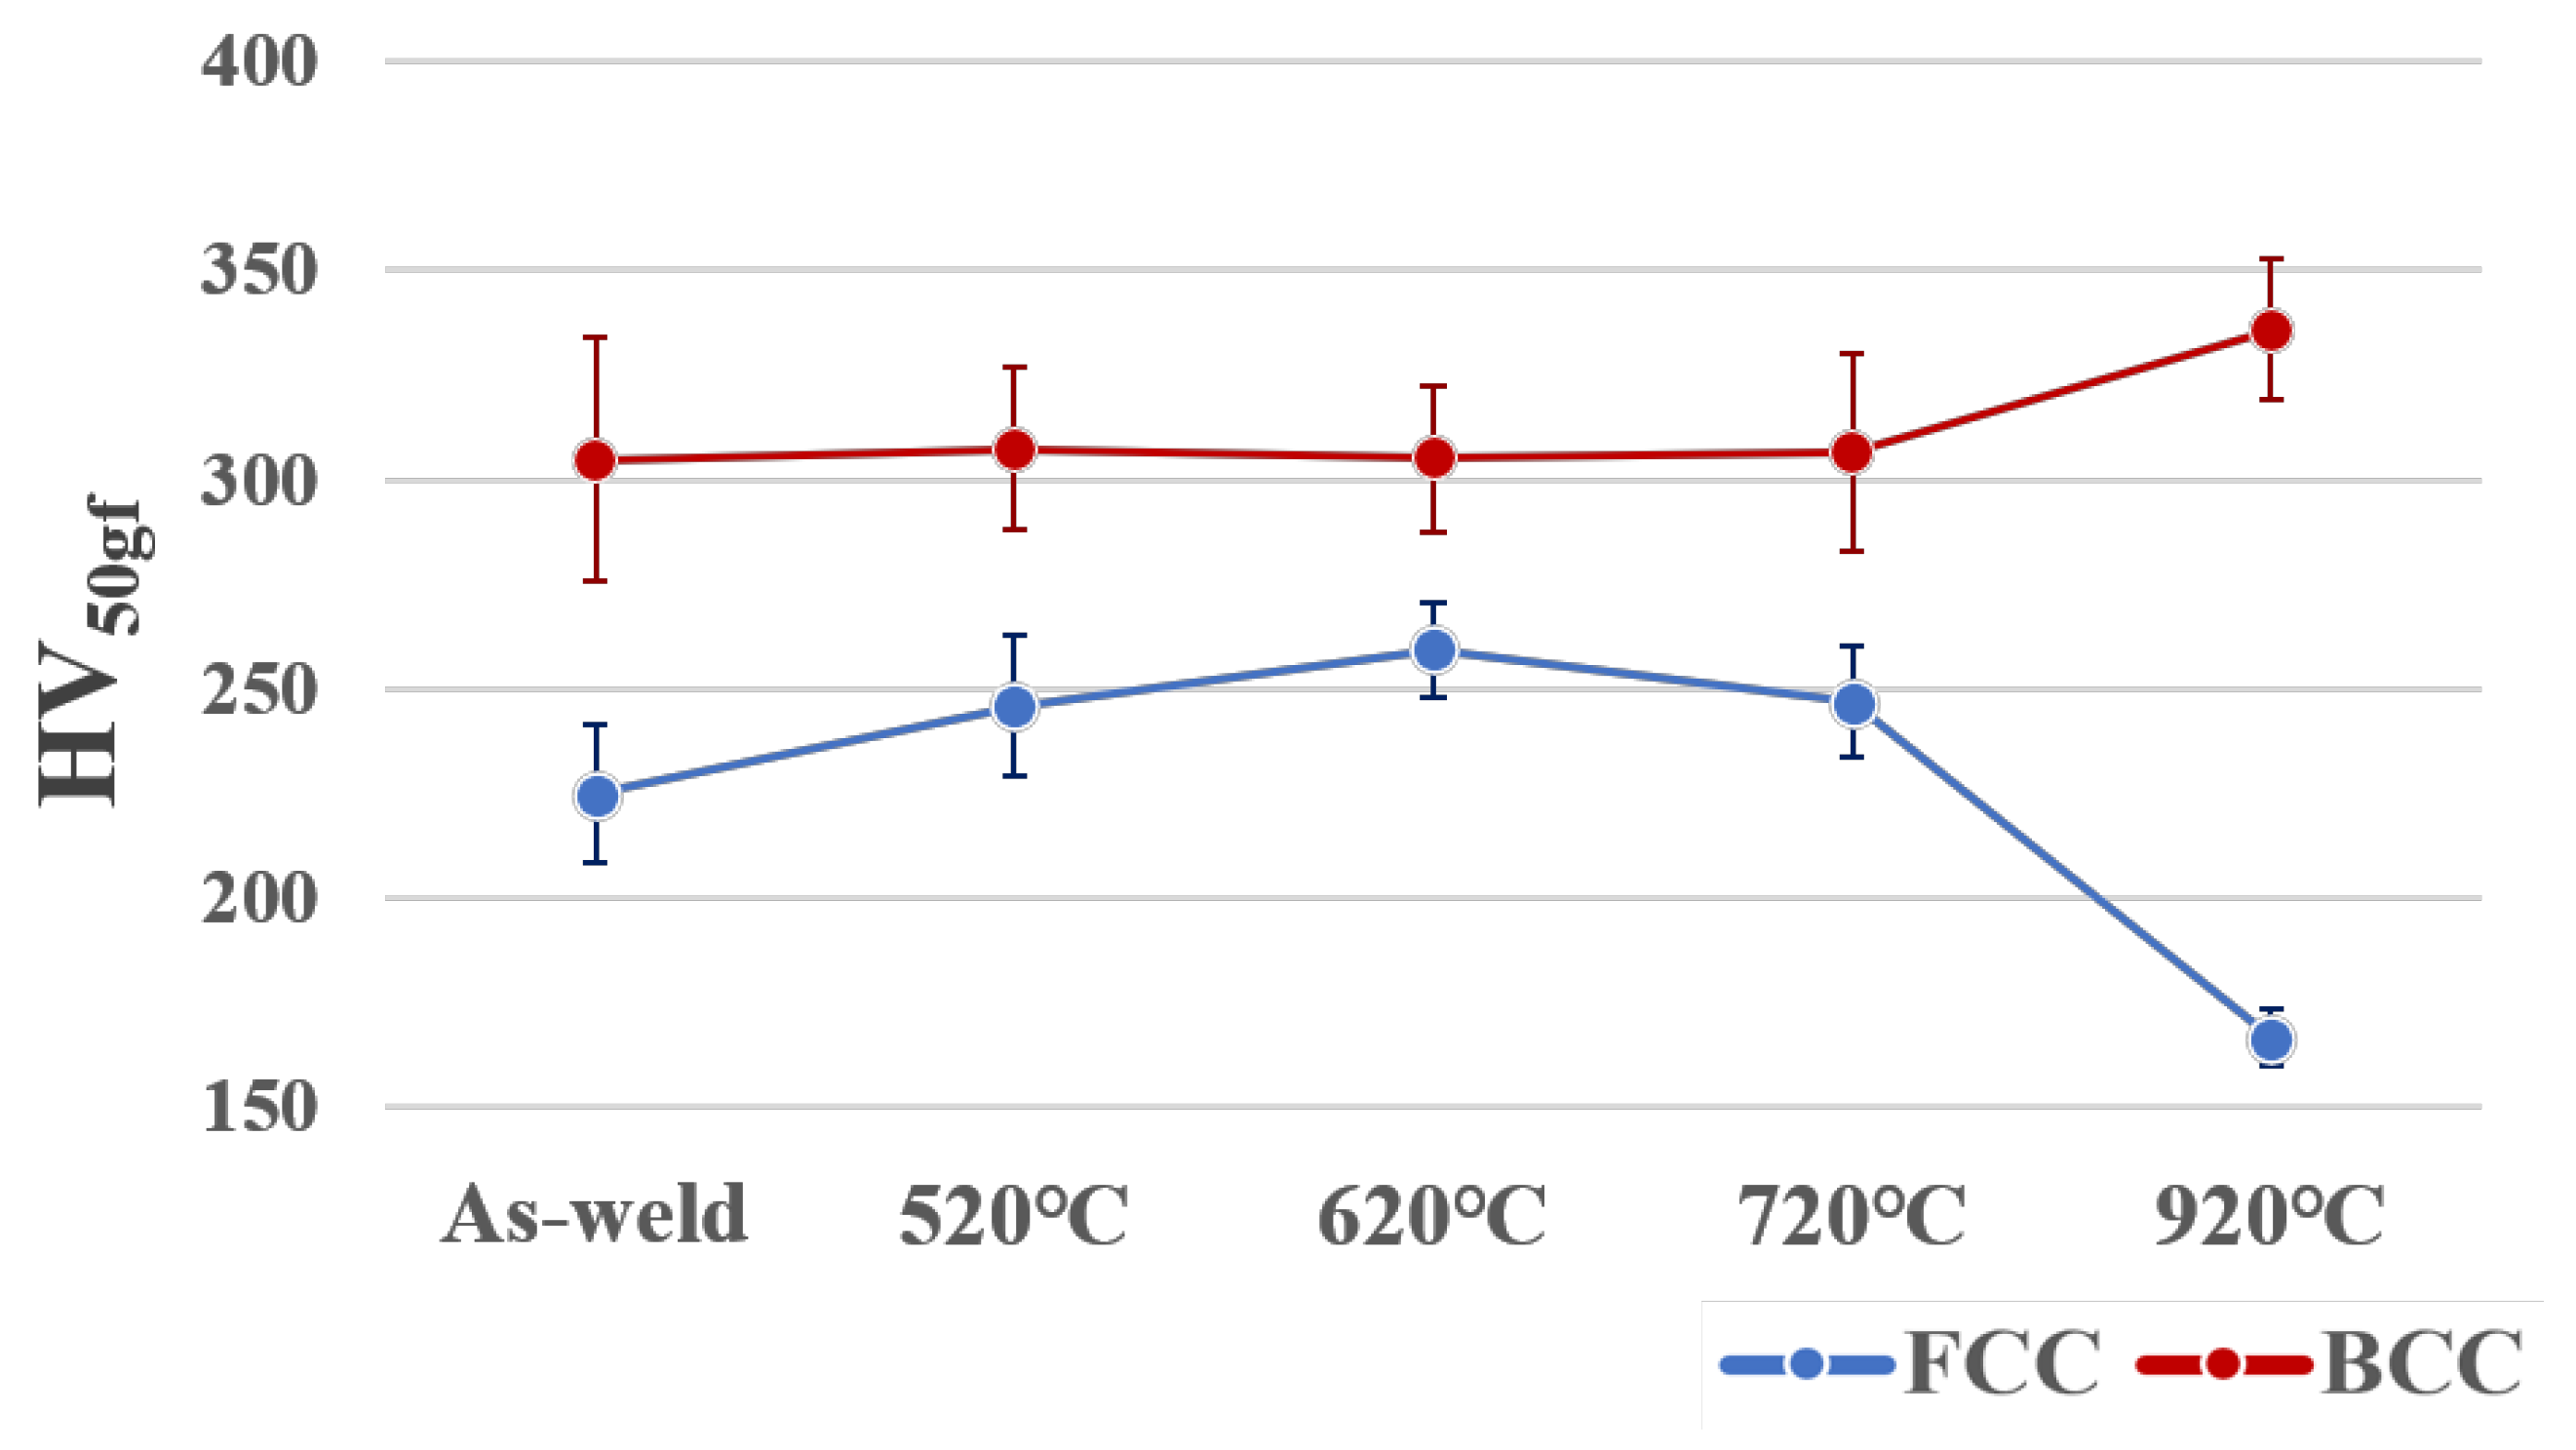
3.3. Mechanical Properties of Weld

The Vickers micro-indentation test was conducted across the FCC and BCC region in the weld. Table 3 and Figure 12 presents the average hardness of the FCC and BCC regions and the comparative analysis of hardness across the different samples.
PWHT resulted in an increase in FCC hardness, reaching a peak value of 259 HV after annealing at 620 °C. However, further increases in annealing temperature led to a reduction in hardness, with a significant drop to below 200 HV after annealing at 920 °C. This hardness variation in fact corresponded to the evolution of the G-phase precipitates. The fractions of G-phase were at their highest at 620 °C, thereby maximizing the hardening effect in the FCC region. While further increasing annealing temperature resulted in the reduction in the G-phase, as well as the hardness. However, the pronounced drop in FCC hardness in the 920 °C-treated sample suggests additional crystallographic factors influencing the material properties. Figure 13 presents the KAM maps of the samples. The strong contrast observed in the KAM map was mainly associated with the high lattice distortion induced by laser welding, laser stirring, and rapid cooling [28,29,47]. The observed reduction in KAM contrast and grain refinement in the 920 °C-treated sample suggests that recrystallization occurred during annealing [52], leading to a softening of the material. Recrystallization could promote the nucleation and growth of strain-free grains, which enhanced the ductility but reduced the hardness of the material [53,54].
To facilitate comparison and interpretation, KAM data were converted to estimated GND densities using Equation (1). This conversion enables a more direct correlation between the lattice distortion and the mechanical properties of the material. The relationship between hardness, precipitate volume fraction, and GND density in the FCC region for different annealing conditions is illustrated in Figure 14, demonstrating a strong correlation between G-phase fraction and hardness, both peaking at 620 °C. By contrast, the GND density gradually decreased with the increase in the annealing temperature, with a significant drop observed at 920 °C due to recrystallization. These findings indicate that the strengthening mechanism in the FCC region was primarily governed by G-phase precipitation hardening. However, at elevated temperatures, recrystallization would become the dominant factor and reduce the hardness.
In the BCC region, a higher level of hardness was observed compared to the FCC region. This was primarily due to the presence of a martensitic structure, which is characterized by a high dislocation density. The hardness of the BCC region remained relatively stable around 305 HV for samples heat-treated below 920 °C but increased to 336 HV after annealing at 920 °C. This increase could be attributed to the complete martensitic transformation following austenitization in the BCC region. Additionally, this phenomenon coincides with the elimination of interdendritic FCC, implying that the presence of fine FCC structures may contribute to the localized softening of the BCC region.
Overall, as shown in Figure 12, the sample annealed at 620 °C presents a better precipitation strengthening effect in the FCC region. And the 920 °C-annealed sample exhibits the lowest hardness in the FCC region and the highest in the BCC region. This pronounced hardness disparity was attributed to recrystallization in the FCC region and complete martensitic transformation and the elimination of interdendritic the FCC in the BCC region. This result of variation in hardness highlights a strong correlation between microstructural evolution and mechanical properties, indicating the feasibility of employing computational simulation to understand the evolution of microstructures after PWHT.

4. Conclusions

In this research, the microstructural evolution in Si steel welds after applying PWHT at various temperatures was investigated through CALPHAD-based simulation and experimental observation. TC-PRISMA and DICTRA simulations were employed to predict the evolution of precipitate growth and interdendritic structures under different annealing conditions. The microhardness testing of the fusion zone was performed to evaluate the mechanical properties, enabling the establishment of the correlation between microstructure, heat treatment condition, and hardness. The key findings of this research are summarized as follows:
  • In the as-weld condition, a complex microstructure was observed due to laser-induced stirring of the weld pool and incomplete mixing of the melted filler wire, leading to phase separation upon cooling. The upper FZ primarily consisted of an FCC structure characterized by interdendritic G-phase precipitates, while the lower FZ exhibited a BCC martensitic matrix interspersed with dispersed interdendritic FCC. These regions were identified as critical sites for microstructural evolution during subsequent heat treatment.
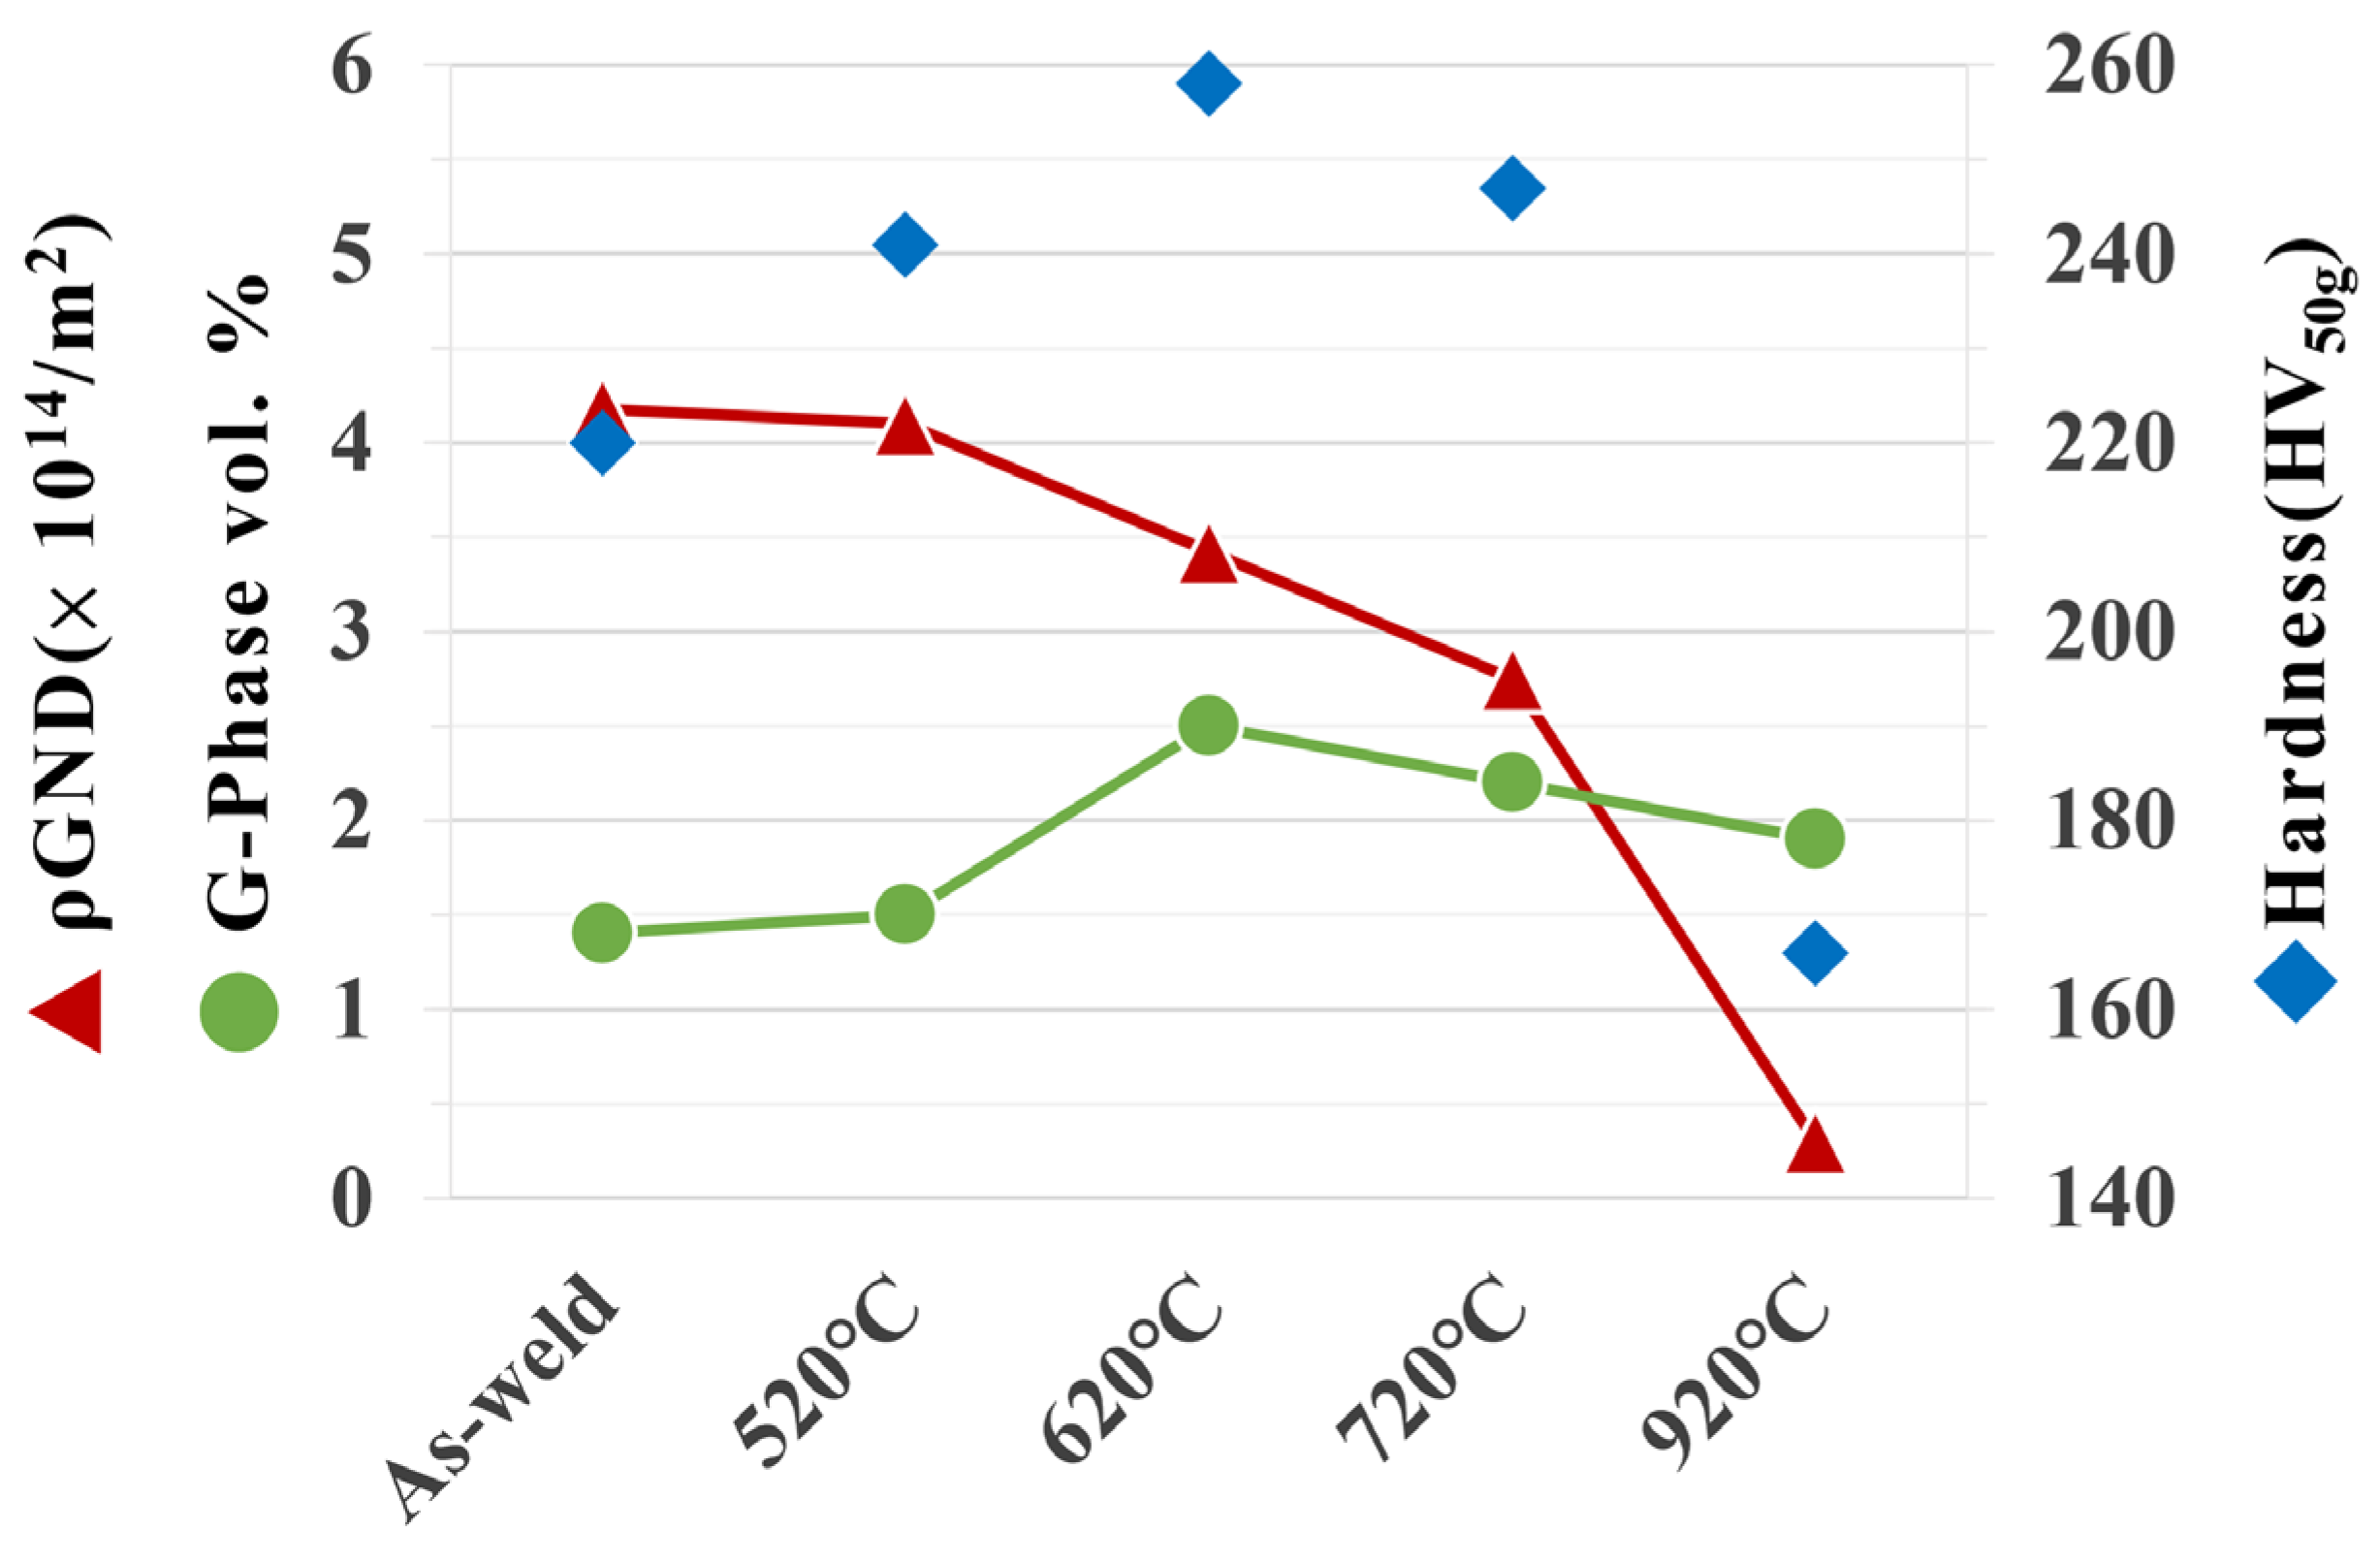
  • The peak G-phase fraction occurred at 620 °C; however, deviations were noted when comparing with the predicted equilibrium phases at 720 °C with experimental observation. This discrepancy was likely due to the simulation’s assumption of uniform and equilibrium conditions, which differs from non-equilibrium solidification in practice.
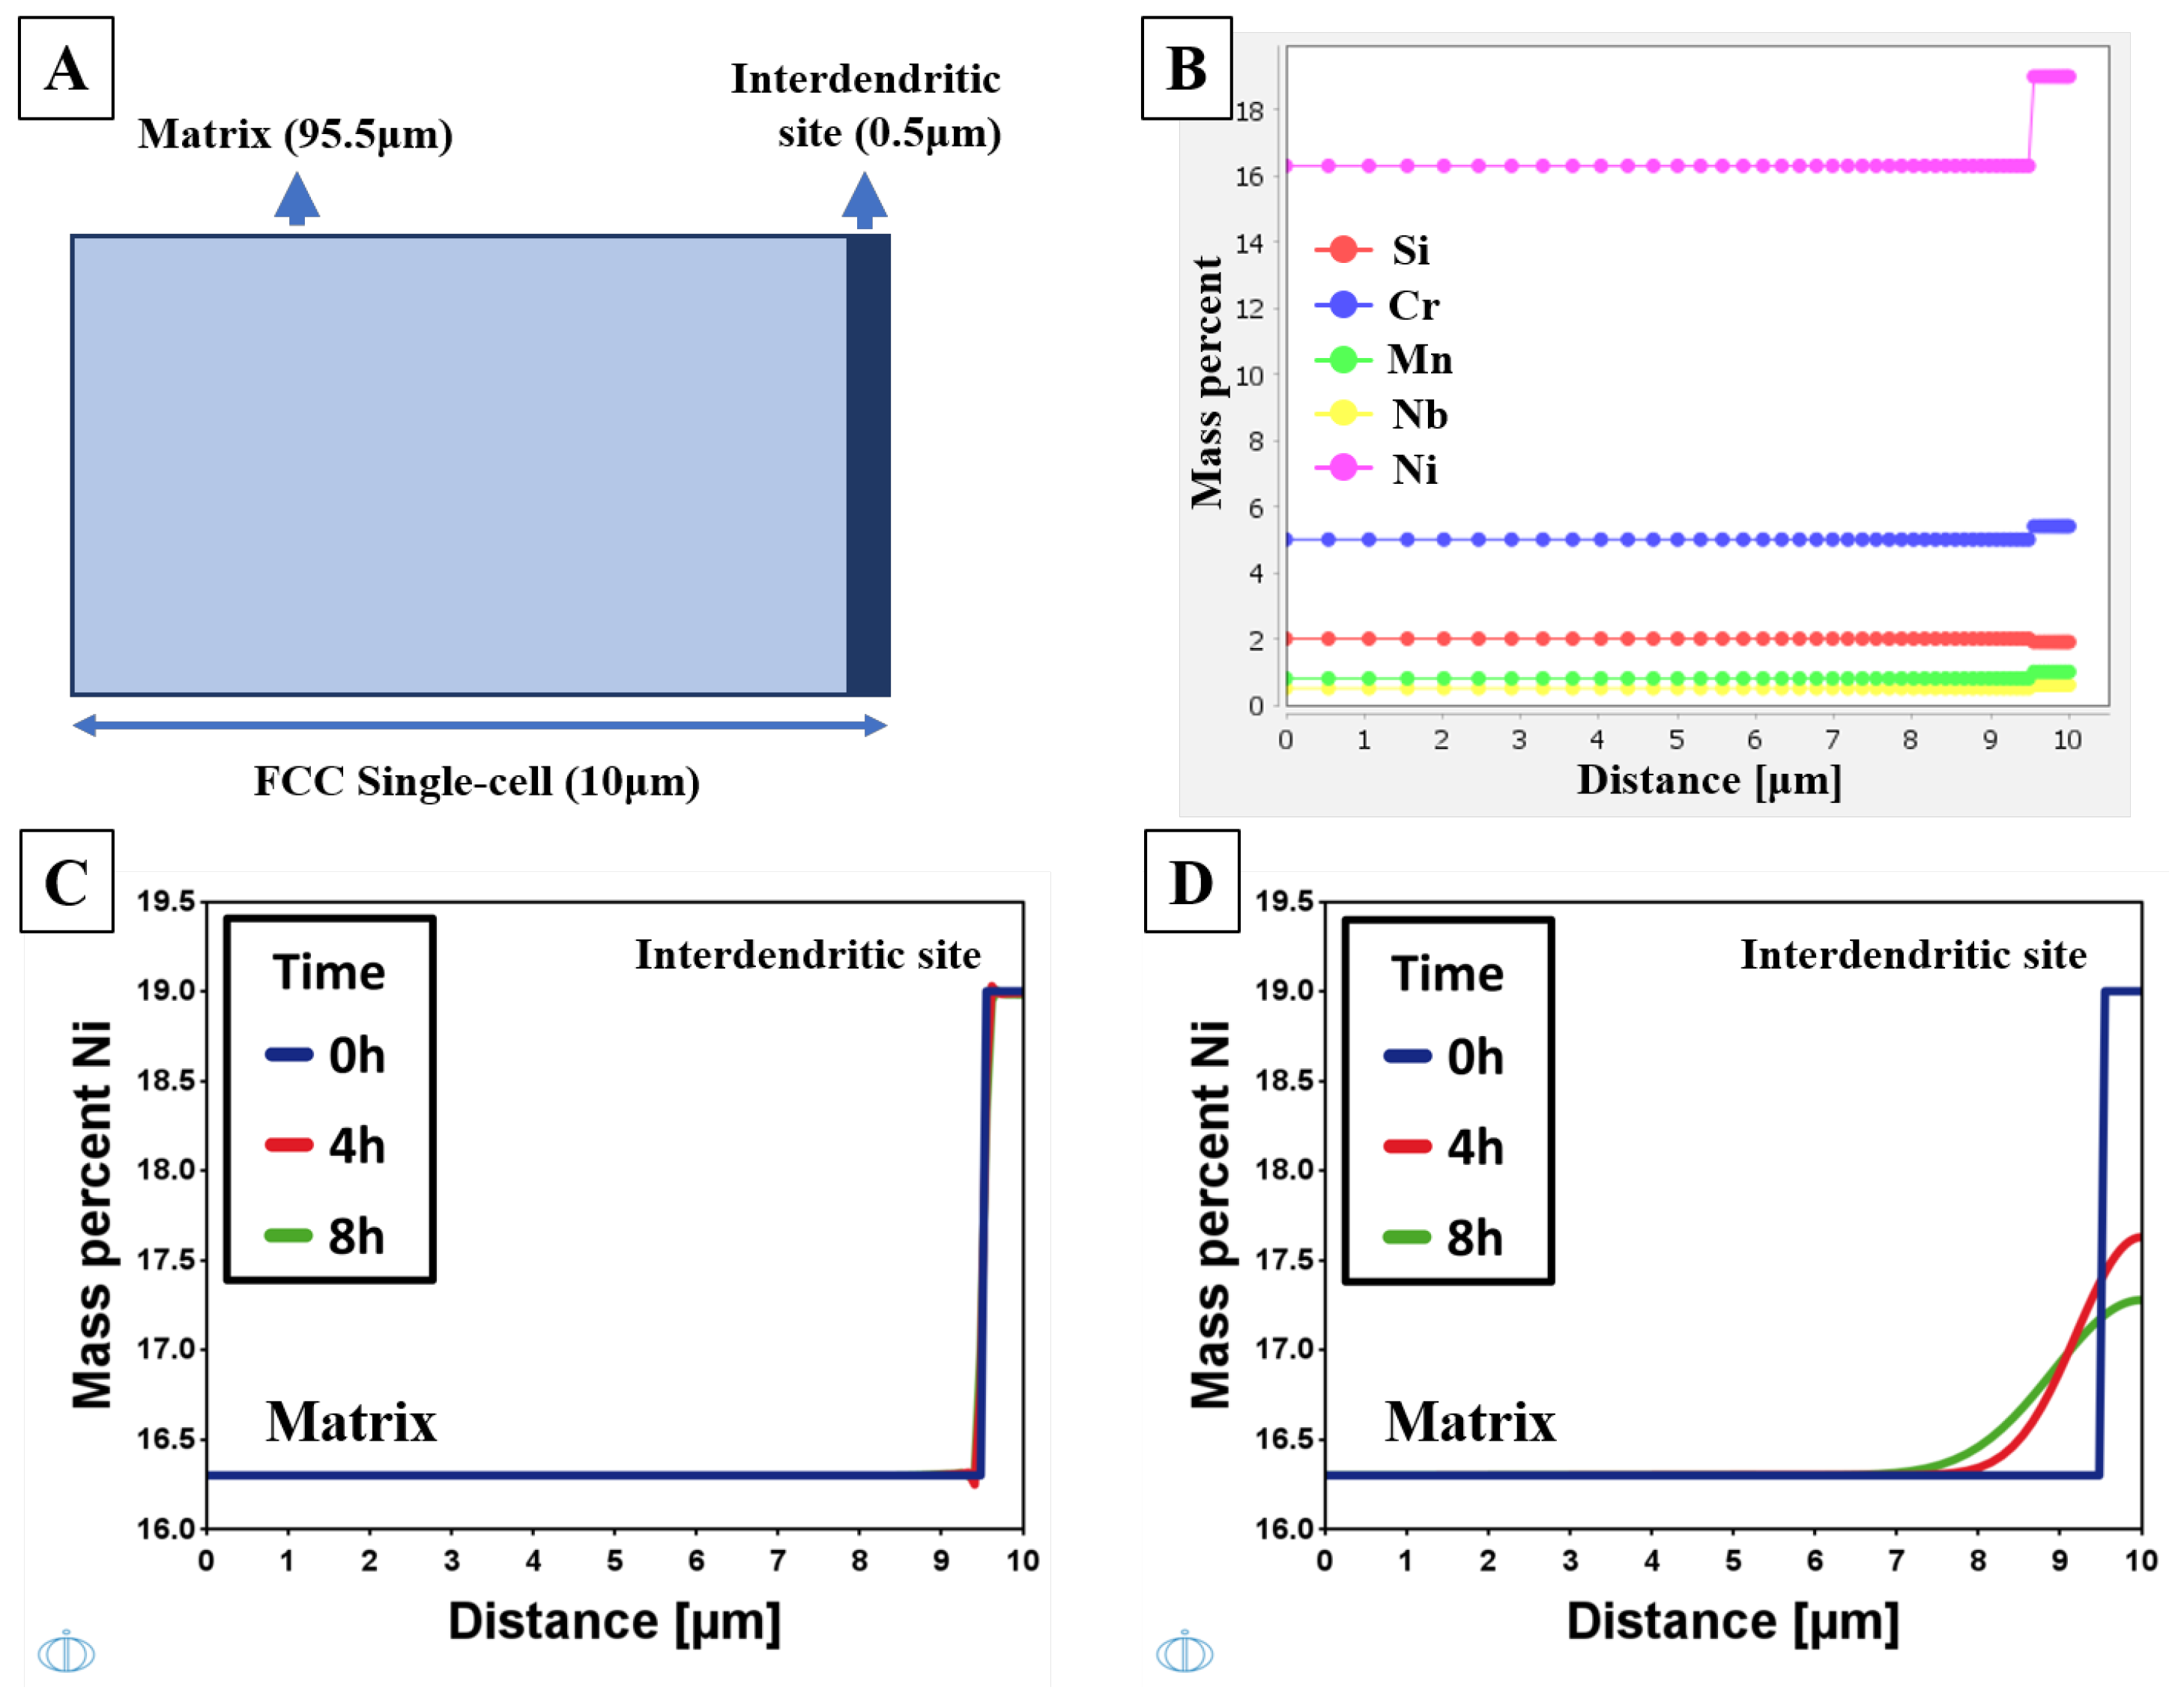
  • The complete elimination of interdendritic FCC was observed only in the 920 °C-annealed specimen. This was attributed to full austenitic transformation at this temperature, which facilitated elemental diffusion and local homogenization. This finding validates the effectiveness of the DICTRA single-phase simulation approach for predicting the homogenization behavior. Additionally, the fully martensitic structure observed after 920 °C annealing further supports the simulation result.
  • Annealing at 620 °C resulted in optimal precipitation hardening in the FCC region, demonstrating the effectiveness of G-phase in strengthening the matrix. By contrast, the 920 °C-annealed sample exhibited the highest hardness disparity, which could be attributed to recrystallization-induced softening in the FCC region and the complete martensitic transformation in the BCC region.
  • This study successfully used CALPHAD-based simulation tools to elucidate microstructural evolution. The utilization of simulation techniques could provide valuable insights for the design and optimization of heat treatment processes in the future.

Author Contributions

Conceptualization, J.-T.K.; methodology, J.-T.K.; software, J.-T.K. and C.-H.C.; validation, A.-C.Y., W.-L.H., M.-F.C. and T.-K.T.; formal analysis, J.-T.K. and C.-H.C.; investigation, J.-T.K.; resources, A.-C.Y., M.-F.C. and T.-K.T.; data curation, J.-T.K. and A.-C.Y.; writing—original draft preparation, J.-T.K.; writing—review and editing, A.-C.Y., W.-L.H., M.-F.C. and T.-K.T.; visualization, J.-T.K.; supervision, A.-C.Y., W.-L.H., M.-F.C. and T.-K.T.; project administration, A.-C.Y. and M.-F.C.; funding acquisition, A.-C.Y. All authors have read and agreed to the published version of the manuscript.

Funding

This study was supported by the High Entropy Materials Center, National Tsing Hua University, Taiwan (No. MOST 109-2634-F-007-024).

Data Availability Statement

The original contributions presented in this study are included in the article. Further inquiries can be directed to the corresponding author.

Acknowledgments

The authors acknowledge the High Entropy Materials Center, National Tsing Hua University, Taiwan, for providing access to the SEM, EDS, and EBSD facilities. Additionally, the authors appreciate the financial support and experimental resources provided by the China Steel Corporation, Taiwan.

Conflicts of Interest

Authors Ming-Feng Chiang and Te-Kang Tsao were employed by the company China Steel Corporation, Taiwan. The remaining authors declare that the research was conducted in the absence of any commercial or financial relationships that could be construed as a potential conflict of interest.

References

  1. Inoue, A.; Kong, F. Soft Magnetic Materials. In Encyclopedia of Smart Materials; Olabi, A.-G., Ed.; Elsevier: Oxford, UK, 2022; pp. 10–23. [Google Scholar]
  2. McHenry, M.E.; Laughlin, D.E. Magnetic properties of metals and alloys. In Physical Metallurgy; Elsevier: Amsterdam, The Netherlands, 2014; pp. 1881–2008. [Google Scholar]
  3. Ouyang, G.; Chen, X.; Liang, Y.; Macziewski, C.; Cui, J. Review of Fe-6.5 wt% Si high silicon steel—A promising soft magnetic material for sub-kHz application. J. Magn. Magn. Mater. 2019, 481, 234–250. [Google Scholar] [CrossRef]
  4. Krings, A.; Boglietti, A.; Cavagnino, A.; Sprague, S. Soft magnetic material status and trends in electric machines. IEEE Trans. Ind. Electron. 2016, 64, 2405–2414. [Google Scholar] [CrossRef]
  5. Chiang, M.-F.; Lo, T.-Y.; Chien, P.-H.; Chi, C.-H.; Chang, K.-C.; Yeh, A.-C.; Shiue, R.-K. The Dilution Effect in High-Power Disk Laser Welding the Steel Plate Using a Nickel-Based Filler Wire. Metals 2021, 11, 874. [Google Scholar] [CrossRef]
  6. Bonikila, P.R.; Indimath, S.S.; Shajan, N. Failure assessment of Mash Seam Weld breakage and development of online weld inspection system for early detection of weld failure. Eng. Fail. Anal. 2022, 133, 105967. [Google Scholar] [CrossRef]
  7. Pawar, S.; Sahoo, S.; Mukhopadhyay, G. Failure analysis of weld joint of high strength quality steel sheets in cold rolling mill. Eng. Fail. Anal. 2019, 103, 392–399. [Google Scholar] [CrossRef]
  8. Park, J.S.; Lim, K.M. Effect of laser welding variables on the formability of 3 wt% Si-added steel welds. Mater. Manuf. Process. 2009, 24, 431–437. [Google Scholar] [CrossRef]
  9. Das, C.; Bhaduri, A.; Srinivasan, G.; Shankar, V.; Mathew, S. Selection of filler wire for and effect of auto tempering on the mechanical properties of dissimilar metal joint between 403 and 304L (N) stainless steels. J. Mater. Process. Technol. 2009, 209, 1428–1435. [Google Scholar] [CrossRef]
  10. Hajiannia, I.; Shamanian, M.; Kasiri, M. Microstructure and mechanical properties of AISI 347 stainless steel/A335 low alloy steel dissimilar joint produced by gas tungsten arc welding. Mater. Des. 2013, 50, 566–573. [Google Scholar] [CrossRef]
  11. Mortezaie, A.; Shamanian, M. An assessment of microstructure, mechanical properties and corrosion resistance of dissimilar welds between Inconel 718 and 310S austenitic stainless steel. Int. J. Press. Vessel. Pip. 2014, 116, 37–46. [Google Scholar] [CrossRef]
  12. Chiang, M.-F.; Chien, P.-H.; Lo, T.-Y.; Shiue, R.-K. Microstructure of Butt Joint of High-Silicon Steel Made Using CO2 Laser Welding and Inconel 82 Filler. Metals 2023, 13, 234. [Google Scholar] [CrossRef]
  13. Ahmad, R.; Bakar, M. Effect of a post-weld heat treatment on the mechanical and microstructure properties of AA6061 joints welded by the gas metal arc welding cold metal transfer method. Mater. Des. 2011, 32, 5120–5126. [Google Scholar] [CrossRef]
  14. Nam, H.; Park, C.; Kim, C.; Kim, H.; Kang, N. Effect of post weld heat treatment on weldability of high entropy alloy welds. Sci. Technol. Weld. Join. 2018, 23, 420–427. [Google Scholar] [CrossRef]
  15. Cao, X.; Rivaux, B.; Jahazi, M.; Cuddy, J.; Birur, A. Effect of pre-and post-weld heat treatment on metallurgical and tensile properties of Inconel 718 alloy butt joints welded using 4 kW Nd: YAG laser. J. Mater. Sci. 2009, 44, 4557–4571. [Google Scholar] [CrossRef]
  16. Jansson, B.; Jönsson, B.; Sundman, B.; Ågren, J. The thermo calc project. Thermochim. Acta 1993, 214, 93–96. [Google Scholar] [CrossRef]
  17. Thermo-Calc. The CALPHAD Methodology. Available online: https://thermocalc.com/about-us/methodology/the-calphad-methodology/ (accessed on 14 March 2025).
  18. Borgenstam, A.; Höglund, L.; Ågren, J.; Engström, A. DICTRA, a tool for simulation of diffusional transformations in alloys. J. Phase Equilibria 2000, 21, 269–280. [Google Scholar] [CrossRef]
  19. Ben, F.; Olubambi, P. Phase and properties prediction of Al–Ag binary system using thermo-calc. MRS Adv. 2023, 8, 577–582. [Google Scholar] [CrossRef]
  20. Ben, F.; Olubambi, P. Thermo-Calc determination of phase diagram and thermodynamic properties of Ni-Al binary system. Mater. Today Proc. 2024, 105, 259–267. [Google Scholar] [CrossRef]
  21. Sridar, S.; Zhao, Y.; Xiong, W. Phase transformations during homogenization of inconel 718 alloy fabricated by suction casting and laser powder bed fusion: A CALPHAD case study evaluating different homogenization models. J. Phase Equilibria Diffus. 2021, 42, 28–41. [Google Scholar] [CrossRef]
  22. Mao, Y.; Li, C.; Ji, X.; Zhang, C.; Ma, J.; Ren, Y.; Zhang, W.; Wang, P.; Liu, Z. Experimental studies on Si mobilities in the Fe3Si/Fe–3% Si alloy diffusion couples and the mathematical simulation by DICTRA. Mater. Chem. Phys. 2025, 337, 130595. [Google Scholar] [CrossRef]
  23. Saucedo-Muñoz, M.L.; Lopez-Hirata, V.M.; Avila-Davila, E.O.; Hernandez-Santiago, F.; Villegas-Cardenas, J.D. Precipitation Process During Isothermal Aging of an Austenitic Stainless Fe-12Cr-10Mn-12Ni-5Mo-0.24 N-0.03 C Steel and Its Effect on the Mechanical Properties. In Proceedings of the TMS 2022 151st Annual Meeting & Exhibition Supplemental Proceedings; Springer: Berlin/Heidelberg, Germany, 2022; pp. 1451–1460. [Google Scholar]
  24. Sanhueza, J.; Rojas, D.; Prat, O.; Garcia, J.; Espinoza, R.; Montalba, C.; Melendrez, M. Precipitation kinetics in a 10.5% Cr heat resistant steel: Experimental results and simulation by TC-PRISMA/DICTRA. Mater. Chem. Phys. 2017, 200, 342–353. [Google Scholar] [CrossRef]
  25. Chung, D.H.; Lee, H.S.; Yun, D.W.; Jeong, H.W.; Yoo, Y.S.; Jang, J.H.; Kwon, H.J.; Seo, S.M.; Na, Y.S. Microsegregation and homogenization behavior of CoCrFeMnNi high-entropy alloy. Mater. Charact. 2024, 209, 113737. [Google Scholar] [CrossRef]
  26. Chen, C.; Dong, Y.; Hu, C.; Du, Y.; Wei, S.; Long, J.; Wang, C.; Xiao, L.; Mao, F. Fabrication of gradient cemented carbide with Ni3Al binder: Simulations and experiments. Ceram. Int. 2022, 48, 12756–12763. [Google Scholar] [CrossRef]
  27. Thorhauer, M.; Heinze, S.; Larsson, H.; Enghardt, S.; Leyens, C. High-temperature-driven degradation analysis and modelling of an industrial gas turbine applicable γ/β NiCoCrAlYRe coating–Part II: Diffusion modelling and experimental validation under isothermal conditions. Surf. Coat. Technol. 2025, 496, 131595. [Google Scholar] [CrossRef]
  28. Nye, J.F. Some geometrical relations in dislocated crystals. Acta Metall. 1953, 1, 153–162. [Google Scholar] [CrossRef]
  29. Moussa, C.; Bernacki, M.; Besnard, R.; Bozzolo, N. Statistical analysis of dislocations and dislocation boundaries from EBSD data. Ultramicroscopy 2017, 179, 63–72. [Google Scholar] [CrossRef]
  30. Muransky, O.; Balogh, L.; Tran, M.; Hamelin, C.; Park, J.-S.; Daymond, M.R. On the measurement of dislocations and dislocation substructures using EBSD and HRSD techniques. Acta Mater. 2019, 175, 297–313. [Google Scholar] [CrossRef]
  31. Jiang, J.; Britton, T.; Wilkinson, A. Measurement of geometrically necessary dislocation density with high resolution electron backscatter diffraction: Effects of detector binning and step size. Ultramicroscopy 2013, 125, 1–9. [Google Scholar] [CrossRef]
  32. ASTM E384-22; Standard Test Method for Microindentation Hardness of Materials. ASTM International: West Conshohocken, PA, USA, 2022.
  33. Katayama, S. Handbook of Laser Welding Technologies; Elsevier: Amsterdam, The Netherlands, 2013. [Google Scholar]
  34. Morito, S.; Nishikawa, J.; Maki, T. Dislocation density within lath martensite in Fe-C and Fe-Ni alloys. ISIJ Int. 2003, 43, 1475–1477. [Google Scholar] [CrossRef]
  35. Berecz, T.; Jenei, P.; Csóré, A.; Lábár, J.; Gubicza, J.; Szabó, P.J. Determination of dislocation density by electron backscatter diffraction and X-ray line profile analysis in ferrous lath martensite. Mater. Charact. 2016, 113, 117–124. [Google Scholar] [CrossRef]
  36. Huang, W.; Wang, H.; Rinker, T.; Tan, W. Investigation of metal mixing in laser keyhole welding of dissimilar metals. Mater. Des. 2020, 195, 109056. [Google Scholar] [CrossRef]
  37. Li, S.; Wang, Y.; Wang, X.; Xue, F. G-phase precipitation in duplex stainless steels after long-term thermal aging: A high-resolution transmission electron microscopy study. J. Nucl. Mater. 2014, 452, 382–388. [Google Scholar] [CrossRef]
  38. Hamaoka, T.; Nomoto, A.; Nishida, K.; Dohi, K.; Soneda, N. Effects of aging temperature on G-phase precipitation and ferrite-phase decomposition in duplex stainless steel. Philos. Mag. 2012, 92, 4354–4375. [Google Scholar] [CrossRef]
  39. Matsukawa, Y.; Takeuchi, T.; Kakubo, Y.; Suzudo, T.; Watanabe, H.; Abe, H.; Toyama, T.; Nagai, Y. The two-step nucleation of G-phase in ferrite. Acta Mater. 2016, 116, 104–113. [Google Scholar] [CrossRef]
  40. Yang, M.; King, D.J.; Povstugar, I.; Wen, Y.; Luan, J.; Kuhn, B.; Jiao, Z.; Wang, C.; Wenman, M.; Liu, X. Precipitation behavior in G-phase strengthened ferritic stainless steels. Acta Mater. 2021, 205, 116542. [Google Scholar] [CrossRef]
  41. Yang, M.; Zhu, J.; Yang, T.; Luan, J.; Jiao, Z.; Fan, X.; Kuhn, B.; Xiong, X.; Wang, C.; Liu, C.T. A novel ferritic steel family hardened by intermetallic compound G-phase. Mater. Sci. Eng. A 2019, 745, 390–399. [Google Scholar] [CrossRef]
  42. Sun, S.; Pugh, M. Manganese partitioning in dual-phase steel during annealing. Mater. Sci. Eng. A 2000, 276, 167–174. [Google Scholar] [CrossRef]
  43. Kurokawa, S.; Ruzzante, J.; Hey, A.; Dyment, F. Diffusion of Nb in Fe and Fe alloys. Met. Sci. 1983, 17, 433–438. [Google Scholar] [CrossRef]
  44. Bukovská, Š.; Moravec, J.; Švec, M. Kinetics of nickel diffusion into austenitic stainless steels AISI 304 and 316L and calculation of diffusion coefficients. Materials 2023, 16, 6783. [Google Scholar] [CrossRef]
  45. Uemura, K. Diffusion of elements in solid iron and steel. Tetsu-to-Hagane 1943, 29, 329–335. [Google Scholar] [CrossRef]
  46. Deng, D. FEM prediction of welding residual stress and distortion in carbon steel considering phase transformation effects. Mater. Des. 2009, 30, 359–366. [Google Scholar] [CrossRef]
  47. Zhang, M.; Wang, D.; He, L.; Ye, X.; Zhang, W. Laser beam welding of AlCoCrFeNi2. 1 eutectic high-entropy alloy. Mater. Lett. 2022, 308, 131137. [Google Scholar] [CrossRef]
  48. Ram, G.J.; Reddy, A.V.; Rao, K.P.; Reddy, G.M.; Sundar, J.S. Microstructure and tensile properties of Inconel 718 pulsed Nd-YAG laser welds. J. Mater. Process. Technol. 2005, 167, 73–82. [Google Scholar]
  49. Li, S.; Zhu, G.; Kang, Y. Effect of substructure on mechanical properties and fracture behavior of lath martensite in 0.1 C–1.1 Si–1.7 Mn steel. J. Alloys Compd. 2016, 675, 104–115. [Google Scholar] [CrossRef]
  50. Kitahara, H.; Ueji, R.; Tsuji, N.; Minamino, Y. Crystallographic features of lath martensite in low-carbon steel. Acta Mater. 2006, 54, 1279–1288. [Google Scholar] [CrossRef]
  51. Klueh, R.; Maziasz, P.; Lee, E.H. Manganese as an austenite stabilizer in Fe-Cr-Mn-C steels. Mater. Sci. Eng. A 1988, 102, 115–124. [Google Scholar] [CrossRef]
  52. Ayad, A.; Ramoul, M.; Rollett, A.; Wagner, F. Quantifying primary recrystallization from EBSD maps of partially recrystallized states of an IF steel. Mater. Charact. 2021, 171, 110773. [Google Scholar] [CrossRef]
  53. Peranio, N.; Li, Y.; Roters, F.; Raabe, D. Microstructure and texture evolution in dual-phase steels: Competition between recovery, recrystallization, and phase transformation. Mater. Sci. Eng. A 2010, 527, 4161–4168. [Google Scholar] [CrossRef]
  54. Mattucci, M.; Cherubin, I.; Changizian, P.; Skippon, T.; Daymond, M. Indentation size effect, geometrically necessary dislocations and pile-up effects in hardness testing of irradiated nickel. Acta Mater. 2021, 207, 116702. [Google Scholar] [CrossRef]
Figure 1. The laser welding system and a schematic diagram of laser welding.
Metals 15 00549 g001
Figure 2. Cross-section images of the FZ which are perpendicular to the welding direction: (A) phase map, (B) Ni, and (C) Fe elements mapping.
Metals 15 00549 g002
Figure 3. Phase distribution across the FZ cross-section and corresponding Fe and Ni compositional profiles.
Metals 15 00549 g003
Figure 4. (A) SEI presents the dendritic structure in FCC region. At a higher magnification, (B) BEI, along with EDS mapping of (C) Fe, (D) Ni, (E) Nb, and (F) Si. (G) SEI of interdendritic particles and (H) the EBSD phase map results confirm that these particles are G-phase. (I) Scheil solidification simulation result indicates the formation of G-phase at the end of non-equilibrium solidification.
Metals 15 00549 g004
Figure 5. Images of microstructure in the BCC region: (A) phase map and (B) IPF, EDS mapping of (C) Fe, (D) Ni, (E) Nb, and (F) Si in the same region.
Metals 15 00549 g005
Figure 6. Equilibrium phase fraction as a function of temperature in the (A) FCC region and (B) BCC region.
Metals 15 00549 g006
Figure 7. Cross-section phase map of entire FZ (A) before and (B) after annealing at 920 °C for 8 h.
Metals 15 00549 g007
Figure 8. SEI of FCC region after (A) 520 °C, (B) 620 °C, (C) 720 °C, and (D) 920 °C annealing for 8 h.
Metals 15 00549 g008
Figure 9. (A) SEI of particles in the FCC region of 920 °C-annealed sample. (B) EDS mapping and (C) phase map of the selected particles in (A). (D) Equilibrium phase fraction versus temperature of FCC interdendrite.
Metals 15 00549 g009
Figure 10. Phase map of the BCC region after (A) 520 °C, (B) 620 °C, (C) 720 °C, and (D) 920 °C annealing for 8 h. (E) IPF of 920 °C-treated sample and (F) the misorientation profile along the direction of black arrow in the previous figure, revealing a misorientation of approximately 60° within the sub-block structures.
Metals 15 00549 g010
Figure 11. (A) Diagrammatic illustration of single-phase simulations setup and (B) chemical composition profile setup. Composition profile of Ni after annealing at (C) 720 °C and (D) 920 °C for various duration.
Metals 15 00549 g011
Figure 12. Comparison of hardness between the FCC and BCC regions for each sample after different heat treatment for 8 h.
Metals 15 00549 g012
Figure 13. KAM maps of the FCC region for (A) as-weld condition and after annealing at (B) 520 °C, (C) 620 °C, (D) 720 °C, and (E) 920 °C for 8 h.
Metals 15 00549 g013
Figure 14. The relation between hardness, precipitate volume fraction, and GND density of the FCC region after different annealing conditions for 8 h.
Metals 15 00549 g014
Table 1. Quantitative chemical composition of selected region A~F and single FCC and BCC area.
LocationChemical Composition (wt.%)
FeSiNiCrMnNbAl
A531.632.69.71.51.20.4
B53.81.7329.31.51.30.4
C70.81.720.55.20.80.60.4
D88.12.46.420.40.20.5
E88.92.55.81.80.30.10.5
F87.82.56.620.40.20.5
FCC56.51.730.38.71.41.00.4
BCC88.42.66.11.70.40.20.6
Table 2. Chemical composition of BCC matrix and interdendritic FCC site.
LocationChemical Composition (wt.%)
FeSiNiCrMnNbAl
BCC Matrix75.02.016.35.00.80.50.4
Interdendritic Site71.61.919.05.41.00.60.5
Table 3. Average hardness in the FCC and BCC regions after different heat treatment for 8 h.
Location/Hardness (HV50gf)Annealing Conditions
As-Weld520 °C for 8 h620 °C for 8 h720 °C for 8 h920 °C for 8 h
FCC224.94245.82259.33246.89166.39
BCC304.78307.38305.00306.53335.77
Disclaimer/Publisher’s Note: The statements, opinions and data contained in all publications are solely those of the individual author(s) and contributor(s) and not of MDPI and/or the editor(s). MDPI and/or the editor(s) disclaim responsibility for any injury to people or property resulting from any ideas, methods, instructions or products referred to in the content.

