

Detection of Q235 Mild Steel Resistance Spot Welding Defects Based on EMD-SVM


Abstract
1. Introduction
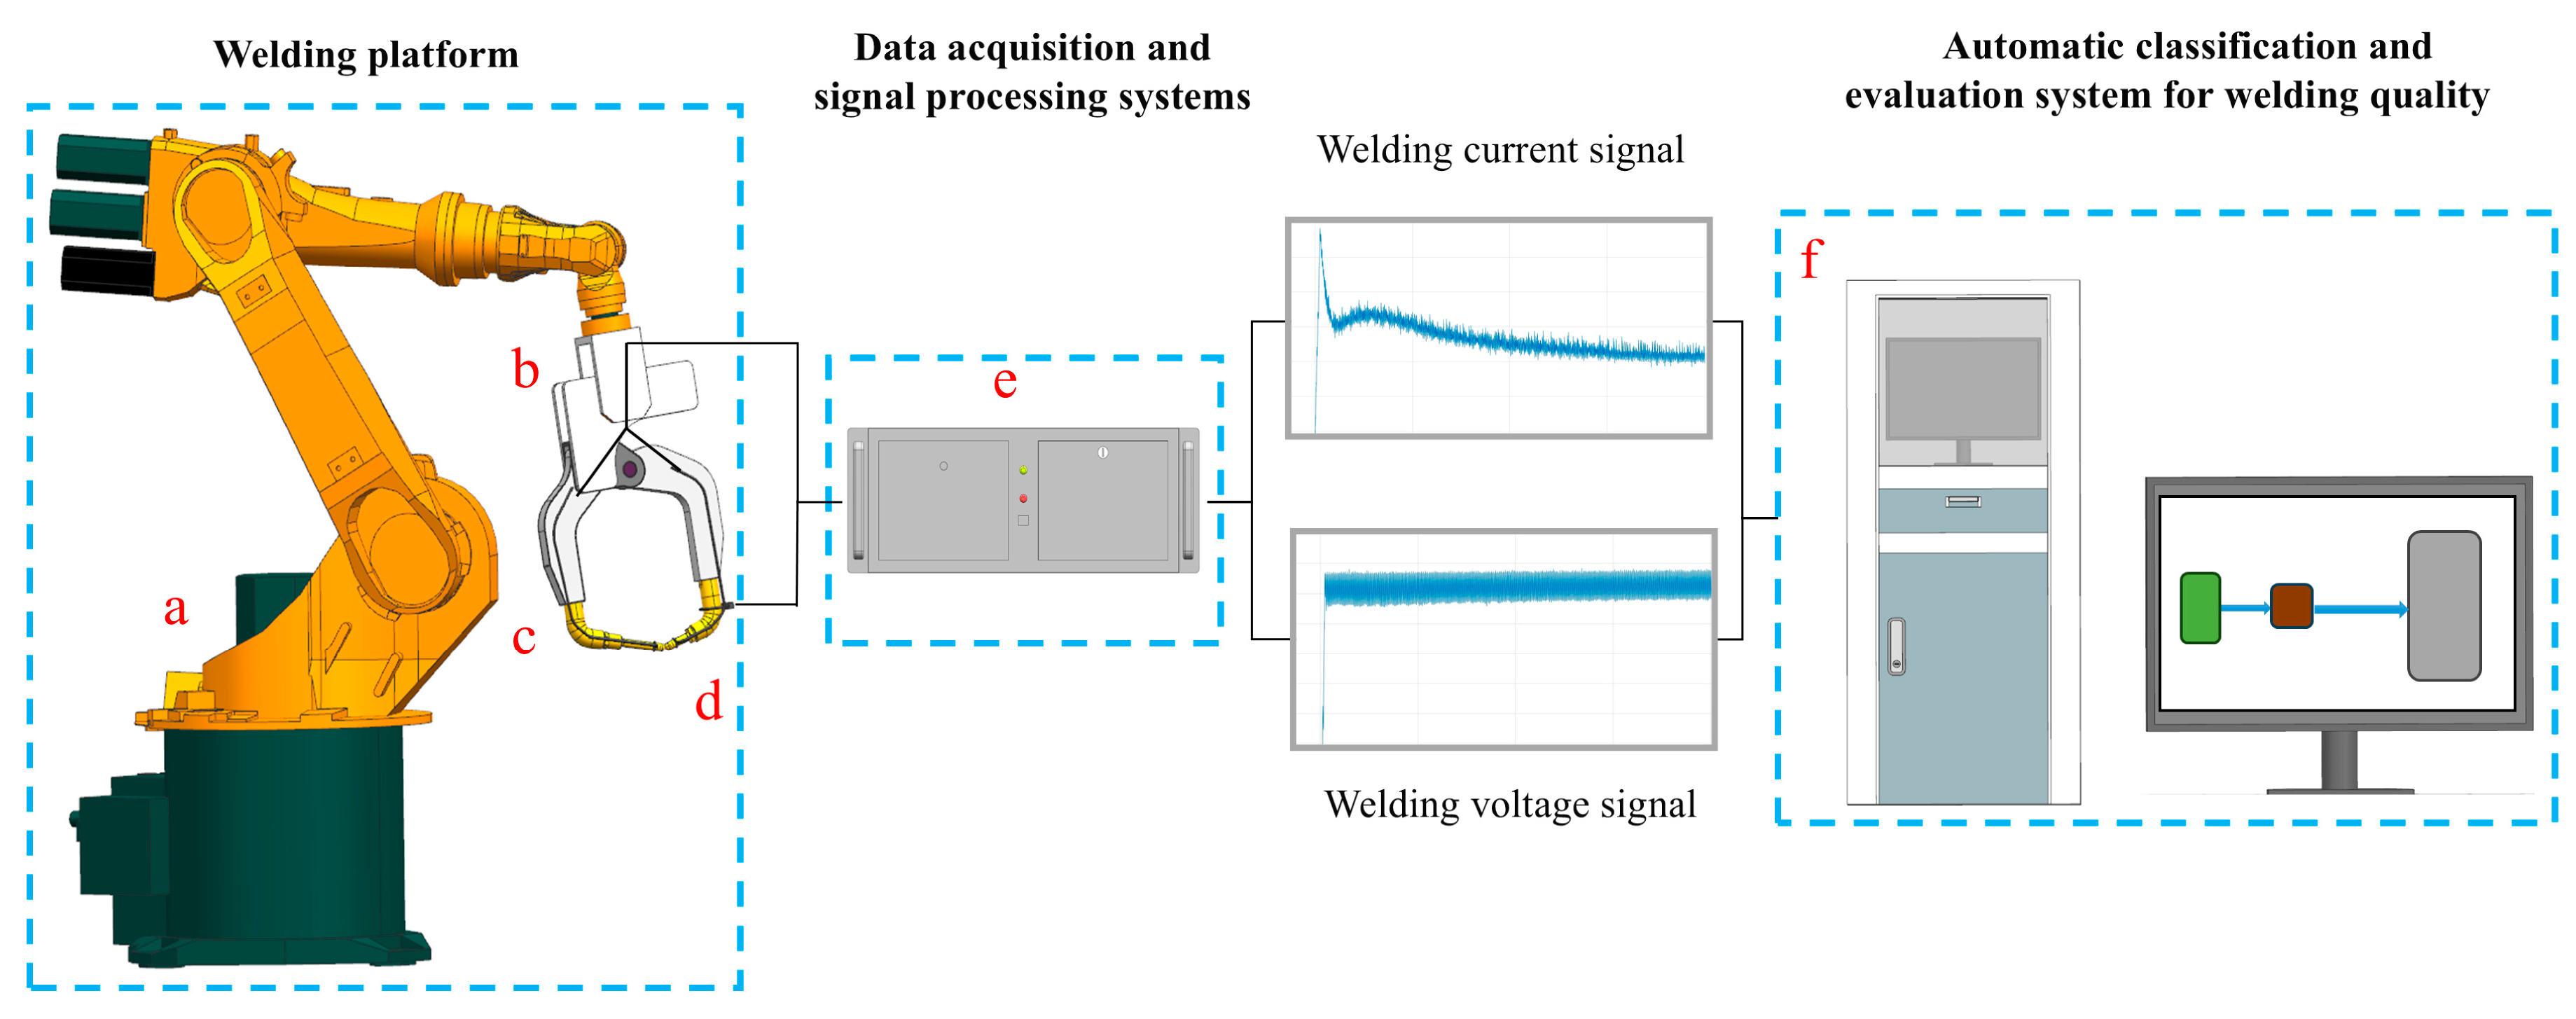
2. Experimental Apparatus and Signal Filtering
2.1. Experimental Device and Experimental Design
- (1)
- Welding spatter experiment: This experiment aimed to study the conditions of sputtering and side welding. The electrode contact surface diameter was 6 mm, and the welding current was adjusted to 9 kA, with a welding duration of 280 ms. Studies have shown that under the above parameters, lower pressures (such as 2.5 kN) are more likely to lead to spatter defects. To further examine the effect of pressure on spatter occurrence, two distinct pressure levels, 2.5 kN and 3 kN, were evaluated;
- (2)
- False welding experiment: Under the conditions of the selected electrode contact surface diameter of 6 mm, welding current of 5 kA, and welding duration of 280 ms, we tested the pressure of 4 kN in the preliminary experiment and found that it was more likely to cause false welding defects. To further investigate the impact of pressure on weld quality, we designed two pressure conditions of 3 kN and 4 kN for comparative analysis;
- (3)
- Edge welding experiment: The electrode contact surface diameter was 6 mm, the welding current was adjusted to 9 kA, and the welding duration was 280 ms. The pressure condition is 3 kN.
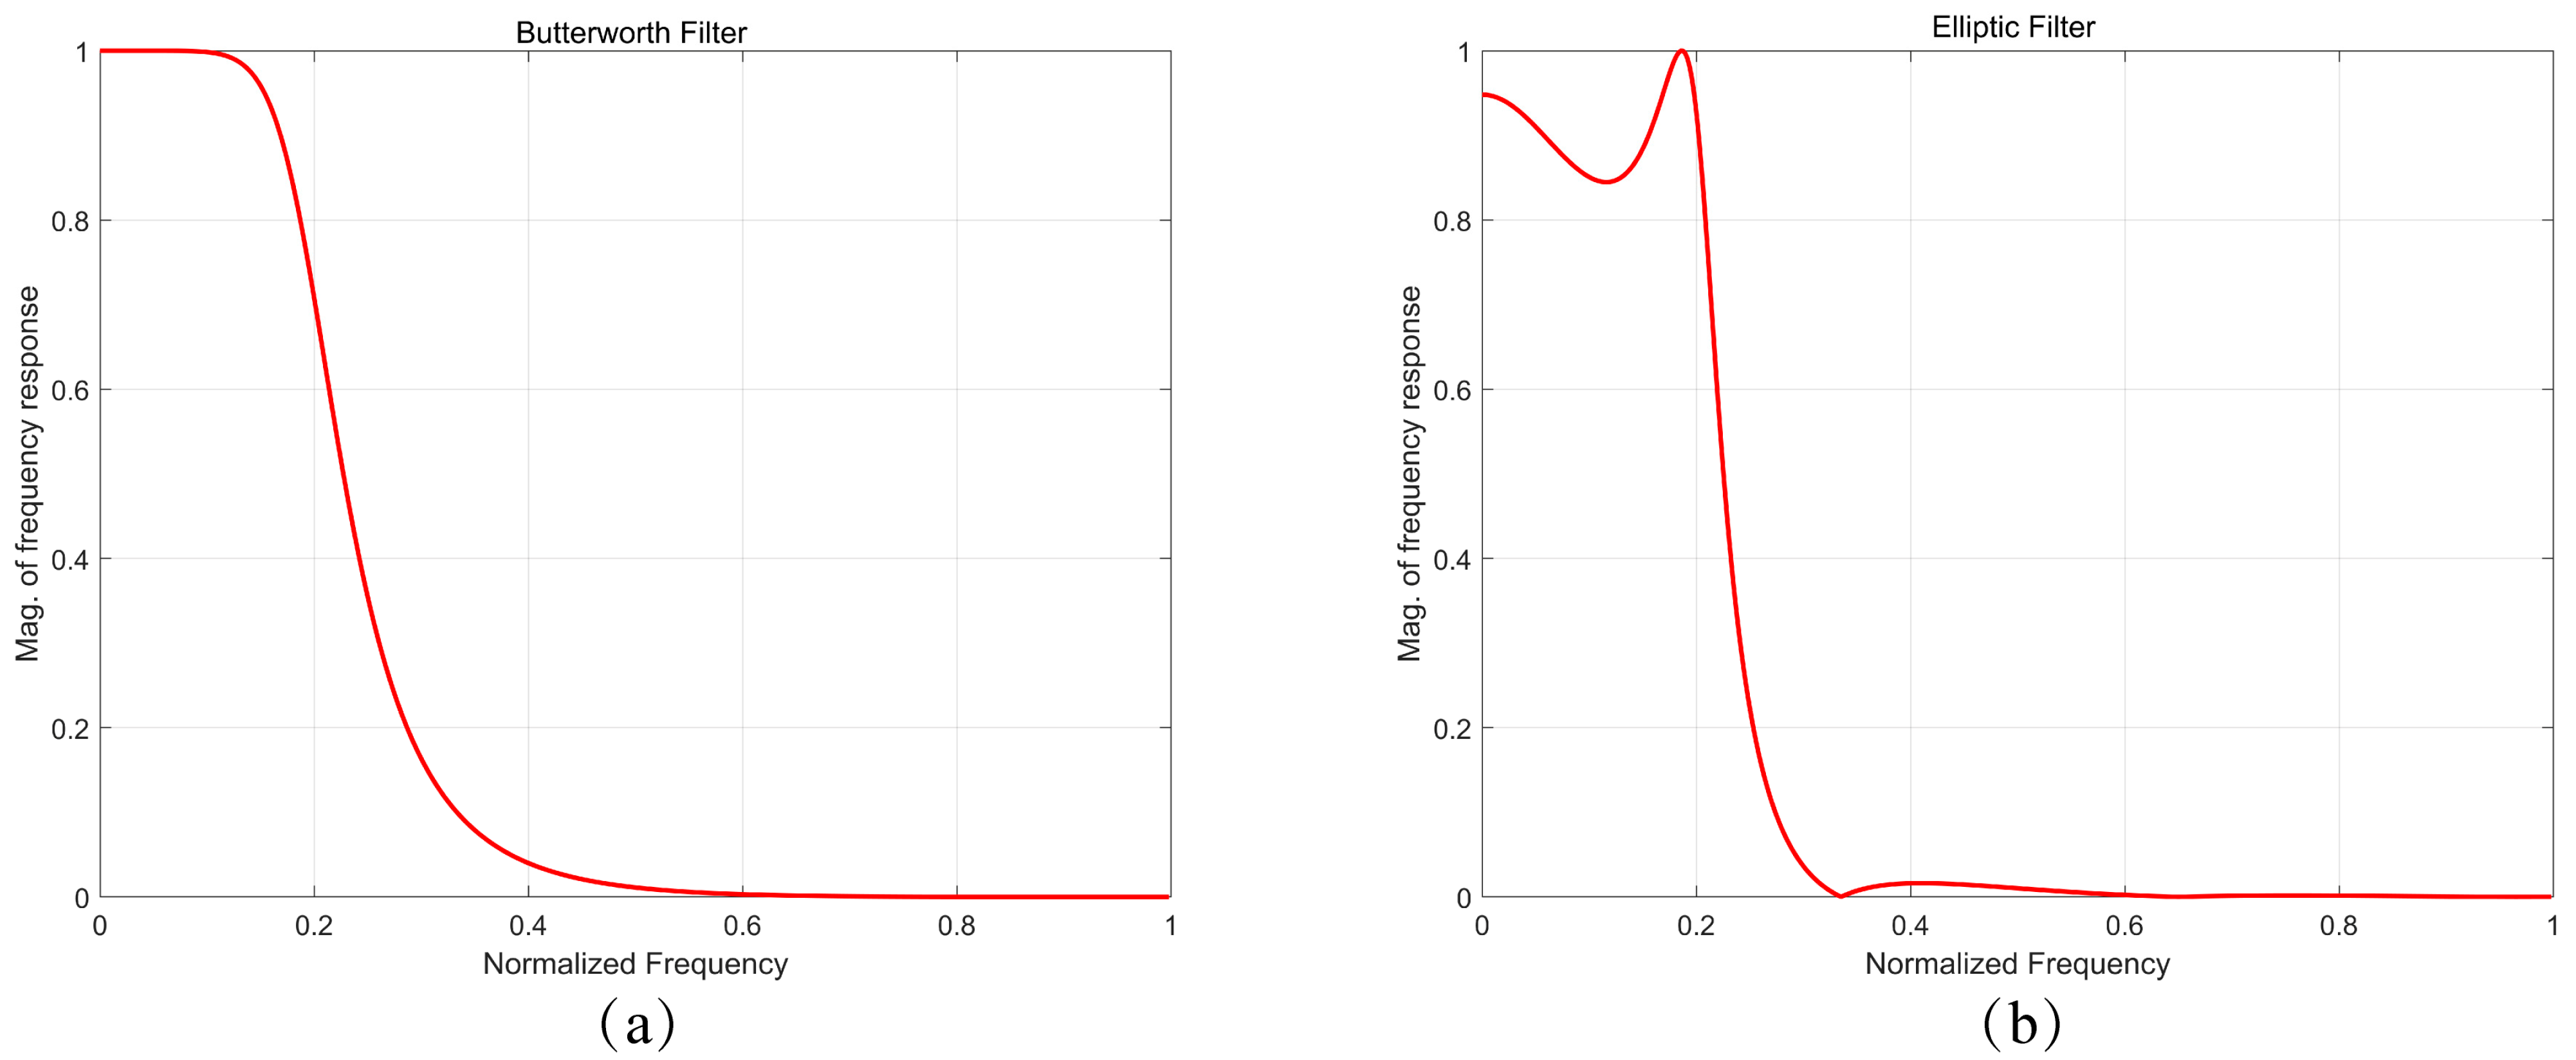
2.2. Filter Selection
2.2.1. Filter Introduction
- (1)
- Reducing the number of IMFs: This helps eliminate unnecessary modes caused by high-frequency noise;
- (2)
- Enhancing computational efficiency: Since the computational complexity of EMD rises with signal complexity, pre-filtering alleviates the processing load for subsequent decomposition steps.
2.2.2. Filter Design
3. Signal Analysis
3.1. Welding Surface Image Analysis
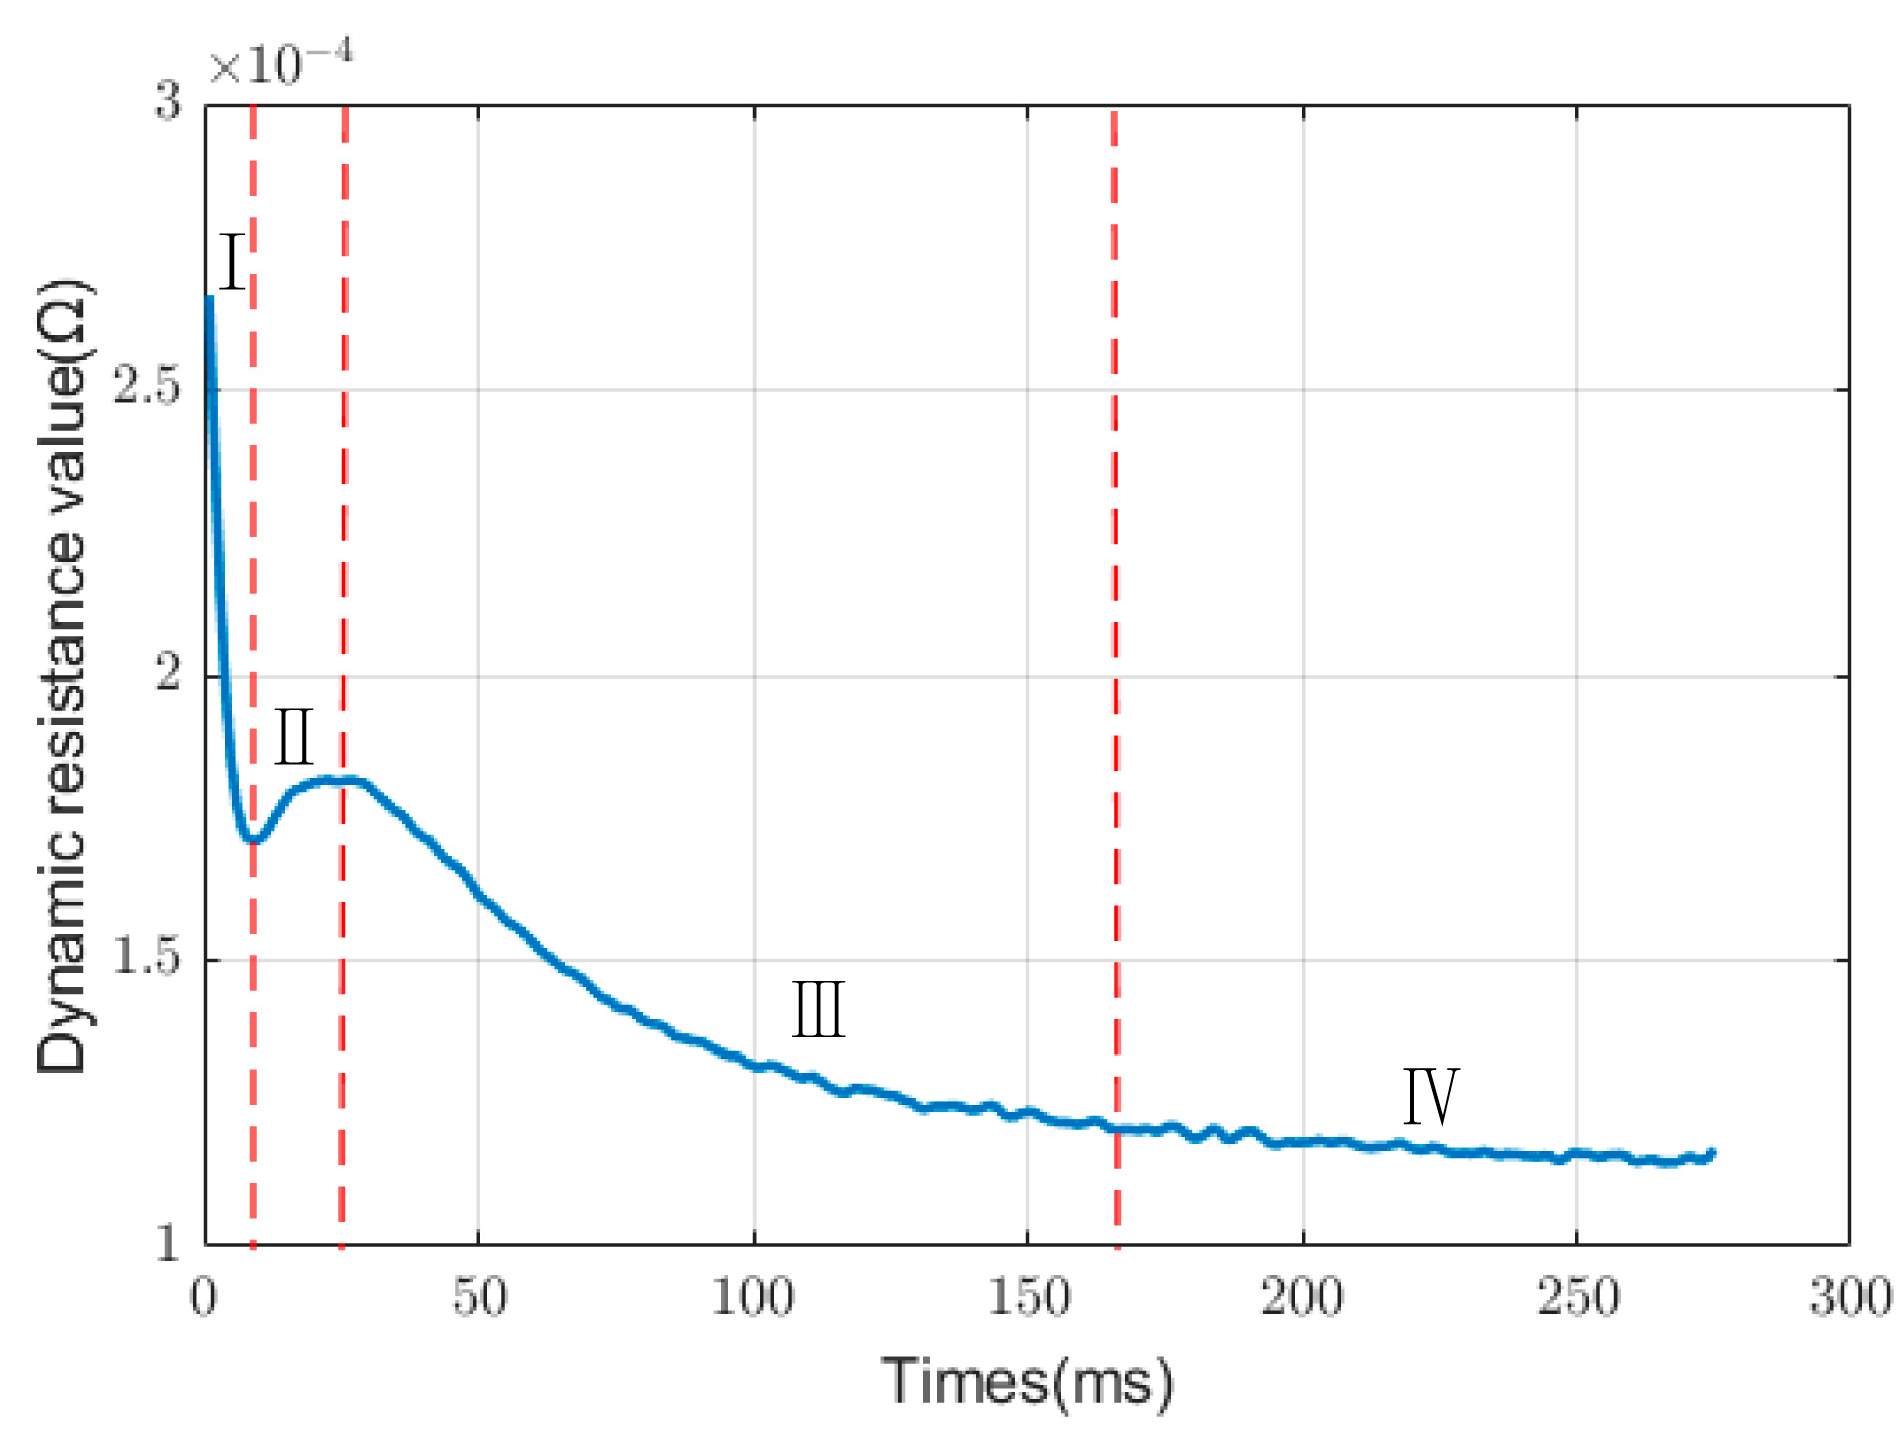
3.2. Dynamic Resistance Signal Curve
3.3. Empirical Mode Decomposition (EMD) of Welding Dynamic Resistance Signals
- (1)
- Assuming that the dynamic resistance signal is , take the sequence , composed of the upper and lower envelope local means;
- (2)
- Let , provided meets the IMF requirement; then, it is the first IMF component. On the contrary, serves as the initial dataset for reiterating the procedures outlined in steps (1) and (2) for j times to obtain so that meets the IMF conditions to derive the first IMF, which is marked as ;
- (3)
- Subtract from to obtain the following residual:
4. Solder Joint Quality Prediction Based on EMD-SVM
4.1. Support Vector Machine
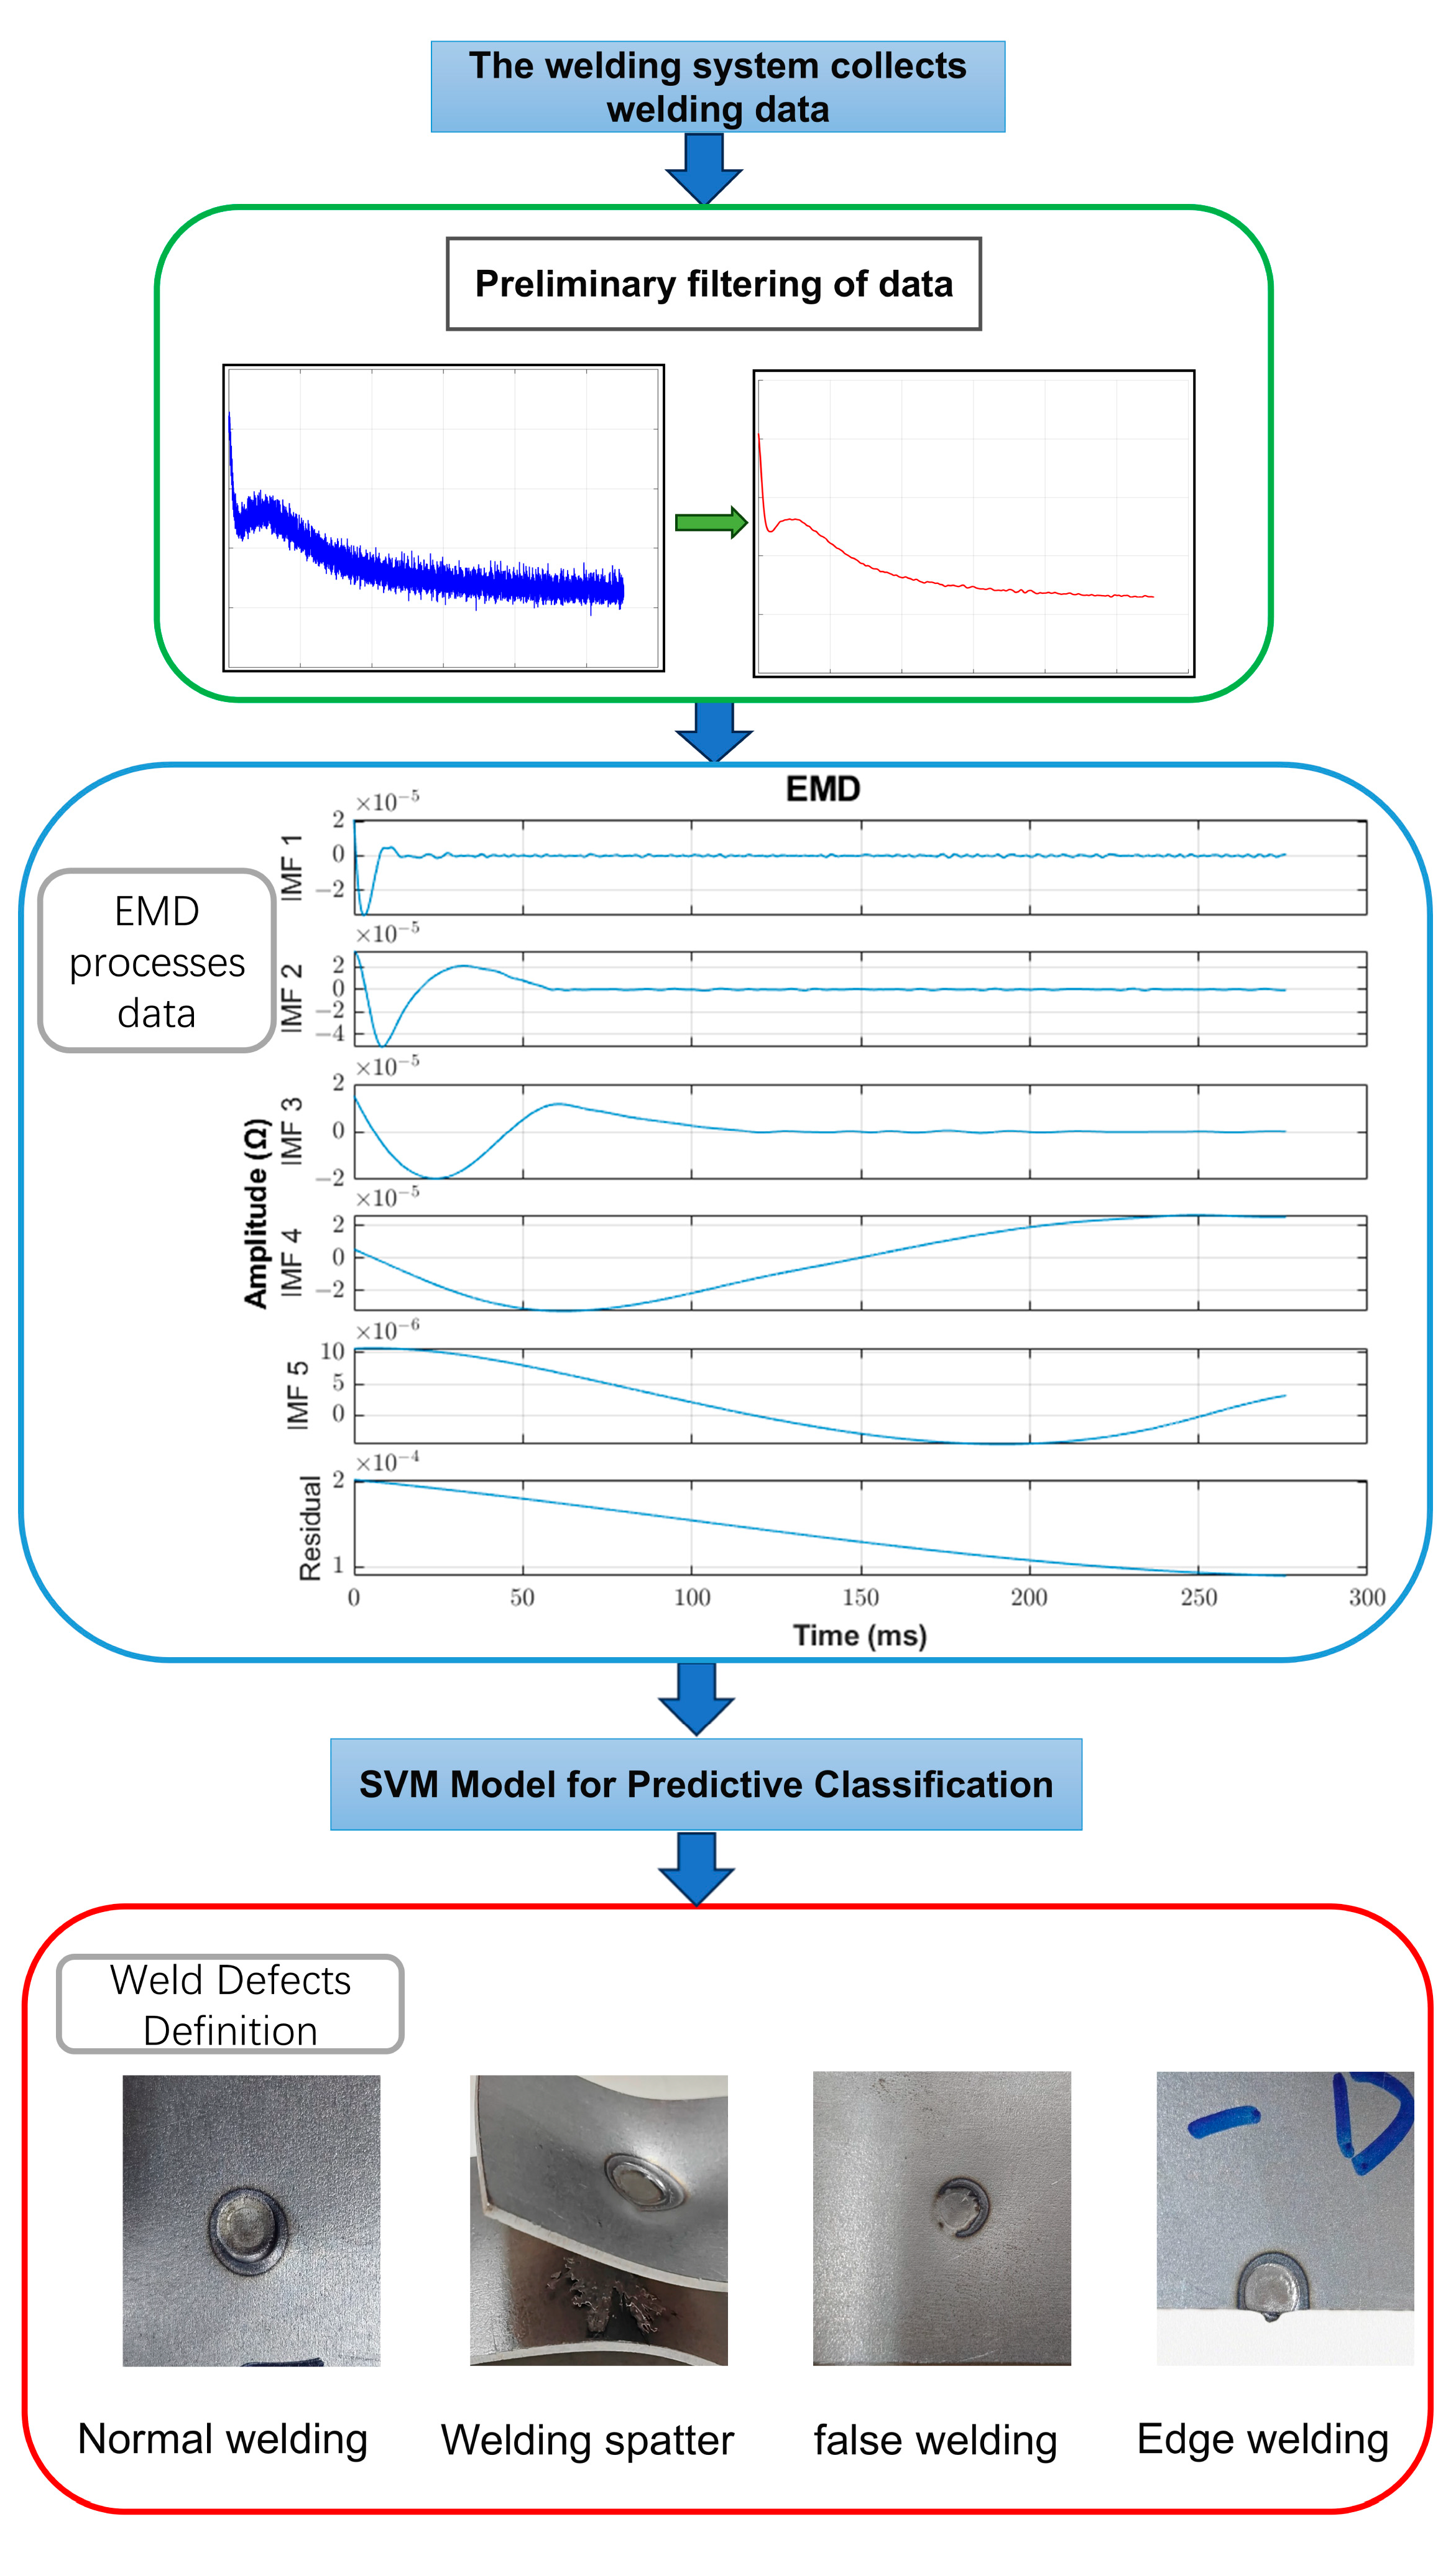
4.2. The Overall Model of EMD-SVM Was Used to Evaluate Solder Joint Quality
- (1)
- In accordance with the surface phenomena of RSW, four types of welding were defined: normal welding, welding spatter, false welding, and edge welding. Among them, level 1 is normal welding, level 2 is welding spatter, level 3 is false welding, and level 4 is edge welding. The DR data after integration processing were taken as the dataset;
- (2)
- The filtered DR data were decomposed through EMD to yield several modal components with varying properties, including IMFs components and residuals;
- (3)
- A classification model using SVM was established to predict solder joint quality types, utilizing the original signal, IMFs components, and residual components of the four defect features as input data.
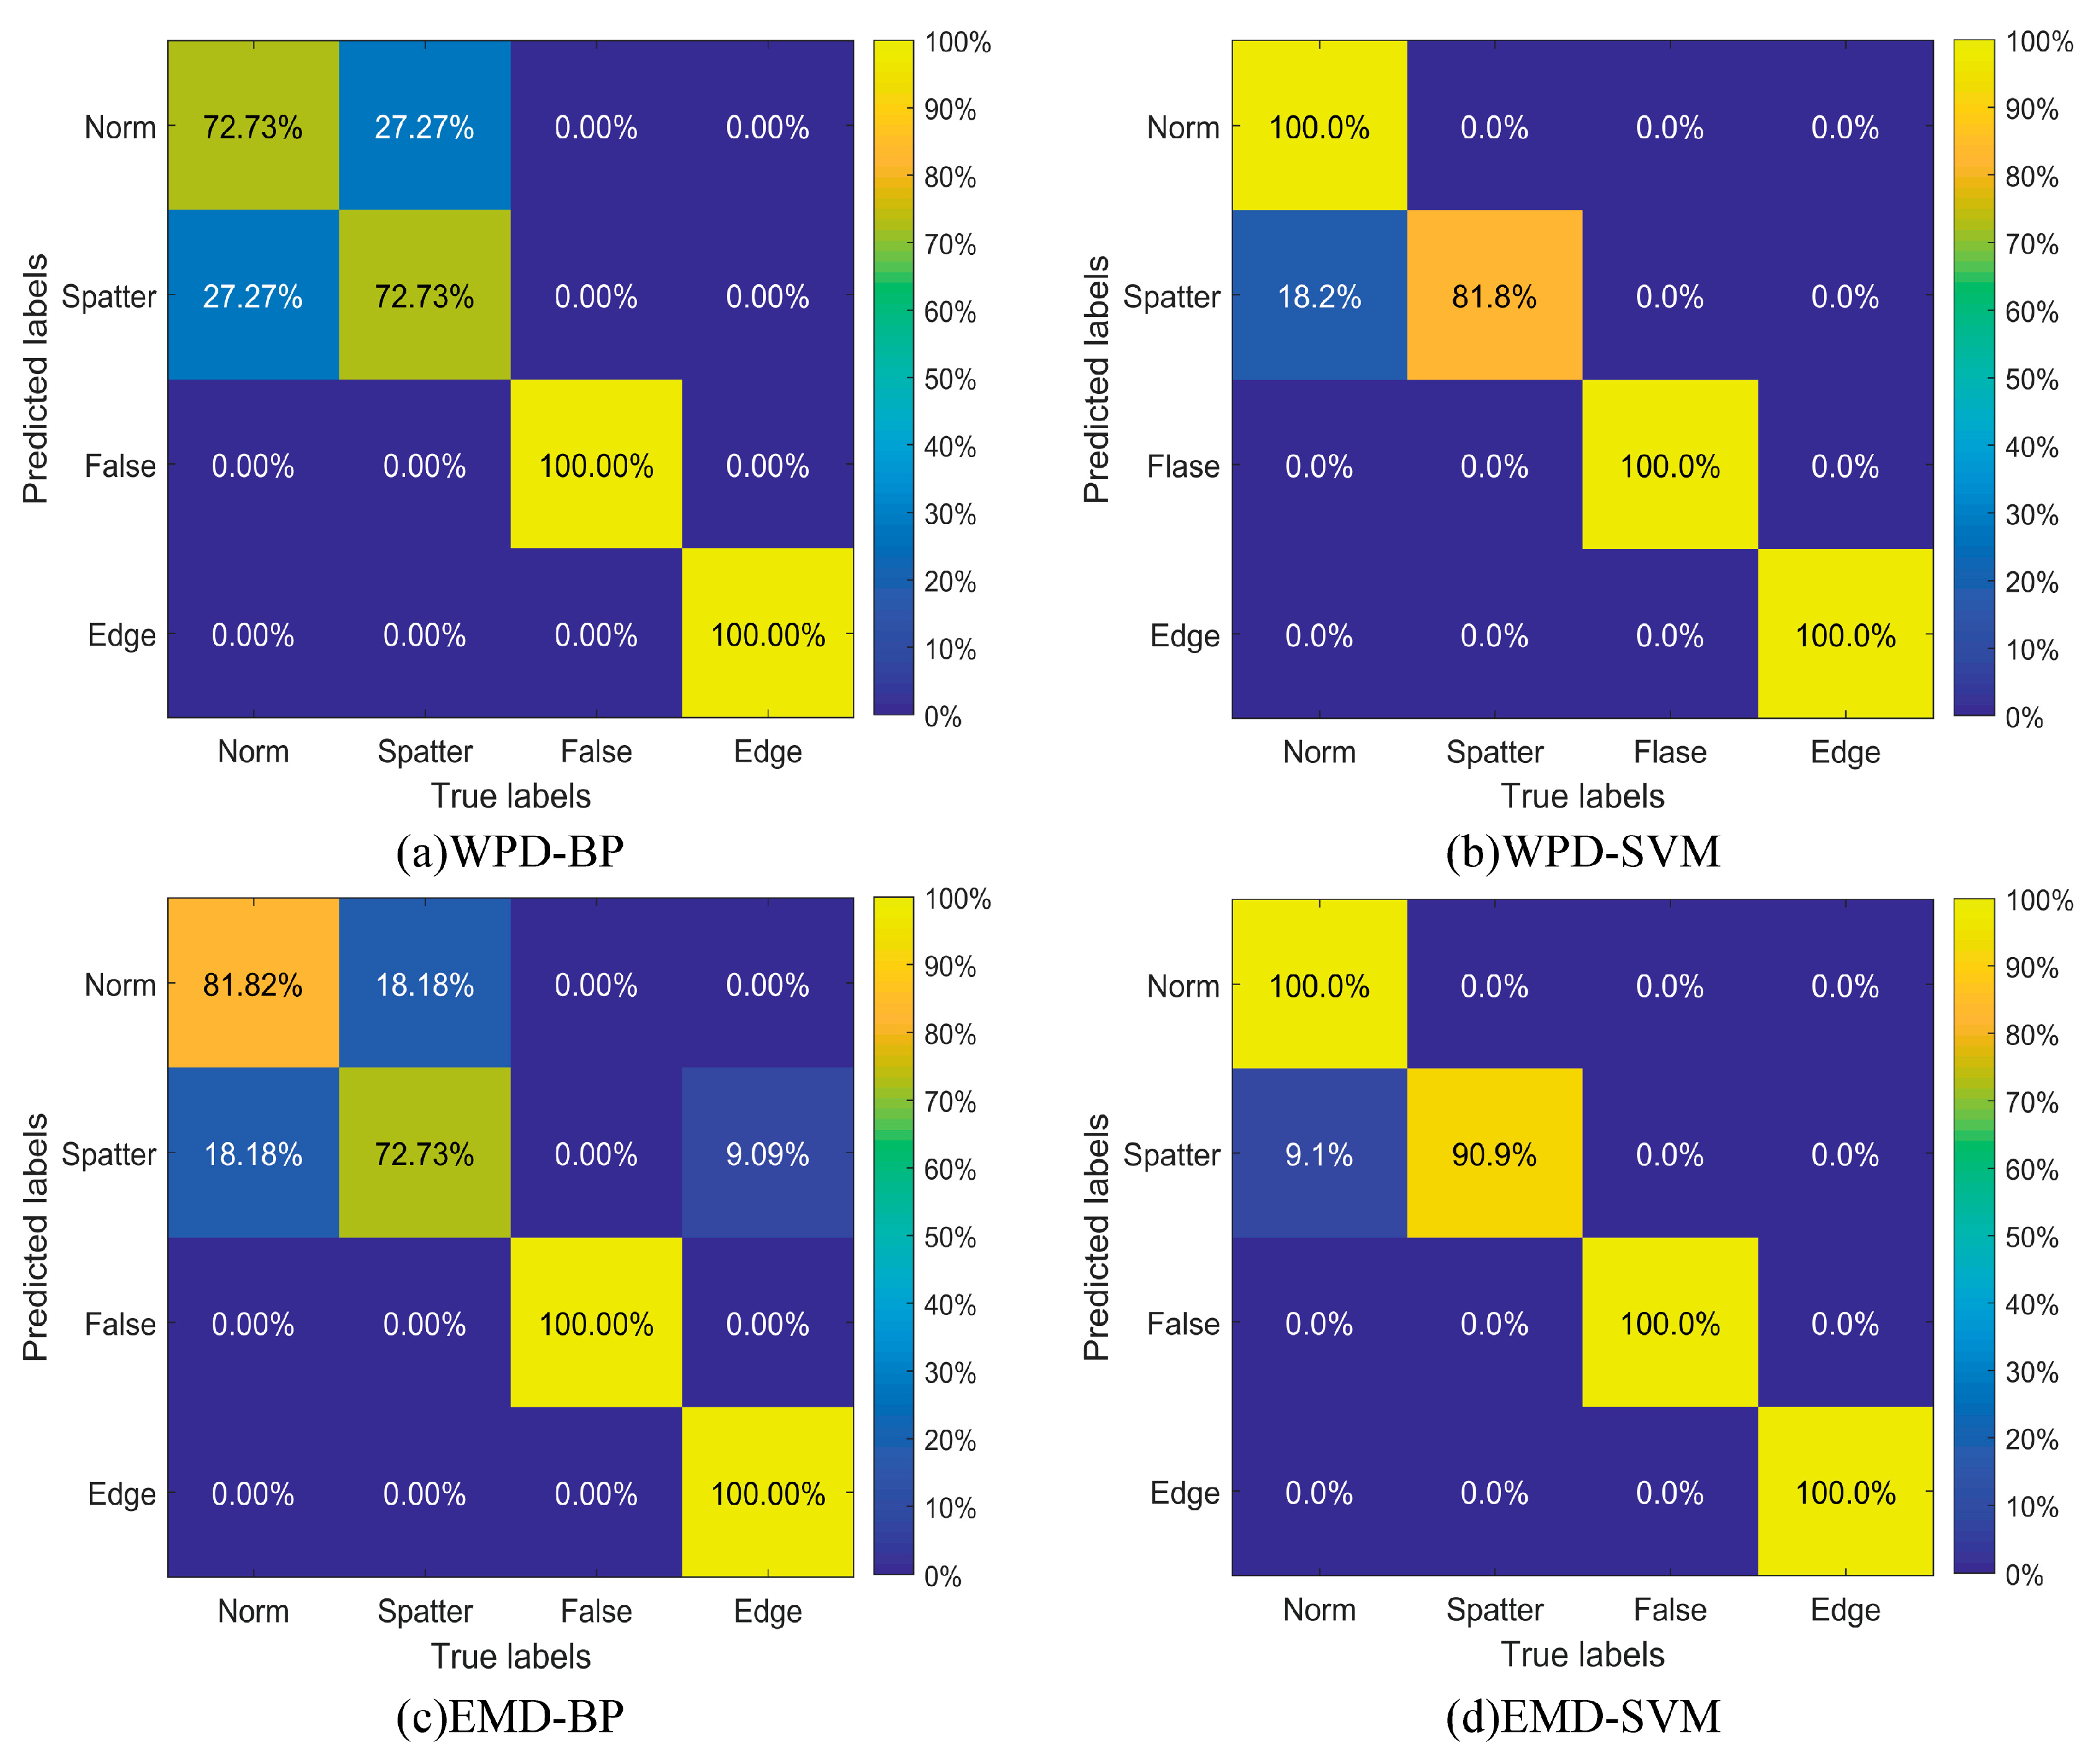
4.3. Results and Discussion
5. Conclusions
- A high-accuracy online monitoring framework for welding current and voltage signals was developed to deliver comprehensive data for the quality assessment of RSW on Q235 mild steel;
- The experiment reveals that notable distinctions exist between the DR profiles of normal welding and defective welding, with clear variations also present among various defect categories. The DR of welding spatter will decrease instantaneously in phase III. The DR of the false welding lacks the characteristics of nugget formation in phase II. The phase III of edge welding concludes earlier than normal welding, and the DR signal drops instantaneously due to the production of the discharge;
- This study investigated main defects in the RSW process (welding spatter, false welding, and edge welding) and extracted 12 features of normal and defective joints using a Butterworth filter. A new EMD-SVM classification method is proposed to improve the accuracy of distinguishing normal from spatter welding points. Through an online quality evaluation of 144 welding points, the method achieved 97.73% classification accuracy, outperforming other models. An online quality evaluation and defect classification model was developed, enabling rapid and accurate classification of welding points.
Author Contributions
Funding
Data Availability Statement
Conflicts of Interest
Correction Statement
Abbreviations
| RSW | Resistance spot welding |
| HHT | Hilbert–Huang transform |
| EMD | Empirical mode decomposition |
| IMF | Intrinsic mode function |
| SVM | Support vector machine |
| WPD | Wavelet packet decomposition |
| MFDC | Medium-frequency direct current |
| DR | Dynamic resistance |
| BP | Backpropagation |
References
- Wang, L.; Hou, Y.; Zhang, H.; Zhao, J.; Xi, T.; Qi, X.; Li, Y. A New Measurement Method for the Dynamic Resistance Signal during the Resistance Spot Welding Process. Meas. Sci. Technol. 2016, 27, 95009. [Google Scholar] [CrossRef]
- Zhao, D.; Vdonin, N.; Slobodyan, M.; Butsykin, S.; Kiselev, A.; Gordynets, A.; Wang, Y. Dynamic Resistance Signal-Based Wear Monitoring of Resistance Spot Welding Electrodes. Int. J. Adv. Manuf. Technol. 2024, 133, 3267–3281. [Google Scholar] [CrossRef]
- Meilinger, Á.; Kovács, P.Z.; Lukács, J. High-Cycle Fatigue Characteristics of Aluminum/Steel Clinched and Resistance-Spot-Welded Joints Based on Failure Modes. Metals 2024, 14, 1375. [Google Scholar] [CrossRef]
- Zhao, D.; Bezgans, Y.; Wang, Y.; Du, W.; Vdonin, N. Research on the Correlation between Dynamic Resistance and Quality Estimation of Resistance Spot Welding. Measurement 2021, 168, 108299. [Google Scholar] [CrossRef]
- Stavropoulos, P.; Sabatakakis, K. Quality Assurance in Resistance Spot Welding: State of Practice, State of the Art, and Prospects. Metals 2024, 14, 185. [Google Scholar] [CrossRef]
- Gao, X.; Wang, Y.; Chen, Z.; Ma, B.; Zhang, Y. Analysis of Welding Process Stability and Weld Quality by Droplet Transfer and Explosion in MAG-Laser Hybrid Welding Process. J. Manuf. Process. 2018, 32, 522–529. [Google Scholar] [CrossRef]
- Wang, C.; Wang, C.; Gao, X.; Tian, M.; Zhang, Y. Research on Microstructure Characteristics of Welded Joint by Magneto-Optical Imaging Method. Metals 2022, 12, 258. [Google Scholar] [CrossRef]
- Peng, P.; Fan, K.; Fan, X.; Zhou, H.; Guo, Z. Real-Time Defect Detection Scheme Based on Deep Learning for Laser Welding System. IEEE Sens. J. 2023, 23, 17301–17309. [Google Scholar] [CrossRef]
- Guo, S.; Wang, D.; Chen, J.; Feng, Z.; Guo, W. Predicting Nugget Size of Resistance Spot Welds Using Infrared Thermal Videos With Image Segmentation and Convolutional Neural Network. J. Manuf. Sci. Eng. 2021, 144, 021009. [Google Scholar] [CrossRef]
- Zhou, L.; Zhang, R.X.; Yang, H.F.; Huang, Y.X.; Song, X.G. Microstructure and Mechanical Properties of Friction Stir Welded Q235 Low-Carbon Steel. J. Mater. Eng. Perform. 2018, 27, 6709–6718. [Google Scholar] [CrossRef]
- Chen, S.; Sun, T.; Jiang, A.; Qi, J.; Zeng, R. Online Monitoring and Evaluation of the Weld Quality of Resistance Spot Welded Titanium Alloy. J. Manuf. Process. 2016, 23, 183–191. [Google Scholar] [CrossRef]
- Chen, S.; Wu, N.; Xiao, J.; Li, T.; Lu, Z. Expulsion Identification in Resistance Spot Welding by Electrode Force Sensing Based on Wavelet Decomposition with Multi-Indexes and BP Neural Networks. Appl. Sci. 2019, 9, 4028. [Google Scholar] [CrossRef]
- Zhao, D.; Wang, Y.; Liang, D.; Ivanov, M. Performances of Regression Model and Artificial Neural Network in Monitoring Welding Quality Based on Power Signal. J. Mater. Res. Technol. 2020, 9, 1231–1240. [Google Scholar] [CrossRef]
- Peng, S.; Sun, S.; Yao, Y.-D. A Survey of Modulation Classification Using Deep Learning: Signal Representation and Data Preprocessing. IEEE Trans. Neural Netw. Learn. Syst. 2022, 33, 7020–7038. [Google Scholar] [CrossRef] [PubMed]
- Abate, F.; Huang, V.K.L.; Monte, G.; Paciello, V.; Pietrosanto, A. A Comparison between Sensor Signal Preprocessing Techniques. IEEE Sens. J. 2015, 15, 2479–2487. [Google Scholar] [CrossRef]
- Voznesensky, A.; Kaplun, D. Adaptive Signal Processing Algorithms Based on EMD and ITD. IEEE Access 2019, 7, 171313–171321. [Google Scholar] [CrossRef]
- Fan, X.; Gao, X.; Zhang, N.; Ye, G.; Liu, G.; Zhang, Y. Monitoring of 304 Austenitic Stainless-Steel Laser-MIG Hybrid Welding Process Based on EMD-SVM. J. Manuf. Process. 2022, 73, 736–747. [Google Scholar] [CrossRef]
- Li, W.; Cerjanec, D.; Grzadzinski, G.A. A Comparative Study of Single-Phase AC and Multiphase DC Resistance Spot Welding. J. Manuf. Sci. Eng. 2004, 127, 583–589. [Google Scholar] [CrossRef]
- Samimi, M.H.; Mahari, A.; Farahnakian, M.A.; Mohseni, H. The Rogowski Coil Principles and Applications: A Review. IEEE Sens. J. 2015, 15, 651–658. [Google Scholar] [CrossRef]
- Hussin, S.F.; Birasamy, G.; Hamid, Z. Design of Butterworth Band-Pass Filter. Politek. Kolej Komuniti J. Eng. Technol. 2016, 1, 32–46. [Google Scholar]
- Lv, Z.; Gao, X.; Xiao, H.; Gao, P. Resistance Spot Welding Defect Detection Based on Vectorized Dynamic Resistance Signal and LightGBM Classifier. Meas. Sci. Technol. 2024, 35, 086113. [Google Scholar] [CrossRef]
- Chen, D.; Yang, W.; Pan, M. The Dynamic Response of a Butterworth Low-Pass Filter in an Ac-Based Electrical Capacitance Tomography System. Meas. Sci. Technol. 2010, 21, 105505. [Google Scholar] [CrossRef]
- JISZ3140:2017 Method of Inspection and Acceptance Levels for Resistance Spot Welds. Available online: https://kikakurui.com/z3/Z3140-2017-01.html (accessed on 25 April 2025).
- Zhou, K.; Yao, P. Overview of Recent Advances of Process Analysis and Quality Control in Resistance Spot Welding. Mech. Syst. Signal Process. 2019, 124, 170–198. [Google Scholar] [CrossRef]
- Xia, Y.-J.; Lv, T.; Ghassemi-Armaki, H.; Li, Y.; Carlson, B. Quantitative Interpretation of Dynamic Resistance Signal in Resistance Spot Welding. Weld. J. 2023, 102, 69s–87s. [Google Scholar] [CrossRef]
- Tan, W.; Zhou, Y.; Kerr, H.W.; Lawson, S. A Study of Dynamic Resistance during Small Scale Resistance Spot Welding of Thin Ni Sheets. J. Phys. D Appl. Phys. 2004, 37, 1998–2008. [Google Scholar] [CrossRef]
- Xing, B.; Xiao, Y.; Qin, Q.H.; Cui, H. Quality Assessment of Resistance Spot Welding Process Based on Dynamic Resistance Signal and Random Forest Based. Int. J. Adv. Manuf. Technol. 2018, 94, 327–339. [Google Scholar] [CrossRef]
- Huang, N.E.; Shen, Z.; Long, S.R.; Wu, M.C.; Shih, H.H.; Zheng, Q.; Yen, N.-C.; Tung, C.C.; Liu, H.H. The Empirical Mode Decomposition and the Hilbert Spectrum for Nonlinear and Non-Stationary Time Series Analysis. Proc. R. Soc. Lond. A Math. Phys. Eng. Sci. 1998, 454, 903–995. [Google Scholar] [CrossRef]
- Ge, H.; Chen, G.; Yu, H.; Chen, H.; An, F. Theoretical Analysis of Empirical Mode Decomposition. Symmetry 2018, 10, 623. [Google Scholar] [CrossRef]
- Cortes, C.; Vapnik, V. Support-Vector Networks. Mach. Learn. 1995, 20, 273–297. [Google Scholar] [CrossRef]
- Burges, C.J.C. A Tutorial on Support Vector Machines for Pattern Recognition. Data Min. Knowl. Discov. 1998, 2, 121–167. [Google Scholar] [CrossRef]


| Steel Grades | C | Mn | Si | S | P |
|---|---|---|---|---|---|
| Q235 | <0.22 | <1.40 | <0.35 | <0.045 | <0.045 |
| Weld Category | Solder Joint Diameter (mm) | Drawing Force (N) |
|---|---|---|
| Normal welding | 6.792 | 5801.1 |
| Welding spatter | 6.503 | 5336.3 |
| False welding | 4.755 | 2517.4 |
| Features | Equation | Description |
|---|---|---|
| The average value of the whole signal; n is the signal length | ||
| The standard deviation value of the signal | ||
| - | The maximum amplitude value in the signal | |
| - | The minimum amplitude value in the signal | |
| The average value of the maximum resistance and minimum resistance value | ||
| Measures asymmetry of the signal distribution | ||
| Measures the “tailedness” or sharpness of the signal distribution. | ||
| The range value between the maximum point and the minimum point in the signal | ||
| The ratio of the peak value of the signal to the root mean square value, indicating signal spikes. | ||
| The count of local peaks in the signal; is indicator function | ||
| The rate at which peaks occur in the signal; is the sampling interval. | ||
| The frequency of signal amplitude sign changes (zero-crossings) per unit time/length |
| Model | Training Time (s) | Accuracy of Train Set (%) | Accuracy of Test Set (%) | Significance (p < 0.05) |
|---|---|---|---|---|
| BP | 0.18 | 80.81 | 84.09 | 0.001 |
| SVM | 0.09 | 90.00 | 90.91 | 0.018 |
| WPD-BP | 0.16 | 82.26 | 86.36 | 0.001 |
| WPD-SVM | 0.12 | 95.60 | 95.45 | 0.045 |
| EMD-BP | 0.15 | 89.36 | 88.64 | 0.002 |
| EMD-SVM | 0.11 | 96.88 | 97.73 | - |
Disclaimer/Publisher’s Note: The statements, opinions and data contained in all publications are solely those of the individual author(s) and contributor(s) and not of MDPI and/or the editor(s). MDPI and/or the editor(s) disclaim responsibility for any injury to people or property resulting from any ideas, methods, instructions or products referred to in the content. |
© 2025 by the authors. Licensee MDPI, Basel, Switzerland. This article is an open access article distributed under the terms and conditions of the Creative Commons Attribution (CC BY) license (https://creativecommons.org/licenses/by/4.0/).
Share and Cite
Wu, Y.; Gao, X.; Zhang, D.; Gao, P. Detection of Q235 Mild Steel Resistance Spot Welding Defects Based on EMD-SVM. Metals 2025, 15, 504. https://doi.org/10.3390/met15050504
Wu Y, Gao X, Zhang D, Gao P. Detection of Q235 Mild Steel Resistance Spot Welding Defects Based on EMD-SVM. Metals. 2025; 15(5):504. https://doi.org/10.3390/met15050504
Chicago/Turabian StyleWu, Yuxin, Xiangdong Gao, Dongfang Zhang, and Perry Gao. 2025. "Detection of Q235 Mild Steel Resistance Spot Welding Defects Based on EMD-SVM" Metals 15, no. 5: 504. https://doi.org/10.3390/met15050504
APA StyleWu, Y., Gao, X., Zhang, D., & Gao, P. (2025). Detection of Q235 Mild Steel Resistance Spot Welding Defects Based on EMD-SVM. Metals, 15(5), 504. https://doi.org/10.3390/met15050504