3.1. Microstructure Analysis
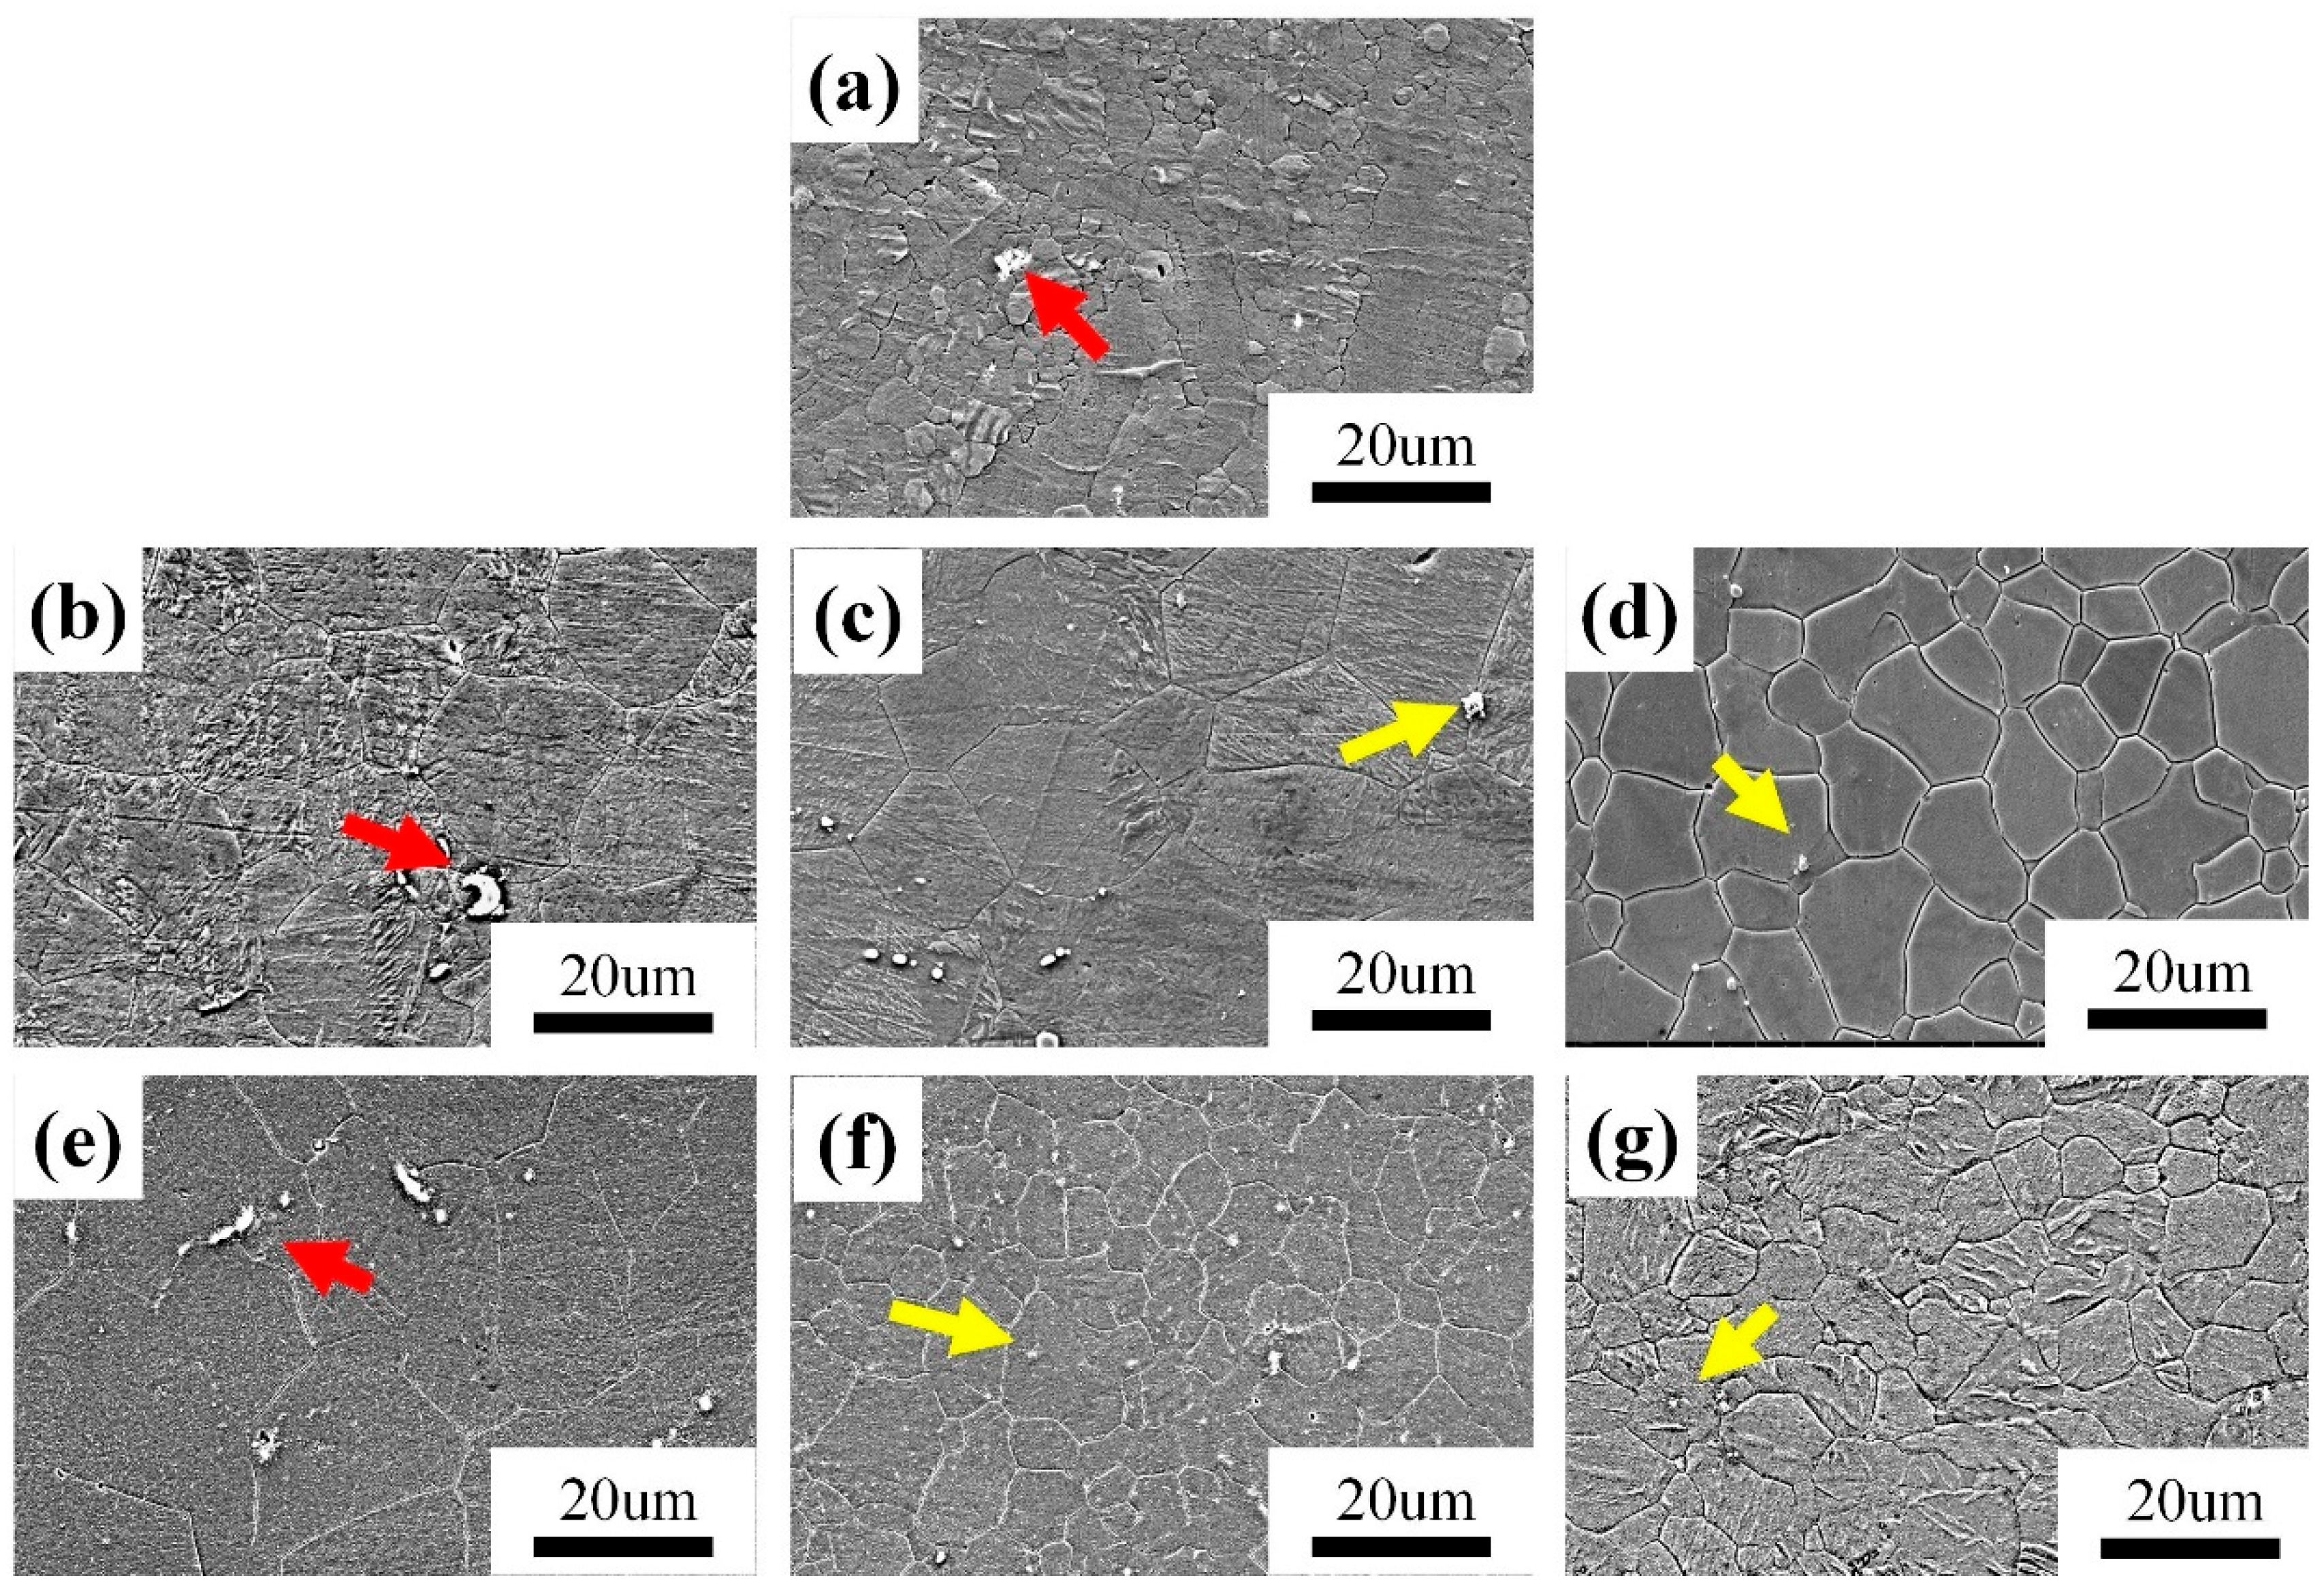
The SEM of the as-extruded and ECAP-ed 0.6 wt.% MgO/Mg–3Zn–0.2Ca composite is shown in
Figure 2, and the specific grain size is shown in
Table 1. The average grain size and standard deviation were obtained through EBSD analysis.
Figure 2a shows that the grain-size distribution of the as-extruded specimen is not homogenized, presenting the distribution of large grains around small grains. In the ECAP-ed specimens, the distribution of the microstructure was more uniform, and the grains evolved into equiaxial crystals. The significant changes in microstructure can be explained by the following aspects. The processing temperature is kept at 300 °C to reach the recrystallization temperature of Mg alloy during the ECAP process and the deformed grains recover and recrystallize, resulting in grain refinement. Nevertheless, the specimens are also subjected to strain along with the recrystallization process, such that the mechanical shearing effect breaks coarse grains into refined ones. Mechanical actions, such as shear stress concentration during extrusion, induce lattice twisting at grain boundaries, leading to the formation of high-angle grain boundaries and grain refinement. Dislocation accumulation and cross-slip contribute to a banded structure. As stress increases, sub-grain boundaries form and migrate, further promoting the development of high-angle grain boundaries and finer grains. Magnesium alloys have a low stacking fault energy (SFE), making it difficult for dislocations on slip planes to rearrange through climb and cross-slip. As a result, during hot deformation, the dynamic recovery process in magnesium alloys is relatively slow, causing local dislocation density to increase with strain, which consequently promotes the initiation of dynamic recrystallization [
23,
24].
There are a large number of coarse grains in the extruded specimen, while the coarse grains are basically eliminated in the ECAP specimens. The specimens in the same pass of ECAP using different die channel angles exhibited different grain sizes. The specimens after ECAP when φ
1 = 90° exhibited finer grains than the specimens after ECAP when φ
2 = 120°, indicating that a larger amount of deformation occurred in the ECAP specimens at 90°; the higher strain led to more deformation energy being stored during ECAP, which promotes the process of recrystallization. Agwa et al. [
25], using finite element (FE) simulation analysis, reported that enormous equivalent plastic strains occurred in the right-angle channel rather than in the obtuse-angle channel, which was consistent with the current experimental results. The grain size cannot invariably be decreased with an increased number of passes; when the number of passes reaches four, the grain size is in a stable state, and the dynamic recrystallization process achieves a balance. A larger strain in the ECAP-ed specimens results in a higher nucleation rate and finer grains. During the processing, a highly localized lattice misorientation around the particles can be caused in the deformation zone of the nano-Mgo particles, which can be used as an effective nucleation site for the newly recrystallized grains, achieving particle-stimulated nucleation (PSN) and MgO particles; a heterogeneous nucleating agent has a fixed effect on dislocations and grain boundaries during dynamic recrystallization, so adding MgO nanoparticles is beneficial to the grain refinement.
The flocculent second phase (as indicated by the red arrow) appears in the grain boundary, and the spherical second phase (as indicated by the yellow arrow) appears inside the grains, as shown in
Figure 2.
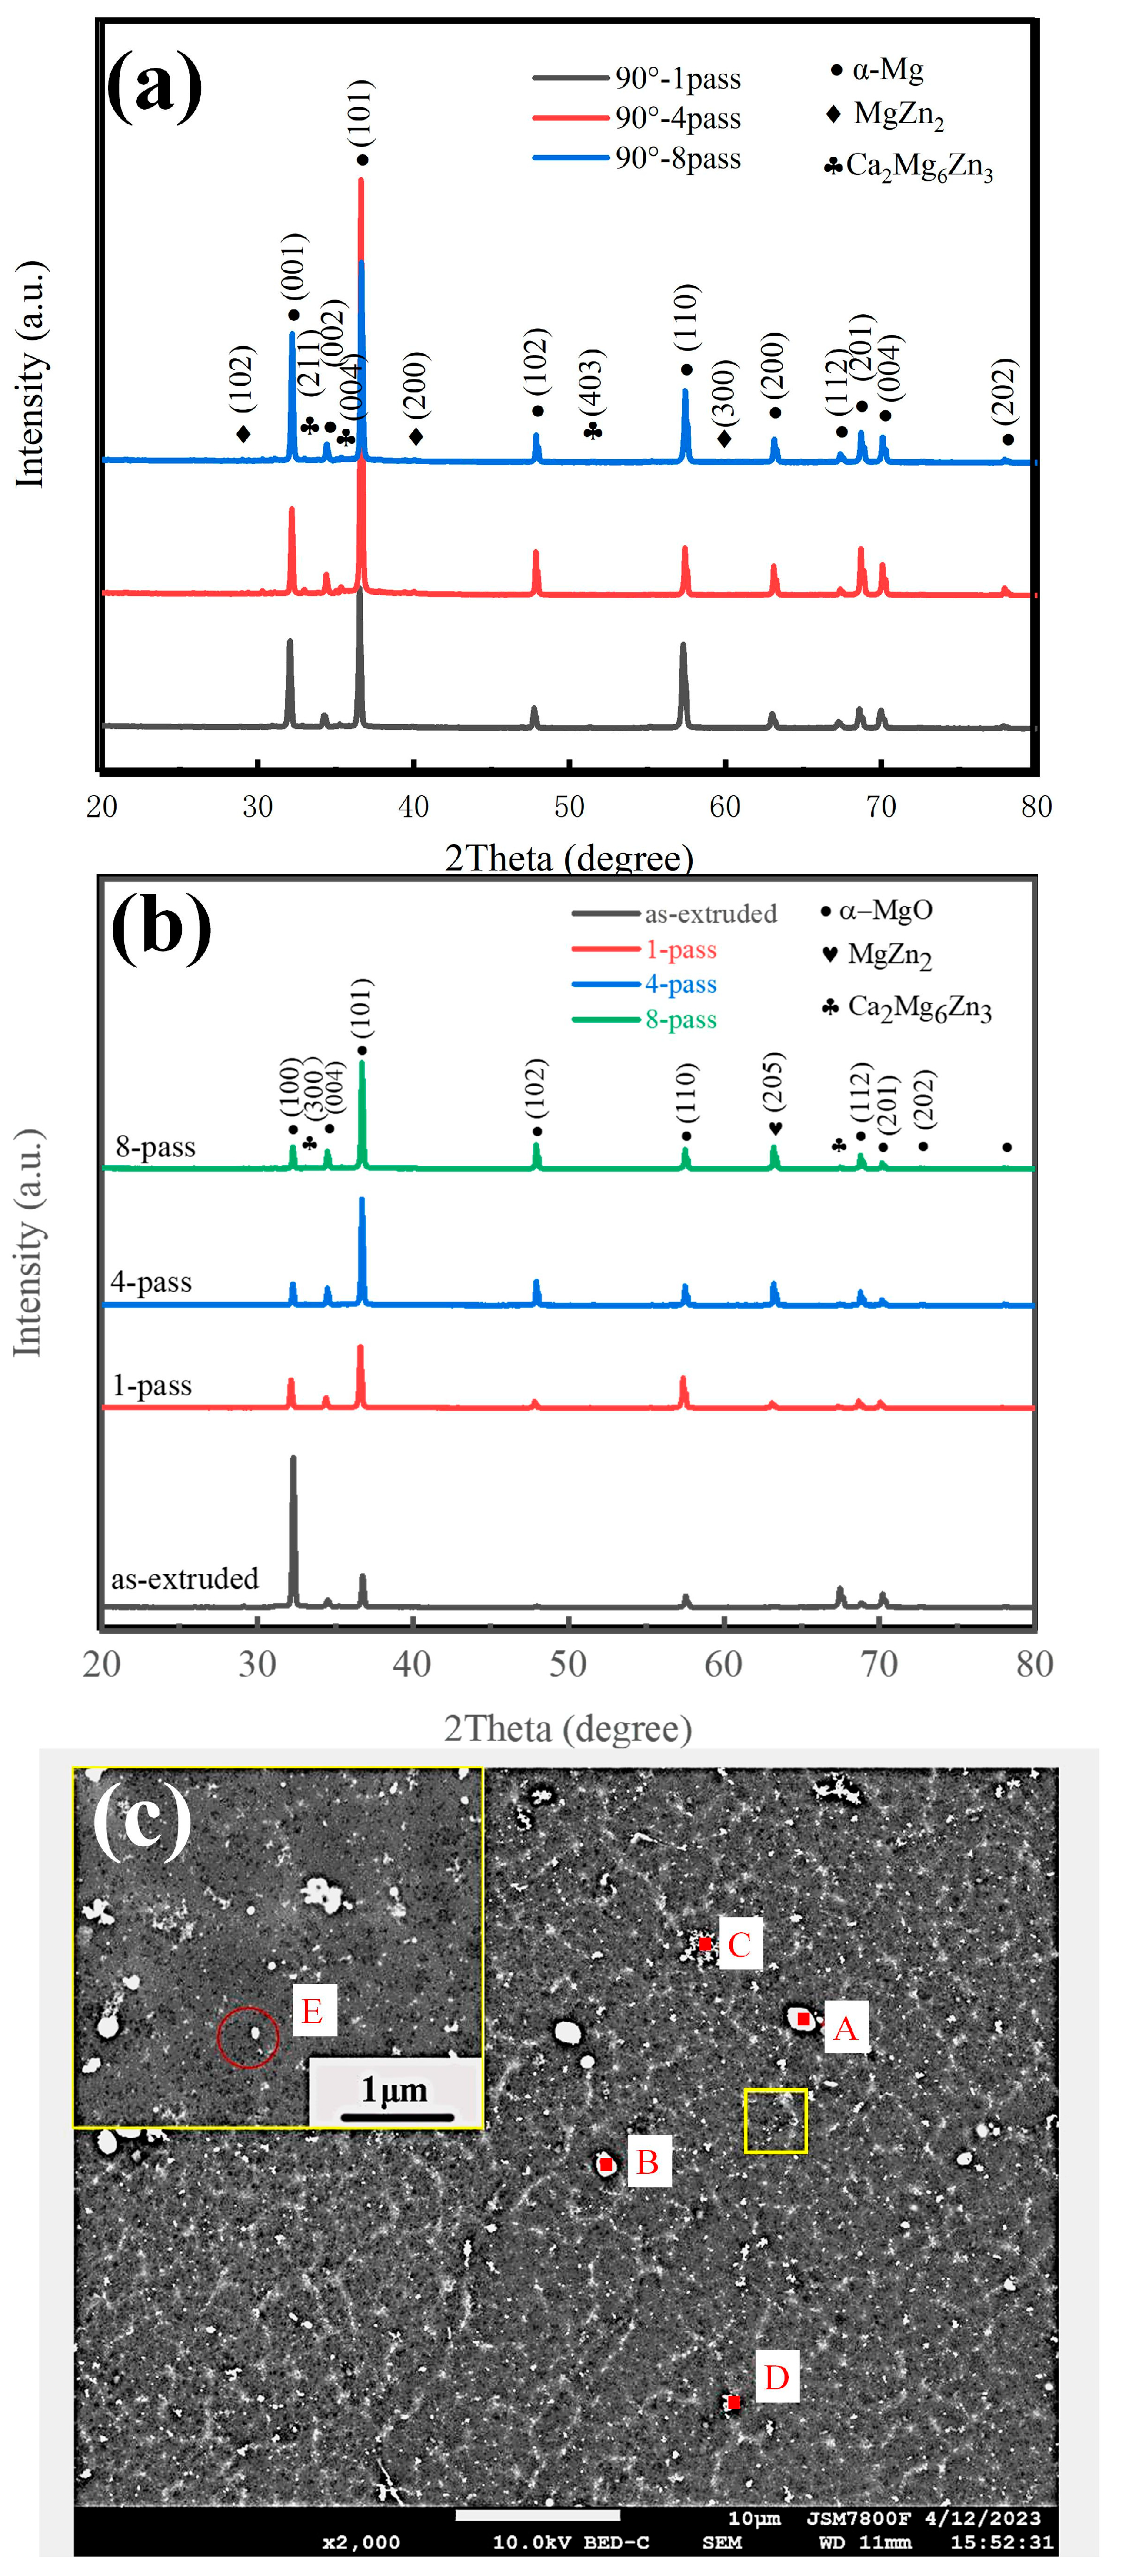
Table 2 shows the EDS result of the four-pass ECAP-ed specimen marked in
Figure 3c. Through energy spectrum analysis and the XRD phase analysis results, it can be seen that the atomic ratio Mg:Ca:Zn is close to 6:2:3; therefore, it can be considered that the second phase at the grain boundary (A and B) are Ca
2Mg
6Zn
3 molecules. Similarly, the flocculent second phases (C and D) are marked as MgZn compounds. The white particles at position E are identified as MgO, and it can be seen that the atomic percentage of Mg and O elements in
Table 2 is not 1, because the size of the MgO particles is so small that the Mg matrix will be scanned in point scanning, resulting in a higher content of the Mg element.
The banded and spherical second phases are larger and haphazardly distributed in the as-extruded specimen, which is related to the precipitation behavior during the casting process. After one-pass ECAP-ing, the distribution had a significant improvement; the refining effect of ECAP on the second phase was noticeable, and the refining effect was continuously improving, accompanying the increase in number of passes. The dimensions of the second phase, like the grain size, came into balance after four passes; therefore, it could be inferred that the sample after four-pass ECAP treatments could obtain better performance, and the increase in number of ECAP passes had little effect on its improvement. MgO particles exhibited pinning effects on dislocations and grain boundary movement during dynamic recrystallization, which also confirmed that MgO nanoparticles were an effective heterogeneous nucleating agent.
The as-extruded and ECAP-ed specimen XRD patterns are presented in
Figure 3a,b. The as-extruded and ECAP-ed specimens show the same phase peaks: α-Mg matrix, MgZn
2, and Ca
2Mg
6Zn
3, indicating that the ECAP process can change the distribution of second phases but does not initiate a phase transition during ECAP [
26]. MgO is not detected in the XRD results due to the low content, i.e., only 0.6 wt.%, which is below the measurable range of the instrument. The orientation of the second phase is also changed, such that the (004) orientation peak intensity of Ca
2Mg
6Zn
3 increases, but the (643) orientation peak intensity decreases as the number of ECAP passes increases, as shown in
Figure 3a. The intensity of (100) and (201) cylindrical orientation peaks of α-Mg decreases, while the intensity of (101), (102), and (103) peaks of basal and conical orientation increases, which will have a certain impact on the mechanical properties of the material, since greater basal slip and pyramidal slip can effectively improve the plasticity of the material. At φ
1 = 90°, the (001) and (101) peak intensities of α-Mg in the composites are significantly improved, and new orientations of MgZn
2 and Ca
2Mg
6Zn
3 phases appear. This is because changing the channel angle generates higher strain, which facilitates the dynamic precipitation of the second phase.
Figure 4 shows the fraction content of grain type of the specimens. The as-extruded specimen exhibits a typical deformed structure; the fraction of recrystallized grain is just 7.4%, and most of the grains are substructure and deformed grains; the scale of substructure and deformed grains is close to 1:1, while in the ECAP-ed specimen, after eight passes at 120°, the recrystallized grains increase to 60.3%, and the fraction of deformed grains is 5.0%, which indicates an improvement in recrystallization. However, the grains have completed recrystallization in the ECAP-ed specimen after eight passes at 90°, almost no deformed grains are left, and the recrystallized grain is up to 71.5%. The main difference in eight-pass ECAP-ed specimens at different angles lies in the proportion of recrystallized grains and subgrains. In addition, the proportion of recrystallized grains in samples subjected to ECAP at 90° is higher because the ECAP-ed specimen at 90° obtains greater heterogeneity of the distribution of the stored energy in neighboring crystallites, which acts as a driving force for recrystallization during the recrystallization process, promoting its recrystallization behavior.
Figure 5 presents the pole figures of the as-extruded and eight-pass ECAP-ed 0.6 wt.% MgO composite. The fabric texture {0001} <1010> in the as-extruded specimen indicates that the {0001} basal plane and <10–10> direction of most grains are parallel to the extrusion direction (ED), as shown in
Figure 5a. The strong basal plane orientation of the coarse grains explains that the pole density of the extruded state (12.49) multiple of random distribution (MRD) is higher than that of the ECAP-ed specimens, indicating that the basal texture decreases after ECAP. The prismatic surface slip is the major deformation mechanism due to the equivalent axisymmetric compressive stress of extrusion and the axial tensile stress, while the {0001} basis plane is parallel to the c-axis direction, and {10–12} tensile twinning occurs when the plane is compressed or stretched along the c-axis direction. The research shows the {0001} basal texture is decomposed into {10–10} and {2-1–10} textures with the increase in the extent of compressive deformation, resulting in texture softening, which can decrease the yield strength [
27].
Figure 5c presents the pole diagram of the composite after eight-pass ECAP. After the specimen is processed by eight-pass ECAP at 90°, it is subjected to strong shear force from passing through the included angle, and the basal plane slip system is activated to form a {11–20} <0001> texture; that is, the (0001) basal plane has a vertical oblique texture in the theoretical shear plane. The strong point in the pole figure is rotated about 70° counterclockwise around the ED direction, deviating from the orientation position of the basal plane and significantly weakening the basal plane texture. It is known that the rigid rotation of the lattice is 45° during the ECAP deformation at φ
1 = 90°; however, the rotation of the lattice after eight passes is significantly larger than this angle, indicating the rotation of the lattice is not limited to the rotation of the crystal. In the early stage of deformation, strong shear deformation occurred during the ECAP process, and the coarse grains were broken to form cell blocks which rotated to match the strain between adjacent cell blocks to form a new texture. The grains had been refined, and the texture evolution in the grains was mainly formed by the rotation of the whole grains in the later stage of deformation, thereby gradually forming the ECAP shear texture.
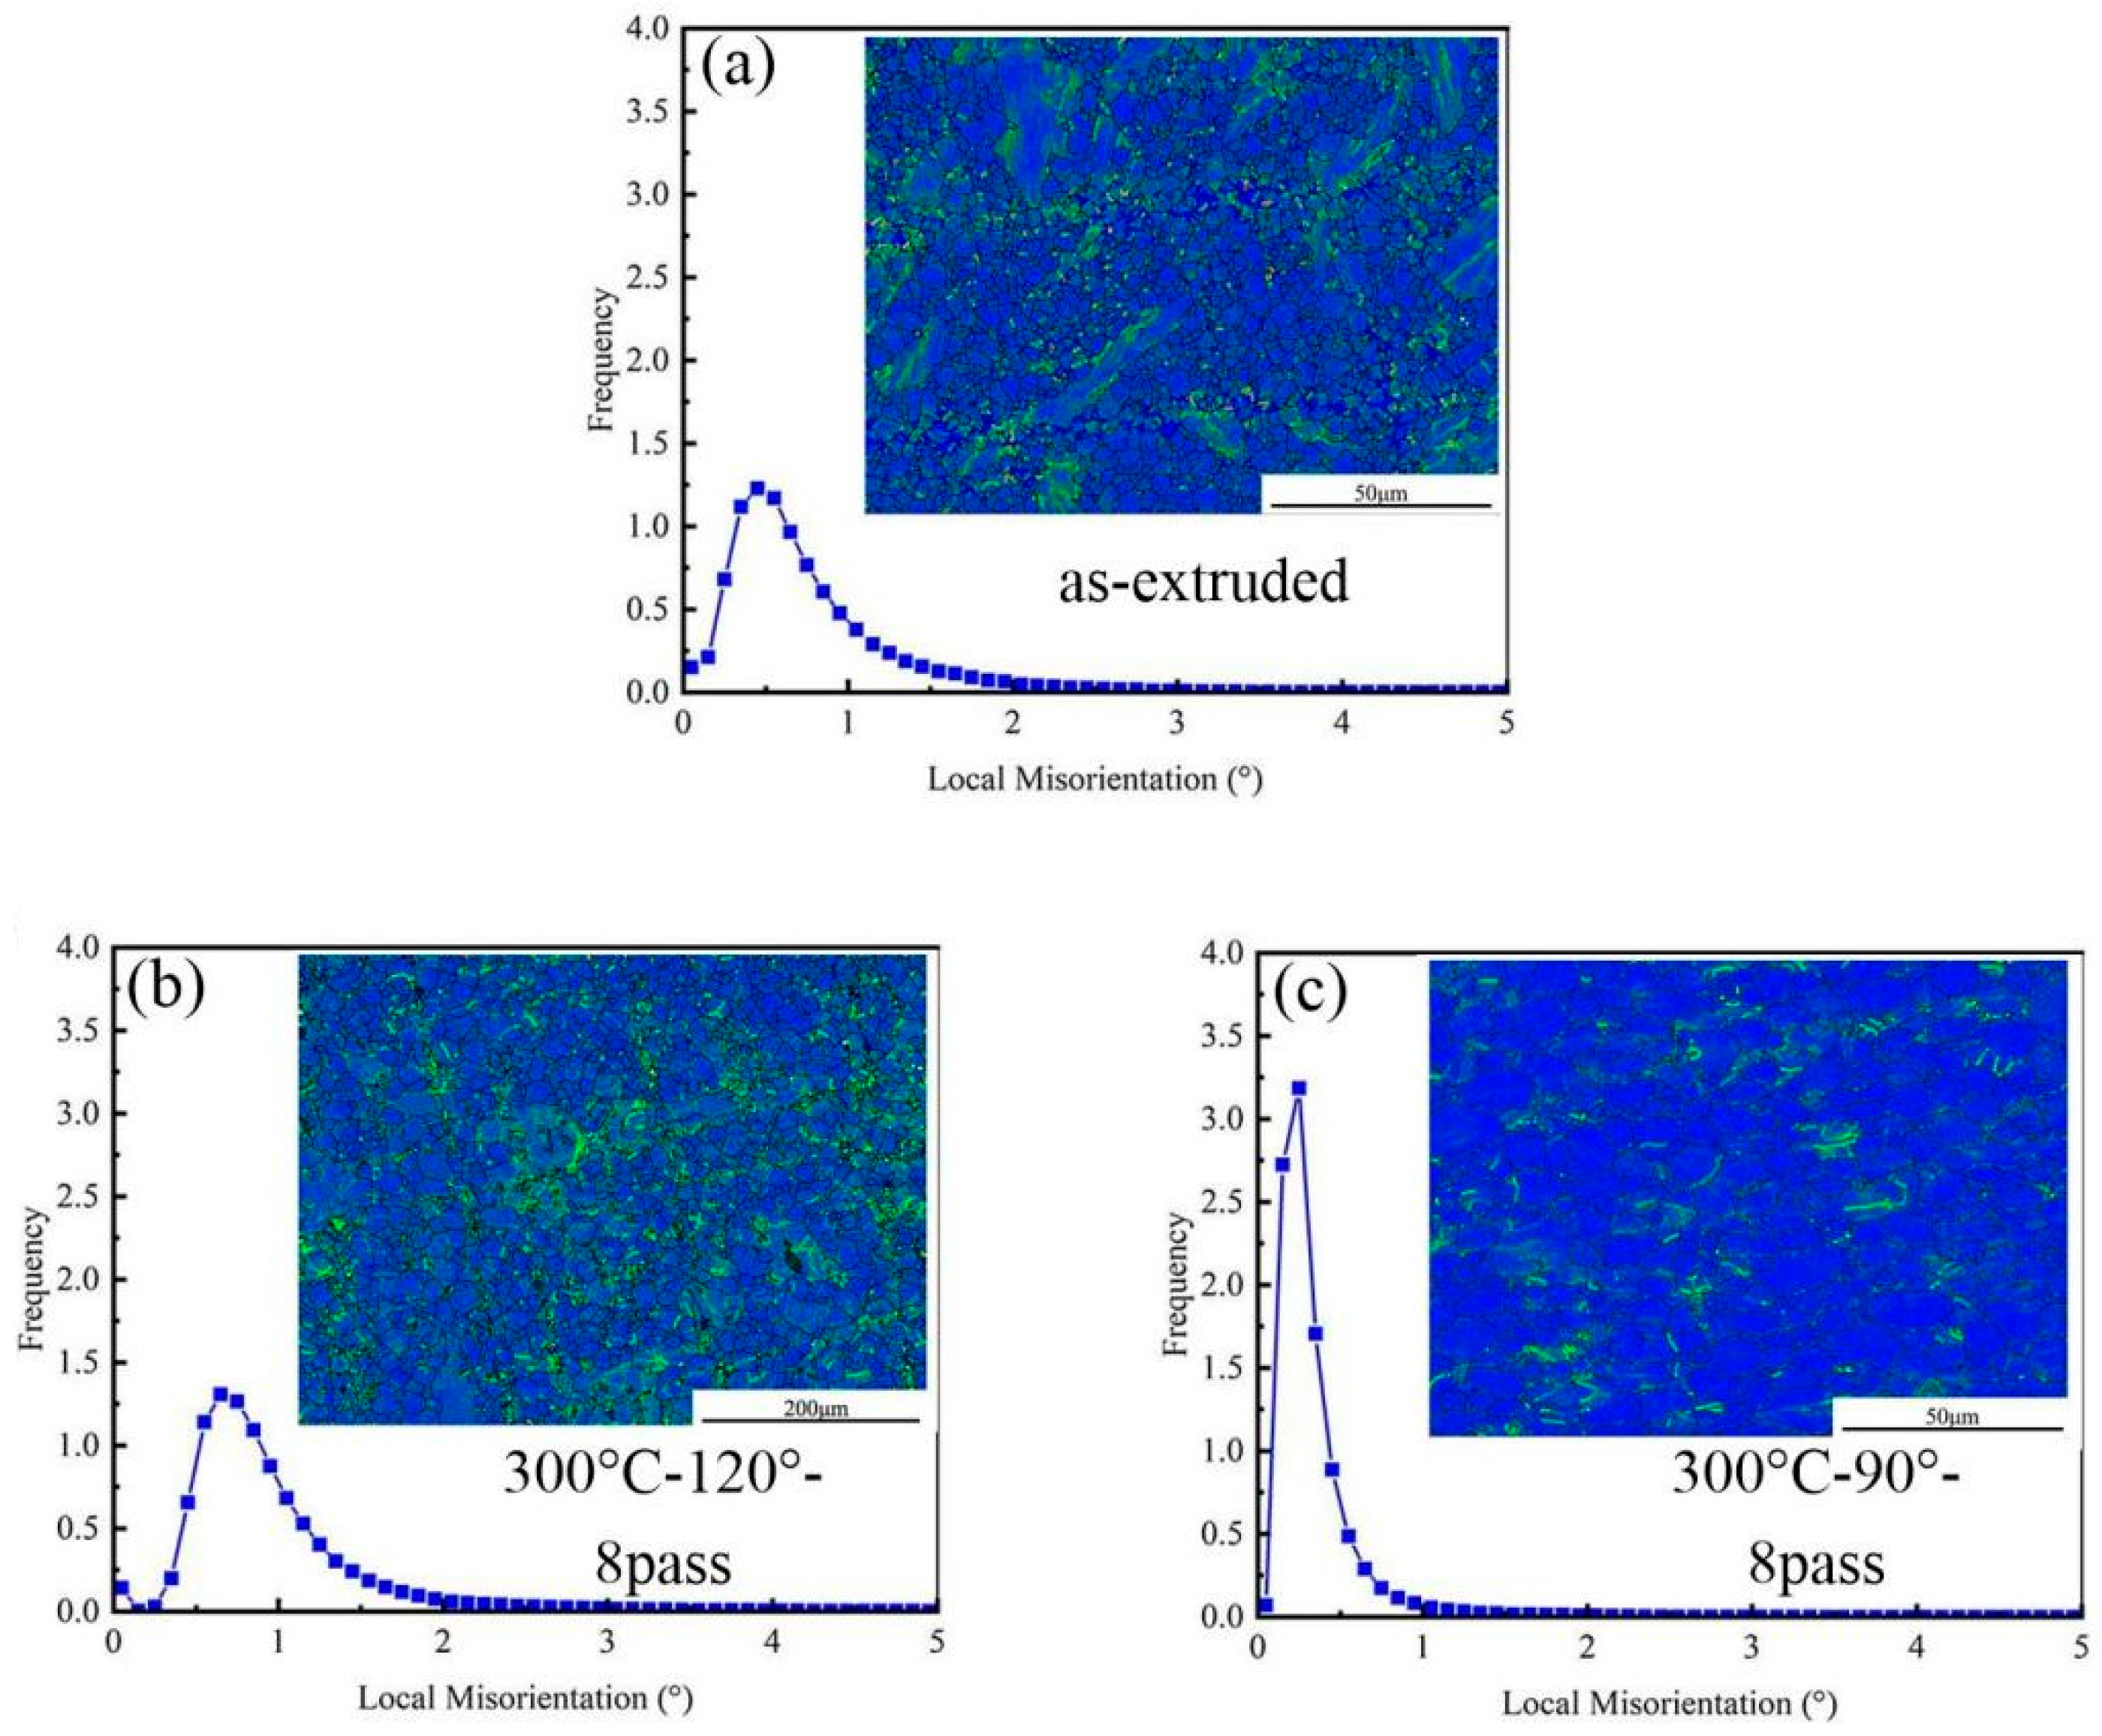
Figure 6 presents the Kernel average misorientation (KAM) and local misorientation of the as-extruded and ECAP-ed specimens. The KAM method is used for Geometrically Necessary Dislocation (GND) of composite materials under different processes, using Equation (2) to calculate the GND density in different regions; the relation between KAM and GND is shown in Equation (2) [
28].
where
presents the
GND density,
presents the weighted average 4 of the local misorientation,
μ presents the unit length of 75 nm,
b presents the Burgers vector and
B = 2.6 × 10¹⁵ m
−2. The
in as-extruded ECAP-ed specimens of eight passes at 120°and 90° are 0.071, 0.097, and 0.034, respectively, and the GND in as-extruded eight-pass ECAP-ed specimens at 120° and 90° is 2.522 × 10
14 m
−2, 1.846 × 10
14 m
−2, and 8.840 × 10
13 m
−2 [
20].
In
Figure 6, green represents the local misorientation, which is caused by lattice distortion resulting from large deformations. In
Figure 6a, the grain structure shows a higher content of green lines, which is due to the large strain experienced by the alloy during the hot extrusion process, leading to dislocation accumulation. The GND density of the eight-pass ECAP specimen at 120° in
Figure 6b is high, indicating that after ECAP processing, the matrix generates a large number of dislocations. Under unidirectional compressive stress, dislocations form dislocation pile-ups during their movement, leading to higher stress concentrations around the matrix and precipitate particles. The activation of new dislocations increases the stress on the second-phase particles, ultimately causing microcracks due to the fracture of the second-phase particles and matrix. In
Figure 6c, the grain structure is predominantly covered in blue, with less green, indicating that reducing the die angle results in a decrease in the GND density of the composite material. This is because, during ECAP deformation, recrystallization occurs within the 0.6 wt.% MgO/Mg–3Zn–0.2Ca composite material. The recrystallization process leads to a reduction in dislocation density, which can absorb a large number of dislocations and hinder strain hardening during deformation. This is the main reason for the observed strain softening and improved formability. As the die angle decreases, the recrystallized grain size reduces, and most of the dislocations generated during alloy deformation accumulate at the grain boundaries. Due to the presence of non-equilibrium grain boundaries, dislocations accumulated at the grain boundaries are more easily absorbed, triggering dynamic recovery. As a result, the GND density decreases, providing the magnesium alloy with higher stress and strain-hardening rates.
3.2. Mechanical Property
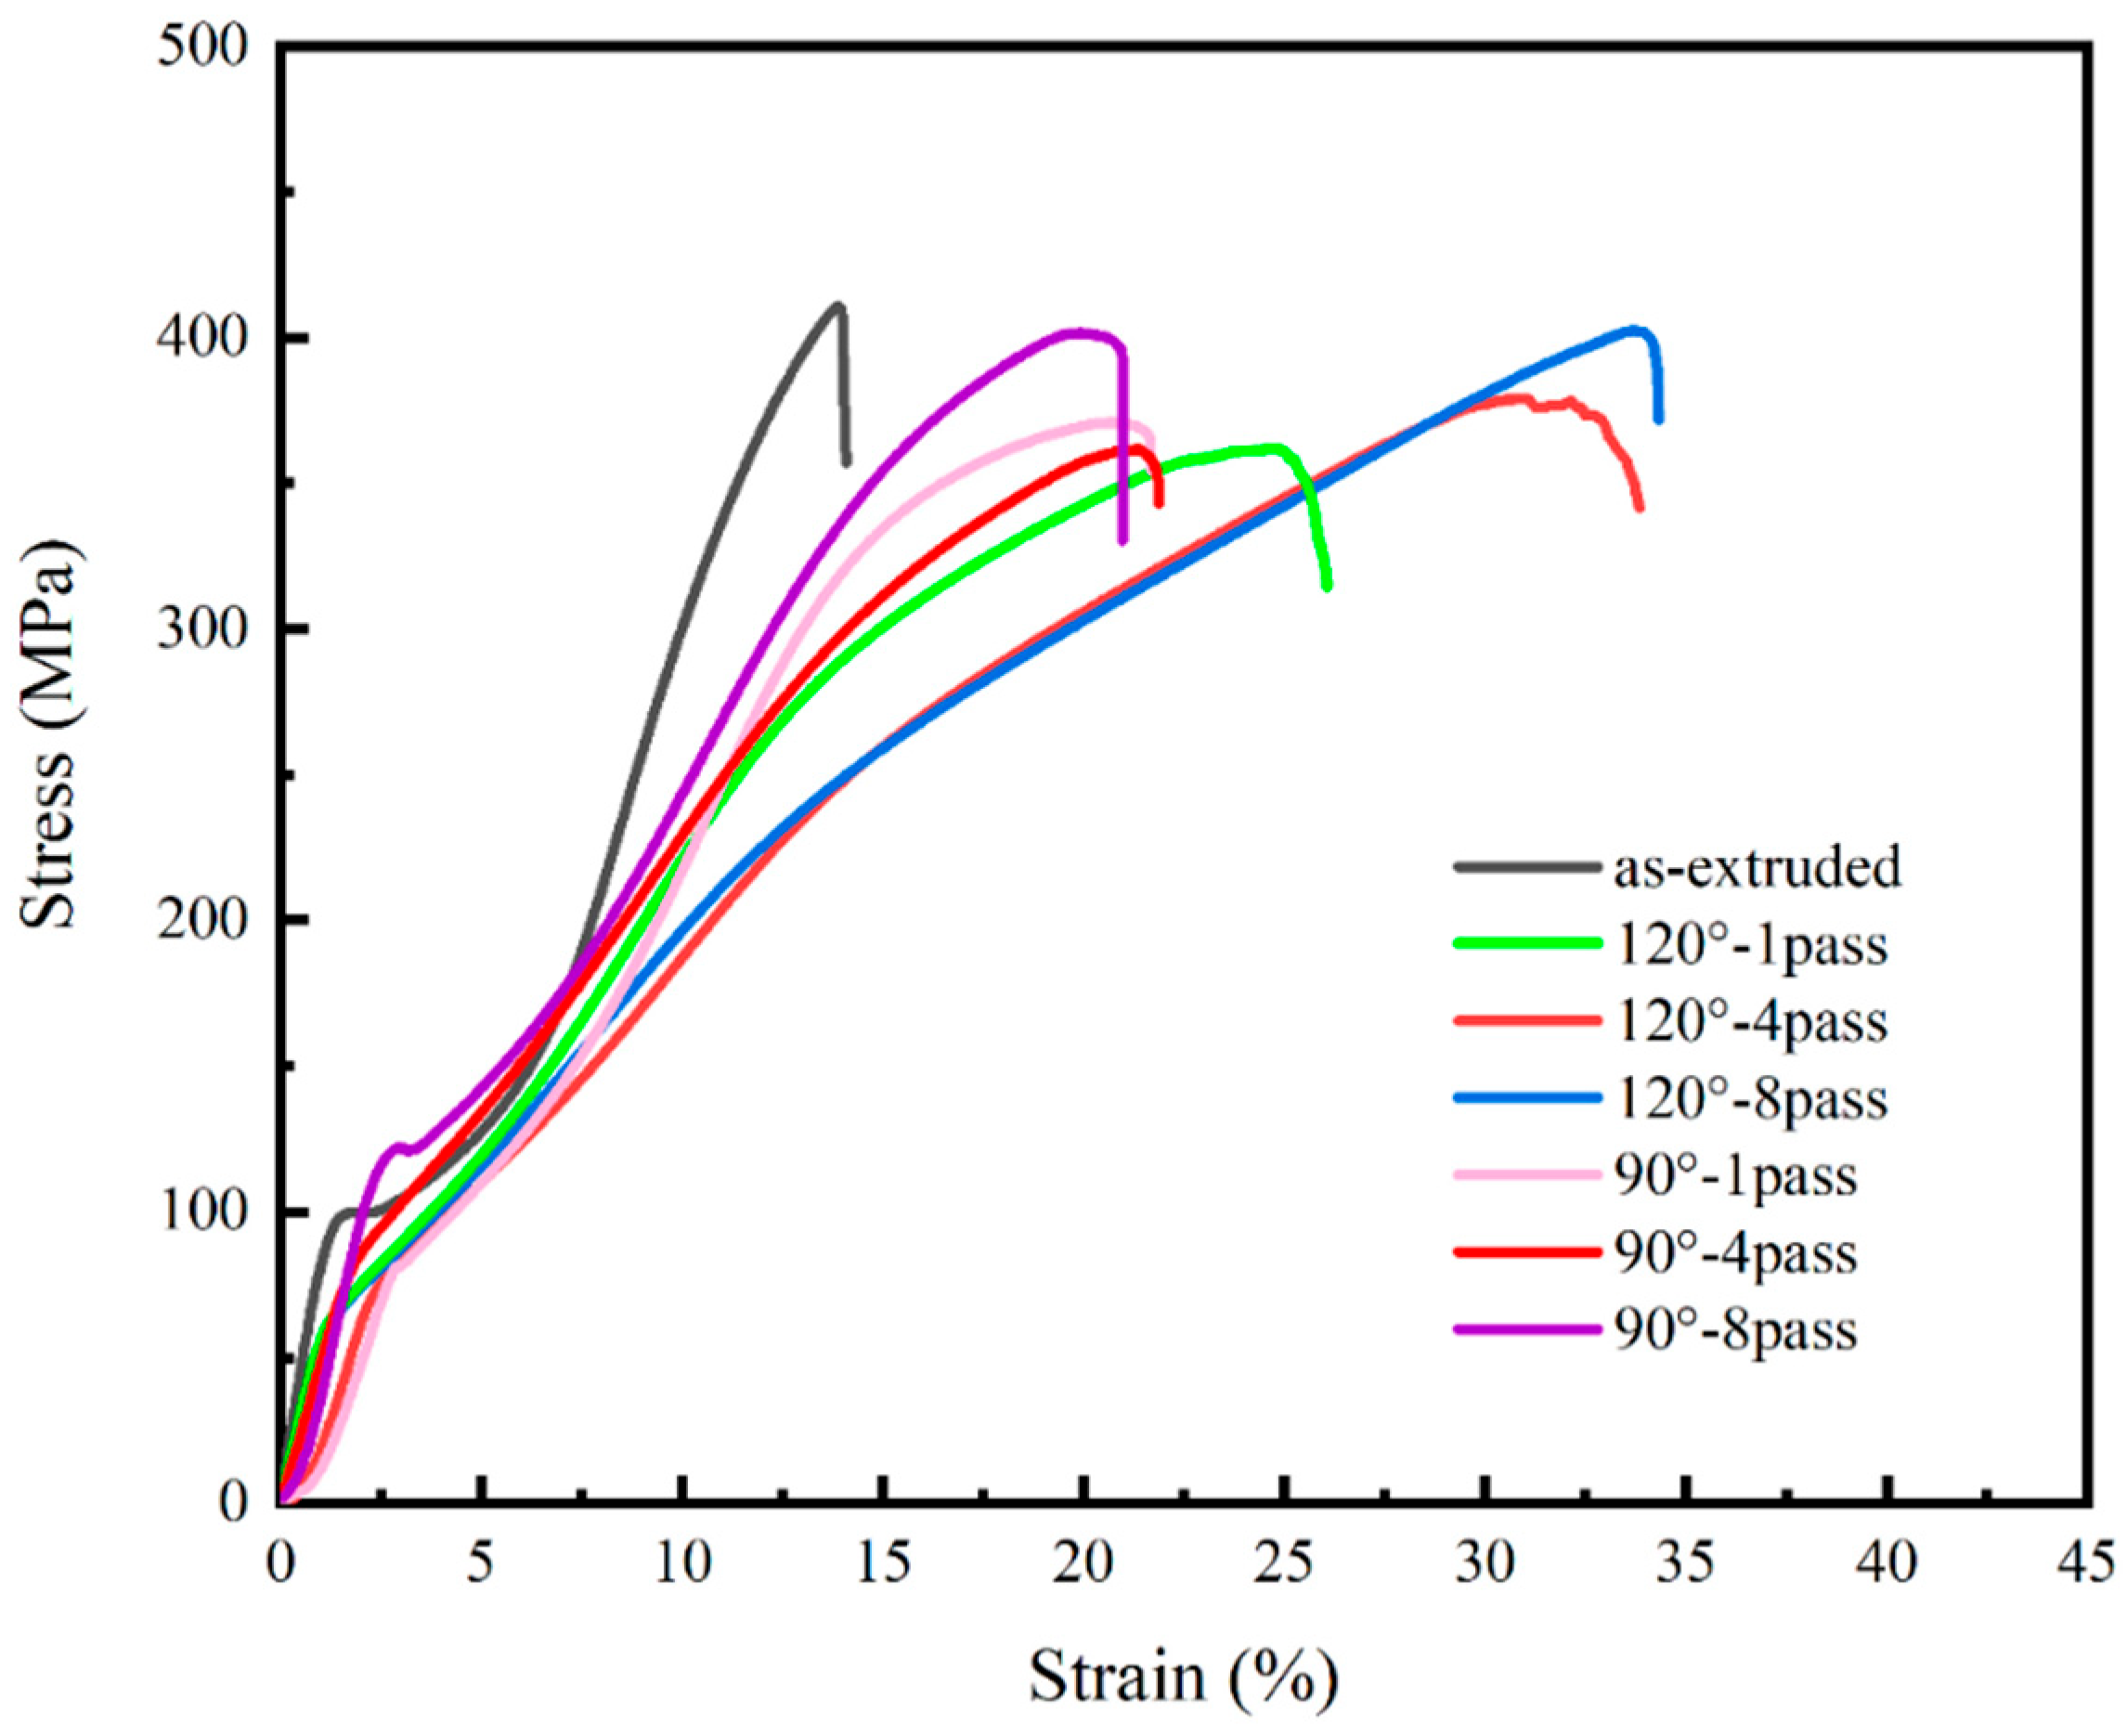
Since the Mg–Zn–Ca alloy under study is primarily intended for biomedical composites, it is likely to experience mainly compressive effects in the human body. Therefore, compression testing can reflect its mechanical behavior in the application environment. The compressive stress–strain curve of the as-extruded and ECAP-ed composite is shown in
Figure 7, and the specific values are shown in
Table 3. The ability to resist plastic deformation of ECAP-ed specimens was weaker than the as-extruded specimen; the one-pass ECAP-ed specimens at 90° and 120° had the lower ultimate compressive strength (UCS), while gradually rising with the increases in number of passes; the eight-pass ECAP-ed specimens achieved the approximate UCS with the as-extruded specimen. Recrystallization was an important factor in the decrease in UCS in the initial ECAP process. The specimen was subjected to significant deformation during the extrusion process, which caused the work-hardening effect; the formation of textures was the best proof, and the max pole density was 11.29 MRD in the as-extruded specimen. Higher temperatures promoted their recrystallization process, which reduced the orientation trend of the grains, leading to the evolution of their texture and reducing the work hardening when the ECAP process was conducted. It is worth noting that, although the ECAP-ed specimens obtain a similar UCS with the as-extruded specimen, this does not mean that both have the same performance, which mainly depends on their internal structural differences. In the as-extruded specimen, coarse grains are generally considered the source of stress concentration during working, which can cause cracks to initiate at these locations, finally leading to failure. In the ECAP-ed specimens, the stress concentration effect may not be obvious, so when the work hardening is lower than for the as-extruded specimen, the UCS still reaches a similar level because of the refinement and uniform distribution of grains; the performance is considered to be superior to the as-extruded specimen, so the ECAP process is expected to improve its performance without affecting its overall strength. The UCS of the one-pass and four-pass ECAP-ed specimens are at the same level, while the UCS increases after the eight-pass ECAP. Therefore, it can be inferred that dynamic recrystallization is in a balanced state when the number of passes is below four. However, as the number of passes increase, the recrystallization effect is suppressed because the grains are already very small, while the effect of work hardening is enhanced when the deformation rate remains unchanged. In polycrystals with small grain sizes, the non-uniform deformation of adjacent crystallites is not constrained, resulting in variations in stored energy. This variation maintains the driving force for recrystallization, which plays a key role in influencing the work-hardening effect.
There is an interesting phenomenon in
Figure 7, which is that the yield strength of the alloy processed by high number of ECAP passes has no obvious change, although the grain size is refined. This phenomenon can be explained by the following aspects. After ECAP processing, there are still large grains in the material structure, which is not the complete grain refinement in the strict sense, and the phenomenon of uneven grain size appears. The preferred orientation of texture affects the mechanical properties of magnesium alloys [
29]. Studies have shown that the elongation of the extruded magnesium alloy is greatly improved after equal channel angular extrusion, but the strength has not changed significantly, which is consistent with the findings of [
17]. The compressive yield strength (CYS) has different performances at 90° and 120° after eight-pass ECAP; in the ECAP-ed specimens at 90°, the CYS increases with the increase in number of passes because of the effect of grain refinement, verified by the Hall–Petch effect. But it has the opposite trend in the ECAP-ed specimen at 120°; overall, it is in a relatively balanced state with a small downward trend, which is related to the texture softening effect; in the ECAP-ed specimen at 120°, the specimen is prone to form a basal fiber texture during the deformation processes, the {0001} basal plane is parallel to the c-axis direction, and {10–12} tensile twinning can occur when compressing or stretching along the c-axis direction. The {0001} basal texture is decomposed into {1010} and {2-1–10} textures with the increase in the degree of compressive deformation, resulting in texture softening, then a reduction in the CYS.
In the ECAP-ed specimens at 90° and 120°, the compressive strain of fracture (CSF) shows a great improvement, reaching 1.5 times and 2.4 times that of the as-extruded specimen, respectively. The improvement of CSF can be attributed to the homogenization of microstructure, grains, and second phases; in the as-extruded specimen, there exist many coarse grains which will act as areas of stress concentration. Meanwhile, the larger-sized phases can also be harmful to its performance; cracks can initiate in areas of stress concentration and spread along coarse grains, leading to a decrease in plasticity. The ECAP processing can refine the grains and phases and decrease the areas which can cause stress concentration. Meanwhile, the inhibiting effect of grain boundaries on crack propagation should not be underestimated. Cracks normally spread along the coarse grains and large phases; the ECAP-ed specimen has more grain boundaries and finer second phases, so the plasticity can be greatly improved by suppressing the propagation of cracks. The texture softening during ECAP can improve the anisotropy of the specimens and CSF. The value of CSF of the eight-pass ECAP-ed specimens at 120° is the highest; the specimens have the proximate grain size with it at 90° but exhibit better plasticity.
As compressive deformation increases, the {0001} basal texture decomposes into {10–10} and {2-1–10} textures, leading to texture softening and reduced yield strength. The weakening effect of the extrusion-induced texture surpasses the strengthening effect of grain refinement, while grain refinement activates more slip systems, enhancing plastic deformation. During early ECAP processing, UCS decreases due to dislocations and defects introduced in the composite. As ECAP continues, dislocation accumulation reaches a critical level, hindering movement and making deformation more difficult. With more ECAP passes, the second-phase size decreases, reducing crack initiation and improving strength. A smaller channel angle decreases plasticity due to increased strain and work hardening. The high yield strength results from grain refinement, second-phase and texture strengthening. According to the Hall–Petch relationship, smaller grain size increases yield strength, while the Orowan mechanism suggests second-phase dispersion contributes to strength. In magnesium alloys, basal slip dominates at room temperature [
30]. A strong basal texture inhibits basal slip activation, raising yield strength. Additionally, MgO and other second-phase particles at grain boundaries exert a pinning effect, effectively hindering dislocation motion and grain boundary sliding, thereby enhancing the composite’s strength.
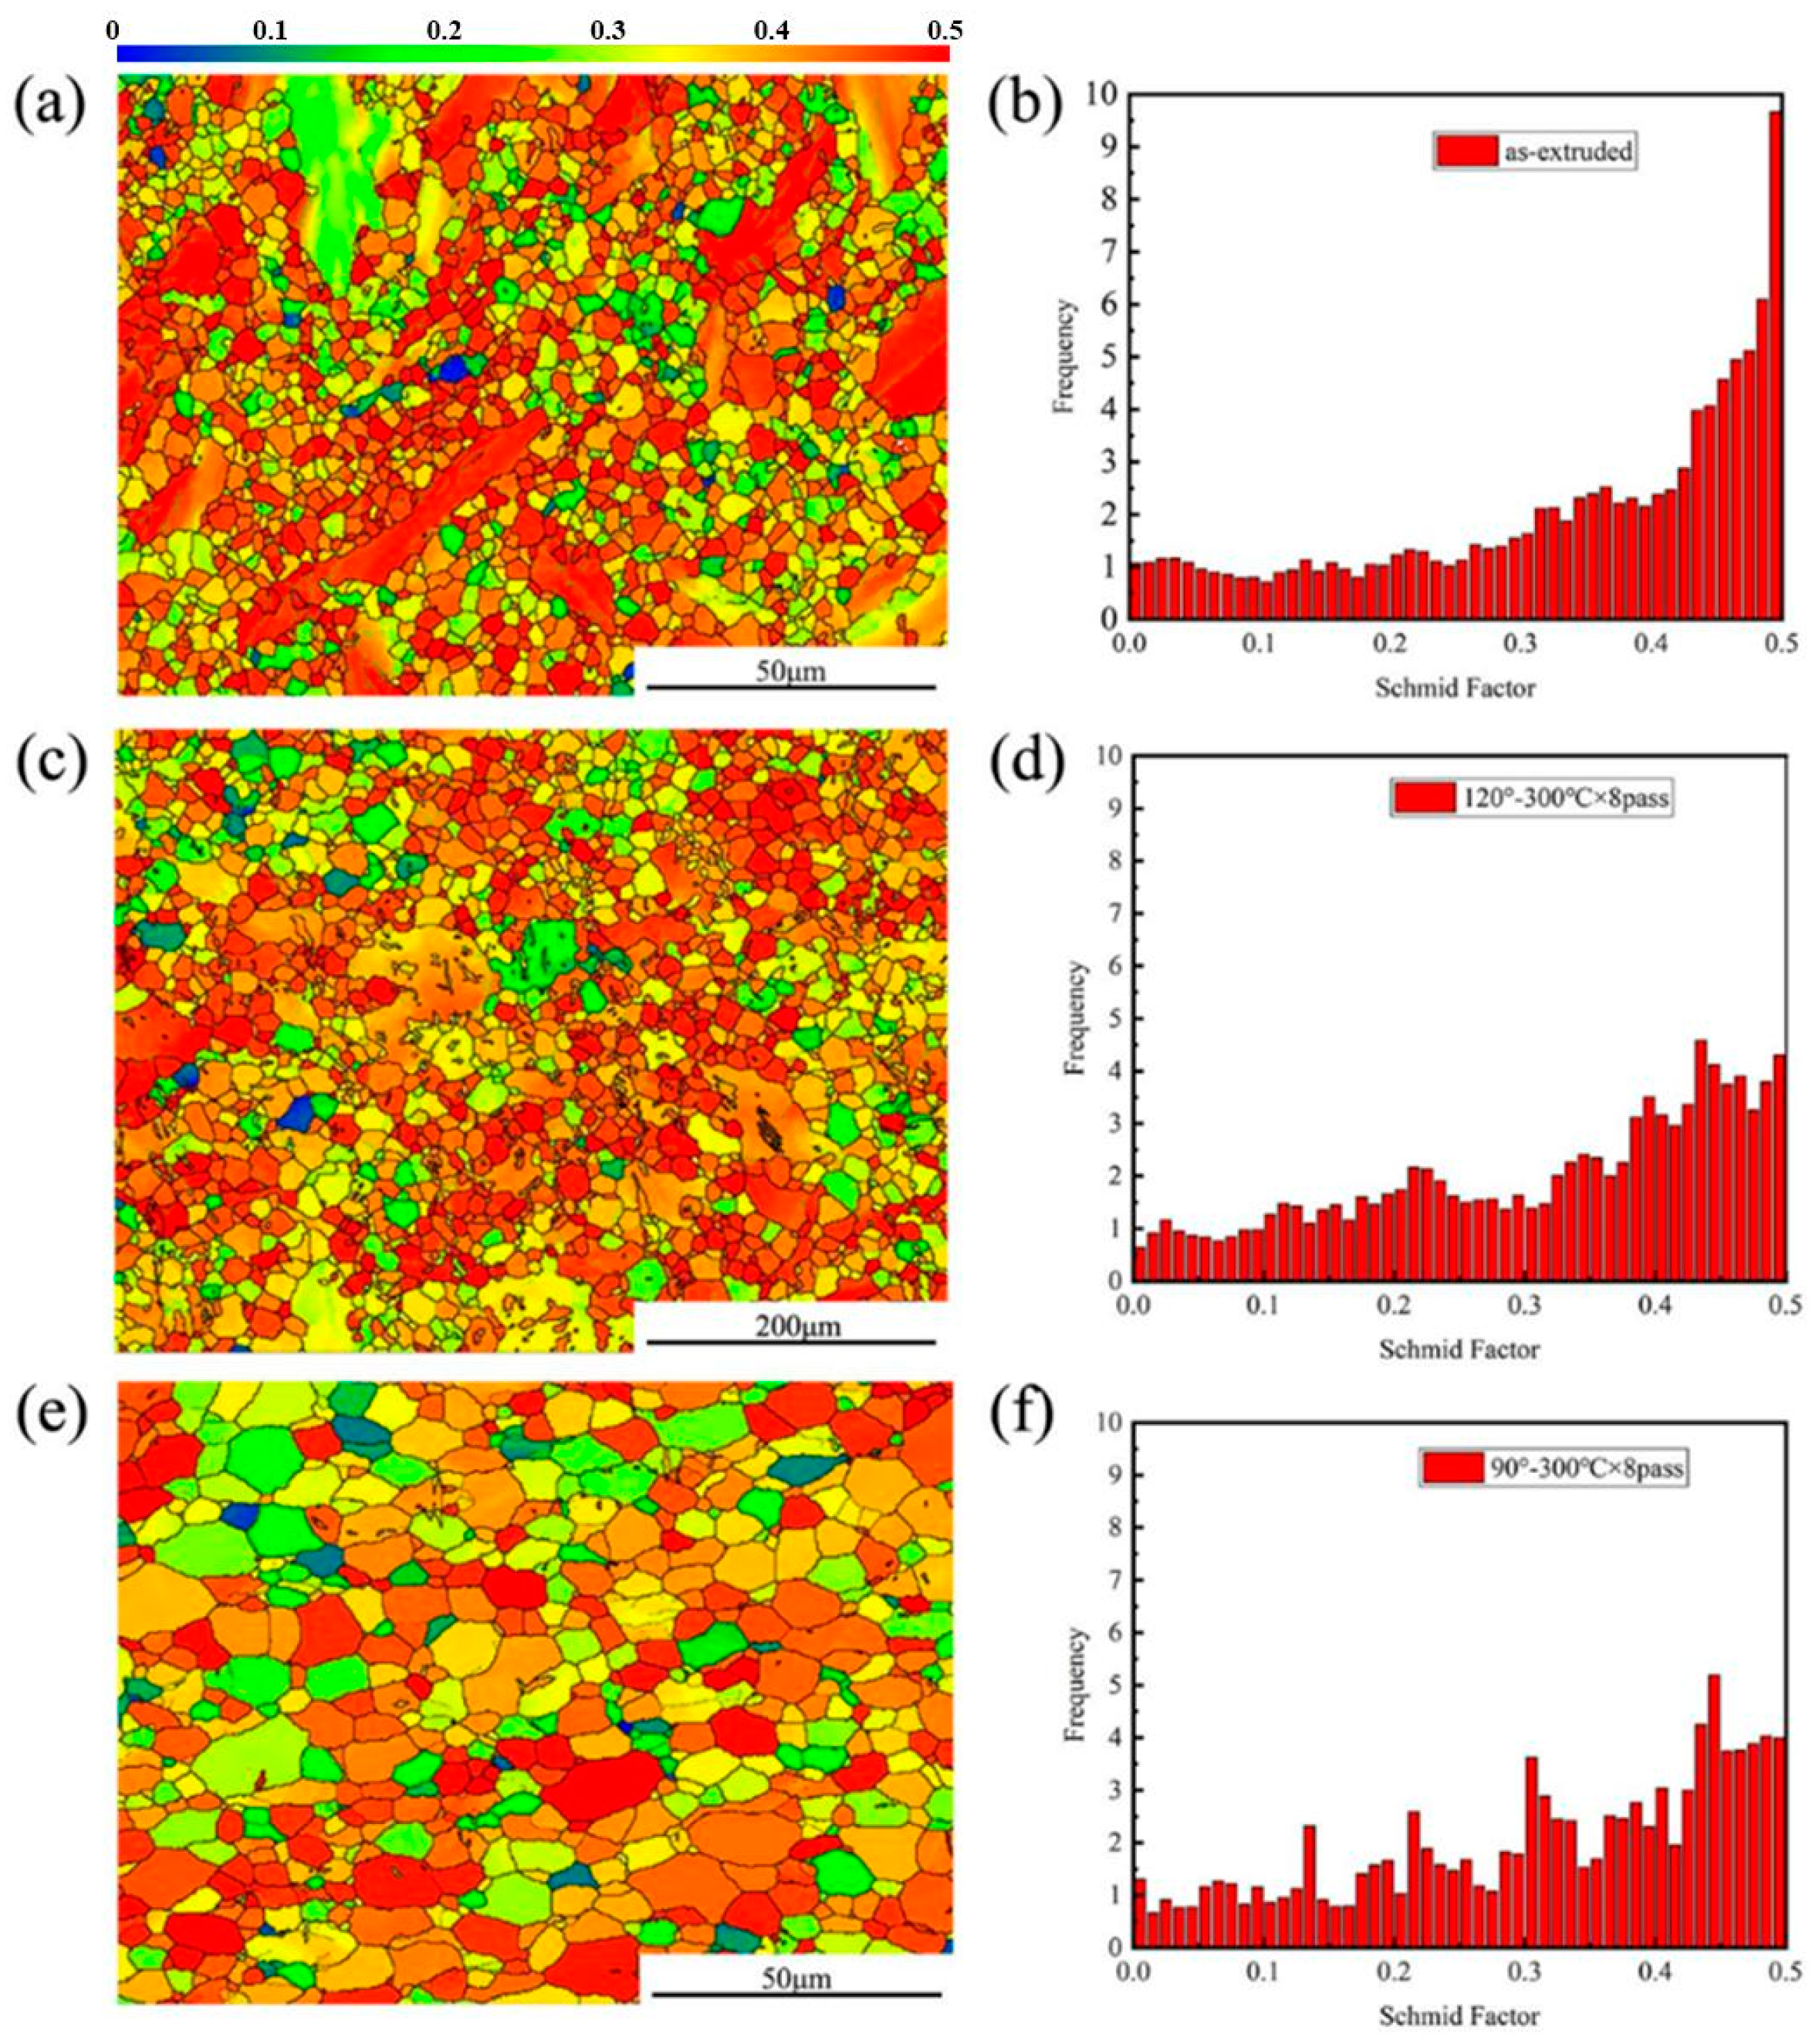
Figure 8 presents the Schmid factors of as-extruded and eight-pass ECAP-ed specimens. Different colors in the figure represent different deformation capabilities of the grains, and the difficulty of opening the slip in different colors in the figure represent different deformation capability of the grains. In the as-extruded specimen, the distribution of the Schmid factor has a large deviation, indicating a large difference in grain orientation, which explains the reason for the low plasticity of the as-extruded specimen. The texture softening effect and the recrystallization process make the distribution of the Schmid factor of the ECAP specimens finer, and that of the eight-pass ECAP-ed specimen at 120° has a smooth trend; the higher area is greater than 0.3, which is preferred to a soft orientation which undergoes greater deformation and stores more energy [
18].
3.3. Corrosion Resistance
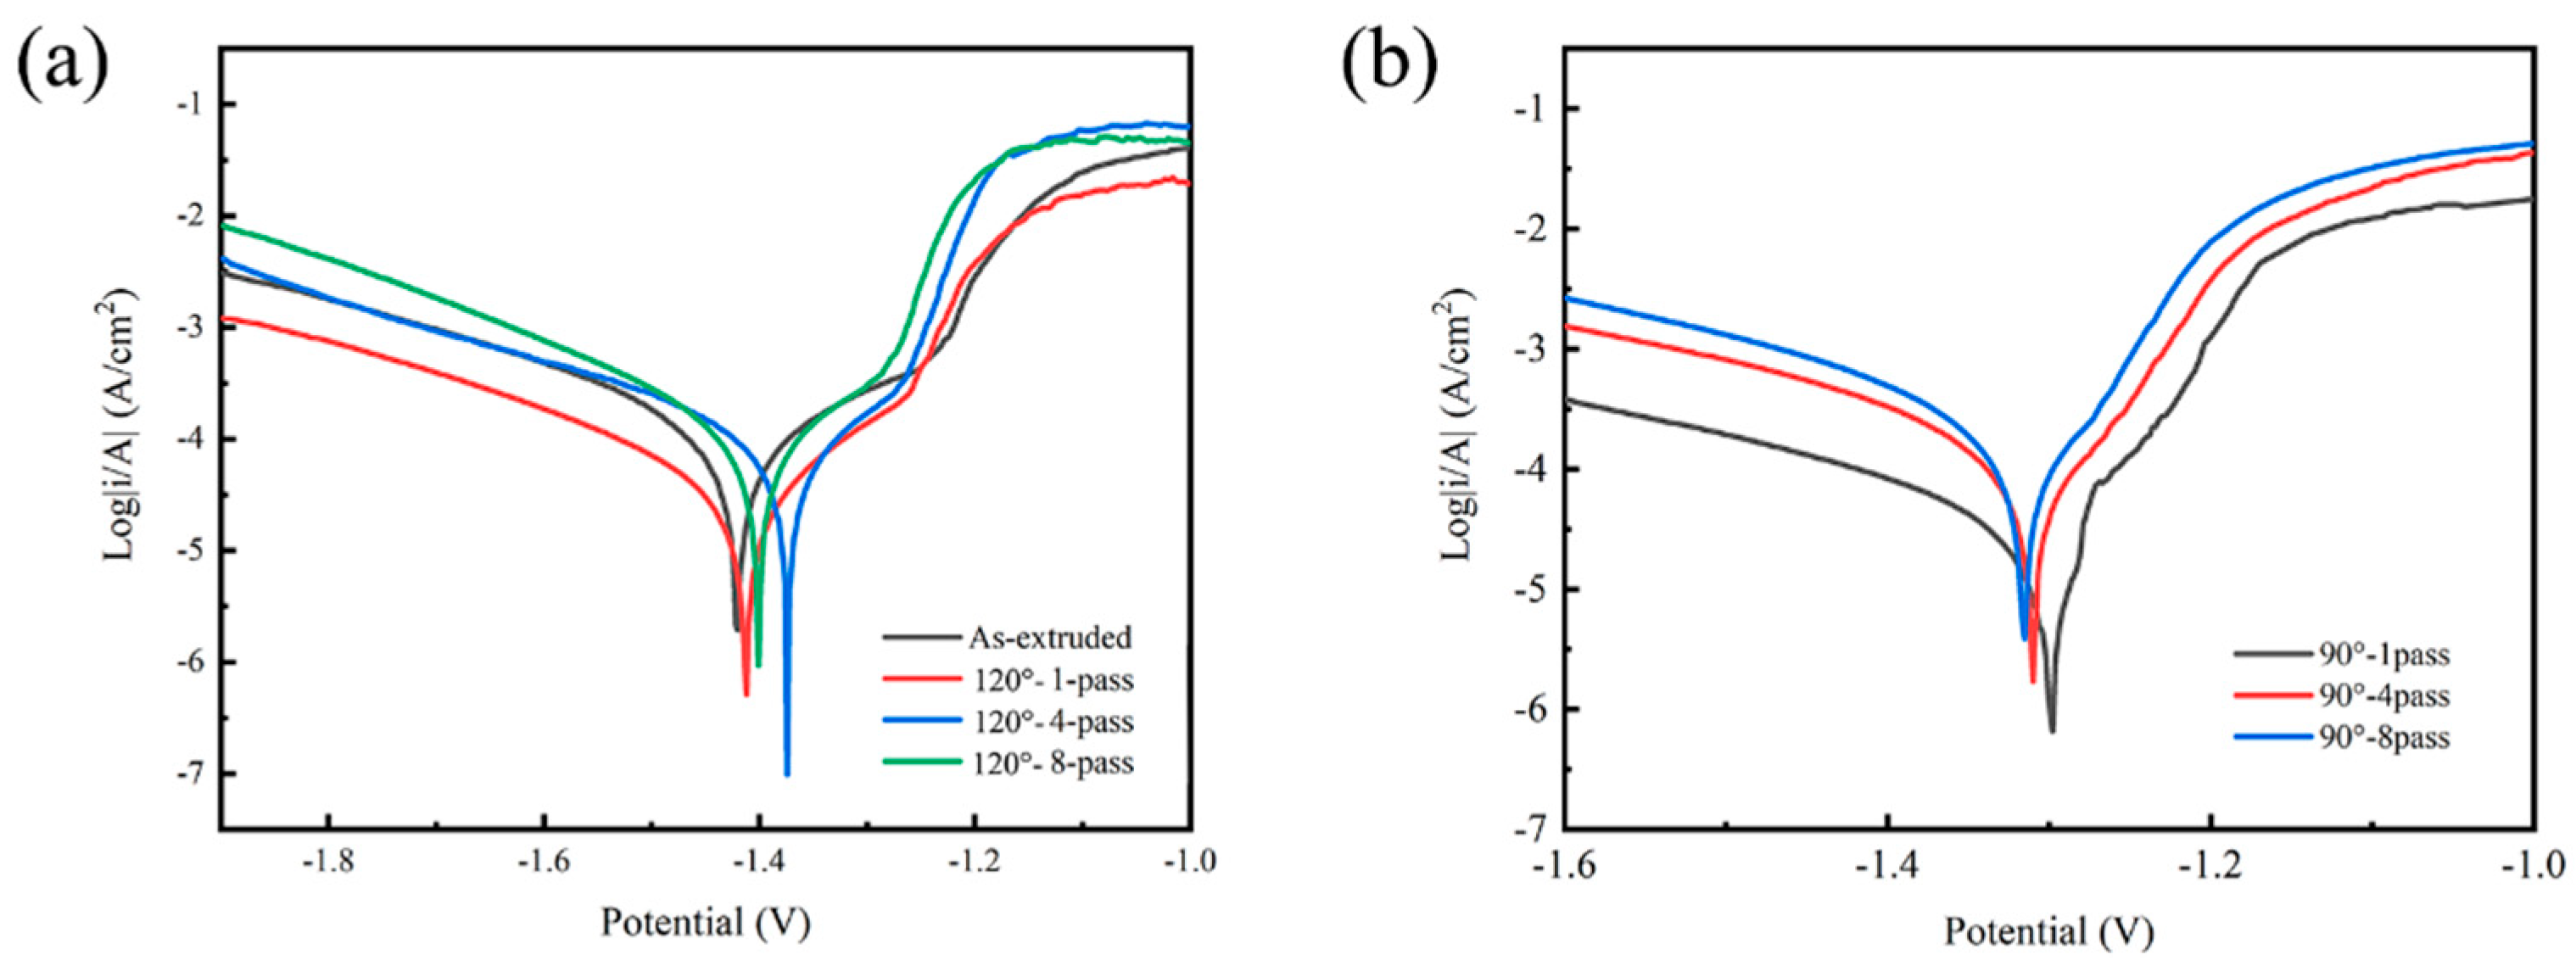
The dynamic potential polarization curves of composites, corrosion potential (
), and corrosion current density (
) are shown in
Figure 9 and
Figure 10, respectively;
is the cathode Tafel slope, and
is the anode Tafel slope in
Figure 10. The corrosion resistance of the prepared innovative magnesium alloy was reflected by dynamic potential polarization curves and impedance spectroscopy to explore the effect of microstructure on corrosion resistance.
Table 4 shows the result of corrosion potential (E
corr), corrosion current (I
corr), cathode Tafel slope (b
c), and anode Tafel slope (b
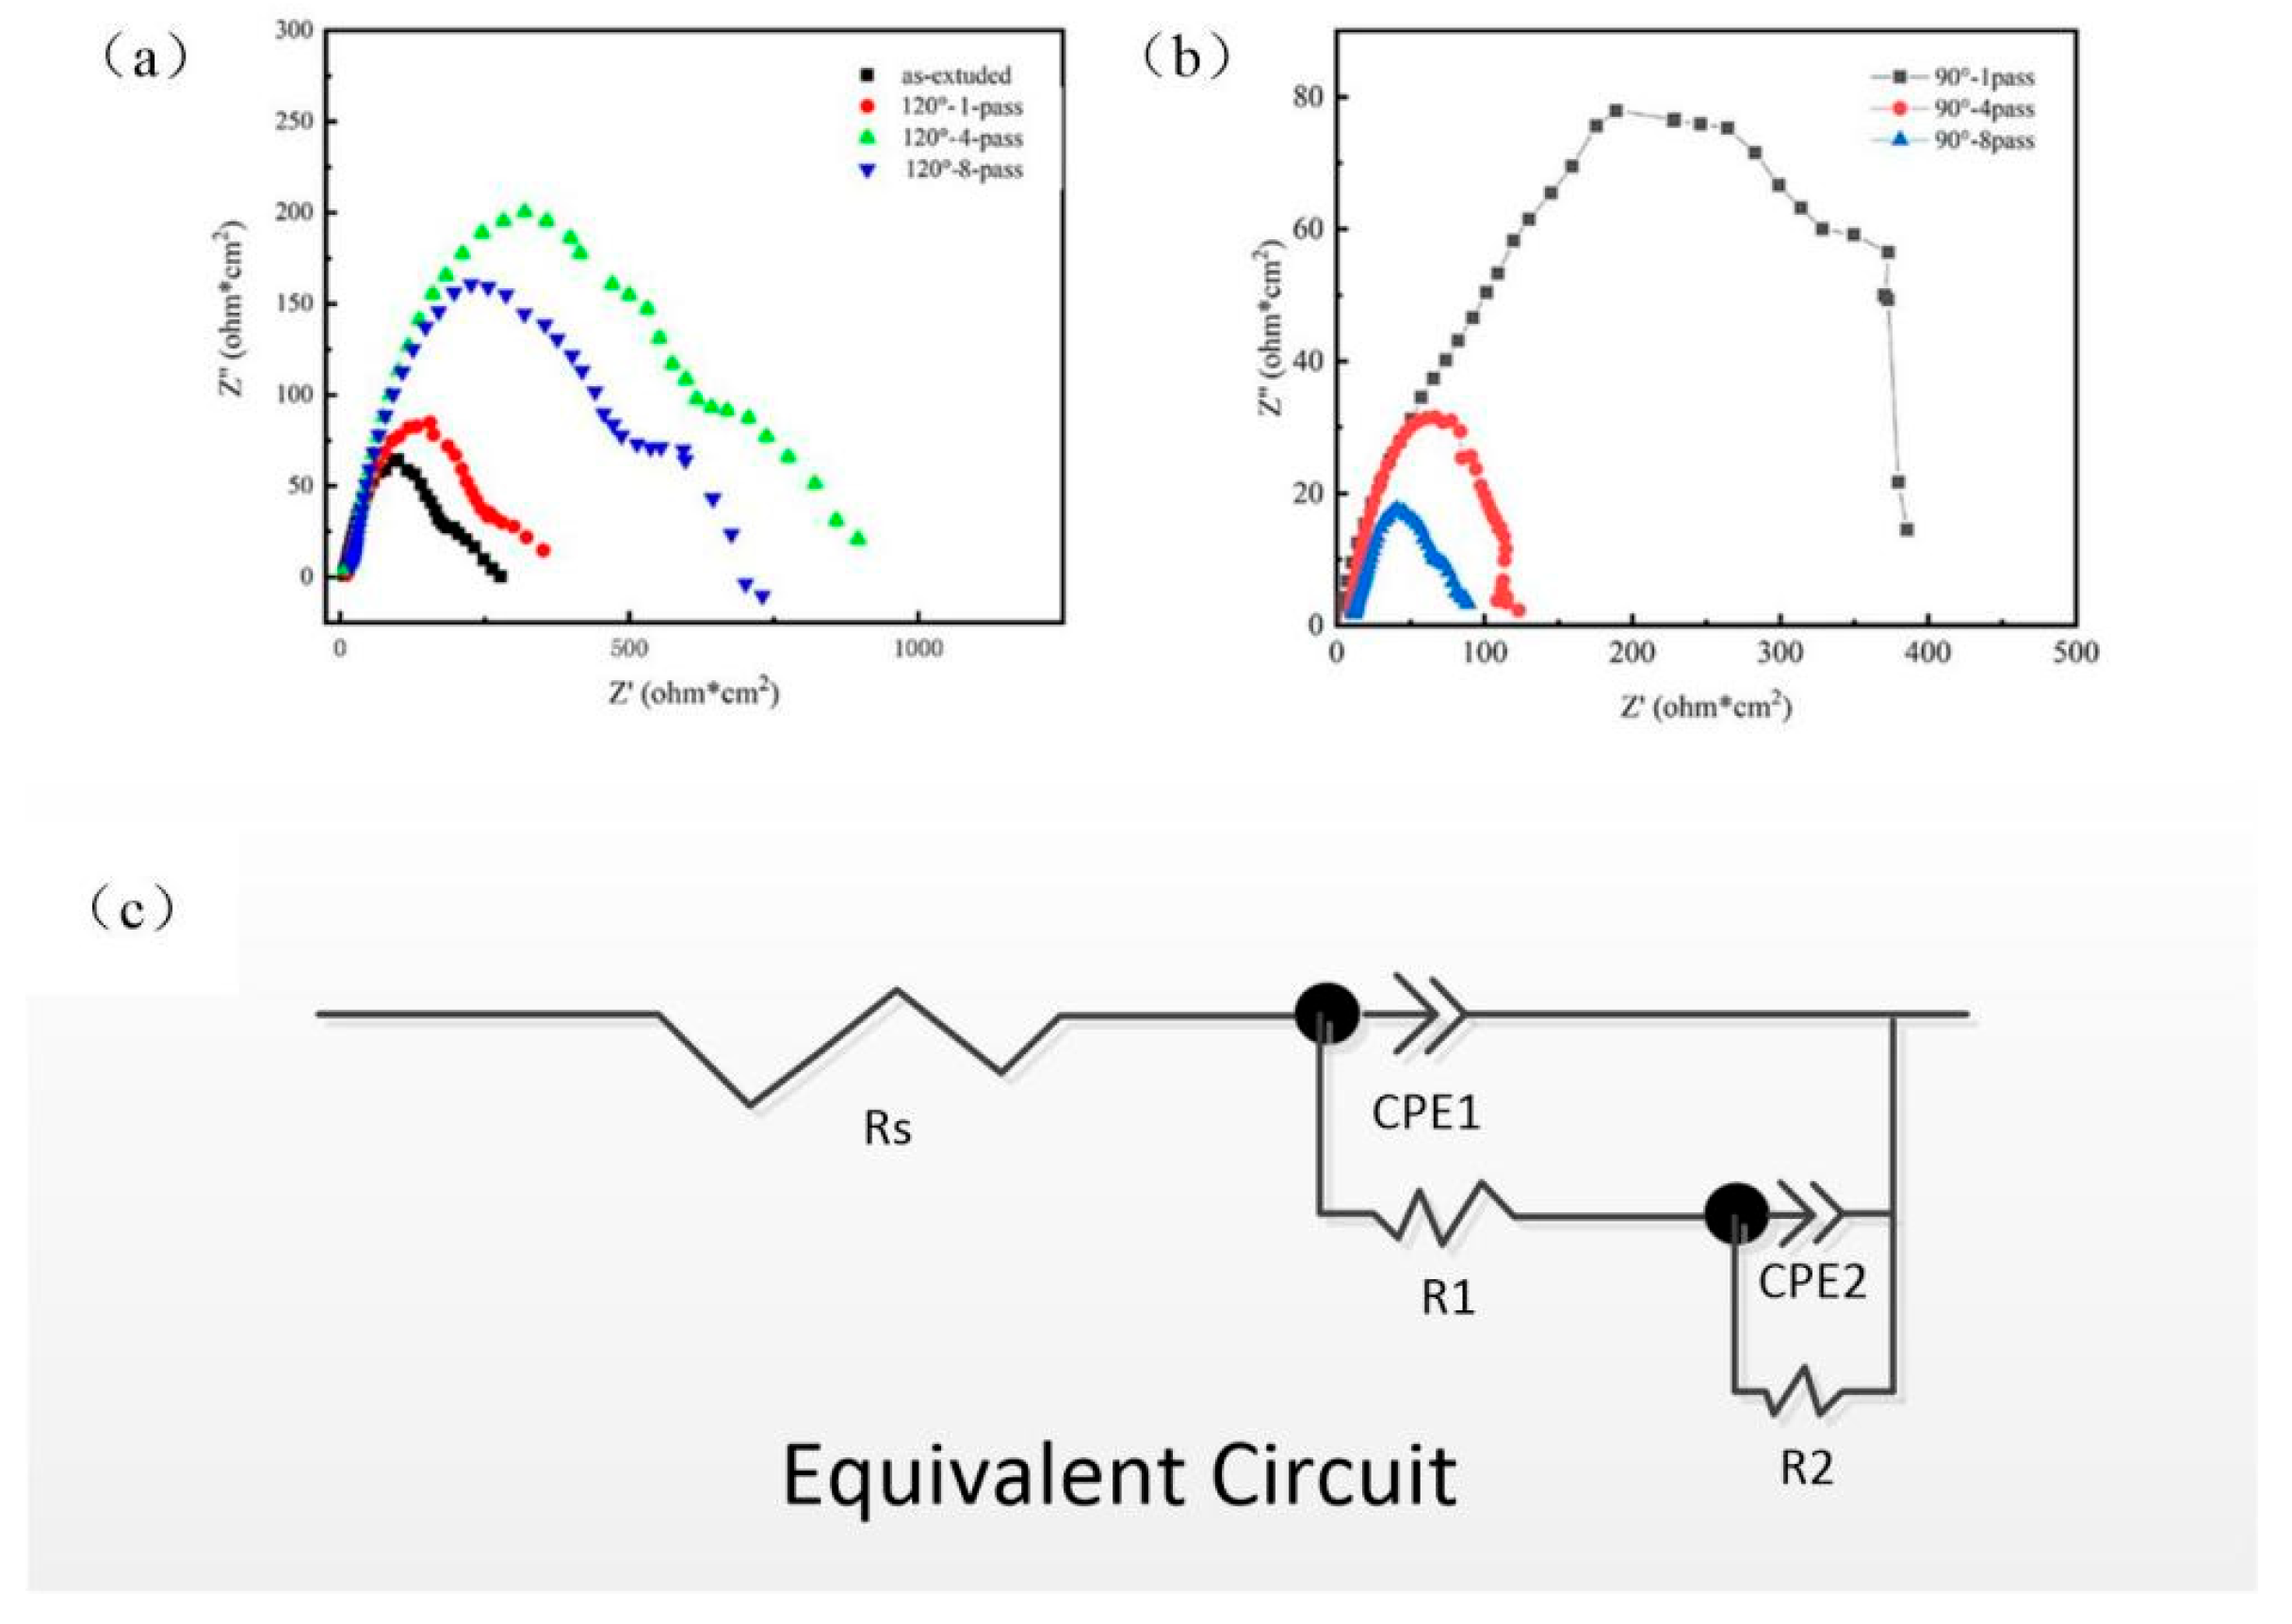
a); the Tafel slope represents the blocking of the electrode process. Impedance spectroscopy, as shown in
Figure 11, reflects the effectiveness of the passivation film formed on the surface. The radius of the capacitive loop is affiliated with the surface film resistance (R1); the small capacitive reactance loop represents the charge transfer resistance (R2), while CPE1 and CPE2 are the constant phase elements of the charge transfer on the surface film, as shown in
Figure 11c.
The corrosion potential of the as-extruded specimens is the lowest, but the corrosion current density is the highest, indicating that the as-extruded specimens have the largest corrosion rate. The factors that affect corrosion performance are related to the size of the second phase, which is usually considered the main reason for causing potential differences and accelerating the corrosion process. Larger second phases will exacerbate the pitting process, and the distribution state of the second phase will also affect the corrosion performance; the specimens which have an interrupted distribution of the second phase have better corrosion resistance. The electrochemical corrosion between the second phase and the substrate will be separated independently; because the presence of grain boundaries prevents the diffusion of corrosion and allows it to exist in a small area without affecting its overall corrosion performance, the continuous distribution of the second phase leads to intensified intergranular corrosion, and the corrosion effect will intensify. Moreover, the strengthening effect of grain boundaries will suppress corrosion performance, as the size of corrosive ions decreases. The more grain boundaries there are, the stronger the ability to inhibit the propagation of these corrosive ions; therefore, as the number of grain boundaries increases, the corrosion resistance improves. The ECAP-ed specimens of 90° display the lower and higher , and the ECAP-ed sample of 90°-1-pass has the best corrosion resistance. With a greater strain created by adjusting the mold angle, the reduced significantly, attributing to a decline in the dimension of the second phase and a multiplication grain boundary density during ECAP. From the dynamic potential polarization curves, the corrosion resistance of ECAP-ed specimens was improved by increasing strain to refine grain size; when specimens are of the same grain size, it is necessary to analyze the inner structures.
Figure 11 presents the impedance spectroscopy of these specimens. The capacitive behavior is large, owing to the charge transfer process of Mg → Mg
2+ at the double layer formed by the surface film, while the capacitance loop is small because of the relaxation of the corrosion product film formed on the alloy surface; the resistance of this oxide film is low due to its porous and partially protective properties [
31]. The composite materials have capacitive arcs in the high-frequency region and the low-frequency region, indicating that local corrosion occurs in the electrochemical corrosion process. The AC impedance spectrum shows that the capacitor arc processed by ECAP tends to continue to spread, indicating that the constant temperature capacitor arc tends to continue to spread, indicating that the constant temperature ECAP processing has not broken and does not destroy the uniform and slow corrosion of the substrate. Interface bonding between MgO and the matrix has a significant impact on corrosion initiation, while grain homogenization slows down the potential difference between large and small grains, which can explain the phenomenon of improving corrosion resistance and reducing the corrosion rate. Larger-size agglomerates in the extruded state and good interfacial bonding will not cause damage to the matrix at the initiation of corrosion. Dynamic recovery and recrystallization processes homogenize the structure and reduce the susceptibility of corrosion before ECAP, and the cathode current density of the composites after ECAP is the lowest, indicating that the ECAP process improves the cathode reaction resistance. Generally speaking, the bulk deposits act as a cathode during the corrosion process, causing more severe corrosion.
The MgO particles in the ECAP samples are finer and more uniform due to the mechanical shearing, which creates the uniform structure of the second phase without lumps, which improves the corrosion resistance, making the corrosion surface protective film denser and complete, accelerates the passivation speed of the magnesium alloy, reduces the secondary corrosion, and thus reduces the corrosion rate. During the corrosion process of the 0.6 wt.% MgO/Mg–3Zn–0.2Ca composite, the grain boundaries can serve as the cathodic protection matrix and generate Mg(OH)
2, which can form a protective film that improves the corrosion resistance. But the Cl
- existing in humans can damage the Mg(OH)
2 protective film, causing localized pitting corrosion, and grain refinement will bring more flaws. The as-extruded specimen has many refined grains, whose microstructure is the most inhomogeneous, and the volume fraction of the second phase is the largest; therefore, the corrosion resistance of the as-extruded specimen is the worst [
32].


 ,
, 


