Article

Assessment of Rate-Dependency and Adiabatic Heating on the Essential Work of Fracture of Press-Hardening Steels

1
Division of Solid Mechanics, Luleå University of Technology, 971 87 Luleå, Sweden
2
Eurecat, Centre Tecnològic de Catalunya, Unit of Metallic and Ceramic Materials, Plaça de la Ciéncia, 2, 08243 Manresa, Spain
*
Author to whom correspondence should be addressed.
Metals 2025, 15(3), 316; https://doi.org/10.3390/met15030316
Submission received: 28 January 2025 / Revised: 4 March 2025 / Accepted: 12 March 2025 / Published: 13 March 2025

Abstract

:
The automotive industry is currently in a paradigm shift transferring the fleet over from internal combustion vehicles to battery electric vehicles (BEV). This introduces new challenges when designing the body-in-white (BIW) due to the sensitive and energy-dense battery that needs to be protected in a crash scenario. Press-hardening steels (PHS) have emerged as an excellent choice when designing crash safety parts due to their ability to be manufactured to complex parts with ultra-high strength. It is, however, crucial to evaluate the crash performance of the selected materials before producing parts. Component testing is cumbersome and expensive, often geometry dependent, and it is difficult to separate the bulk material behaviour from other influences such as spot welds. Fracture toughness measured using the essential work of fracture method is a material property which has shown to be able to rationalise crash resistance of advanced high-strength steel (AHSS) grades and is thereby an interesting parameter in classifying steel grades for automotive applications. However, most of the published studies have been performed at quasi-static loading rates, which are vastly different from the strain rates involved in a crash. These higher strain rates may also lead to adiabatic self-heating which might influence the fracture toughness of the material. In this work, two PHS grades, high strength and very high strength, intended for automotive applications were investigated at lower and higher strain rates to determine the rate-dependence on the conventional tensile properties as well as the fracture toughness. Both PHS grades showed a small increase in conventional mechanical properties with increasing strain rate, while only the high-strength PHS grade showed a significant increase in fracture toughness with increasing loading rate. The adiabatic heating in the fracture process zone was estimated with a high-speed thermal camera showing a significant temperature increase up to 300 °C.

1. Introduction

Progressively more stringent safety standards aimed at the automotive industry as well as new design challenges introduced by the transition to electric vehicles put an increasing demand on ultra-high-strength steels (UHSS). The increasing weight of modern vehicles [1] has put a lot of effort into research on automotive steel grades to improve crash resistance and reduce weight. Advanced high-strength steels that depend on multiphase microstructures and the transformation-induced plasticity (TRIP) effect are in continuous development to gradually increase strength while maintaining ductility. Much research has focused on characterising AHSS for modelling and assessing their fracture behaviour under different loading conditions [2,3,4,5,6]. Highly alloyed twinning-induced plasticity (TWIP) steel and low-density Fe-Mn-Al-C grades (e.g., DUPLEX and TRIPLEX steels) are also under active research [7,8,9,10,11]. Furthermore, press-hardening steels (PHS) have become increasingly popular [12] due to their low alloy content and their ability to form ultra-high-strength parts with complex shapes without significant springback. Thus, lightweighting of structural components is possible by downgauging the sheet thicknesses in stamped parts. For example, a recent study that used a virtual analysis of a side impact for a real production vehicle showed a potential weight decrease of more than 10% in the relevant area by using 2000 MPa press-hardening steel (PHS) instead of the current steel grade used [13]. Other authors have also pointed out that replacing existing steel grades with high-strength steels is currently the most cost-effective material substitution when lightweighting [14,15]. Since component testing is cumbersome, and due to the difficulty in separating the material behaviour from other influences such as spot welds, material characterisation using small-scale lab testing in the form of test coupons is attractive. This is also helpful for the calibration of material models used in finite element codes to assess the viability of designs before starting production. Conventional uniaxial tensile properties, such as yield stress (YS), ultimate tensile strength (UTS), uniform elongation, or total elongation to fracture, are typically used to classify or rank materials in terms of ductility and strength. However, the uniform elongation or total elongation to fracture sometimes used as measurement of ductility only describes part of the mechanical behaviour related to global formability (i.e., necking instabilities). However, UHSS grades can suffer from issues related to local ductility, such as edge cracks and fractures in tight radius bending in crash folding [16], which are not characterised by these conventional standardised mechanical properties. For example, Golem et al. [17] investigated the effects of austenitization conditions on 22MnB5 PHS and performed some quasi-toughness tests using a small-radius notched specimen as well as VDA238-100 bending experiments. They found a discrepancy between the straight tensile testing displacement results compared with the local notch displacement and bending angle results. Recent studies have shown that fracture toughness measured in the frame of fracture mechanics can be used to rationalise crack-related problems in advanced high-strength steel (AHSS) grades [18,19] and to estimate their local ductility [20]. Furthermore, relevant crashworthiness properties such as crack formation and energy absorption have also been shown to correlate well with the fracture toughness of thin sheets [21]. Hence, fracture toughness is a relevant property to evaluate the crash performance of PHS grades intended for automotive use and is a proper complement to the conventional tensile properties when evaluating the performance of the steels.
However, only a limited number of studies are available on the fracture toughness of PHS grades. Recently, a study published by Lai et al. [22] investigated the fracture properties of a PHS grade alloyed with chromium and silicon using the concept of the J-integral proposed by Rice [23]. The results showed that the fracture toughness is comparable with advanced high-strength steel (AHSS) grades with lower tensile strength. However, the fracture toughness parameters used in the article were more related to crack initiation or early stages of crack propagation and do not consider the total energy of crack propagation. Golling et al. [24] instead used the essential work of fracture (EWF), a method that considers the average fracture resistance including crack propagation. They studied the influence of microstructure on fracture toughness in low-alloyed boron steel sheets and found that a fully bainitic microstructure showed the highest fracture toughness while the bainitic–martensitic microstructure showed the lowest. An interesting observation was that a single soft microstructure showed higher fracture toughness values than mixed microstructures, even though a softer phase was present. Grifé et al. [25] used EWF and an innovative notch preparation method to evaluate the fracture toughness of PHS sheets, and found that the fracture toughness increased with softening laser treatment after quenching due to a different microstructure. Some results of quasi-static fracture toughness of PHS sheets were also included in a larger study on automotive steel grades and their crashworthiness by Frómeta et al. [21]. The results showed that crashworthiness correlated well with fracture toughness measured with EWF, and that the results were vastly different for the two PHS grades tested depending on their strength and tempering treatment. In addition to the high strength measured in monotonic loading (suitable for determining the anti-intrusion potential in a crash structure), fracture toughness can thus be used to rationalise crashworthiness in the form of energy absorption [26]. Furthermore, a recent study on the fracture toughness of thicker PHS grades intended for the heavy-duty vehicle industry has also been carried out. Tarhouni et al. [27] used the EWF methodology to evaluate the fracture toughness of thick PHS grades with different microstructures. The results showed that the fracture toughness depended on microstructure, where martensite showed the lowest fracture toughness. Parareda et al. [28] studied the effects of the addition of niobium (Nb) and molybdenum (Mo) on the mechanical properties and the fracture toughness of thick PHS grades. The addition of Nb and Mo improved fracture toughness.
However, all these fracture toughness experiments on PHS grades used for the automotive industry have been conducted at quasi-static loading rates, which are vastly different from the high strain rate conditions present in a crash scenario. Thus, to accurately describe the behaviour of the material in a crash, both the monotonic loading strength and the fracture toughness should be evaluated at higher loading rates. However, the evaluation of the fracture toughness of thin sheets at higher loading rates is still severely limited. Previously, Golling et al. [29] have shown the feasibility of performing EWF tests at higher loading rates for 3rd-gen AHSS grades and showed a significant increase in fracture toughness with increasing loading rates. However, the results were not compared with any uniaxial tensile test to evaluate the rate dependence of plasticity in monotonic loading, which may be interesting for comparison and for evaluating the causes of the increase. Thus, questions regarding whether this increase in fracture toughness with loading rate is always true for automotive steel sheets are largely still unanswered. Also, to the authors’ knowledge, no experimental data on plane stress fracture toughness at high strain rates for PHS sheets are available. Since crashworthiness (e.g., energy absorption and crash folding behaviour [30]) has been shown to correlate well with fracture toughness [21,26], this is currently a research gap that needs further exploration.
Another interesting parameter to consider in high-strain rate testing is the adiabatic heating. At high deformation rates, the plastic work leads to a significant temperature increase in the material because of the lack of time for heat dissipation. This effect can be especially important for the mechanical properties of modern multiphase AHSS grades with a significant amount of metastable austenite. Langi et al. [31] studied the mechanical behaviour of four multiphase steels at different strain rates and showed that the increase in temperature due to adiabatic heating could be significant. Vázquez-Fernández et al. [32] tried to separate the effect of adiabatic heating and the effect of strain rate when studying the strain-induced martensitic transformation. They found that strain rate and temperature could be uncoupled and that both strain rate and adiabatic heating affect the strain-induced phase transformation rate. However, most studies regarding adiabatic heating focus on monotonic tensile tests, and not fracture mechanical tests. Some studies simulating adiabatic heating in localised shear-bands have indicated that the temperature can increase drastically [33], even close to melting temperatures [34]. Thus, intense shearing in the fracture process zone (FPZ) in a double edge notch tension (DENT) specimen likely leads to a significant temperature increase. This has previously not been experimentally verified for DENT specimens used for EWF testing and could have an influence on fracture toughness and therefore the increased values at higher strain rates previously published [29]. Therefore, it is of interest to determine the temperatures involved in the fracture zone as a preliminary study to establish what temperatures could be expected in high strain rate testing. This can be used as a foundation to further investigate the influence of adiabatic heating on fracture toughness in a manner similar to that performed by Vázquez-Fernández et al. [32] by uncoupling the strain rate and adiabatic heating in a more easily managed quasi-static loading rate.
In summary, this paper will advance on previous fracture mechanical characterisation of PHS sheets by investigating fracture toughness at higher loading rates and comparing the results to quasi-static loading rates, since this is something currently lacking in the literature on PHS sheets. The causes of previously published results showing an increase in fracture toughness with increasing loading rate [29] are still largely unexplored. Adiabatic heating is an aspect of high-speed testing that could possibly contribute to this increase due to the expected shear-void-growth in the ligament of a DENT specimen when the crack starts to propagate. Experimental estimation of adiabatic heating in DENT specimens fractured at high loading rates has, to the authors’ knowledge, previously not been performed for steel and could give valuable insight into the thermals involved locally in the fracture zone. The current work will assess this current lack in the literature. Furthermore, local strains in the ligament are measured with 2D-DIC and the necking of the ligament is evaluated by measuring the thickness strains of the DENT specimens. Finally, the rate dependence of conventional plasticity is investigated with conventional tensile tests.

2. Materials and Methods

2.1. Materials

In this study, two commercially available high-strength steel grades intended for automotive structural parts in body-in-white (BIW) were investigated. PHS 1000 is a low-carbon and niobium (Nb) micro-alloyed press-hardening steel with an ultimate tensile strength (UTS) of 1000 MPa suitable for crash applications where energy absorption is essential. Examples of structural parts are front and rear rails in a vehicle where high ductility and high fracture resistance are desired. PHS 2000 is an ultra-high-strength press-hardening steel grade rated for an UTS of 2000 MPa suitable for anti-intrusion structural parts such as front and rear bumper beams, reinforcements for doors, roof and floor, as well as A- and B-pillars in a vehicle. The approximate chemical compositions of the two steel grades were obtained from the steel manufacturer and are presented in Table 1. PHS 1000 and PHS 2000 had a nominal sheet thickness of 1.55 mm and 1.2 mm, respectively. Because the quenching process parameters were not known beforehand, the microstructure was investigated using a Merlin field emission gun through a scanning electron microscope (FEG-SEM) (Zeiss, Oberkochen, Baden-Württemberg, Germany). The samples were prepared according to conventional metallographic sample preparation and etched using a Nital 3% etching agent. The hardness of the PHS grades was studied with a Struers Duramin-40 hardness tester (Struers, Cleveland, OH, USA) and an indentation force of 0.5 kg.

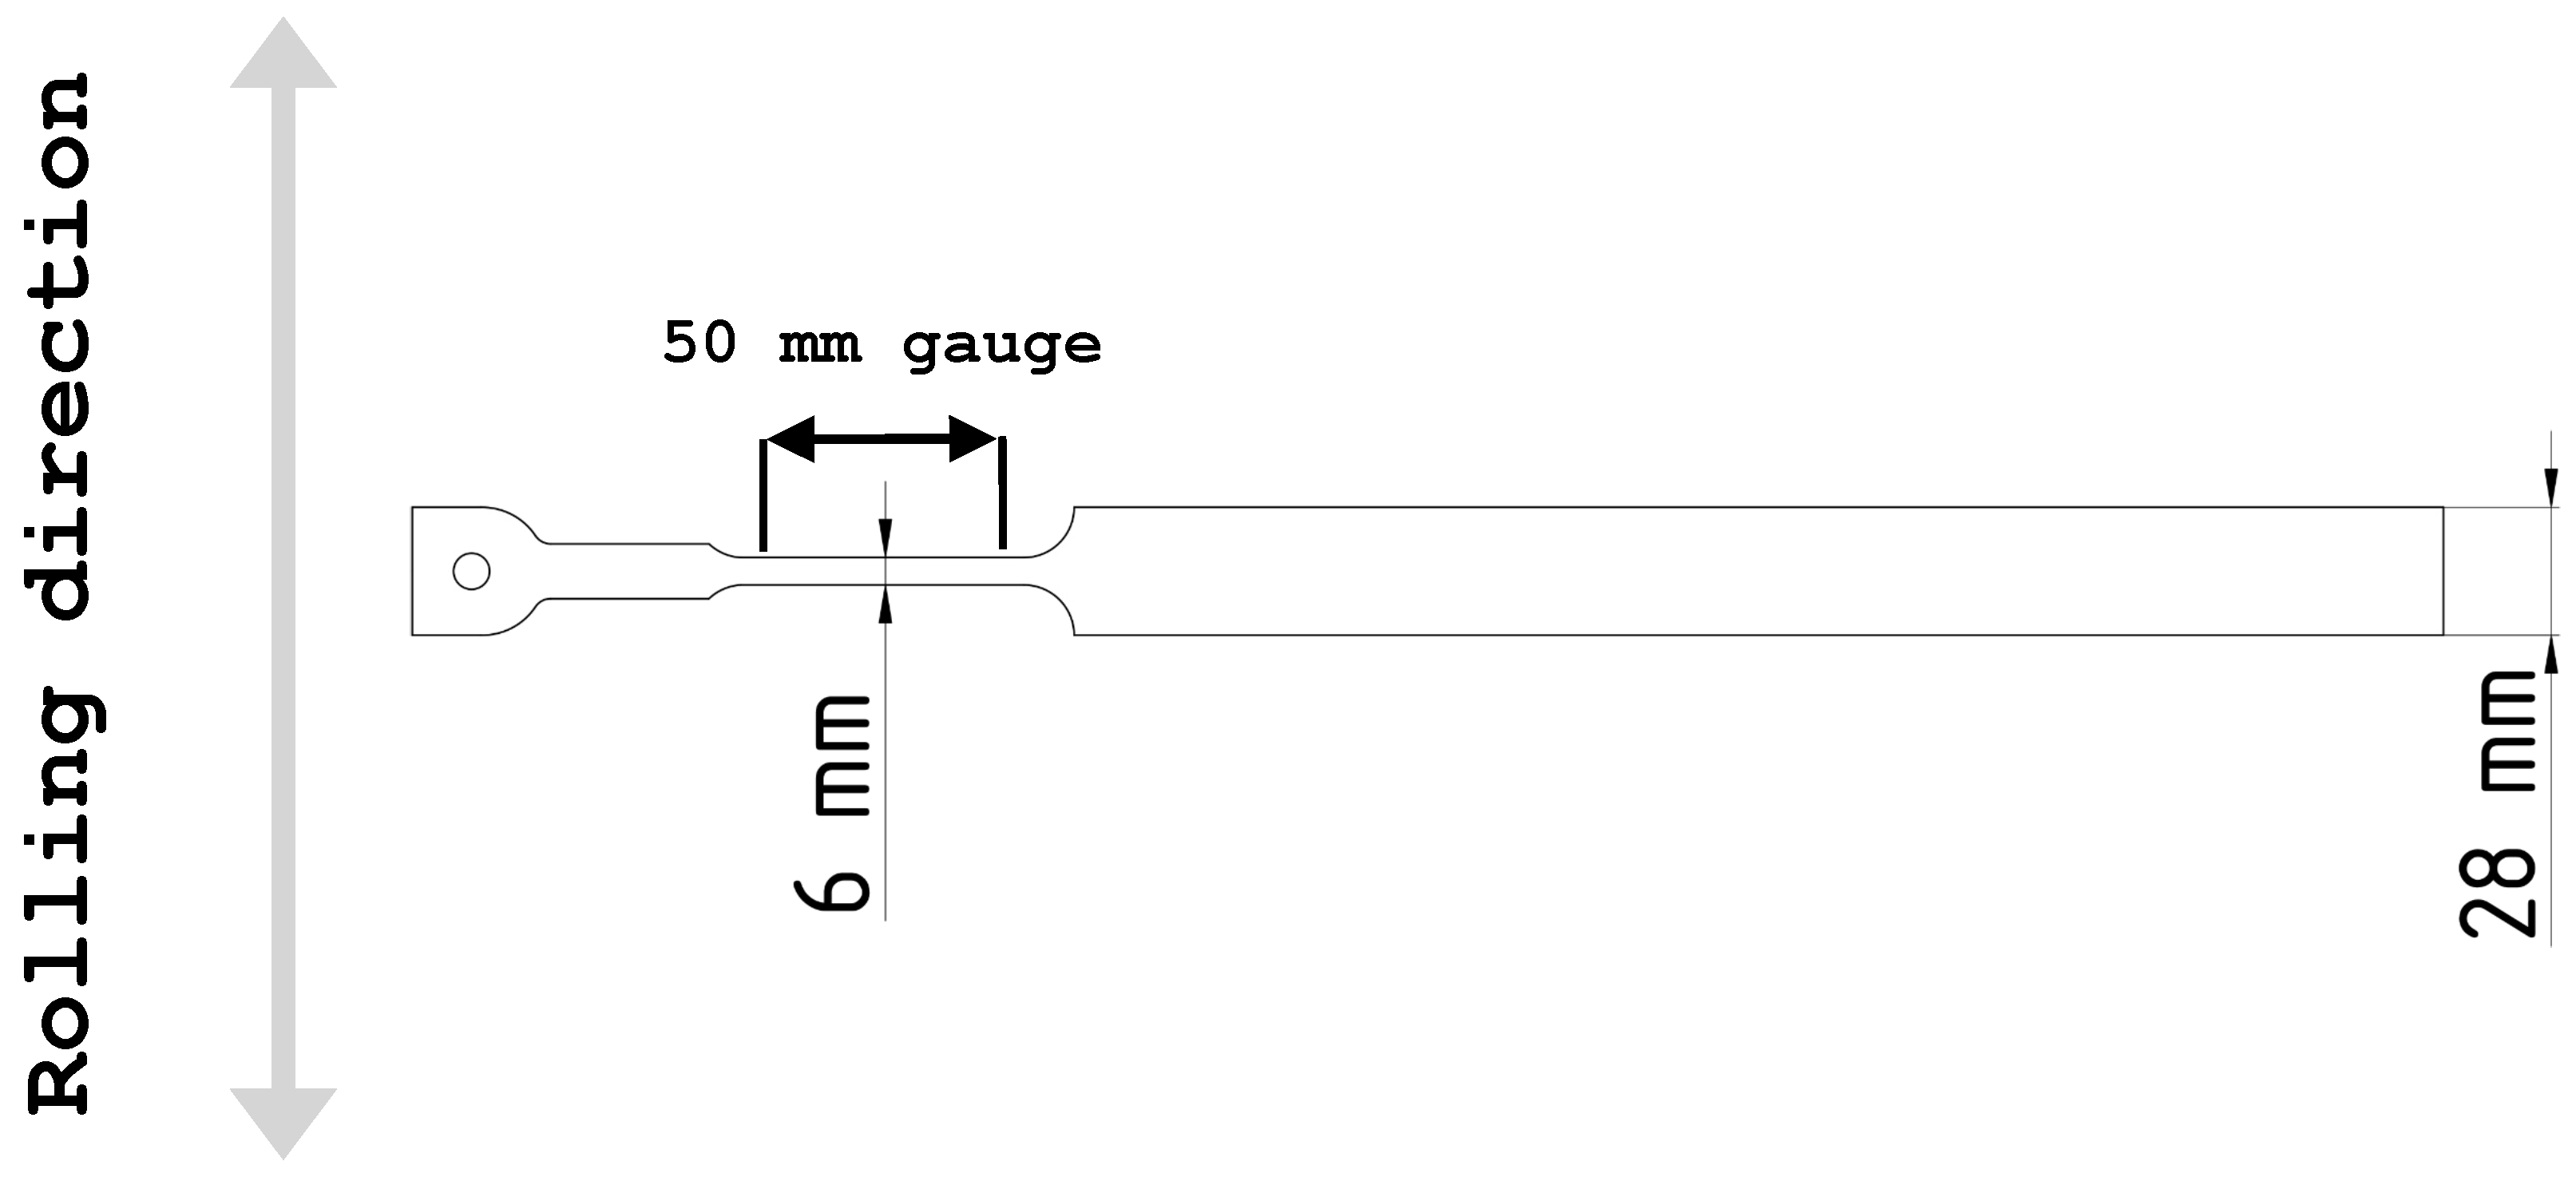
2.2. Tensile Testing

A series of straight tensile tests were evaluated under quasi-static (low-rate) and high-speed (high-rate) conditions to evaluate the rate dependence of the materials. The geometry used for both conditions is presented in Figure 1 and had a gauge width of 6 mm and was cut by electrical discharge machining (EDM) transverse to the rolling direction. The transverse direction was chosen because it usually exhibits lower strength and ductility, and therefore the measured values should give a conservative estimate of the uniaxial tensile properties. The geometry was designed with a long grip section to comply with the pre-accelerated gripping mechanism in the high-speed tensile testing machine. The same geometry was used for the quasi-static conditions for the sake of production simplicity and to make the elongation results comparable. The quasi-static tensile tests were performed in an Instron 1272 (Instron, Norwood, MA, USA) servo-hydraulic testing machine with the crosshead velocity set to 4 mm/min and with a 50 mm 3542 extensometer from Epsilon Technology to measure elongation. High-speed tensile tests were performed with an Instron VHS 160/100-20 (Instron, Norwood, MA, USA) at a crosshead speed of 6.5 m/s and a Zimmer 100D (Zimmer OHG, D-6101, Rossdorf/Darmstadt, Germany) non-contacting displacement transducer to measure the elongation of a 50 mm gauge length. The engineering strain rates of the two conditions were approximately 0.001 s 1 and 100 s 1 , respectively. The quasi-static tests were performed as reference since these are easily controllable experiments that are usually performed, while 100 s 1 was chosen to evaluate the material at the strain rates expected in a crash. Previous numerical simulations of axially crushed crash boxes at approx. 20 m/s performed by the authors showed that strain rates could locally reach an order of 100 s 1 . Three tests were performed for each grade and each strain rate were performed, except for PHS 2000 where one of the high-strain tensile results was excluded due to noisy data.

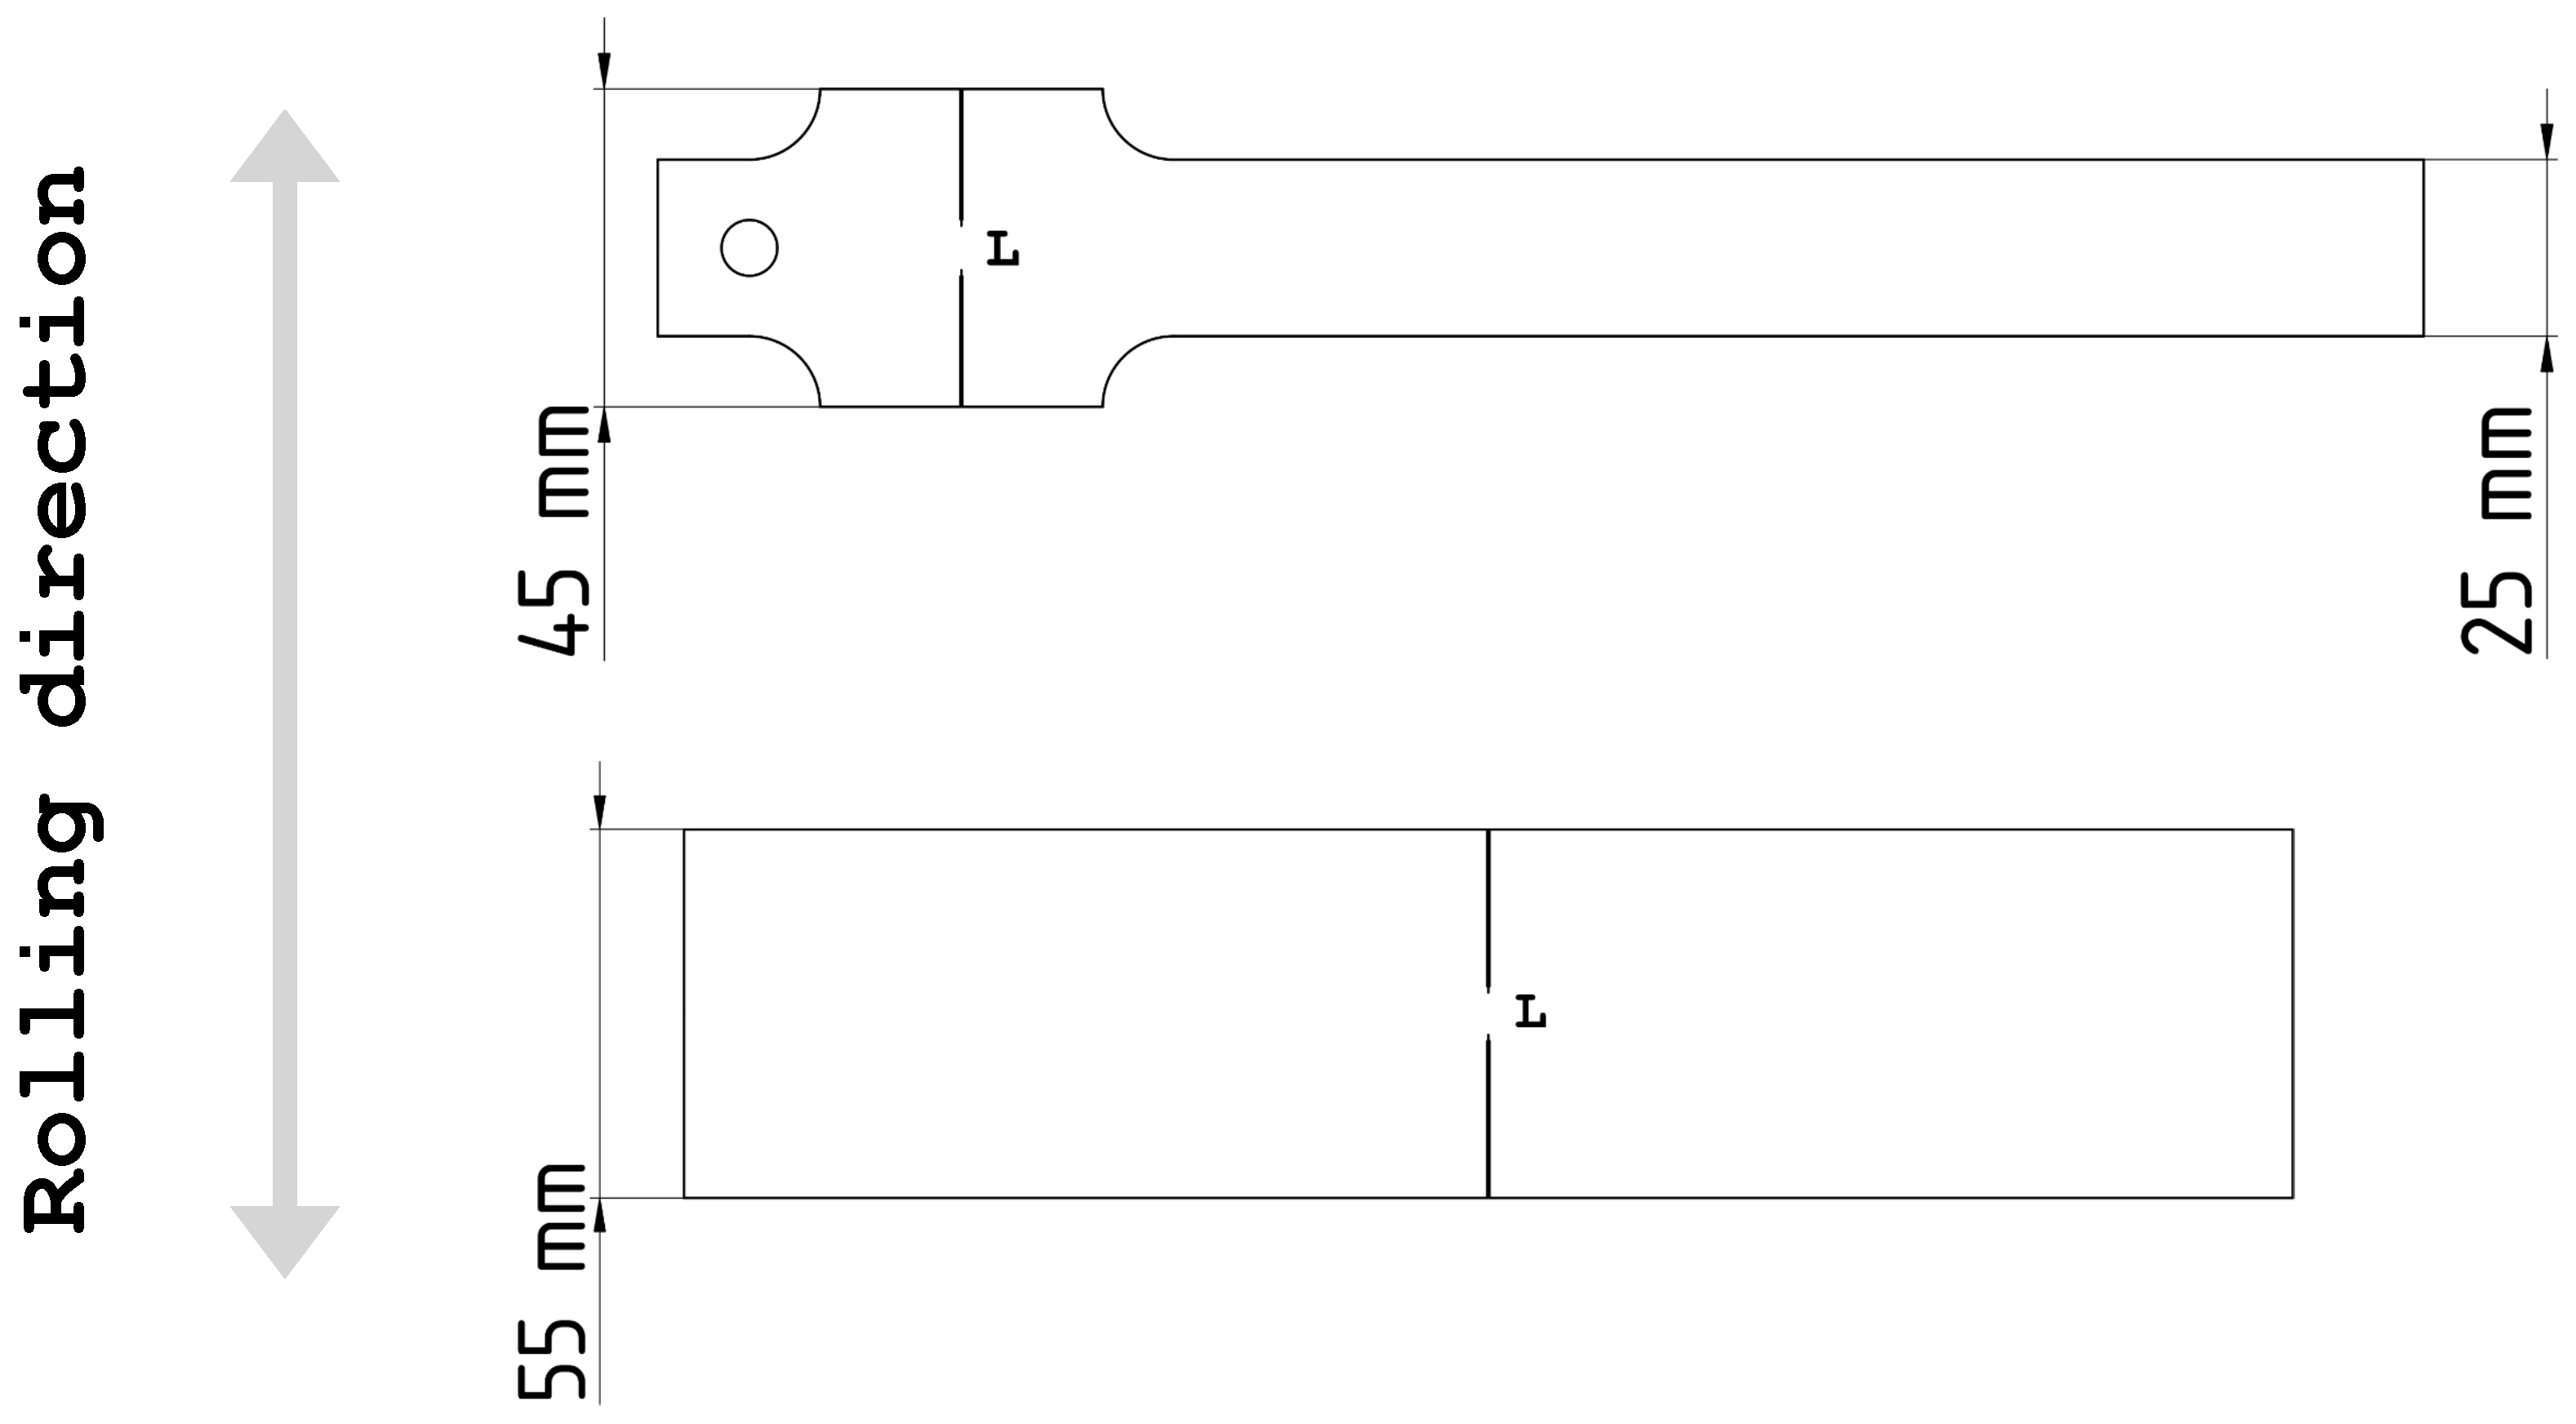
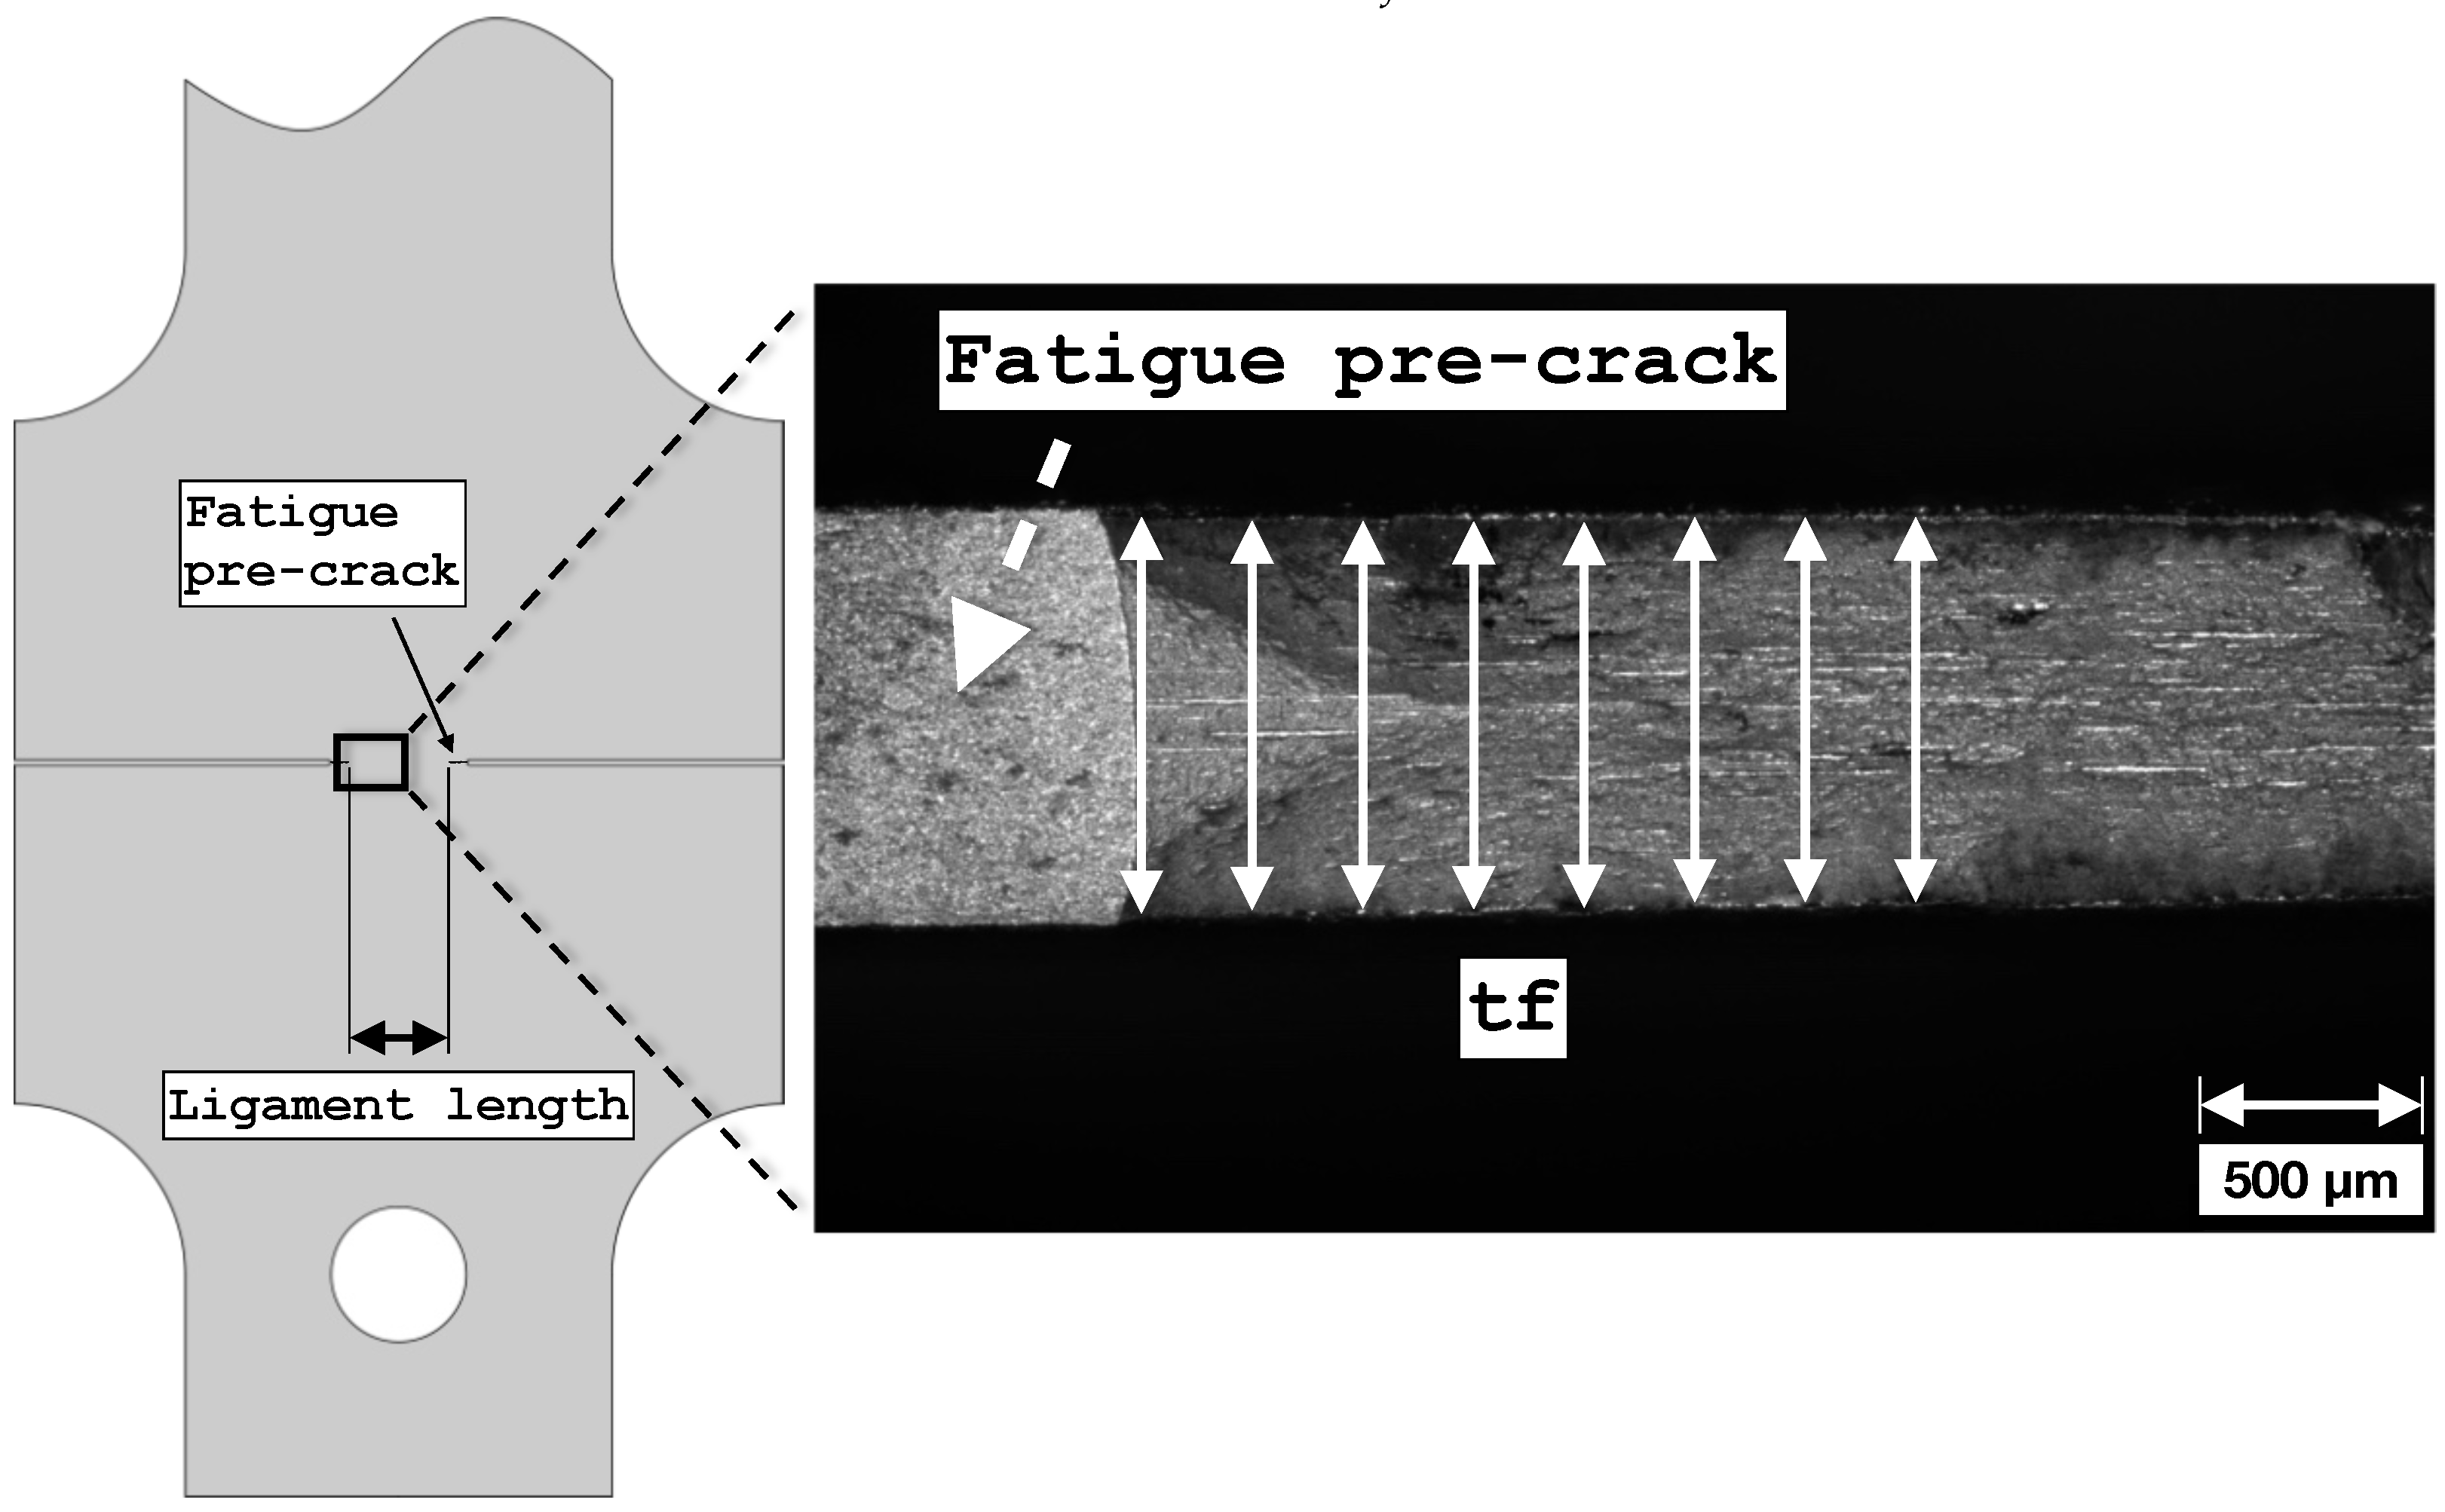
2.3. Essential Work of Fracture

The EWF method [35] used in this study is a technique to measure plane stress fracture toughness of thin sheets and is based on concepts introduced by [36,37,38]. The DENT specimen, presented in Figure 2 for low and high loading rates, respectively, is often the preferred geometry for thin sheets due to the contained plastic zone and the absence of buckling and is therefore chosen in this study. The specimens were cut transverse to the rolling direction (the cracks in the ligament along the rolling direction), for the same reason that was stated for the uniaxial tensile specimens previously (conservative value). The notches of the quasi-static DENT samples were prepared with EDM. Regarding the high-speed specimens, some were cut using laser cutting in a previous project while others were prepared using EDM. Due to the notch root radius sensitivity of EWF [39], fatigue pre-cracks were introduced before subjecting the samples to tensile load to give the smallest root crack possible. The resulting length between the cracks in the DENT specimen is known as the ligament. Due to these fatigue cracks of approximately 1 mm on each side, the influence of the different cutting techniques was deemed to have a negligible impact on the test results and therefore not considered further in this study.
The region in front of a crack tip can be divided into an essential fracture process zone (FPZ) where the actual fracture takes place and an outer region screening the large strains created in the FPZ with non-essential plastic work. Assuming constant specific work of fracture (per unit area of crack extension), the essential work of fracture w e is proportional to the ligament area (i.e., the length between the cracks multiplied with the initial sheet thickness). The non-essential work is in turn proportional to the square of the ligament length and a plastic shape factor β . By normalising the total work of fracture W f with the ligament area, the linear equation with respect to the ligament length, l, presented in Equation (1) is obtained.
w f = w e + β l w p
By performing fracture tests for a range of ligament lengths and calculating the specific work of fracture (integral of stress–displacement curve up to fracture) in each case, the essential work of fracture w e is obtained by extrapolating a linear regression curve to l = 0 . The slope of this regression line gives the plastic work multiplied by a shape factor β , which is geometry dependent. Certain limits on ligament lengths must be within certain limits to ensure plane stress [40]. w e is an intrinsic material property for a specific sheet thickness and has emerged as an interesting and viable parameter to rationalise the crack behaviour of AHSS components in the automotive industry, both in forming [18,19] and crash applications [20,21].
In this work, to characterise the fracture toughness of the PHS grades, the quasi-static tests were performed in an Instron 5585H (Instron, Norwood, MA, USA) equipped with a digital video extensometer with a gauge length of 50 mm to measure the global extension. The crosshead speed was 1 mm/min and nine tests were performed for PHS 1000 and PHS 2000, respectively. The high-rate tests were conducted in the Instron VHS 160/100-20 (Instron, Norwood, MA, USA) machine with the same Zimmer 100D (Zimmer OHG, D-6101, Rossdorf/Darmstadt, Germany) non-contacting displacement transducer to measure the elongation of a 50 mm gauge length as for the uniaxial tensile tests. The approximate crosshead velocity was approximately 0.5 m/s. A Phantom® vision V2512 (Vision Research, Wayne, NJ, USA) high-speed camera was used to detect crack initiation and to track the subsequent propagation until the final fracture. This was necessary to integrate the load–displacement curves to determine the specific work of fracture for each DENT specimen. In total, 13 (valid) tests were performed for PHS 1000 and 12 (valid) tests were performed for PHS 2000. Some tests were excluded since they violated some EWF criteria (e.g., self-similarity) possibly due to some twisting of the specimen during the experiment which could lead to only one of the cracks growing during the experiment or other preparation-related influences (e.g., cutting techniques).

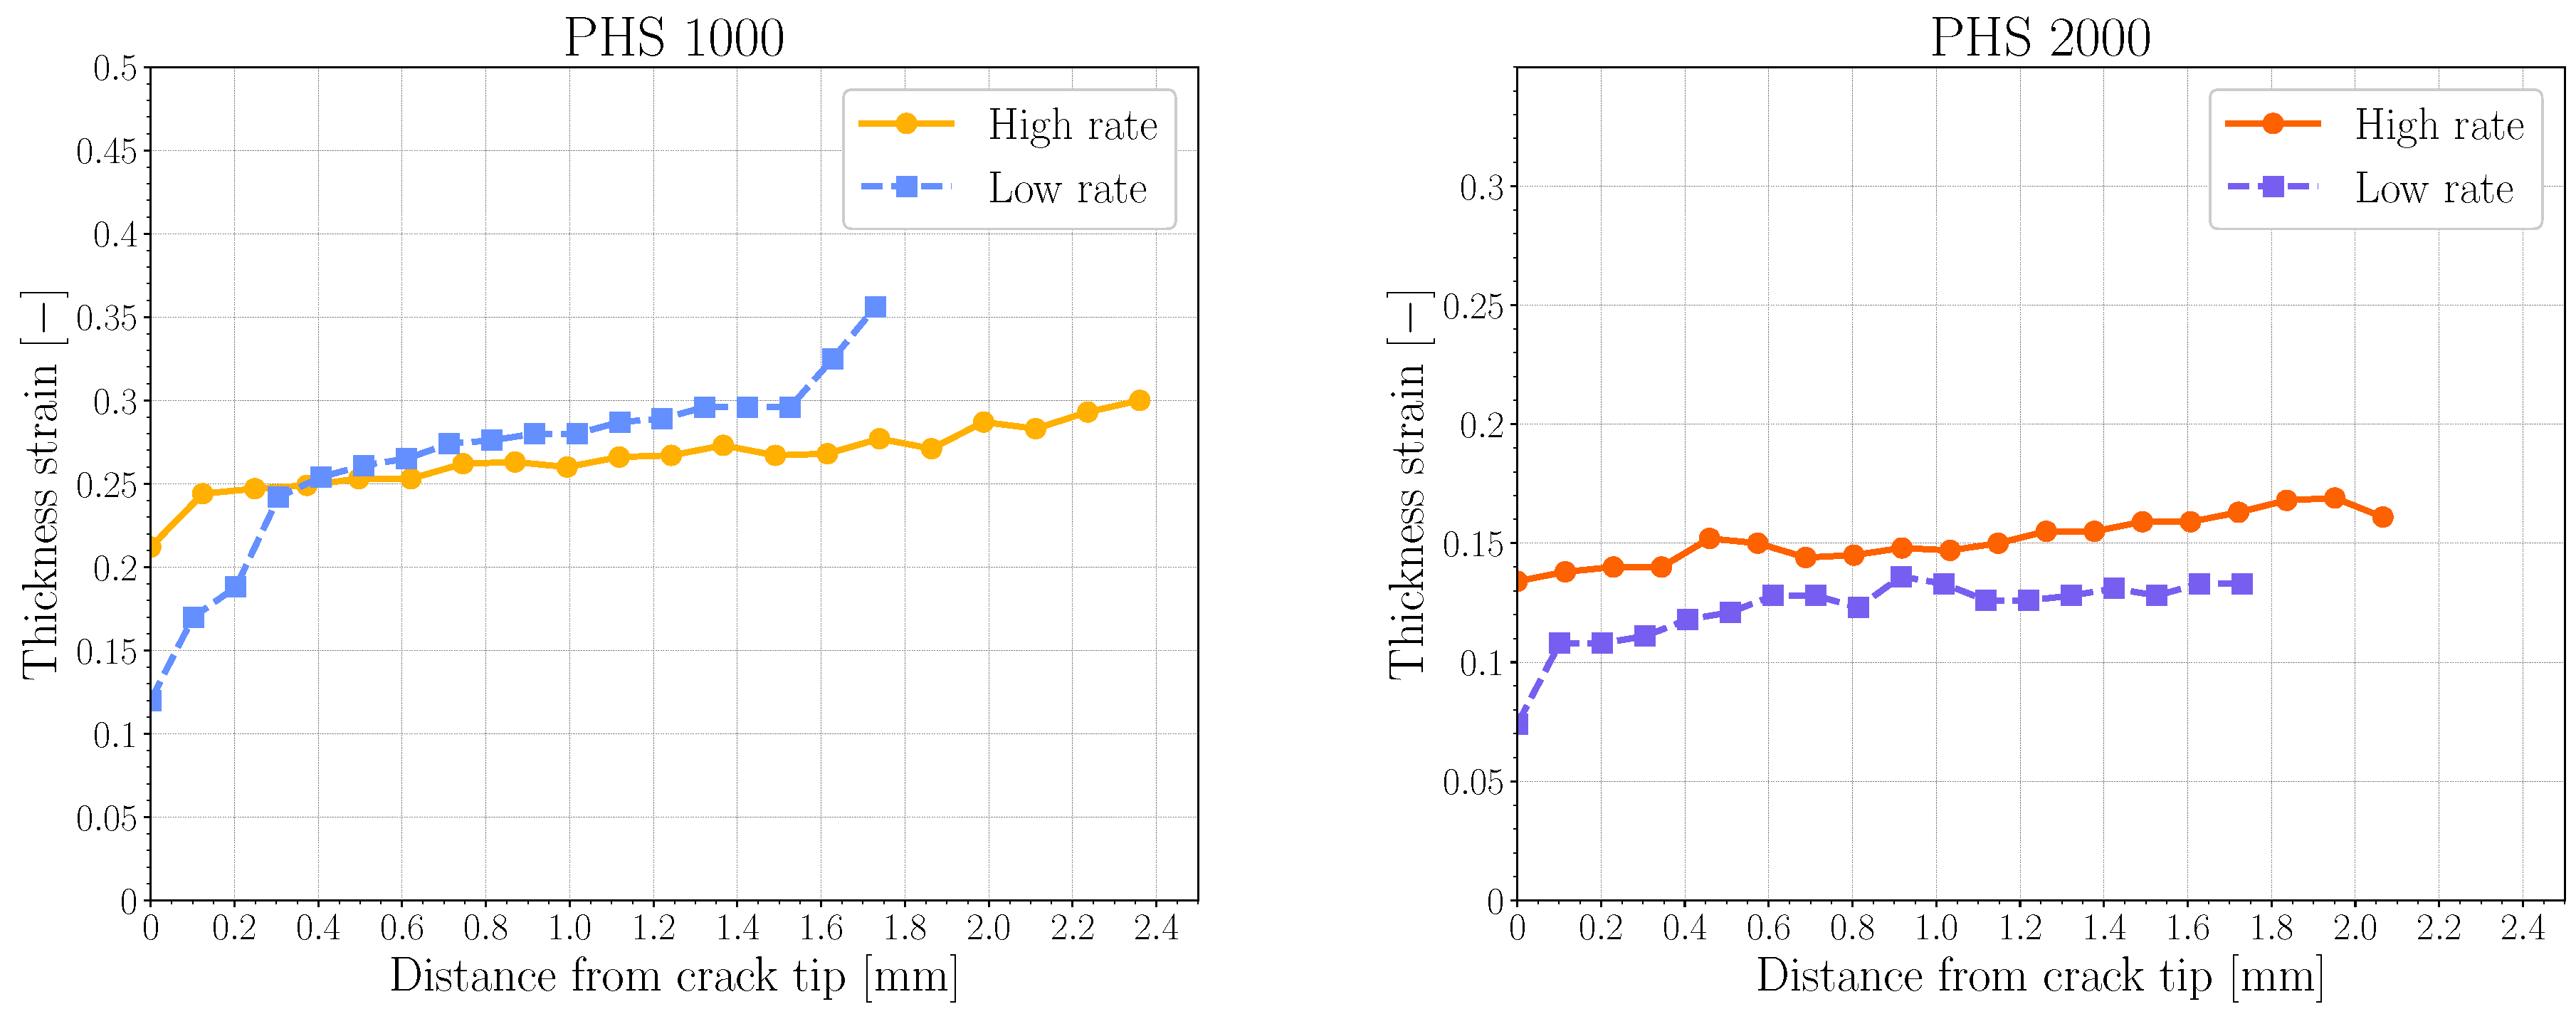
2.4. Thickness Strain

Since there is a significant energetic contribution of necking to the essential work of fracture of thin sheets [39,41], it is interesting to quantify this contribution for the two PHS grades at different loading rates. The thickness strain was calculated according to Equation (2) for the DENT samples for each material and at each loading rate. The section studied and the relevant parameters are illustrated in Figure 3. Here, t 0 is the initial thickness of the ligament measured with a micrometre and t f is the thickness of the fracture area at different locations progressively further away from the tip of the crack. This equation is rewritten to give a positive value for thickness reduction, i.e., a positive value indicates a thickness reduction.
ε DENT = l n t 0 t f

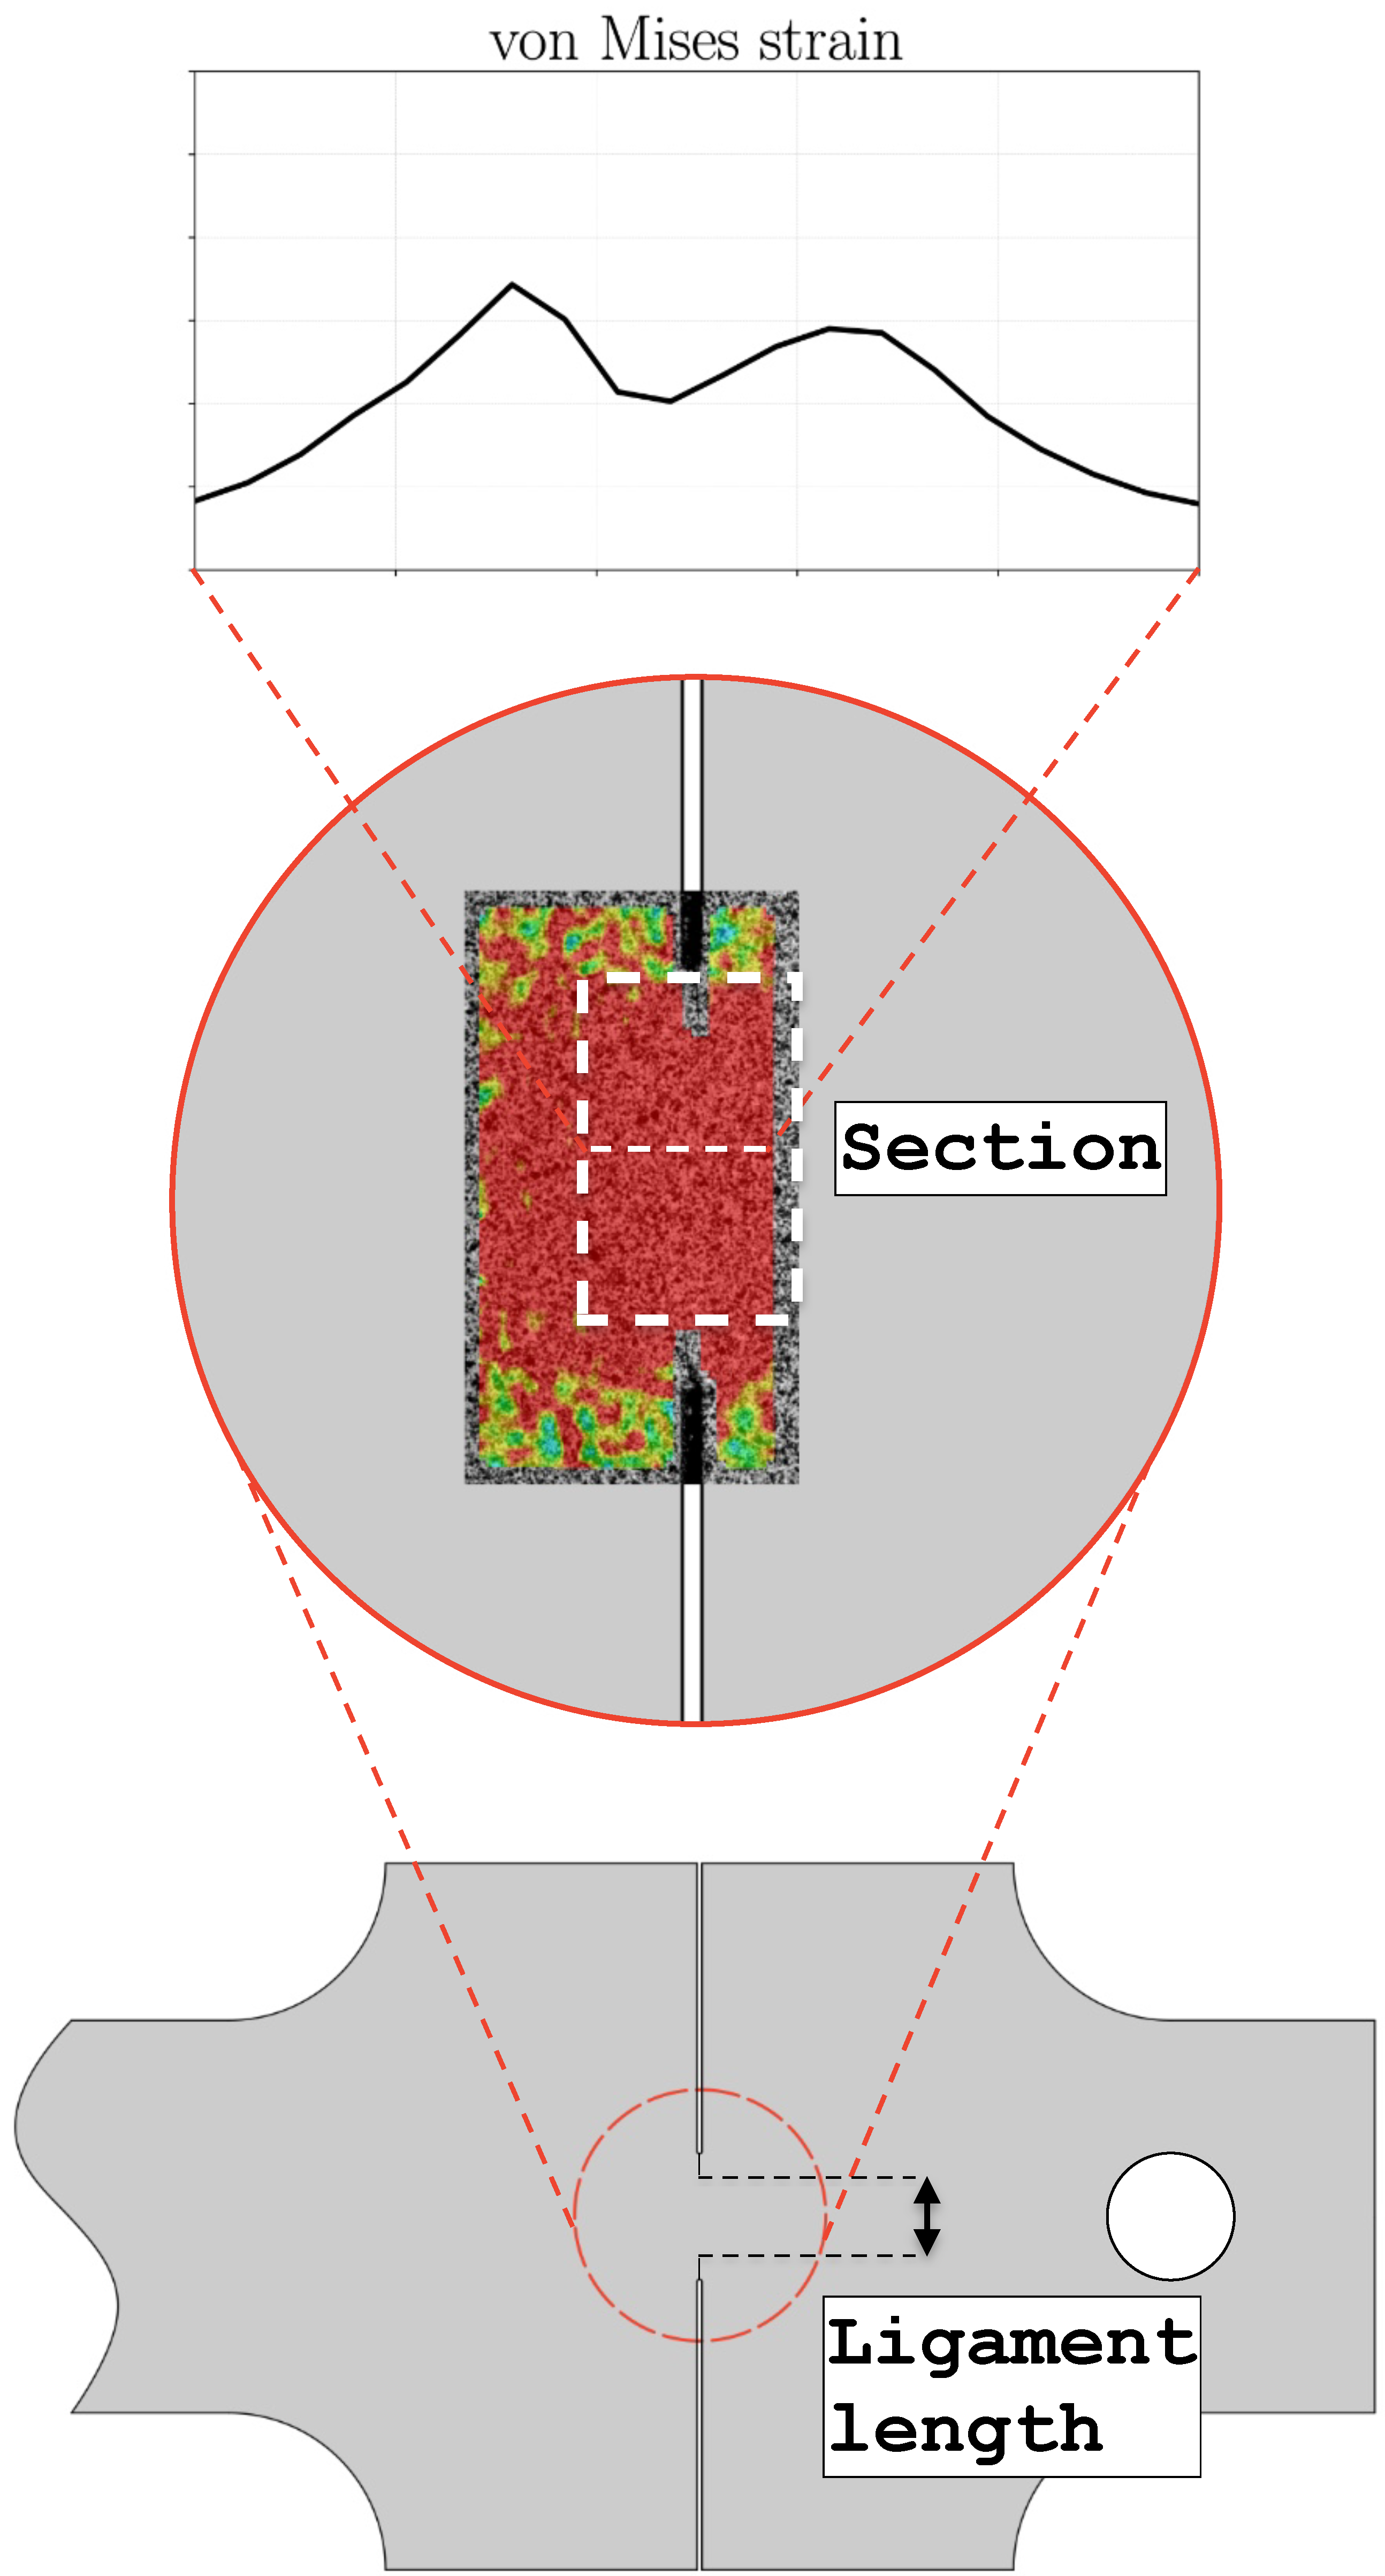
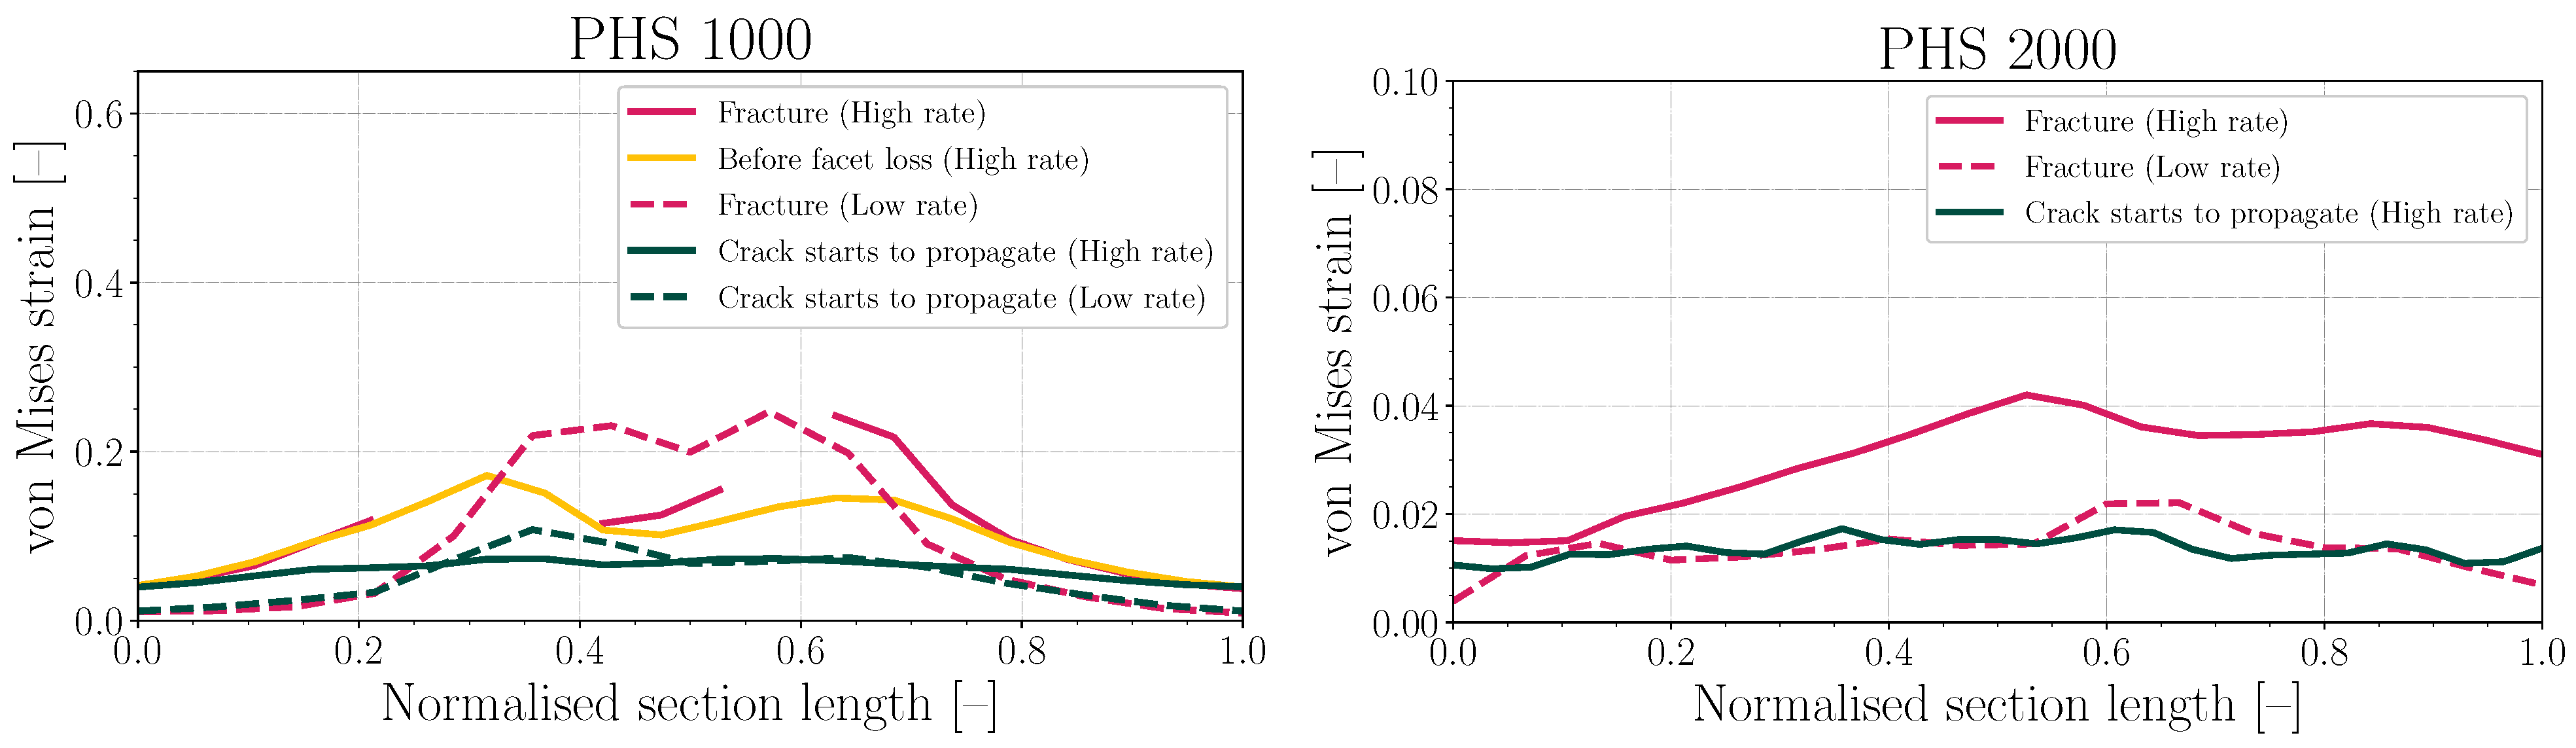
2.5. Digital Image Correlation

To measure and compare the local ligament strains of a DENT specimen of each PHS grade, 2D digital image correlation (DIC) was used. The commercial GOM ARAMIS 6.3 software was used for the analysis. It is important to note that 2D-DIC cannot capture out-of-plane deformations, so measured strain values should be interpreted with caution. It is used here only for the sake of comparison between low and high strain rates. The section used for measurement is illustrated in Figure 4.

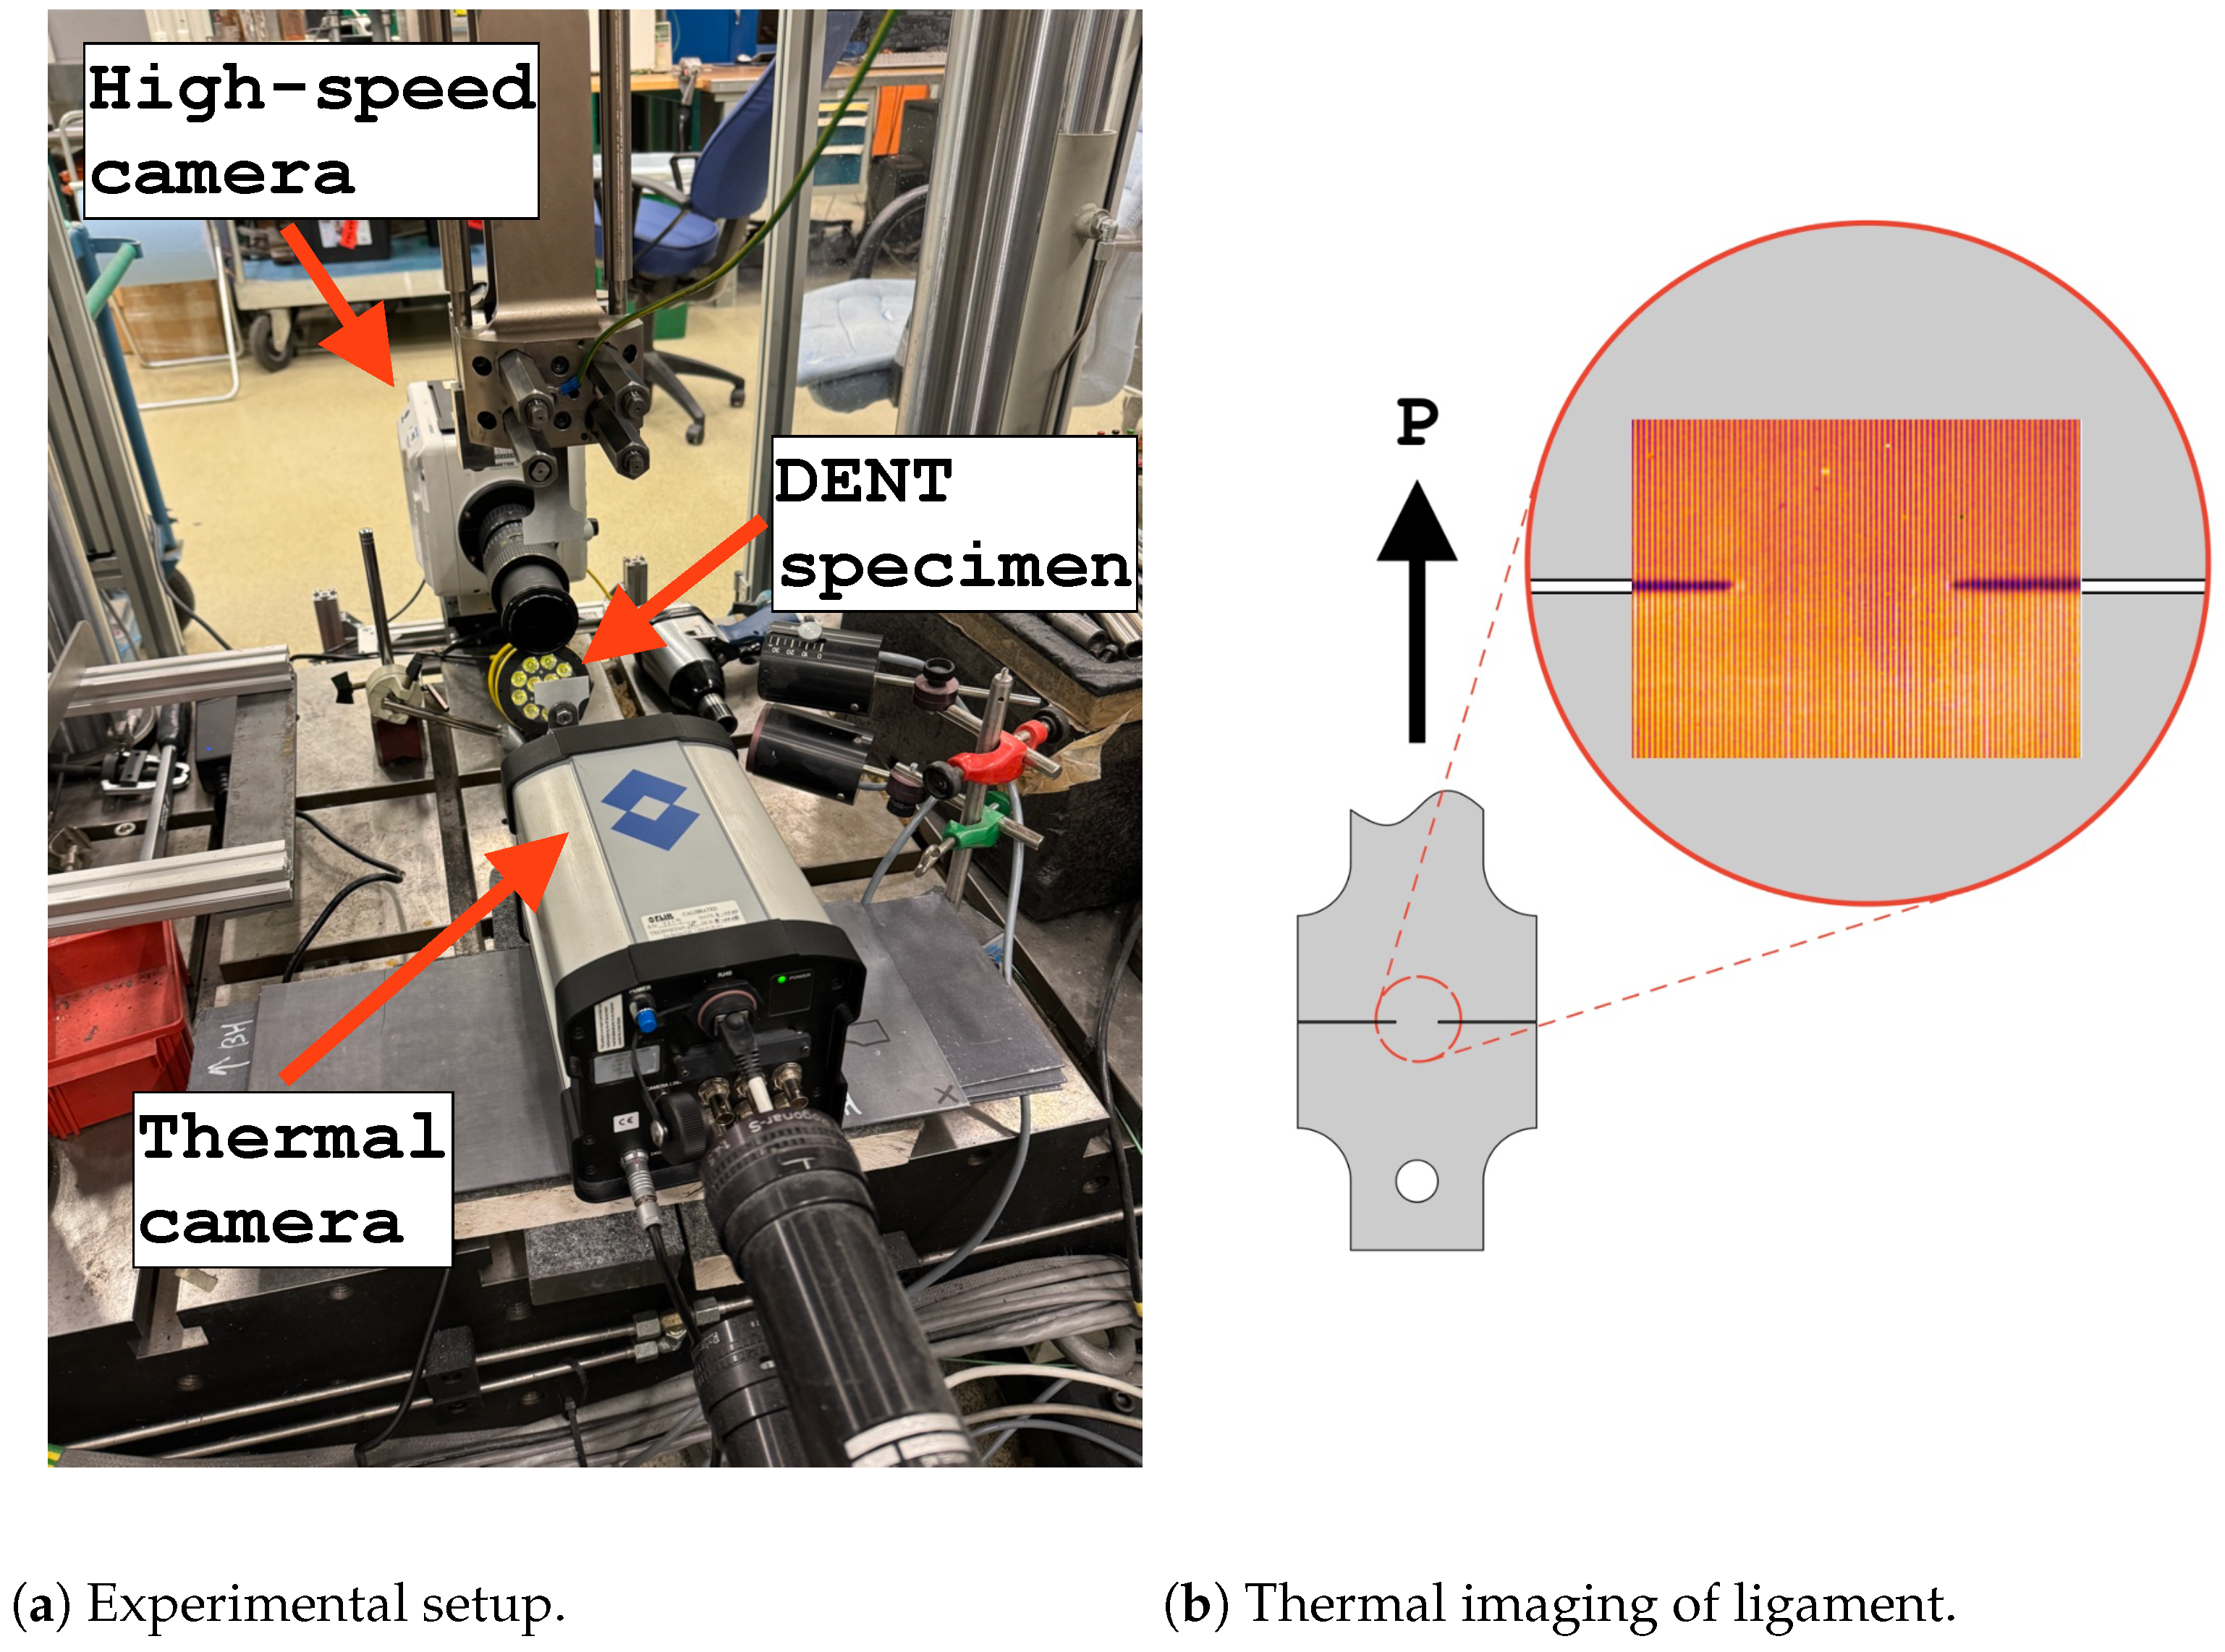
2.6. Temperature Measurements

The adiabatic heating was captured using a FLIR SC4000 HS-MWIR (FLIR Systems, Wilsonville, OR, USA) thermal camera and was equipped with a 50 mm lens together with macro rings. The camera was configured using the commercial Therma-CAM® Researcher Professional 2.8 software to capture images of 160 × 120 pixels at 700 frames per second. No effort was made in syncing with the high-speed camera and DIC because of the limited frame rate of the thermal camera. Instead, the camera was manually operated to try to capture an instant of the fracture to obtain an estimate of the temperature increase in the fracture zone. The setup for the thermal measurements and the studied area of the ligament is presented in Figure 5. Some experimental trials were first performed on both grades to tune the methodology. An estimated temperature range needed to be set for the thermal camera before the experiment, and here calibrated intervals from the camera manufacturer were used. Since the exact temperature increase was not known beforehand, the temperature interval was initially set to a lower range and progressively increased when needed. The evaluated DENT samples were uncoated and a tabled emissivity value of 0.97 was used. This must be used with caution, since the emissivities change with wavelength and surface conditions, and it is not clear how the tabled values were measured. To perform a sanity check on the emissivity values used, a temperature measurement was performed on the PHS 2000 specimen before fracture and checked against room temperature. The measured temperature for this sample was between 24 °C and 25 °C, which was deemed accurate enough for the purposes of this study. Furthermore, it was evident that the temporal resolution of the thermal camera was too low to capture the cracking of PHS 2000, and thus only a single test was performed to estimate the adiabatic heating after the fracture.

3. Results

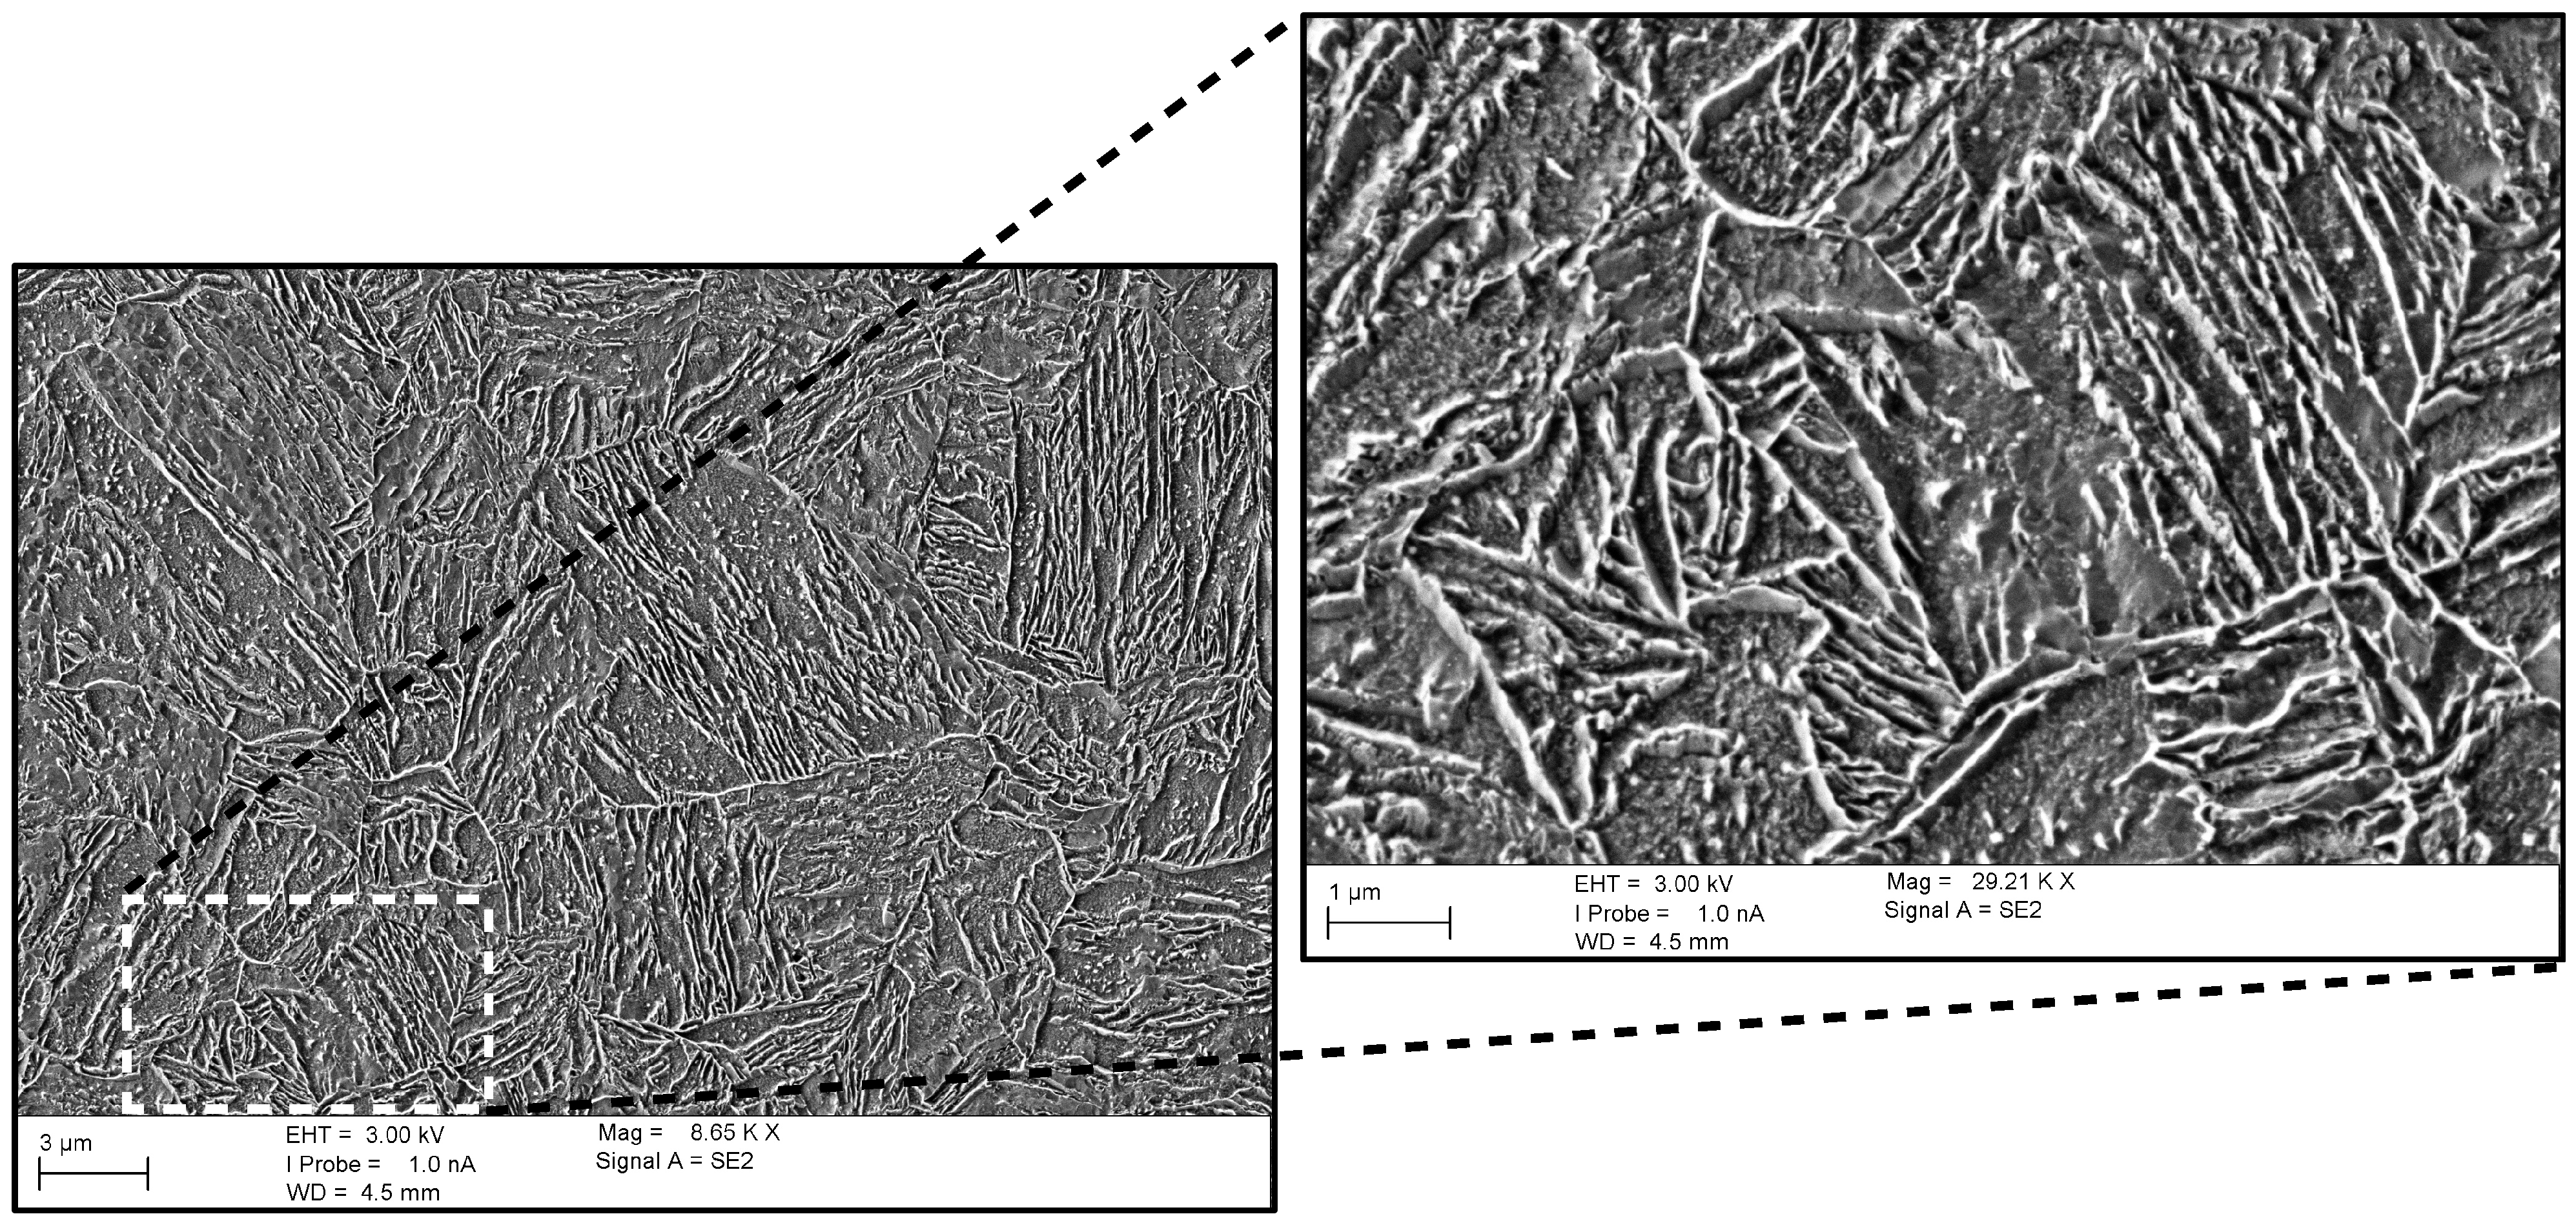
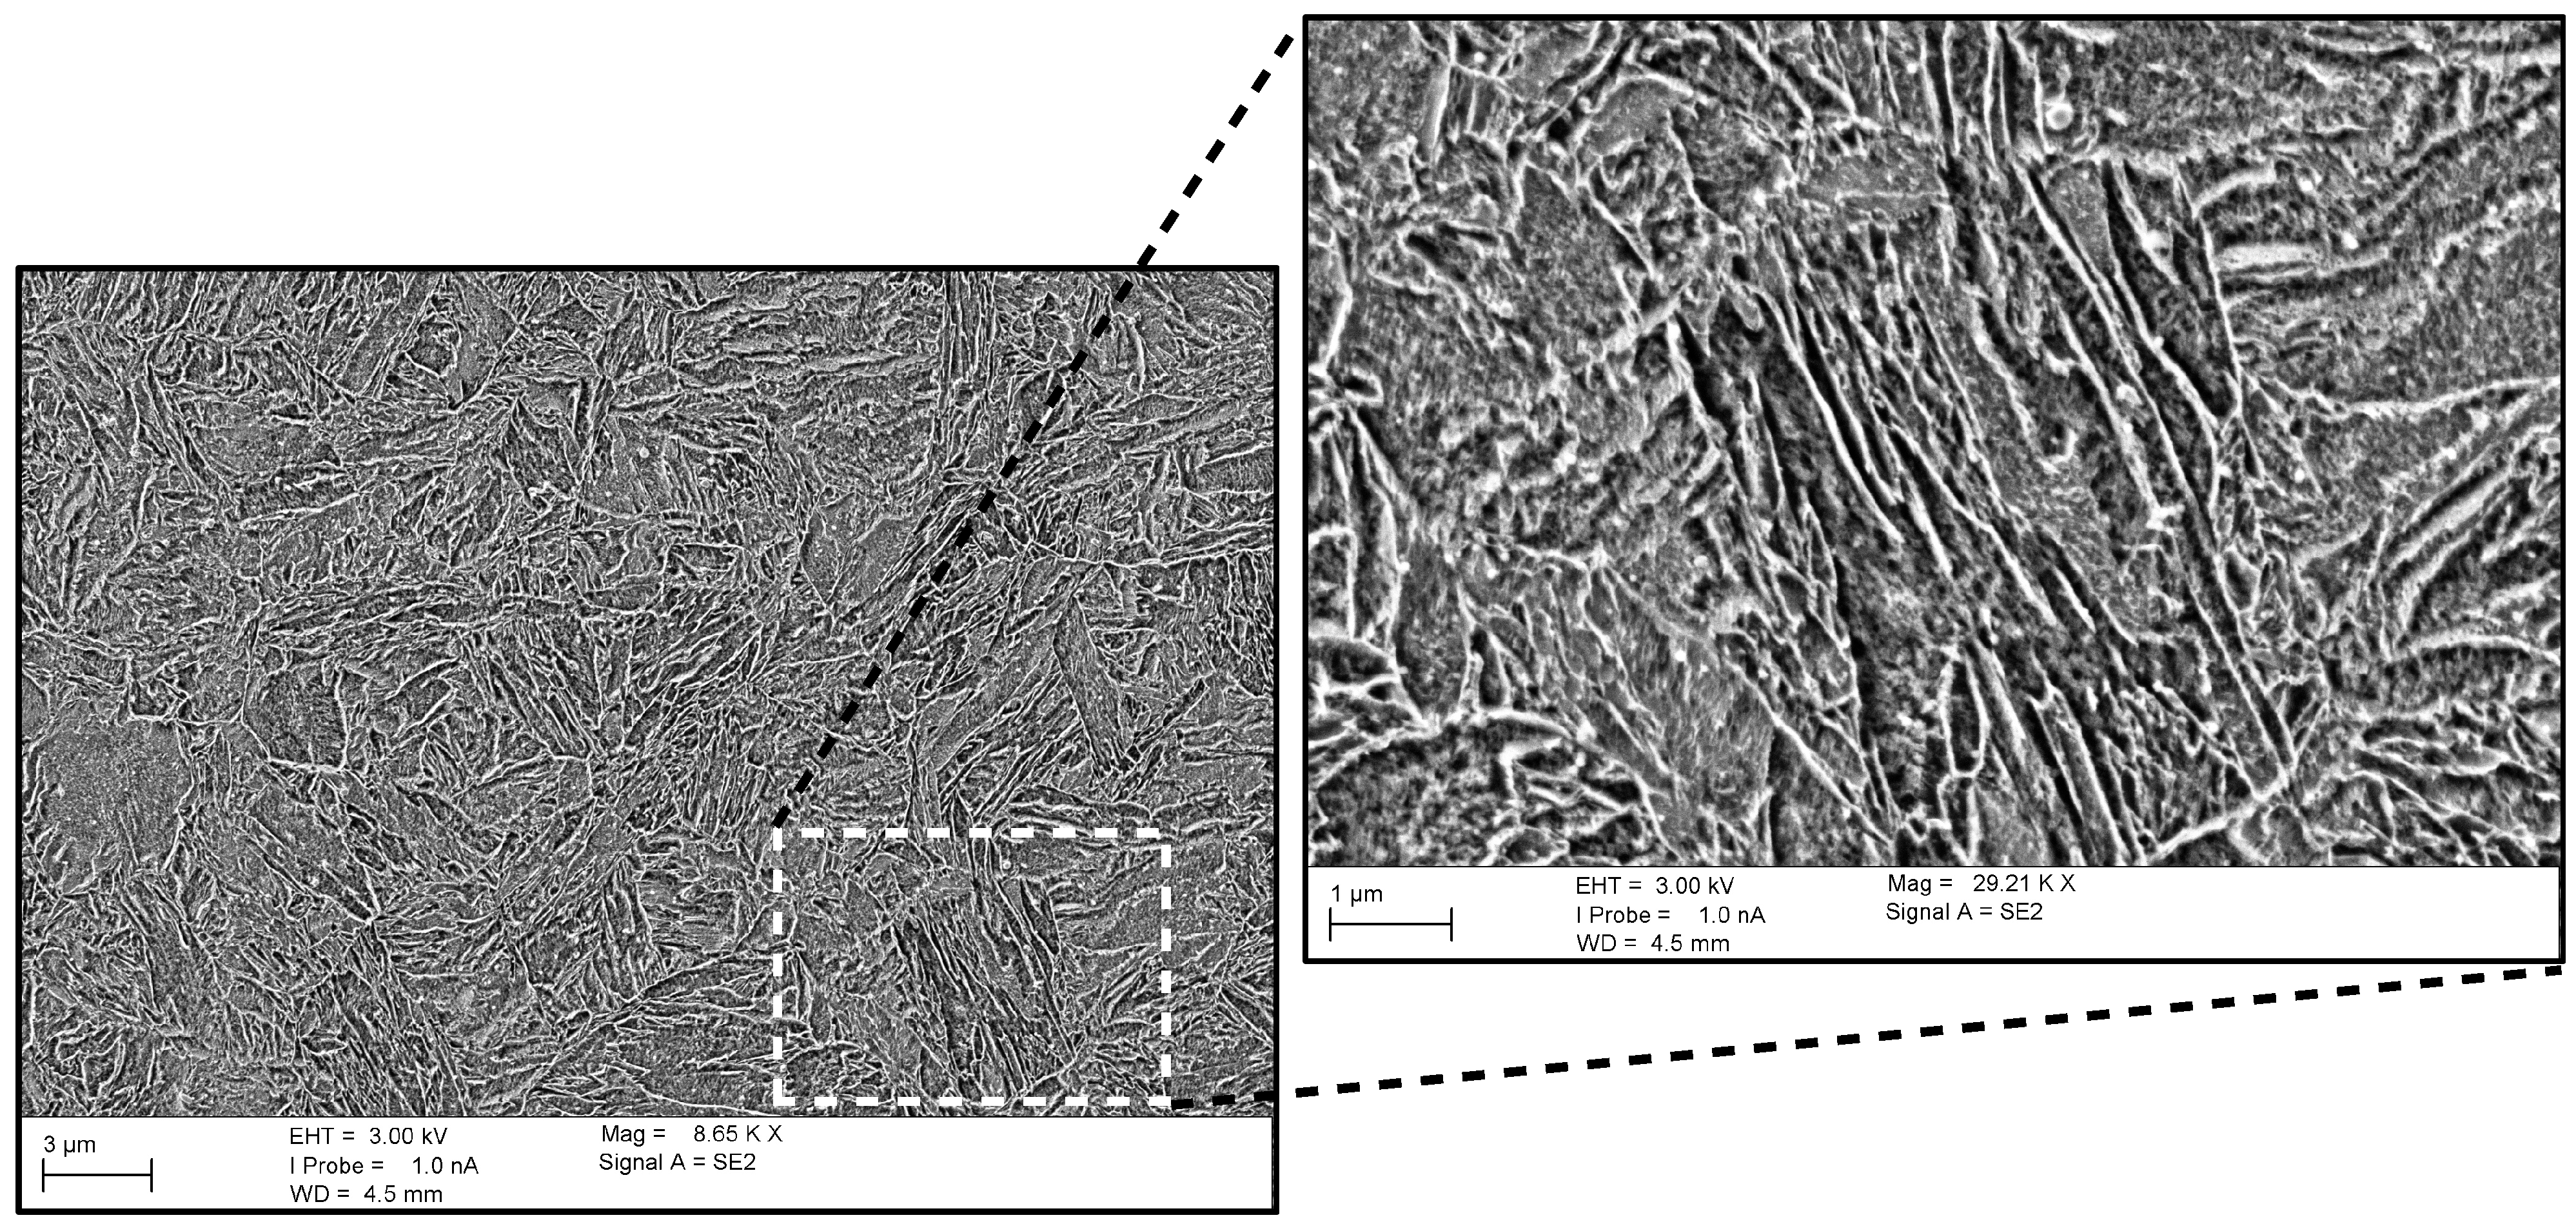
3.1. Microstructure and Hardness Measurements

The microstructure for PHS 1000 and PHS 2000 are presented in Figure 6 and Figure 7, respectively. The average Vickers hardness results from the micro indentation testing using 0.5 kg force are presented for each grade in Table 2. The average is taken from 10 points, each with a dwell time of 10 s, and the low standard deviation shows that the scatter in the measured hardness is low. The extremely high hardness of 602 HV0.5 for PHS 2000 indicates that the microstructure is fully martensitic. Comparing the PHS 1000 hardness of 364 HV0.5 and the SEM image of Figure 6 with previously published results for a steel with similar chemical composition (low carbon, high niobium), where the hardness was coupled with microconstituent volume fractions [42], the microstructure of PHS 1000 should be mainly martensitic. Similar results have also been presented for similar grades (both 1000 MPa and 2000 MPa UTS) for higher cooling rates [43].

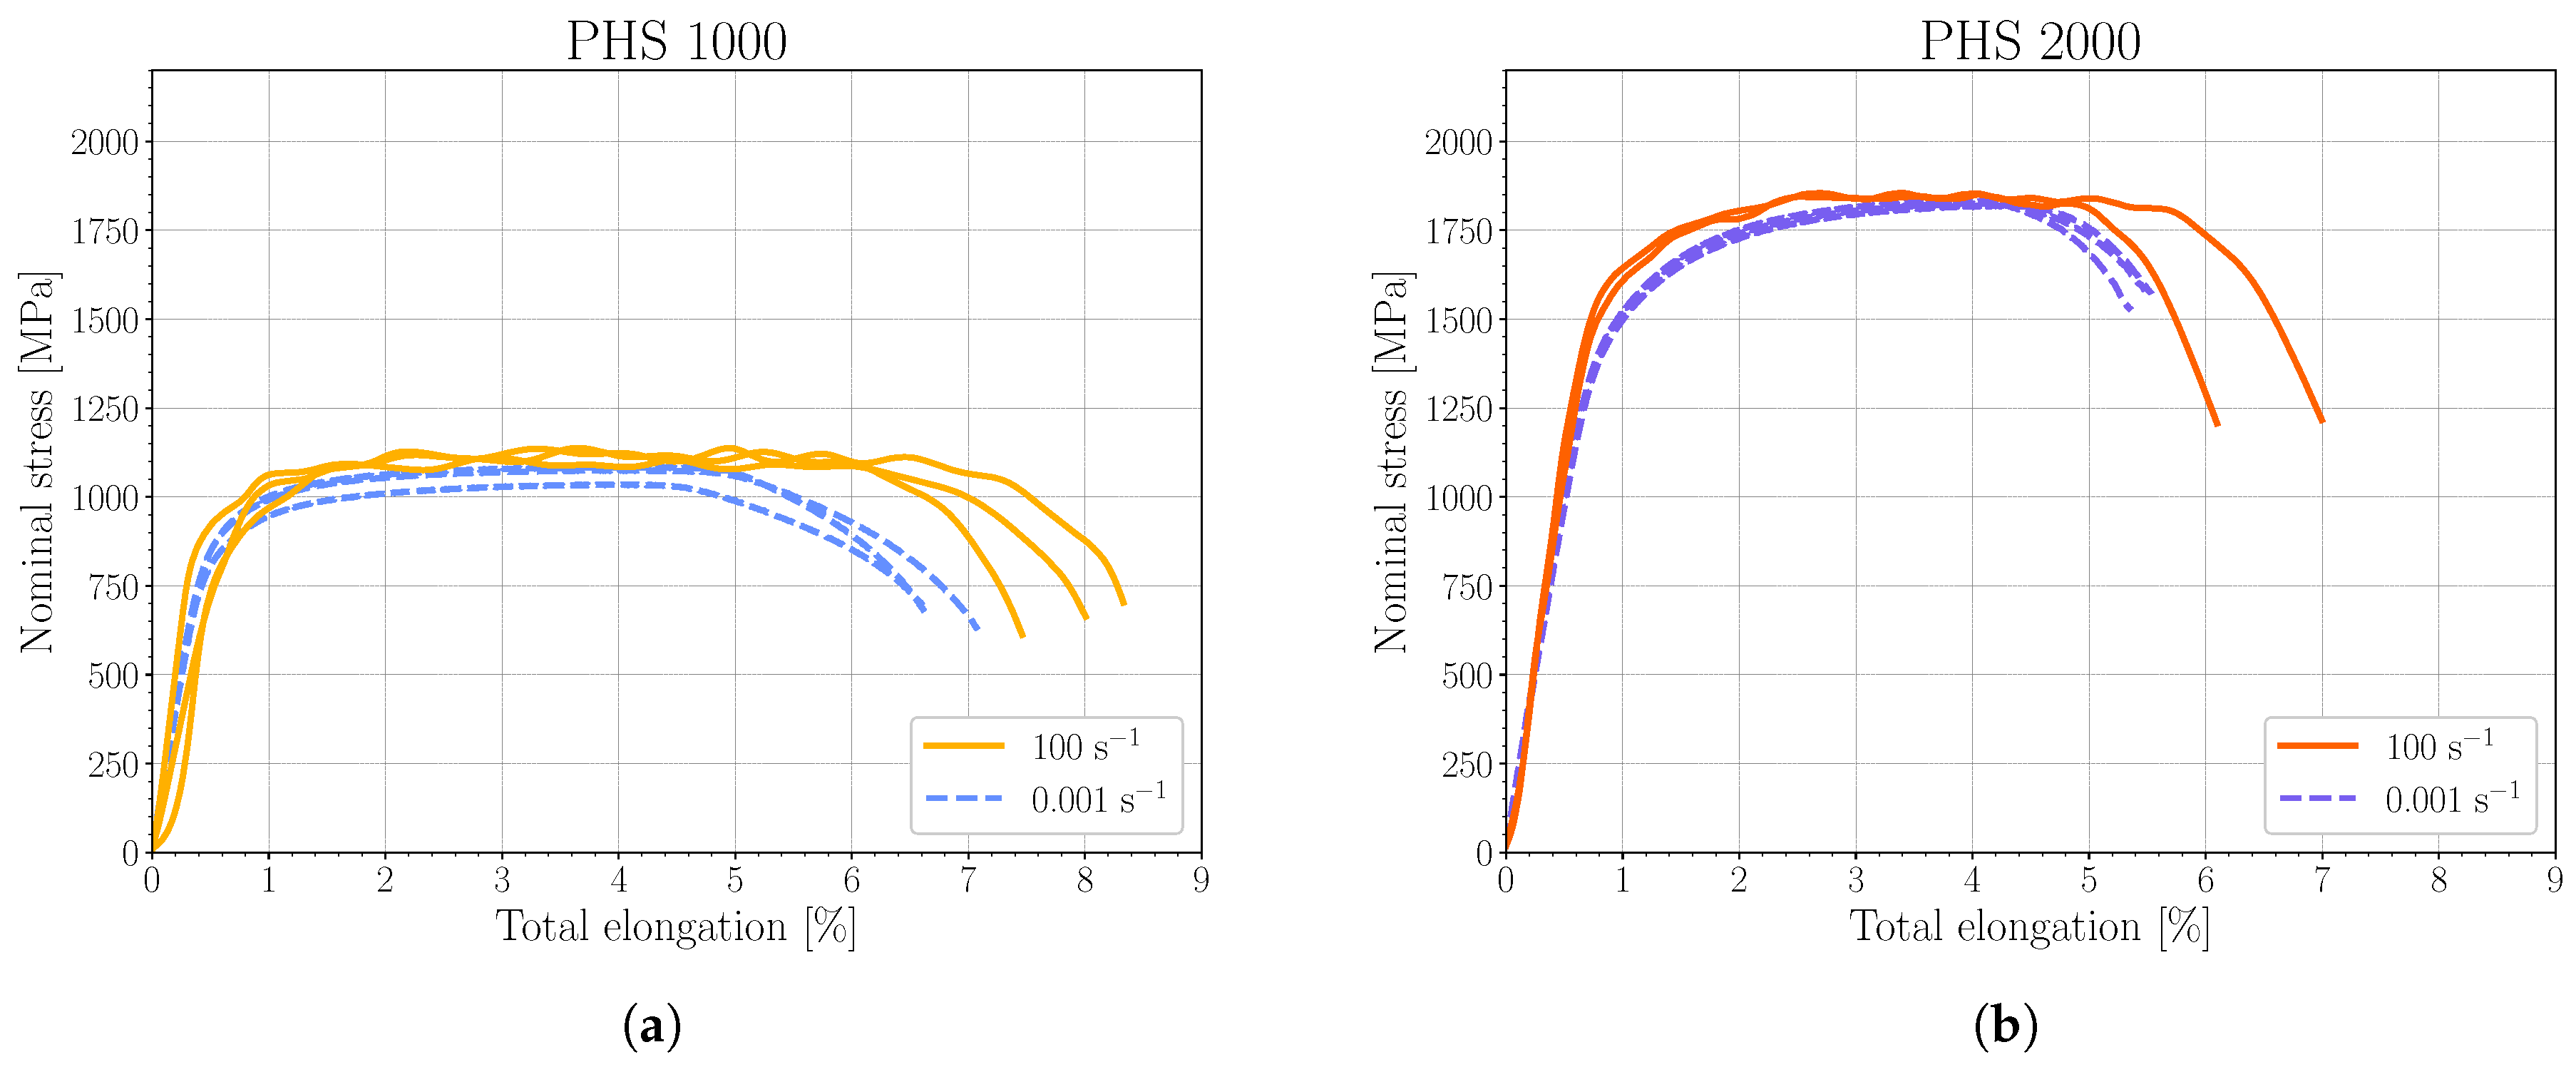
3.2. Uniaxial Tensile Tests

The nominal stress and elongation curves for the two PHS grades are presented in Figure 8 and the conventional uniaxial mechanical properties are presented in Table 3. There is a small increase in both YS and UTS for both grades with increasing strain rate. The total elongation to fracture (TE) is similar for the two steel grades but appears to increase slightly with strain rate, while the YS to UTS ratio is unchanged for PHS 1000 and increases for PHS 2000. For reference, the product of UTS and TE, representing a combination of strength and ductility, is also calculated for the two steel grades. The significantly larger UTS of PHS 2000 compared to PHS 1000 and the similarity in TE lead to a significantly higher value for PHS 2000. Due to the increase in UTS and TE with the strain rate for both grades, UTSxTE increases with the loading rate by more than 20%.

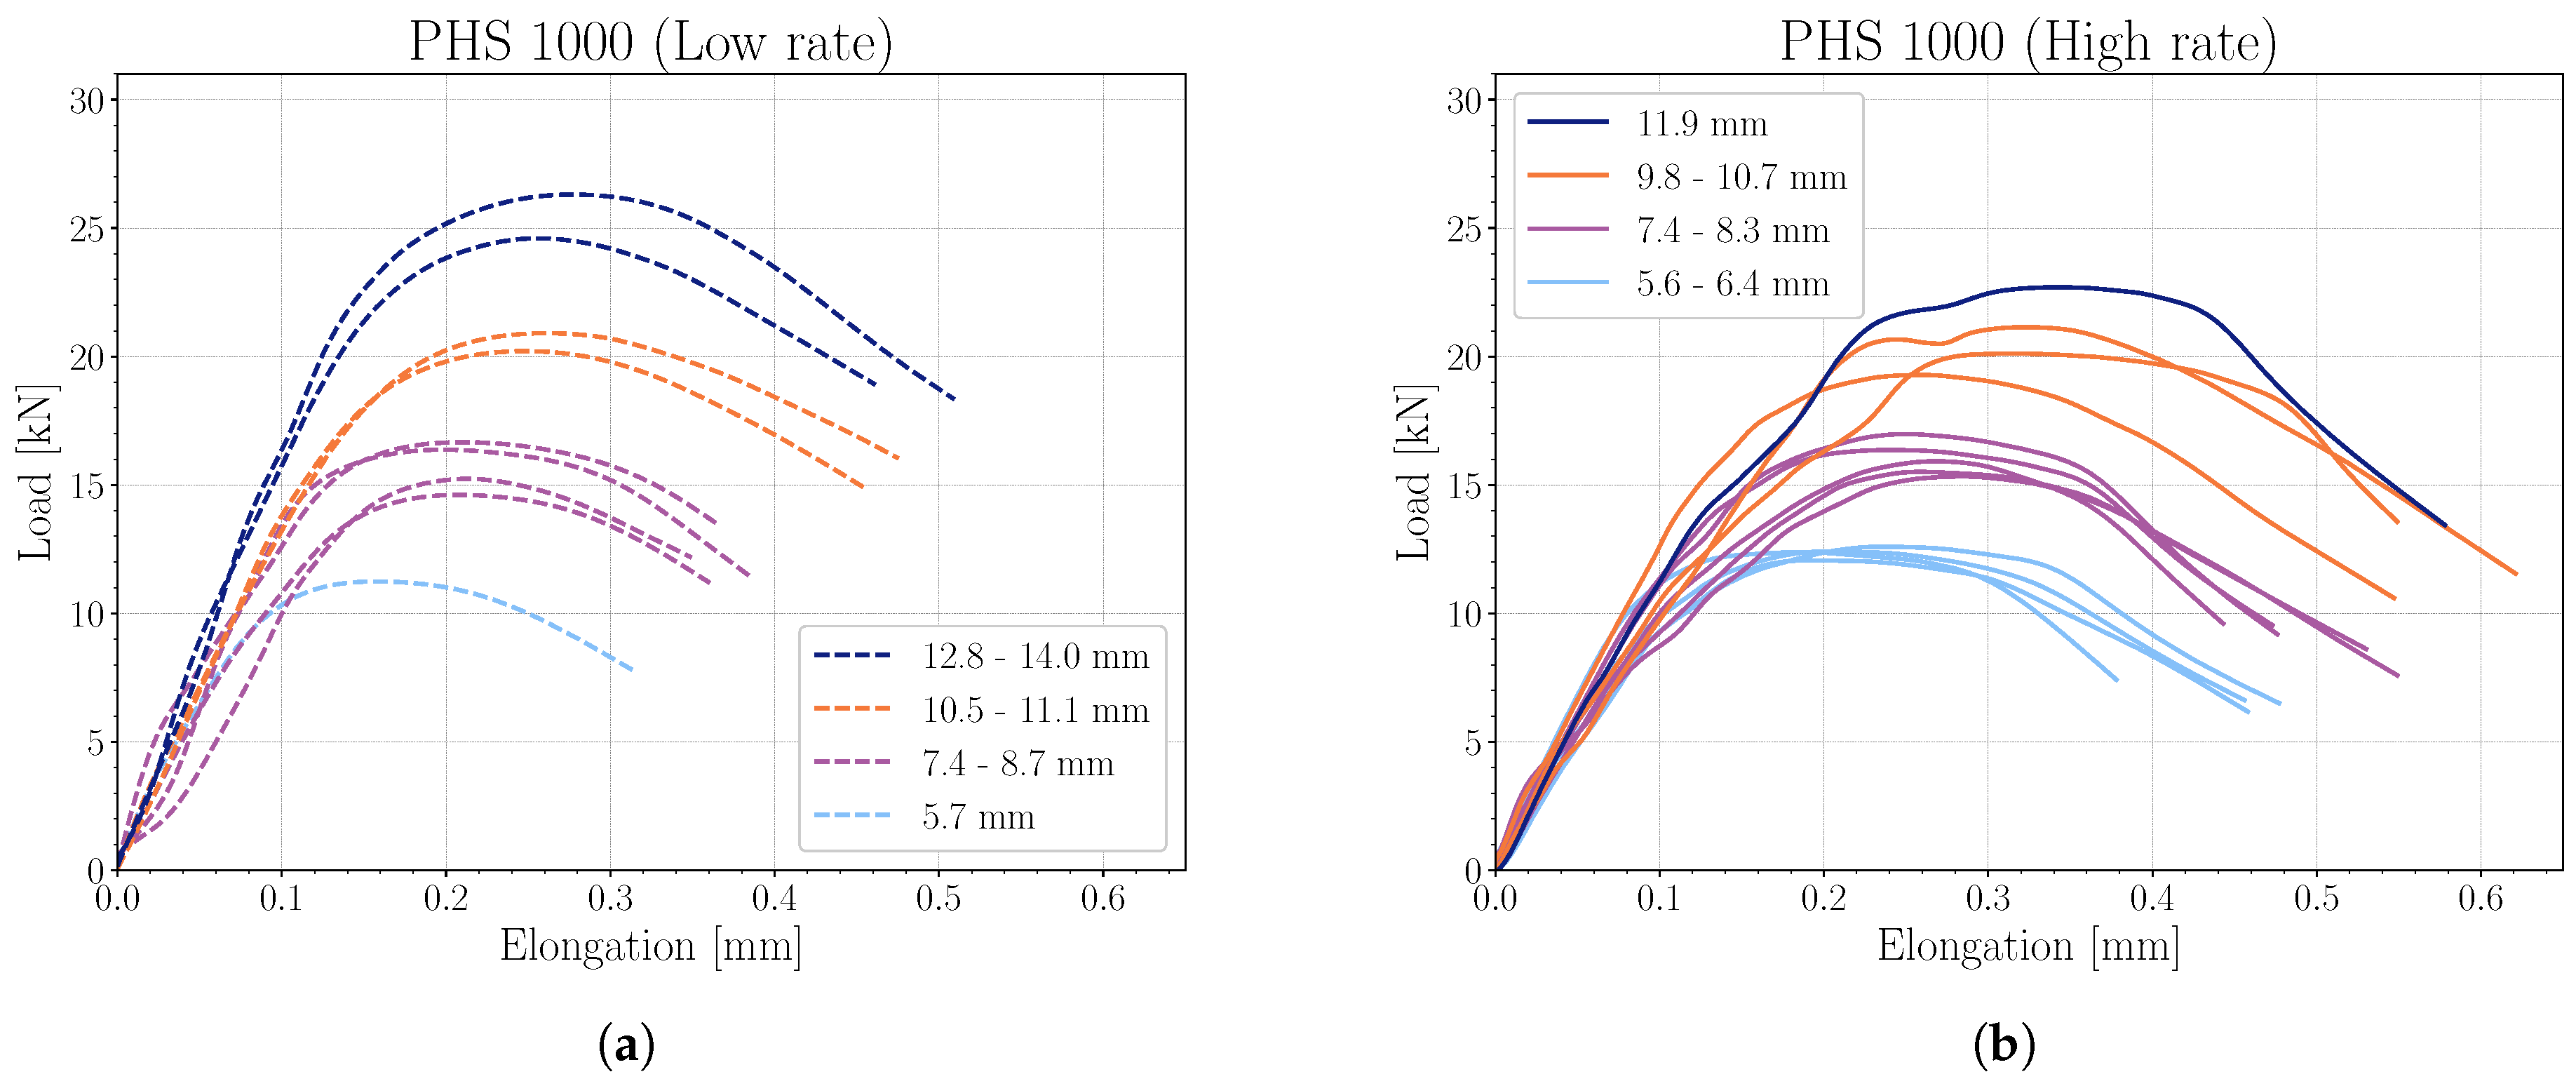
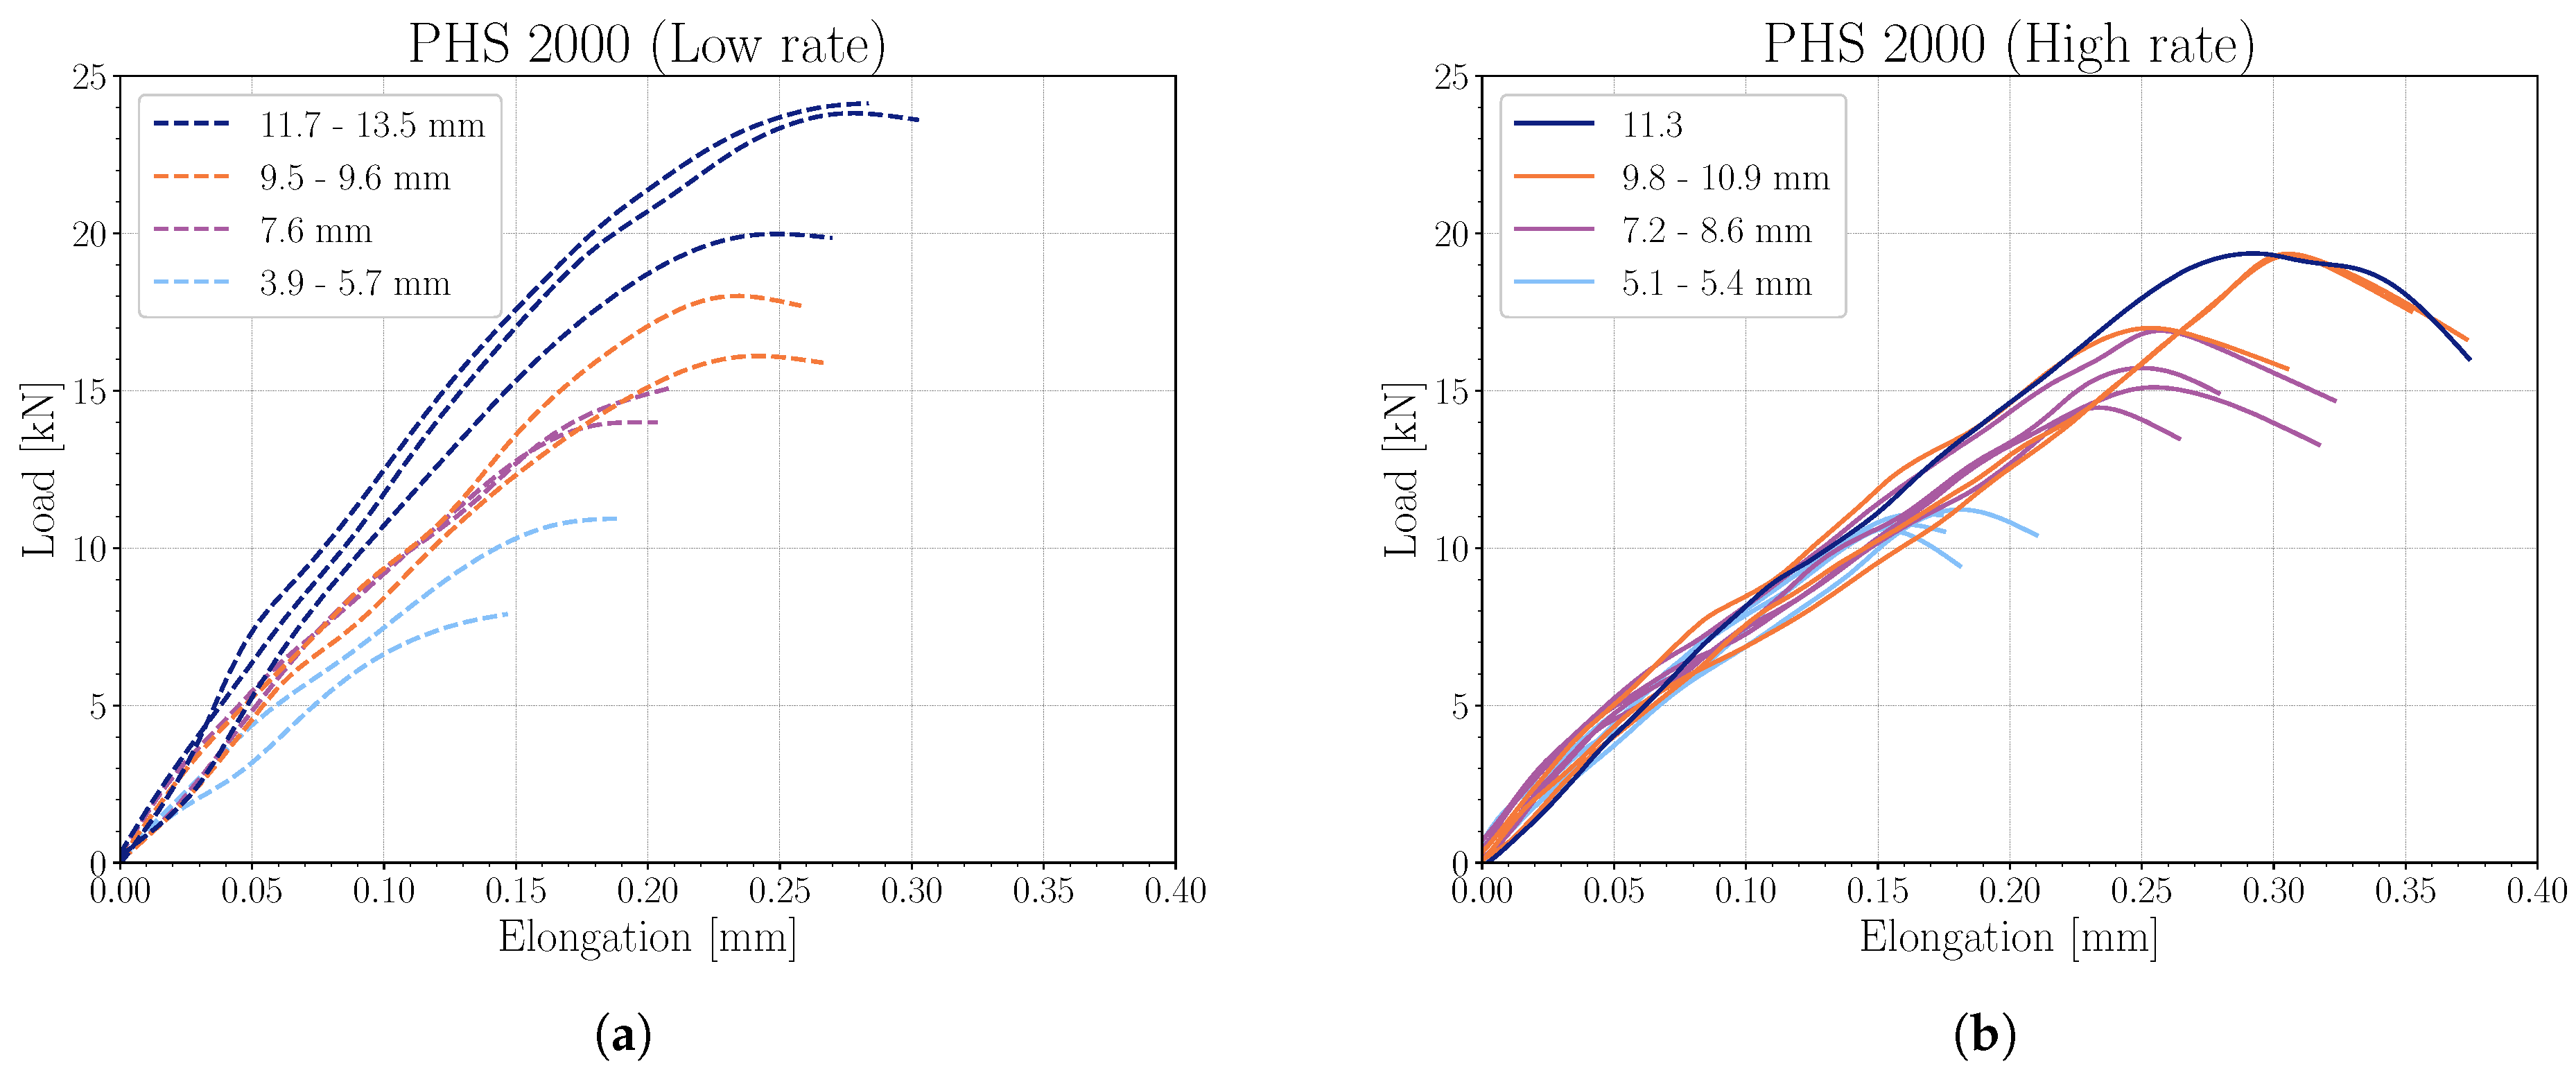
3.3. Essential Work of Fracture

The load–displacement curves for each DENT specimen are presented in Figure 9 and Figure 10 for PHS 1000 and PHS 2000, respectively. The solid lines correspond to the higher loading rate results, while the dashed lines illustrate the quasi-static results. Starting with the quasi-static loading rate, PHS 1000 is significantly more ductile than PHS 2000, which exhibits a quasi-brittle behaviour characterised by a fast unstable fracture shortly after the peak load. The crack propagation energy is therefore low for PHS 2000, while it is significantly larger for PHS 1000. When the loading rate increases, the post-peak area under the load curve increases for PHS 1000, which in turn increases the fracture energy. For PHS 2000, the largest difference between the quasi-static loading rate and the higher loading rate is that the slope changed with ligament length in the quasi-static case while it stayed consistent for the higher loading rate. The post-peak crack propagation is similar for both loading rates with a rapid final fracture process.
The EWF results obtained by integrating the stress–elongation curves adapted from Figure 9, Figure 10 are presented in Figure 11 with the regression line and a 95% confidence interval to determine the spread in the extrapolated fracture toughness value. The resulting fracture toughness value w e and the maximum ligament stress σ Max (defined as the maximum load divided by the nominal ligament area) are presented in Table 4. The experimental scatter is naturally larger at the higher loading rates, as has also been stated by others [29]. However, scatter is also significant for quasi-static loading rates, especially for PHS 1000. Thus, the difference in fracture toughness between the two grades cannot be determined within 95% confidence of these results. However, fracture toughness increases significantly with increasing strain rate for PHS 1000. The rate dependence of the fracture toughness value for PHS 2000 is statistically indeterminable from the EWF results due to the wide spread in the confidence interval. The maximum nominal ligament stress increases slightly for PHS 1000, while no clear difference can be determined for PHS 2000.
The von Mises strains measured in the ligament section introduced in Figure 4 are presented in Figure 12 for the two PHS grades. The moment when the crack started to propagate was estimated from the captured images. Since more images were captured during the high-rate tests compared to the low-rate tests, and a higher zoom was used, it became easier to identify crack initiation for the former tests. The curve indicating the fracture is the measured strain in the ligament section obtained from the final image just before the fracture. Since the temporal resolution is naturally higher with the high-speed camera, there are facet losses close to fracture in the measure section at the higher loading rate for PHS 1000, where crack propagation is significant. Thus, a measurement before facet losses is made to complement the high-speed results. With this limitation in mind, the deformations do not appear to change much with the loading rate for PHS 1000. Unsurprisingly, the local strains in the ligament are larger for PHS 1000 than for PHS 2000. Interestingly, the strains do not appear to change much with the loading rate for PHS 1000, although facet losses close to the final fracture make strain estimations difficult, especially between normalised section lengths between approximately 0.2 and 0.6 in this case. The ligament von Mises strain for PHS 2000 doubled in magnitude with increasing strain rate.
To further investigate the influence of necking on the strain rate, the thickness strains for the two grades are presented in Figure 13. The thickness strain at crack initiation (i.e., at the crack tip) increases with loading rate for both PHS 1000 and PHS 2000. At stable crack propagation (≈0.4–0.5 mm from the crack tip) the thickness strains are similar for both loading rates for PHS 1000 while slightly larger in the case of the higher loading rate for PHS 2000.
Figure 14 shows the nominal stress–displacement curves of a DENT specimen for PHS 1000 (left figure) and PHS 2000 (right image) together with the average ligament strain rate (as specified in Figure 4). The strain rate is not constant during deformation and is both larger in magnitude and increases faster for the more ductile PHS 1000 grade compared to the quasi-brittle PHS 2000 grade. The strain rate also increases significantly close to the maximum load (around the time the crack starts to propagate), and since PHS 2000 lack any significant crack propagation energy, the strain rate remains lower for most of the deformation.

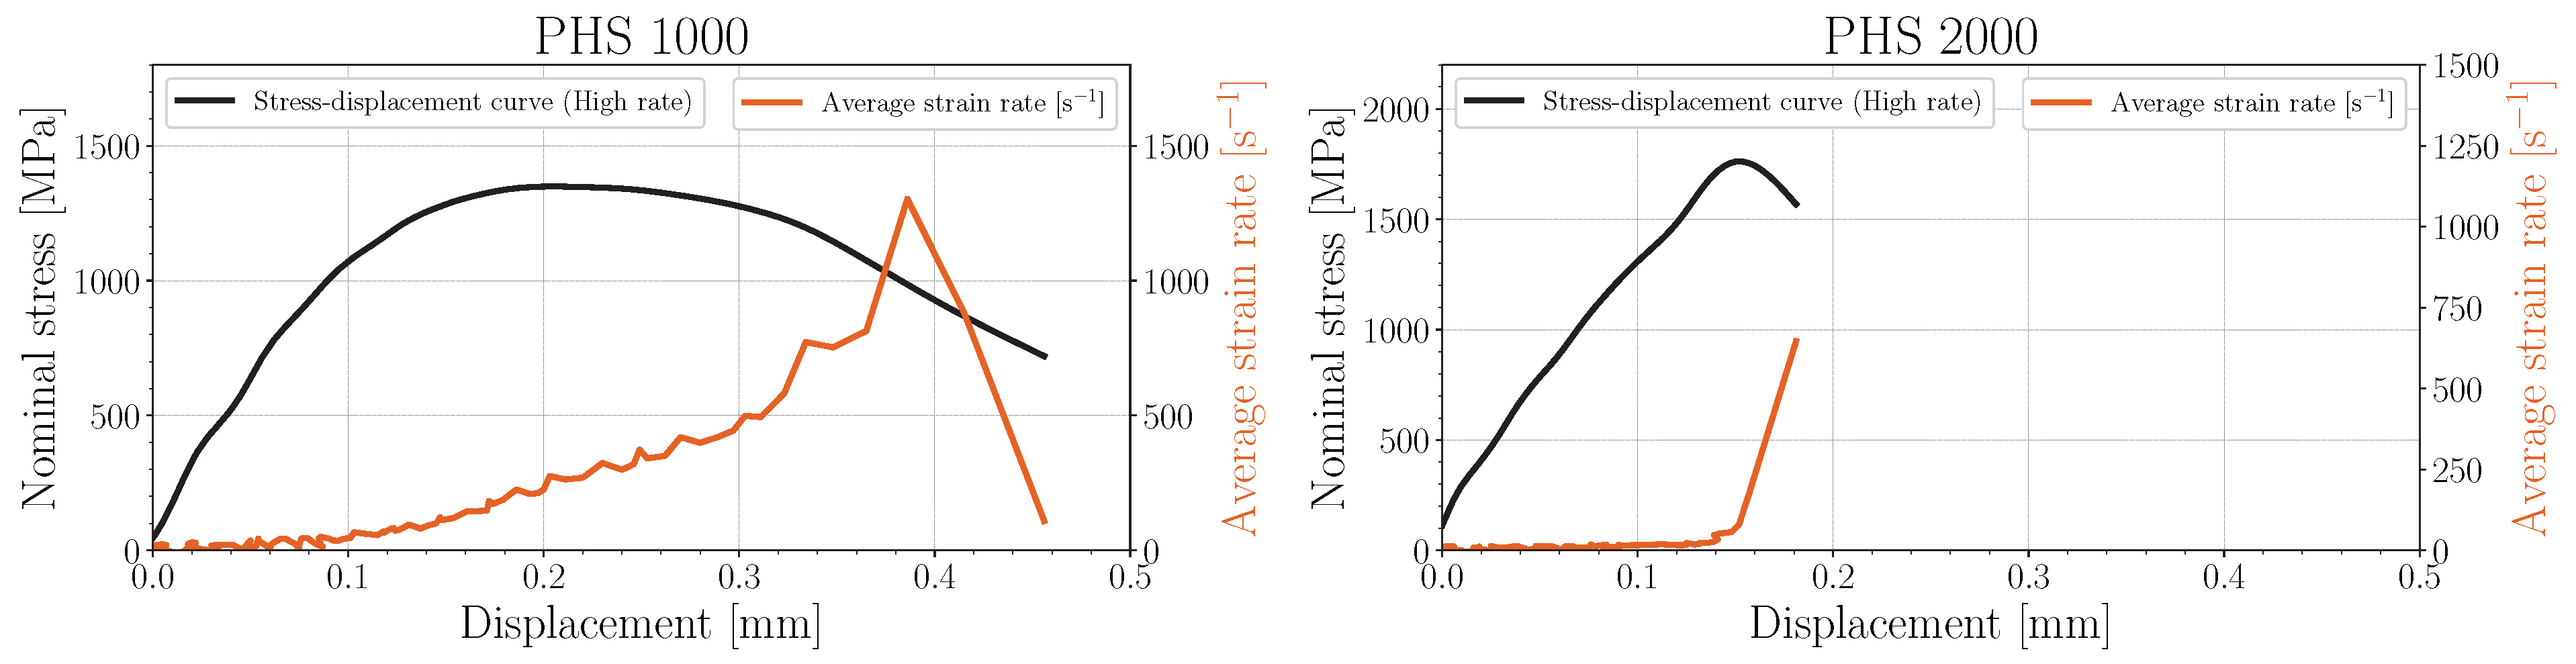
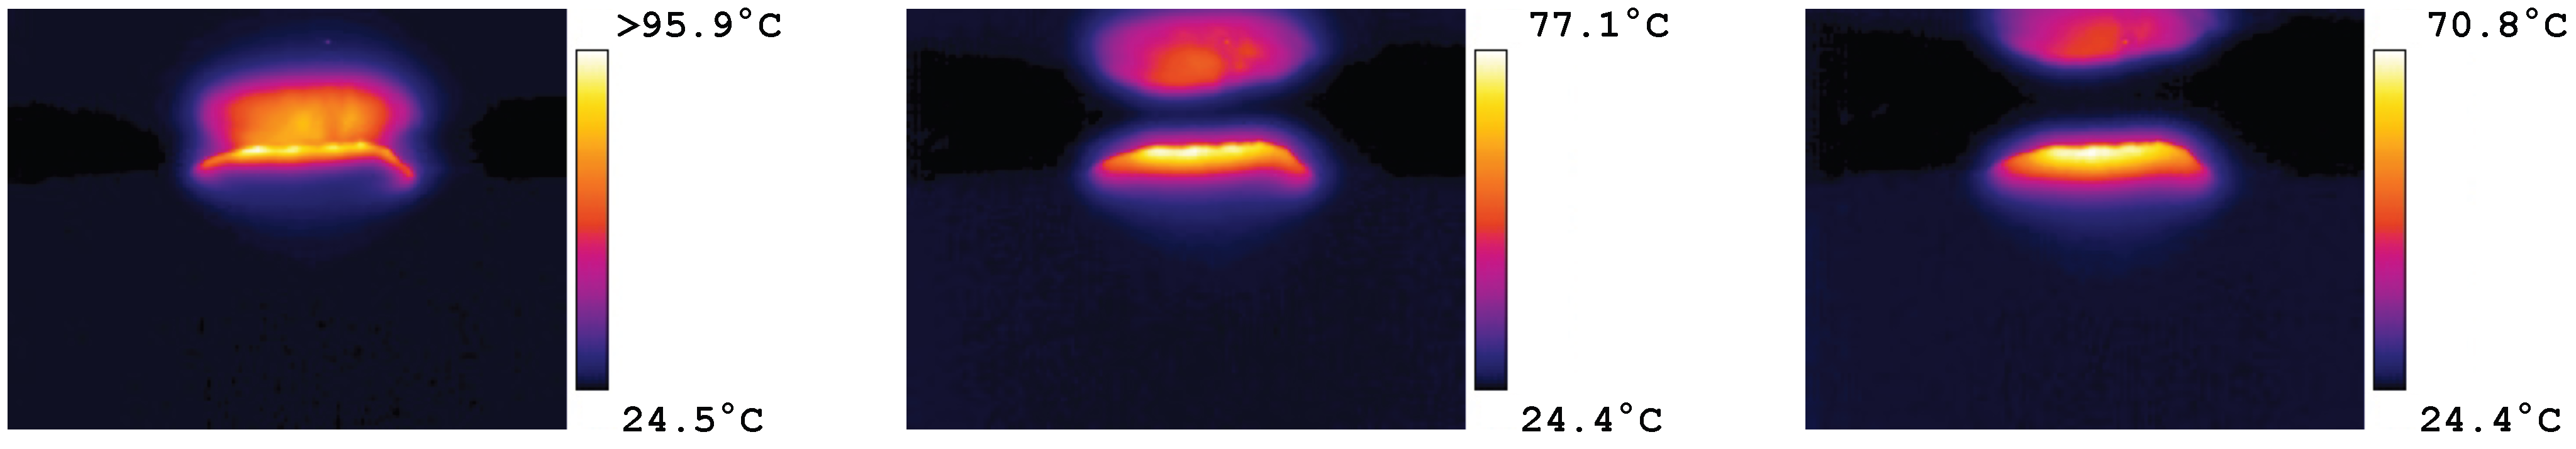
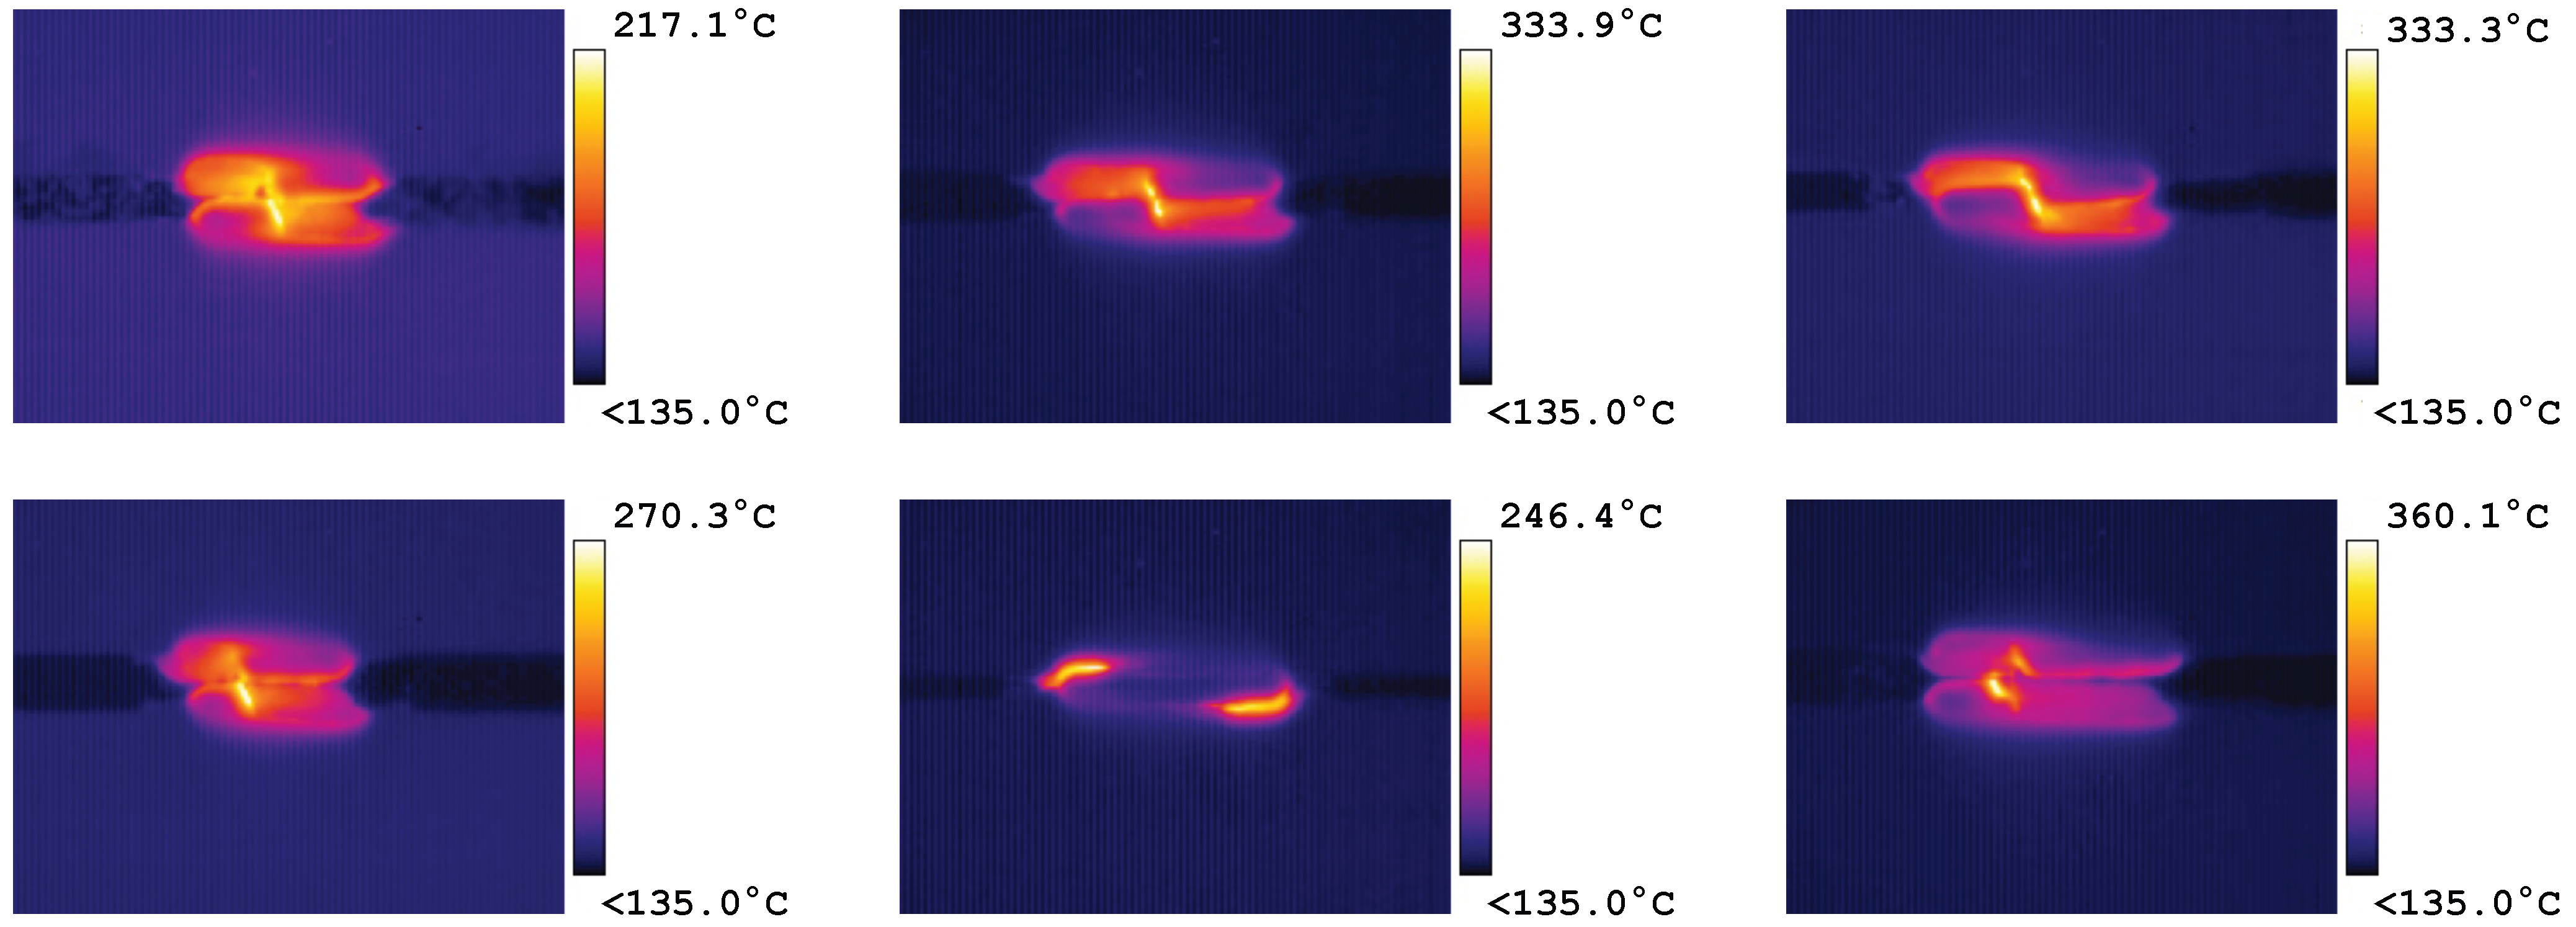
3.4. Thermal Measurements

Figure 15 shows results from initial trials on PHS 2000 with three consecutive thermal images after fracture. It is evident that there is a significant increase in temperature in the fracture zone for this grade. The fracture of the PHS 2000 was deemed too sudden to capture the propagation of the crack and the temperature was measured after the complete fracture. The temperature quickly decreased after the fracture.
Figure 16 shows the temperature field measurements for a set of DENT ligaments for PHS 1000. Due to the higher ductility, it was easier to capture the fracture for this grade. A higher temperature interval was chosen for this grade, and the results show a significant increase in temperature in the fracture zone. Since local strain rates in this zone can reach extremely high values [29], this is not surprising.

4. Discussion and Conclusions

The conventional uniaxial tensile properties such as YS and UTS showed a moderate increase with increasing strain rate for the loading rates tested. This is in accordance with other works for this strain rate range for boron steel grades [44,45]. In contrast to uniaxial plasticity, fracture toughness increases significantly with increasing loading rate for PHS 1000. The rate dependence of fracture toughness for PHS 2000 could not be determined with significant confidence from the EWF method alone due to the large experimental scatter for the high-rate results. This scatter has previously been pointed out by other authors [29] and is in part due to the low temporal resolution when the crack starts to propagate. This leads to difficulties in capturing the last point before fracture when evaluating the specific work of fracture and was particularly evident for PHS 2000 which had an extremely fast fracture process for both the low rate and high rate results. However, higher loading rates also make self-similarity of curves, necessary for the EWF method to be valid, difficult, especially at higher loads. Thus, a larger set of tests is necessary to gain EWF fracture values with less uncertainty at higher loading rates compared to the quasi-static case. Although experimental scatter introduces uncertainty in the determination of fracture toughness to the extent that a direct comparison between the two PHS grades is difficult from the EWF plots alone, the fracture behaviour of individual DENT samples was distinctly different. PHS 1000 was more ductile with a larger specific work of fracture than PHS 2000 due to a larger crack propagation energy. The fracture of PHS 2000 had a quasi-brittle characteristic with a low crack propagation energy, which is not surprising because of the fully martensitic microstructure and high Vickers hardness. Thus, it is reasonable to assume that the fracture toughness is lower for PHS 2000 compared to PHS 1000. This is also aligned with previously published results by Golling et al. [24] where mainly martensitic microstructures with high hardness had lower fracture toughness values. From the DENT load curves, it is also reasonable to assume that this increase is mostly related to the increase in crack propagation energy but is also partly due to the increase in ligament stress with increasing strain rate. This could only be verified for PHS 1000 due to the large spread in ligament stresses for PHS 2000.
Comparing the EWF results in the current study with previously published proposed classification diagrams where fracture toughness is plotted against UTS [18], both the low- and high-rate EWF values of PHS 2000, 96 kJ/m2 and 93 kJ/m2, respectively, fit right at the lower end of the PHS section. For PHS 1000, the low-rate EWF value 186 kJ/m2 places it in the upper region of TRIP and quenched and partitioning (Q&P) steels while the high-rate result of 371 kJ/m2 puts it in the complex phase, twinning-induced plasticity (TWIP) and some grades of PHS. A good correlation has previously been found between the fracture toughness of steel sheets and crash resistance (e.g., crack formation and energy absorption) [21]. It is thus tempting to conclude that high-strain-rate scenarios (e.g., crash) can rapidly increase the crashworthiness of the material. However, it is important to note that energy absorption of a structural component is a complex interplay of several different factors, such as geometry, load case, material strength and also local heating effects. For example, Xia et al. [46] performed punch and drop weight impact tests on an AHSS grade and found that energy absorption actually decreased slightly with increasing loading rate, which was attributed to softening of the material due to adiabatic heating effects. Without making a side-by-side comparison of different crash structures loaded at different loading rates and comparing the results to fracture mechanical testing, the impact of a rapidly increased fracture toughness is difficult to make from a design perspective. However, from this study, it is reasonable that the most rate-sensitive grades already have a high fracture toughness value for quasi-static loading rates, and thus a similar trend can be expected for higher loading rates. Automotive designers should therefore choose grades with high fracture toughness with positive rate dependence for structural parts intended for energy absorption, such as front-side members in a vehicle. This potentially allows for weight reduction because thinner PHS sheets with higher strength and high fracture toughness could replace thicker ones. However, a more detailed study should be performed comparing the rate effects of fracture toughness tests and full-scale components to properly investigate the convoluted interaction between rate-dependent parameters involved in a crash.
Since EWF has a significant contribution from necking [39,41], the thickness strains of the fracture ligament were evaluated to investigate if this had a connection to the rate dependence of fracture toughness. The thickness strain close to the crack tip (i.e., thickness strain at crack initiation) increased for both grades with increased loading rate. For PHS 1000, the thickness strains increased when moving away from the crack tip, while they remained constant for the high-rate sample. At stable crack propagation (usually chosen 0.4–0.5 mm from the crack tip [18]), the thickness strains are similar for both loading rates. For PHS 2000, the thickness strains were mostly constant from crack initiation to crack propagation and were slightly higher for the higher loading rate. However, it is important to note that the results presented are based on one specimen for each grade, and the experimental scatter can be significant. Considering this, it is questionable whether the increase in thickness strain at stable crack propagation for PHS 2000 is significant. Furthermore, both steel grades showed a larger thickness strain at crack initiation for the higher loading rate, but only PHS 1000 had a significant increase of fracture toughness with increased loading rate. Thus, no clear connection could be found between the increase in fracture toughness and the thickness strain (i.e., necking). The ligament strains measured with DIC showed similar results for PHS 1000 for both loading rates, while strains doubled in magnitude for PHS 2000 with increased loading rate. Thus, no clear trends coupled with the fracture toughness values determined earlier could be made from ligament strains measured using DIC either.
The average strain rate measured for the two PHS grades showed some interesting results. It is clear that the ligament strain rate gradually increases when the ligament starts to deform plastically and continues to increase rapidly when the crack starts to propagate until the final fracture. More ductile steel grades, such as PHS 1000, thereby show larger strain rates in the ligament. More quasi-brittle grades, such as PHS 2000, with low local ductility and barely any crack propagation energy will reach high strain rates only close to final fracture. This reiterates the difficulty of coupling a fracture toughness value measured with EWF to a specific strain rate, as it depends on how it is defined [29]. Thus, it is up to debate whether the two PHS grades are even evaluated at the same loading rates and if the evaluation of the EWF values is directly comparable. However, it is clear that the local strain rates when the crack starts to propagate can reach orders of 1000 s 1 which is fast enough to introduce significant adiabatic heating of the material which can affect the fracture resistance. Thus, adiabatic heating was studied by incorporating a thermal camera and the results showed that there was a significant increase in temperature during the fracture process for both PHS grades, but significantly higher for the more ductile PHS 1000 grade. PHS 1000 reached temperatures of 360 °C, which could be compared to peak temperatures of 225 °C in drop weight impact experiments performed on a high-strength steel by Xia et al. [47]. When cracks begin to form, the adiabatic heating can therefore expect to increase significantly. Previously published work that simulated crash components using thermo-mechanical consititutive modelling without damage has shown quite moderate adibatic heating with peak temperatures about 75 °C [48]. However, future thermomechanical numerical models that involve damage evolution models should consider the significantly higher temperature increase when fracture occurs. Phenomenological crash models based on fracture toughness parameters must also consider the fracture toughness parameter at higher loading rates to be accurate.
The higher adiabatic heating for the more ductile PHS 1000 is not surprising, as it showed a significantly larger crack propagation after crack initiation, with the resulting shearing of the ligament leading to significant adiabatic heating [34]. It should be highlighted that accurate temperature measurements using thermal cameras are highly dependent on the thermal emissivity of the material surface. Since this value varies with material, surface roughness, and temperature, it can be difficult to obtain reliable measurements. In this study, a tabulated value for the emissivity of the surface was chosen that approximately captured room temperature on an unfractured sample. However, the measured temperatures in this work should be considered a conservative estimate and not accurate to the first decimal point, as presented in the software. A more careful study with a coating with a known emissivity (e.g., boron nitride) or tuning it in with thermocouples could give more accurate results. Furthermore, the temporal resolution of the thermal camera was low, so no effort was made to synchronise it with the DIC software (GOM ARAMIS 6.3). The proposed future work is to use a faster thermal camera and synchronise it with the DIC system and the load cell to track deformations and temperatures in parallel. This might allow more empirical relations to be calculated, such as the Taylor–Quinney coefficient over time, to check the fraction of plastic work that is converted into heat. More detailed tracking of the temperature during deformation and how it evolves with crack propagation would also be interesting. However, the fracture in a DENT sample is extremely fast at a loading rate of 0.5 m/s (the complete fracture process is of the order of a millisecond), and therefore a fast thermal camera is necessary. An alternative approach is to complement with a lower loading rate, for example a rate one tenth of the rate used here, since the local strain rates are likely still sufficiently high to produce significant adiabatic heating when the crack starts to propagate [29]. A more attractive and easily controllable experiment is to perform normally isothermal quasi-static tests at higher temperatures like a previously published article [32], where the fracture is measured more easily. The present paper can be used as a foundation for choosing this temperature in such an uncoupled experiment. Finally, the resulting fracture toughness at high loading rates probably depends on several competing parameters such as strain rate, adiabatic heating, process parameters, and microstructures. Much more research is necessary to isolate and check the influence of each of these properties. However, since the rate dependence of the plasticity parameters in this study was moderate for both materials, the main reason for the significant increase in fracture toughness for PHS 1000 is attributed to adiabatic heating and the resulting softening of the material during fracture.
In summary, although the material shows a low to moderate rate dependence in plasticity measured with conventional uniaxial tensile tests, it does not necessarily mean that the rate dependence is low for fracture toughness measured in frame of fracture mechanics. In case a material is intended for high loading rates scenarios, e.g., crash, it is therefore beneficial to evaluate the elastoplastic properties and fracture toughness under low and high loading conditions. After studying the uniaxial tensile properties and plane stress fracture toughness of the two PHS grades at low and high strain rates, the following conclusions can be drawn:
  • Both grades of PHS showed a moderate increase in YS and UTS measured in uniaxial tensile testing with increasing strain rate, while only PHS 1000 showed a significant increase in fracture toughness with increasing loading rate. No statistically determinable change in fracture toughness could be resolved using the EWF methodology for PHS 2000.
  • Both grades showed a significant increase in temperature due to adiabatic heating during the fracture of the DENT specimen, but the temperature for the more ductile PHS 1000 grade increased significantly more. The increase in adiabatic heating might be the cause of the increase in fracture toughness with strain rate in this case. However, more research is needed to draw strong conclusions.

Author Contributions

Conceptualization, S.J., D.F. and J.K.; methodology, S.J., D.F., L.G., F.L. and J.K.; software, S.J. and F.L.; validation, S.J.; formal analysis, S.J., D.F. and J.K.; investigation, S.J., J.K., D.F. and L.G.; resources, J.K.; data curation, S.J.; writing—original draft preparation, S.J.; writing—review and editing, J.K. and D.F.; visualization, S.J.; supervision, J.K. and D.F.; project administration, S.J., D.F. and J.K.; funding acquisition, J.K. and D.F. All authors have read and agreed to the published version of the manuscript.

Funding

This research was funded by the EU Horizon2020 project FormPlanet, grant number 814517, which is gratefully acknowledged.

Data Availability Statement

The raw data supporting the conclusions of this article will be made available by the authors on request.

Acknowledgments

The authors would like to thank Jan Granström for his expertise in high-speed testing in the lab. The corresponding author also would like to give a huge thanks to Khalifa Maissara at the Division of Material Science and Erik Lundholm at the Division of Solid Mechanics at Luleå University of Technology for helping with sample preparation and microstructural investigation.

Conflicts of Interest

The authors declare no conflicts of interest.

Abbreviations

The following abbreviations are used in this manuscript:
EWFEssential Work of Fracture
FPZFracture Process Zone
DICDigital Image Correlation
DENTDouble Edge Notched Tension
PHSPress-Hardening Steel
AHSSAdvanced High-Strength Steel
UHSSUltra-High-Strength Steel
BIWBody-in-White
FPZFracture Process Zone
YSYield Stress
UTSUltimate Tensile Strength
TETotal Elongation
FEGField Emission Gun
SEMScanning Electron Microscope

References

  1. Monteforte, M.; Mock, P.; Bernard, M.R.; Tietge, U.; Mulholland, E. European Vehicle Market Statistics Pocketbook 2023/24; Technical Report; International Council on Clean Transportation Europe: Berlin, Germany, 2023. [Google Scholar]
  2. Noder, J.; Gutierrez, J.E.; Zhumagulov, A.; Dykeman, J.; Ezzat, H.; Butcher, C. A comparative evaluation of third-generation advanced high-strength steels for automotive forming and crash applications. Materials 2021, 14, 4970. [Google Scholar] [CrossRef]
  3. Barnwal, V.K.; Lee, S.Y.; Choi, J.; Kim, J.H.; Barlat, F. Fracture assessment in dual phase and transformation-induced plasticity steels during 3-point bending. Theor. Appl. Fract. Mech. 2020, 110, 102834. [Google Scholar] [CrossRef]
  4. Gutierrez, J.E.; Noder, J.; Butcher, C. Experimental characterization and deterministic prediction of in-plane formability of 3rd generation advanced high strength steels. Metals 2020, 10, 902. [Google Scholar] [CrossRef]
  5. Noder, J.; Gutierrez, J.E.; Zhumagulov, A.; Khameneh, F.; Ezzat, H.; Dykeman, J.; Butcher, C. Constitutive, Formability, and Fracture Characterization of 3rd Gen AHSS with an Ultimate Tensile Strength of 1180 MPa. SAE Int. J. Adv. Curr. Pract. Mobil. 2021, 3, 1395–1407. [Google Scholar] [CrossRef]
  6. Savic, V.; Hector, L.; Alturk, R.; Enloe, C. High Strain Rate Tensile Behavior of 1180MPa Grade Advanced High Strength Steels. SAE Int. J. Adv. Curr. Pract. Mobil. 2020, 2, 1561–1568. [Google Scholar] [CrossRef]
  7. Kim, J.G.; Enikeev, N.A.; Seol, J.B.; Abramova, M.M.; Karavaeva, M.V.; Valiev, R.Z.; Park, C.G.; Kim, H.S. Superior Strength and Multiple Strengthening Mechanisms in Nanocrystalline TWIP Steel. Sci. Rep. 2018, 8, 11200. [Google Scholar] [CrossRef]
  8. Ding, H.; Liu, D.; Cai, M.; Zhang, Y. Austenite-Based Fe-Mn-Al-C Lightweight Steels: Research and Prospective. Metals 2022, 12, 1572. [Google Scholar] [CrossRef]
  9. Bartlett, L.; Van Aken, D. High Manganese and Aluminum Steels for the Military and Transportation Industry. JOM 2014, 66, 1770–1784. [Google Scholar] [CrossRef]
  10. Zambrano, O. A general perspective of Fe–Mn–Al–C steels. J. Mater. Sci. 2018, 53, 14003–14062. [Google Scholar] [CrossRef]
  11. Zuazo, I.; Hallstedt, B.; Lindahl, B.; Selleby, M.; Soler, M.; Etienne, A.; Perlade, A.; Hasenpouth, D.; Massardier-Jourdan, V.; Cazottes, S.; et al. Low-Density Steels: Complex Metallurgy for Automotive Applications. JOM 2014, 66, 1747–1758. [Google Scholar] [CrossRef]
  12. Karbasian, H.; Tekkaya, A. A review on hot stamping. J. Mater. Process. Technol. 2010, 210, 2103–2118. [Google Scholar] [CrossRef]
  13. Ferrea, M.; De Caro, D.; Baldoin, E.; Tedesco, M.; Barile, B. 2000 PHS Press Hardening Steel Mechanical Characterization and Virtual Simulation of Automotive Crash Applications. In Proceedings of the 8th International Conference on Hot Sheet Metal Forming of High-Performance Steel, CHS2 2022, Barcelona, Spain, 30 May 2022; pp. 95–102. [Google Scholar]
  14. Kawajiri, K.; Kobayashi, M.; Sakamoto, K. Lightweight materials equal lightweight greenhouse gas emissions?: A historical analysis of greenhouse gases of vehicle material substitution. J. Clean. Prod. 2020, 253, 119805. [Google Scholar] [CrossRef]
  15. Burd, J.T.J.; Moore, E.A.; Ezzat, H.; Kirchain, R.; Roth, R. Improvements in electric vehicle battery technology influence vehicle lightweighting and material substitution decisions. Appl. Energy 2021, 283, 116269. [Google Scholar] [CrossRef]
  16. Choi, W.S.; De Cooman, B.C. Characterization of the Bendability of Press-Hardened 22MnB5 Steel. Steel Res. Int. 2014, 85, 824–835. [Google Scholar] [CrossRef]
  17. Golem, L.; Cho, L.; Speer, J.G.; Findley, K.O. Influence of austenitizing parameters on microstructure and mechanical properties of Al-Si coated press hardened steel. Mater. Des. 2019, 172, 107707. [Google Scholar] [CrossRef]
  18. Frómeta, D.; Lara, A.; Grifé, L.; Dieudonné, T.; Dietsch, P.; Rehrl, J.; Suppan, C.; Casellas, D.; Calvo, J. Fracture Resistance of Advanced High-Strength Steel Sheets for Automotive Applications. Metall. Mater. Trans. A Phys. Metall. Mater. Sci. 2021, 52, 840–856. [Google Scholar] [CrossRef]
  19. Yoon, J.I.; Jung, J.; Joo, S.H.; Song, T.J.; Chin, K.G.; Seo, M.H.; Kim, S.J.; Lee, S.; Kim, H.S. Correlation between fracture toughness and stretch-flangeability of advanced high strength steels. Mater. Lett. 2016, 180, 322–326. [Google Scholar] [CrossRef]
  20. Frómeta, D.; Lara, A.; Casas, B.; Casellas, D. Fracture toughness measurements to understand local ductility of advanced high strength steels. In IOP Conference Series: Materials Science and Engineering; IOP Publishing: Bristol, UK, 2019; Volume 651. [Google Scholar] [CrossRef]
  21. Frómeta, D.; Lara, A.; Molas, S.; Casellas, D.; Rehrl, J.; Suppan, C.; Larour, P.; Calvo, J. On the correlation between fracture toughness and crash resistance of advanced high strength steels. Eng. Fract. Mech. 2019, 205, 319–332. [Google Scholar] [CrossRef]
  22. Lai, Q.; Chen, Z.; Wei, Y.; Lu, Q.; Ma, Y.; Wang, J.; Fan, G. Towards the understanding of fracture resistance of an ultrahigh-strength martensitic press-hardened steel. J. Mater. Res. Technol. 2023, 27, 1996–2006. [Google Scholar] [CrossRef]
  23. Rice, J.R.; Paris, P.C.; Merkle, J.G. Some Further Results of J-Integral Analysis and Estimates. In Progress in Flaw Growth and Fracture Toughness Testing; ASTM International: West Conshohocken, PA, USA, 1973. [Google Scholar] [CrossRef]
  24. Golling, S.; Frómeta, D.; Casellas, D.; Jonsén, P. Influence of microstructure on the fracture toughness of hot stamped boron steel. Mater. Sci. Eng. A 2019, 743, 529–539. [Google Scholar] [CrossRef]
  25. Grifé, L.; Frómeta, D.; Parareda, S.; Lara, A.; Casellas, D. An Innovative Rapid Procedure for Fracture Toughness Characterization of Advanced High Strength Steels and Press Hardened Steels. In Proceedings of the 8th International Conference on Hot Sheet Metal Forming of High-Performance Steel, CHS2 2022, Barcelona, Spain, 30 May 2022; pp. 221–228. [Google Scholar]
  26. Frómeta, D.; Parareda, S.; Pujante, J.; Corón, D.; Galceran, L.; Casellas, D. Influence of Laser Tempering on Fracture Toughness of Press Hardened Steels – Correlation with Components Crash Performance. In Proceedings of the 8th International Conference on Hot Sheet Metal Forming of High-Performance Steel, CHS2 2022, Barcelona, Spain, 30 May 2022; pp. 137–144. [Google Scholar]
  27. Tarhouni, I.; Frómeta, D.; Casellas, D. Essential Work of Fracture Method for Toughness Evaluation of Thick Press Hardened 22MnB5 Plates. In Proceedings of the 8th International Conference on Hot Sheet Metal Forming of High-Performance Steel, CHS2 2022, Barcelona, Spain, 30 May 2022; pp. 387–394. [Google Scholar]
  28. Parareda, S.; Casellas, D.; Taiss, E.; Tolotti de Almeida, D.; Frómeta, D. Improved Fatigue and Fracture Resistance of 22MnB5 Steels With Added Nb and Mo. In Proceedings of the 9th International Conference on Hot Sheet Metal Forming of High-Performance Steel, CHS2 2024, Nashville, TN, USA, 27 May 2024; pp. 445–450. [Google Scholar]
  29. Golling, S.; Frómeta, D.; Casellas, D.; Jonsén, P. Investigation on the influence of loading-rate on fracture toughness of AHSS grades. Mater. Sci. Eng. A 2018, 726, 332–341. [Google Scholar] [CrossRef]
  30. Larour, P.; Pauli, H.; Kurz, T.; Hebesberger, T. Influence of Post Uniform Tensile and Bending Properties on the Crash Behaviour of AHSS and Press-Hardening Steel Grades. In Proceedings of the IDDRG 2010 Conference (International Deep Drawing Research Group), Graz, Austria, 31 May–2 June 2010; pp. 107–126. [Google Scholar]
  31. Langi, V.; Soares, G.C.; Ahmed, S.; Peura, P.; Hokka, M. Effects of strain rate and adiabatic heating on mechanical behavior of medium manganese Q&P steels. Mater. Sci. Eng. A 2023, 865, 144659. [Google Scholar] [CrossRef]
  32. Vázquez-Fernández, N.; Nyyssönen, T.; Isakov, M.; Hokka, M.; Kuokkala, V.T. Uncoupling the effects of strain rate and adiabatic heating on strain induced martensitic phase transformations in a metastable austenitic steel. Acta Mater. 2019, 176, 134–144. [Google Scholar] [CrossRef]
  33. Peirs, J.; Verleysen, P.; Degrieck, J.; Coghe, F. The use of hat-shaped specimens to study the high strain rate shear behaviour of Ti-6Al-4V. Int. J. Impact Eng. 2010, 37, 703–714. [Google Scholar] [CrossRef]
  34. Kubair, D.; Ramesh, K.; Swaminathan, P. Effect of shear-void-growth-softening on adiabatic shear-band-spacing in ductile materials. Acta Mech. 2015, 226, 4189–4206. [Google Scholar] [CrossRef]
  35. Cotterell, B.; Reddel, J. The essential work of plane stress ductile fracture. Int. J. Fract. 1977, 13, 267–277. [Google Scholar] [CrossRef]
  36. Broberg, K.B. On stable crack growth. J. Mech. Phys. Solids 1975, 23, 443–445. [Google Scholar] [CrossRef]
  37. Broberg, K.B. Critical review of some theories in fracture mechanics. Int. J. Fract. Mech. 1968, 4, 11–19. [Google Scholar] [CrossRef]
  38. Broberg, K.B. Crack-growth criteria and non-linear fracture mechanics. J. Mech. Phys. Solids 1971, 19, 407–418. [Google Scholar] [CrossRef]
  39. Frómeta, D.; Parareda, S.; Lara, A.; Molas, S.; Casellas, D.; Jonsén, P.; Calvo, J. Identification of fracture toughness parameters to understand the fracture resistance of advanced high strength sheet steels. Eng. Fract. Mech. 2020, 229, 106949. [Google Scholar] [CrossRef]
  40. Clutton, E. Essential work of fracture. In Fracture Mechanics Testing Methods for Polymers, Adhesives and Composites; European Structural Integrity Society; Moore, D., Pavan, A., Williams, J., Eds.; Elsevier: Amsterdam, The Netherlands, 2001; Volume 28, pp. 177–195. [Google Scholar] [CrossRef]
  41. Pardoen, T.; Hachez, F.; Marchioni, B.; Blyth, P.; Atkins, A. Mode I fracture of sheet metal. J. Mech. Phys. Solids 2004, 52, 423–452. [Google Scholar] [CrossRef]
  42. Samadian, P.; Abedini, A.; Butcher, C.; Worswick, M.J. Microstructure-Based Modelling of Flow and Fracture Behavior of Tailored Microstructures of Ductibor® 1000-AS Steel. Metals 2022, 12, 1770. [Google Scholar] [CrossRef]
  43. Zhu, H.; Yin, H.; Sadagopan, S. Study of Microstructural Evolution of Press Hardening Steels using Dilatometer and In-situ Studies for a Simulated Hot Stamping Condition. IOP Conf. Ser. Mater. Sci. Eng. 2023, 1284, 012008. [Google Scholar] [CrossRef]
  44. Bardelcik, A.; Worswick, M.J.; Wells, M.A. The influence of martensite, bainite and ferrite on the as-quenched constitutive response of simultaneously quenched and deformed boron steel—Experiments and model. Mater. Des. 2014, 55, 509–525. [Google Scholar] [CrossRef]
  45. Bardelcik, A.; Worswick, M.; Winkler, S.; Wells, M. A strain rate sensitive constitutive model for quenched boron steel with tailored properties. Int. J. Impact Eng. 2012, 50, 49–62. [Google Scholar] [CrossRef]
  46. Xia, P.; Sabirov, I.; Molina-Aldareguia, J.; Verleysen, P.; Petrov, R. Mechanical behavior and microstructure evolution of a quenched and partitioned steel during drop weight impact and punch testing. Mater. Sci. Eng. A 2018, 737, 18–26. [Google Scholar] [CrossRef]
  47. Xia, P.; Sanchez Palomar, M.; Sabirov, I. Adiabatic heating and energy absorption capability of an advanced high strength steel during drop weight impact testing. Mater. Sci. Eng. A 2020, 785, 139382. [Google Scholar] [CrossRef]
  48. Kohar, C.P.; Cherkaoui, M.; Kadiri, H.E.; Inal, K. Numerical modeling of TRIP steel in axial crashworthiness. Int. J. Plast. 2016, 84, 224–254. [Google Scholar] [CrossRef]
Figure 1. The specimen used for the quasi-static and high-speed uniaxial tensile tests. The measuring gauge length was 50 mm and the specimen was cut transverse to the rolling direction.
Metals 15 00316 g001
Figure 2. Schematics of the specimens used for the low rate (bottom) and high rate (top) EWF experiments. The specimens were cut transverse to the rolling direction (the cracks in the ligament along the rolling direction). The distance between the cracks is referred to as the ligament L.
Metals 15 00316 g002
Figure 3. Illustration of how where and how the thickness strains were measured in the fractured DENT specimen. The reference thickness was measured using a micrometer. t f is the thickness at fracture (denominator in logarithm in Equation (2)).
Metals 15 00316 g003
Figure 4. Image illustrating how the von Mises strain was measured using 2D-DIC in a section in the ligament of the DENT specimen. The dashed square surrounding the line section is the area used to evaluate the average strain rate in the ligament.
Metals 15 00316 g004
Figure 5. Experimental setup for high-speed EWF testing in (a). The high-speed camera was used for DIC measurements and to track the crack propagation in the samples. The FLIR thermal camera was used separately on certain specimens to capture the adiabatic heating during the fracture of the DENT specimen. An illustration of the ligament and the thermal imaging before fracture is presented in (b).
Metals 15 00316 g005
Figure 6. Microstructural images of PHS 1000 taken with SEM at different magnifications (8.65 K × and 29.21 K × magnification). The microstructure is mainly martensitic.
Metals 15 00316 g006
Figure 7. Microstructural images of PHS 2000 taken with SEM at different magnifications (8.65 K × and 29.21 K × magnification). The microstructure is fully martensitic.
Metals 15 00316 g007
Figure 8. Nominal stress versus elongation at fracture for PHS 1000 (a) and PHS 2000 (b) for the strain rates 0.001 s 1 (dashed line) and 100 s 1 (solid line).
Metals 15 00316 g008
Figure 9. Load-elongation curves for the PHS 1000 DENT specimens with different ligament lengths. (a) shows the low rate results and the (b) shows the high rate results.
Metals 15 00316 g009
Figure 10. Load-elongation curves for the PHS 2000 DENT specimens with different ligament lengths. (a) shows the low rate results and (b) shows the high rate results.
Metals 15 00316 g010
Figure 11. The specific essential work of fracture as a function of the ligament length for PHS 1000 (a) and PHS 2000 (b). The low rate results are given by a dashed line and the high rate results are given by solid lines. The intersections of the regression lines with the vertical axes indicate the essential works of fracture.
Metals 15 00316 g011
Figure 12. The von Mises strain measured in a section over the ligament for PHS 1000 (left) and PHS 2000 (right) for both loading rates. It is clear that PHS 1000 is a lot more ductile compared to PHS 2000. Different scales are used for each grade for clarity.
Metals 15 00316 g012
Figure 13. Thickness strain of the fracture ligament measured from the crack tip (origin) for PHS 1000 (left) and PHS 2000 (right) for both loading rates. Positive thickness strain indicate a thickness reduction.
Metals 15 00316 g013
Figure 14. The stress–displacement curve for a DENT specimen (solid dark line) with the average strain rate in the ligament (solid orange line). The more ductile PHS 1000 grade (left) and the quasi-brittle PHS 2000 grade (right).
Metals 15 00316 g014
Figure 15. Three consecutive images of initial trials of PHS 2000. Fracture was deemed too quick to capture the crack propagation and thus only a post-fracture result is presented.
Metals 15 00316 g015
Figure 16. Thermal images of a set of ligaments for PHS 1000. A significant increase in temperature can be seen, especially for the wider ligaments to the right.
Metals 15 00316 g016
Table 1. Chemical composition in weight percent (balance Fe) of the investigated steel grades. (*) indicates maximum amount. Commercial data obtained from steel manufacturer.
PHS GradeC *Si *Mn *P *S *AlTi *Nb *Cu *B *Cr *Mo *
PHS 1000 0.10 0.6 1.8 0.03 0.01 0.01–0.1 0.05 0.10 0.20 0.005 0.20 -
PHS 2000 0.36 0.80 0.8 0.03 0.01 0.01–0.06 0.07 0.02–0.07 0.20 0.005 0.50 0.50
Table 2. The average Vickers hardness results from the micro indentation testing with 0.5 kgf together with the respective standard deviation. The average is taken from 10 points with 10 s dwell time each.
PHS GradeAvg. Vickers Hardness [HV0.5]Std. Dev.
PHS 10003645.3
PHS 20006025.0
Table 3. Conventional mechanical properties based on uniaxial tensile tests for the engineering strain rates 0.001 s 1 and 100 s 1 .
ε ˙ [ s 1 ] YS (Min/Max) [MPa]UTS (Min/Max) [MPa]YS/UTS [–]TE (Min/Max) [Pct]UTS × TE [MPa × Pct]
PHS 1000 (1.55 mm thickness)
0.001901 (878/915)1067 (1042/1085)0.846.8 (6.6/7.1)7256
100946 (894/1002)1129 (1111/1138)0.848.0 (7.5/8.3)9032
PHS 2000 (1.2 mm thickness)
0.0011489 (1482/1496)1832 (1820/1842)0.815.5 (5.4/5.5)10,076
1001600 (1583/1617)1853 (1850/1855)0.866.6 (6.1/7.0)12,230
ε ˙ —engineering strain rate, YS—0.2% offset yield stress, UTS—ultimate tensile stress, TE—total elongation to fracture.
Table 4. Table with the EWF values (±95% confidence interval) and the average of the maximum nominal ligament stress (±standard deviation) for the tested DENT specimens for the two PHS grades. The ratio between the high rate results and the quasi static results are presented as Δ w e and Δ σ Max , respectively.
Low RateHigh Rate
Grade w e [kJ/m2] σ Max [MPa] w e [kJ/m2] σ Max [MPa] Δ w e Δ σ Max
PHS 1000 186 ± 71 1226 ± 22 371 ± 113 1309 ± 45 1.99 1.07
PHS 2000 96 ± 36 1528 ± 103 93 ± 89 1682 ± 128 0.97 1.10
Disclaimer/Publisher’s Note: The statements, opinions and data contained in all publications are solely those of the individual author(s) and contributor(s) and not of MDPI and/or the editor(s). MDPI and/or the editor(s) disclaim responsibility for any injury to people or property resulting from any ideas, methods, instructions or products referred to in the content.

