Article

Microscopic Modeling of Interfaces in Cu-Mo Nanocomposites: The Case Study of Nanometric Metallic Multilayers

Laboratoire Interdisciplinaire Carnot de Bourgogne ICB UMR 6303, Université Bourgogne Europe, CNRS, F-21000 Dijon, France
*
Authors to whom correspondence should be addressed.
Metals 2025, 15(3), 282; https://doi.org/10.3390/met15030282
Submission received: 31 January 2025 / Revised: 21 February 2025 / Accepted: 28 February 2025 / Published: 5 March 2025
(This article belongs to the Special Issue Design and Development of Metal Matrix Composites)

Abstract

Nanocomposites composed of Cu and Mo were investigated by means of molecular dynamics (MD) simulations to study the incoherent interface between Cu and Mo. In order to select an appropriate potential capable of accurately describing the Cu-Mo system, five many-body potentials were compared: three Embedded Atom Method (EAM) potentials, a Tight Binding Second Moment Approximation (TB-SMA) potential, and a Modified Embedded Atom Method (MEAM) potential. Among these, the EAM potential proposed by Zhou in 2001 was determined to provide the best compromise for the current study. The simulated system was constructed with two layers of Cu and Mo forming an incoherent fcc-Cu(111)/bcc-Mo(110) interface, based on the Nishiyama–Wassermann (NW) and Kurdjumov–Sachs (KS) orientation relationships (OR). The interfacial energies were calculated for each orientation relationship. The NW configuration emerged as the most stable, with an interfacial energy of 1.83 J/m², compared to 1.97 J/m² for the KS orientation. Subsequent simulations were dedicated to modeling Cu atomic deposition onto a Mo(110) substrate at 300 K. These simulations resulted in the formation of a dense layer with only a few defects in the two Cu planes closest to the interface. The interfacial structures were characterized by computing selected area electron diffraction (SAED) patterns. A direct comparison of theoretical and numerical SAED patterns confirmed the presence of the NW orientation relationship in the nanocomposites formed during deposition, corroborating the results obtained with the model fcc-Cu(111)/bcc-Mo(110) interfaces.

1. Introduction

Recently, thin films have gained significant importance in advanced technologies, including protective coatings (acting as diffusion or thermal barriers and providing wear or corrosion resistance), biosensors, plasmonic devices, optical coatings, electrically conductive layers, and thin-film photovoltaic cells. Among these materials, nanometric metallic multilayers (NMMs), also known as layered composites or nanolaminates, have emerged as a particularly promising class of thin films. These structures are composed of hundreds of nanometric layers made of two metallic elements, with individual layer thicknesses typically ranging from 4 to 100 nm. Compared to monolithic films, NMMs offer superior properties due to their abundant interfaces and nanometric layered architecture. Recently, their unique physical and chemical properties have attracted increasing attention [1].
In this context, our study focuses on a specific type of NMMs composed of immiscible metals, referred to as NMMIs (Nanometric Metallic Multilayers of Immiscible Metals). These systems offer a wide range of mechanical, optical, magnetic, and radiation tolerance properties that can be tailored (“materials on demand”) to specific applications by controlling the combined metal ratio, layer thickness, and texture. For instance, the family of NMMIs combining one element with high thermal and electrical conductivity with a refractory element that has a low coefficient of thermal expansion is promising for next-generation multi-material devices (e.g., heat sinks in electronic devices). However, their thermal stability remains a significant challenge, as high temperatures can profoundly alter their layered microstructure, thereby limiting their durability and potential applications [2]. The structural instability is closely related to interface and grain boundary energies and is further amplified by the significant stresses present in the multilayers. Although numerous experimental studies have investigated the structural stability of NMMIs under thermal treatments (e.g., Cu-Ag [3,4], Cu-W [5,6,7], Cu-Mo [8], Hf-Ti [9], Cu-Ag/Fe [10], Ag-Ni [11,12]), the precise mechanisms underlying this thermal instability remain poorly understood.
A starting explanation can be provided by simulations at the atomic scale. During the last decades, MD simulations have proven instrumental in exploring various aspects of NMMs. Previous studies examined reactive metallic multilayers like Al-Ni and Al-Ti, investigating their self-propagating exothermic reactions [13,14], reaction front propagation [15], and the role of different microstructures, such as amorphous and crystalline grains, on combustion behavior [16,17,18]. Recently, approaches focused on the thermal stability of immiscible metal nanolaminates. MD simulations of Ag-Ni multilayers investigated the kinetic pathways accountable for the degradation of NMMIs to nanocomposites (NCs) [19]. The effect of in-plane strain on thermal degradation kinetics of NMMs into NCs was investigated in Cu-W coupling experiments and DFT calculations [7,20].
As a case study, this work employs molecular dynamics (MD) to investigate Cu-Mo NMMIs, with particular emphasis on characterizing the interface between Cu and Mo. Here, the complete immiscibility between the metals prevents intermetallic phase formation and/or chemical intermixing, as observed in reactive NMMS. Therefore, other mechanisms are responsible for the thermal instability of the laminated architecture and need to be identified. Molecular dynamics requires reliable interatomic potentials, which describe the interactions between atoms in a system. Five many-body potentials fitted for Cu and Mo binary systems from the literature were benchmarked to select the most appropriate one to investigate the Cu/Mo interface.
Epitaxy relationships between bcc and fcc phases have been the topic of many works over the years, with the development of pioneering models for the ferrite-austenite interface in iron alloys. Two primary orientation relationships have been identified: the Nishiyama–Wassermann (NW) relationship [21,22], where [ 1 1 ¯ 0 ] fcc [ 100 ] bcc , and the Kurdjumov–Sachs (KS) relationship [23], where [ 1 1 ¯ 0 ] fcc [ 1 1 ¯ 1 ] bcc . These orientation relationships describe the atomic alignment at the interface and significantly influence the structural and energetic stability of the system. To date, few studies have been dedicated to the Cu/Mo interface despite the remarkable properties of these composite systems. Cui et al. [24] and Yeom et al. [8] observed using transmission electron microscopy (TEM) the Cu{111}//Mo{110} fiber texture. Nevertheless, they do not mention any preferential orientation relationships. In Cu-W [6] and Cu-Nb [25,26] systems, TEM observations reported Cu{111}, W{110} and Nb{110} textures with a Cu{111} 10 1 ¯ ‖ W{110} 00 1 ¯ and Cu{111} 110 ‖ Nb{110} 111 orientation relationships, corresponding to the NW and KS orientation relationships, respectively. Additionally, small regions with NW orientation were observed in the Cu-Nb system. On the other hand, for these two last systems, Bodlos et al. [27] using atomistic simulations reported a preferential NW orientation relationship. To determine the preferential epitaxial orientation in Cu-Mo nanometric metallic multilayers (NMMs), interfacial analyses were carried out for both KS and NW configurations. For this purpose, we created two simulation boxes, one corresponding to a KS orientation relationship and the other to a NW orientation relationship, and calculated the interfacial energy in both cases to identify the most stable configuration. To further investigate the orientation relationships predicted with the selected potential, we performed simulations of copper deposition onto a molybdenum substrate. The resulting deposits were analyzed and characterized using selected area electron diffraction (SAED) patterns.

2. Methods

The molecular dynamics simulations were performed using the LAMMPS (22 aug 2018 version) software package [28] using the five many-body potentials listed in Table 1. Three of them were based on the Embedded Atom Method (EAM), which is widely used for modeling metals [29]. One was developed by Gong et al. based on ab initio calculations that were performed to predict the structures, lattice constants, and cohesive energies of the metastable Cu75Mo25, Cu50Mo50, and Cu25Mo75 phases, as well as the elastic behavior of the pure Cu and Mo phases [30]. The two others were proposed by Zhou et al. in 2001 [31] and 2004 [32] in the context of simulating multilayers sputtering processes and properties. They are part of a 16-element normalized potential database that enables calculations of alloys. They were fitted to basic material properties such as lattice constants, elastic constants, bulk moduli, vacancy formation energies, sublimation energies, and heats of solution. They were successively used to study nanometric films such as CoFe/Cu/CoFe [31], CoFe/NiFe [32], Au/NiFe [33], and Cu/NiCo/Cu [34]. We also considered the Tight Binding in the Second Moment Approximation (TB-SMA) potential developed by M. A. Karolewski [35]. This potential was specifically developed to study sputtering simulations involving 26 fcc and bcc metals. Finally, a second-nearest-neighbor modified embedded-atom method (2NN MEAM) potential proposed by Wang et al. was also tested [36]. To our knowledge, this potential has not been used to study multilayers until now but was applied to investigate the effect of pressure on the enthalpy of mixing of fcc/bcc binary solid solutions [37]. For each individual potential, we computed microscopic, thermal, and mechanical properties of pure Cu and Mo with LAMMPS [28]. All quantities were then compared with experimental or ab initio data to assess their range of validity. The best compromise was found for the two pure elements with Zhou’s 2001 potential, which was selected to investigate the Cu/Mo interface.
The computational efficiency of each potential was evaluated by running an NPT simulation for 100 ps using a simulation box containing 66,564 atoms. The performance, measured in nanoseconds per day (ns/day) on 20 cores, is presented in Figure S1. As expected, EAM and TB-SMA potentials exhibit better performances, with the Gong potential being the most efficient at about 22 ns/day on 20 cores. On the benchmarked system, the MEAM potential proposed by Wang et al. is about 27 times slower than the Gong potential.

3. Results

3.1. Physical Properties of the Pure Elements in the System

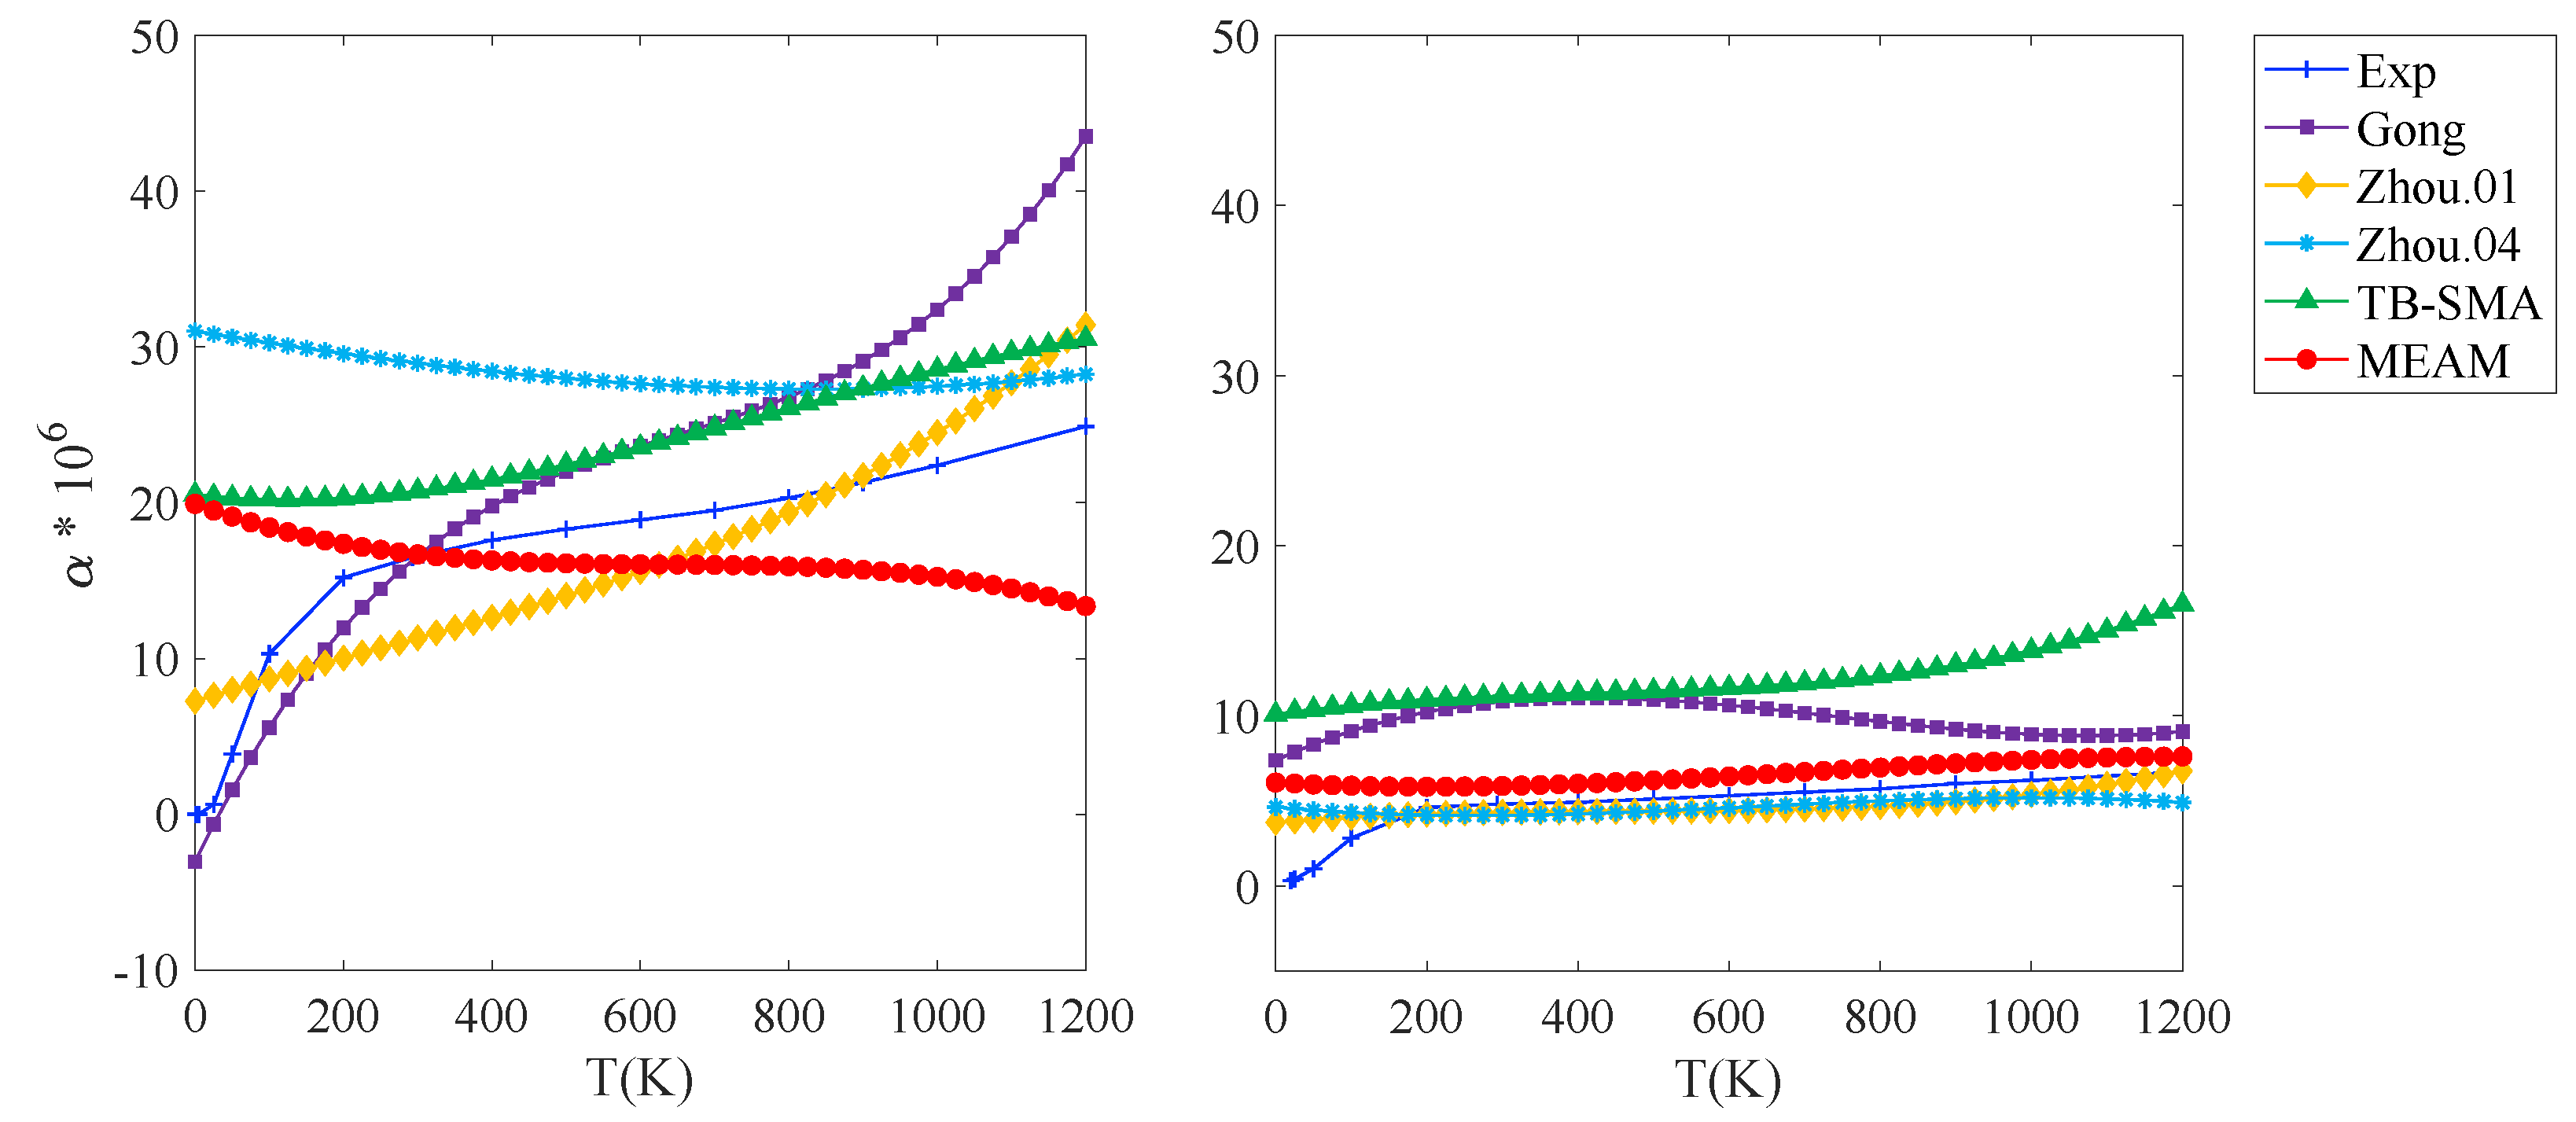
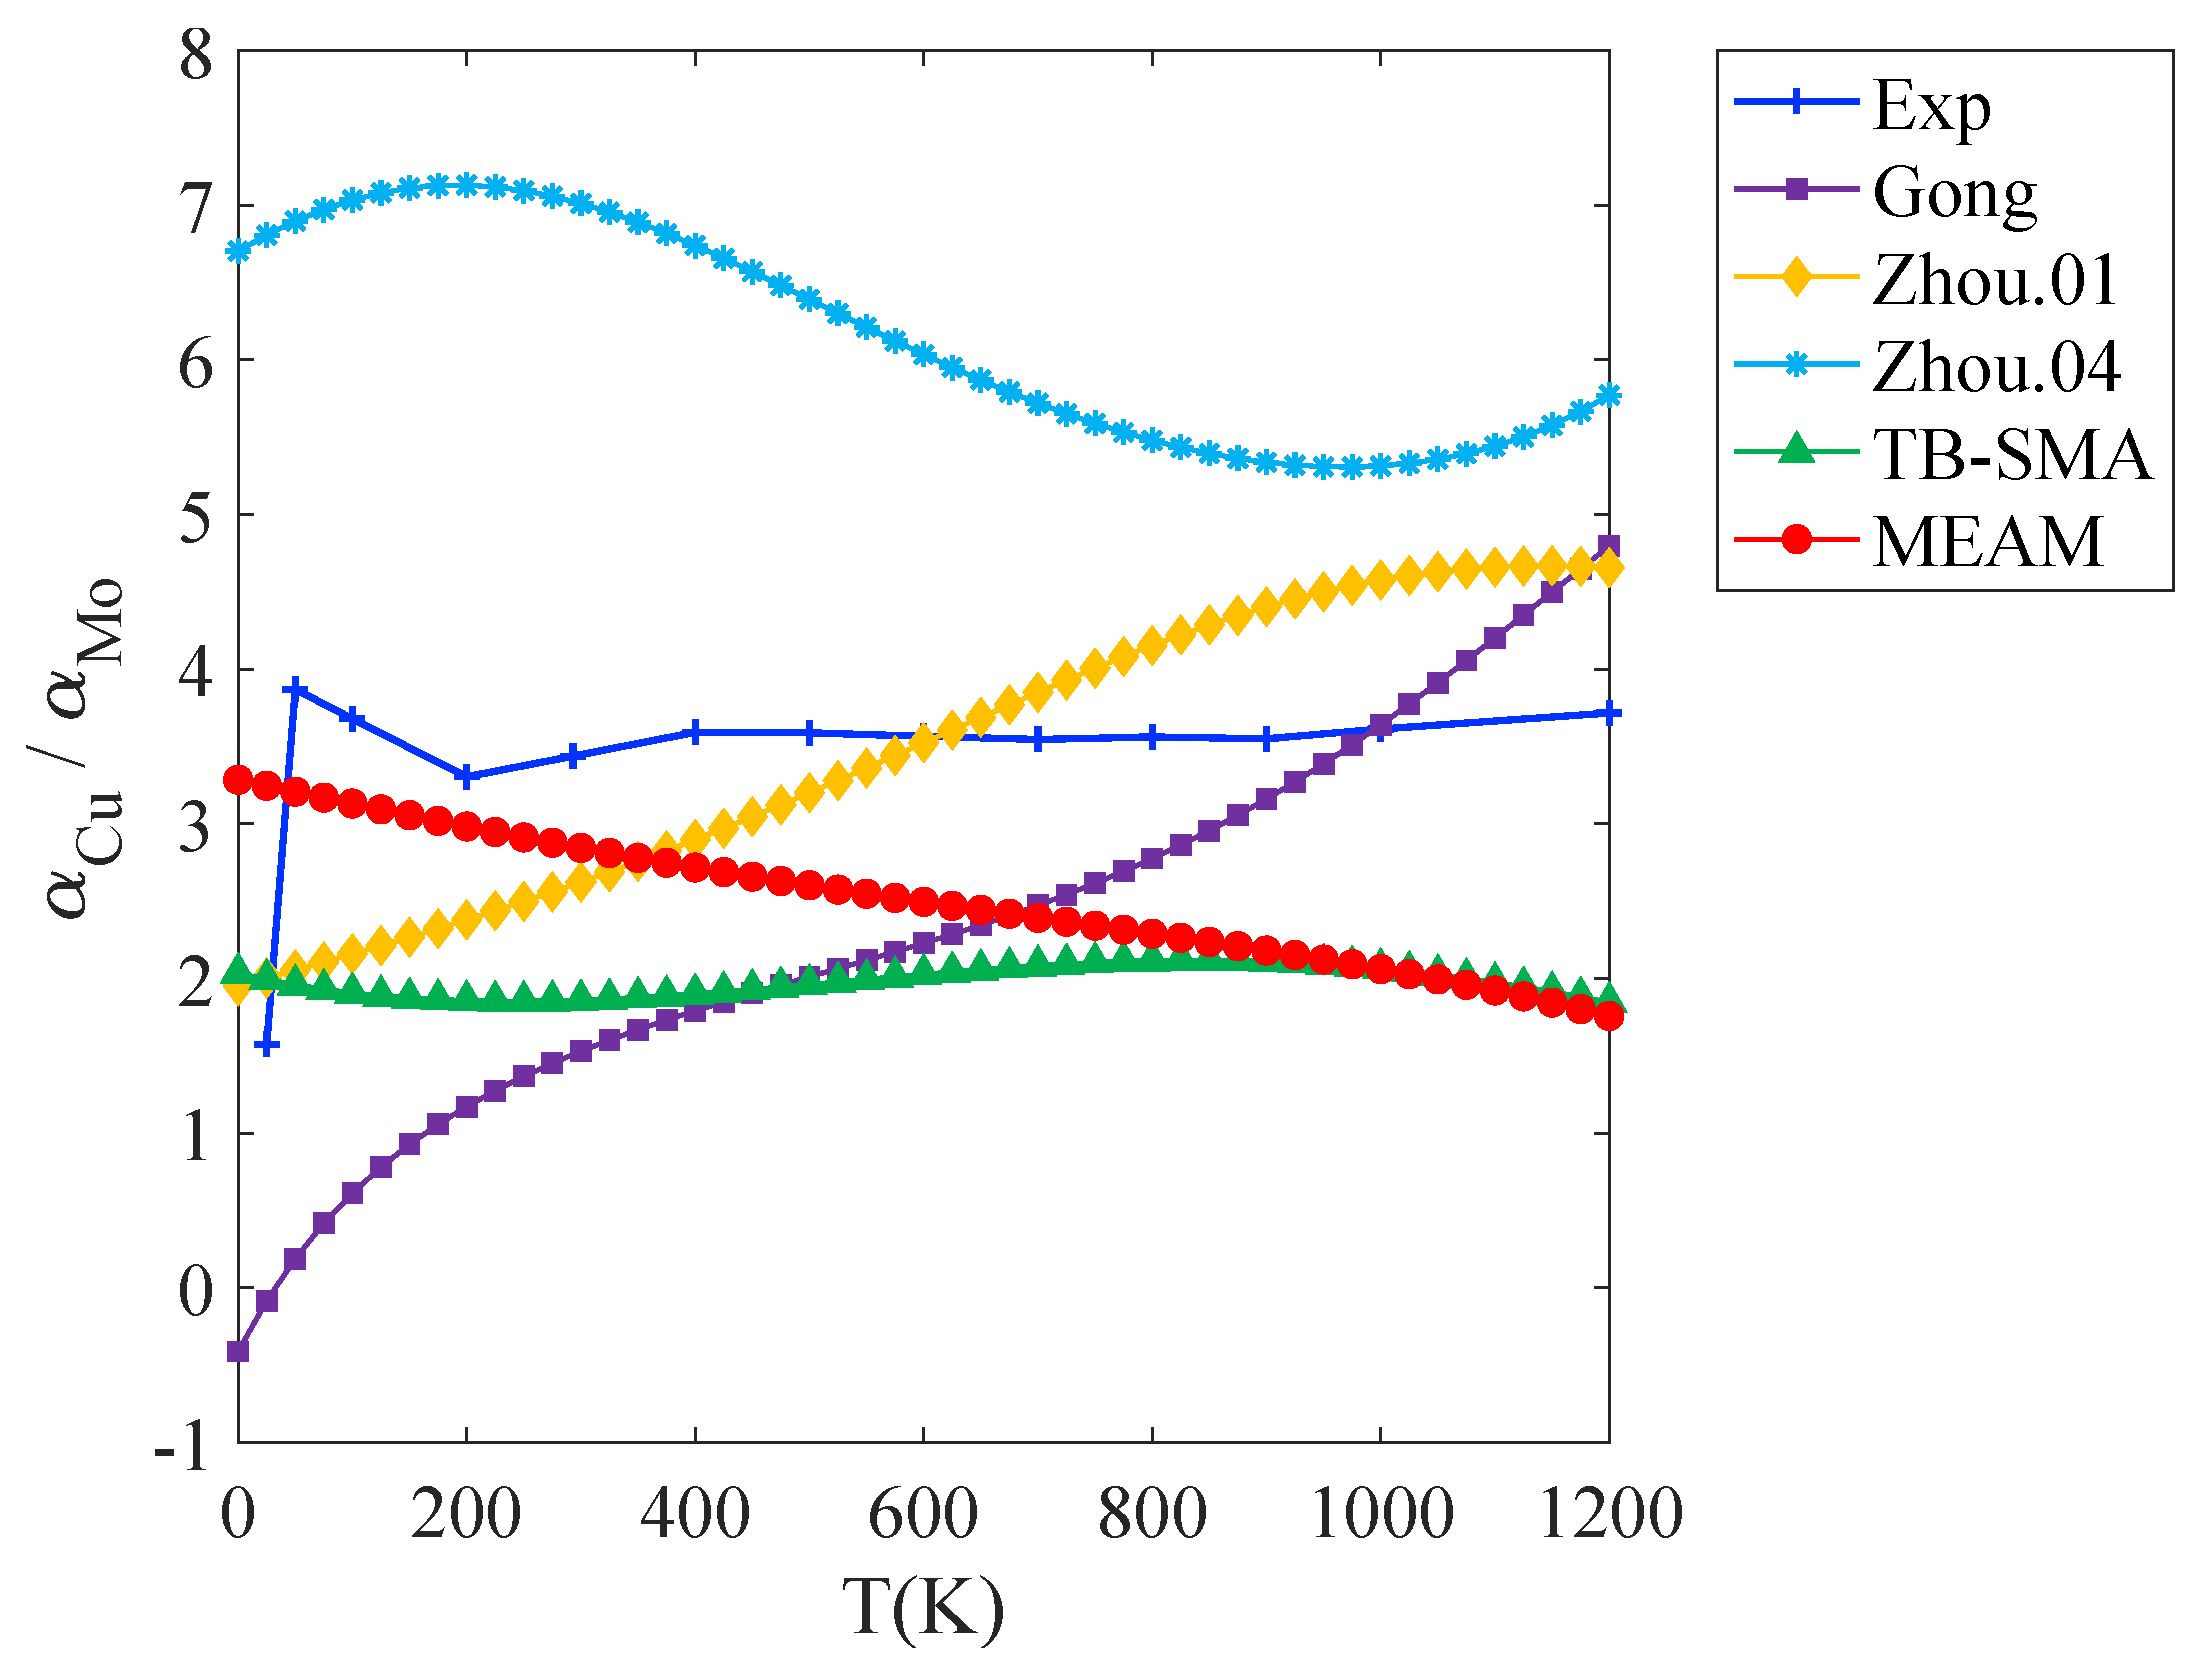
3.1.1. Thermal Expansion

The variation of the lattice parameter with temperature and the coefficient of thermal expansion (CTE) were first determined. To this end, we performed 600 picoseconds NPT runs (600,000 timesteps) for temperatures ranging from 50 K to 1200 K in steps of 50 K using simulation boxes containing 15 × 15 × 15 lattice units. The box sizes were averaged over the last 100 ps in order to determine the lattice parameter at the target temperature. A fourth-order polynomial equation a ( T ) = A + B T + C T 2 + D T 3 + E T 4 was used to fit the lattice parameter as a function of temperature for the two elements. As shown in Figure S2 in the Supplementary Material (SM), the five potentials correctly predict an increase in the lattice parameter with temperature. The coefficients A, B, C, D, and E are given in the Tables S3 and S4 in the Supplementary Material (SM) for Cu and Mo, respectively. The percentage variation of Δ L / L 0 = ( a ( T ) a 0 ) / a 0 as a function of temperature is plotted in Figure 1 along with the experimental values reported by Touloukian [38]. Here, a 0 is the lattice parameter at 293 K.
For copper, Gong, TB-SMA, and MEAM potentials underestimate the value of Δ L / L 0 at high temperatures, while the Zhou.04 potential shows underestimation even at low temperatures. The Zhou.01 potential provides more accurate values of Δ L / L 0 across the entire temperature range. In the case of Mo, Gong and TB-SMA potentials similarly underestimate the value of Δ L / L 0 across all temperature ranges. The Zhou.01 and Zhou.04 potentials also show underestimation at high temperatures but offer more accurate predictions at temperatures below 1200 K. The MEAM potential gives a more precise estimation across all temperature ranges. Therefore, the Zhou.01 potential emerges as the most reliable for both copper and molybdenum in the temperature range of interest in our studies (0 to 1200 K). The coefficient of thermal expansion was computed using α = 1 a ( T ) d a ( T ) d T (see Figure 2) and compared to the experimental values available in [38]. For copper, the MEAM, Zhou.04, and TB-SMA potentials generally underestimate the CTE across the entire temperature range. The Zhou.01 potential offers a slightly better trend and provides the closest approximation across the entire temperature range. For molybdenum, the TB-SMA and Gong potentials overestimate the CTE, while the Zhou.01, Zhou.04, and MEAM potentials are closer to the experimental measurement. The Zhou.01 potential emerges as the most reliable model, closely matching the experimental data across the entire temperature range.
The difference in thermal expansion between copper and molybdenum will be the source of thermal stress in NMMIs. Thus, the calculation of the ratio of these two quantities will help to understand the presence of internal stress measured in an NMMIs at finite temperature (see Figure 3). Experimentally, the thermal expansion of copper is about three times higher than that of molybdenum in the given temperature range. The Zhou.01 potential provides the closest match to the experimental data. The Gong potential improves at higher temperatures but still underestimates the ratio. The Zhou.04 potential consistently overestimates the ratio, and the MEAM potential significantly underestimates it. Thus, the Zhou.01 potential appears to be the most reliable for predicting the thermal expansion ratio between copper and molybdenum across the temperature range.

3.1.2. Melting Temperature

The melting temperature was determined using the hysteresis method. The simulation box was heated from 300 K up to a target temperature well above the melting point, using a procedure similar to that used to calculate thermal expansion coefficients. Subsequently, we initiated a cooling process with a constant temperature ramp. The potential energy per atom was plotted as a function of the temperature (see Figure S3 in Supplementary Material). The bulk melting temperature, T m , is estimated with T m = T + + T T + T , where T + represents the temperature at which the solid melted during the heating process, and T is the temperature at which the liquid solidified during the cooling process [39]. The melting temperatures obtained for Cu and Mo are listed in Table 2. The closest calculated melting points were 2778 K for Mo with the MEAM and 1332 K for Cu with the TB-SMA. The other values are relatively distant from the experimental values. The melting temperature is generally not considered in the fitting of potentials. This often results in significant discrepancies with experimental data, as observed here.

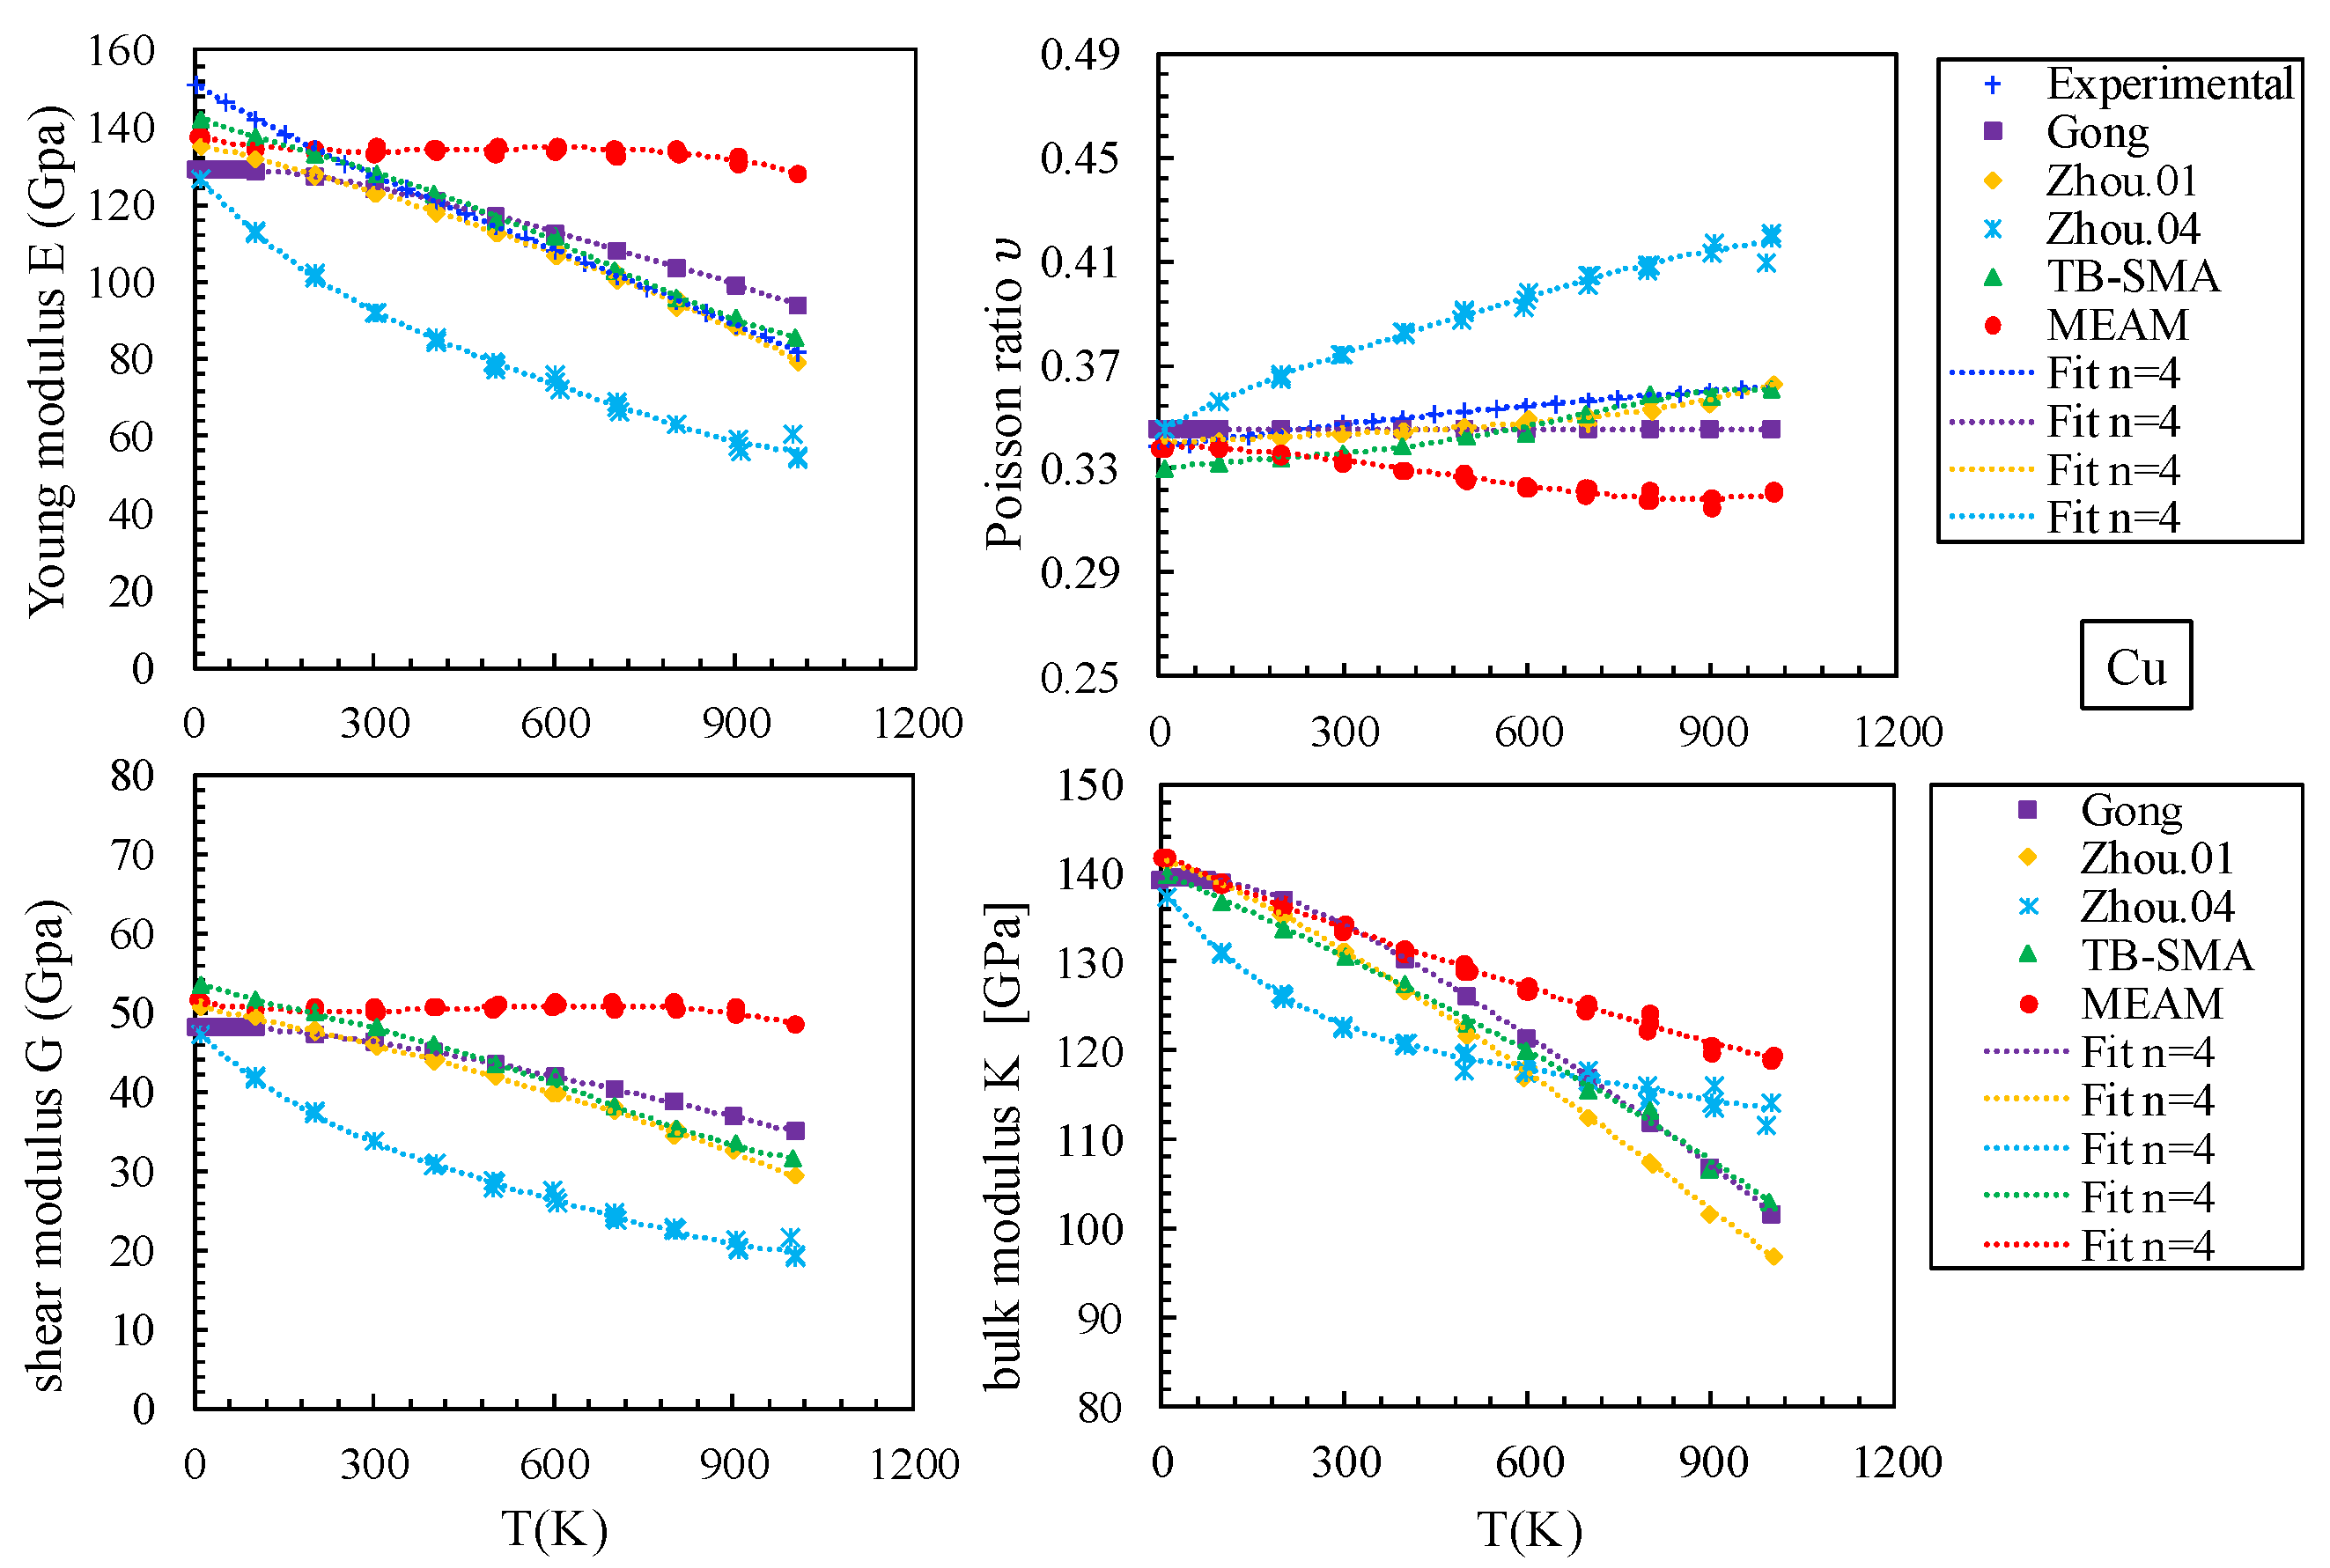
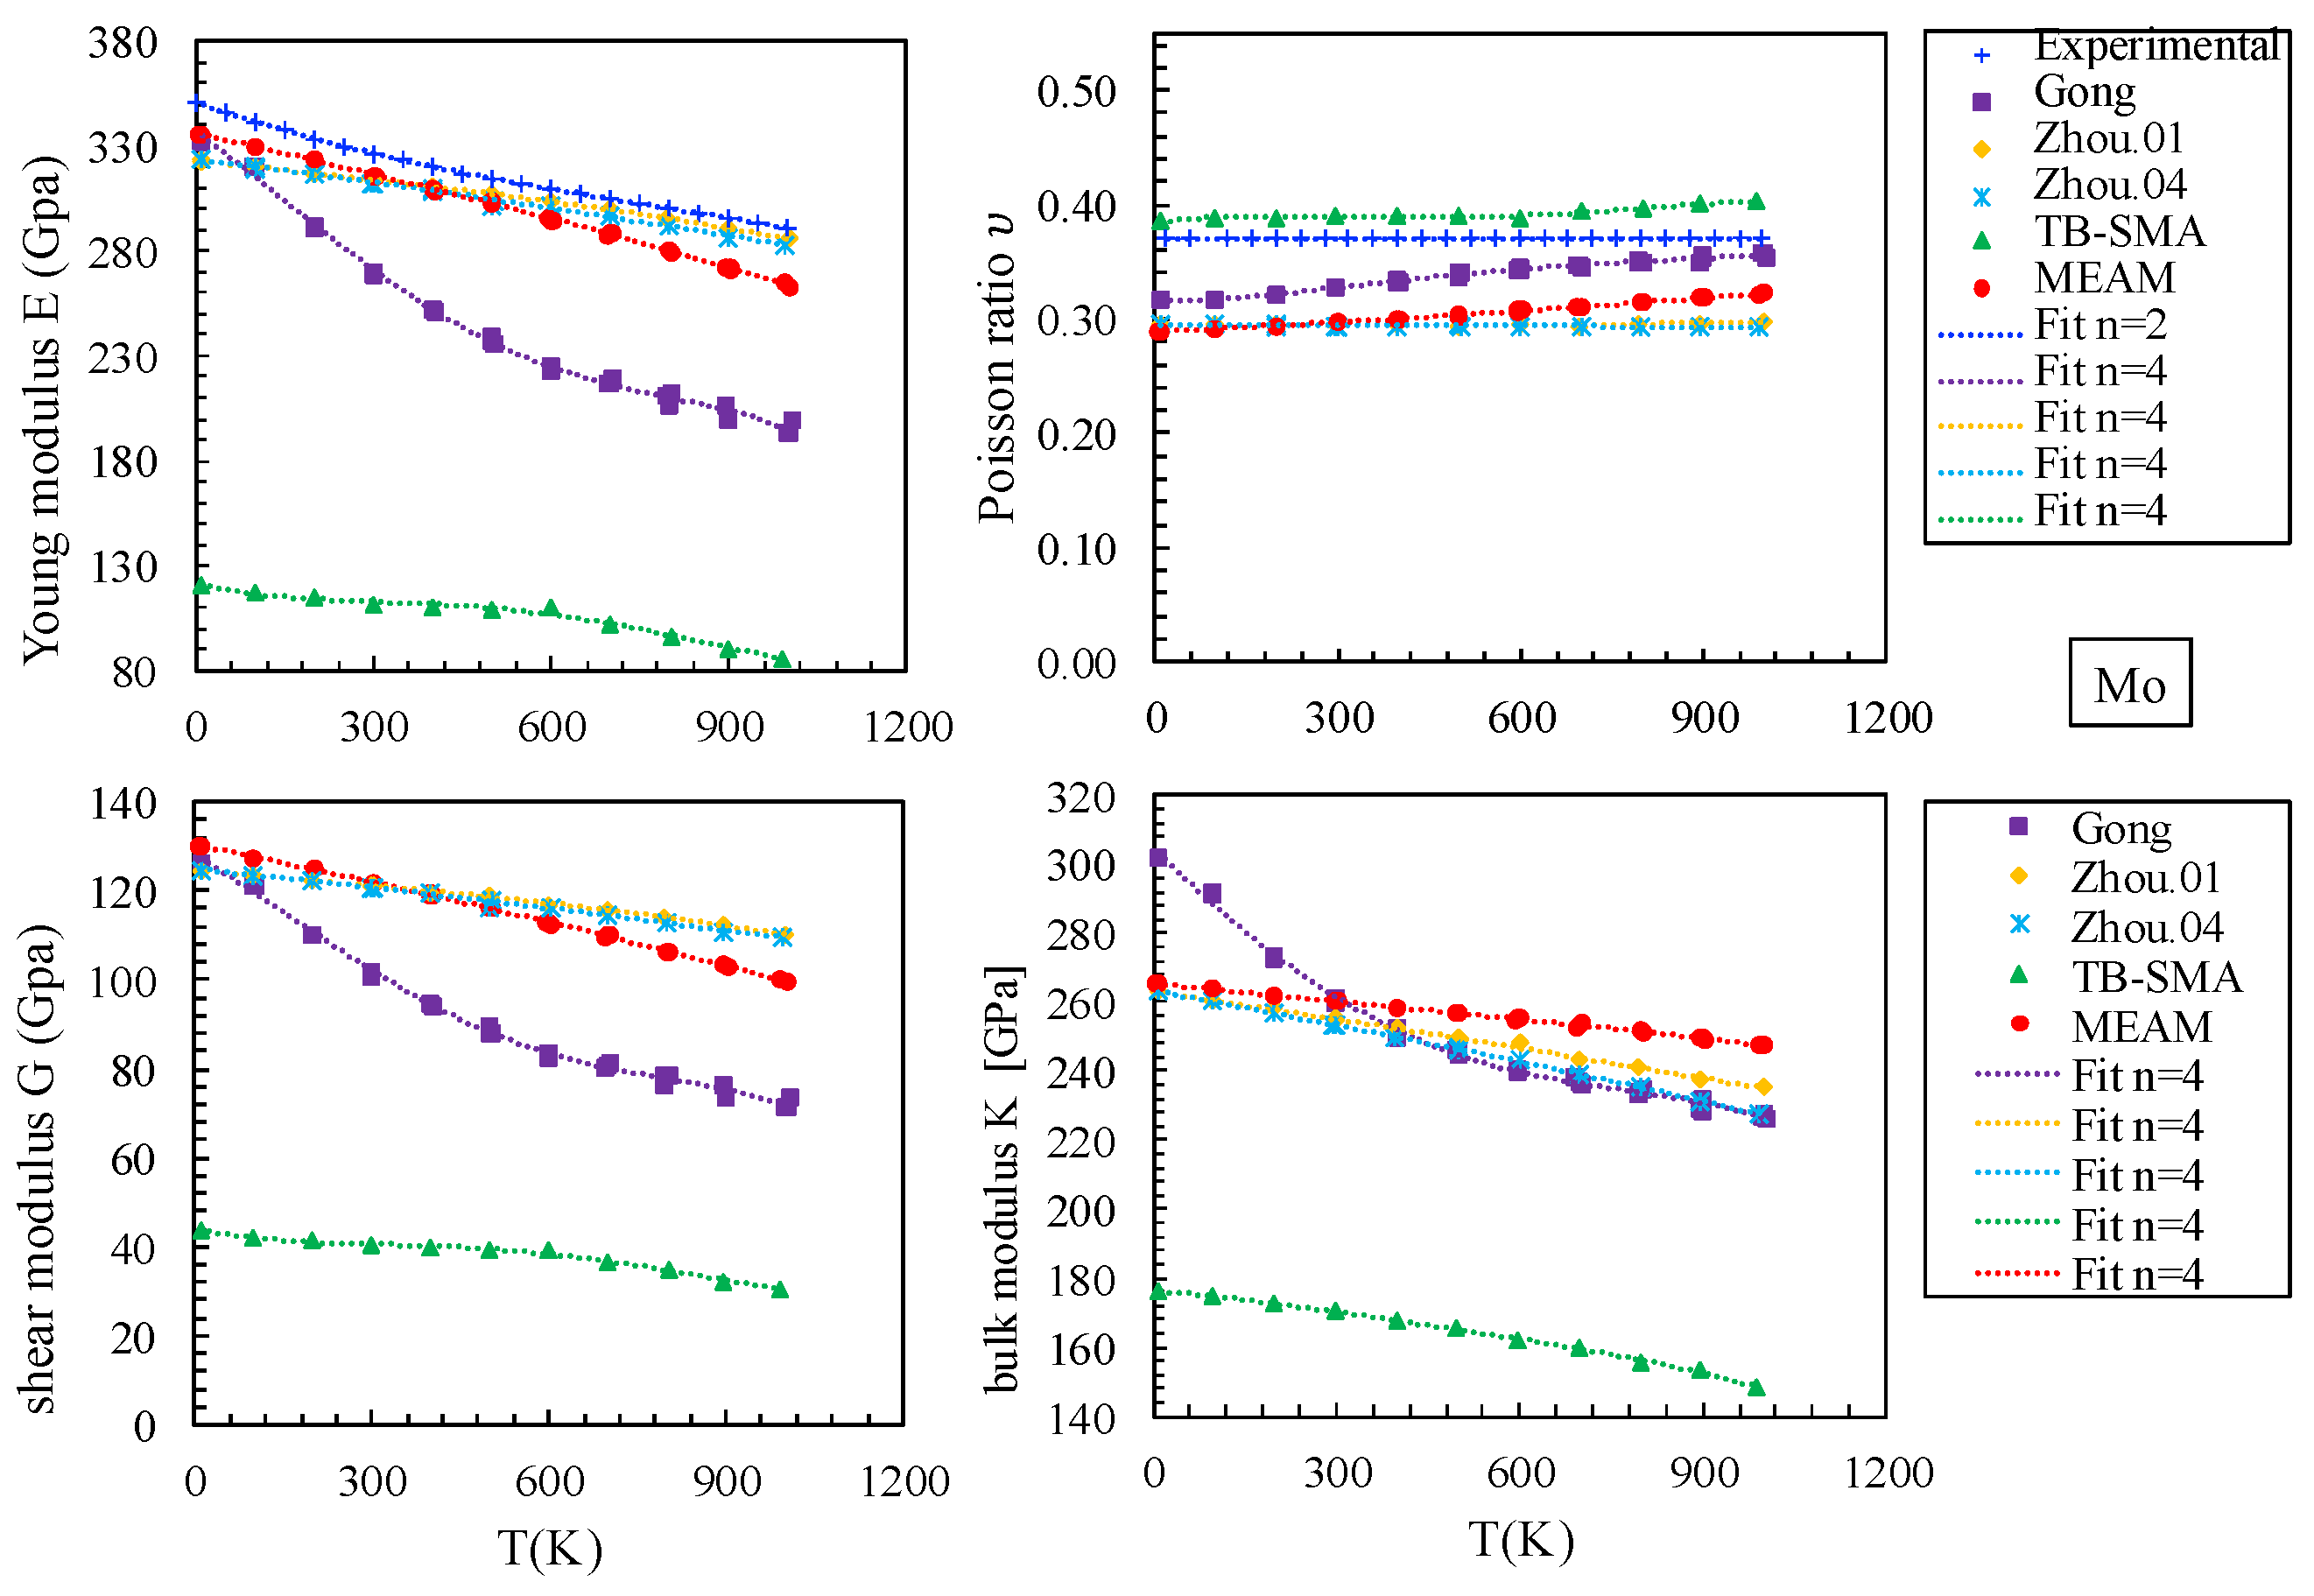
3.1.3. Elastic Constants and Elastic Moduli

Elastic constants were computed by imposing a deformation, ε i j , on the simulation box and measuring the resulting stress σ i j . To respect the assumption of linear elasticity, the size of the simulation box was deformed from −0.1% up to 0.1% at 0 K. The elastic constants were directly computed using σ i j = C i j ε i j . The results are reported in Table 3. The inability of the TB-SMA potential to model the elastic properties of Mo (bcc lattice) is attributed to its lack of angular dependence [35]. The calculations were repeated at finite temperatures up to 1100 K (see Figure S5 in Supplementary Material (SM)). Using these elastic constants along with the Voigt-Reuss-Hill approximation, which is an averaging scheme, the anisotropic single-crystal elastic constants can be converted into isotropic polycrystalline elastic moduli [40,41]. The Young modulus E, Poisson ratio υ , shear modulus G, and bulk modulus K are calculated using the elastic constants was computed at 0 K and at finite temperature up to 1100 K. The bulk modulus is expressed in terms of the elastic constants:
K = C 11 + 2 C 12 3 .
The upper (Voigt approximation) and lower bounds (Reuss approximation) of shear moduli read
G V = C 11 C 12 + 3 C 44 5
and
G R = 5 C 44 ( C 11 C 12 ) 4 C 44 + 3 ( C 11 C 12 ) .
Based on the Hill empirical average [40,41], we introduced the isotropic elastic shear modulus as follows:
G = G V + G R 2 .
It is then straightforward to find Poisson’s ratio, υ , and Young’s modulus, E, from the well-known isotropic relations as follows:
υ = 3 K 2 G 2 ( 3 K + G )
and
E = 9 G K 3 K + G .
The results obtained at finite temperature are presented in Figure 4 for Cu and in Figure 5 for Mo. The symbols are the calculated points, and the dotted lines are the corresponding fourth-order polynomial fits. Regarding the elastic constants at 0 K, the Gong and Zhou.04 potentials are the most accurate for copper, closely matching the experimental values for all three elastic constants ( C 11 , C 12 , and C 44 ). Additionally, the Zhou.01 potential shows results that are very close to the experimental values. For molybdenum, the Zhou.01, Zhou.04, and MEAM potentials provide the best approximation to the experimental values. With respect to the variation of elastic properties with temperature and by comparing the simulation results with the experimental data [44,45], the Zhou.01 potential appears as the most reliable for predicting the elastic properties of both materials across the temperature range. Calculations carried out on pure metals indicate that the Zhou.01 potential provides the best compromise for most of the quantities calculated. This potential was therefore adopted to simulate the interface in the Cu-Mo bilayer system.

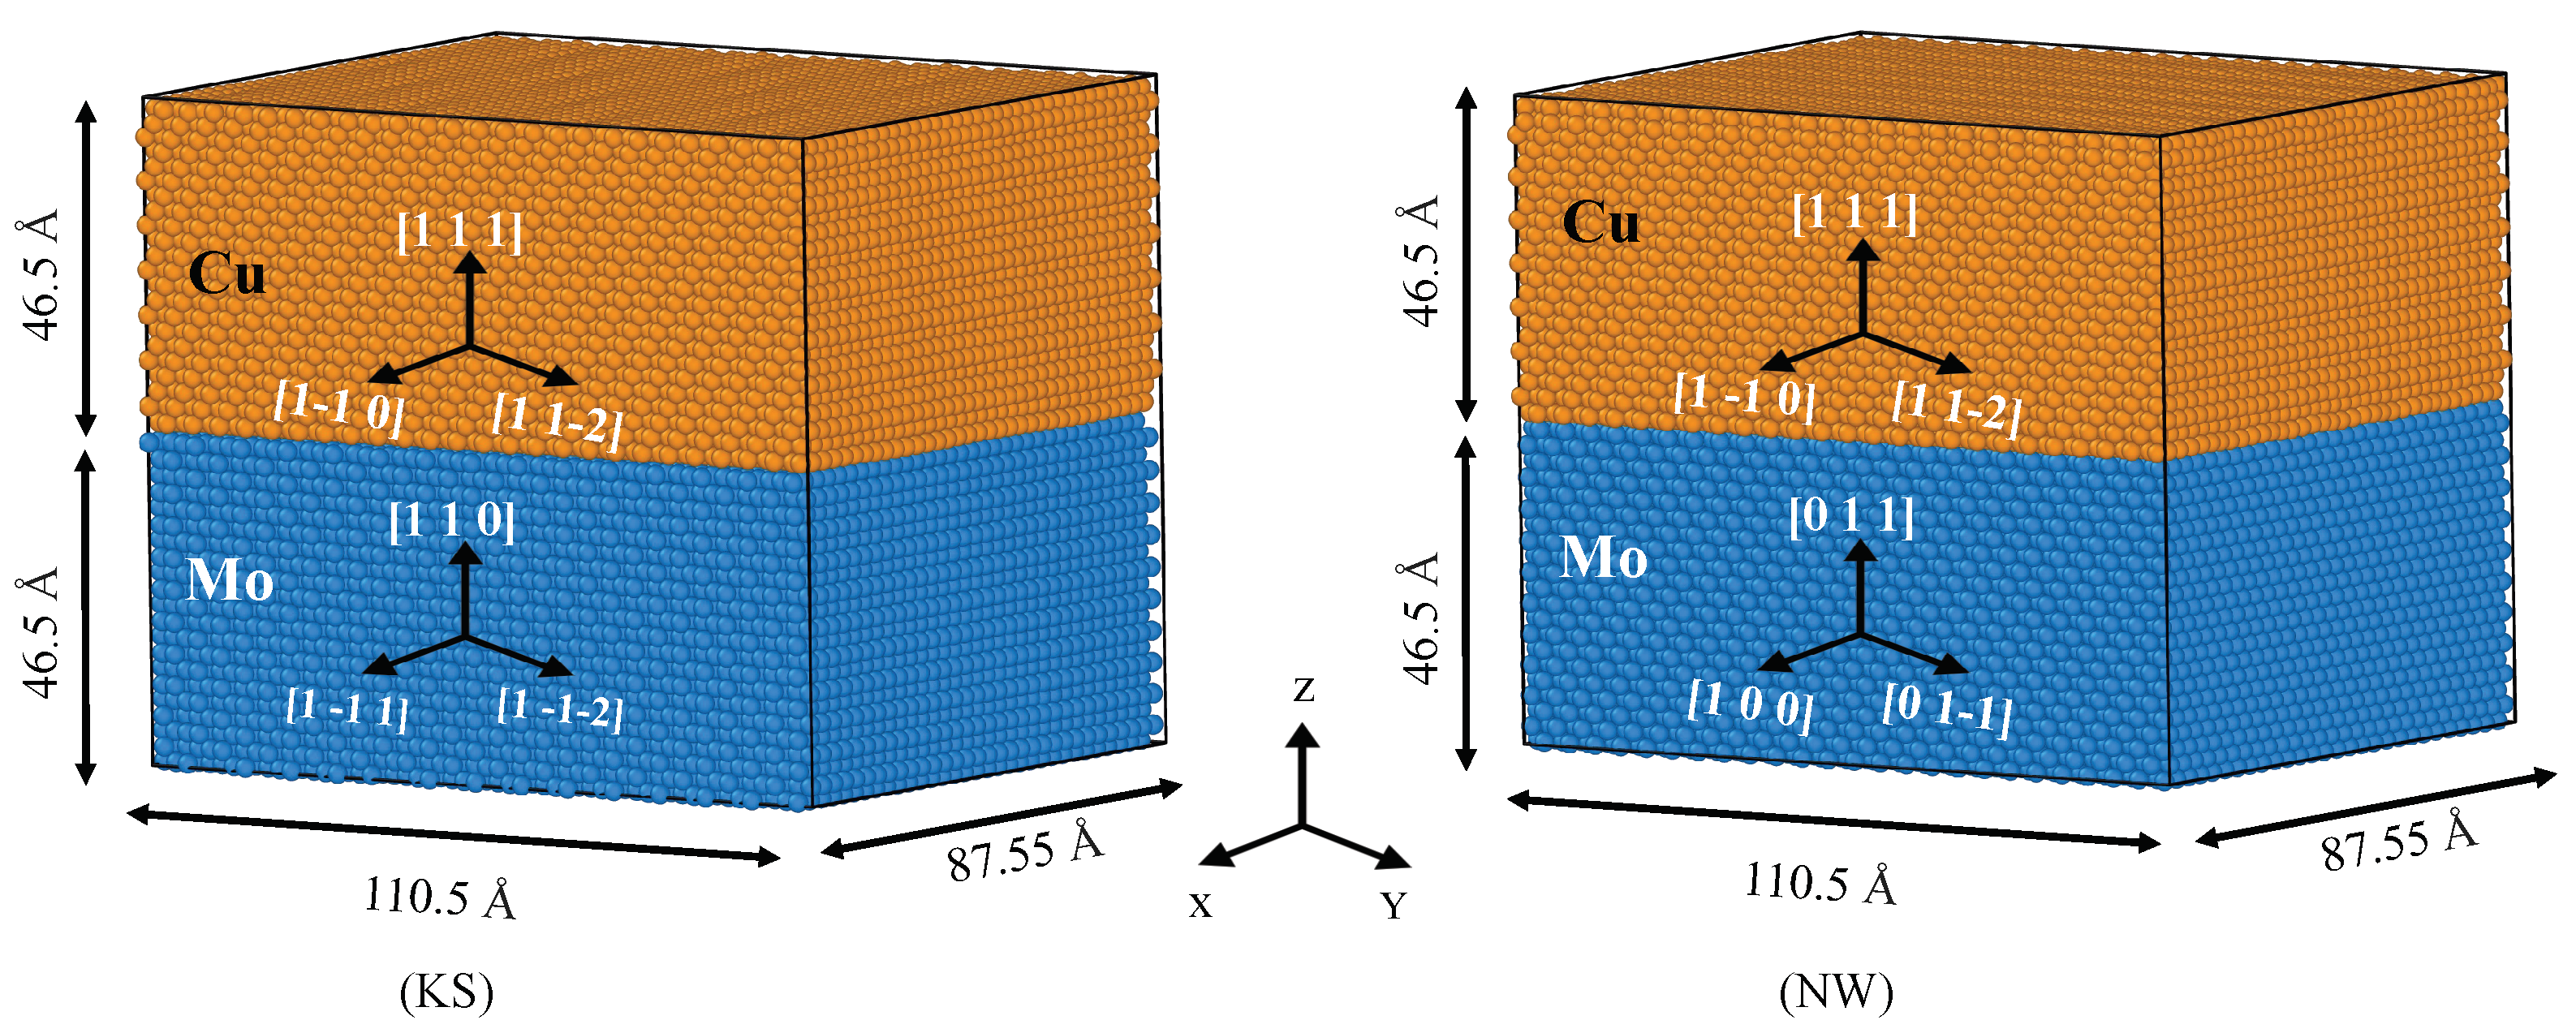
3.2. Modeling of the Cu/Mo Interface

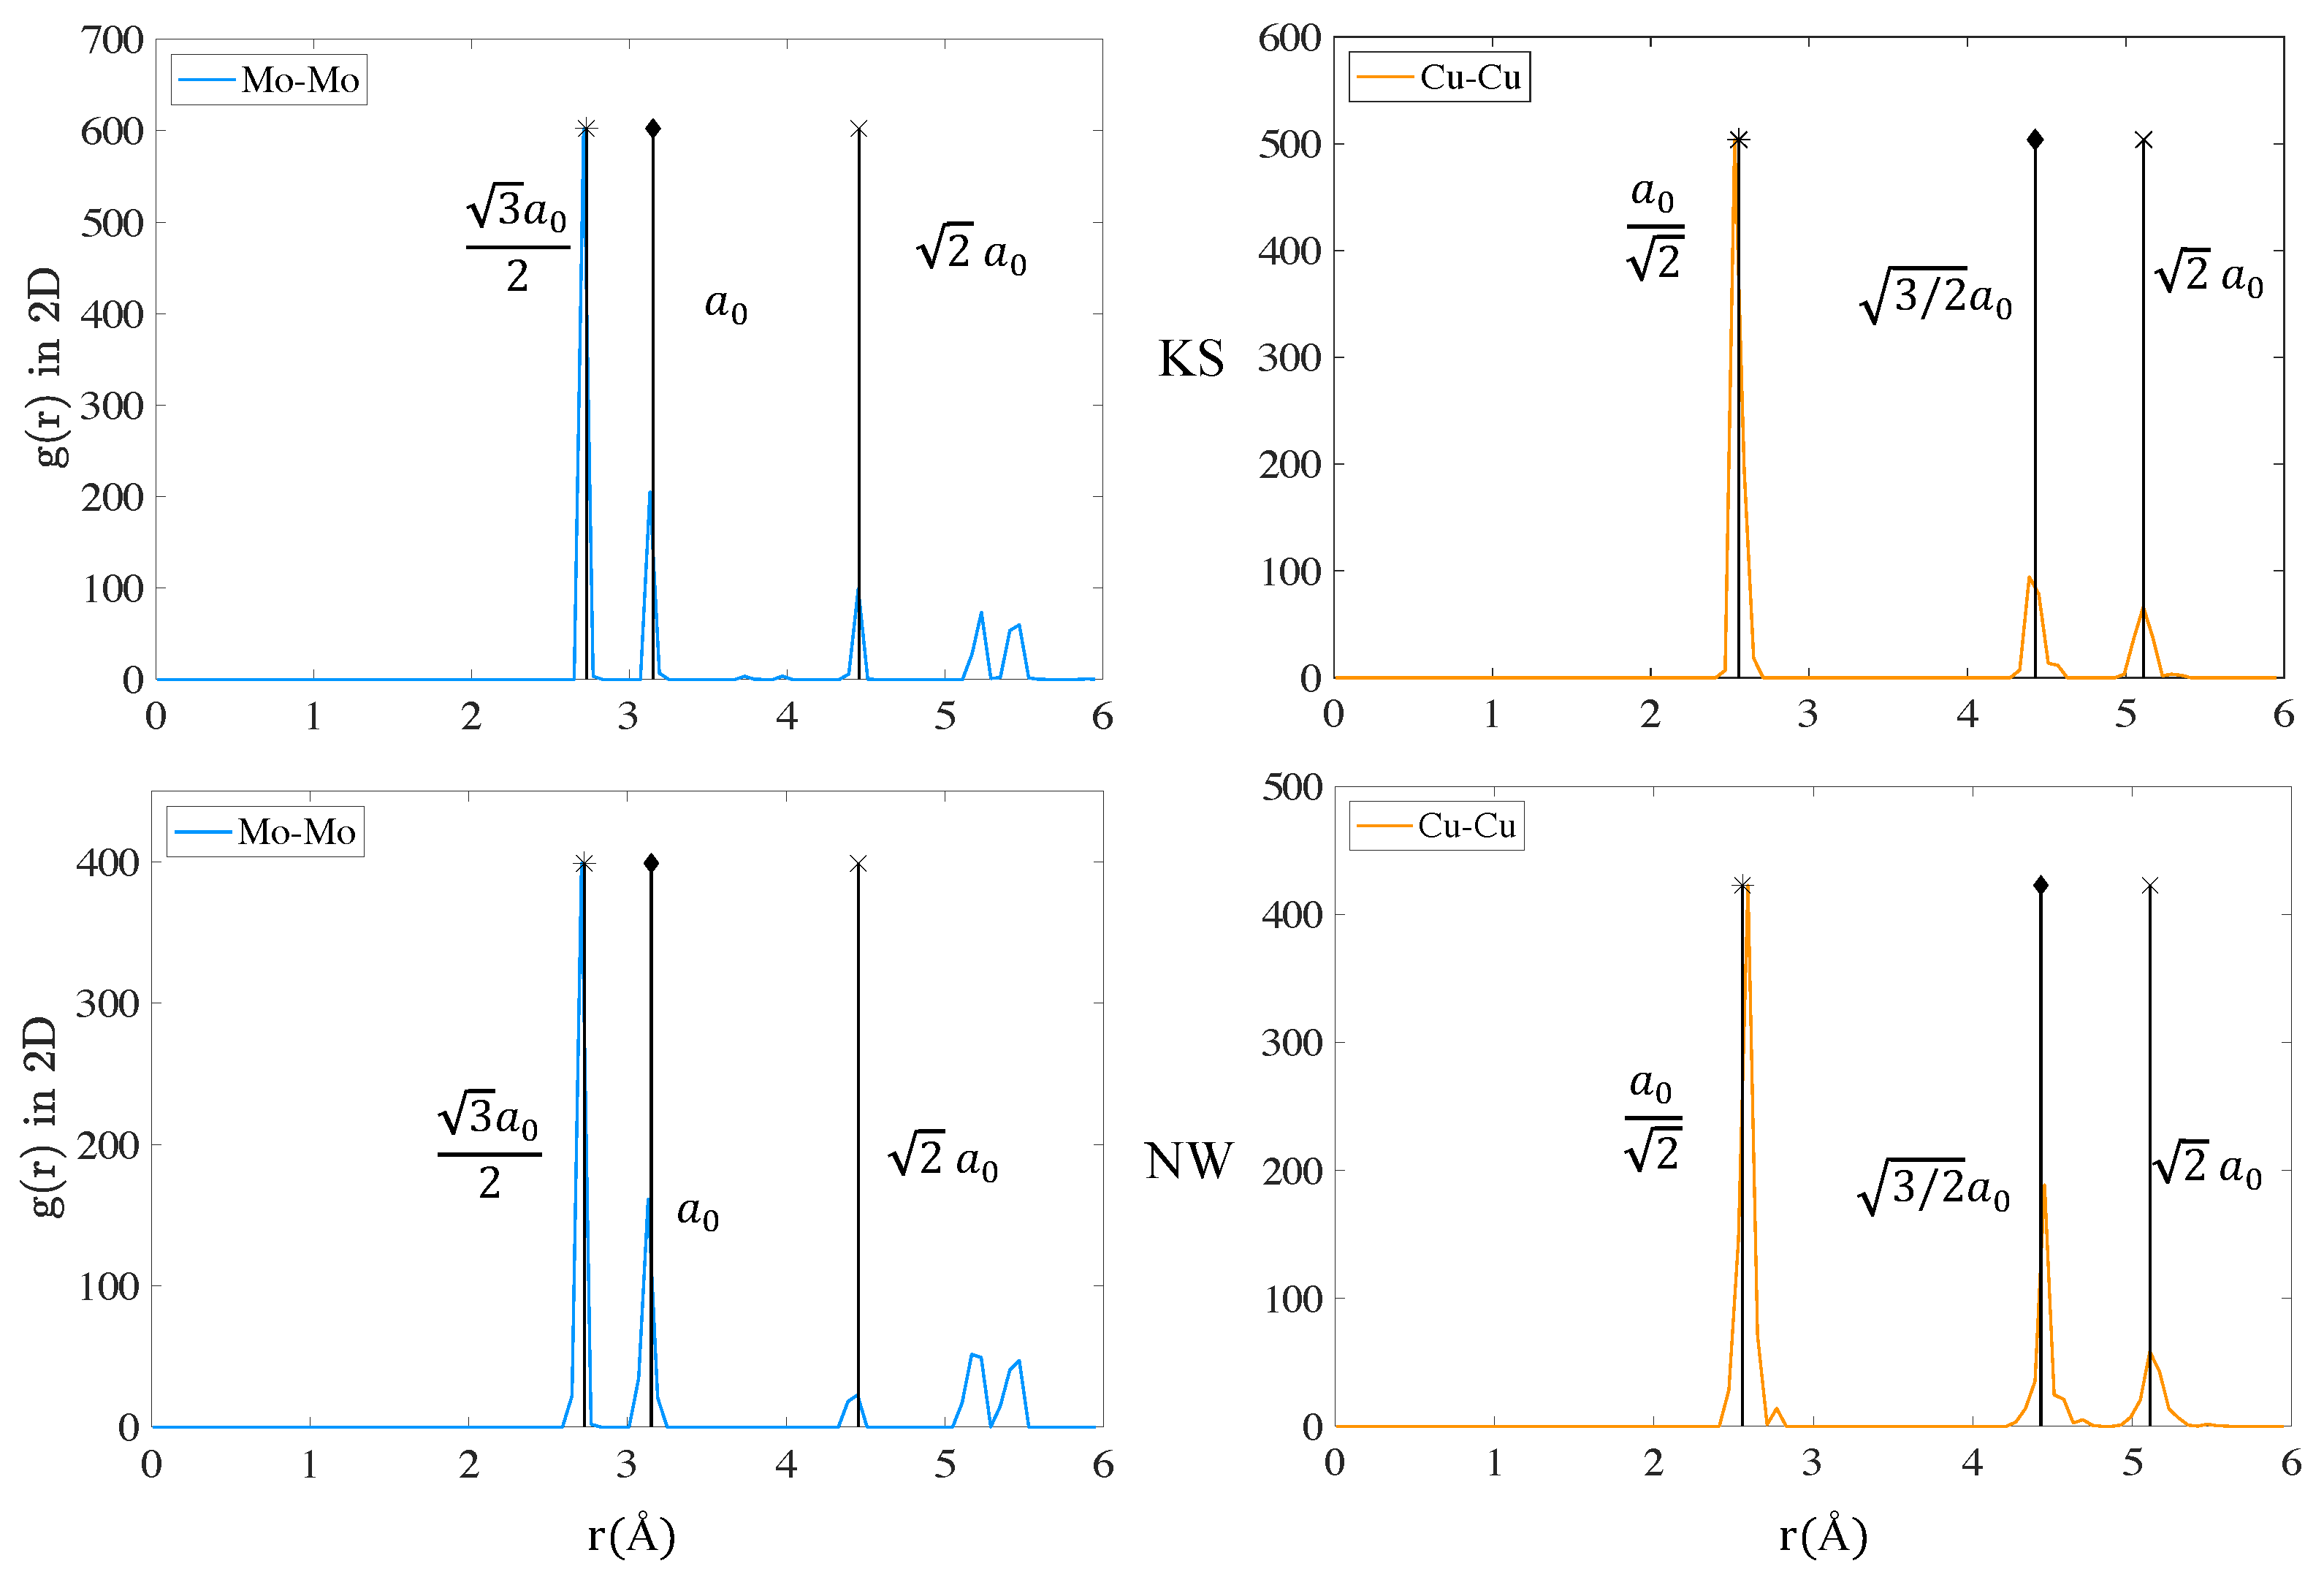
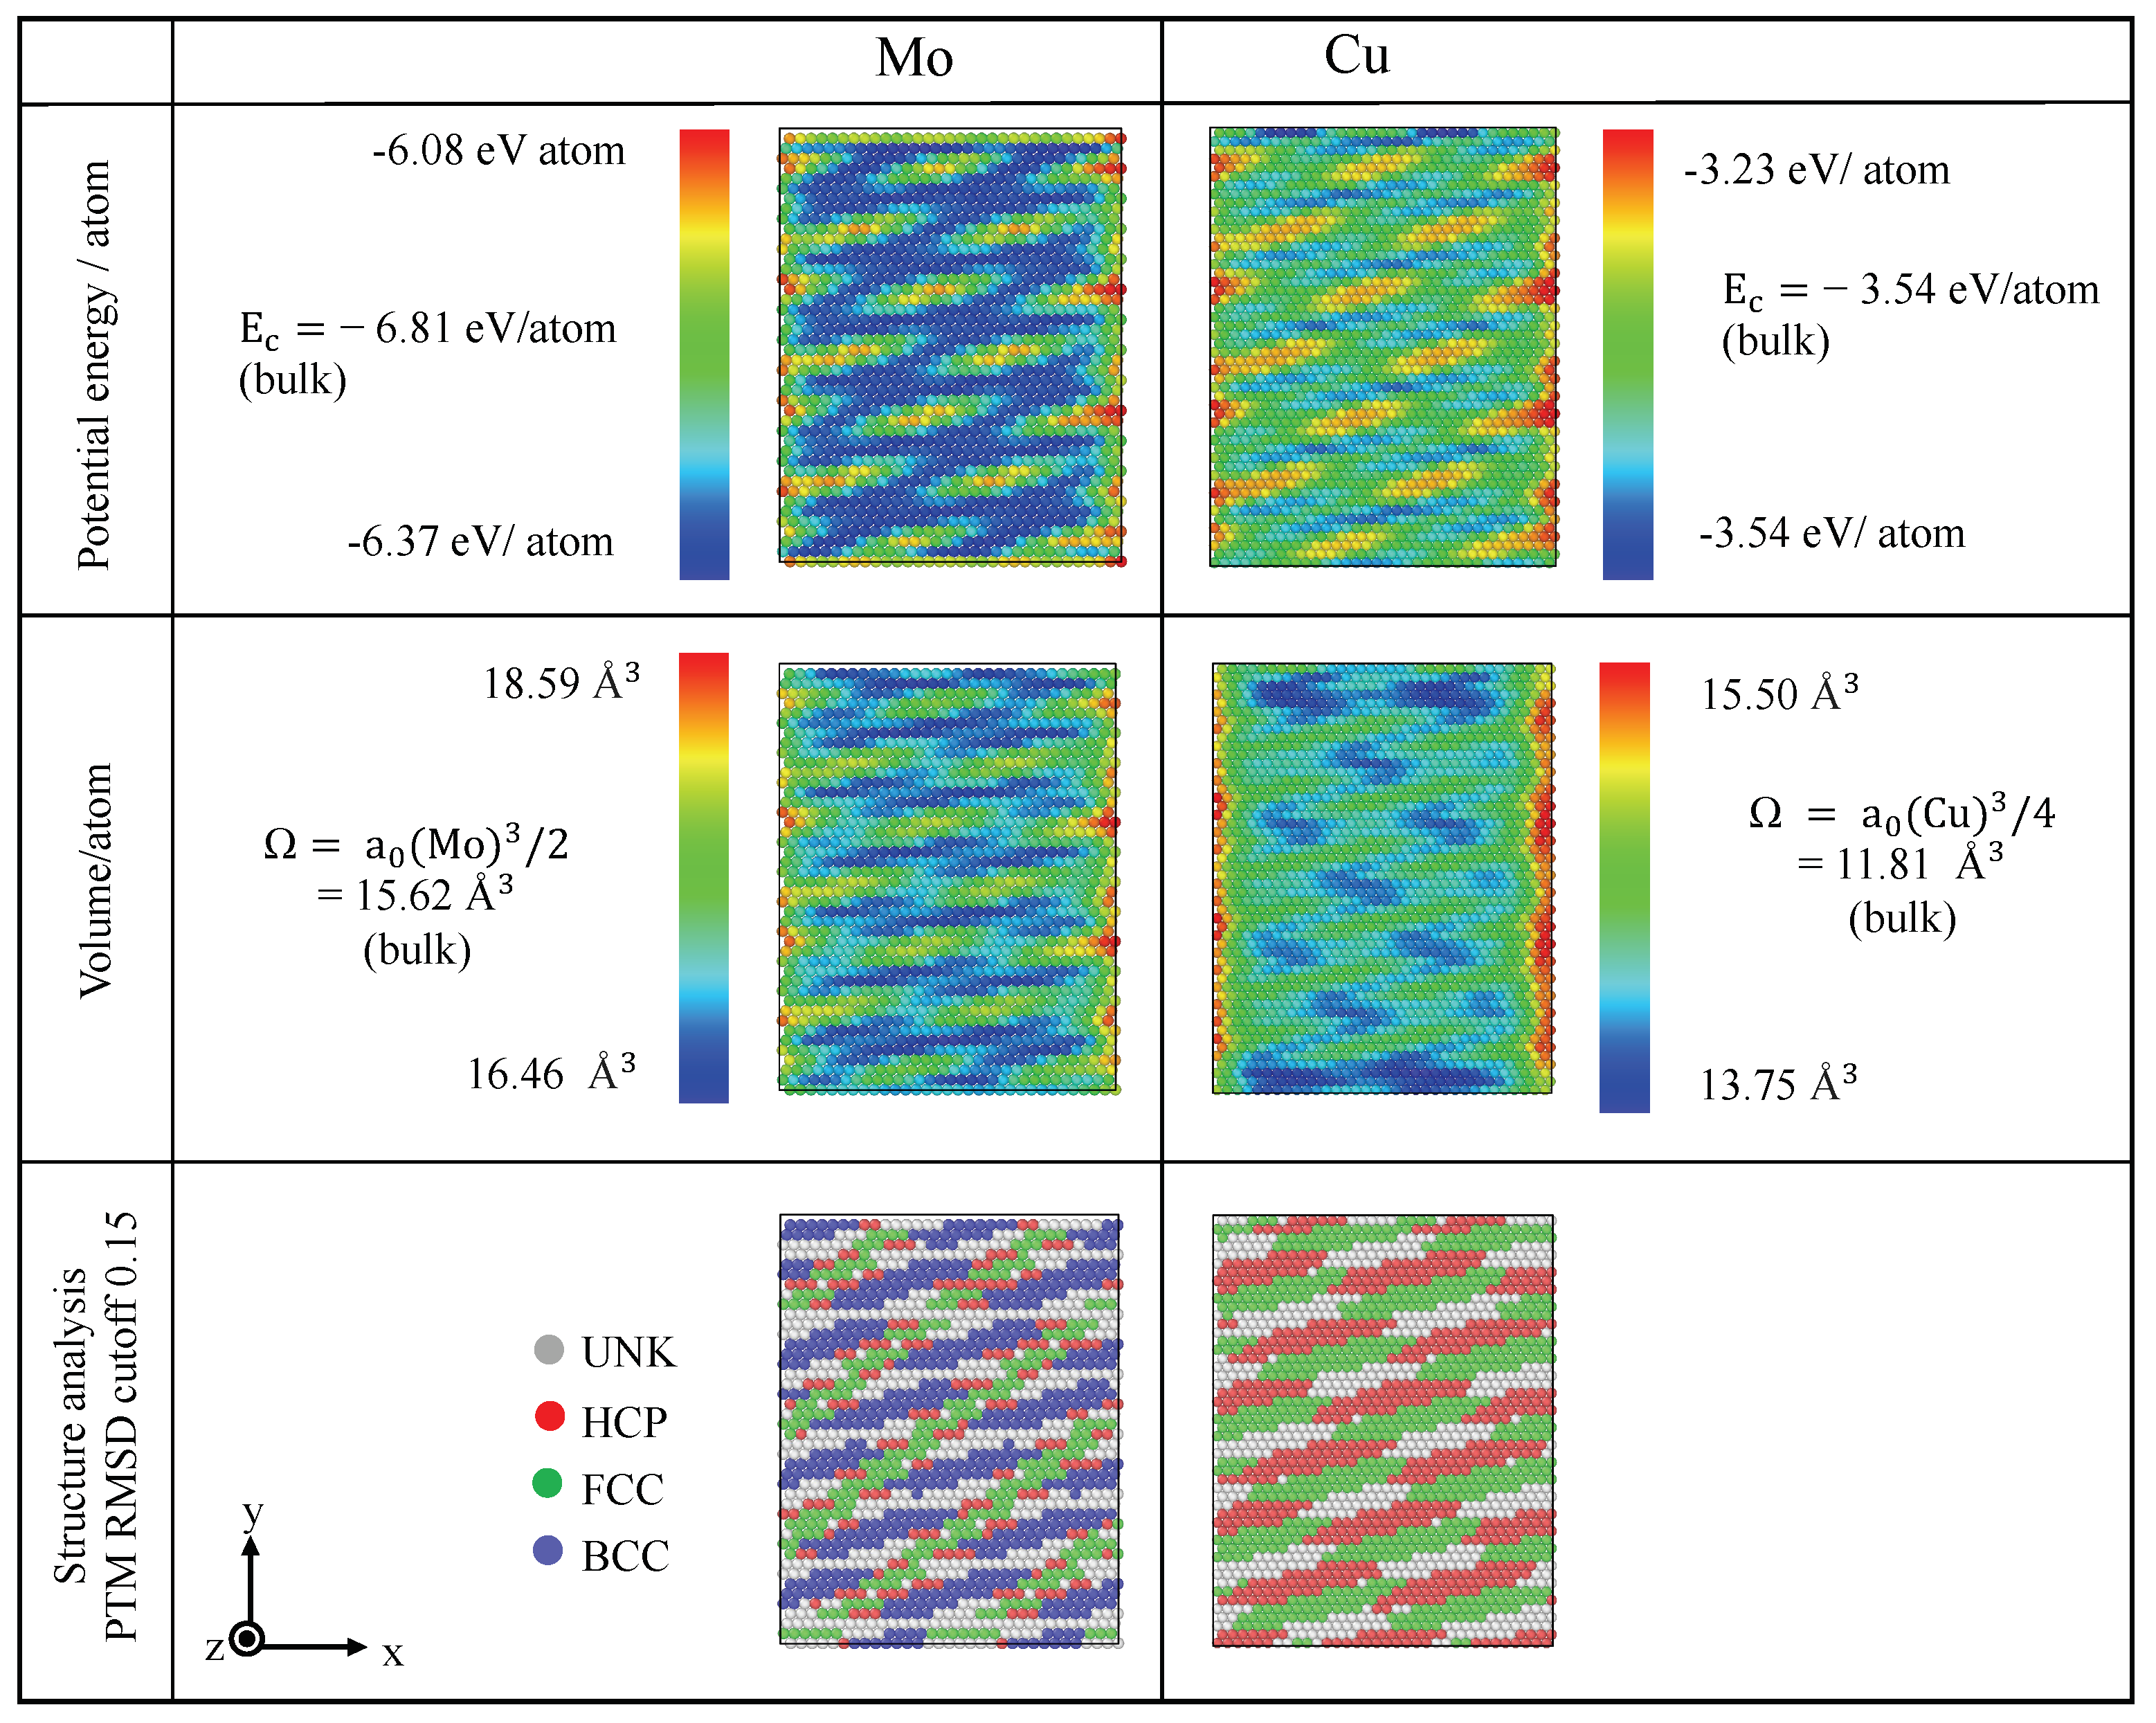
3.2.1. Energy, Atomic Volume and Local Atomic Environment

Bimetallic interfaces are categorized based on their crystal structure and the degree of lattice mismatch between the two metals [1]. This lattice misfit is commonly defined as f = a ( A ) / a ( B ) , where a ( A ) and a ( B ) are the lattice parameters of metals A and B, respectively. When the two metals in contact share the same crystal structure, coherent interfaces occur for f < 10 % , semi-coherent interfaces are observed when f ranges from 10% to 20% and incoherent interfaces for f > 20 % . For A and B having different crystalline structures, incoherent interfaces are observed regardless of the lattice misfit. In the case of Cu-Mo, the interface is incoherent with a lattice misfit of 15 % . For the interface between fcc(111) and bcc(110) crystals, two types of orientation relationships have been identified during epitaxial growth experiments. One is the Nishiyama–Wassermann (NW) relationship [21,22] with [ 1 1 ¯ 0 ] fcc [ 100 ] bcc , and the other is the Kurdjumov–Sachs (KS) relationship [23] with [ 1 1 ¯ 0 ] fcc [ 1 1 ¯ 1 ] bcc . To determine the preferential epitaxial orientation in Cu-Mo NMMs using Zhou0.1, we created two simulation boxes: one corresponding to KS and the other to NW orientation relationship. As shown in Figure 6, the initial configuration includes a Mo layer and a Cu layer. The typical size of the simulation box is L x = 8.755 nm , L y = 11.05 nm , and L z = 9.30 nm , fitted with 99% occupation in the x-direction for Cu and Mo in the KS box and 99% occupation in the x-direction for Cu in the NW box. The KS box contained 22 atomic planes of Cu and 21 of Mo along the z-direction, as shown in Figure 6 (KS). Along the lateral directions, the simulation box consisted of 34 atomic planes of Cu and 32 of Mo along the x-direction, and 50 atomic planes of Cu and 43 of Mo along the y-direction. The box was composed of 66,296 atoms (37,400 Cu and 28,896 Mo atoms). The NW box contained 22 atomic planes of Cu and 21 of Mo along the z-direction, as shown in Figure 6 (NW). Along the lateral directions, the simulation box consisted of 34 atomic planes of Cu and 28 of Mo along the x-direction, and 50 atomic planes of Cu and 50 of Mo along the y-direction. The box was composed of 66,800 atoms (37,400 Cu and 29,400 Mo atoms).
We minimized the energy of the system by allowing the atom positions and box size to change using a conjugate gradient procedure. We then computed with the OVITO software the partial radial distribution function, g i j ( r ) , where i and j represent Cu or Mo atoms and r denotes the atomic distance [46]. The radial distribution function (RDF) is expressed as:
g ( r ) = c i 2 g i i ( r ) + 2 c i c j g i j ( r ) + c j 2 g j j ( r ) ,
where c i and c j are the concentrations of i and j, respectively. Figure 7 shows the partial radial distribution functions g ( r ) computed in 2D for the first atomic planes of Mo and Cu at the interface. Vertical lines marked with a cross (∗) indicate the theoretical distances of the first neighbors in a bulk system, while those marked with a diamond (⧫) correspond to the second neighbors. The computed peaks align well with the theoretical distances of the first and second neighbors in the bulk. For the first Mo plane neighboring the interface, the peaks are located precisely at the theoretical positions ( 3 a 0 2 , a 0 , and 2 a 0 ), confirming that the local structure remains consistent with a bulk configuration. For the first Cu plane neighboring the interface, the peaks also align with the expected positions ( a 0 , 2 a 0 , and 3 2 a 0 ), but they exhibit slight broadening. This broadening can be attributed to the misfit, i.e., the difference in lattice parameters between Mo and Cu, which introduces a slight distortion in the atomic structure of Cu at the interface. In contrast, the Mo atoms keep their bulk configuration.
Snapshots of the first Mo and Cu planes adjacent to the interface are shown in Figure 8 for KS orientation and in Figure 9 for NW. Atoms were colored according to different indicators such as potential energy per atom, volume per atom, and local environment (i.e., polyhedral template matching analysis). We recovered the typical Moiré fringes observed in [27] for the fcc(111) and bcc(110) interface. For KS and NW configurations, the potential energy per atom is higher at the interface compared to bulk atoms, reflecting the strain caused by lattice mismatch. However, the KS interface (Figure 8) exhibits larger variations in energy. For Mo, the potential energy ranges from 6.08 eV / atom to 6.37 eV / atom , while for Cu it varies from 3.23 eV / atom to 3.54 eV / atom . By comparison, the NW interface (Figure 9) shows a narrower energy range, with Mo spanning from 6.18 eV / atom to 6.40 eV / atom and Cu ranging from 3.30 eV / atom to 3.57 eV / atom . These smaller variations in the NW case suggest a better accommodation of the lattice mismatch, resulting in a more uniform energy distribution across the interface.
The atomic volume further highlights differences between the two configurations. In the KS case, Mo atoms exhibit a volume ranging from 16.46 Å 3 to 18.59 Å 3 , deviating significantly from the bulk value of 15.62 Å 3 , while Cu atoms show volumes between 13.75 Å 3 and 15.50 Å 3 , compared to a bulk value of 11.81 Å 3 . In contrast, the NW interface shows smaller deviations: Mo volumes range from 15.52 Å 3 to 17.76 Å 3 , and Cu volumes range from 13.27 Å 3 to 14.60 Å 3 . These reduced distortions in the NW configuration indicate a more stable atomic arrangement, with fewer local compressions and expansions caused by the interface. Additionally, structural analysis using PTM (with a cutoff of 0.15 RMSD) reinforces these observations. In the KS configuration, the alternating Moiré fringe patterns are more pronounced (more regions of disordered atomic arrangements (unk)), reflecting stronger lattice mismatch and interfacial strain. The NW configuration, on the other hand, exhibits a more gradual transition between the fcc(Cu) and bcc(Mo) phases, with a reduced strain distribution across the interface. This further supports the idea that the NW orientation relationship better accommodates the differences in lattice parameters between Mo and Cu.
Overall, the NW interface exhibits smaller variations in potential energy and atomic volume compared to the KS interface, reflecting reduced strain and more favorable interfacial stability. These results suggest that the NW configuration provides a more energetically and structurally stable interface for the Cu-Mo system.

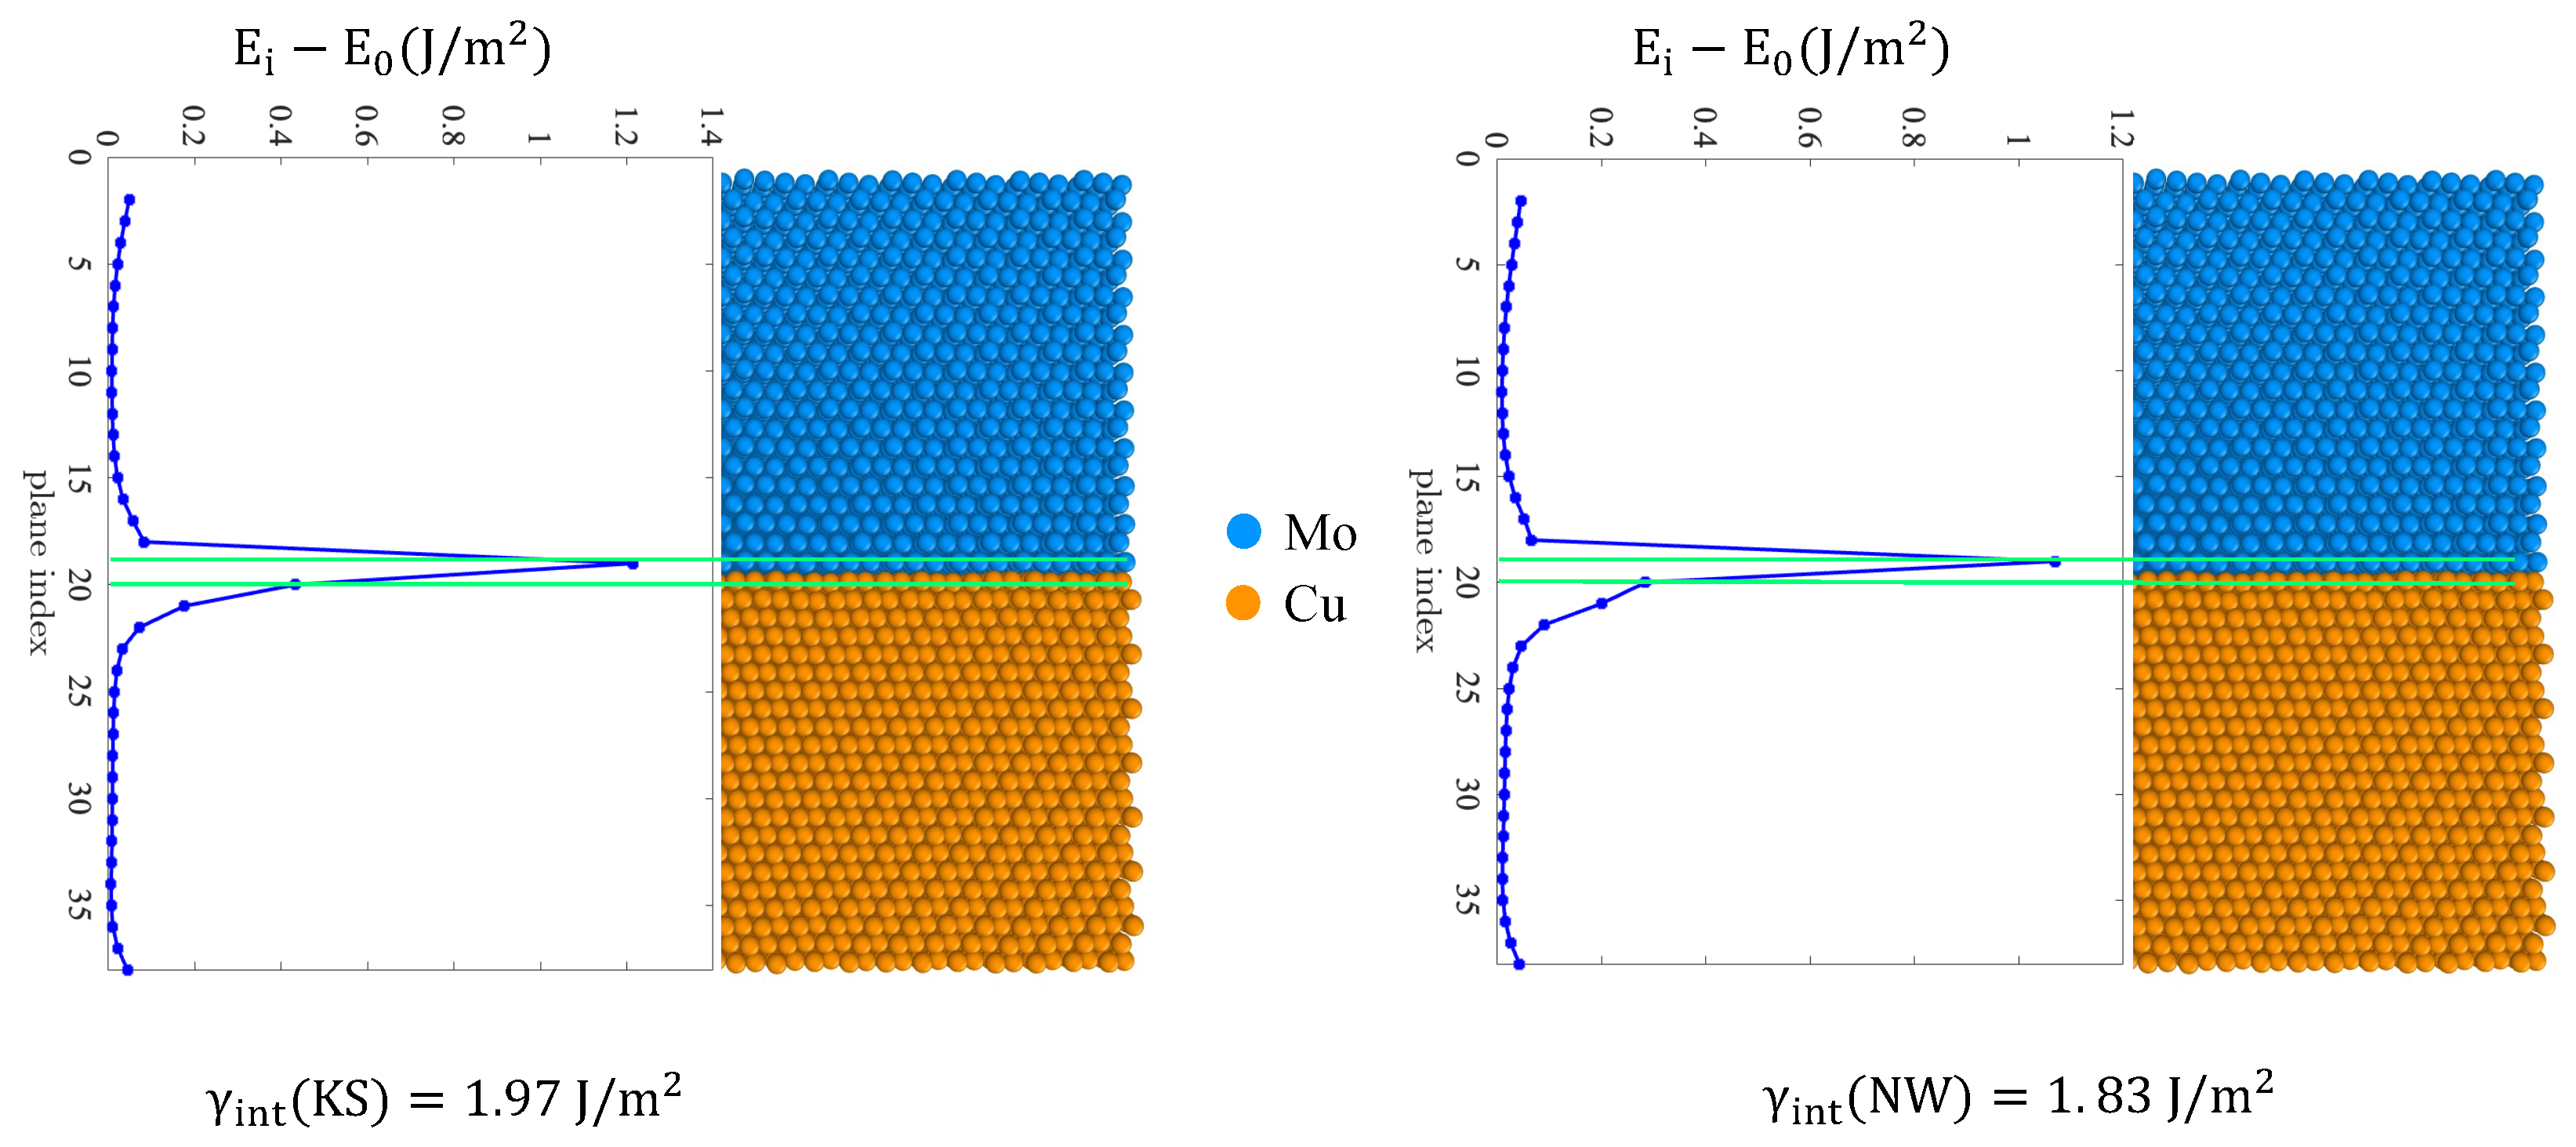
3.2.2. Energy of the Interface

The interfacial region can be clearly identified according to the average potential energy of atoms in each plane adjacent to the interface after relaxation. Figure 10 depicts the excess potential energy compared to bulk energy in each atomic plane parallel to the interface. The potential energies of the planes near the interface significantly differ from those in the bulk region (i.e., the region far away from the interface, in the middle of the layer). The interface energy γ i is given by:
γ i = 1 A E Cu E 0 , Cu + E Mo E 0 , Mo
where E is the actual potential energy of plane , E 0 , = N Cu E 0 Cu + N Mo E 0 Mo is the reference bulk energy, with N Cu representing the number of Cu atoms in plane , N Mo representing the number of Mo atoms in plane , and A being the interface area. The interface energy evaluated with Equation (8) is γ i = 1.97 J / m 2 for an interface with Kurdjumov-Sachs (KS) orientation [ 1 1 ¯ 0 ] fcc [ 1 1 ¯ 1 ] bcc , and γ i = 1.83 J / m 2 for an interface with Nishiyama-–Wassermann (NW) orientation [ 1 1 ¯ 0 ] fcc [ 100 ] bcc . Although there is limited information in the literature regarding the interfacial energy of Cu-Mo systems, some studies have reported data that agree well with our observations. Experimentally, Yeom et al. [8] estimated (111)Cu/(110)Mo interface energy in a range between 0.5 and 2.0 J/m² at 600 °C, in good agreement with our values. Other studies were conducted using an ab initio approach by Li et al. [47] with three other interface orientations, namely (111)Cu/(111)Mo, (110)Cu/(110)Mo, and (100)Cu/(100)Mo. Despite the difference of orientations, these results fall within the same order of magnitude, with values of 3.51, 4.11, and 3.37 J/m², respectively. For Cu/W and Cu/Nb, Bodlos et al. [27] computed the interfacial (111)/(110) energy using DFT and EAM calculations, showing that NW is more stable by around 0.15 eV, again corroborating the present findings. From an energetic perspective, the NW orientation proves to be more stable than the KS orientation.

3.2.3. MD Simulation of the Growth of Sputtered Cu Film on Mo Substrate

The calculations at 0 K presented above revealed that the NW orientation is energetically more stable. To validate at finite temperature this theoretical finding and investigate the naturally occurring orientation relationship, deposition simulations were carried out using the Zhou.01 potential. Figure 11 illustrates the MD model for the deposition of Cu atoms onto the Mo (110) and (011) surfaces. The simulation domain measured 21.5 a × 21.8 a × 27 a (where a = 3.15 Å , the lattice constant of Mo). The substrate itself had dimensions of 21.5 a × 21.8 a × 11.1 a . The z-axis represents the film growth direction. For Mo (110), the crystal orientations were x = [ 1 1 ¯ 1 ] , y = [ 1 1 ¯ 2 ¯ ] , and z = [ 110 ] , whereas for Mo (011), we used x = [ 100 ] , y = [ 01 1 ¯ ] , and z = [ 011 ] . Periodic boundary conditions were applied along the x- and y-axes, while the z-axis was subject to non-periodic and fixed boundary conditions. The incident Cu atoms originate from the region between the incident plane and the virtual plane (see Figure 11), with a velocity of 3.43 Å/ps (i.e., E c = 0.039 eV) and a deposition rate of 1 atom per 100 ps. A virtual plane allows us to reflect Cu atoms that eventually reach the top of the box. Mo atoms located at the bottom of the box (i.e., z < 2.3 nm) were held fixed while the others (i.e., 2.3 nm < z < 3.5 nm) were thermalized at 300K using a Langevin thermostat with a damping parameter equal to 1 ps.
After deposition, the atomic ordering of the first three deposited Cu layers was investigated. Figure 12 shows the structural analysis of Cu after deposition on Mo(110) at 300 K, focusing on the first three atomic layers at the interface. The g ( r ) curve in 2D (on the left) shows the distribution of distances between the nearest neighbors for the first three Cu layers and the last Mo layer (the first Mo layer in contact with Cu). In the first Cu layer, the snapshots (see images a–d in Figure 12) show a mixture of fcc (green atoms) and bcc (blue atoms) structures, indicating that Cu locally adopts a bcc structure in certain regions under the strong influence of the Mo substrate, along with some regions exhibiting an hcp (stacking fault) structure (in red). The white color represents atoms whose structure could not be identified. In the second Cu layer, the peaks begin to align with the theoretical positions for fcc(111), but with a slightly larger full width at half maximum, reflecting residual strain as the structure transitions completely from bcc (first layer) to fcc (third layer). Finally, in the third Cu layer, the peaks correspond well to the theoretical positions for fcc(111), indicating the presence of the stable fcc structure. We observed initially a layer-by-layer (2D) growth mode for the first six copper planes. This growth mode ensures initial adherence consistent with the substrate structure. After that stage, the mechanism changed and as shown in Figure 12d, the formation of islands is observed with the presence of 3D growth. However, as growth progresses, small islands appear in the upper layers, signaling a transition from two-dimensional to three-dimensional (3D) growth. In summary, the results demonstrate that Cu deposited on Mo(110) is initially influenced by the bcc structure of the substrate in the first atomic layer, before transitioning to its stable fcc(111) structure by the third layer. This transition, combined with the shift from a 2D to a 3D growth mode, highlights the complex interactions between the substrate and the deposited material, influencing both local structure and overall growth mode. Note that similar simulations were conducted using the Gong potential. With that potential, the computed interface energy is also lower for the NW ( γ i = 1.54   J / m 2 ) orientation compared to the KS ( γ i = 1.61   J / m 2 ). Nevertheless, the deposition of Cu on Mo subtrates never resulted in a clear orientation relationship as obtained with Zhou.01.

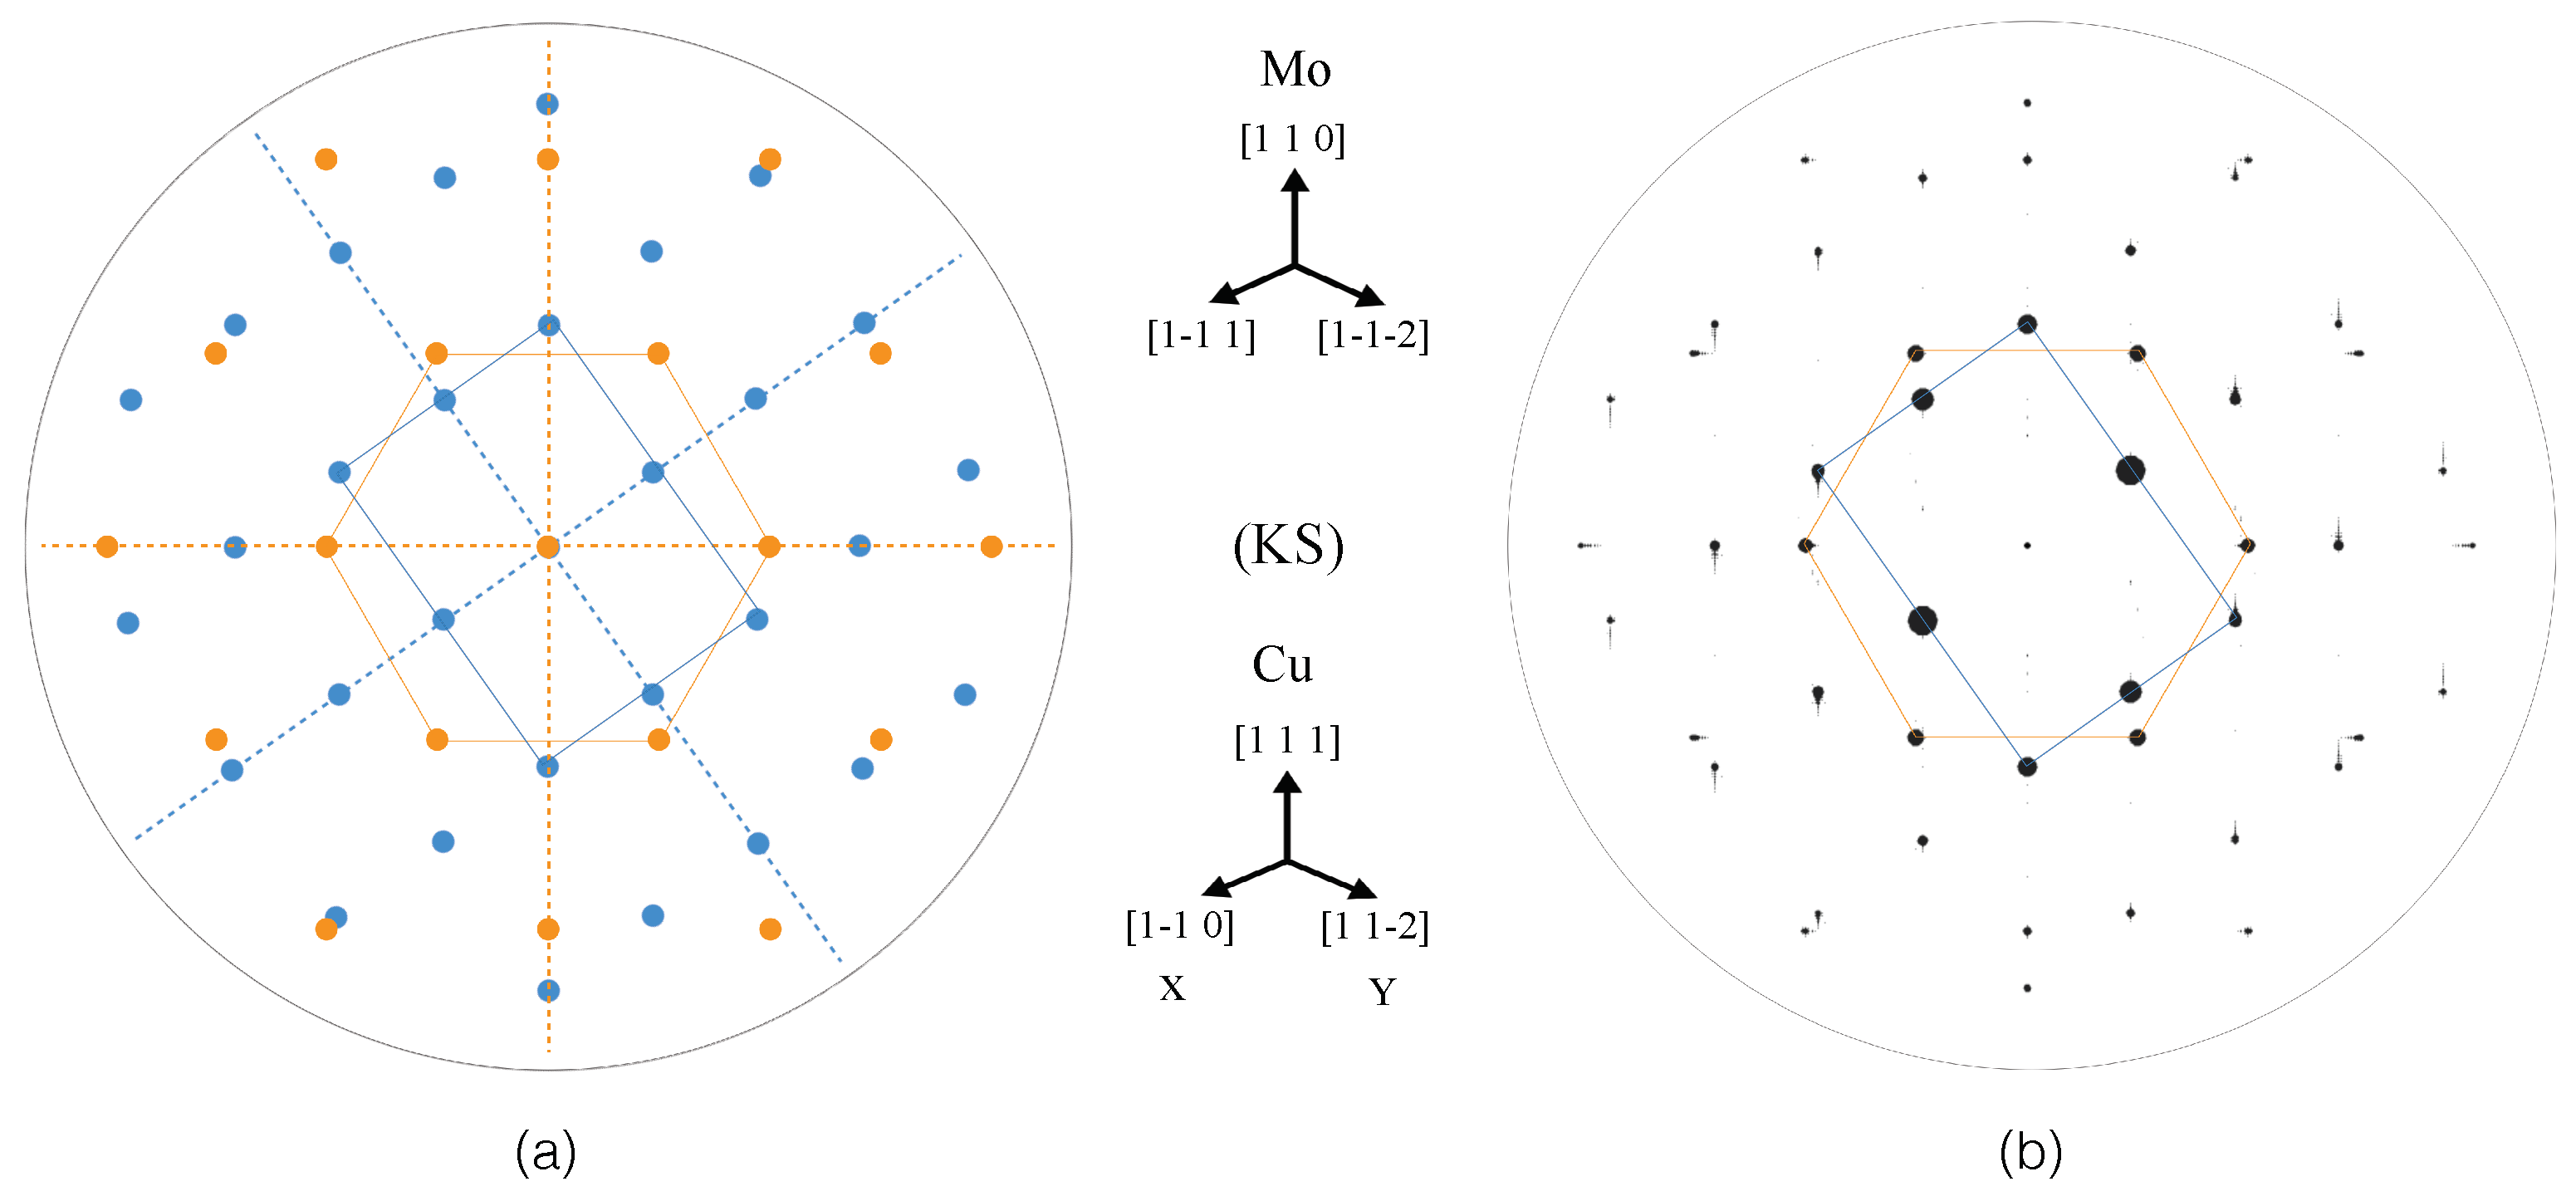
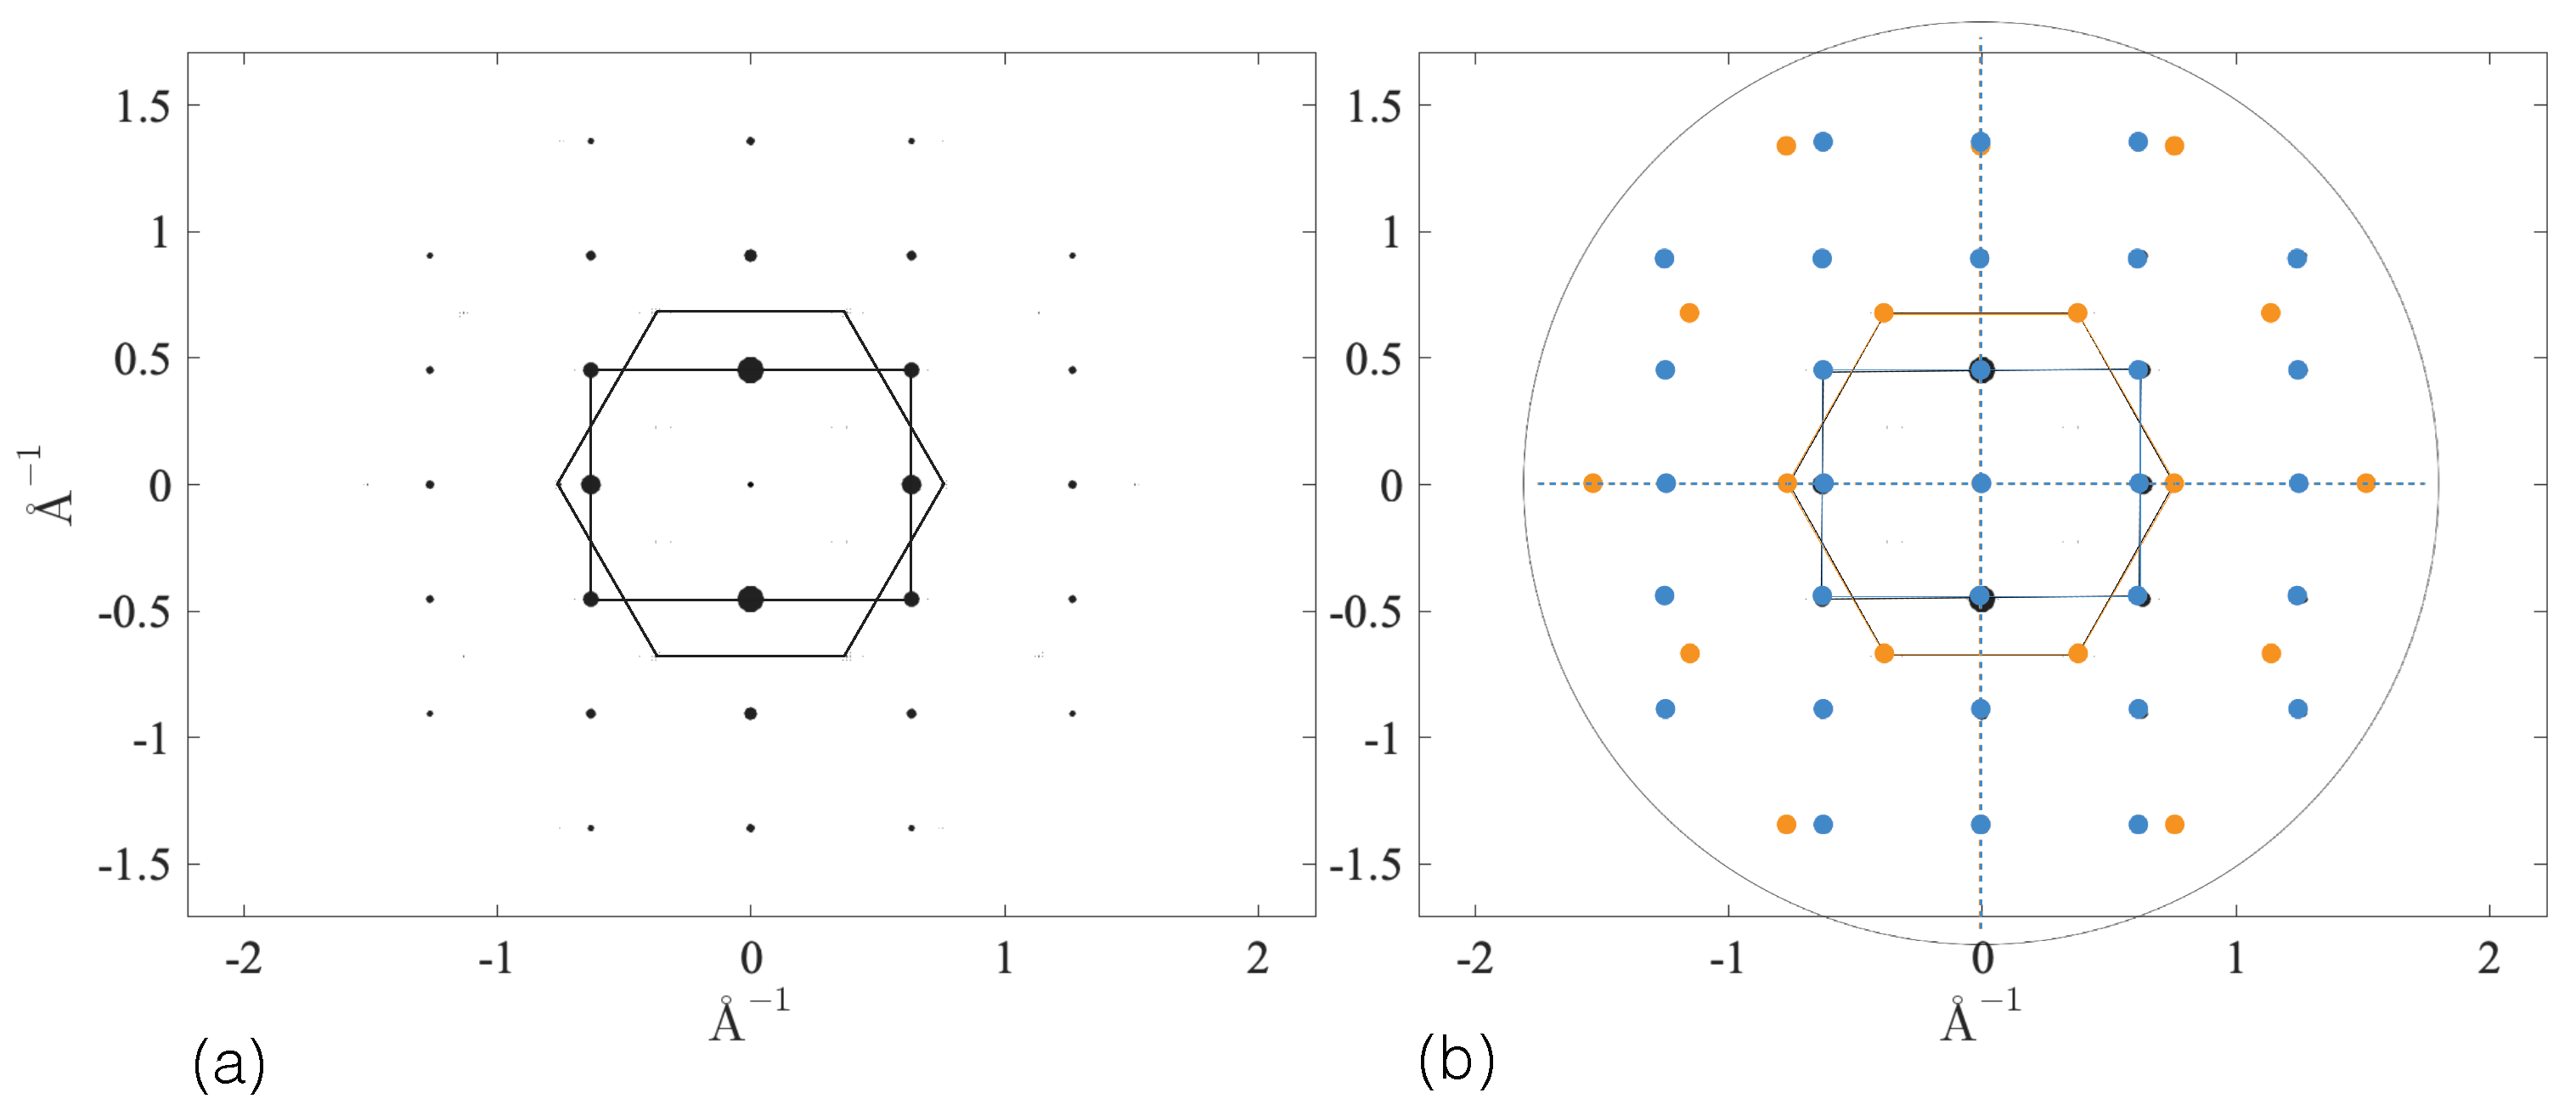
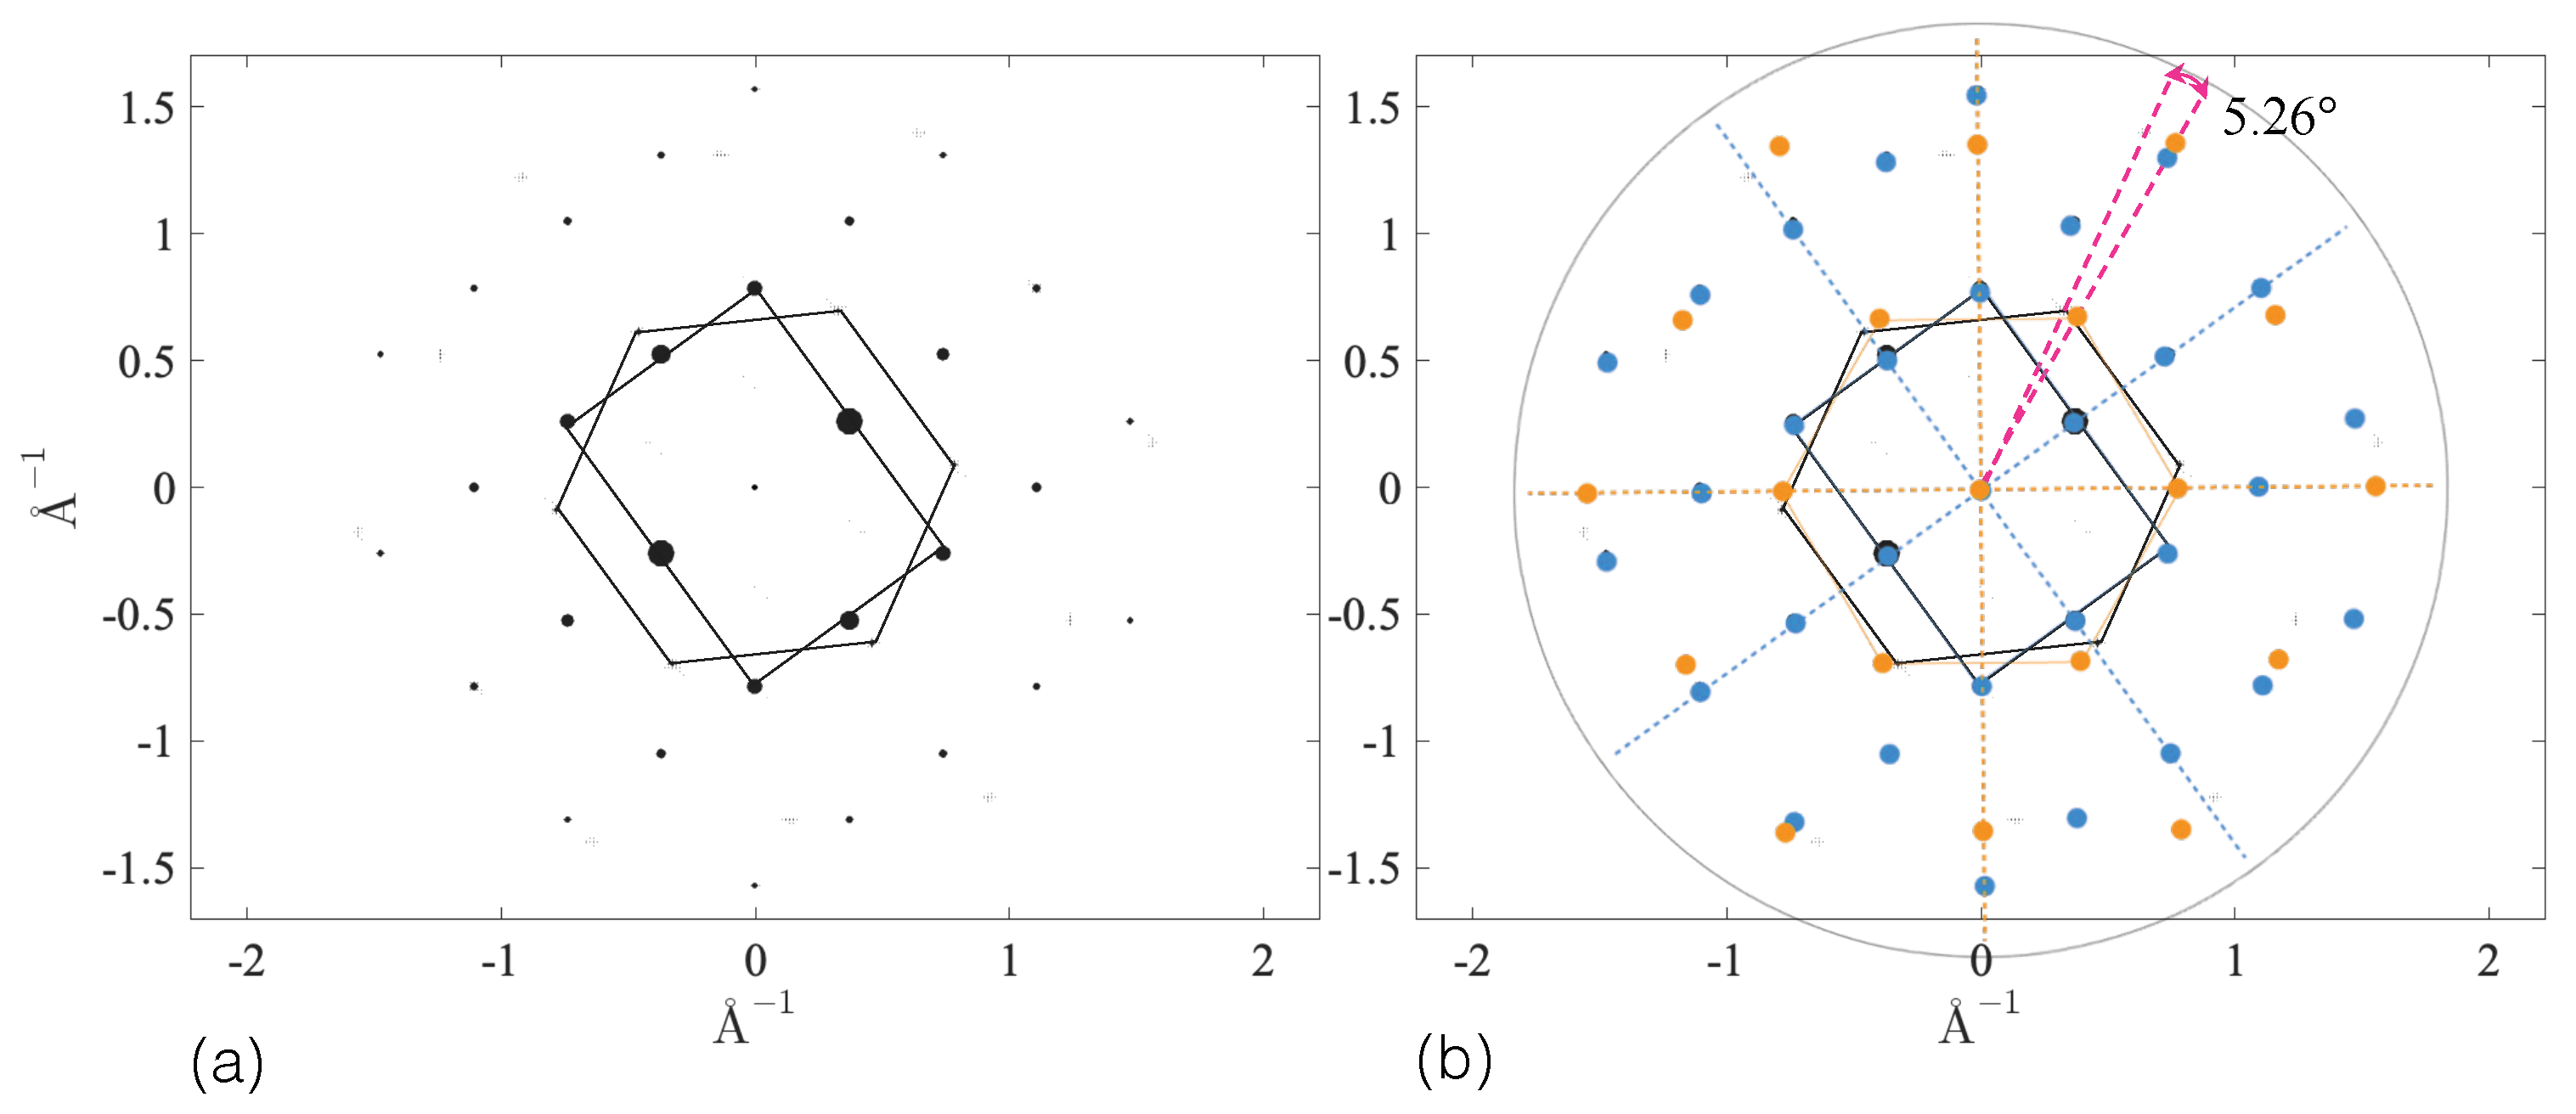
3.2.4. SAED Patterns

To identify the preferred orientation relationship adopted by the system, it was essential to perform detailed analyses following the deposition. Given that such analyses are often complex and unclear in real space, we opted for a more precise approach. Selected area electron diffraction (SAED) patterns, typically obtained through TEM experiments, provide a reliable method to study orientation relationships.
For an fcc(111)/bcc(110) interface, there are three variants of the Nishiyama–Wassermann (NW) orientation relationship and six variants of the Kurdjumov–Sachs (KS) orientation relationship. To establish a theoretical basis, SAED patterns were prepared for all these variants (see Figures S6 and S7 in Supplementary Materials (SM)). Figure 13 presents the necessary diffraction images used to construct the theoretical SAED patterns for the two systems introduced earlier, which correspond to one variant of KS (KS1 see Figure S6 in Supplementary Materials (SM)) and one of NW (NW1 see Figure S7 in Supplementary Materials (SM)).
The calculated diffraction pattern of bcc-Mo with zone axis along the [110] direction, shown in Figure 13a, corresponds to the low surface orientation of solid Mo [110] and with zone axis along the [011] direction, shown in Figure 13b, corresponds to the low surface orientation of solid Mo [011]. Cu was observed to grow in the [111] direction. The calculated diffraction pattern of fcc-Cu is depicted in Figure 13c. Each point of the reciprocal lattice corresponds to an observable peak (hkl). The unit cell of the reciprocal lattice is a rectangle with l = d = 0.317 Å−1 and L = 2 d = 0.449 Å−1 for Mo and an hexagon with L = 2 d 2 = 0.0 . 782 Å−1 for Cu where d = 1 / a Å−1, and a is the lattice parameter in real space. Some representative points are indexed in Figure 13. To construct the KS theoretical diffraction pattern, we rotated the diffraction pattern of bcc-Mo with the zone axis along [110] by an angle of 144.74°. Then, we rotated the diffraction pattern of Cu by 180° to align the two directions along x ( x = [ 1 1 ¯ 0 ] for Cu and x = [ 1 1 ¯ 1 ] for Mo), and to construct the NW theoretical diffraction pattern, we rotated the diffraction pattern of Cu by 180° to align the two directions along x ( x = [ 1 1 ¯ 0 ] for Cu and x = [ 100 ] for Mo). Not all points contribute in an equal manner to the diffraction pattern.
Next, the computational method developed in [48] was applied to produce a virtual electron diffraction pattern directly from atomistic simulations. The SAED pattern was computed for perfect KS and perfect NW boxes, as represented in Figure 6, to validate our theoretical patterns. The blue square in Figure 14 and Figure 15, defined by the Mo peaks, and the orange hexagon, defined by the Cu peaks, are drawn as guides to identify the structure. The virtual SAED pattern is reproduced with striking similarity.
Figure 16a presents the calculated SAED patterns after Cu deposition on Mo, with orientations x = [ 100 ] , y = [ 01 1 ¯ ] , and z = [ 011 ] . In Figure 16b, the theoretical SAED of NW1 is superimposed on the SAED of deposition, revealing a perfect alignment between the patterns. Figure 17a illustrates the SAED patterns obtained after Cu deposition on Mo for x = [ 1 1 ¯ 1 ] , y = [ 1 1 ¯ 2 ¯ ] , and z = [ 110 ] . In Figure 17b, the superposition of the theoretical SAED of KS1 with the SAED of the deposition highlights a shift of 5.26°, corresponding to the difference between the KS1 and NW2 orientation relationships (see Figure S8 in Supplementary Materials (SM)) The NW orientation relationship is always obtained, regardless of the orientations of Mo(110), confirming that the system favors the NW relationship in agreement with previous observations.

4. Conclusions

By means of molecular dynamics simulations, we studied the Cu/Mo interface in layered nanocomposite systems. Since there are only a few MD studies dedicated to this binary system, we first had to select an appropriate interatomic potential capable of simulating both metals as well as the interface orientation relationship. The comparison of the computed physical properties of the pure elements (i.e., lattice parameters, cohesive energy, thermal expansion, coefficient of thermal expansion, melting temperature, elastic constants, and moduli) with the experimental data led us to select the Zhou.01 potential.
Experimentally, nanometric Cu-Mo multilayers are obtained by magnetron-sputtering. Following this elaboration step, annealing at high temperature is often performed to reduce internal stresses. Degradation of these multilayers, revealing structural instability, is observed at 600 °C [8]. One of the causes of this instability is the interface between Cu and Mo. To investigate the possible source of instability, we conducted a study of the Cu/Mo interface by MD. Experimentally, Mo grows with a (110) orientation along the z-axis, and Cu grows with a (111) orientation along the z-axis, resulting in an fcc(111)/bcc(110) interface with a fiber texture, as Cui et al. [24] and Yeom et al. [8] have shown using transmission electron microscopy (TEM). Nevertheless, they were not able to characterize the preferential orientation relationships (either NW or KS). Both configurations were investigated by MD to determine the most stable one. The interface energy is lower for the NW orientation relationship compared to KS. This was confirmed by simulations of Cu deposition on Mo (110). The SAED diffraction patterns computed after deposition perfectly match the theoretical SAED calculated for NW. These results clearly show that the system favors the NW orientation relationship. Similar results were found experimentally by Moszner et al. [6] and numerically by Bodlos et al. [27] for the Cu-W system, which also has an incoherent interface and a lattice misfit very close to that of Cu-Mo (15%). This study helped to characterize the Cu/Mo interface that plays a key role in the nanocomposite’s stability. It represents a first step towards understanding the lack of thermal stability of the Cu-Mo system at the atomic level, thereby limiting its potential applications for the development of high-performance nanocomposite materials.

Supplementary Materials

The following supporting information can be downloaded at: https://www.mdpi.com/article/10.3390/met15030282/s1, Figure S1: Performance of potentials with different numbers of cores; Figure S2: Evolution of the lattice parameter of Cu and Mo as a function of temperature; Figure S3: Evolution of the potential energy per atom ( E p / atom ) as a function of temperature (T) during two processes: heating and cooling; Figure S4: Two types of deformations were applied to compute the elastic constants: uniaxial deformation for C 11 and C 12 (left) and shear deformation for C 44 (right); Figure S5: Variation of the elastic constant of Cu (left) and Mo (right) as a function of temperature; Figure S6: SAED theoretical diffraction patterns of KS variants; Figure S7: SAED theoretical diffraction patterns of NW variants; Figure S8: Comparison between a KS variant and an NW variant, showing the small angle difference of 5.26°; Table S1: MD calculations of lattice parameters a for pure Cu and Mo using the five selected potentials, compared with selected literature references; Table S2: MD calculations of cohesive energies E c for pure Cu and Mo using the five selected potentials, compared with selected literature references; Table S3: The coefficient A , B , C , D , and E for the fit a ( T ) = A + B T + C T 2 + D T 3 + E T 4 of the evolution of the lattice parameter of Cu as a function of temperature; Table S4: The coefficient A , B , C , D , and E for the fit a ( T ) = A + B T + C T 2 + D T 3 + E T 4 of the evolution of the lattice parameter of Mo as a function of temperature; Table S5: The elastic constants of Cu; Table S6: The elastic constants of Mo.

Author Contributions

Conceptualization, F.B. and O.P.; Methodology, F.B. and O.P.; Software, A.A. and O.P.; Validation, A.A., F.B. and O.P.; Formal analysis, A.A., F.B. and O.P.; Investigation, A.A.; Data curation, A.A. and O.P.; Writing—original draft, A.A.; Writing—review & editing, A.A., F.B. and O.P.; Visualization, A.A.; Supervision, F.B. and O.P.; Project administration, O.P.; Funding acquisition, O.P. All authors have read and agreed to the published version of the manuscript.

Funding

This research was funded by [Agence Nationale de la Recherche] grant number [ANR-23-CE09-0002-01].

Data Availability Statement

The original contributions presented in this study are included in the article/Supplementary Material. Further inquiries can be directed to the corresponding authors.

Acknowledgments

The use of computational facilities at the Computing Center of the Université Bourgogne Europe PSIUN-CCUB, is gratefully acknowledged. We also thank Jolanta Janczak-Rusch and Helena Zapolsky for fruitful discussions.

Conflicts of Interest

The authors declare no conflicts of interest.

References

  1. Sáenz-Trevizo, A.; Hodge, A.M. Nanomaterials by design: A review of nanoscale metallic multilayers. Nanotechnology 2020, 31, 292002. [Google Scholar] [CrossRef] [PubMed]
  2. Lewis, A.C.; Josell, D.; Weihs, T.P. Stability in thin film multilayers and microlaminates: The role of free energy, structure, and orientation at interfaces and grain boundaries. Scr. Mater. 2003, 48, 1079–1085. [Google Scholar] [CrossRef]
  3. Knoedler, H.L.; Lucas, G.E.; Levi, C.G. Morphological stability of copper-silver multilayer thin films at elevated temperatures. Metall. Mater. Trans. 2003, 34A, 1043–1054. [Google Scholar] [CrossRef]
  4. Ma, Y.J.; Wei, M.Z.; Sun, C.; Cao, Z.H.; Meng, X.K. Length scale effect on the thermal stability of nanoscale Cu/Ag multilayers. Mater. Sci. Eng. A 2017, 686, 142–149. [Google Scholar] [CrossRef]
  5. Druzhinin, A.V.; Cancellieri, C.; Jeurgens, L.P.H.; Straumal, B.B. The effect of interface stress on the grain boundary grooving in nanomaterials: Application to the thermal degradation of Cu/W nano-multilayers. Scr. Mater. 2021, 199, 113866. [Google Scholar] [CrossRef]
  6. Moszner, F.; Cancellieri, C.; Chiodi, M.; Yoon, S.; Ariosa, D.; Janczak-Rusch, J.; Jeurgens, L.P.H. Thermal stability of Cu/W nano-multilayers. Acta Mater. 2016, 107, 345–353. [Google Scholar] [CrossRef]
  7. Troncoso, J.F.; Lorenzin, G.; Cancellieri, C.; Turlo, V. Explaining the effect of in-plane strain on thermal degradation kinetics of Cu/W nano-multilayers. Scr. Mater. 2024, 242, 115902. [Google Scholar] [CrossRef]
  8. Yeom, J.; Lorenzin, G.; Ghisalberti, L.; Cancellieri, C.; Janczak-Rusch, J. The thermal stability and degradation mechanism of Cu/Mo nanomultilayers. Sci Technol Adv Mater. 2024, 25, 2357536. [Google Scholar] [CrossRef]
  9. Appleget, C.D.; Riano, J.S.; Hodge, A.M. An Overview of Nano Multilayers as Model Systems for Developing Nanoscale Microstructures. Materials 2022, 15, 382. [Google Scholar] [CrossRef]
  10. Niu, T.; Zhang, Y.; Cho, J.; Li, J.; Wang, H.; Zhang, X. Thermal stability of immiscible Cu-Ag/Fe triphase multilayers with triple junctions. Acta Mater. 2021, 208, 116679. [Google Scholar] [CrossRef]
  11. Schweitz, K.O.; Ratzke, K.; Foord, D.; Thomas, P.J.; Greer, A.L.; Geisler, H.; Chevallier, J.; Bottiger, J. The microstructural development of Ag/Ni multilayers during annealing. Phil. Mag. A 2000, 80, 1867–1877. [Google Scholar] [CrossRef]
  12. Schweitz, K.O.; Bottiger, J.; Greer, A.L.; Thomas, P.J.; Foord, D.T. The mechanism of degradation of Ag/Ni multilayers deposited at different temperatures. Philos. Mag. A 2001, 81, 1–10. [Google Scholar] [CrossRef]
  13. Baras, F.; Turlo, V.; Politano, O.; Vadchenko, S.G.; Rogachev, A.S.; Mukasyan, A.S. SHS in Ni/Al Nanofoils: A Review of Experiments and Molecular Dynamics Simulations. Adv. Eng. Mater. 2018, 20, 1800091. [Google Scholar] [CrossRef]
  14. Baloochi, M.; Shekhawat, D.; Riegler, S.S.; Matthes, S.; Glaser, M.; Schaaf, P.; Bergmann, J.P.; Gallino, I.; Pezoldt, J. Influence of Initial Temperature and Convective Heat Loss on the Self-Propagating Reaction in Al/Ni Multilayer Foils. Materials 2021, 14, 7815. [Google Scholar] [CrossRef]
  15. Politano, O.; Baras, F. Molecular dynamics simulations of self-propagating reactions in Ni–Al multilayer nanofoils. J. Alloys Compd. 2015, 652, 25–29. [Google Scholar] [CrossRef]
  16. Politano, O.; Baras, F. Reaction front propagation in nanocrystalline Ni/Al composites: A molecular dynamics study. J. Appl. Phys. 2020, 128, 215301. [Google Scholar] [CrossRef]
  17. Politano, O.; Rogachev, A.S.; Baras, F. Molecular Dynamics Studies in Nanojoining: Self-Propagating Reaction in Ni/Al Nanocomposites. J. Mater. Eng. Perform. 2021, 30, 3160–3166. [Google Scholar] [CrossRef]
  18. Schwarz, F.; Spolenak, R. Molecular dynamics study of the influence of microstructure on reaction front propagation in Al–Ni multilayers. Appl. Phys. Lett. 2021, 119, 133901. [Google Scholar] [CrossRef]
  19. Baras, F.; Politano, O.; Li, Y.; Turlo, V. A Molecular Dynamics Study of Ag-Ni Nanometric Multilayers: Thermal Behavior and Stability. Nanomaterials 2023, 13, 2134. [Google Scholar] [CrossRef]
  20. Lorenzin, G.; Troncoso, J.F.; Liyanage, M.; Druzhinin, A.V.; Jeurgens, L.P.H.; Cancellieri, C.; Turlo, V. Experimental and ab initio derivation of interface stress in nanomultilayered coatings: Application to immiscible Cu/W system with variable in-plane stress. Appl. Surf. Sci. 2024, 661, 159994. [Google Scholar] [CrossRef]
  21. Wassermann, G. Einflu der—Umwandlung eines irreversiblen Nickelstahls auf Kristallorientierung und Zugfestigkeit. Arch. Eisenhüttenwesen 1933, 6, 347–351. [Google Scholar] [CrossRef]
  22. Nishiyama, Z. X-ray investigation of the mechanism of the transformation from face centered cubic lattice to body centered cubic. Sci. Rep. Tohoku Univ. 1934, 23, 637. [Google Scholar]
  23. Kurdjumow, G.; Sachs, G. Über den Mechanismus der Stahlhärtung. Z. Phys. 1930, 64, 325–343. [Google Scholar] [CrossRef]
  24. Cui, Y.; Derby, B.; Li, N.; Mara, N.A.; Misra, A. Suppression of shear banding in high-strength Cu/Mo nanocomposites with hierarchical bicontinuous intertwined structures. Mater. Res. Lett. 2018, 6, 184. [Google Scholar] [CrossRef]
  25. Yu-Zhang, K.; Embury, J.D.; Han, K.; Misra, A. Transmission electron microscopy investigation of the atomic structure of interfaces in nanoscale Cu-Nb multilayers. Philos. Mag. 2008, 88, 2559–2567. [Google Scholar] [CrossRef]
  26. Monclús, M.A.; Karlik, M.; Callisti, M.; Frutos, E.; Lorca, J.L.; Polcar, T.; Molina-Aldareguí, J.M.A. Microstructure and mechanical properties of physical vapor deposited Cu/W nanoscale multilayers: Influence of layer thickness and temperature. Thin Solid Films 2014, 571, 275–282. [Google Scholar] [CrossRef]
  27. Bodlos, R.; Fotopoulos, V.; Spitaler, J.; Shluger, A.L.; Romaner, L. Energies and structures of Cu/Nb and Cu/W interfaces from density functional theory and semi-empirical calculations. Materialia 2022, 21, 101362. [Google Scholar] [CrossRef]
  28. Plimpton, S. Fast Parallel Algorithms for Short-Range Molecular Dynamics. J. Comp. Phys. 1995, 117, 1. [Google Scholar] [CrossRef]
  29. Daw, M.S.; Baskes, M.I. Embedded-atom method: Derivation and application to impurities, surfaces, and other defects in metals. Phys. Rev. B 1984, 29, 6443–6453. [Google Scholar] [CrossRef]
  30. Gong, H.R.; Kong, L.T.; Liu, B.X. Metastability of an immiscible Cu-Mo system calculated from first-principles and a derived n-body potential. Phys. Rev. B 2004, 69, 024202. [Google Scholar] [CrossRef]
  31. Zhou, X.; Johnson, R.A.; Wadley, H.N.G. Misfit-energy-increasing dislocations in vapor-deposited CoFe/NiFe multilayers. Phys. Rev. B 2004, 69, 144113. [Google Scholar] [CrossRef]
  32. Zhou, X.; Johnson, R.A.; Wadley, H.N.G. Atomic scale structure of sputtered metal multilayers. Acta Mater. 2004, 49, 4005–4015. [Google Scholar] [CrossRef]
  33. Zhou, X.W.; Wadley, H.N.G. Misfit dislocations in gold/Permalloy multilayers. Philos. Mag. 2004, 84, 193–212. [Google Scholar] [CrossRef]
  34. Wadley, H.; Zhou, X.; Butler, W.H. Atomic Assembly of Magnetoresistive Multilayers; Springer: Berlin/Heidelberg, Germany, 2008; Volume 109, pp. 497–559. [Google Scholar] [CrossRef]
  35. Karolewski, M.A. Tight-binding potentials for sputtering simulations with fcc and bcc metals, Radiation Effects and Defects in Solids. Radiat. Eff. Defects Solids 2001, 153, 239–255. [Google Scholar] [CrossRef]
  36. Wang, J.; Lee, B.-J. Second-nearest-neighbor modified embedded-atom method interatomic potential for V-M (M=Cu, Mo, Ti) binary systems. Comput. Mater. Sci. 2021, 188, 110177. [Google Scholar] [CrossRef]
  37. Oh, S.-H.; Lu, X.-G.; Chen, Q.; Lee, B.-J. Pressure dependence of thermodynamic interaction parameters for binary solid solution phases: An atomistic simulation study. Calphad 2021, 75, 102342. [Google Scholar] [CrossRef]
  38. Touloukian, Y.S.; Kirby, R.K.; Taylor, R.E.; Desai, P.D. Thermophysical properties of matter-the tprc data series. In Thermal Expansion Metallic and Elements and Alloys; Plenum Press: New York, NY, USA, 1975; Volume 12. [Google Scholar]
  39. Luo, F.; Chen, X.; Cai, L.; Ji, G. Solid–Liquid Interfacial Energy and Melting Properties of Nickel Under Pressure from Molecular Dynamics. J. Chem. Eng. Data Data 2010, 55, 5149–5155. [Google Scholar] [CrossRef]
  40. Rassoulinejad-Mousavi, S.M.; Mao, Y.; Zhang, Y. Evaluation of copper, aluminum, and nickel interatomic potentials on predicting the elastic properties. J. Appl. Phys. 2016, 119, 244304. [Google Scholar] [CrossRef]
  41. Hill, R. The Elastic Behaviour of a Crystalline Aggregate, Proceedings of the Physical Society. Sect. A 1952, 65, 349. [Google Scholar] [CrossRef]
  42. Simmons, G.; Wang, H.F. Single Crystal Elastic Constants and Calculated Aggregate Properties. In A Handbook, 2nd ed.; M.I.T. Press: Cambridge, MA, USA, 1971. [Google Scholar]
  43. Bujard, P.; Sanjinés, R.; Walker, E.; Ashkenazi, J.; Peter, M. Elastic constants in Nb-Mo alloys from zero temperature to the melting point: Experiment and theory. J. Phys. Met. Phys. 1981, 11, 775–786. [Google Scholar] [CrossRef]
  44. ASM Handbook Committee. Properties and Selection: Nonferrous Alloys and Special-Purpose Materials; ASM International: New York, NY, USA, 1952. [Google Scholar] [CrossRef]
  45. Simon, N.J.; Drexler, E.S.; Reed, R.P. Properties of Copper and Copper Alloys at Cryogenic Temperatures; NIST Monograph: Boulder, CO, USA, 1992. [Google Scholar] [CrossRef]
  46. Stukowski, A. Visualization and analysis of atomistic simulation data with OVITO-the open visualization tool. Model. Simul. Mater. Sci. Eng. 2009, 18, 015012. [Google Scholar] [CrossRef]
  47. Li, Z.; Ding, P.; Wang, R.; Wang, C.; Li, Q.; Sun, B.; Zhang, Y. First-principles investigation on the effects of alloying elements on Cu/Mo interface. Chem. Phys. Lett. 2023, 832, 140895. [Google Scholar] [CrossRef]
  48. Coleman, S.P.; Spearot, D.E.; Capolungo, L. Virtual diffraction analysis of Ni [010] symmetric tilt grain boundaries. Model. Simul. Mater. Sci. Eng. 2013, 21, 055020. [Google Scholar] [CrossRef]
Figure 1. Comparison between the MD results obtained for Cu and Mo with experimental results from Touloukian [38].
Metals 15 00282 g001
Figure 2. The evolution of the coefficient of thermal expansion as a function of temperature of copper and molybdenum.
Metals 15 00282 g002
Figure 3. Evolution of the ratio of the thermal expansion coefficient of Cu and Mo as a function of temperature.
Metals 15 00282 g003
Figure 4. The variation of the young modulus E, Poisson ratio υ , shear modulus G, and bulk modulus K of Cu as a function of temperature.
Metals 15 00282 g004
Figure 5. The variation of the young modulus E, Poisson ratio υ , shear modulus G, and bulk modulus K of Mo as a function of temperature.
Metals 15 00282 g005
Figure 6. KS and NW boxes. Mo and Cu atoms are represented by blue and orange spheres, respectively.
Metals 15 00282 g006
Figure 7. Two dimensional partial radial distribution function computed in the first atomic plane of Cu and of Mo at the interface. The theoretical positions of the first, second, and third neighbor peaks in a 2D plane from a bulk system are indicated by the lines with a star (∗), a diamond (⧫), and a cross (x), respectively.
Metals 15 00282 g007
Figure 8. Energy, atomic volume and local atomic environment of KS box. For direct comparison, cohesive energy and volume per atom for bulk systems are also reported.
Metals 15 00282 g008
Figure 9. Energy, atomic volume and local atomic envirronement of NW box. For direct comparison, cohesive energy and volume per atom for bulk systems are also reported.
Metals 15 00282 g009
Figure 10. Excess of potential energy at the interface at 0 K.
Metals 15 00282 g010
Figure 11. MD model of the deposition of sputtered Cu atoms onto Mo surface.
Metals 15 00282 g011
Figure 12. Two-dimensional radial distribution functions computed for the first three planes of Cu and the Mo plane located at the interface. The positions of the peaks computed in Cu(111) and Mo(110) planes in bulk systems are presented for comparison by lines with a cross (x) and a star (∗), respectively. Side views of the final configurations from simulations at 300 K. Thin slices of Cu atoms at different heights are shown on (ad). In snapshots (ac), the atoms are colored according to their local environment (i.e., fcc (green), bcc (blue), hcp (red), and unk (gray)), whereas in snapshot (d), the atoms are colored according to their relative height.
Metals 15 00282 g012
Figure 13. (a,b) Calculated diffraction pattern of bcc-Mo substrate with zone axis aligned along the [011] and [110] directions. (c) Calculated diffraction pattern of fcc-Cu with zone axis aligned along the [111]-direction.
Metals 15 00282 g013
Figure 14. SAED for Nishiyama–Wassermann (NW) relationship. (a) Theoretical diffraction patterns. (b) Virtual diffraction patterns. Mo and Cu peaks are represented in blue and orange, respectively.
Metals 15 00282 g014
Figure 15. SAED for Kurdjumov–Sachs (KS) relationship. (a) Theoretical diffraction patterns. (b) Virtual diffraction patterns. Mo and Cu peaks are represented in blue and orange, respectively.
Metals 15 00282 g015
Figure 16. (a) SAED patterns computed for the full system at the end of deposition simulation. The black square defined by the Mo peaks, and the black hexagon, defined by the Cu peaks, are drawn as guides to identify the structure. (b) superposition of theoretical and virtual SAED patterns (deposition simulation). Theoretical Mo and Cu peaks are represented in blue and orange, respectively.
Metals 15 00282 g016
Figure 17. (a) SAED patterns computed for the full system at the end of deposition simulation. The black square defined by the Mo peaks, and the black hexagon, defined by the Cu peaks, are drawn as guides to identify the structure. (b) superposition of theoretical and virtual SAED patterns (deposition simulation). Theoretical Mo and Cu peaks are represented in blue and orange, respectively.
Metals 15 00282 g017
Table 1. List of the benchmarked Cu-Mo potentials.
PotentialRefTypeNotationPerformance (ns/Day)
Gong et al.[30]EAMGong20.51
Zhou et al. 2001[31]EAMZhou.018.66
Zhou et al. 2004[32]EAMZhou.049.71
M. A. Karolewski et al.[35]TB-SMATB-SMA12.77
J. Wang et al.[36]MEAMMEAM0.76
Table 2. Melting temperatures obtained with the hysteresis method for Cu and Mo.
T m (K)CuMo
This WorkExperimentalThis WorkExperimental
Gong1085 3143
Zhou.011131 3404
Zhou.041153135834202896
TB-SMA1332 2236
MEAM1572 2778
Table 3. The values of the elastic constants C i j , Young modulus E, Poisson ratio υ , shear modulus G, and bulk modulus K of Cu and Mo at 0 K.
MaterialMethod C 11 (GPa) C 12 (GPa) C 44 (GPa)E (GPa) G V (GPa) G R (GPa)G (GPa)K (GPa) υ
CuExperimental170 [42]122.5 [42]75.8 [42]128.3154.9840.3947.69138.330.35
Gong170.03122.5075.80128.3454.9940.4147.70138.340.35
Zhou.01182.84121.1570.64135.7954.7246.5950.66141.710.34
Zhou.04169.62122.1375.74128.2154.9440.3847.66137.960.35
TB-SMA176.03121.7183.63141.9961.0445.6653.35139.820.33
MEAM176.13124.9081.76137.6759.3043.5651.43141.980.34
MoExperimental464.7 [43]161.5 [43]108.9 [43]322.20125.98122.73124.35262.570.30
Gong500.18196.94108.92327.55126.00122.75124.37298.020.32
Zhou.01456.59166.55113.11323.64125.87124.03124.95263.230.30
Zhou.04456.56166.55113.11323.63125.87124.02124.94263.220.30
TB-SMA182.84173.35123.76121.0776.1511.2243.69176.510.39
MEAM474.79160.51115.10336.13131.92128.89130.40265.270.29
Disclaimer/Publisher’s Note: The statements, opinions and data contained in all publications are solely those of the individual author(s) and contributor(s) and not of MDPI and/or the editor(s). MDPI and/or the editor(s) disclaim responsibility for any injury to people or property resulting from any ideas, methods, instructions or products referred to in the content.

