Article

Numerical Simulation of Effects of Mold Cavity and Submerged Entry Nozzle on Flow, Heat Transfer and Solidification in Funnel-Type Molds for Thin Slab Casting

by
Zhaoyang Li
1,*,
Yao Lu
2,
Rudong Wang
2,
Gengyang Li
2 and
Heng Cui
2,*
1
Steel Rolling Mill, Tangshan Donghua Iron and Steel Enterprise Group Co., Ltd., Tangshan 063300, China
2
Collaborative Innovation Center of Steel Technology, University of Science and Technology Beijing, Beijing 100083, China
*
Authors to whom correspondence should be addressed.
Metals 2025, 15(2), 183; https://doi.org/10.3390/met15020183
Submission received: 16 January 2025 / Revised: 1 February 2025 / Accepted: 7 February 2025 / Published: 11 February 2025
(This article belongs to the Special Issue Advances in Continuous Casting and Refining of Steel)

Abstract

:
As the third generation of thin slab continuous casting and rolling technology, endless strip production (ESP) has been widely used in the steelmaking industry. The key equipment in this process, the funnel-type mold, is prone to accidents such as slag entrainment, surface cracks and steel leakage under high casting speed conditions. To reduce the incidence of the above accidents, the numerical model of flow, heat transfer and solidification in the funnel-type mold is established by using the k-ε model, enthalpy–porosity method and magnetohydrodynamics (MHD), and the influence mechanism of the mold cavity and submerged entry nozzle (SEN) on the molten steel is studied, providing a new solution for optimizing the ESP process. The results show that compared with the type-I mold, the influence of the geometric disturbance of the top cavity on the flow state of the middle and lower body is localized, while the type-II funnel mold increases the thickness of the solidified shell at the outlet of mold; the marked enhancement in solidified shell thickness and uniformity at the mold exit achieved through the type-II SEN due to the distribution of temperature and velocity are more reasonable, reducing the risk of surface cracks and steel leakage.

1. Introduction

Thin slab casting and direct rolling (TSCR) technology integrates casting, heating, rolling and other processes in an orderly manner, which is a top technology in the steel industry [1,2]. In this process, molten steel is cast into thin slabs through a tundish and a funnel-type mold, and then directly sent to the rolling mill using waste heat to reduce energy consumption. Finally, the target specifications are achieved through multiple pass rolling. Due to its simple process, efficient production and more energy-saving and emission reduction advantages, it has been widely used in the steelmaking industry [3,4,5]. After more than 30 years of development, TSCR technology has made rapid progress [6]. According to the continuous extent of the manufacturing process, TSCR technology can be divided into the following three generations: batch rolling, semiendless, and endless rolling and headless. The third generation, which is characterized by endless rolling in fully continuous production, has become the mainstream of current TSCR technology [7].
Different from conventional slab continuous casting, endless strip production (ESP) technology requires a close integration of casting and rolling processes to ensure high production efficiency. Therefore, the continuous casting machine needs to be produced under a high casting speed [8], which is likely to lead to slag entrainment, cracking and steel leakage accidents, making the continuous casting a key process in ESP and the step that this study focuses on. To accommodate the high casting speed and dimensional requirements of thin slab production, a specially designed submerged entry nozzle (SEN) combined with a funnel-type mold is typically employed. The SEN’s structural configuration exerts significant influence on the fluid dynamics of molten steel within the mold, directly determining the final quality of cast products [9]. The funnel-type mold expands the upper surface area, which is conducive to the melting of protective slag, provides the necessary space for the SEN to introduce the molten steel into the mold and suppresses turbulence, which is conducive to improving the surface quality of the cast slab [10,11,12]. Comparative analysis reveals that the solidified shell thickness in thin slab continuous casting reaches approximately 40% of the final product thickness at the mold outlet [13], contrasting with conventional slab casting’s 20% [14], from which it can be seen that the thin slab mold undertakes more solidification tasks. Consequently, comprehensive investigation of thermo-fluid-solid coupling phenomena in funnel-type molds constitutes a critical pathway for product quality enhancement and energy-saving and ESP technology advancement.
Multiple interacting factors govern the metallurgical behavior in funnel-type mold systems, including but not limited to casting parameters, structure of the mold and SEN, and electromagnetic braking (EMBr) applications. These variables collectively determine flow stability and shell uniformity [4,8,10,15]. Many studies [16,17,18] have shown that under high casting speed, the impact depth of the mainstream of the molten steel is large, the flow velocity inside and on the surface of the mold is high, and the solidified shell in the funnel area is thin and subjected to large thermal stress, which is prone to cause slag entrainment, cracks and steel leakage. Different from the mold of conventional slab, the wide copper plate of the thin slab continuous casting mold has a funnel shape, which can greatly improve the uniformity of the solidified shell [19], and reduce the stress and strain of the casting billet during solidification and casting, thereby reducing the incidence of cracks and steel leakage accidents [20]. A number of studies on the shape of the mold cavity [21,22] proposed complete design principles and requirements, and established a three-dimensional stress–strain model of the funnel-type mold for analysis. Liu et al. [20] found that the maximum value of the first principal stress occurs at the corner, and designed a new copper plate to reduce the occurrence of cracks; Liu et al. [23] found that the maximum strain of the solidified shell occurs at the intersection of the two arcs of the mold cavity, and different curve designs of mold cavity correspond to different stress peaks. The above studies mainly focus on the analysis of stress and strain, and the research on the influence of the mold cavity on the flow of molten steel, the growth and the uniformity of the solidified shell is not comprehensive enough.
The submerged entry nozzle (SEN) plays an important role in protecting casting, stabilizing the flow field of molten steel in the mold, and has a decisive influence on the production quality of continuous casting [24]. Recent advancements in SEN design for funnel-type molds have yielded significant findings through computational and experimental approaches. Zhang et al. [25] conducted numerical and physical simulations on a funnel-type mold using a multi-hole SEN and designed a new SEN that significantly reduced the surface velocity and the risk of slag entrainment. Jeon et al. [26] established a full-scale water model of the funnel-shaped mold, tested three SENs with different structures and analyzed the mechanism of vortex generation inside the mold with different SENs. Torres et al. and Shen et al. [27,28,29] studied the instability of turbulence in the funnel-type mold and the relationship between the SEN depth and structure. Arcos-Gutierrez et al. [30] studied the structural design of bifurcated SENs and revealed the effects of casting speed and immersion depth of the SEN on the flow of molten steel in the funnel-type mold. Morales et al. [15]’s newly designed four-port SEN has flow stability and is not affected by casting speed and immersion depth. However, due to the complex design of the SEN and different applicable scenarios, it is still necessary to explore the influence of the new structure of SEN on the flow, heat transfer and solidification behavior of molten steel.
In this work, in order to solve the surface cracks and steel leakage problems in the ESP process of Tangshan Donghua Iron and Steel Enterprise Group Co., Ltd. (Tangshan, China), a numerical model of the flow, heat transfer and solidification of molten steel in a funnel-type mold was established. The investigation focused on evaluating how mold cavity and submerged entry nozzle (SEN) design influence molten steel through computational analysis. The k-ε model, MHD model and enthalpy–porosity method are used respectively. Combining the interaction of turbulence, electromagnetic braking (EMBr) and solidification of molten steel, the results are verified by comparing with the physical simulation and the actual measured temperature to ensure the accuracy of the numerical model. Based on this numerical model, the effects of different curves of mold cavity and the new double-hole SEN with different structures on the flow, heat transfer and solidification of molten steel in the mold were studied (the main temperature range of the study is 900–1831 K), and the key factors causing crack and steel leakage in the ESP process were analyzed. This study enhances the understanding of the mechanism of the effect of mold cavity and structure of SEN on the behavior of molten steel and provides strong data support for optimizing the ESP mold cavity and SEN structure.

2. Mathematical Model
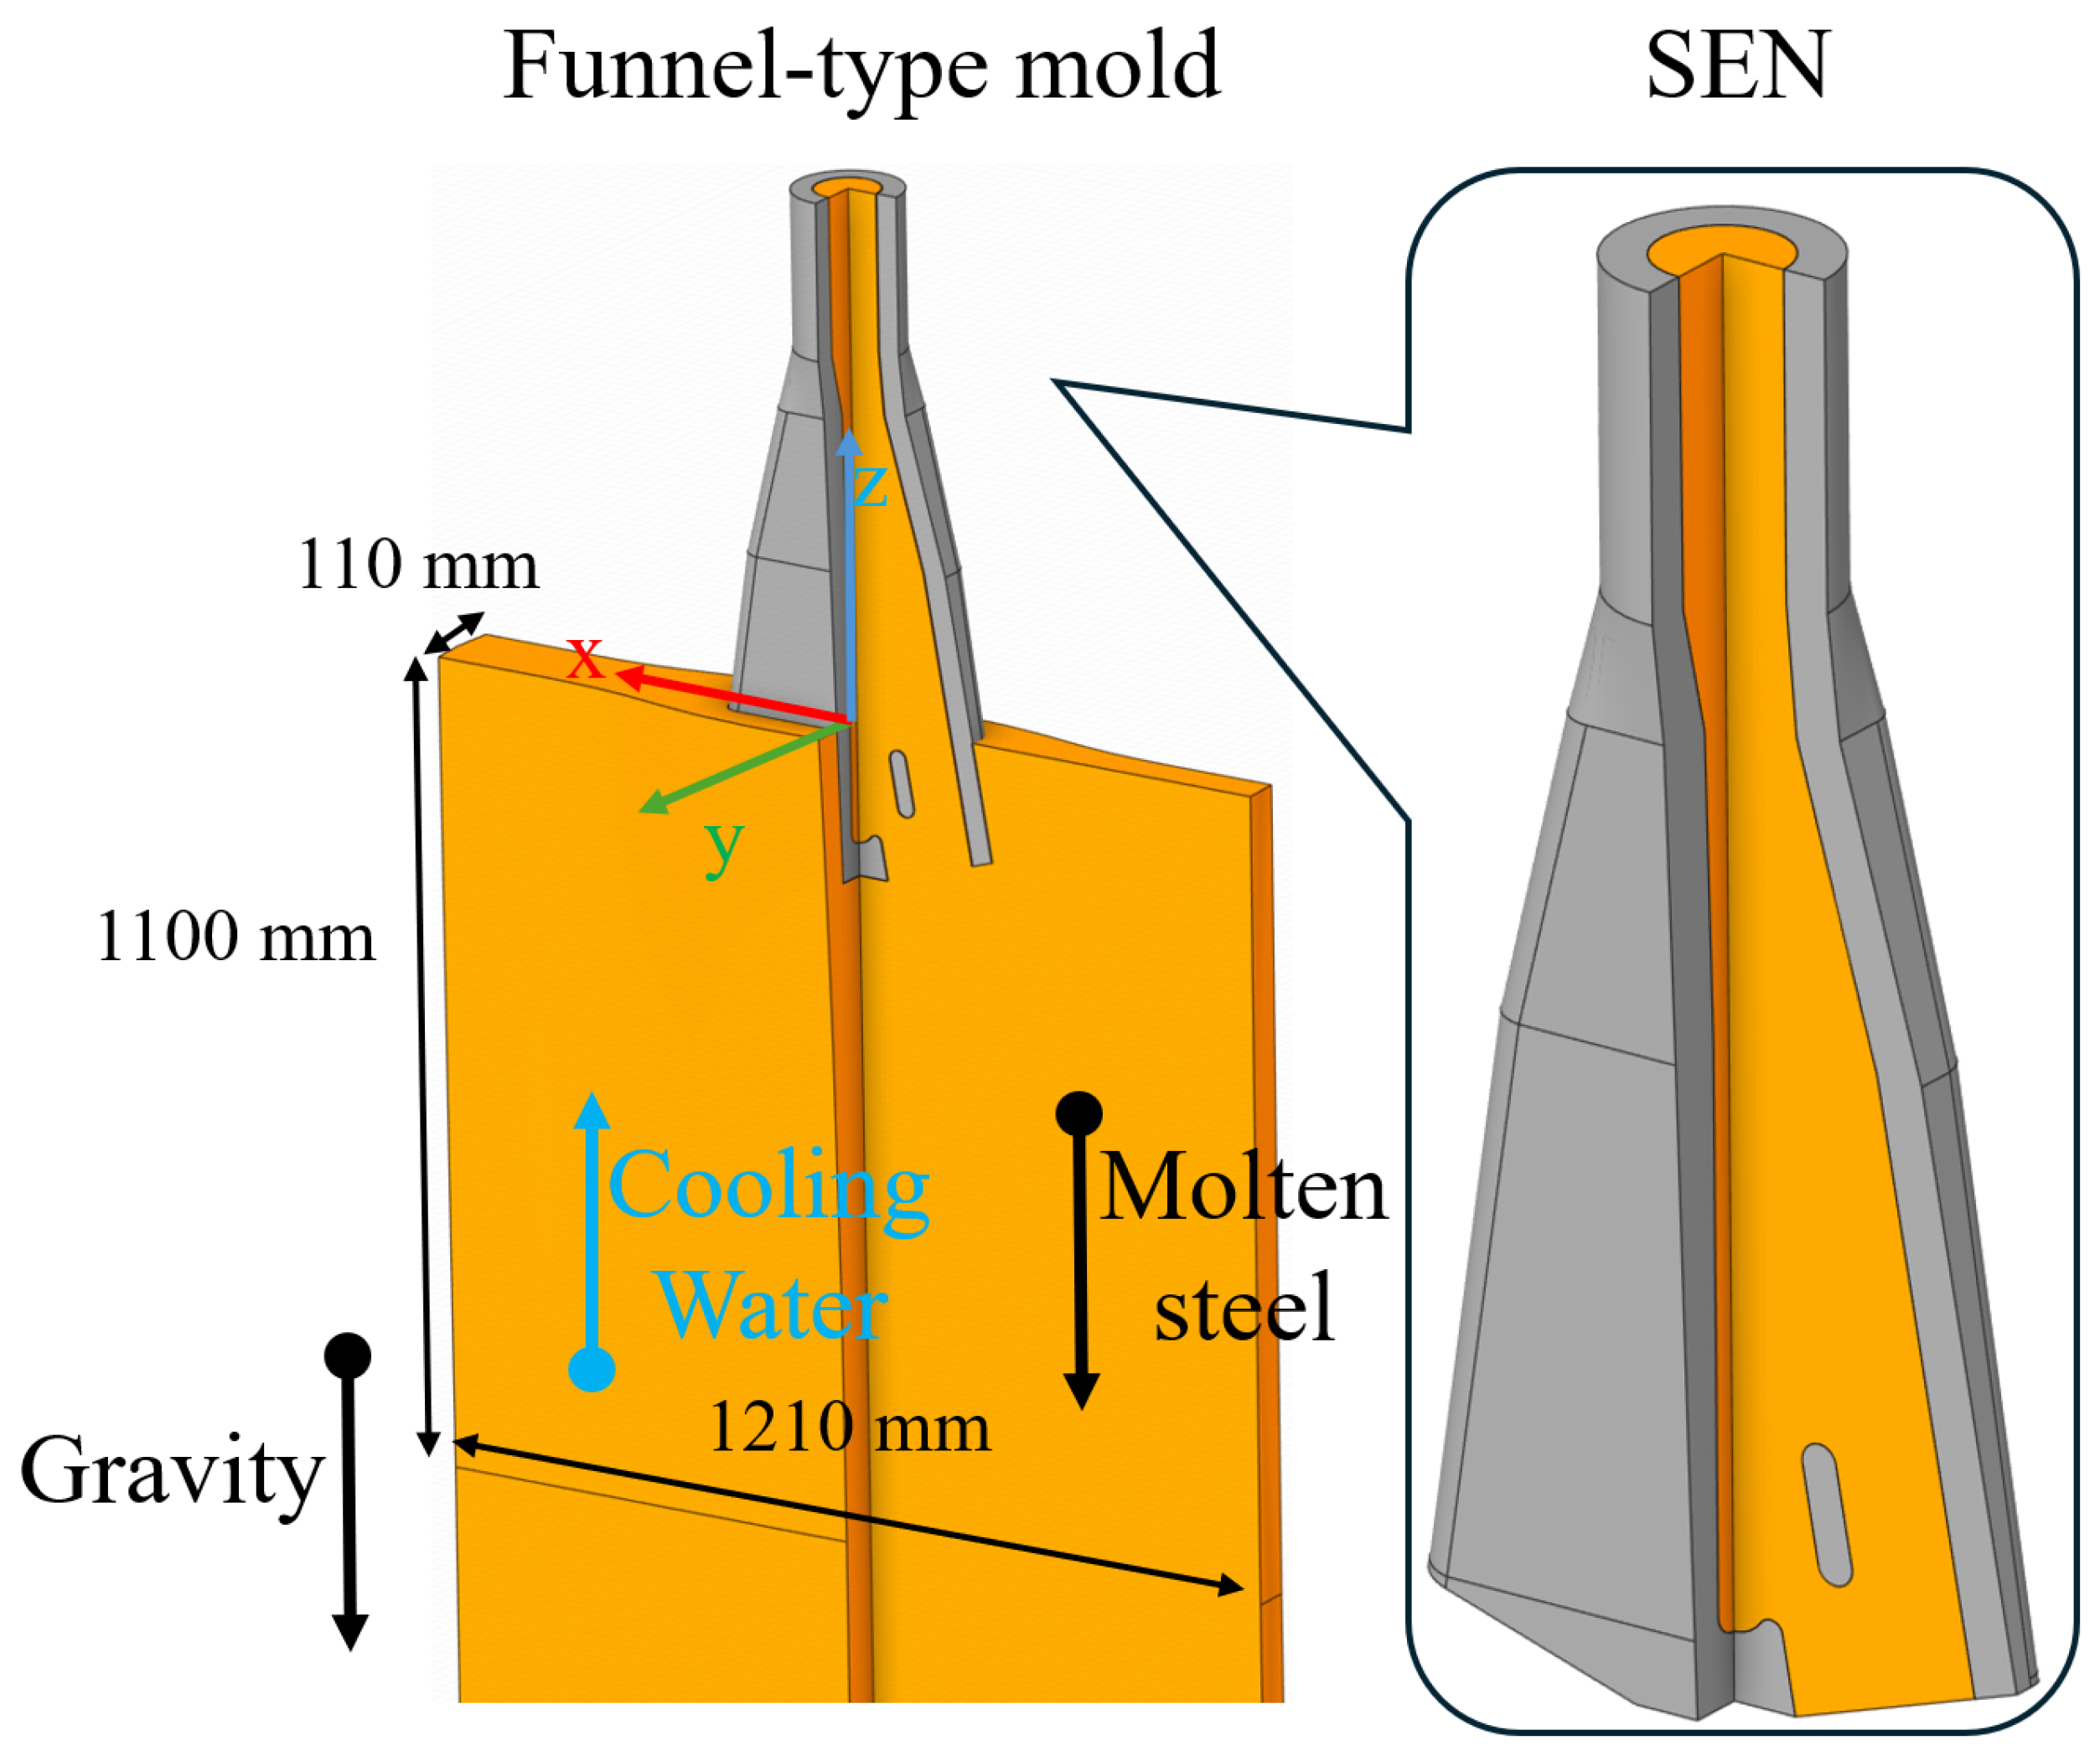
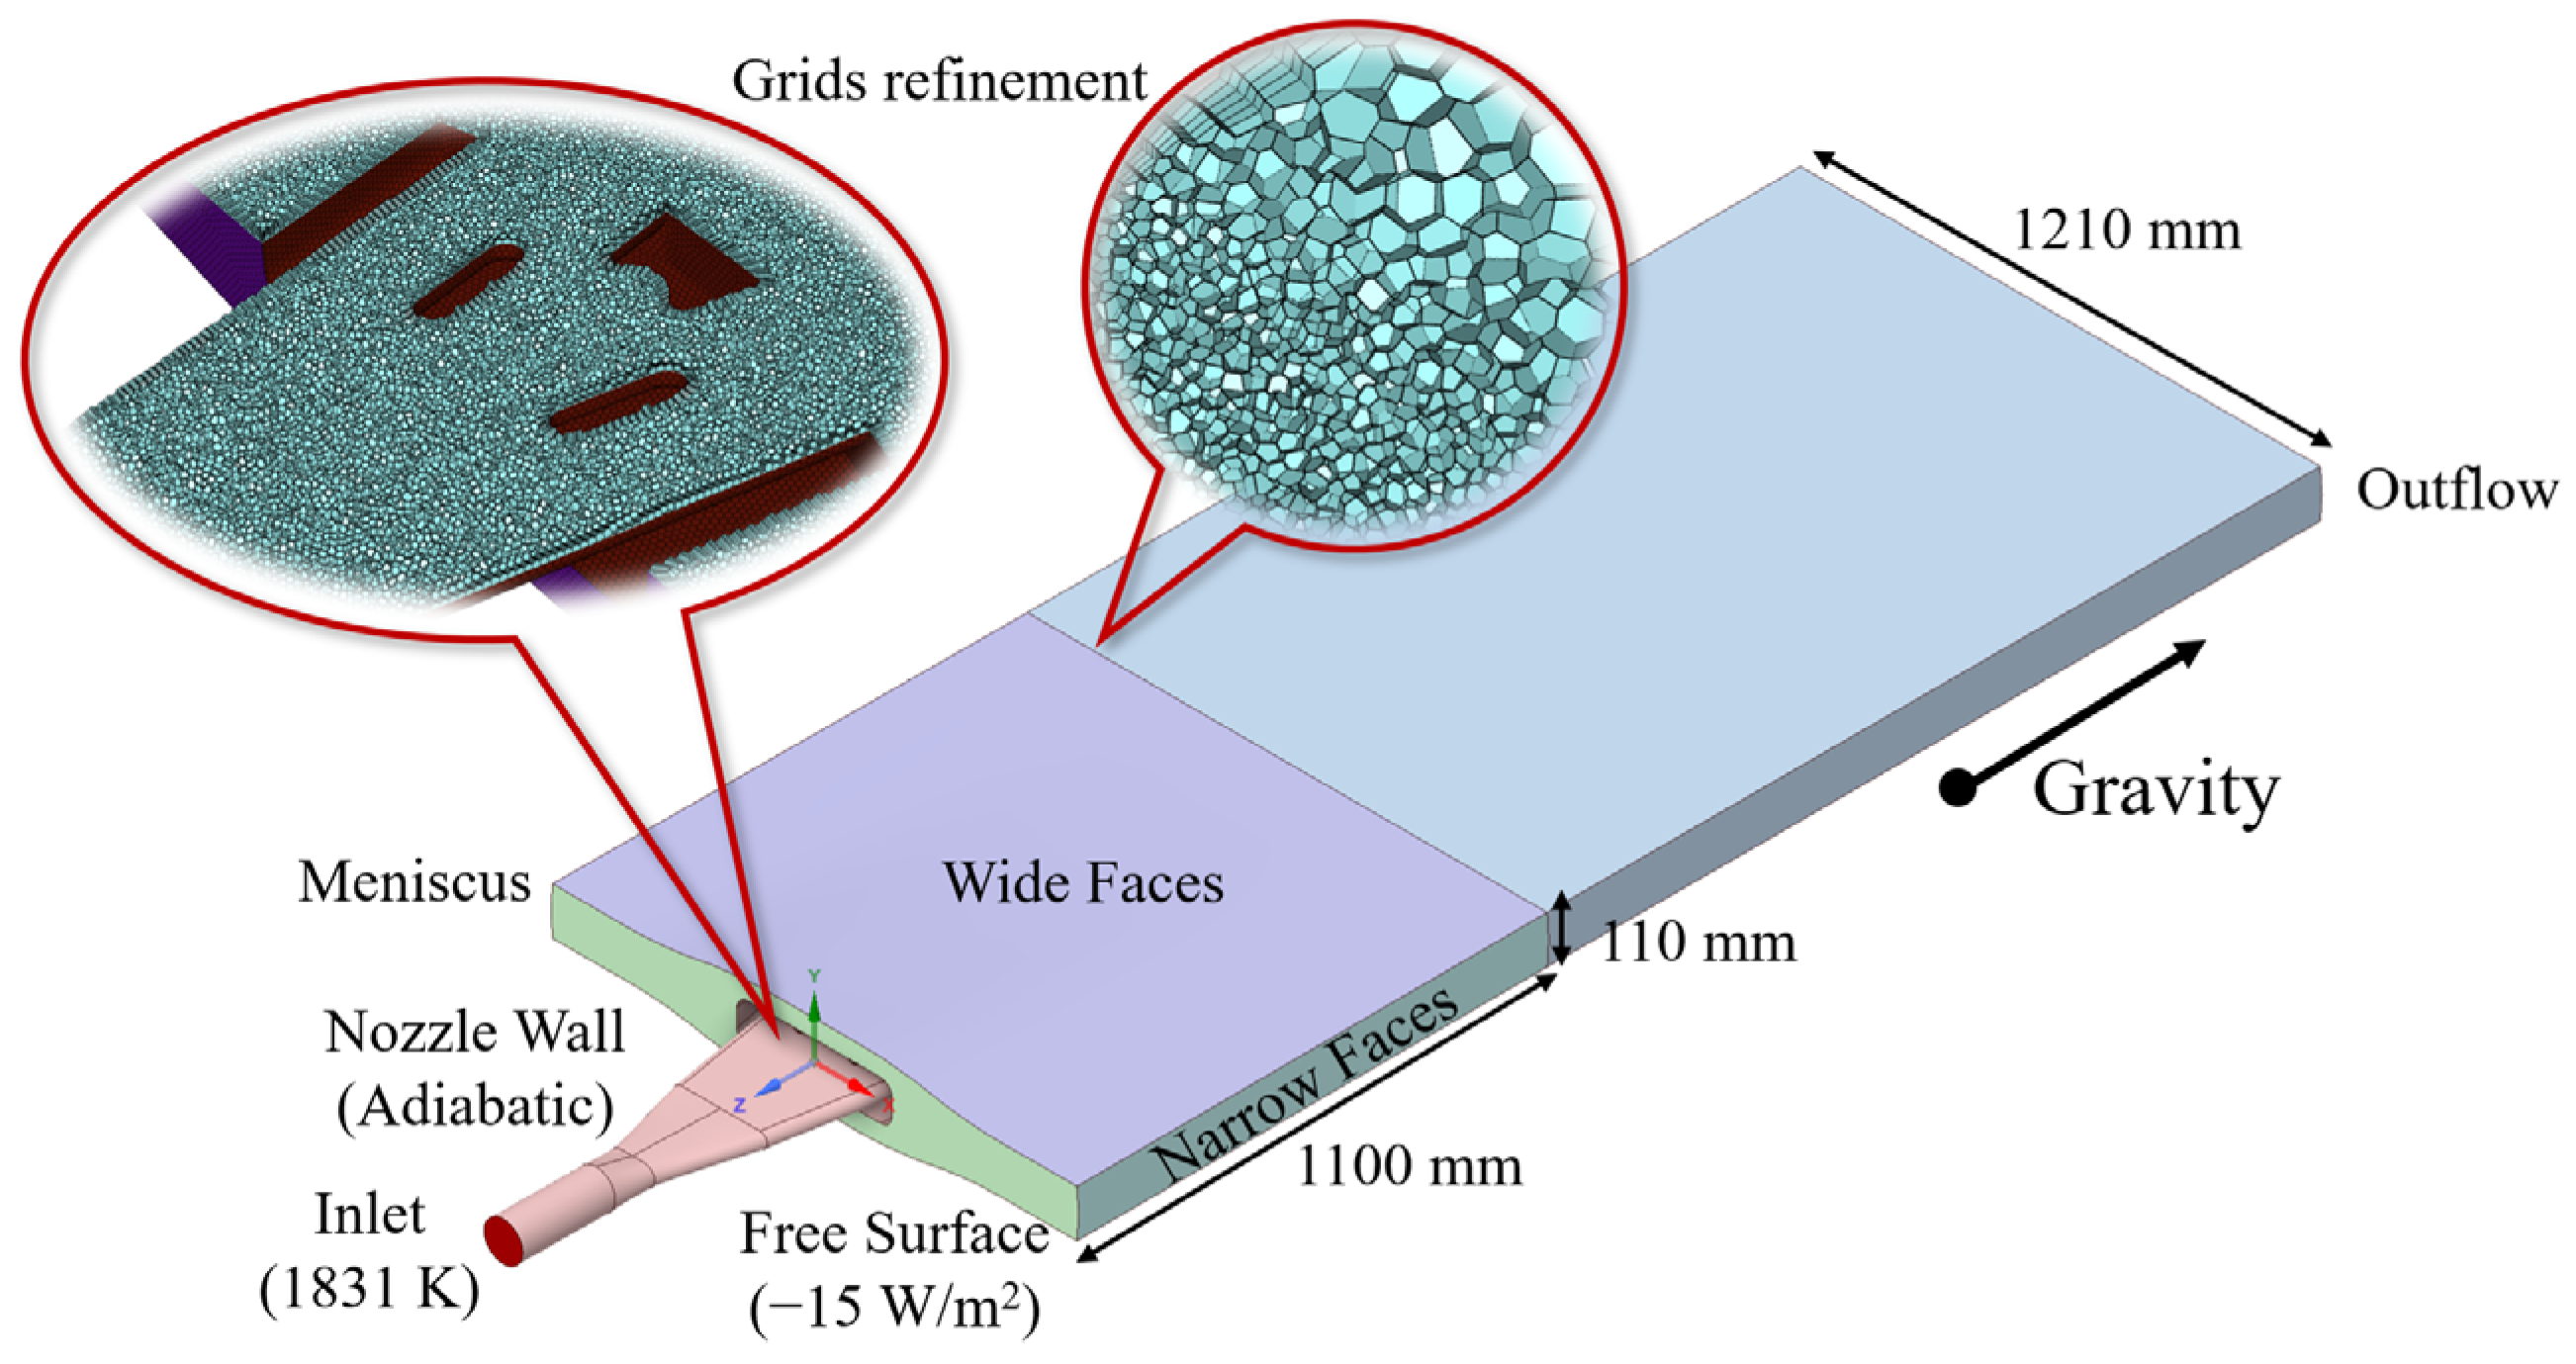
The mathematical model was solved using the commercial CFD software Ansys Fluent 2022 R1 (v22.1, Ansys, Inc., Canonsburg, PA, USA), and transient simulations were performed on a Windows 11 server equipped with one AMD 7950X core (Advanced Micro Devices, Inc., Santa Clara, CA, USA) with a simulation time of 40 s. In order to simplify the mathematical model, the following assumptions were made in this work: (1) The molten steel in the mold is considered to be a uniform, incompressible Newtonian fluid, and the flow of the molten steel reaches a steady state. (2) Molten steel is a homogeneous medium, and its physical properties are assumed to be constant. (3) The effects of the surface slag layer and chemical reactions on the molten steel are ignored. (4) The effects of mold vibration, bulging and shrinkage of solidified slab shell on the molten steel are ignored. (5) The effect of solid-state phase change on the molten steel is ignored, as the latent heat of solid-state phase change is much smaller than the latent heat of solidification. (6) The electromagnetic parameters of the molten steel are uniform and isotropic. (7) Only the component of magnetic field normal to the wide face of the mold is considered when solving multiple physical fields.

2.1. Physical Model

In this work, a double-hole SEN is applied to the funnel-shaped mold. The details of the physical model are shown in Figure 1 and Table 1. By using Ansys SpaceClaim, a three-dimensional full-scale geometric model of the funnel-type mold with a double-hole SEN is established according to the actual working condition of ESP. Its coordinate origin is at the center of the free surface, the mold body is located in the negative half-axis of the z-axis, the wide face of the fixed side is located in the negative direction of the y-axis and the wide face of the loose side is located in the positive direction of the y-axis. In order to fully develop the molten steel turbulence in the mold, the calculation domain of the mold is extended to 2900 mm. The mold copper plate, SEN wall, related cooling equipment and the magnetic poles of the EMBr equipment are simplified and not included in the simulation model.

2.2. Fluid Phase Hydrodynamic

For incompressible fluids, the following represent the continuity and momentum conservation equations:
· u ¯ = 0
ρ u ¯ t + ρ ( u ¯ u ¯ ) = p + ( μ e f f u ¯ ) + ρ g ¯ + S D + F m a g , E M B r
μ e f f = μ 0 + μ t
where ρ represents the density (kg/m3), t is the time (s), u ¯ is the velocity of molten steel (m/s), μ 0 is the molecule viscosity (Pa⋅s), μ t is the turbulent viscosity (Pa⋅s), μ e f f is the effective viscosity (Pa⋅s), S D is a momentum sink described by Darcy’s law, F m a g , E M B r is the filtered Lorentz force caused by the electromagnetic brakes (EMBr).
Due to its robustness, economy and reasonable accuracy for various turbulences, the standard k - ε two-equation turbulence model is used to calculate the transient melt flow. The transport equations of k and ε are as follows:
ρ ( k ) t + ρ · ( k u ¯ ) = [ ( μ 0 + μ t σ k ) · k ] + G k ρ ε + S k
ρ ( ε ) t + ρ · ( ε u ¯ ) = [ ( μ 0 + μ t σ ε ) · ε ] + C 1 ε k G k C 2 ε 2 k ρ ε + S ε
μ t = C μ ρ k 2 ε
G k = μ t ( u j x i + u i x j ) u i x j
where k is the turbulent kinetic energy (m2 s−2), ε is the turbulent kinetic energy dissipation rate (m2 s−3), C μ = 0.09, C 1 = 1.44 and C μ 2 = 1.92 are empirical constants. σ ε = 1.3 and σ k = 1.0 are Prandtl numbers corresponding to turbulent kinetic energy k and turbulent kinetic energy dissipation rate ε [31], S k and S ε is momentum sink in the mushy zone and solid zone.

2.3. Solidification and Melting Mode

An enthalpy–porosity method [32] was applied to predict the distribution of the solidified shell. Its basic assumptions are: (1) The phase change region is treated as a porous medium. (2) The phase change occurs in a temperature range rather than at a fixed point. (3) The total enthalpy is decomposed into sensible heat and latent heat. A total enthalpy equation was solved to calculate the temperature fields in the computational domain. The total enthalpy contains the latent heat released from solidification and melting. The equation and the total enthalpy are:
ρ ( H ) t + ρ · ( u ¯ H ) = · λ e T + Q m a g
H = h r e f + T r e f T c p d T + β L
where c p is heat capacity (J·kg−1·K−1); λ e is the thermal conductivity (W·m−1·K−1); H is total enthalpy (J kg−1); Q m a g is the source of heat transfer equation; h r e f and T r e f are the reference enthalpy and the reference temperature; β is the liquid fraction of simulated steel; and L is the latent heat. It was assumed that the liquid fraction varies linearly with the steel temperature and is defined as follows [11]:
β = { 1                                             T l i q u i d u s < T T T s o l i d u s T l i q u i d u s T s o l i d u s               T s o l i d u s < T T l i q u i d u s 0                                     T T s o l i d u s
The mushy zone was treated as a porous medium, the porosity of which is equal to the liquid fraction in each cell. The drop in momentum due to the drag of the solid dendrites in the mushy zone is modeled by Darcy’s law [33]:
S D = ( 1 β ) 2 β 3 + β 0 A m u s h ( u ¯ u s )
S k = ( 1 β ) 2 β 3 + β 0 A m u s h k
S ε = ( 1 β ) 2 β 3 + β 0 A m u s h ε
where β 0 is 0.001 (to avoid using 0 as the denominator); A m u s h is the mushy zone coefficient; u s is the velocity of solidified shell (m/s).

2.4. Electromagnetic Stirring Force

For analyzing the braking effect of EMBr, the electrical potential method of the Fluent MHD model was introduced to the numerical model [34,35,36,37]. Based on Ohm’s law, the induced current density can be solved by:
J = σ [ E + ( v × B ) ]
where J represents the induced current density (A/m2); σ is the electrical conductivity (S/m); E is the strength of electric field (V/m); v is the velocity of fluid (m/s); and B is the magnetic flux density (T).
The strength of electric field E can be solved as follows based on the electrical potential φ (V):
E = φ
According to the electric current conservation:
· J = 0
The expression of the potential equation is shown as below:
2 φ = · ( v × B )
The filtered Lorentz force caused by the EMBr F m a g , E M B r in Equation (2) is:
F m a g , E M B r = J × B

2.5. Boundary Conditions and Numerical Details

The details of computational grids and material physical properties are systematically summarized in Figure 2 and Table 2. The polyhedral mesh was generated using Ansys Fluent Meshing with Body of Influence (BOI) local refinement in the mold region. The baseline mesh resolution was maintained at 5 mm, with adaptive refinement implemented in critical zones demanding enhanced numerical precision, particularly the submerged entry nozzle (SEN), fluid inlet boundaries and near-wall regions. Five layers of mesh were added at the boundary to improve the accuracy, while polyhedral elements were utilized for bulk domain discretization to optimize solution convergence. The final mesh configuration contained approximately 2.9 million cells, exhibiting a minimum orthogonal quality of 0.5 and an average orthogonal quality of 0.97. These metrics confirm the mesh satisfies the strict orthogonality requirements (typically >0.3) for industrial-grade CFD simulations, ensuring sufficient accuracy for the multi-physics numerical model in continuous casting processes.
Throughout the numerical framework, the submerged entry nozzle (SEN) was maintained at a fixed immersion depth of 270 mm. and the boundary condition of the inlet was set to the velocity inlet. The inlet boundary condition (BC) was specified as a velocity inlet, with the magnitude derived through rigorous application of mass conservation principles, taking into account the casting speed and mold cross-sectional dimensions. A constant velocity boundary condition was imposed on the inlet, and the relevant boundary condition calculation formula is as follows:
v i n l e t = v c · A A S E N
k = 0.01 v i n l e t 2
ε = 2 v i n l e t 1.5 d i n l e t
where v i n l e t is the velocity at the inlet (m/s); v c is the casting speed (m/s); A is the area of the section (m2); A S E N . is the area of the inlet (m2); d i n l e t is the diameter of the inlet (m). The outlet of the computational domain is specified as outflow to permit unrestricted fluid discharge while maintaining mass conservation. Shear stress in all three directions on the free surface is assumed to be zero, and the insulating electric boundary condition is applied to the free surface, the wide surface and the narrow surface. In addition, the MHD boundary condition of the mold wall and the SEN wall is selected by default, and the detailed boundary conditions of other boundaries are shown in Table 3. This study focuses on the molten steel in the mold, and the boundary conditions of the extended domain are omitted.
The calculation formula for the heat flux of the wide face and narrow faces of the mold is as follows [38]:
q m = ( 2.688 b z v c ) × 10 6
b = 1.5 × ( 2680000 q a v e ) H v c
q a v e = C × m × Δ T S
where z is the coordinate axis of z (m); H is the height of the mold (m); q a v e is the average heat flux (W/m2); C is the heat capacity of water (J kg−1 K−1); m is the flow of cooling water (L/s); Δ T is the temperature increase of the water (K); S is the effective area of the inner cavity of the copper tube of the mold.
The key parameters for calculating heat flux distribution are shown in Table 4. The implementation details related to Electromagnetic Braking (EMBr) are systematically illustrated in Figure 3. Specifically: Figure 3a is the method for measuring the distribution of magnetic induction intensity of EMBr. Figure 3b is the distribution of magnetic induction intensity on the mold after implementing the MHD-coupled electromagnetic boundary conditions. Figure 3c is the comparison between the actually measured magnetic induction intensity distribution and the setting value of the numerical simulation under varying excitation currents.
The governing equations were discretized and solved through the finite volume method (FVM) framework within ANSYS Fluent 2022 R1. The pressure–velocity coupling was addressed using the Semi-Implicit Method for Pressure-Linked Equations (SIMPLE) algorithm to ensure robust iterative convergence of the pressure–momentum system. Spatial discretization employed the PRESTO! (PREssure STaggering Option) scheme for pressure interpolation to mitigate checkerboard oscillations. Second-order upwind differencing was employed for convective terms in transport equations to balance accuracy and stability. In addition, the convergence criterion for the numerical model is that the variable residual is less than 1 × 10⁻³. In order to ensure convergence at each time step, the time step was set to 0.01 s to solve the transient turbulence. Based on the pre-experimental calculations, when using this time step, a simulation time of 40 s was selected considering the high-speed casting conditions, and the time-averaged data were calculated throughout the whole solution process. On average, completing the transient simulation of a multi-physical field requires about 30 h.

3. Scheme of Numerical Simulation

In this work, the effects of different cavity curves of molds and different structures of SEN on the flow, heat transfer and solidification of molten steel were studied. Two molds with different cavity curves as shown in Figure 4, two SENs with different structures as shown in Figure 5, and SENs with the same structure but different inner diameters (enlarged to 1.13 times) were selected for numerical simulation to investigate the stability of internal and surface structure, temperature distribution and the thickness and uniformity of the solidified shell. The specific numerical simulation scheme is shown in Table 5.
As shown in Figure 4, two distinct funnel-cavity curves are composed of straight lines at both ends and a curve in the middle. The curve in the middle can also be further divided into two sections at the center (x = 270 mm): a convex curve and a concave curve. Furthermore, x = 270 mm is the location where the curvature of the curve changes and where the two different cavity curves intersect. Since the maximum strain of the solidified shell occurs at the intersection of the two arcs of the mold funnel surface [23], if the flow rate here is high and the temperature is elevated, the thickness of the solidified shell will be insufficient and the temperature difference between the hot and cold surfaces of the shell will be substantial. The thermal stress here will increase, which may readily lead to accidents such as cracks and steel leakage. Therefore, in the subsequent analysis, it is essential to pay closer attention to the state of velocity, temperature and solidified shell at x = 270 mm.

4. Results and Discussion

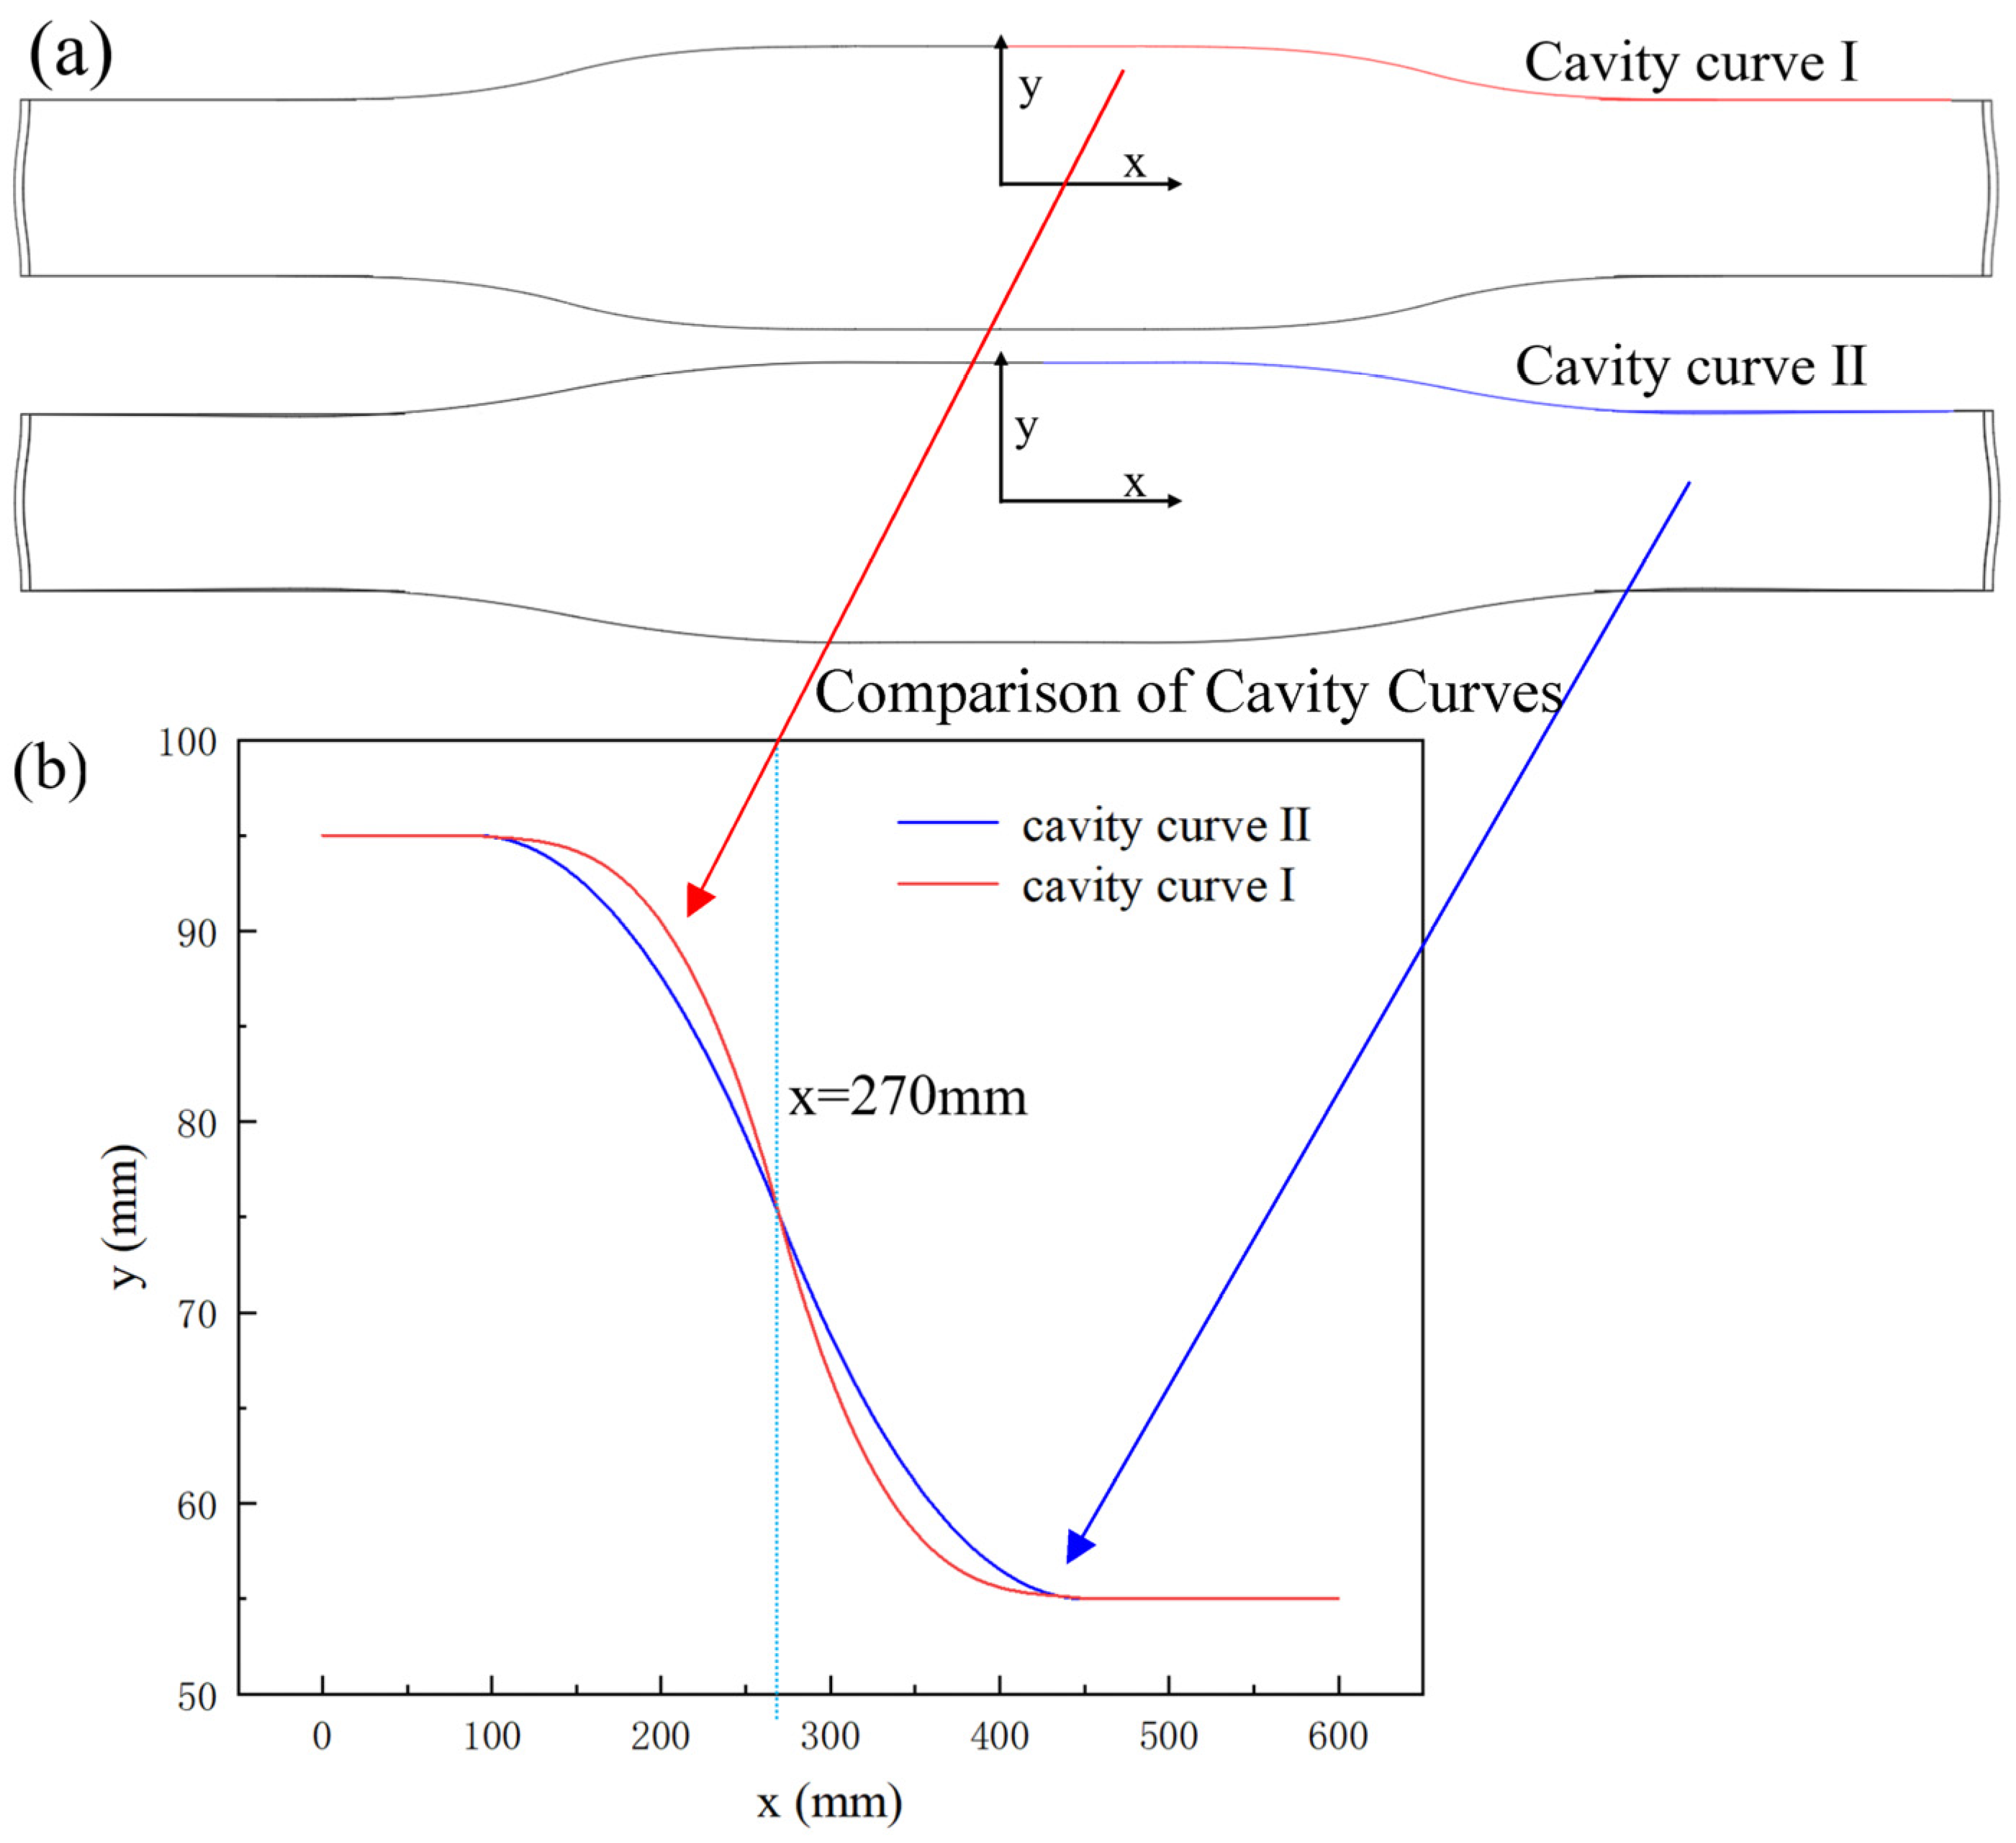
4.1. Model Verification

Under the same working conditions (funnel-type mold of type-Ⅰ, SEN of type-Ⅰ, casting billet section of 1210 mm × 110 mm, casting speed of 5 m/min, immersion depth of 170 mm, no electromagnetic brake), both numerical simulation and physical simulation were carried out to verify the accuracy of the numerical model. The PIV (particle image velocimetry) velocity-measurement system was employed to measure the molten steel flow in the physical simulation. The flow results of the numerical simulation and physical simulation are compared in Figure 6a. It can be observed from the figure that the molten steel rushes into the mold from the SEN at a high speed and at a certain angle, generating two vortices on either side of the mainstream strand. The vortex on the outside (close to the narrow surface of the mold) is more intense, while the vortex on the inside (close to the center of the mold) is relatively weak. The mainstream strand did not directly impact on the narrow face wall of the mold, and a part of the molten steel still moved toward the free surface close to the narrow side wall of the mold. The flow morphology and vortex distribution of the molten steel in the physical simulation and the numerical simulation are strikingly consistent, thus confirming the numerical model’s capability to replicate fundamental metallurgical phenomena.
A comprehensive validation study was conducted through synergistic numerical–experimental analysis under identical casting parameters (funnel-type mold of type-I, SEN of type-I, casting billet section of 1210 mm × 110 mm, casting speed of 5 m/min, immersion depth of 170 mm and electromagnetic braking). Numerical predictions of the solidified shell’s surface temperature were benchmarked against in situ thermocouple measurements from six strategic locations on the mold copper plate’s surface. As illustrated in Figure 6b, both datasets exhibit strong spatial correlation across the monitored domain, which verifies the accuracy of the numerical model. The results of the numerical simulation are the temperature of the surface of the solidified shell, while the results of on-site measurement are the temperatures actually measured by the thermocouples on the surface of copper plate of the mold. Since the heat transfer and exchange of the mold copper plate exhibit one-dimensional characteristics, the temperature distribution between the surface of the solidified shell and the surface of copper plate is linearly related [39]. Therefore, the temperature distribution and variation trend of the solidified shell surface and the copper plate surface should be basically consistent. As shown in Figure 6b, at the six temperature measuring points, the change trend of the numerical simulation temperature and the field measuring results is completely consistent. The temperature on the wide face of the mold first increases along the x-axis, then tends to be stable, and finally decreases, showing that the temperature in the center area of the wide face is higher while the temperature on both sides is lower. The difference between the simulation results and the field measurement results at the same position on the wide surface remains basically unchanged at about 1074 K (fluctuation is about 1%), demonstrating excellent model fidelity and indicating that the numerical model can accurately reflect the heat transfer and solidification phenomena of molten steel.

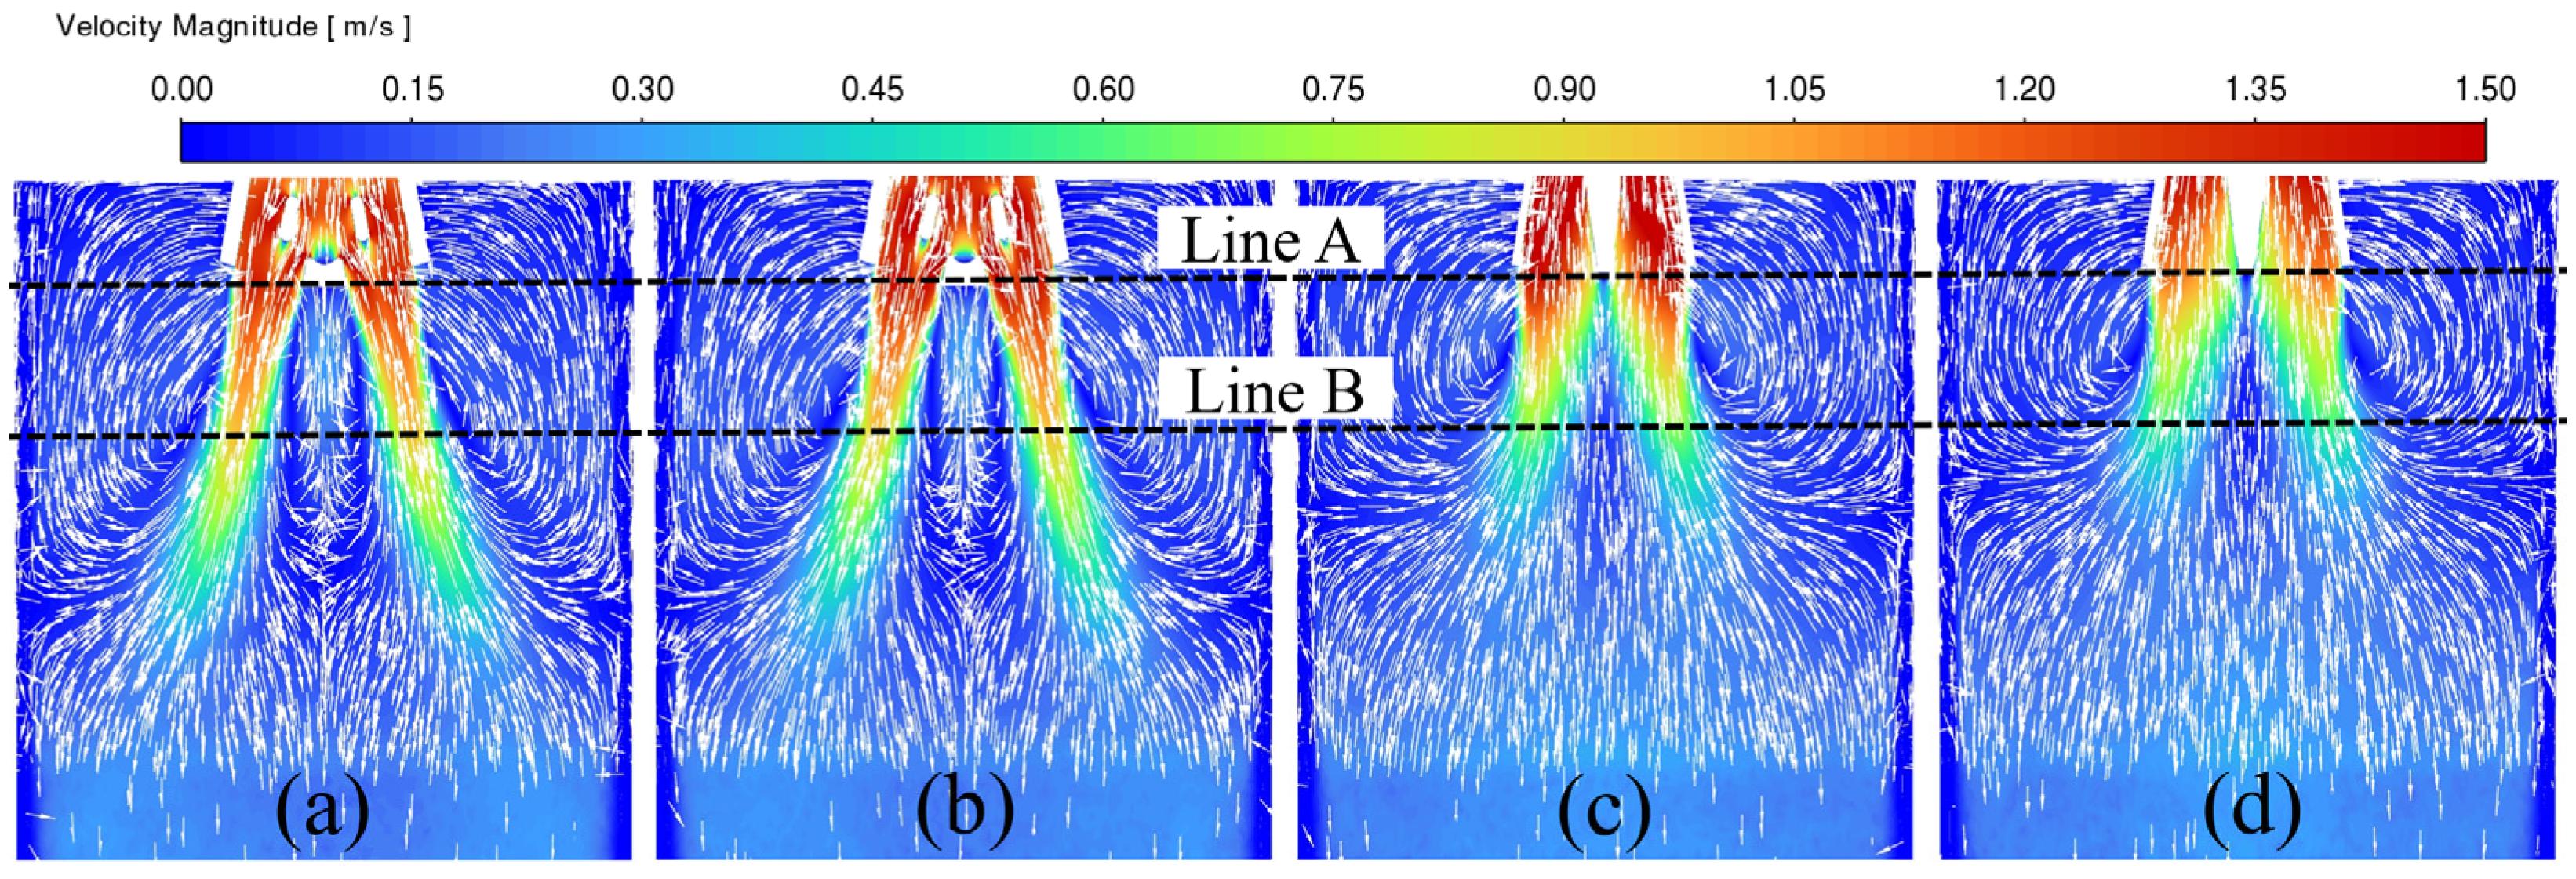
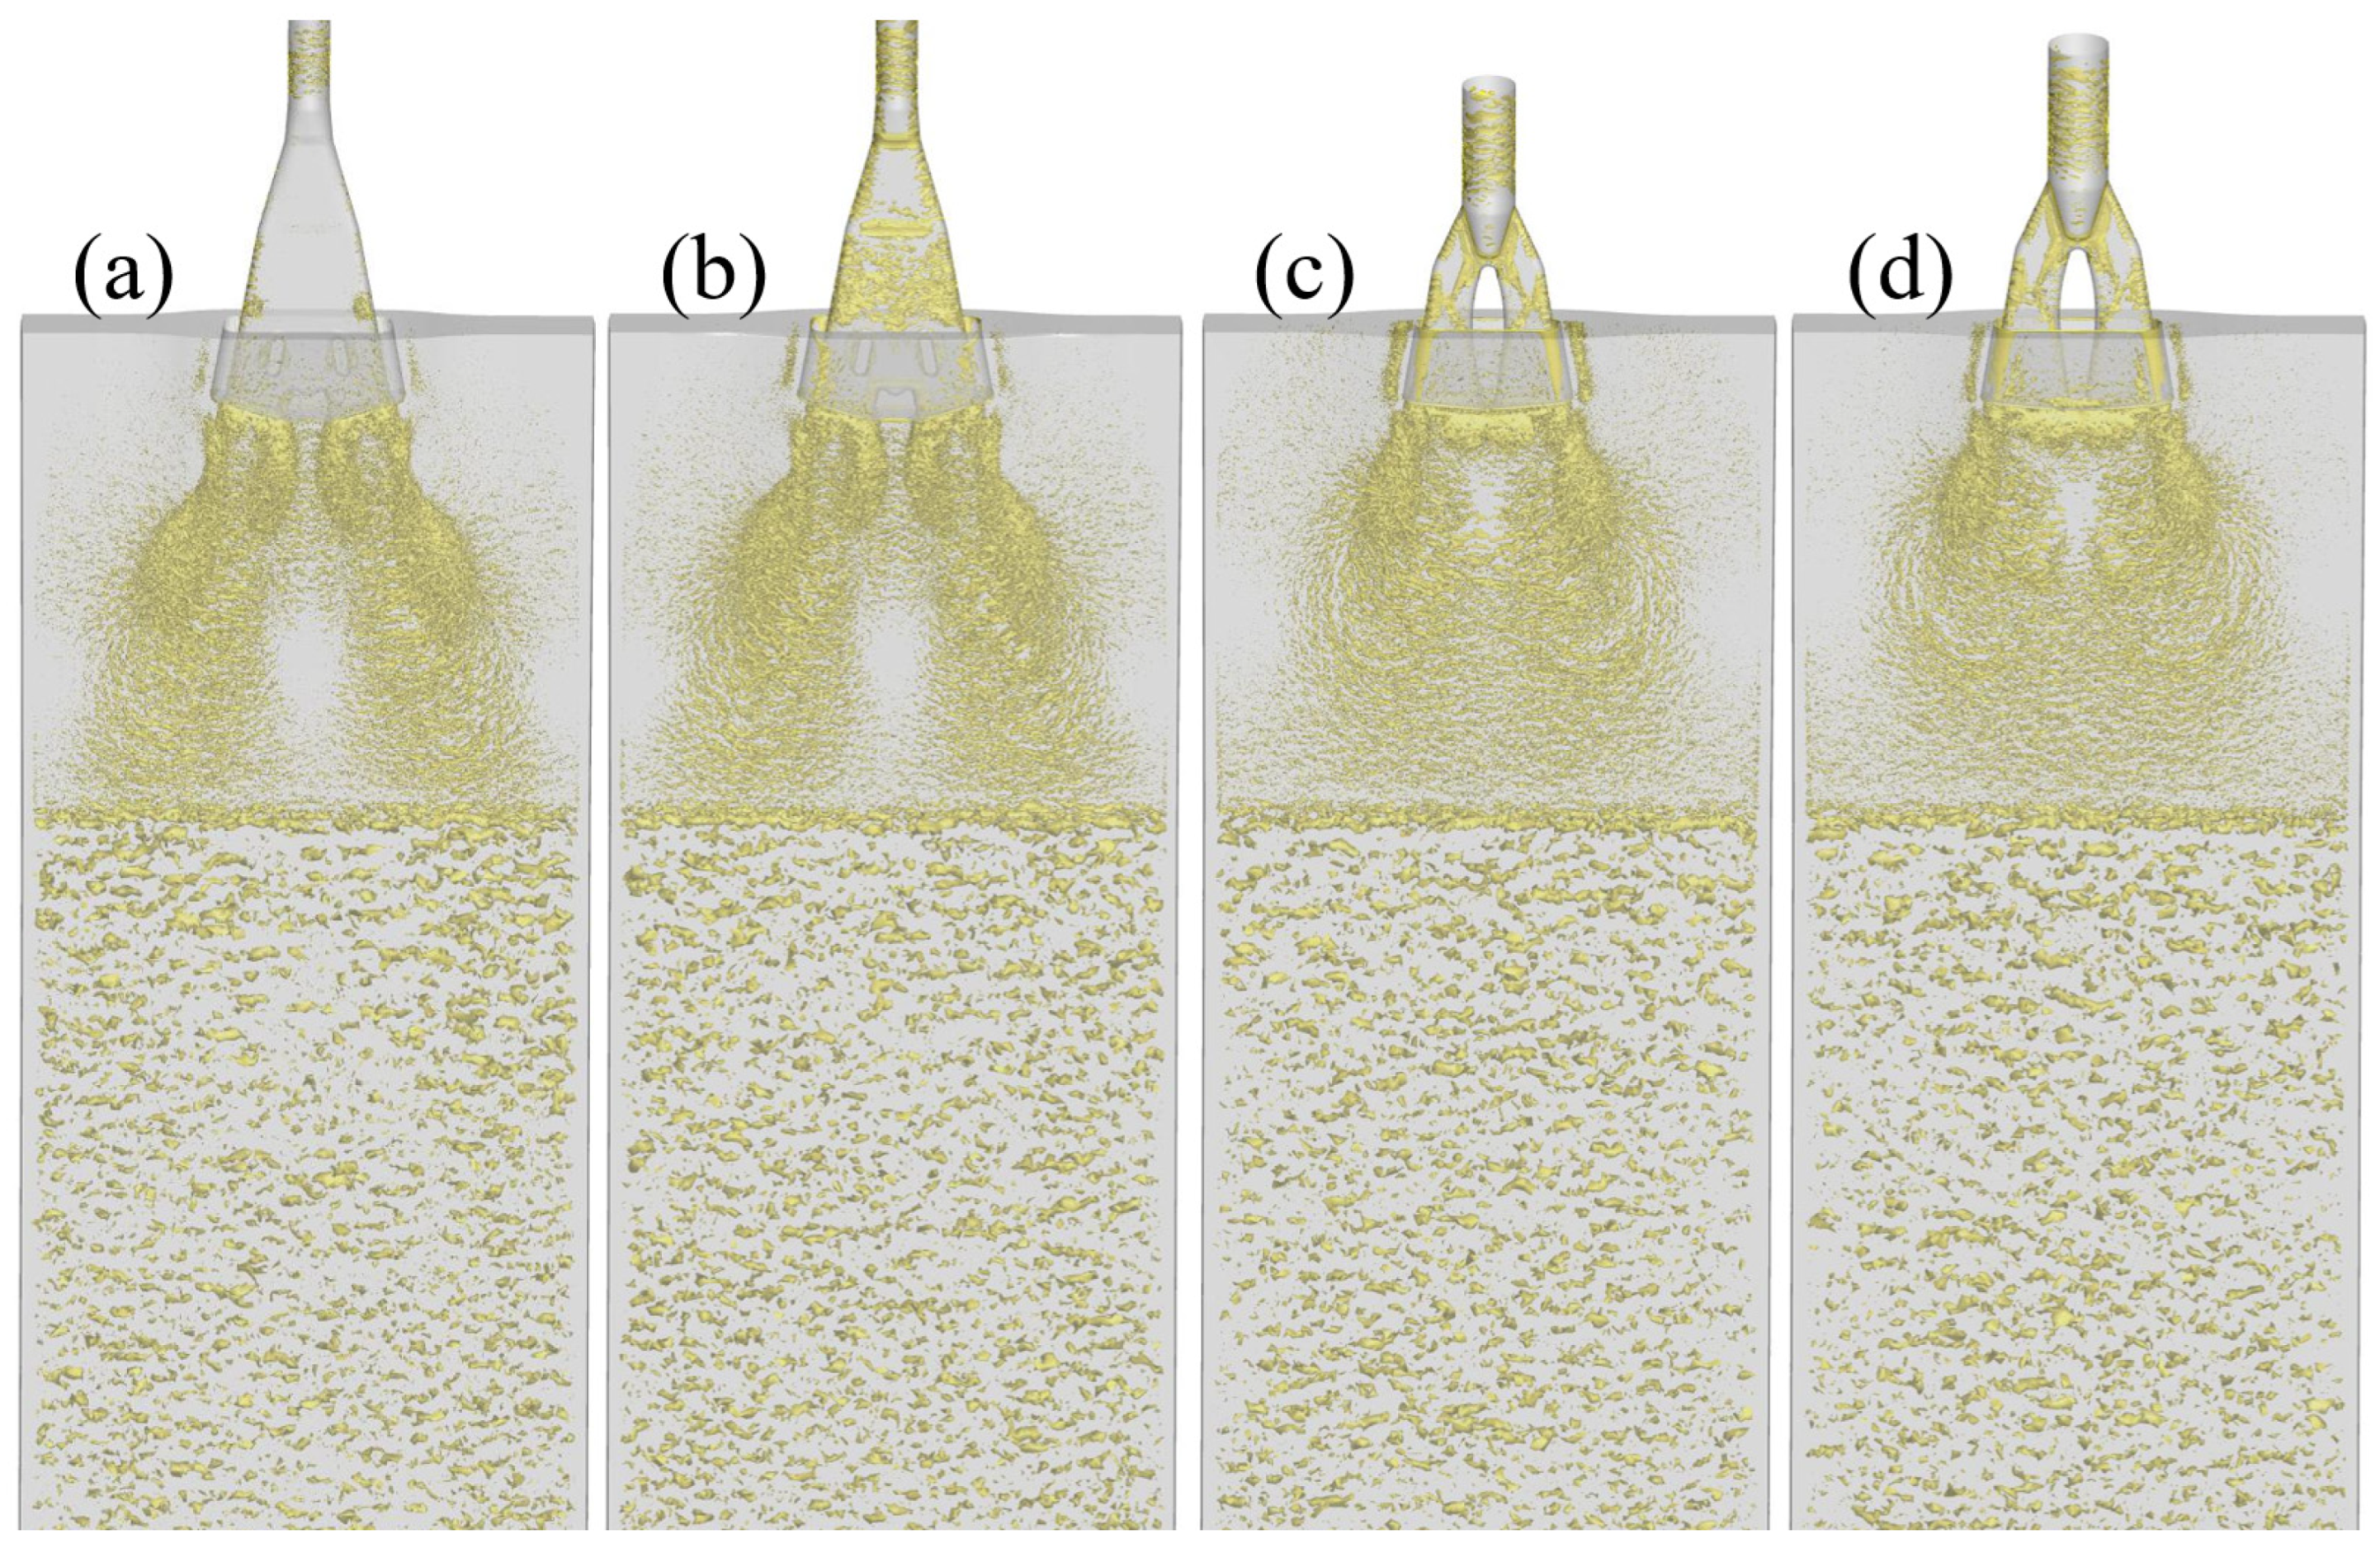
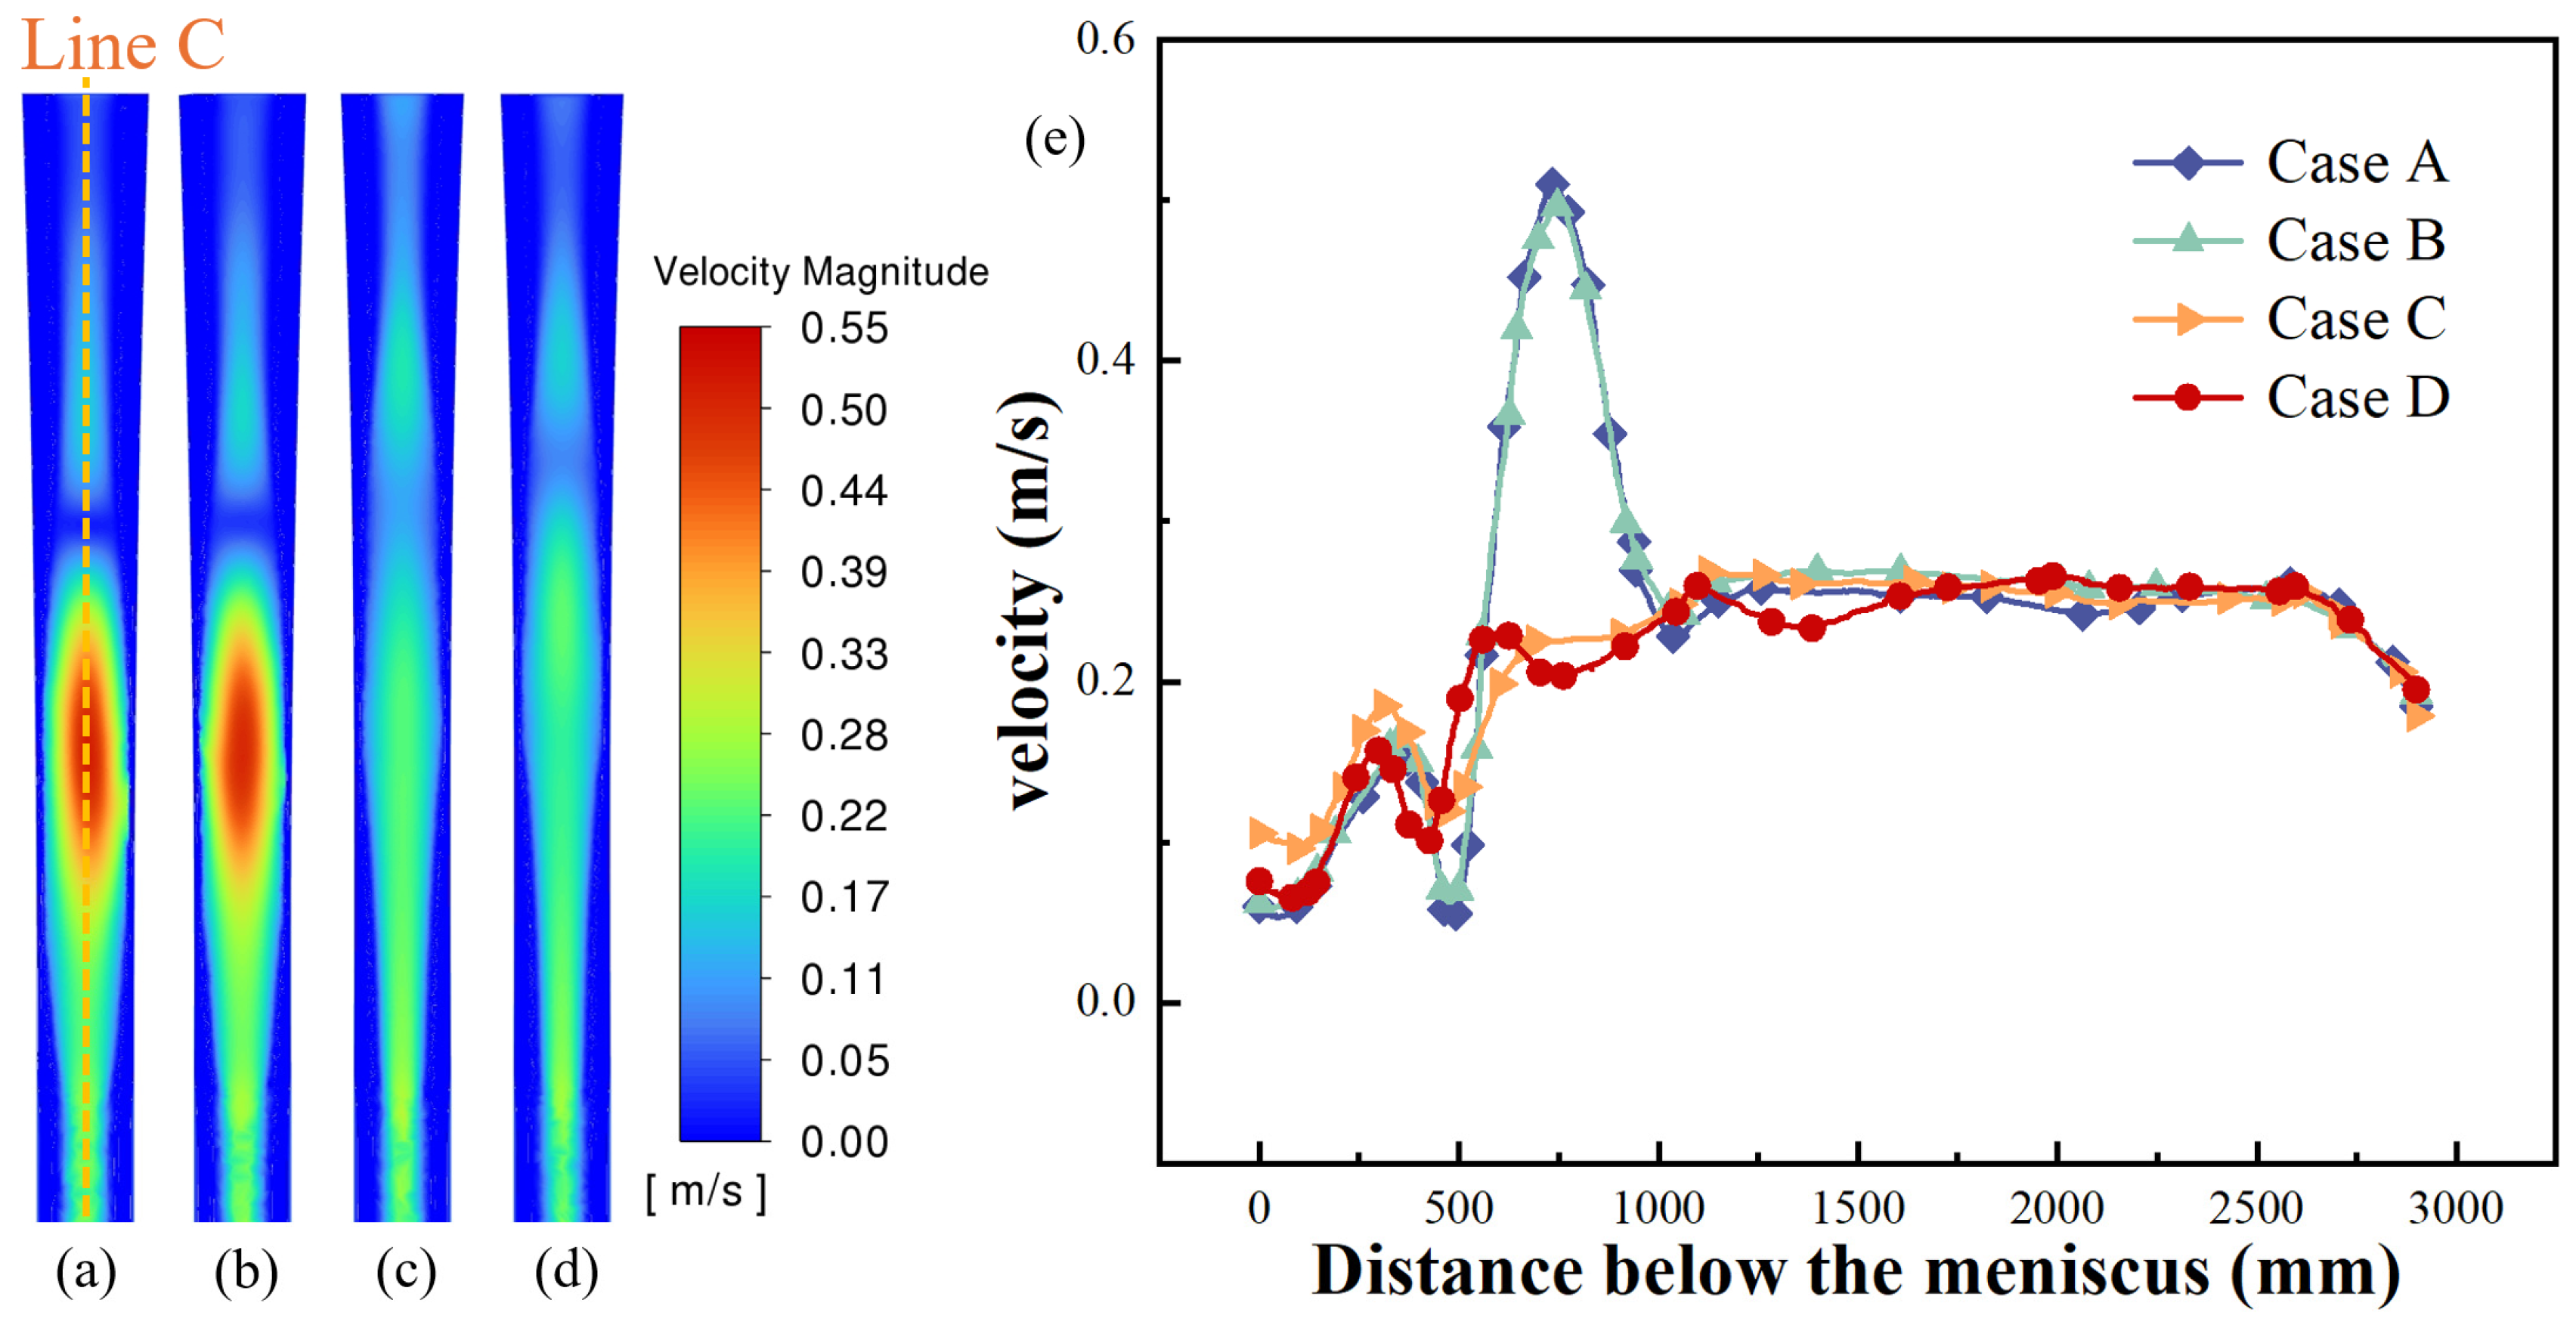
4.2. Melt Flow Field

Figure 7 shows the multi-dimensional comparison results of the velocity magnitude and vector distribution in the middle plane of the wide face (y = 0) of the funnel-type mold under different working conditions, revealing the regulation mechanism of geometric parameters on the flow field topology structure. As depicted in Figure 7a,b, given that the primary difference between the two cavity curves exists on the free surface (top face) of the mold, although there are differences in the top cavity of the mold, the flow state in the middle plane of the wide face is highly similar, which shows that the influence of the geometric disturbance of the top cavity on the flow state of the middle and lower body is localized, providing a theoretical basis for local structural optimization. Figure 7c replaces the SEN with a different structure (type-II), which significantly affects the flow state of the molten steel in the mold, and three primary modifications were observed: redistribution of flow direction, as the angle and the vortex between the two main streams is significantly suppressed; jet penetration depth decreases and the high-velocity core shifts upward toward the meniscus; the narrow-face impingement point ascends and creates a secondary surface vortex through upward momentum transfer. Figure 7d presents the scenario where an enlarged type-II SEN is utilized. The overall flow velocity in the SEN is reduced through momentum dissipation, resulting in a decrease in the impact depth and a suppression in surface fluctuation. In addition, the two lines in Figure 7, Line A (z = −170 mm) and Line B (z = −500 mm), correspond to the outlet of the SEN and the middle area of the mold, respectively; the velocity distribution results along Line A and Line B are shown in Figure 8.
Figure 8 delineates the velocity distribution characteristics at two monitoring lines, revealing related flow modulation mechanisms. Figure 8a shows the distribution of the velocity at the SEN outlet (z = −170 mm). In the range of −150 mm < x < 150 mm, the outlet velocity of the SEN using the type-II mold is about 0.07 m/s higher than that of the type-I mold, indicating that the geometric perturbation of the upper cavity exhibits a measurable impact on the flow characteristics at the SEN outlet. The distance between the two main streams of molten steel in the type-II SEN is very close, about 30 mm, while in comparison the distance in the type-Ⅰ SEN is 76 mm. Compared with the type-II SEN, the peak velocity at the outlet of the enlarged type-II SEN is reduced from 1.47 m/s to 1.14 m/s, while its high-speed (>0.6 m/s) area range increased from 300 mm to 341 mm. Figure 8b shows the velocity distribution at z = −500 mm. There is no difference in the velocity distribution here when using different molds with different cavities (Case A and Case B), verifying the influence of the geometric disturbance of the top cavity on the flow state of the middle and lower body is localized. In addition, when using the type-Ⅰ SEN, a small vortex will form in the middle of the two main streams of molten steel in the middle section of the mold. In the range of −100 mm < x < 100 mm, the speed will increase significantly, while this phenomenon will not occur with the type-II SEN.
The three-dimensional vortex structure distribution based on the Q criterion is shown in Figure 9. The Q criterion is a vortex identification method based on the decomposition of the velocity gradient tensor. When drawing the Q isosurface, a threshold that reflects the vortex strength needs to be specified. Selecting the isosurface with Q = 1 s−2 [11] can clearly display the vortex distribution and filter out background noise. It can be seen from Figure 9 that the vortex distribution is basically the same under using different mold cavities, which is consistent with the previous analysis. Compared with the type-Ⅰ SEN, after changing to the type-II SEN, the vortex of the molten steel flow is more concentrated in the middle and upper part of the mold, meanwhile the vortex at the mold outlet is reduced. Compared with the type-II SEN, the vortex distribution of the enlarged type-II SEN is more extensive and sparser, especially at the outlet of the SEN.
A comparative analysis of velocity profiles across the x = 270 mm plane under varying cases is illustrated in Figure 10a–d. Different mold cavities exhibit remarkable consistency in velocity distributions at this critical plane, with elevated velocities (v > 0.25 m/s) persisting across the 600 mm < z < 1000 mm domain. Notably, this characteristic flow pattern is entirely absent when employing the type-II SEN. Intriguingly, the velocity distribution for the enlarged type-II SEN (Case D) exhibits negligible discrepancies compared to the type-II SEN (Case C) at this plane, as further corroborated by the velocity magnitude profiles along Line C in the negative z-direction (Figure 10e). It is also noted from Figure 10e that within the 600–1000 mm z-range, the type-II SEN-driven flows exhibit substantially diminished velocities compared to the type-I SEN, with a maximum speed difference of 0.28 m/s, effectively suppressing high-momentum zones linked to crack initiation and steel leakage risks.
Figure 11 delineates the velocity magnitude distribution at the mold’s top free surface. Distinct SEN geometries yield divergent interfacial contact areas between molten steel in the SEN and the free surface, with the type-I SEN (Case A and Case B) exhibiting larger contact area than the type-II SEN (Case C and Case D). In accordance with mass flux conservation principles, the expanded interfacial area in the type-I SEN directly correlates with a reduced surface flow velocity (0.057 m/s compared with 0.116 m/s for the type-II SEN), validating the hypothesized linkage between upward vortex intensity and meniscus destabilization. However, the type-II SEN can also reduce the surface velocity by enlarging the inner diameter (Case D) to improve the stability of liquid level fluctuation, which is more specifically explained by the velocity distribution along the center line D of the free liquid surface under different cases in Figure 12, while the inherent design of the type-II SEN promotes stronger ascending vortices—elevating surface velocities and exacerbating level fluctuations—and the enlarged type-II SEN demonstrates 29% attenuation in peak surface velocity (0.116 m/s→0.082 m/s), effectively enhancing meniscus stability through momentum dissipation.

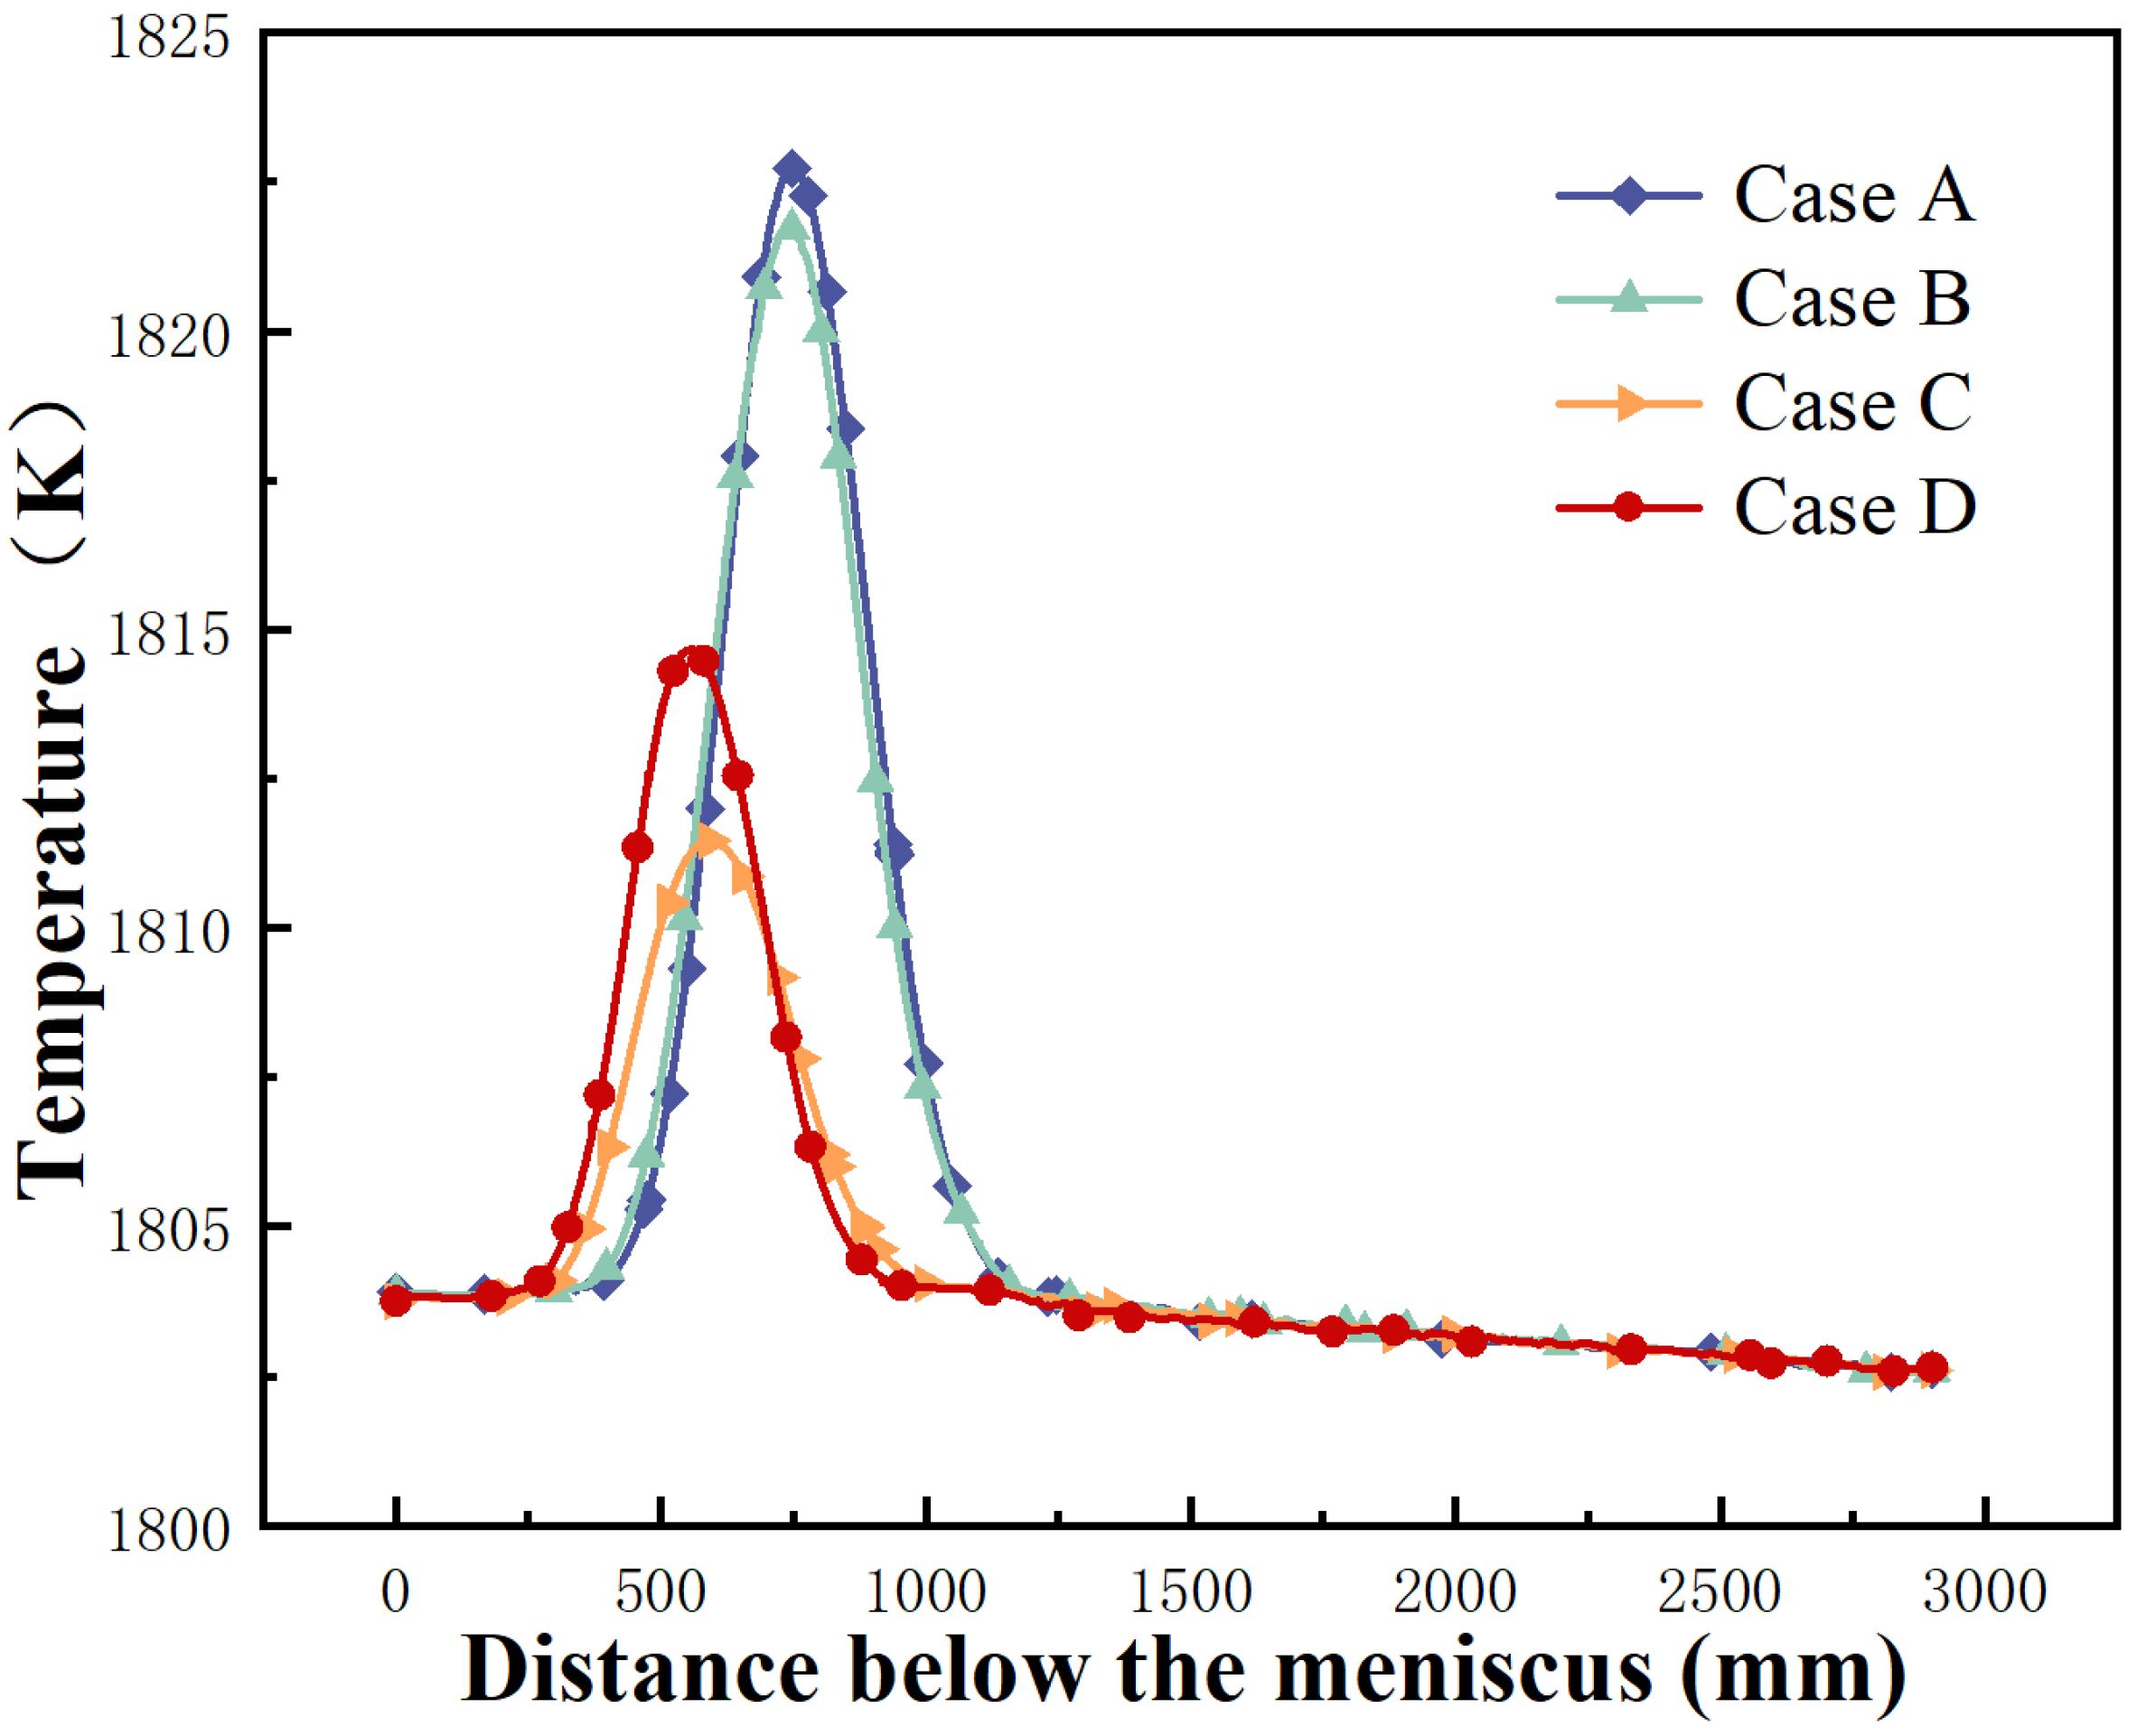
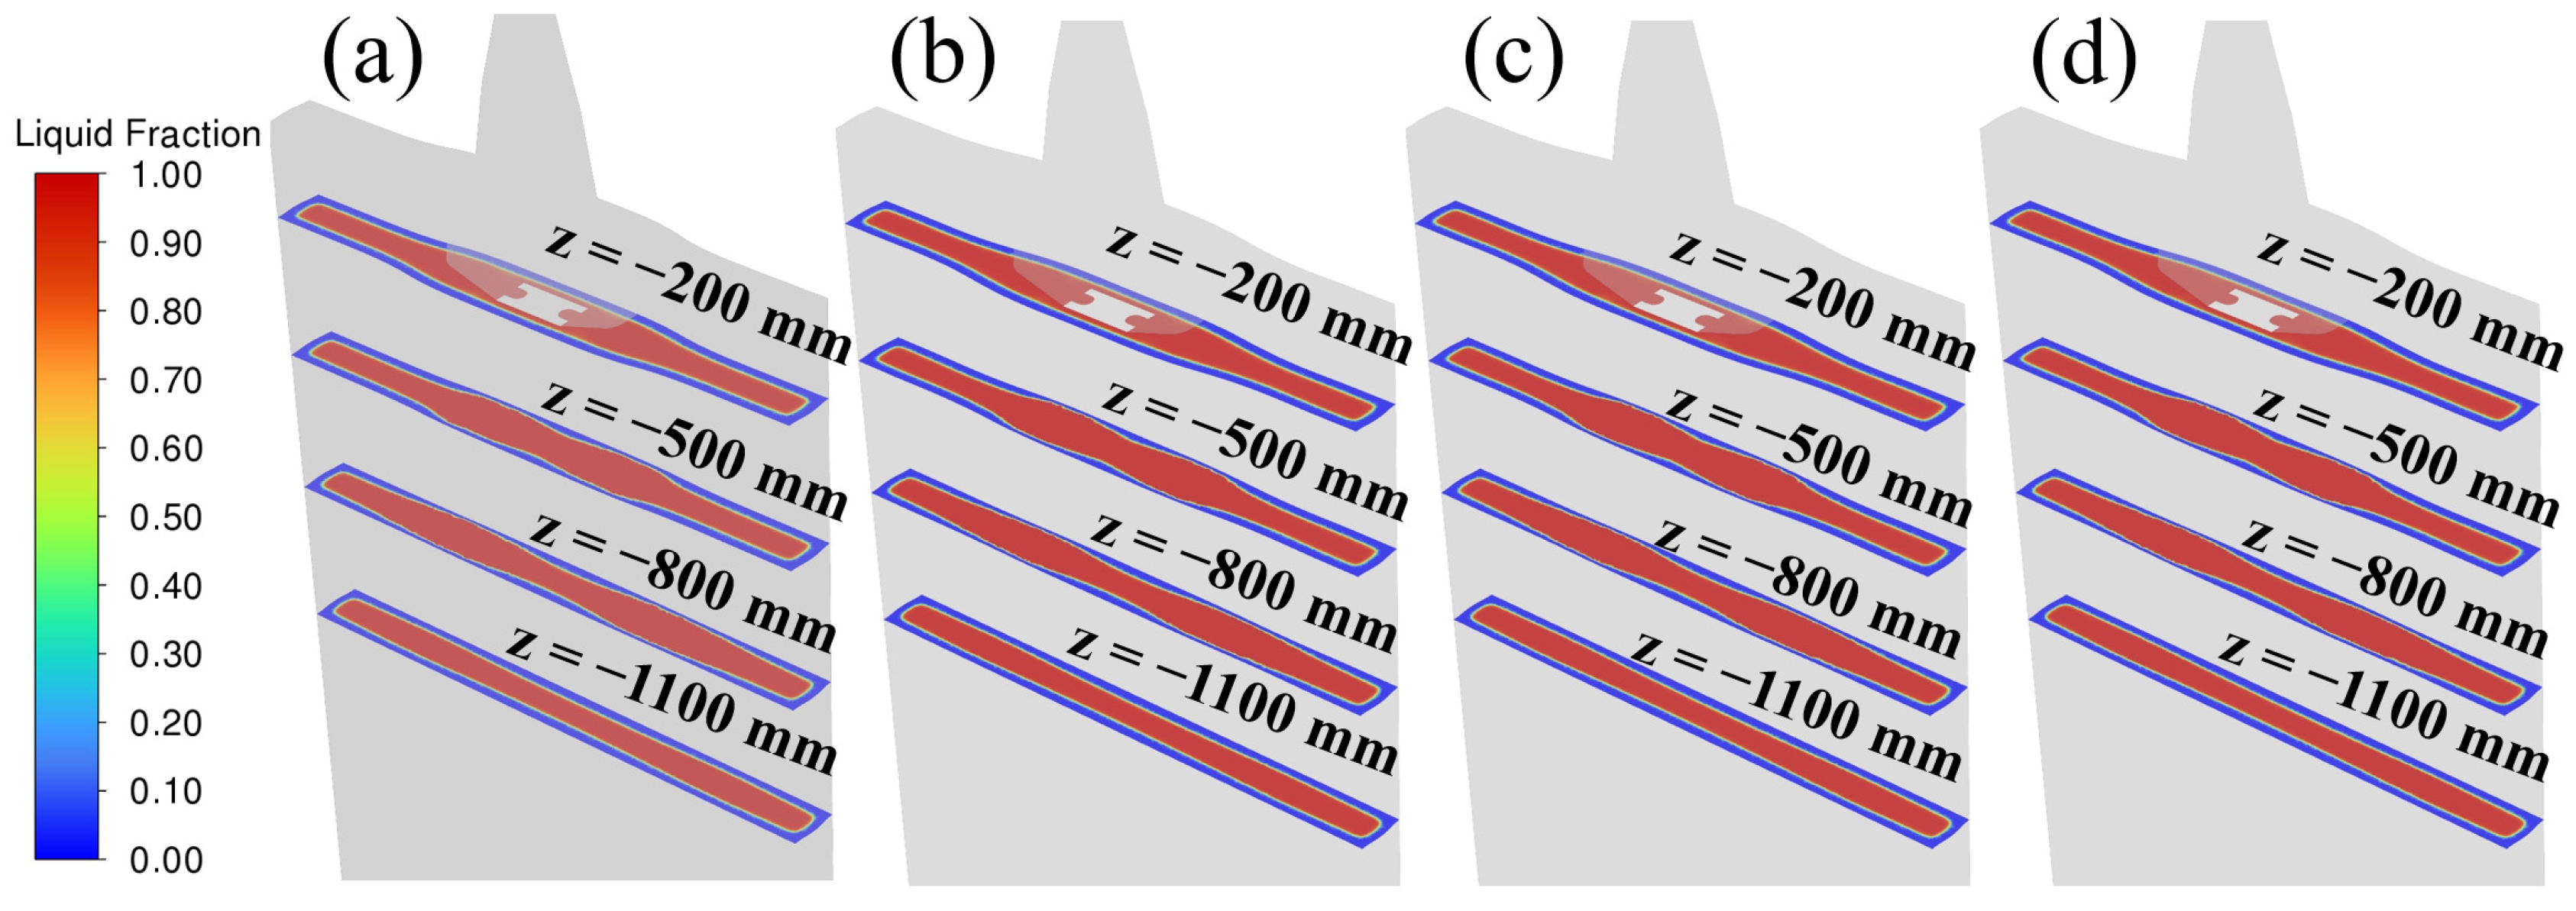
4.3. Heat Transfer and Solidification

Figure 13 delineates the temperature contour map across the mold wide face, with hot spots defined as localized zones of elevated temperature (about 1300 k or more) concentration. Excessive hot spot formation on the wide face correlates with reduced steel ductility and compromised shell integrity, as solidified shells undergo compressive stress at these loci during withdrawal. This mechanical mismatch may induce gap collapse between the shell and mold, predisposing the system to transverse cracks and breakout incidents [40,41]. Consequently, hot spot mitigation remains a critical operational priority. It can be seen from Figure 13 that compared with the type-I cavity mold, the hot spots on the wide surface of the type-II cavity mold are more concentrated and closer to the meniscus, while the type-II SEN further strengthens this phenomenon, indicating that the mold cavity and SEN have a synergistic effect on the transfer of hot spots. Compared with the type-II SEN, the surface hot spot area of the enlarged type-II SEN is also larger, which confirms the previous analysis that the increase in the high velocity area is due to the enlargement of the SEN’s inner diameter. The concentration and upward transfer of hot spots are far away from the maximum strain (x = ±270 mm) of the funnel-shaped mold. Avoiding the occurrence of hot spots at the maximum strain to reduce thermomechanical stress overlap is also a good way to solve the frequent cracking and steel leakage accidents, offering a dual optimization pathway for defect suppression.
Figure 14 presents the distribution of center temperatures along the negative z-axis at x = 270 mm. In general, the temperature change trends under different conditions are consistent, while the peak temperature of the type-II SEN is closer to the meniscus and the peak temperature of the type-I SEN is higher, exacerbating crack susceptibility due to thermal gradient-induced stress concentration. Compared with the type-I SEN, the center temperature peak of the type-II SEN dropped by 11 K, significantly mitigating the risks of thermo-mechanical failure and cracking. In contrast, compared with the type-I mold, the center temperature of the type-II mold has a slight decrease, which shows that the type-II mold and type-II SEN are both beneficial to preventing cracks and steel leakage.
Figure 15 shows the distribution of liquid fraction across four x–y planes (z = −200 mm, z = −500 mm, z = −800 mm and z = −1100 mm) positioned at varying distances below the meniscus. The liquid fractions on the two middle planes (z = −500 mm, z = −800 mm) indicate that the solidified shell in this area is uneven, and the local shell is thin, which is due to the influence of the mainstream of the molten steel. It confirms that the molten steel carrying higher kinetic energy and higher heat reduces the thickness of the solidified shell and disrupts equilibrium solidification, leading to shell integrity degradation and increasing the risk of cracks and steel leakage. The solution is to use the type-II mold and type-II SEN to reduce the flow rate at the maximum strain, reduce and transfer hot spots, and reduce the center temperature of x = ±270 mm.
Figure 16 is a distribution diagram of the liquid phase at the outlet of the mold. It can be seen from the comparison that the thickness and uniformity of the outlet solidified shell of the four cases are different. The change results of the solidified shell thickness measured along the x-axis direction are shown in Figure 17. Comparative analysis of solidified shell characteristics at the mold exit reveals critical geometric and flow-field dependencies: From the perspective of the thickness of the solidified shell at the outlet of the mold, compared with the type-I cavity mold, the shell thickness of the type-II cavity mold increased and uniformity was also improved, indicating that the mold cavity affects the solidification behavior of the molten steel in the mold. However, the marked enhancement in solidified shell thickness and uniformity at the mold exit achieved through type-II SEN implementation stems from synergistic velocity–temperature regulation at critical positions, thereby establishing metallurgically optimized conditions for subsequent rolling operations.

5. Conclusions

In this study, a numerical model of the flow, heat transfer and solidification of molten steel in a funnel-type mold of ESP was established by a numerical simulation method. The effects of the mold cavity and SEN structure on the flow stability and uniformity of the solidified shell were studied (the main temperature range of the study is 900 K–1831 K). The impact of the indicators can lead to the following conclusions:
(1)
The influence of the geometric disturbance of the top cavity on the flow state of the middle and lower body is localized. The type-II cavity curve optimized hot spot distribution on the wide surface of the mold and the thickness of the solidified shell at the mold outlet is increased.
(2)
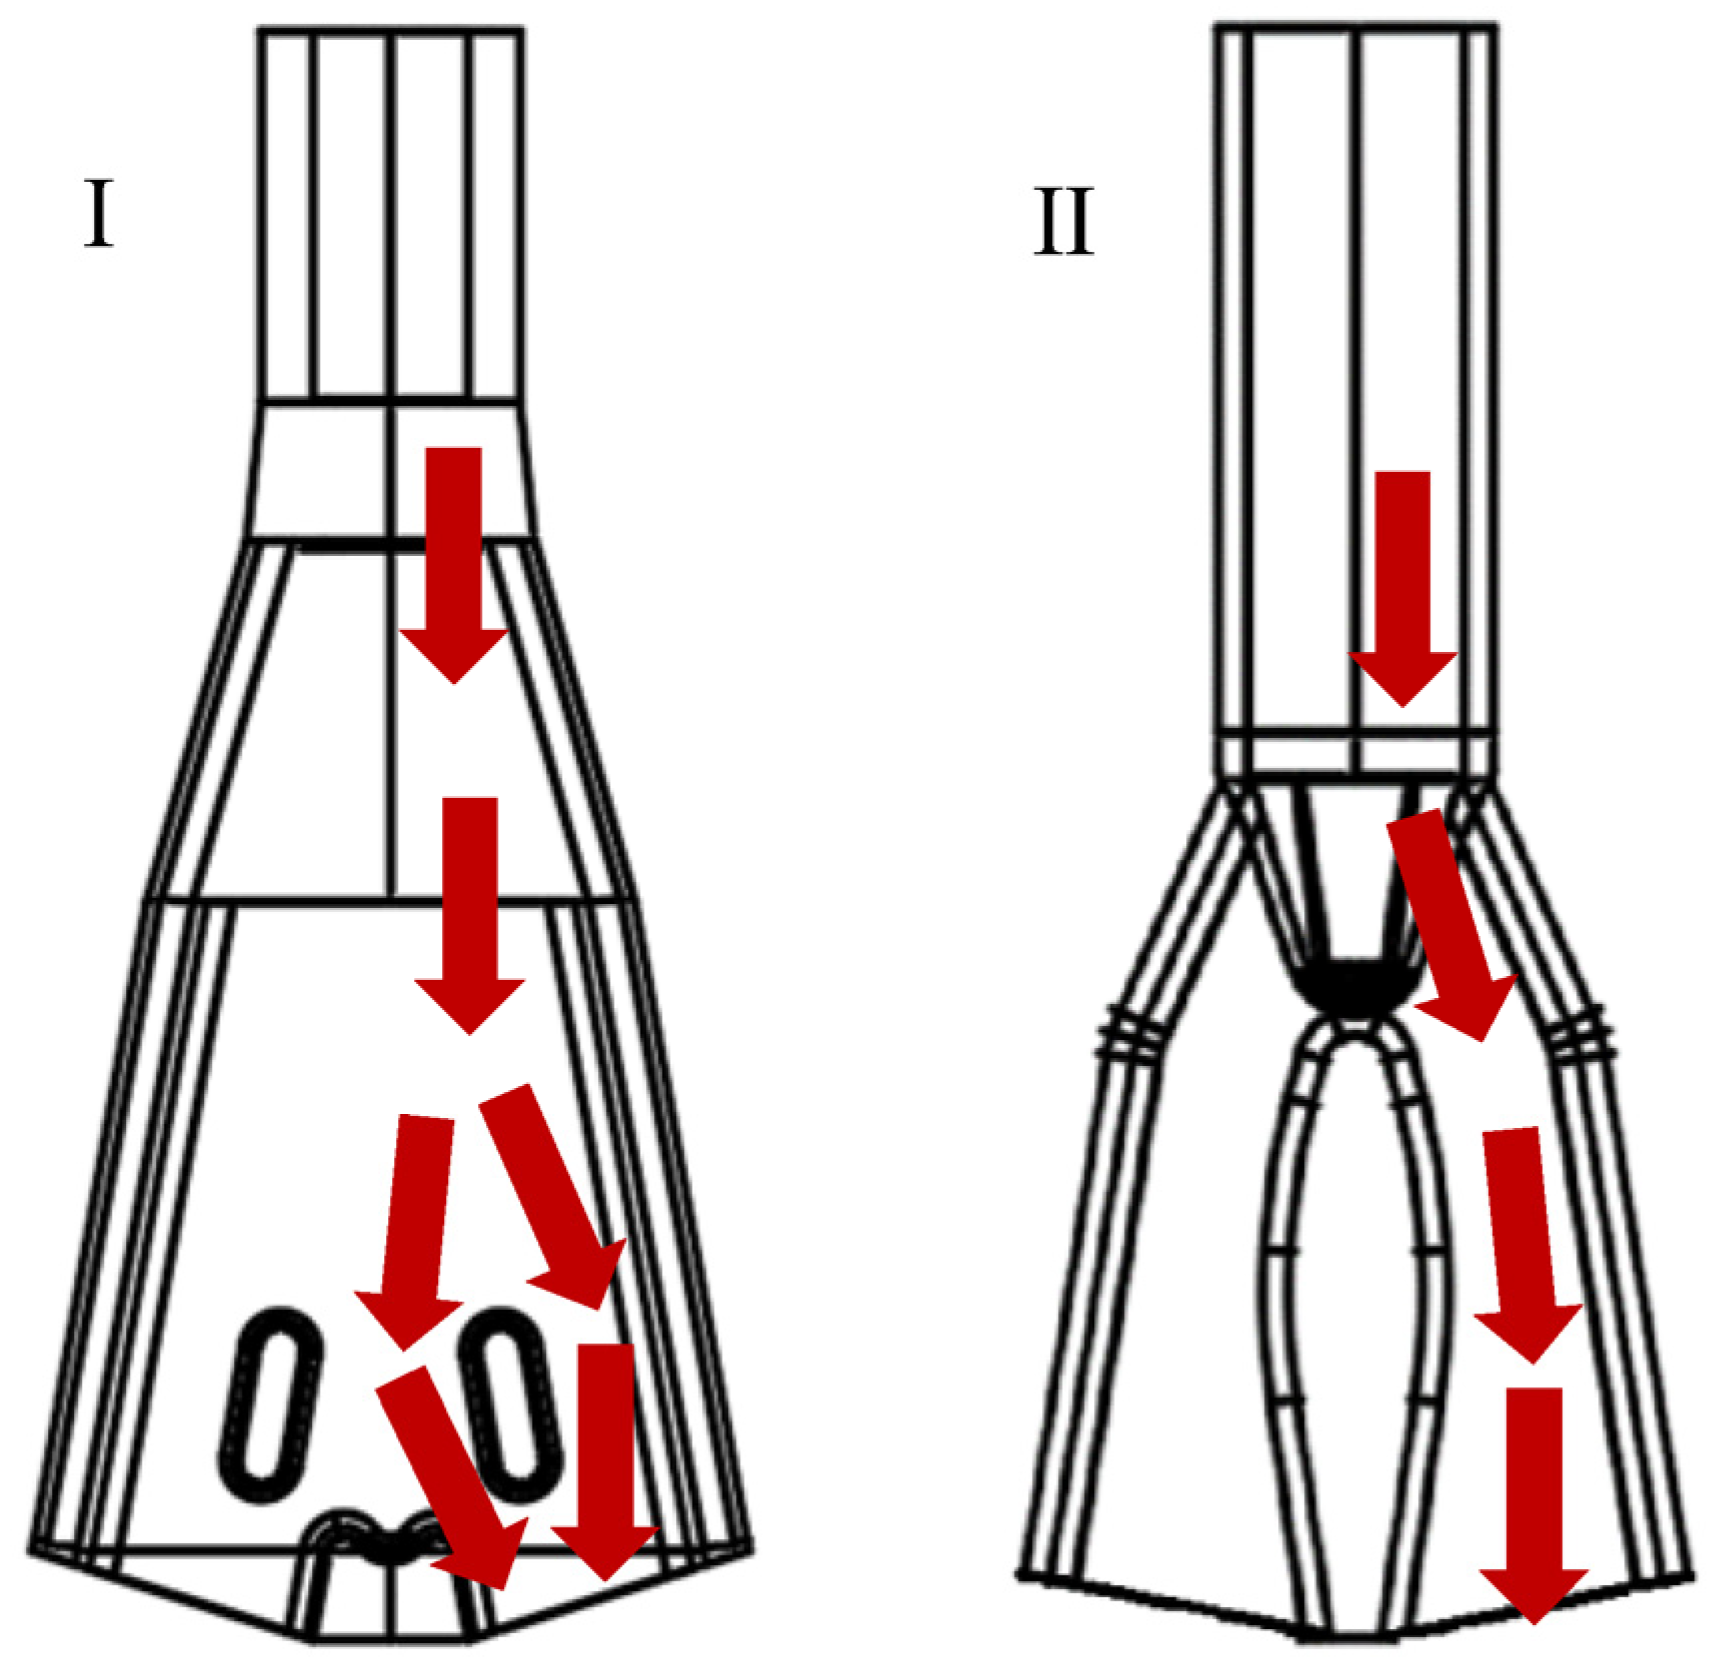
The structure of the SEN significantly affects the flow of molten steel. The flow field inside the type-II SEN is relatively stable, but the vortex formed by the impact of the narrow surface makes the surface flow velocity larger and the liquid surface fluctuates more, which can be improved by enlarging the inner diameter of the SEN. Furthermore, the hot spots on the wide surface of the mold are transferred and the uniformity of the solidified shell is significantly improved.

Author Contributions

Data curation, R.W.; Formal analysis, Z.L. and H.C.; Funding acquisition, Z.L. and H.C.; Investigation, Z.L. and H.C.; Methodology, Y.L. and R.W.; Project administration, Z.L. and H.C.; Resources, Z.L. and H.C.; Software, Z.L., R.W. and G.L.; Supervision, Z.L.; Validation, R.W.; Visualization, G.L.; Writing—original draft, Y.L.; Writing—review and editing, Z.L., Y.L. and H.C. All authors have read and agreed to the published version of the manuscript.

Funding

This research received no external funding.

Data Availability Statement

The original contributions presented in the study are included in the article; further inquiries can be directed to the corresponding author.

Acknowledgments

The authors would like to acknowledge Tangshan Donghua Iron and Steel Enterprise Group Co., Ltd. and University of Science and Technology Beijing for providing the necessary facilities and a conducive research environment that made this study possible.

Conflicts of Interest

Author Zhaoyang Li was employed by the company Steel Rolling Mill, Tangshan Donghua Iron and Steel Enterprise Group Co., Ltd. The remaining authors declare that the research was conducted in the absence of any commercial or financial relationships that could be construed as a potential conflict of interest.

References

  1. Yu, H.; Kang, Y.L.; Zhao, Z.Z.; Sun, H. Morphology and Precipitation Kinetics of MnS in Low-Carbon Steel During Thin Slab Continuous Casting Process. J. Iron Steel Res. Int. 2006, 13, 30–36. [Google Scholar] [CrossRef]
  2. Park, J.K.; Samarasekera, I.V.; Thomas, B.G.; Yoon, U.S. Thermal and Mechanical Behavior of Copper Molds During Thin-Slab Casting (II): Mold Crack Formation. Metall. Mater. Trans. B 2002, 33, 437–449. [Google Scholar] [CrossRef]
  3. Cui, H.N.; Sun, J.K.; Zhang, J.S.; Ji, C.X.; Wang, G.L.; Liu, Q. Large Eddy Simulation of Novel EMBr Effect on Flow Pattern in Thin Slab Casting Mold with Multi-Rort SEN and Tltra-High Casting Speed. J. Manuf. Process. 2025, 133, 448–465. [Google Scholar] [CrossRef]
  4. Liu, H.P.; Yang, C.Z.; Zhang, H.; Zhai, Q.J.; Gan, Y. Numerical Simulation of Fluid Flow and Thermal Characteristics of Thin Slab in the Funnel-Type Molds of Two Casters. ISIJ Int. 2011, 51, 392–401. [Google Scholar] [CrossRef]
  5. Yin, R.Y.; Zhang, H. Progress and Development Direction on Thin Slab Continuous Casting and Rolling Technology under New Situation. Ironmak. Steelmak. 2011, 46, 1–9. [Google Scholar]
  6. Xu, S.; Li, S.H.; Wang, S.Z.; Gao, J.H.; Cao, R.; Feng, Q.X.; Li, H.L.; Mao, X.P. Research Status and Prospect of Direct Strip Casting Manufactured Low-Carbon Microalloyed Steel. J. Iron Steel Res.Int. 2022, 29, 17–33. [Google Scholar] [CrossRef]
  7. Wang, S.Z.; Gao, J.H.; Wu, G.L.; Mao, X.P. Thin Slab Casting and Direct Rolling Technology: Current Status and Prospects. Chin. J. Eng. 2022, 44, 534–545. [Google Scholar]
  8. Yang, J.; Chen, D.F.; Long, M.J.; Duan, H.M. Transient Flow and Mold Flux Behavior During Ultra-High Speed Continuous Casting of Billet. J. Mater. Res. Technol. 2020, 9, 3984–3993. [Google Scholar] [CrossRef]
  9. Yu, S.; Long, M.J.; Zhang, M.Y.; Chen, D.F.; Xu, P.; Duan, H.M.; Yang, J. Effect of Mold Corner Structures on the Fluid Flow, Heat Transfer and Inclusion Motion in Slab Continuous Casting Molds. J. Manuf. Process. 2021, 68, 1784–1802. [Google Scholar] [CrossRef]
  10. Vakhrushev, A.; Wu, M.; Ludwig, A.; Tang, Y.; Hackl, G.; Nitzl, G. Numerical Investigation of Shell Formation in Thin Slab Casting of Funnel-Type Mold. Metall. Mater. Trans. B 2014, 45, 1024–1037. [Google Scholar] [CrossRef]
  11. Wang, C.J.; Liu, Z.Q.; Li, B.K. Combined Effects of EMBr and SEMS on Melt Flow and Solidification in a Thin Slab Continuous Caster. Metals 2021, 11, 948. [Google Scholar] [CrossRef]
  12. Xuan, M.T.; Chen, M. Optimal Design of the Submerged Entry Nozzle for Thin Slab Continuous Casting Molds. Metals 2021, 11, 1223. [Google Scholar] [CrossRef]
  13. Camporredondo, S.J.E.; Castillejos, E.A.H.; Acosta, G.F.A.; Gutiérrez, M.E.P.; Herrera, G.M.A. Analysis of Thin-Slab Casting by the Compact-Strip Process: Part I. Heat Extraction and Solidification. Metall. Mater. Trans. B 2004, 35, 541–560. [Google Scholar] [CrossRef]
  14. Pfeiler, C.; Thomas, B.G.; Wu, M.; Ludwig, A.; Kharicha, A. Solidification and Particle Entrapment During Continuous Casting of Steel. Steel Res. Int. 2008, 79, 599–607. [Google Scholar] [CrossRef]
  15. Morales, R.D.; Tang, Y.; Nitzl, G.; EglsÄEer, C.; Hackl, G. Design of a Submerged Entry Nozzle for Thin Slab Molds Operating at High Casting Speeds. ISIJ Int. 2012, 52, 1607–1615. [Google Scholar] [CrossRef]
  16. Yuan, Z.P.; Zhu, L.G.; Wang, X.J.; Zhang, K.X. Analysis of Longitudinal Cracking and Mold Flux Optimization in High-Speed Continuous Casting of Hyper-Peritectic Steel Thin Slabs. Metals 2024, 14, 909. [Google Scholar] [CrossRef]
  17. Chiwo, F.S.; Susunaga-Notario, A.D.C.; Betancourt-Cantera, J.A.; Pérez-Bustamante, R.; Mercado-Lemus, V.H.; Méndez-Lozoya, J.; Barrera-Cardiel, G.; García-Herrera, J.E.; Arcos-Gutiérrez, H.; Garduño, I.E. Design and Optimization of the Internal Geometry of a Nozzle for a Thin-Slab Continuous Casting Mold. Designs 2024, 8, 2. [Google Scholar] [CrossRef]
  18. Meng, X.N.; Zhu, M.Y. Thermal Behavior of Hot Copper Plates for Slab Continuous Casting Mold with High Casting Speed. ISIJ Int. 2009, 49, 1356–1361. [Google Scholar] [CrossRef]
  19. Ding, Z.J.; Xue, Y.K.; Zhang, L.M.; Li, C.X.; Wang, S.H.; Ni, G.L. Study on Mushy Zone Coefficient in Solidification Heat Transfer Mathematical Model of Thin Slab with High Casting Speed. Processes 2023, 11, 3108. [Google Scholar] [CrossRef]
  20. Liu, Z.X.; Yang, Y.S.; Xiao, P.C.; Zhu, L.G.; Zhang, L.P. Analysis of Uneven Wear Mechanism of Narrow-Face Copper Wall of Funnel Mold. Metals 2023, 13, 666. [Google Scholar] [CrossRef]
  21. Chen, J.; Qi, H.J.; Di, J.Y. Research on the Design of Funnel-Shaped Part of Thin Slab Continuous Casting Mold. Iron Steel 1993, 1, 22–25. [Google Scholar]
  22. Jin, X.; Ren, T.; Guan, J. Design of Cavity Shape for a New Thin Slab Continuous Casting Mold. J. Mech. Eng. 2009, 45, 271–276. [Google Scholar] [CrossRef]
  23. Liu, L.W.; Zhang, H.; Gan, Y.; Zheng, X.R.; Liu, A.Q. Analysis of Metal Deformation in Funnel-Shaped Mould. Contin. Cast. 2001, 4, 12. [Google Scholar]
  24. Zhang, L.L.; Chen, D.F.; Long, M.J.; Chen, H.B.; Huang, Y.W.; Dong, Z.H. Study on the Fluid Flow in a Semi-Open-Stream-Poured Beam Blank Continuous Casting Mold with Submerged Refractory Funnels by Multiphase Modeling. Metals 2016, 6, 104. [Google Scholar] [CrossRef]
  25. Zhang, L.M.; Zhu, L.G.; Zhang, C.J.; Xiao, P.C.; Wang, X.J. Influence of Submerged Entry Nozzle on Funnel Mold Surface Velocity. High Temp. Mater. Process. 2023, 42, 247. [Google Scholar] [CrossRef]
  26. Jeon, Y.J.; Sung, H.J.; Lee, S. Flow Oscillations and Meniscus Fluctuations in a Funnel-Type Water Mold Model. Metall. Mater. Trans. B 2010, 41, 121–130. [Google Scholar] [CrossRef]
  27. Torres-Alonso, E.; Morales, R.D.; Garcia-Hernandez, S.; Palafox-Ramos, J. Cyclic Turbulent Instabilities in a Thin Slab Mold. Part I: Physical Model. Metall. Mater. Trans. B 2010, 41, 583–597. [Google Scholar] [CrossRef]
  28. Torres-Alonso, E.; Morales, R.; Garcia Hernandez, S. Cyclic Turbulent Instabilities in a Thin Slab Mold. Part II: Mathematical Model. Metall. Mater. Trans. B 2010, 41, 675–690. [Google Scholar] [CrossRef]
  29. Shen, H.F.; Shen, B.Z.; Liu, B.C. Water Modeling of the Fluid Flow Instability in Continuous Thin Slab Casting Mould. Steel Res. Int. 2007, 78, 531–535. [Google Scholar] [CrossRef]
  30. Arcos-Gutierrez, H.; Barrera-Cardiel, G.; Barreto, J.D.J.; Garcia-Hernandez, S. Numerical Study of Internal SEN Design Effects on Jet Oscillations in a Funnel Thin Slab Caster. ISIJ Int. 2014, 54, 1304–1313. [Google Scholar] [CrossRef]
  31. Thomas, B.G.; Huang, X.; Sussman, R.C. Simulation of Argon Gas Flow Effects in a Continuous Slab Caster. Metall. Mater. Trans. B 1994, 25, 527–547. [Google Scholar] [CrossRef]
  32. Singh, V.; Das, S.K. Thermo-Fluid Mathematical Modeling of Steel Slab Caster: Progress in 21st Century. ISIJ Int. 2016, 56, 1509–1518. [Google Scholar] [CrossRef]
  33. Schneider, M.C.; Gu, J.P.; Beckermann, C.; Boettinger, W.J.; Kattner, U.R. Modeling of Micro- and Macrosegregation and Freckle Formation in Single-Crystal Nickel-Base Superalloy Directional Solidification. Metall. Mater. Trans. A. 1997, 28, 1517–1531. [Google Scholar] [CrossRef]
  34. Fukada, N.; Marukawa, Y.; Abe, K.; Ando, T. Development of Mold (HS-Mold) for High Speed Casting. Can. Metall. Q. 1999, 38, 337–346. [Google Scholar] [CrossRef]
  35. Cui, H.N.; Li, T.; Bai, C.G.; Tan, M.; Zhu, Y.L. Numerical Simulation of Coupling Multi-Physical Field in Electrical Arc Furnace for Smelting Titanium Slag. J. Iron Steel Res. Int. 2023, 30, 2194–2209. [Google Scholar] [CrossRef]
  36. Cui, H.N.; Bai, C.G.; Jiang, Z.X.; Tan, M.; Gao, X.D.; Zhu, Y.L. Numerical Simulation of the Interaction Between Arc Plasma and Molten Slag in Electric Arc Furnace for High-Titania Slag Smelting. Metall. Mater. Trans. B 2023, 54, 1687–1704. [Google Scholar] [CrossRef]
  37. Yao, C.; Wang, M.; Zhang, M.; Xing, L.D.; Zhang, H.B.; Bao, Y.P. Effects of Mold Electromagnetic Stirring on Heat Transfer, Species Transfer and Solidification Characteristics of Continuous Casting Round Billet. J. Mater. Res. Technol. 2022, 19, 1766–1776. [Google Scholar] [CrossRef]
  38. Petrus, B.; Zheng, K.; Zhou, X.; Thomas, B.G.; Bentsman, J. Real-time, model-based spray-cooling control system for steel continuous casting. Metall. Mater. Trans. B 2011, 42, 87–103. [Google Scholar] [CrossRef]
  39. Pinheiro, C.A.M.; Samarasekera, I.V.; Brimacomb, J.K.; Walker, B.N. Mould Heat Transfer and Continuously Cast Billet Quality with Mould Flux Lubrication Part 1 Mould Heat Transfer. Ironmak. Steelmak. 2000, 27, 37–54. [Google Scholar] [CrossRef]
  40. Grill, A.; Sorimachi, K.; Brimacombe, J.K. Heat Flow, Gap Formation and Break-Outs in the Continuous Casting of Steel Slabs. Metall. Mater. Trans. B 1976, 7, 177–189. [Google Scholar] [CrossRef]
  41. Zhang, S.D.; Wang, Q.Q.; He, S.P.; Wang, Q. Study of the Mechanism of Liquid Slag Infiltration for Lubrication in Slab Continuous Casting. Metall. Mater. Trans. B 2018, 49, 2038–2049. [Google Scholar] [CrossRef]
Figure 1. Schematic diagram of the physical model and submerged entry nozzle.
Metals 15 00183 g001
Figure 2. Grids and sizes of the computational domains and boundary conditions adopted in the simulation.
Metals 15 00183 g002
Figure 3. Details about EMBr: (a) the method for measuring EMBr; (b) distribution of magnetic induction intensity on the mold; (c) the actually measured values and setting values of magnetic induction intensity under different excitation currents.
Metals 15 00183 g003
Figure 4. Details of cavity curve of top surface of mold, where the red line is cavity curve Ⅰ and the blue line is cavity curve II: (a) top view of mold; (b) comparison of cavity curves.
Metals 15 00183 g004
Figure 5. Two different structures of SEN: () Two-hole islanded mold. (II) Two-hole islandless mold. The red arrows represent the flow of molten steel.
Metals 15 00183 g005
Figure 6. Two-model verification: (a) comparison of the results of numerical simulation and physical simulation; (b) comparison of field measuring results and numerical simulation results at different points.
Metals 15 00183 g006
Figure 7. The comparison of velocity at the mid-plane of the wide face in the mold: (a) Case A (mold I and SEN I); (b) Case B (mold II and SEN I); (c) Case C (mold II and SEN II); (d) Case D (mold II and enlarged SEN II).
Metals 15 00183 g007
Figure 8. Velocity distribution of (a) Line A (z = −170 mm) and (b) Line B (z = −500 mm).
Metals 15 00183 g008
Figure 9. Isosurfaces of the Q-criterion (1 s−2): (a) Case A (mold I and SEN I); (b) Case B (mold II and SEN I); (c) Case C (mold II and SEN II); (d) Case D (mold II and enlarged SEN II).
Metals 15 00183 g009
Figure 10. Velocity distribution on the x = 270 mm plane: (a) Case A (mold I and SEN I); (b) Case B (mold II and SEN I); (c) Case C (mold II and SEN II); (d) Case D (mold II and enlarged SEN II); and (e) velocity distribution on Line C.
Metals 15 00183 g010
Figure 11. Velocity distribution of top surface: (a) Case A (mold I and SEN I); (b) Case B (mold II and SEN I); (c) Case C (mold II and SEN II); (d) Case D (mold II and enlarged SEN II).
Metals 15 00183 g011
Figure 12. Velocity distribution at Line D (y = 0).
Metals 15 00183 g012
Figure 13. Temperature distribution at the mid-plane of the wide face of (a) Case A (mold I and SEN I); (b) Case B (mold II and SEN I); (c) Case C (mold II and SEN II); (d) Case D (mold II and enlarged SEN II).
Metals 15 00183 g013
Figure 14. Temperature distribution along the negative direction of the z-axis under different conditions at x = −270 mm.
Metals 15 00183 g014
Figure 15. The cloud map of liquid phase ratios: (a) Case A (mold I and SEN I); (b) Case B (mold II and SEN I); (c) Case C (mold II and SEN II); (d) Case D (mold II and enlarged SEN II).
Metals 15 00183 g015
Figure 16. The cloud map of liquid phase ratios at the outlet of the mold: (a) Case A (mold I and SEN I); (b) Case B (mold II and SEN I); (c) Case C (mold II and SEN II); (d) Case D (mold II and enlarged SEN II).
Metals 15 00183 g016
Figure 17. Shell thickness at the mold outlet along the x-axis under different conditions.
Metals 15 00183 g017
Table 1. Geometry dimensions.
ParameterUnitsValue
Thickness of moldmm110
Width of moldmm1210
Height of moldmm1100
Height of computational domainmm2900
Gravitym/s29.8
Table 2. Physical properties and process parameters in the simulation.
ParameterUnitsValue
SEN immersion depthmm170
Casting speedm/min5
Steel densitykg⋅m−37020
Steel viscosityPa⋅s0.0062
Magnetic permeabilityH·m−14π × 10−7
Steel electric conductivitym/s29.8
Specific HeatJ/(kg K)750
Solidus TemperatureK1760
Liquidus TemperatureK1803
Table 3. Boundary conditions for the numerical simulation.
BoundaryBoundary ConditionValue
Outlet of computational domainOutflow
——
——
Inlet of moldVelocity inlet
Temperature of inlet
1.067/0.836 m/s
1831 K
Wall of SENNo-slip wall
heat flux
0 W/m2
Wide FacesNo-slip wall
heat flux
Equations (21)
Narrow FacesNo-slip wall
heat flux
Free SurfaceSpecified shear
heat flux
Shear = 0 Pa
−15 W/m2
Table 4. Key parameters for calculating the heat flux profile on wide and narrow faces.
ParameterValue
Wide Faces
MoldFlow Rate4187 L/min
(Cooling Water)Temperature Increase12.5 K
Narrow Faces
MoldFlow Rate306 L/min
(Cooling Water)Temperature Increase14.4 K
Table 5. Scheme of the numerical simulation.
CaseCavity Curve of MoldType of SEN
Case AII
Case BIII
Case CIIII
Case DIIII (enlarged to 1.13 times)
Disclaimer/Publisher’s Note: The statements, opinions and data contained in all publications are solely those of the individual author(s) and contributor(s) and not of MDPI and/or the editor(s). MDPI and/or the editor(s) disclaim responsibility for any injury to people or property resulting from any ideas, methods, instructions or products referred to in the content.

