Article

Alkali Fusion–Leaching Process for Non-Standard Copper Anode Slime (CAS)

1
Innovative Center of the Faculty of Chemistry in Belgrade Ltd., University of Belgrade, Studentski trg 12-16, 11000 Belgrade, Serbia
2
Innovation Center of the Faculty of Technology and Metallurgy in Belgrade Ltd., University of Belgrade, Karnegijeva 4, 11000 Belgrade, Serbia
3
Institute for Nuclear and Other Mineral Raw Materials Technology, Franše d’Eperea 86, 11000 Belgrade, Serbia
4
Faculty of Technology and Metallurgy, University of Belgrade, Karnegijeva 4, 11000 Belgrade, Serbia
*
Author to whom correspondence should be addressed.
Metals 2025, 15(12), 1308; https://doi.org/10.3390/met15121308
Submission received: 24 October 2025 / Revised: 21 November 2025 / Accepted: 26 November 2025 / Published: 27 November 2025
(This article belongs to the Special Issue Hydrometallurgical Processes for the Recovery of Critical Metals)

Abstract

Copper anode slime (CAS), obtained from non-standard anodes by pyro-hydrometallurgical electronic waste (e-waste) processing, contains high concentrations of lead, tin (as metastannic acid), and base (Cu, Fe, Zn), precious (Au, Ag), and technological metals (In, Ga, Ge), which limit the efficiency of conventional valorization methods. In this study, an integrated alkali fusion–leaching process was applied to non-standard CAS. Thermodynamic modeling defined the key parameters for selective phase transformations and efficient metal separation. These parameters were experimentally investigated, and the optimized fusion conditions (CAS:NaOH = 40:60, 600 °C, 60 min), followed by water leaching (200 g/dm3, 80 °C, 60 min, 250 rpm), resulted in >97% Sn removal efficiency. Simultaneously, Au and Ag losses were negligible, resulting in solid residue enrichment. Oxidant addition (NaNO3) did not improve Sn removal but increased Fe, Pb, and Ag solubility, reducing selectivity. The scaled-up test confirmed process reproducibility, achieving 97.75% Sn dissolution and retention of precious metals in the PbO-based residue (99.99% Au, 99.78% Ag). Application of an integrated thermodynamic modeling, laboratory optimization, and scaled-up validation approach to non-standard CAS provides a relevant framework for a selective, efficient, and scalable method addressing industrial needs driven by increased e-waste co-processing, contributing to sustainable metal recovery.

Graphical Abstract

1. Introduction

The growing demand for base, precious, and technological metals necessitates the exploration of alternative sources in addition to conventional primary exploitation. These alternative sources, although commonly considered as waste, possess compositions rich in metals that make them valuable secondary raw materials. In addition to serving as a source of essential and economically significant metals, this approach is consistent with the principles of cleaner production, environmental protection, and the objectives of a circular economy [1,2].
In the field of primary metallurgy, numerous studies have been devoted to the optimization of leaching and extraction processes to enhance metal recovery efficiencies and reduce environmental impact [3,4]. Careful control of process parameters is essential to achieve high metal yields, and the same principle applies to the valorization of secondary materials.
One of the valuable secondary sources is anode slime, a by-product generated during the electro-hydrometallurgical refining stage of copper production (copper anode slime—CAS). Given that global copper production in 2024 reached approximately 23 million tons, of which nearly 80% was produced via pyrometallurgical routes, the associated generation of CAS is estimated at approximately 2–20 kg per ton of refined Cu [5,6]. More than 70% of its total composition consists of base metals such as Cu, Ni, Sb, Sn, and Pb [7,8,9]. Although it also contains hazardous elements such as As and Cd, which classify CAS as hazardous waste, its significant content of precious and platinum group metals makes it an attractive material for further processing and valorization [10,11,12]. Considering that global copper demand continues to outpace supply and that only about 20% of total copper production originates from secondary sources, the need to enhance recycling and recovery efforts is becoming increasingly urgent [13].
The composition of CAS, particularly the ratios of metals it contains, is largely determined by the nature of the input material for copper refining, specifically whether and to what extent secondary raw materials such as electronic waste (e-waste) are introduced alongside primary copper ores. With the continuous increase in global e-waste generation, recognized as an important carrier of valuable metals, its integration into copper smelting has become significant. Although the proportion of e-waste varies considerably among refineries, major operators are gradually adopting mixed-feed smelting (co-processing), combining 60–40% copper concentrate with 40–60% e-waste, instead of the typical <20% of e-waste addition [14]. Thus, CAS generated from co-processing routes, referred to as non-standard anode slime, exhibits a far more heterogeneous, inherited, chemical composition compared to conventional CAS generated by refining of anodes made solely from copper concentrate. These non-standard CAS materials generally contain elevated levels of lead and tin (predominantly as metastannic acid, H2SnO5 × 9H2O), along with increased fractions of precious and technological metals [15,16]. The comprehensive review of Moosavi-Khoonsari [5] provides an extensive summary of CAS compositions collected from over 100 smelters worldwide, presenting the characteristic features and processing approaches for this material; however, it does not clearly distinguish between standard and non-standard anode slimes. Although comprehensive studies addressing the composition and behavior of non-standard CAS remain scarce, their pronounced heterogeneity—both in elemental diversity and concentration—is evident, reflecting the inherited composition of input materials and the specific pyrometallurgical and electrorefining processes from which the CAS originates.
CAS valorization has been the subject of numerous studies, yet the optimal processing strategy is defined by its physicochemical characteristics [11,17]. Processing methods are generally categorized into traditional hybrid routes, integrating hydro-, pyro-, and electrometallurgical refining stages and purely hydrometallurgical approaches [10,18,19,20]. However, recovery of its metallic constituents remains a considerable challenge, primarily due to the strong chemical interactions among base metals (e.g., adhesion, encapsulation), which hinder efficient metal recovery [21,22,23]. A particular challenge arises from the complex phase composition of the CAS, characterized by stable and insoluble compounds such as metastannic acid [24]. This insoluble hydrated tin oxide forms under the anode refining process conditions and is especially prominent in non-standard copper anode slimes due to the increased tin input resulting from e-waste co-processing. These inert phases further complicate the already demanding treatment process [25,26].
To overcome these limitations, the alkali fusion–leaching approach was selected in this study as it enables the transformation of metastannic acid into soluble species, thus improving selectivity and overall recovery efficiency.
Alkali fusion has emerged as an effective method for the treatment of various metallurgical wastes and by-products, particularly in cases where traditional approaches are insufficient to meet the requirements of sustainable and environmentally responsible processing. This method is frequently applied to CAS to alter its phase composition, thereby facilitating subsequent processing, i.e., leaching [27,28]. Its primary applications include the removal of base metals, enrichment of CAS with precious metals by concentrating them, and the recovery of Pb and Sn. The core of the process involves the reaction of PbSO4 and SnO2 in alkaline medium, possibly with additives such as nitrates, at elevated temperatures, leading to the formation of soluble salts—plumbates and stannates [29,30]. Leaching procedures involve water, acid, or sulfide media, depending on the target metals [31]. A combination of NaOH fusion (1:1 CAS mass ratio; 700 °C, 2 h), water leaching, and synergistic acid leaching with H2SO4, H2O2, and tartaric acid has been shown to remove Pb, Sn, S, As, Cu, Ni, and Sb (76.39, 79.29, 87.72, 95.20, 99.68, 81.99, and 99.94%, respectively) while enriching the residue with precious metals [32]. A fusion system consisting of NaOH and Na2CO3 as the alkaline medium and NaNO3 as the oxidizing agent, in a mass ratio of 1:3:3 relative to the sample, was employed at 600 °C for 40 min to induce phase transformation of Sn, Pb, Al, and Zn with efficiencies of 84.5, 73.97, 95.22, and 78.87%, respectively. After leaching, Cu and precious metals remained concentrated in the residue and were further separated by selective acid leaching [33]. However, most studies have focused on standard CAS, but the efficiency of suggested processes on non-standard ones remain unknown.
Accordingly, the objective of this study is to optimize the alkali fusion–leaching process for non-standard CAS, characterized by elevated contents of lead, tin (present as metastannic acid), and precious metals. The research integrates thermodynamic modeling, experimental investigation, and scaled-up validation to establish the correlation between fusion parameters, type and dosage of additives, phase transformations, dissolution behavior, and leaching efficiency to achieve selective tin separation into leachate and enrichment of precious metals in the lead phase (solid residue), suitable for further valorization. By optimizing the process, this study can provide a framework for enhancing metal recovery efficiency from non-standard CAS, addressing industrial needs driven by increased e-waste co-processing, which aligns with the principles of cleaner production, environmental protection, and the objectives of a circular economy.

2. Materials and Methods

2.1. CAS Physico-Chemical Properties

A real sample of copper anode slime (CAS), generated during the electrorefining of non-standard copper anodes originating from sole e-waste pyro-electrometallurgical recycling, was obtained from a local supplier. The general methodology for the production of such non-standard anodes and the corresponding CAS has been described in detail elsewhere [25]. Its physico-chemical characterization included the determination of the particle size distribution (in accordance with [34]) and moisture content [35] and detailed chemical and phase composition analyses. The chemical composition was determined using a combination of Inductively Coupled Plasma–Optical Emission Spectroscopy (ICP–OES, Thermo Scientific iCAP 6000, Waltham, MA, USA, iTEVA data processing software, version 1.2.0.34.), X-ray fluorescence (XRF, Olympus Vanta C Series, Tokyo, Japan), and elemental composition (Vario EL III, Elementar, Hanau, Germany) analyses. Phase composition was analyzed by X-ray diffraction (XRD) using a Philips PW 1710 X-Pert Pro diffractometer (Malvern Panalytical, Eindhoven, The Netherlands), with CoKα radiation at 40 kV and 30 mA, within the angular range of 10° < 2θ < 120°, and with a step size of 0.017°. The instrumental accuracy of the applied methods was within certified ranges: ±2–3% for ICP–OES and XRF (major elements), ±0.1 wt.% for elemental (CHNS) analysis, and ±0.2° 2θ for XRD peak positions.
Prior to analysis and experiments, the bulk sample was homogenized, and a representative portion was obtained by quartering in accordance with [36]. It was determined that 95 wt.% of the sample had a particle size below 500 µm, with more than 40 wt.% below 125 µm, indicating a particle size distribution favorable for further experimental investigation. The moisture content was 9 wt.%, and this value was accounted for in the experimental setup. The chemical composition of the sample is presented in Table 1. The sample contained 23.65 wt.% Pb, 28.36 wt.% Sn, 6.86 wt.% Ag, and 0.86 wt.% Au. These values, particularly the high Pb and Sn contents, indicate a non-standard CAS composition. In addition, elements such Cu, Fe, Zn, Sb, and Cl were also detected in amounts below 1 wt.%, along with traces of technological metals. The tabulated composition includes the major elements and those relevant for further investigation, while trace and accompanying constituents are not presented.
The phase composition (Figure 1, Table 2) indicates a significant presence of lead, primarily in the form of sulfate (JCPDS/ICDD no. 36-1461) and oxide (JCPDS/ICDD no. 05-0561). Tin was identified as a hydrated oxide (JCPDS/ICDD no. 04-003-63991), corresponding to stable metastannic acid, which represents the dominant phase in the sample. Both the lead and tin concentrations and their corresponding phases reflect the inherited composition of the input feed and upstream processing conditions. Accompanying metals such as Cu, Ag, and Au were detected in the form of sulfates, sulfides, chlorides, or oxides. These characterization results provide the basis for the subsequent step: theoretical modeling of the alkali fusion–leaching system.

2.2. Modeling Methods

For the thermodynamic modeling of the non-standard CAS alkali fusion process, the HSC Chemistry software (v. 9.9.2.3) [37] was employed. The Reaction Equations module was used to determine the thermodynamic parameters (ΔHθ, ΔSθ, ΔGθ, and log K) of the main chemical reactions for the CAS–NaOH and CAS–NaOH–NaNO3 systems under various fusion temperatures (0–1000 °C). The Equilibrium Compositions module, based on the principle of Gibbs free energy (ΔGθ), was applied to calculate and evaluate the equilibrium states of the alkali fusion products. Possible uncertainties in thermodynamic constants may slightly shift the calculated equilibrium boundaries but do not affect the overall reaction trends or phase stability relationships discussed herein. All calculations were performed using input data corresponding to 100.00 kg of CAS at a pressure of 1.0 atm.
A theoretical analysis of the thermodynamic properties of selected leaching reactions was conducted to provide deeper insight into the complex reaction system, to define the optimal process parameters, and to design the experimental setup. Phase stability of the metals in the specified water leaching system was assessed using the Hydra/Medusa software (version 2010) [38]. This systematic modeling approach reduces the number of required experimental trials, resulting in savings in reagents, generated wastes, and time.

2.3. Experimental Process

The process was conducted in two stages. In the first step, CAS was fused with additives (NaOH, NaNO3, Fisher Chemical, p.a. grade) at a temperature defined by thermodynamic modeling to selectively transform insoluble Sn (metastannic acid) into water-soluble salts. In the second step, the resulting fusion products were subjected to hot water leaching, aiming to remove soluble species while simultaneously concentrating precious metals in the solid residue.
Alkali fusion: Optimization of the alkali fusion process was conducted in two test series, examining the influence of flux composition—the amount of alkali (NaOH, 20–70 wt.% stoichiometric excess relative to Pb and Sn) and oxidant (NaNO3, 2.5 to 20 wt.% relative to CAS). Each test was conducted with 30 g of CAS mixed with the specified additives and fused for 60 min in a 200 cm3 SiC crucible coated with an inert aluminized lining using a laboratory electric resistance furnace. Additionally, the influence of time was examined within the 30–120 min interval to determine the optimal fusion duration.
Leaching: The fusion products were subjected to leaching with distilled water in a 0.5 dm3 glass reactor equipped with a heating mantle, reflux condenser, stirrer, pH/temperature control system, and sample dosing system. The experiments were conducted under constant process parameters: 200 g/dm3 solid-to-liquid ratio (S/L), 250 rpm, 80 °C, and 60 min leaching time. After leaching, separation of the phases and residue drying were followed by mass balance and chemical analysis.
Scaled-up test: Based on the optimized laboratory-scale results, a scaled-up experiment was conducted using 1 kg of the non-standard CAS sample. Fusion was performed in an electric resistance furnace using a chemically resistant steel crucible. The resulting fusion product was subsequently subjected to water leaching in a glass reactor equipped with a mechanical stirrer, temperature control, and a reflux condenser connected to an off-gas washing system. Prior to fusion, the charge was dry-homogenized to ensure uniform distribution of components. Also, to minimize potential losses of metals into the liquid phase through suspended particles, two-step phase separation was applied after leaching. This included vacuum filtration and washing of the solid residue using a cellulose filter cloth (Grade 4, pore size 20–25 μm), coagulation of suspended particles in the filtrate and wash solution with 0.1 vol.% of CIBA Magnafloc of a wide pH range, concentration 2 g/dm3, followed by a second filtration (cellulose filter cloth, Grade 4, pore size 4–6 μm). The solid residue and recovered suspended particles were dried at 105 °C for 24 h (to constant mass) prior to weighing and analysis. The objective of the scaled-up test was to validate the process parameters under semi-industrial conditions.
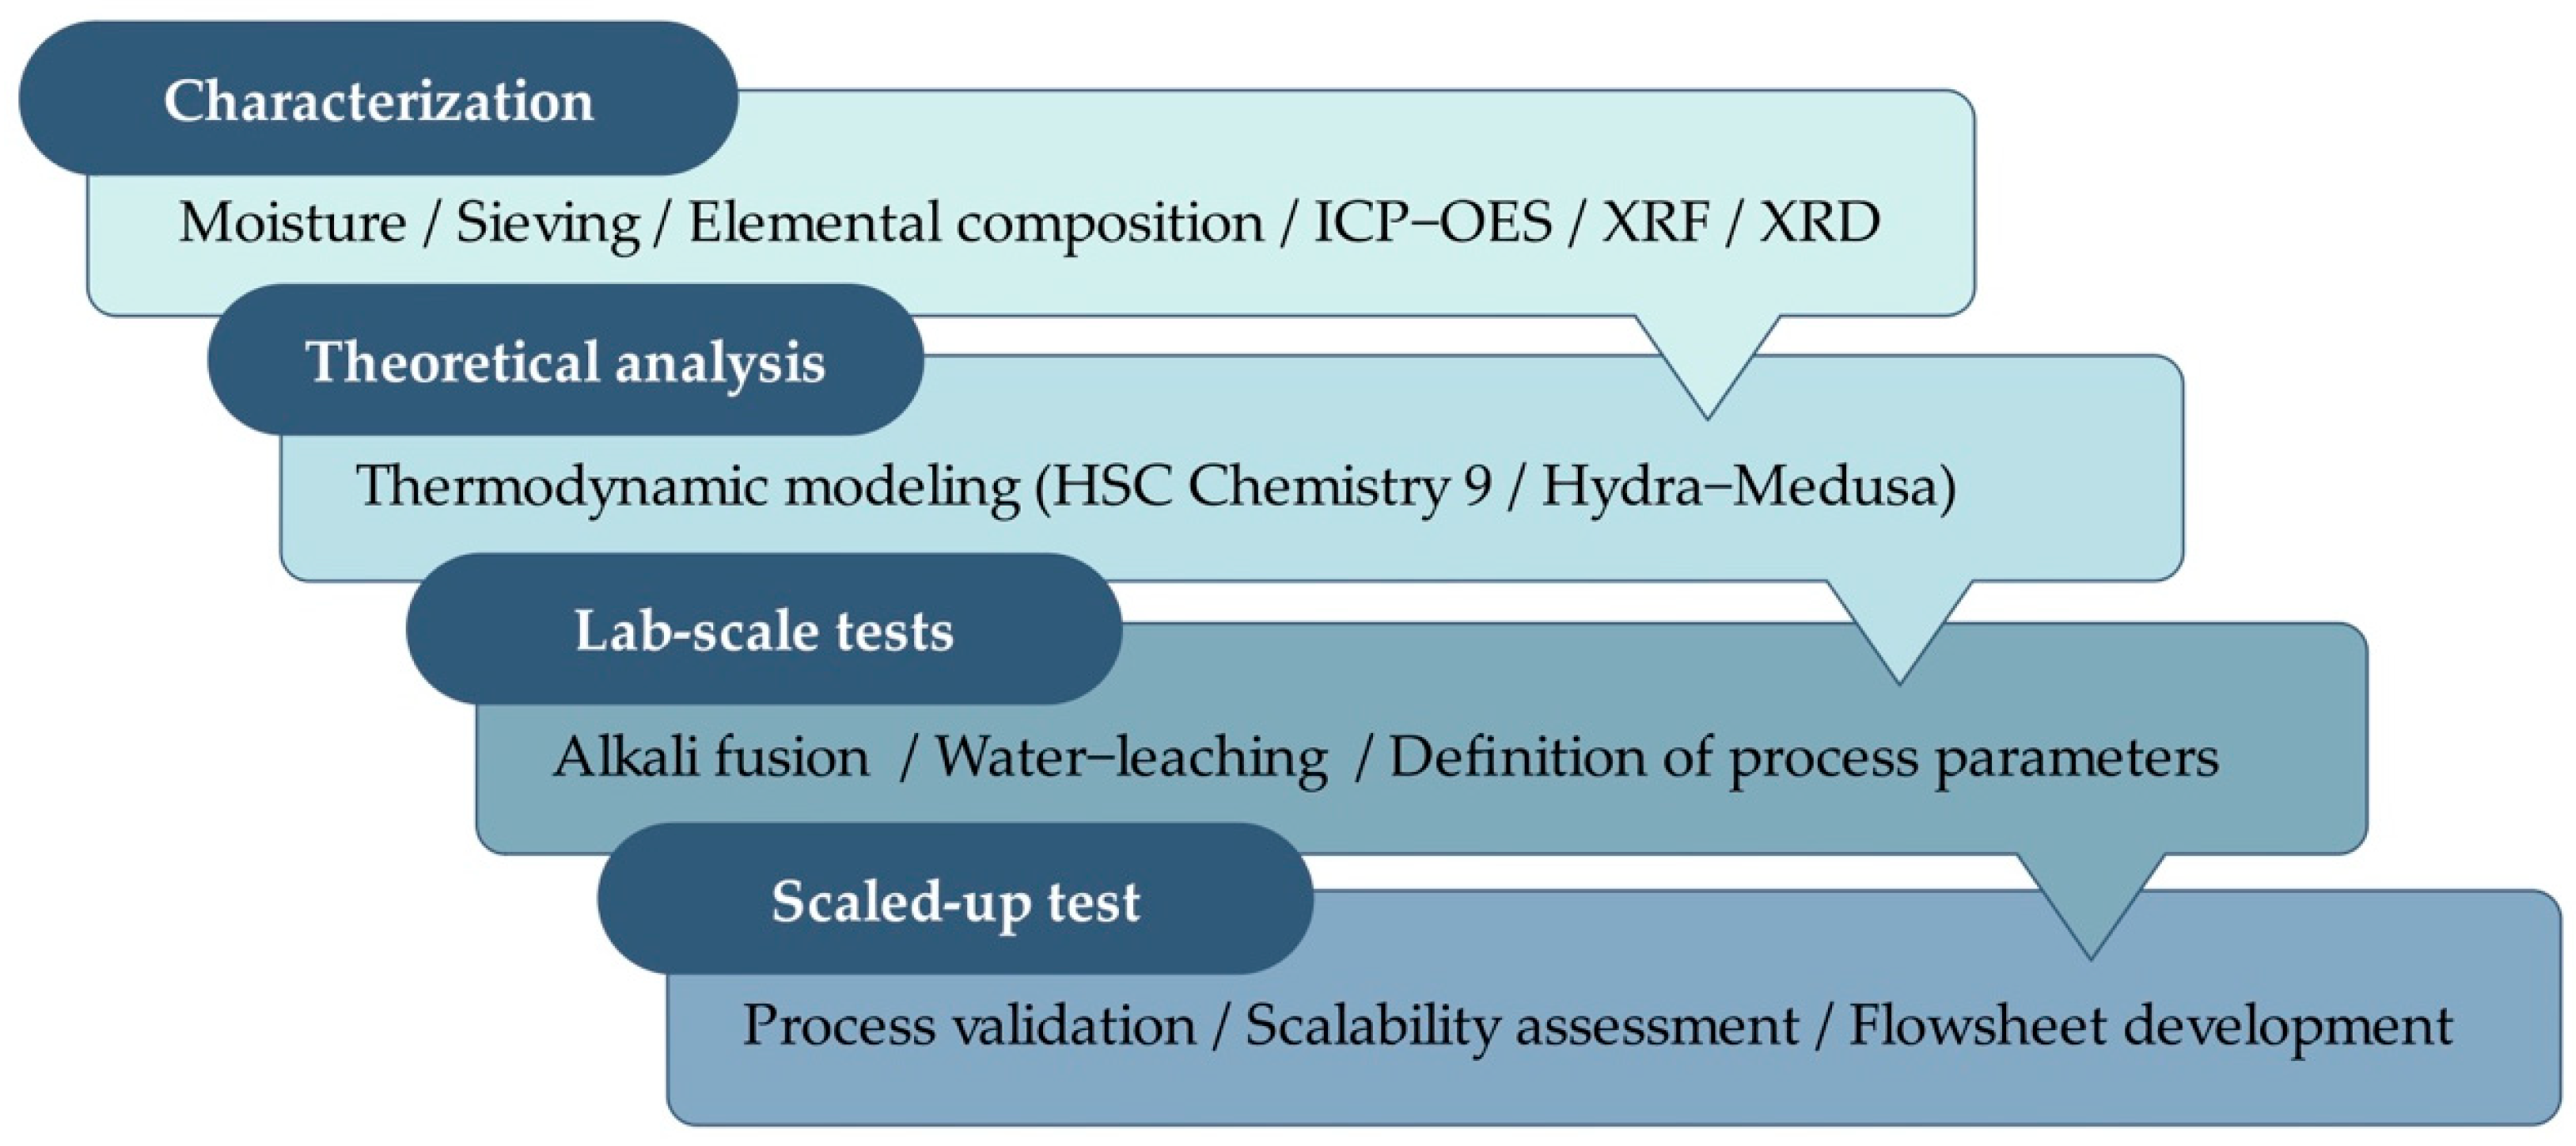
The overall methodology of the integrated process is presented in Figure 2.

3. Results and Discussion

3.1. Thermodynamic Modeling

Thermodynamic modeling was employed to define possible chemical reactions within the fusing system, the stability regions of key compounds, and the distribution of elements throughout leaching.

3.1.1. Influence of NaOH

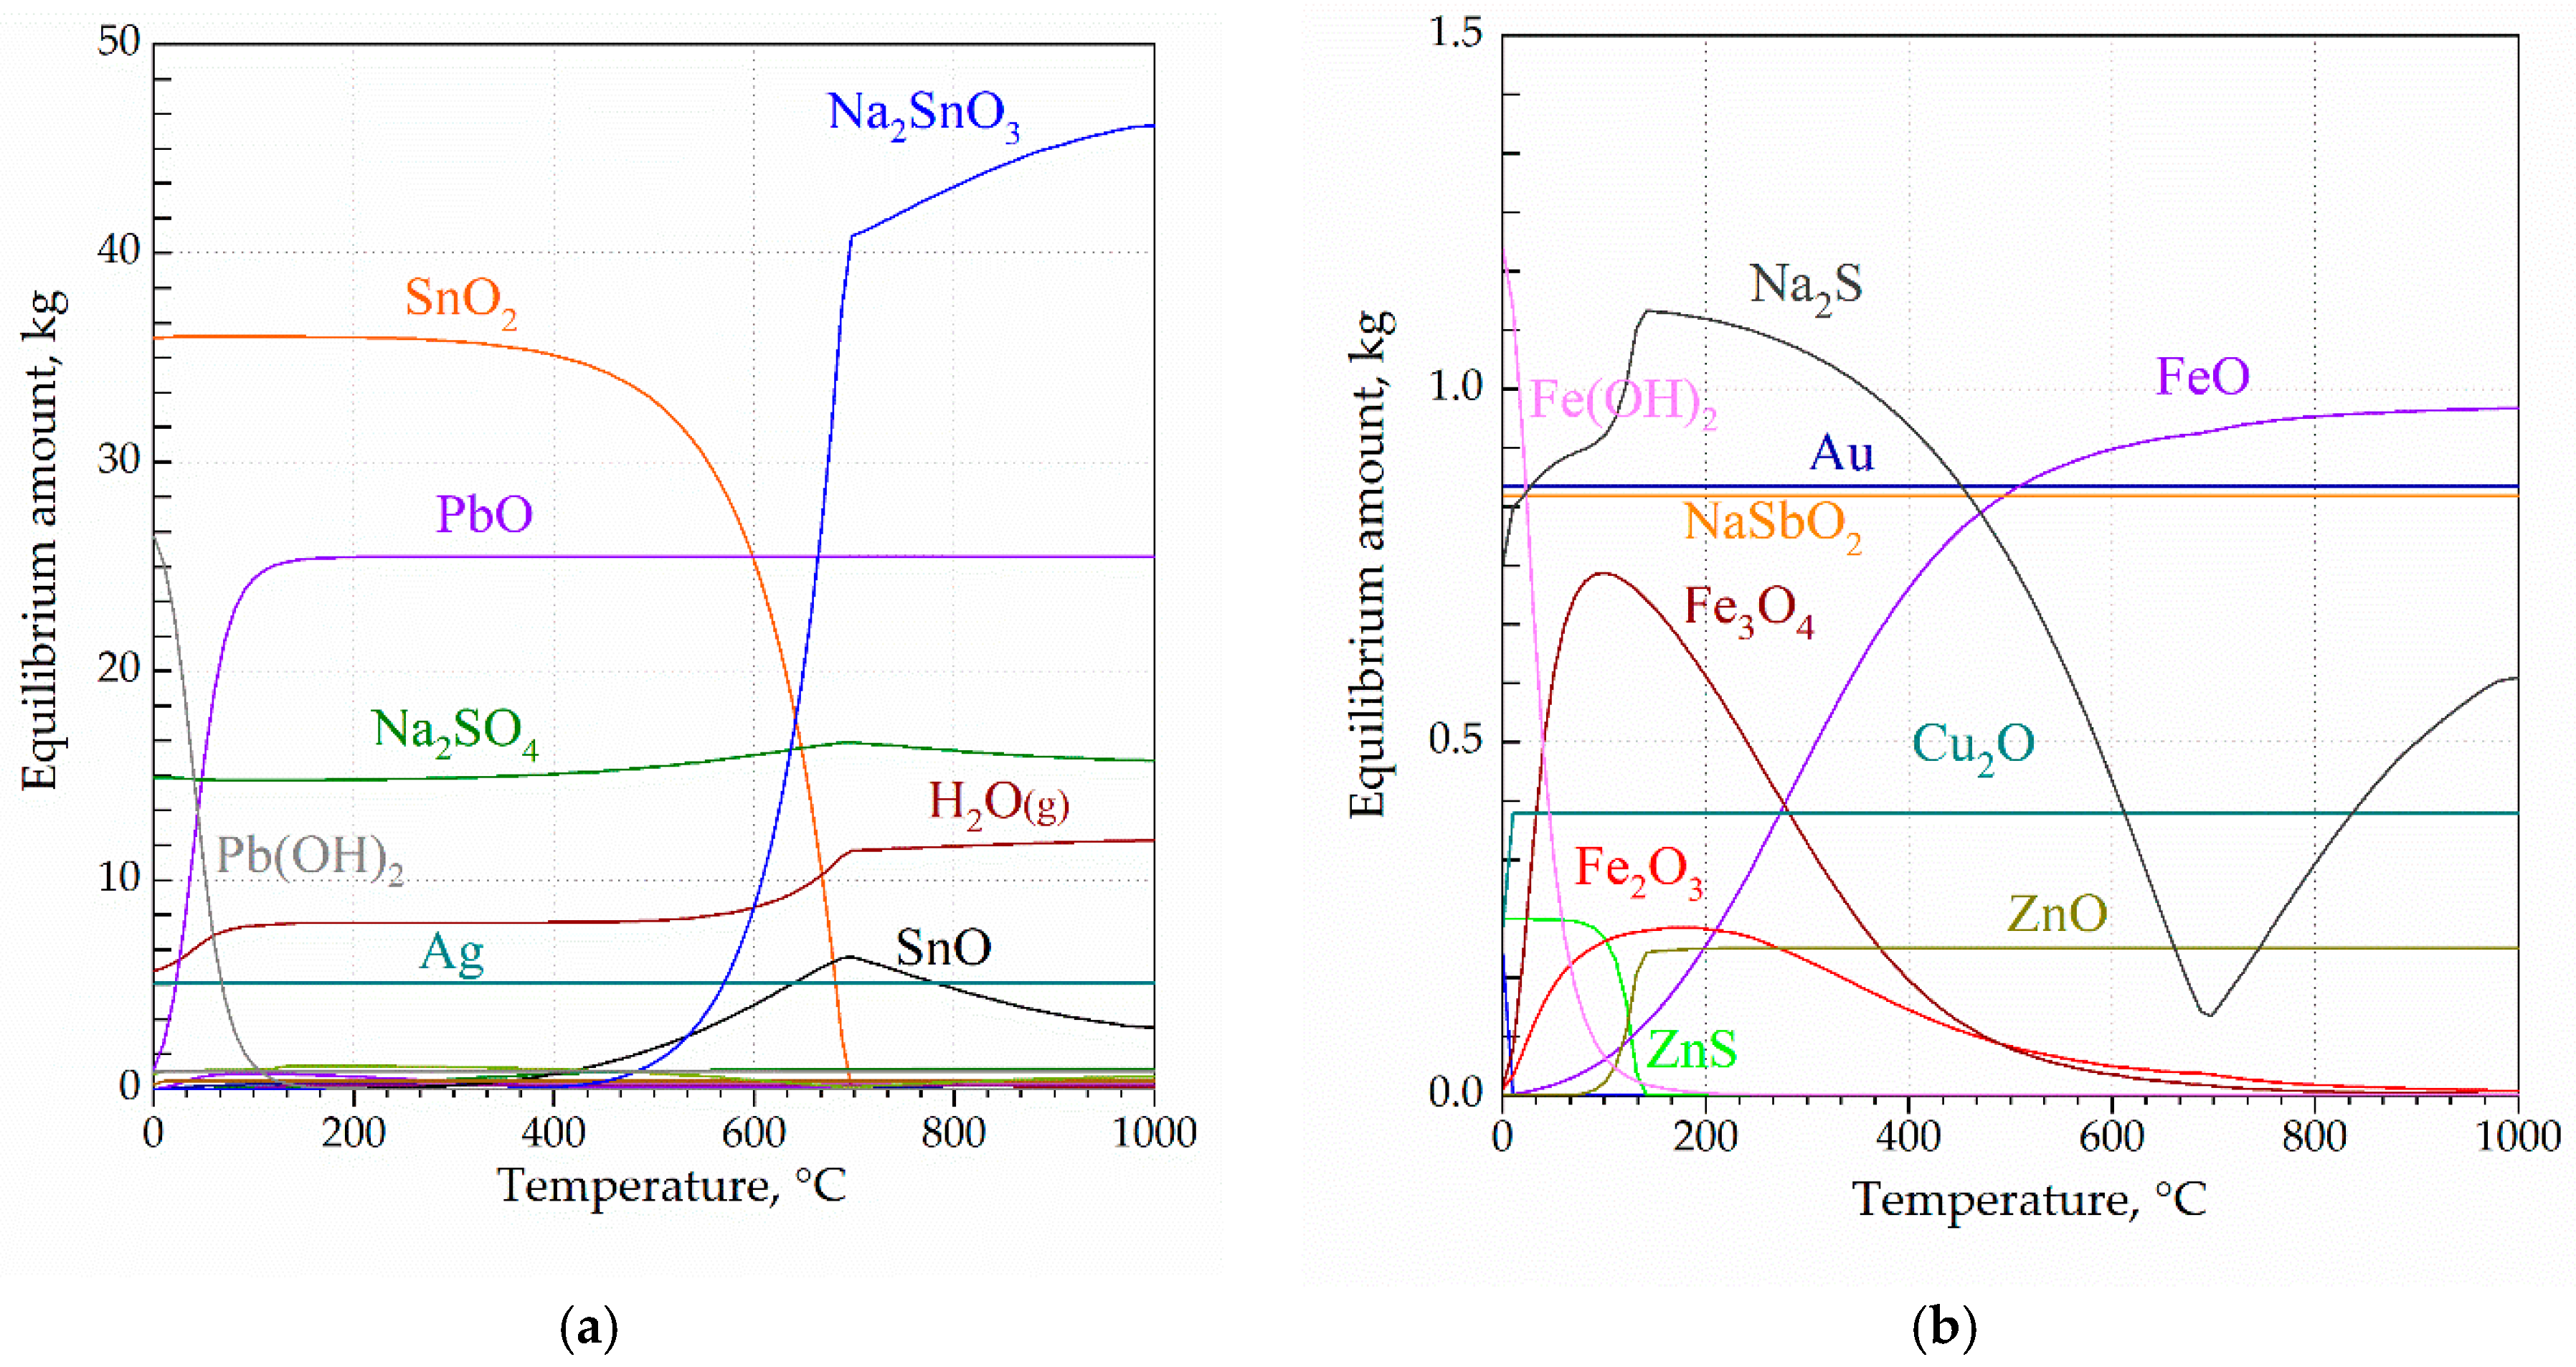
Figure 3 presents the equilibrium phase diagrams based on the initial composition containing PbSO4, PbO, SnO2, FeS, AgO, Ag, AgCl, Au, and AuCl3, illustrating the temperature-dependent transformations of major and minor components during alkali fusion. Although calculations were conducted for various NaOH excess ratios, only the equilibrium results corresponding to the optimal NaOH addition (50% stoich. excess relative to Sn and Pb content) are presented. These calculations simulate the alkali fusion process, predicting the formation and stability of individual solid and gaseous phases as a function of temperature and NaOH influence.
The modeling results show a progressive conversion of SnO2 into Na2SnO3 with increasing temperature, whereas lead phases remain predominantly in the form of stable PbO, reflecting the low reactivity of lead oxides under the considered temperature range. Iron stabilizes as FeO, while AgO and AgCl decompose to metallic Ag, and AuCl3 is reduced to metallic Au. At around 400 °C, SnO2 starts converting to Na2SnO3, with maximal conversion achieved just above 600 °C. With further temperature increase, Pb (as a major component) dominates in the form of PbO, while minor elements (Sb, Fe, Zn, Cu, Au, Ag) stabilize as NaSbO2, FeO, ZnO, Cu2O, and metallic Au and Ag. These results confirm the thermodynamic tendency toward the formation of stable oxide-type phases at elevated temperatures and the retention of noble metals in their metallic form (Table 3).
PbSO4 + 2NaOH(l) = PbO + Na2SO4 + H2O(g)
PbO + 2NaOH(l) = Na2PbO2 + H2O(g)
SnO2 + 2NaOH(l) = Na2SnO3 + H2O(g)
CuSO4 + Cu + 2NaOH(l) = Cu2O + Na2SO4 + H2O (g)
FeS + 2NaOH(l) = FeO + Na2S + H2O(g)
ZnS + 2NaOH(l) = ZnO + Na2S + H2O(g)
4AgCl + 4NaOH(l) = 4Ag + 4NaCl + 2H2O(g) + O2(g)
1.333AuCl3 + 4NaOH(l) = 1.333Au + 4NaCl + 2 H2O(g) + O2(g)
Sb2O3 + 2NaOH(l) = 2NaSbO2 + H2O(g)
SiO2 + 2NaOH(l) = Na2O × SiO2 + H2O(g)
Thermodynamic modeling conducted in the temperature range of 400–800 °C showed that Reactions (1), (4), and (7)–(10) are highly spontaneous within the examined interval (ΔGθ < 0, log K > 0). Increasing the temperature further enhances their thermodynamic favorability, representing a characteristic trend for most reactions in the CAS–NaOH system. Such behavior corresponds to the nature of exothermic processes accompanied by positive entropy changes (ΔSθ > 0), where the release of gaseous products (H2O(g), O2(g)) contributes to an overall increase in system entropy.
In contrast, certain reactions deviate from this general trend and exhibit specific temperature-dependent behavior. Reaction (3) (SnO2 + 2NaOH = Na2SnO3 + H2O(g)) remains spontaneous throughout the examined interval but shows a negative entropy change (ΔSθ < 0), resulting in decreased thermodynamic favorability with increasing temperature. Reaction (6) (ZnS + 2NaOH = ZnO + Na2S + H2O(g)) changes from non-spontaneous to spontaneous near 600 °C (ΔHθ > 0, ΔSθ > 0), indicating that at this temperature the process is thermodynamically driven by the entropic factor.
Reaction (2) (PbO + 2NaOH = Na2PbO2 + H2O(g)) exhibits the opposite behavior and remains unfavorable throughout the considered temperature range due to the negative entropy change (ΔSθ < 0).
However, thermodynamic parameters suggest that under locally oxidizing conditions and altered phase stability, equilibrium may be established that enables partial formation of Na2PbO2, while a significant part of lead remains in the stable PbO form. This indicates that, within the considered temperature range, PbO represents the dominant and thermodynamically most stable lead phase in the CAS–NaOH system. This finding is favorable for the subsequent leaching step, as PbO is characterized by very low solubility (Ksp = 1.43 × 10⁻¹³ at 25 °C; [39]), suggesting that lead will remain predominantly in the solid phase during leaching.
At 600 °C, the highest log K values were obtained for Reactions (4) and (8), followed by (1), (7), and (9), while Reaction (6) only reaches positive log K values. Although ΔGθ and log K values were also calculated for temperatures below 400 °C and above 800 °C (up to 1000 °C), these results are not relevant for the interpretation of the process, as they fall outside the practical temperature range in which the alkali fusion occurs. Overall, the results indicate that approximately 600 °C represents the optimal temperature for simultaneous conversion of major phases, noting that the formation of Na2PbO2 requires more oxidizing conditions and slightly higher temperatures than those assumed in the model.
According to the Gibbs free energy values presented in Table 3, all fusion reactions exhibit a progressive decrease in ΔGθ with increasing temperature, indicating that higher temperatures favor the formation of sodium stannate, antimonate, and plumbite phases. The reactions become thermodynamically spontaneous (ΔGθ < 0) above approximately 500 °C, while at 600 °C, all systems exhibit negative Gibbs energies. Therefore, considering the thermodynamic parameters of the system, it can be concluded that 600 °C represents the optimal temperature that enables complete phase conversion without excessive volatilization or sintering that may occur at higher temperatures.

3.1.2. Influence of NaNO3

The introduction of NaNO3 into the system (Table 4) significantly increases the oxidation potential and enhances the thermodynamic favorability of most reactions, as confirmed by strongly negative ΔGθ and high log K values. Nevertheless, this effect is not advantageous for practical application, since oxidation promoted by NaNO3 leads to the formation of insoluble oxide and sulfate phases (PbO2, Fe2O3, and Na2SO4), which inhibit metal recovery and complicate phase separation. In contrast, the use of NaOH alone favors the formation of soluble Na2SnO3, NaSbO2, and Na2ZnO2 phases, enabling more efficient dissolution and selective phase conversion during the water leaching step following alkali fusion.
2SnO2 + 2NaOH + 2NaNO3 = 2Na2SnO3 + H2O(g) + N2(g) + 2.5O2(g)
6PbSO4 + 10NaOH + 2NaNO3 = PbO + 5PbO2 + 6Na2SO4 + 5H2O(g) + N2(g)
2CuSO4 + 2NaOH + 2NaNO3 + 5Cu = 7CuO + 2Na2SO4 + H2O(g) + N2(g)
10FeS + 2NaOH + 18NaNO3 = 5Fe2O3 + 10Na2SO4 + H2O(g) + 9N2(g)
5ZnS + 2NaOH + 8NaNO3 = 5ZnO + 5Na2SO4 + H2O(g) + 4N2(g)
8.221AgCl + 6.221NaOH + 2NaNO3 =
8.221Ag + 8.221NaCl + 3.111H2O(g) + N2(g) + 4.555O2(g)
1.575AuCl3 + 2.725NaOH + 2NaNO3 =
1.575Au + 4.725NaCl + 1.362H2O(g) + N2(g) + 3.681O2(g)
2.5Sb2O3 + 3NaOH + 2NaNO3 = 5NaSbO3 + 1.5H2O(g) + N2(g)

3.1.3. Leaching Modeling

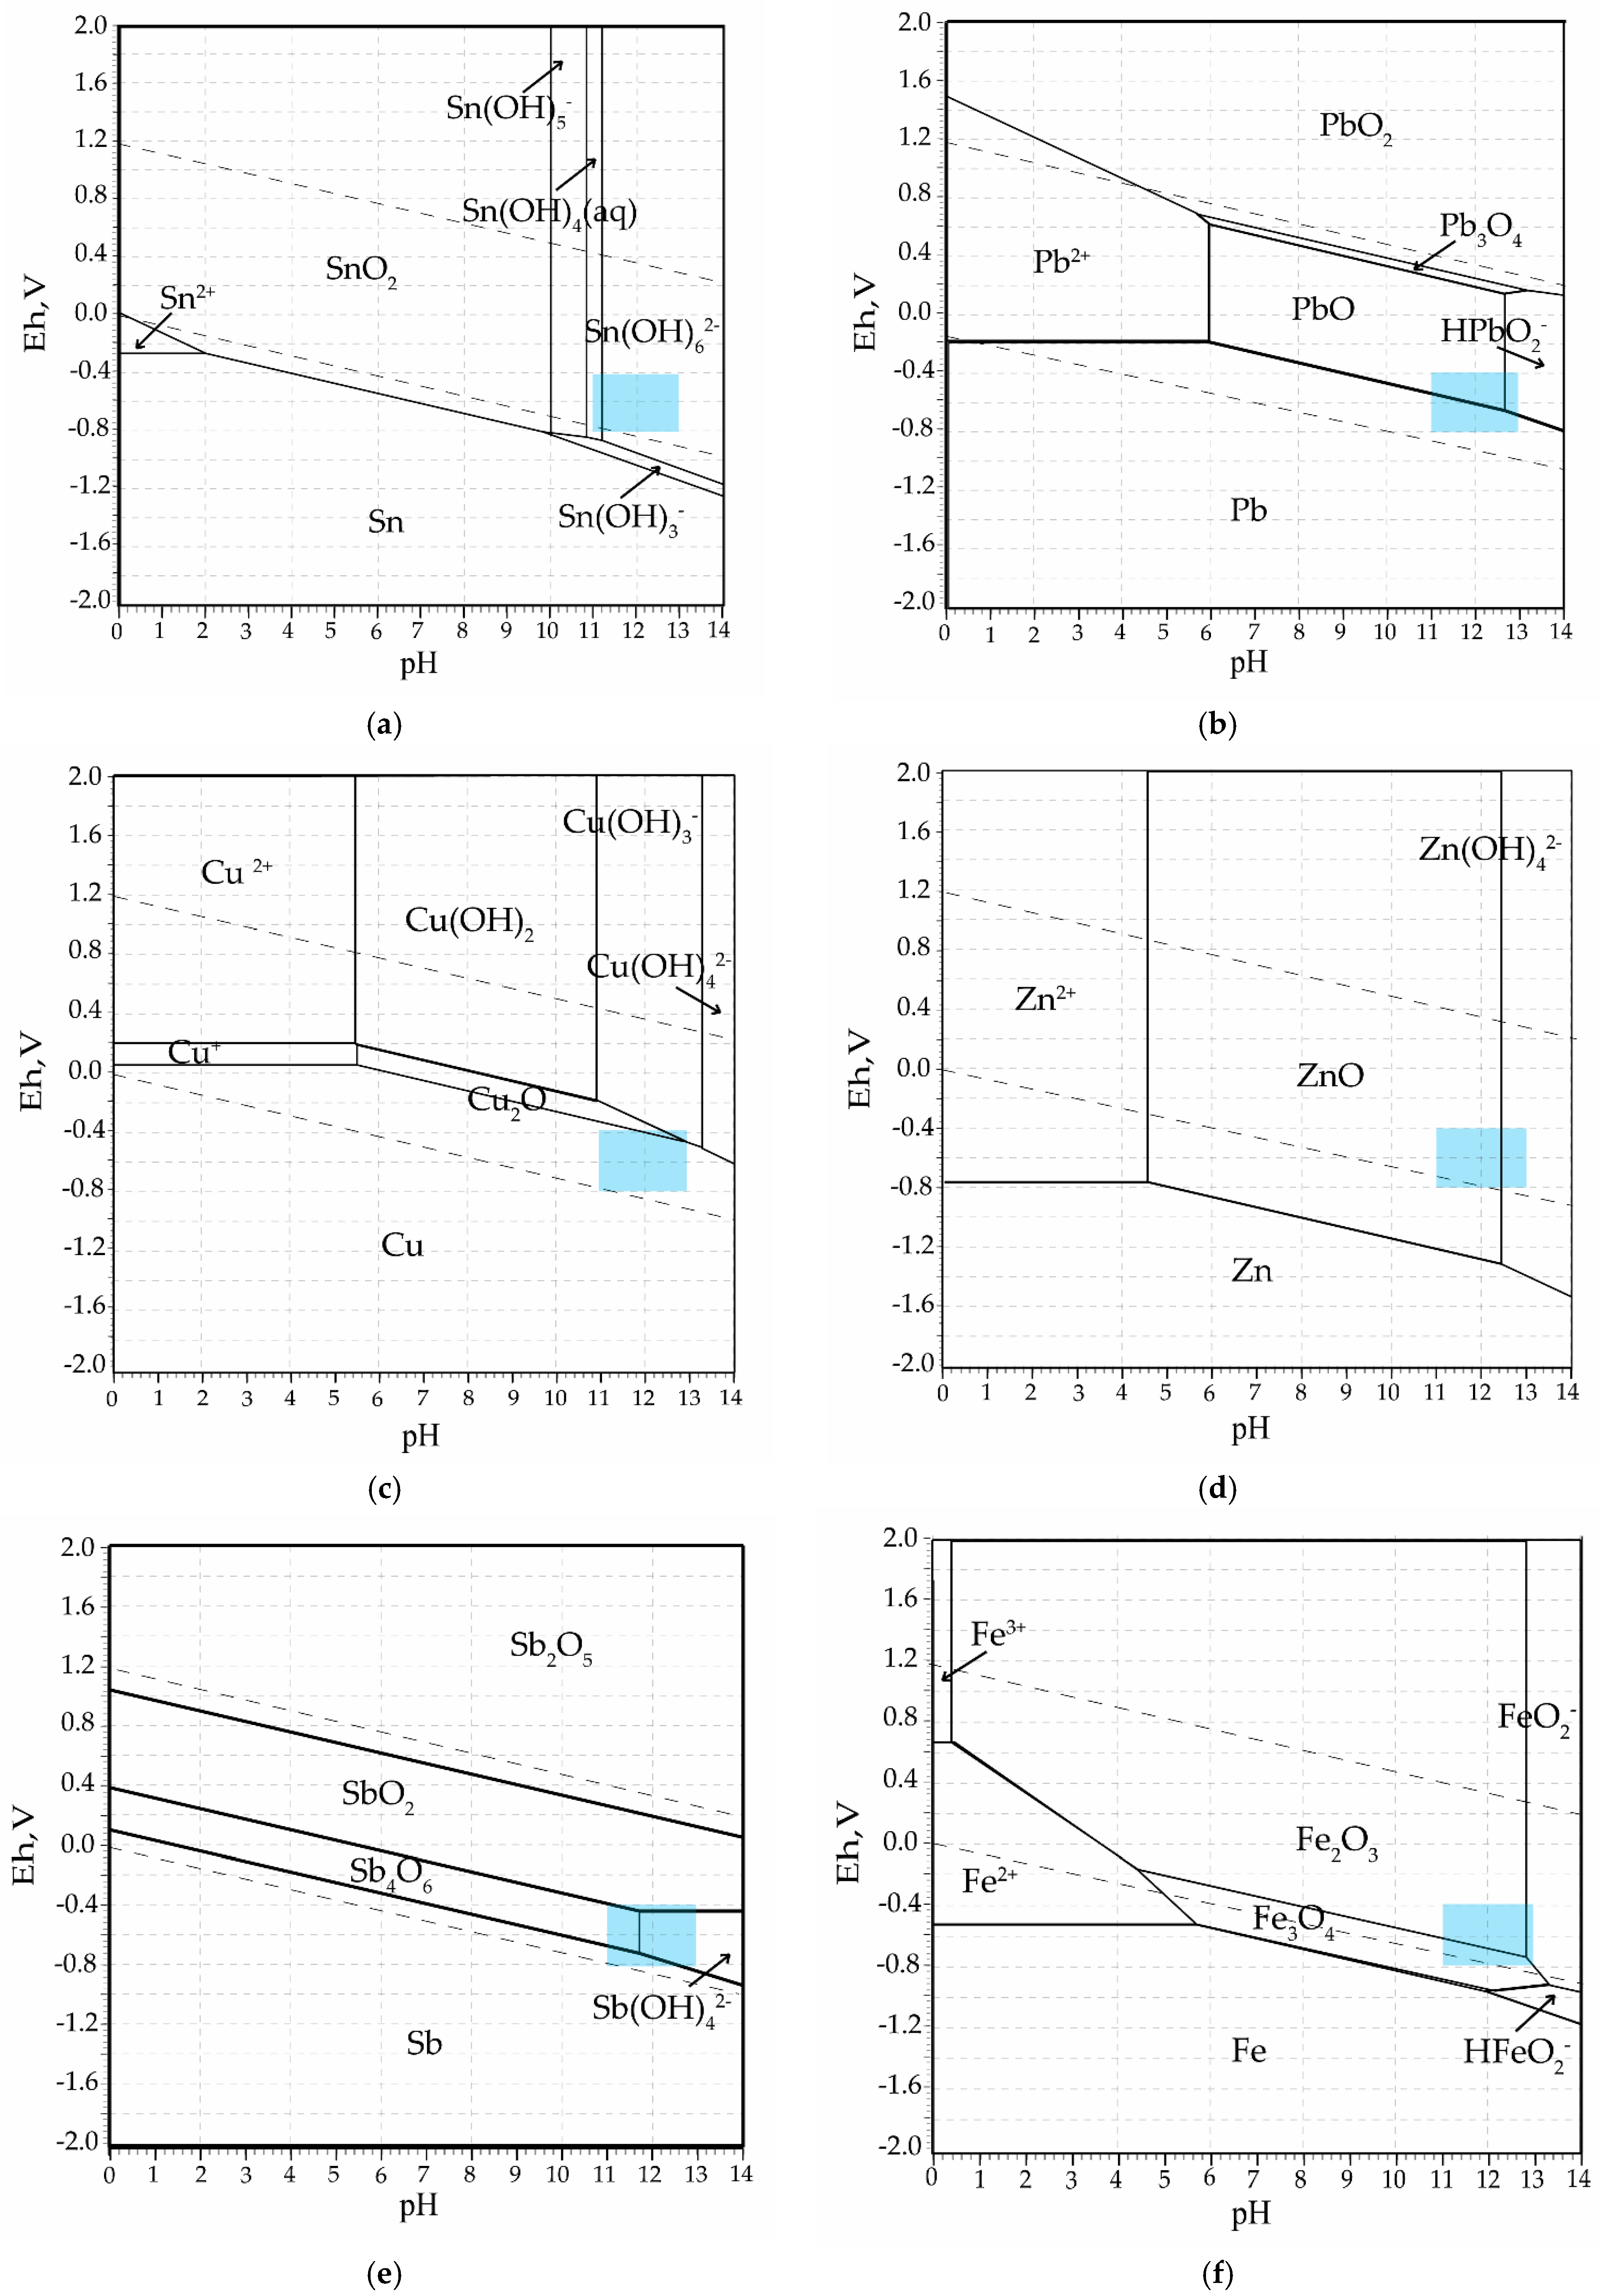
Thermodynamic analysis based on Pourbaix diagrams (Eh–pH), previously developed for the metals of interest (Pb, Sn, Fe, Zn, Cu, and Sb) and discussed in detail in [40], is presented in Figure 4. The diagrams illustrate the dominant phases and solubility boundaries under alkaline conditions, where the blue region indicates the pH 11–13 and Eh = −0.8 to −0.4 V range corresponding to the optimal conditions to achieve efficient separation. Eh–pH diagrams were modeled for various temperatures, and it was determined that 80 °C provides the most thermodynamically favorable conditions. Diagrams for Au and Ag were not included due to the absence of the formation of stable aqueous complexes and their insolubility in aqueous media.
Thermodynamic stability analysis revealed that Sn and Sb predominantly form soluble stannate and antimonate species (Sn(OH)62−, Sb(OH)42−, Figure 4a,e), whereas Zn exhibits only limited solubility as Zn(OH)42− near pH ≈ 13 (Figure 4d); in contrast, Pb, Cu, and Fe remain mainly in stable, insoluble solid phases (Pb/PbO, Cu/Cu2O, Fe/Fe3O4,) under the examined alkaline-reducing conditions (Figure 4b,c,f). The correspondence between the fusion and leaching modeling results indicates the overall process selectivity.
Thermodynamic analysis of the selected leaching reactions (Equations (19)–(21)) was conducted to complement the Eh–pH stability results obtained at the same temperatures, and the corresponding parameters are summarized in Table 5.
Na2SnO3 + 3OH + 3H+ = 2Na+ + Sn(OH)62−
NaSbO2 + 2OH + 2H+ = Sb(OH)4 + Na+
ZnO + 3OH + H+ = Zn(OH)42−
According to Table 5, the thermodynamic data indicate that the dissolution of Sn and Zn compounds is thermodynamically favorable, whereas Sb is expected to remain in the solid phase. However, when these results are interpreted in conjunction with the Eh–pH diagrams (Figure 4d,e), thus accounting for the redox conditions of the system rather than isolated equilibrium reactions, it becomes evident that Zn and Sb are located near the boundary between the stability fields of solid and soluble species. As a result, their dissolution is expected to be only partial, occurring concurrently with Sn under the defined leaching conditions.

3.2. Alkali Fusion–Leaching Optimization

3.2.1. Influence of NaOH

In the first test series, the effect of NaOH addition (stoich. excess 20–70 wt.%) on the efficiency of compound transformation and the selective removal of metals, primarily tin, from CAS through leaching was investigated. The analysis of mass loss after alkali fusion indicated that this step did not cause significant mass loss. The observed reduction, ranging from 6.29% to 12.74%, can be attributed to the release of crystalline water and partial sulfur removal from the CAS matrix at elevated temperatures. To assess the influence of fusion time, experiments were conducted at a constant NaOH ratio within the 30–120 min interval. A mass change between 7.22% and 11.50% was recorded, and a plateau was observed between 50 and 60 min, after which variations became negligible. The stabilization of mass change after 50–60 min indicates that the dominant reactions approach equilibrium within this period, implying that kinetic constraints are minimal under the selected fusion parameters. Accordingly, a fusion time of 60 min was selected as optimal for subsequent experiments.
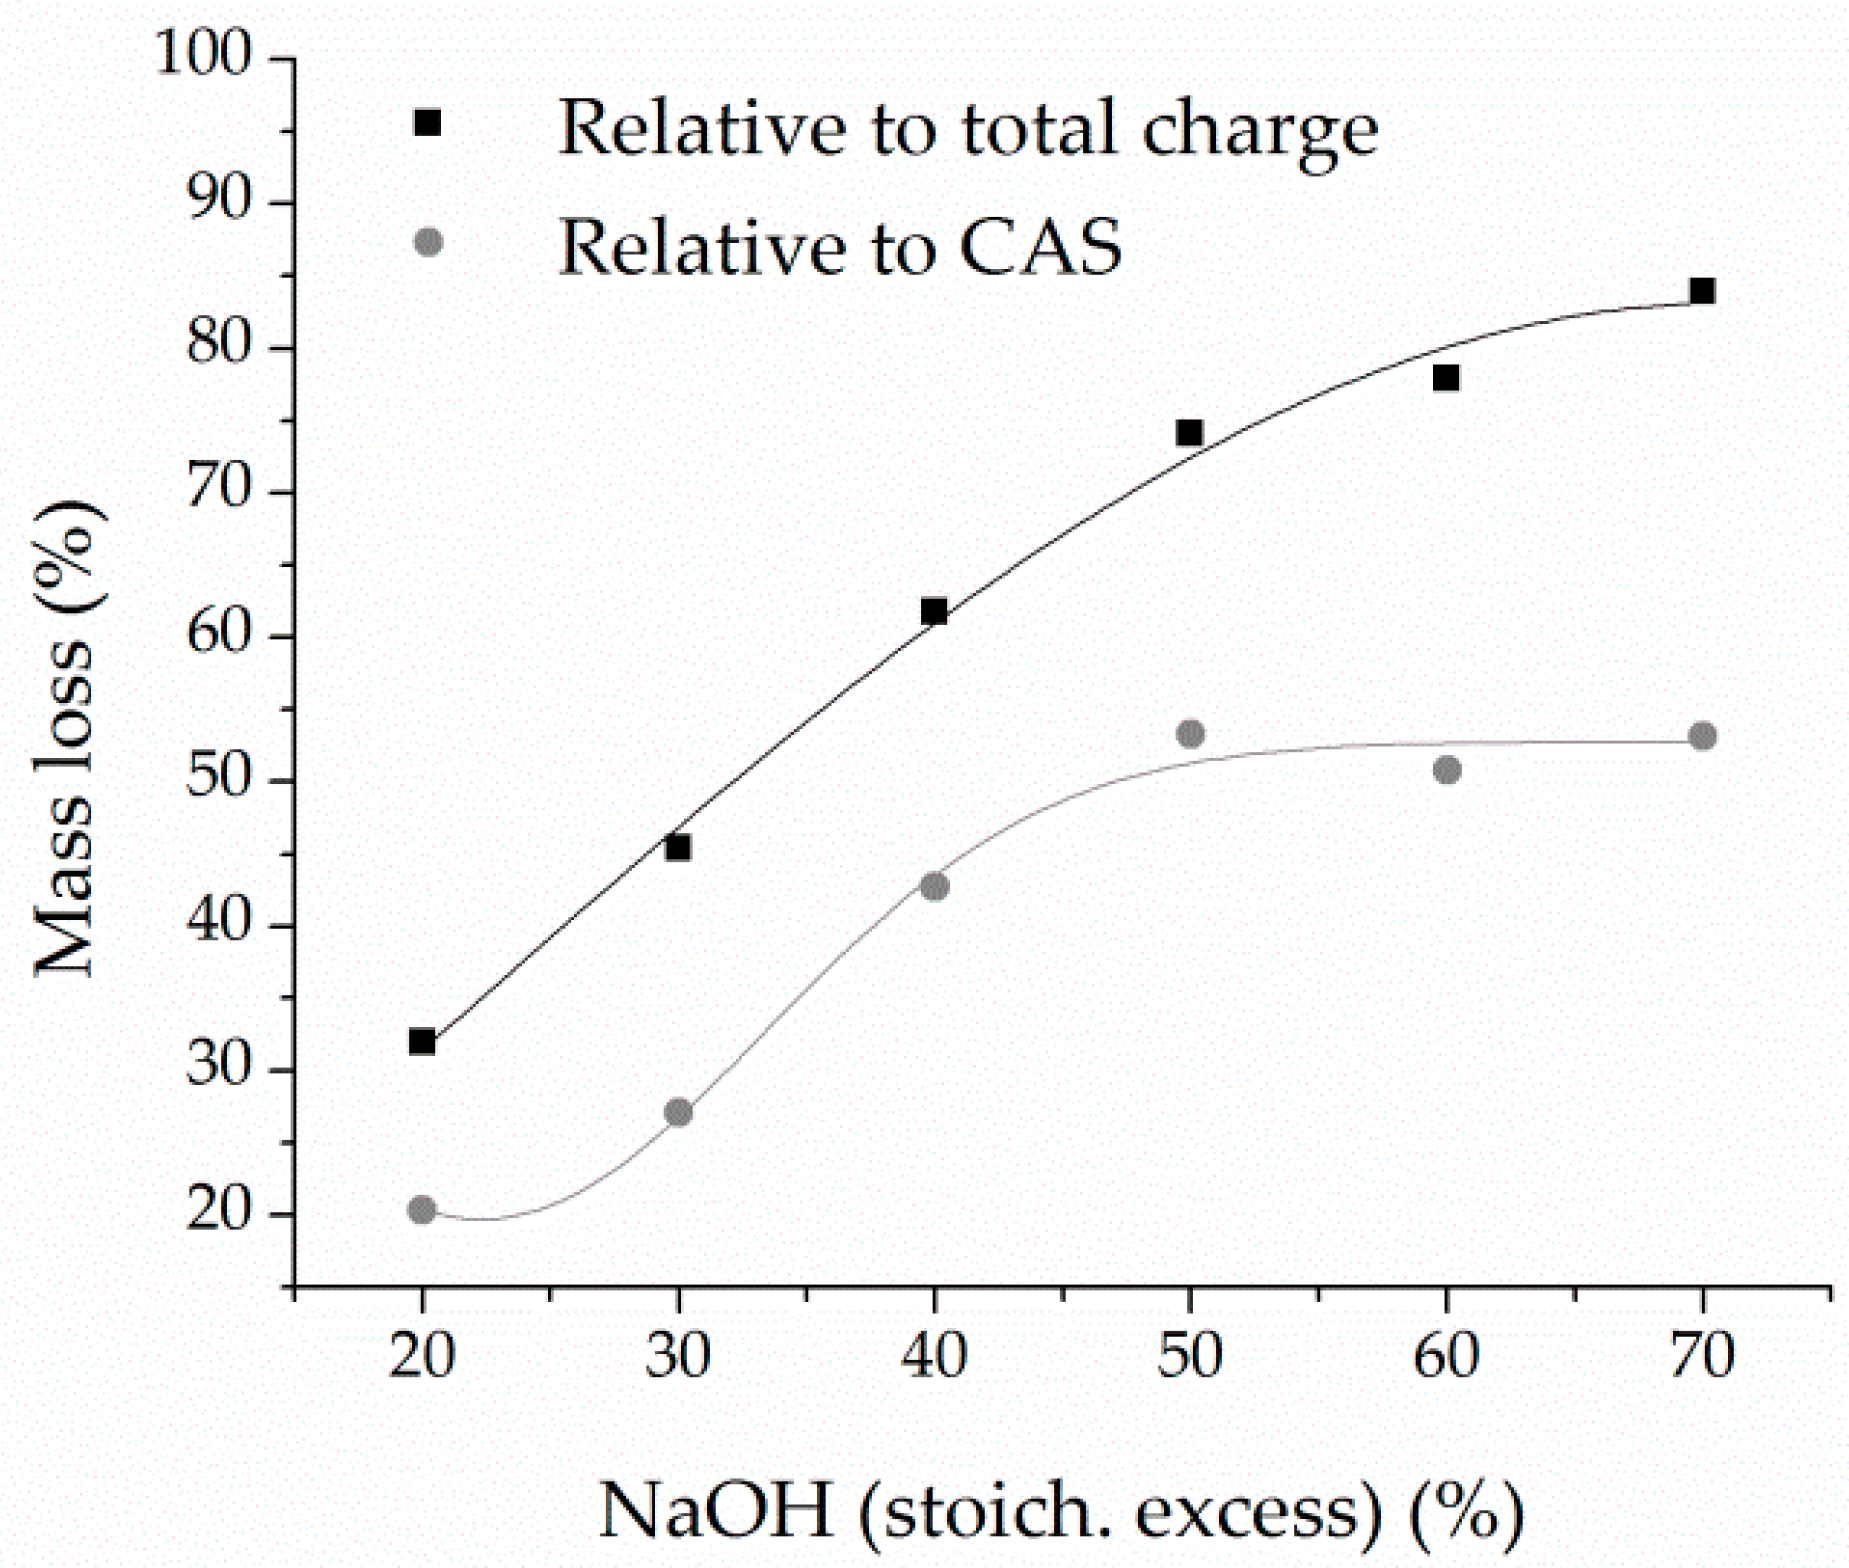
The dependence of the mass change after leaching of the fusion products on the NaOH dosage is shown in Figure 5.
The mass loss after leaching of the fusion products showed a clear dependence on the amount of NaOH added. Within the CAS–NaOH system, increasing the NaOH content led to a substantial rise in mass loss, ranging from 31.97% to 83.90% relative to the total fusion charge. When calculated in relation to the CAS content alone, this corresponds to a reduction of 20.31% to 53.17%. Furthermore, it was observed that mass loss increased proportionally with NaOH addition up to a stoichiometric excess of 50%, beyond which no significant changes were recorded. This trend aligns well with the predictions of thermodynamic modeling and confirms the expected behavior of the system under the given conditions.
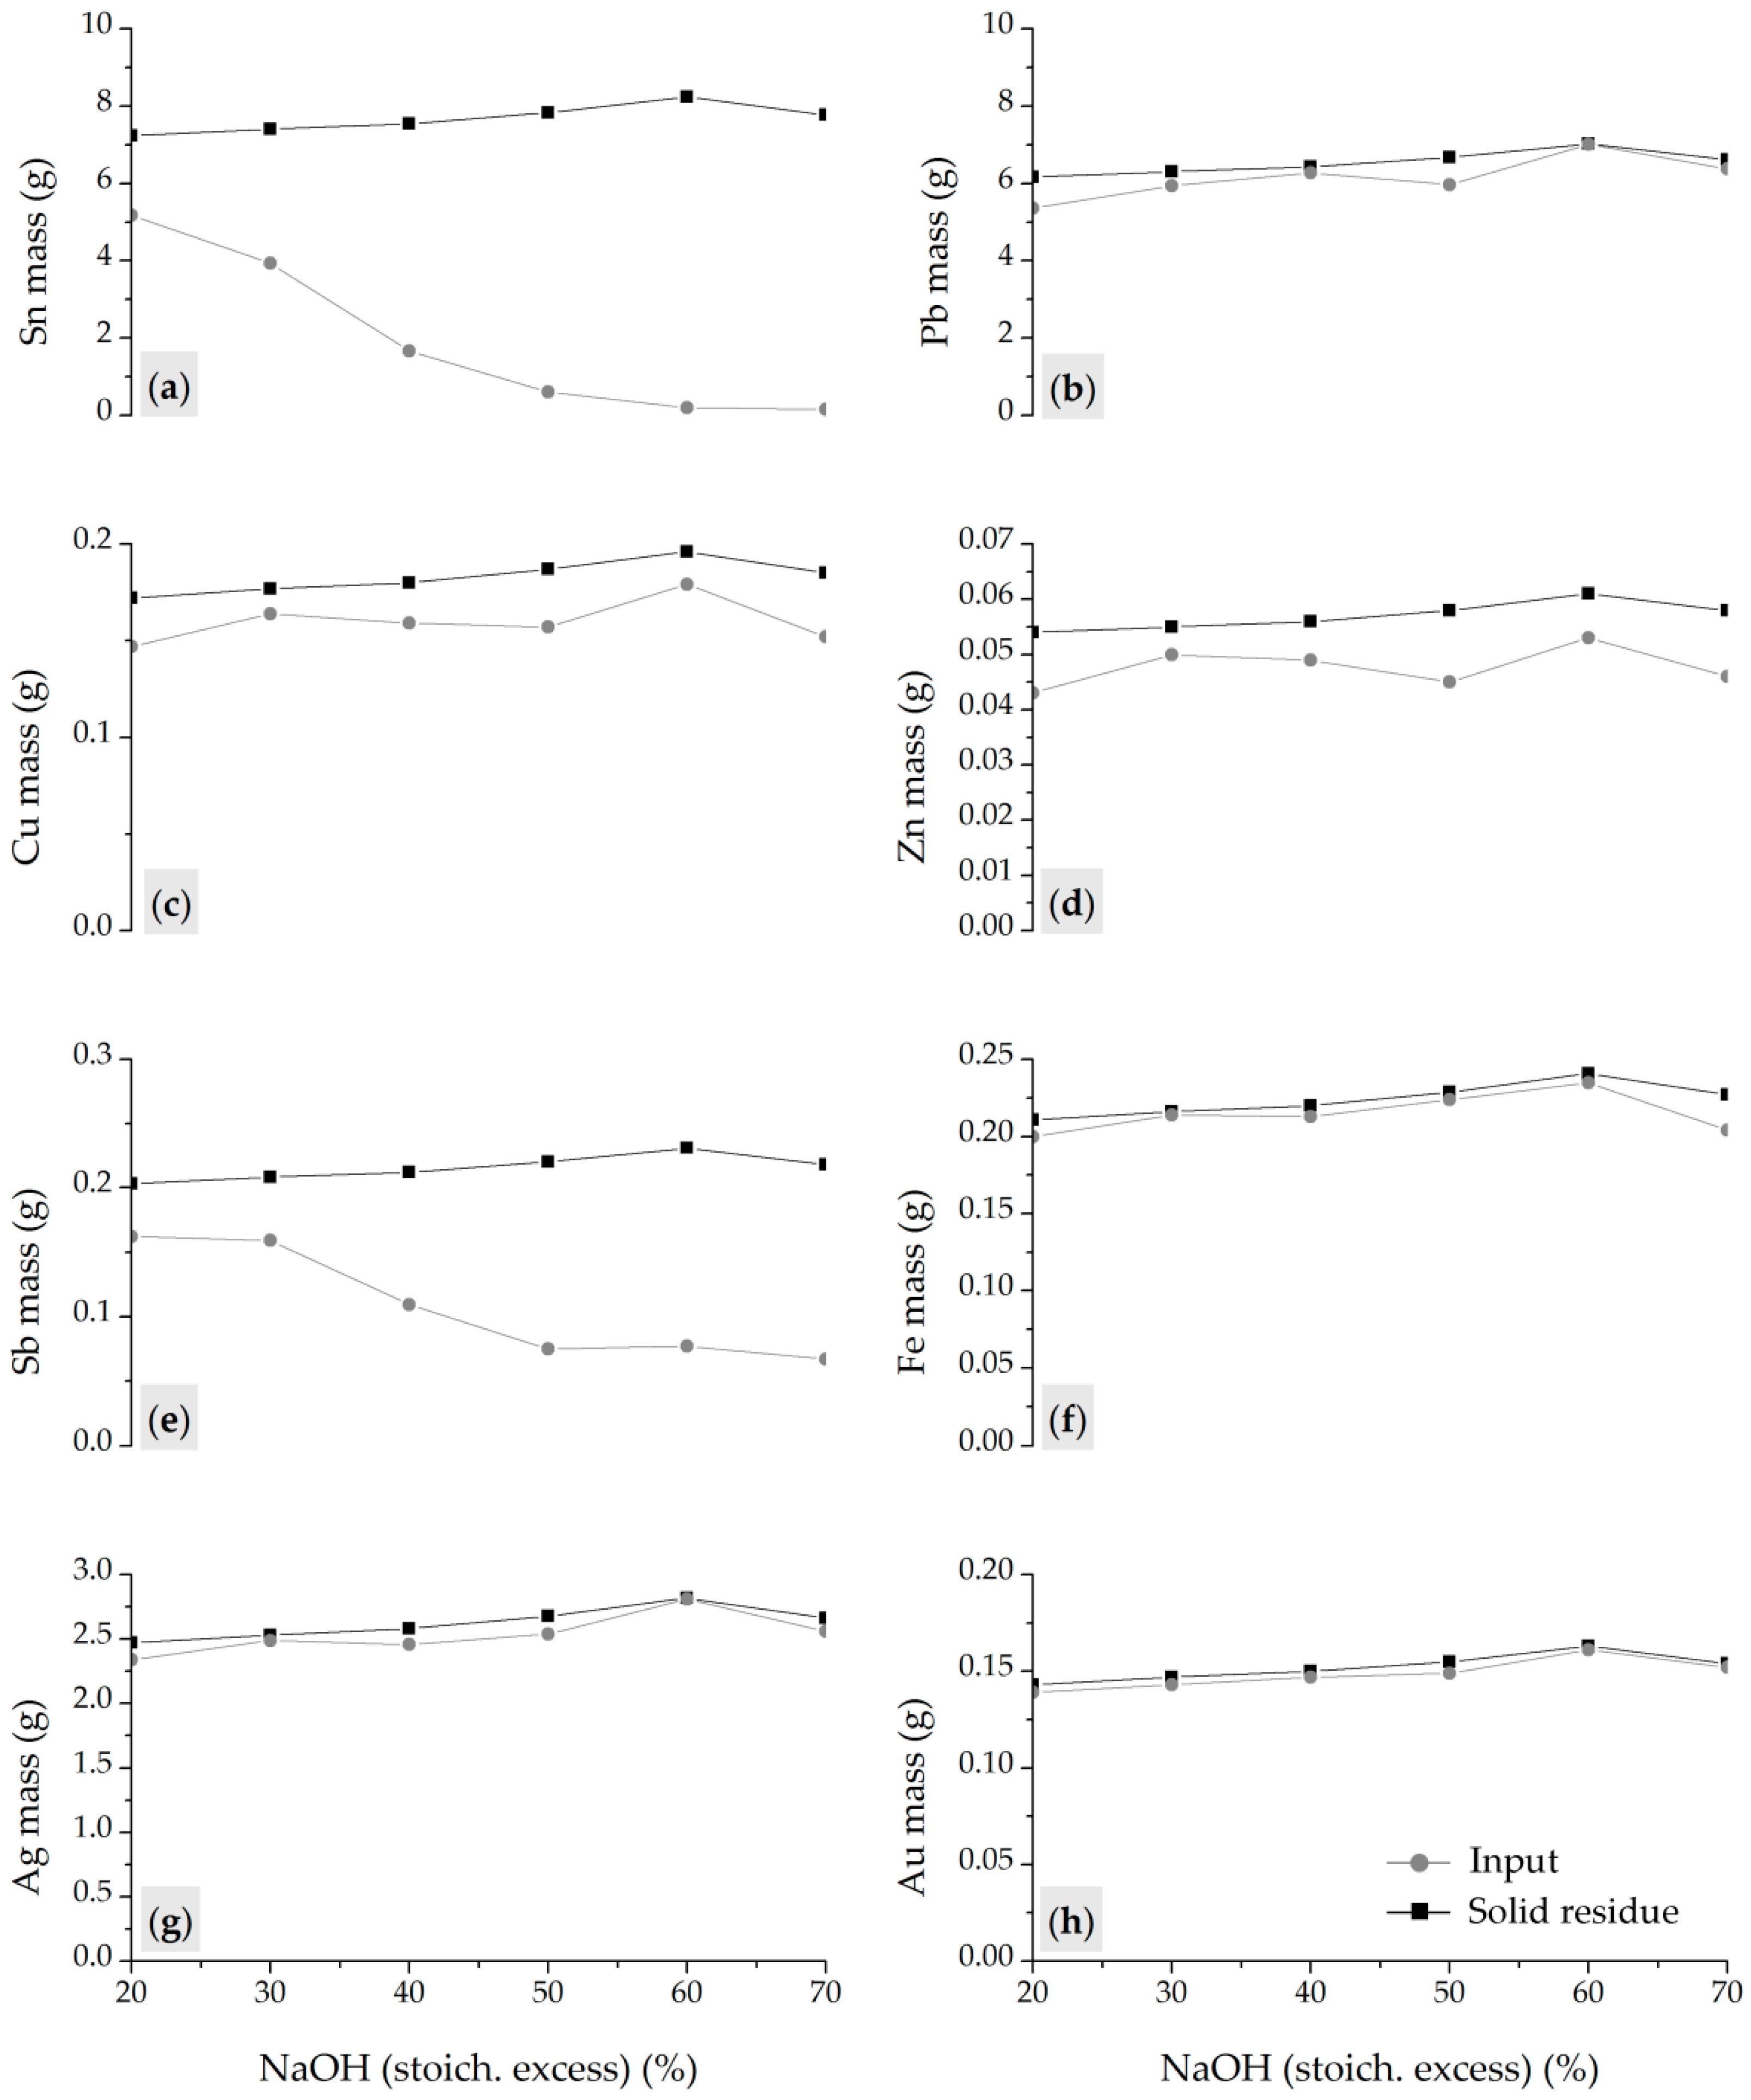
The chemical composition of the solid residues obtained after leaching of the fusion products, as a function of NaOH addition, was determined by XRF analysis and is presented in Table 6. The corresponding metal mass balance and leaching efficiencies, calculated based on the chemical composition and known residue masses, are shown in Figure 6 (trace and accompanying elements are not presented).
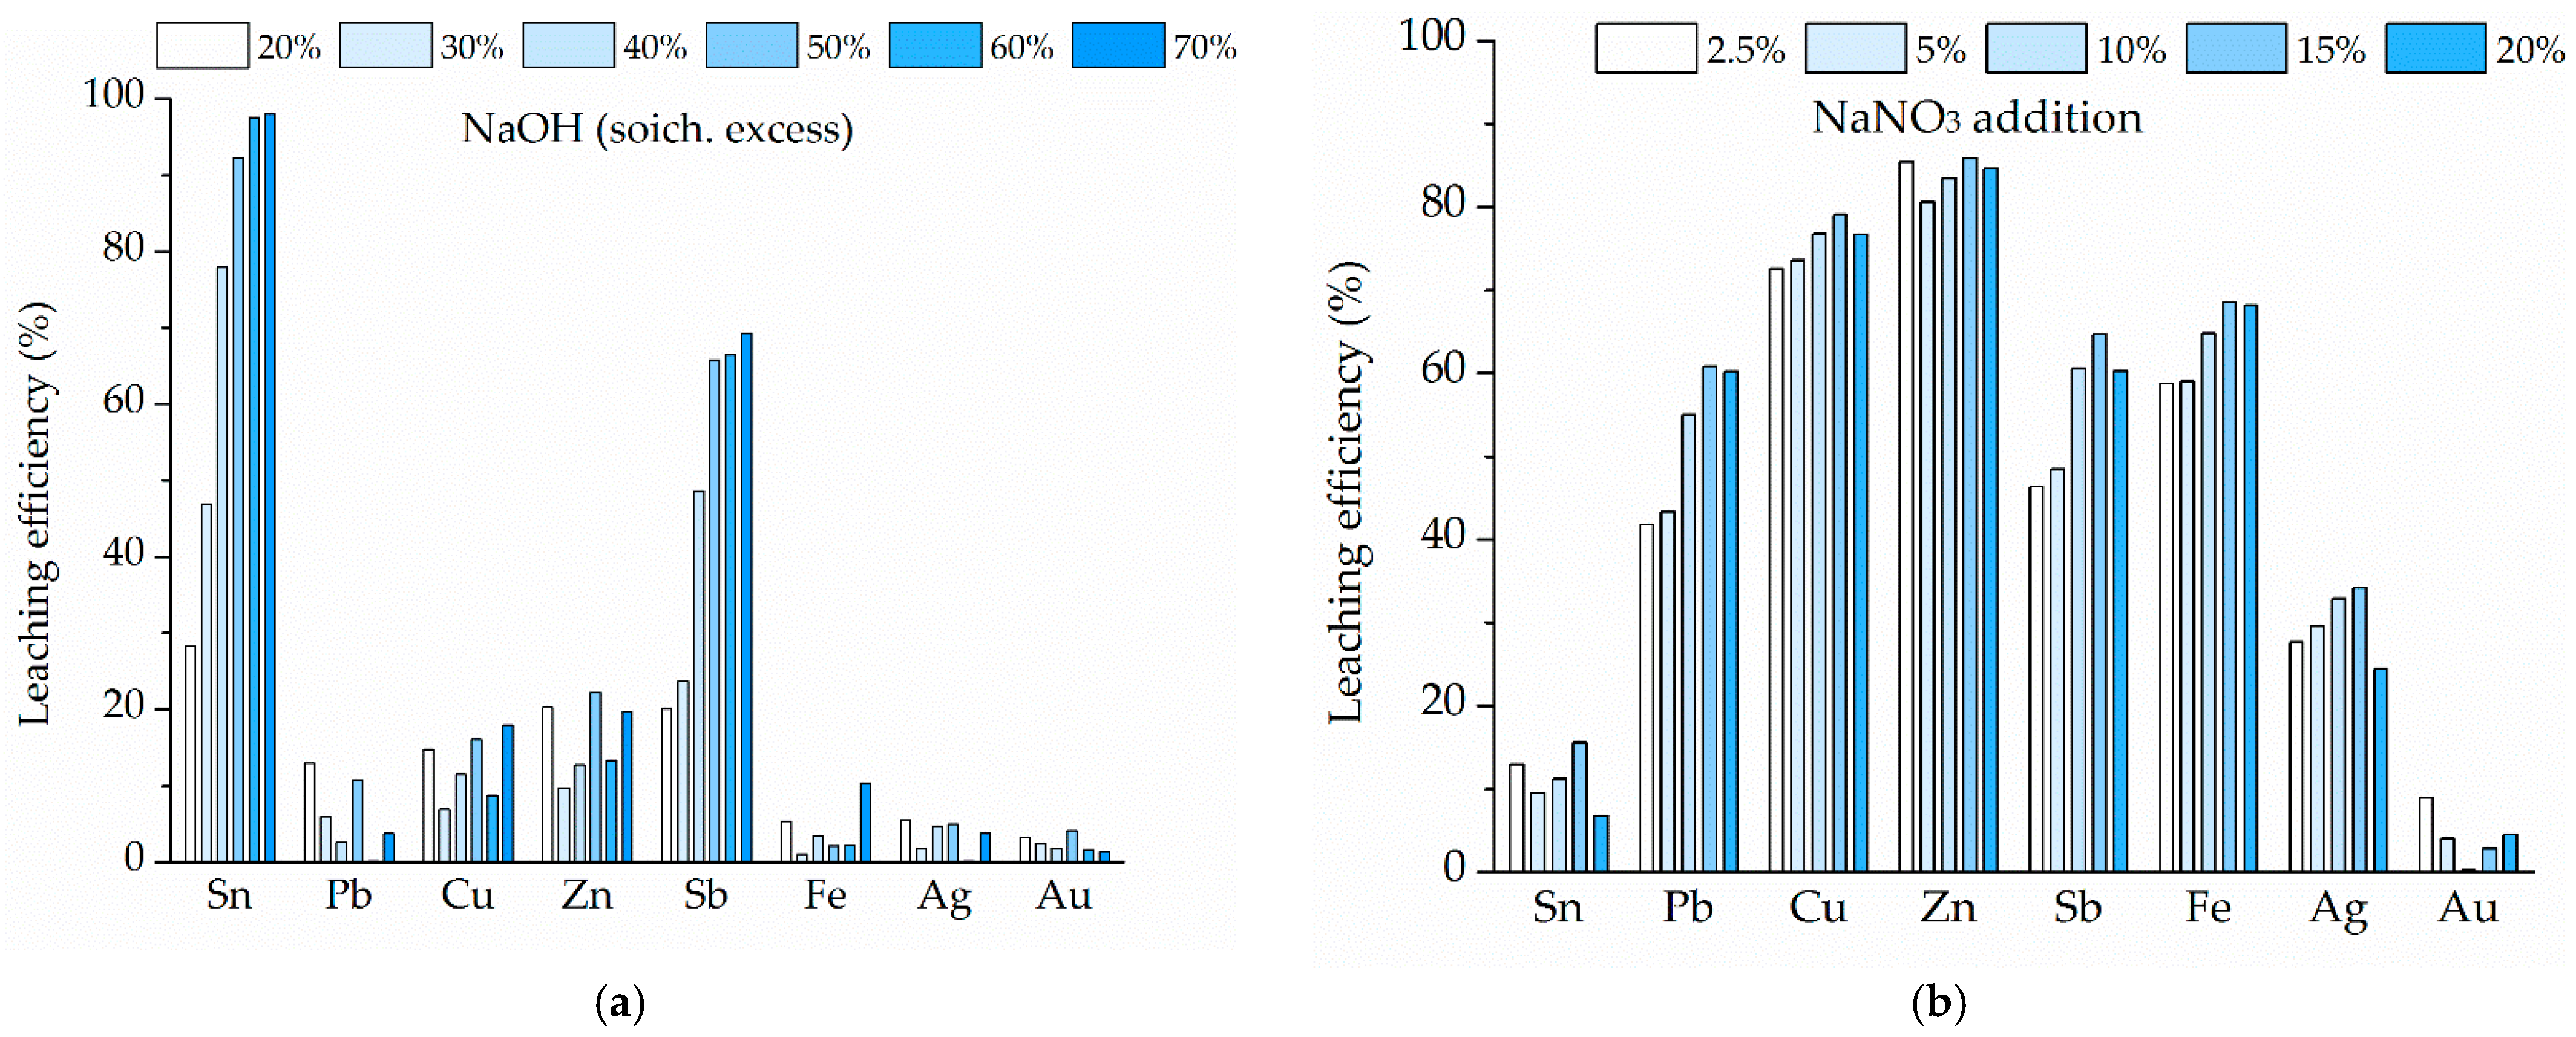
Composition analysis of the solid residues after leaching confirmed that mass losses correlated with a decrease in tin content, indicating that increasing the NaOH in the fusion system enhanced the conversion of tin from stable hydrate oxide (metastannic acid) into water-soluble salts, primarily sodium hexahydroxostannate (Na2Sn(OH)6). This reduction in Sn content was accompanied by a relative increase in the concentration of other metals due to their low solubility. According to the results, the highest tin removal was achieved at CAS:NaOH = 40:60, were the Sn content (as metastannic acid) was reduced to 2.57 wt.% (Table 6). The leaching efficiency for Sn (recalculated according to metastannic acid) reached 97.58% (Figure 6a). A further increase in NaOH content (70 wt.%) resulted in only a marginal improvement in Sn removal (97.99%) but negatively affected the selectivity of the process (Figure 6b–h). Under optimal conditions (fusion at 600 °C for 60 min, CAS:NaOH = 40:60; leaching at 80 °C for 60 min, 250 rpm, solid-to-liquid ratio of 200 g/dm3), high selectivity toward tin was achieved. Except for Zn and Sb (Figure 6d,e), the solubility of other metals remained below 10%, with a Pb dissolution of only 0.14% (Figure 6b), indicating effective retention of accompanying metals in the solid residue and enrichment of precious metals (Figure 6g,h). These results are in accordance with the thermodynamic modeling indications.
It should be noted that while thermodynamic modeling predicts sufficient transformation with a stoichiometric excess of NaOH of 50% (relative to Sn and Pb content), it does not account for kinetic limitations, diffusion barriers, the presence of competing metal ions, phase heterogeneity, local interactions, and the presence of inert materials/impurities in real samples. These factors contribute to the experimentally observed requirement for a 60% NaOH excess. Generally, the leaching modeling and experimental data were in accordance.

3.2.2. Influence of NaNO3

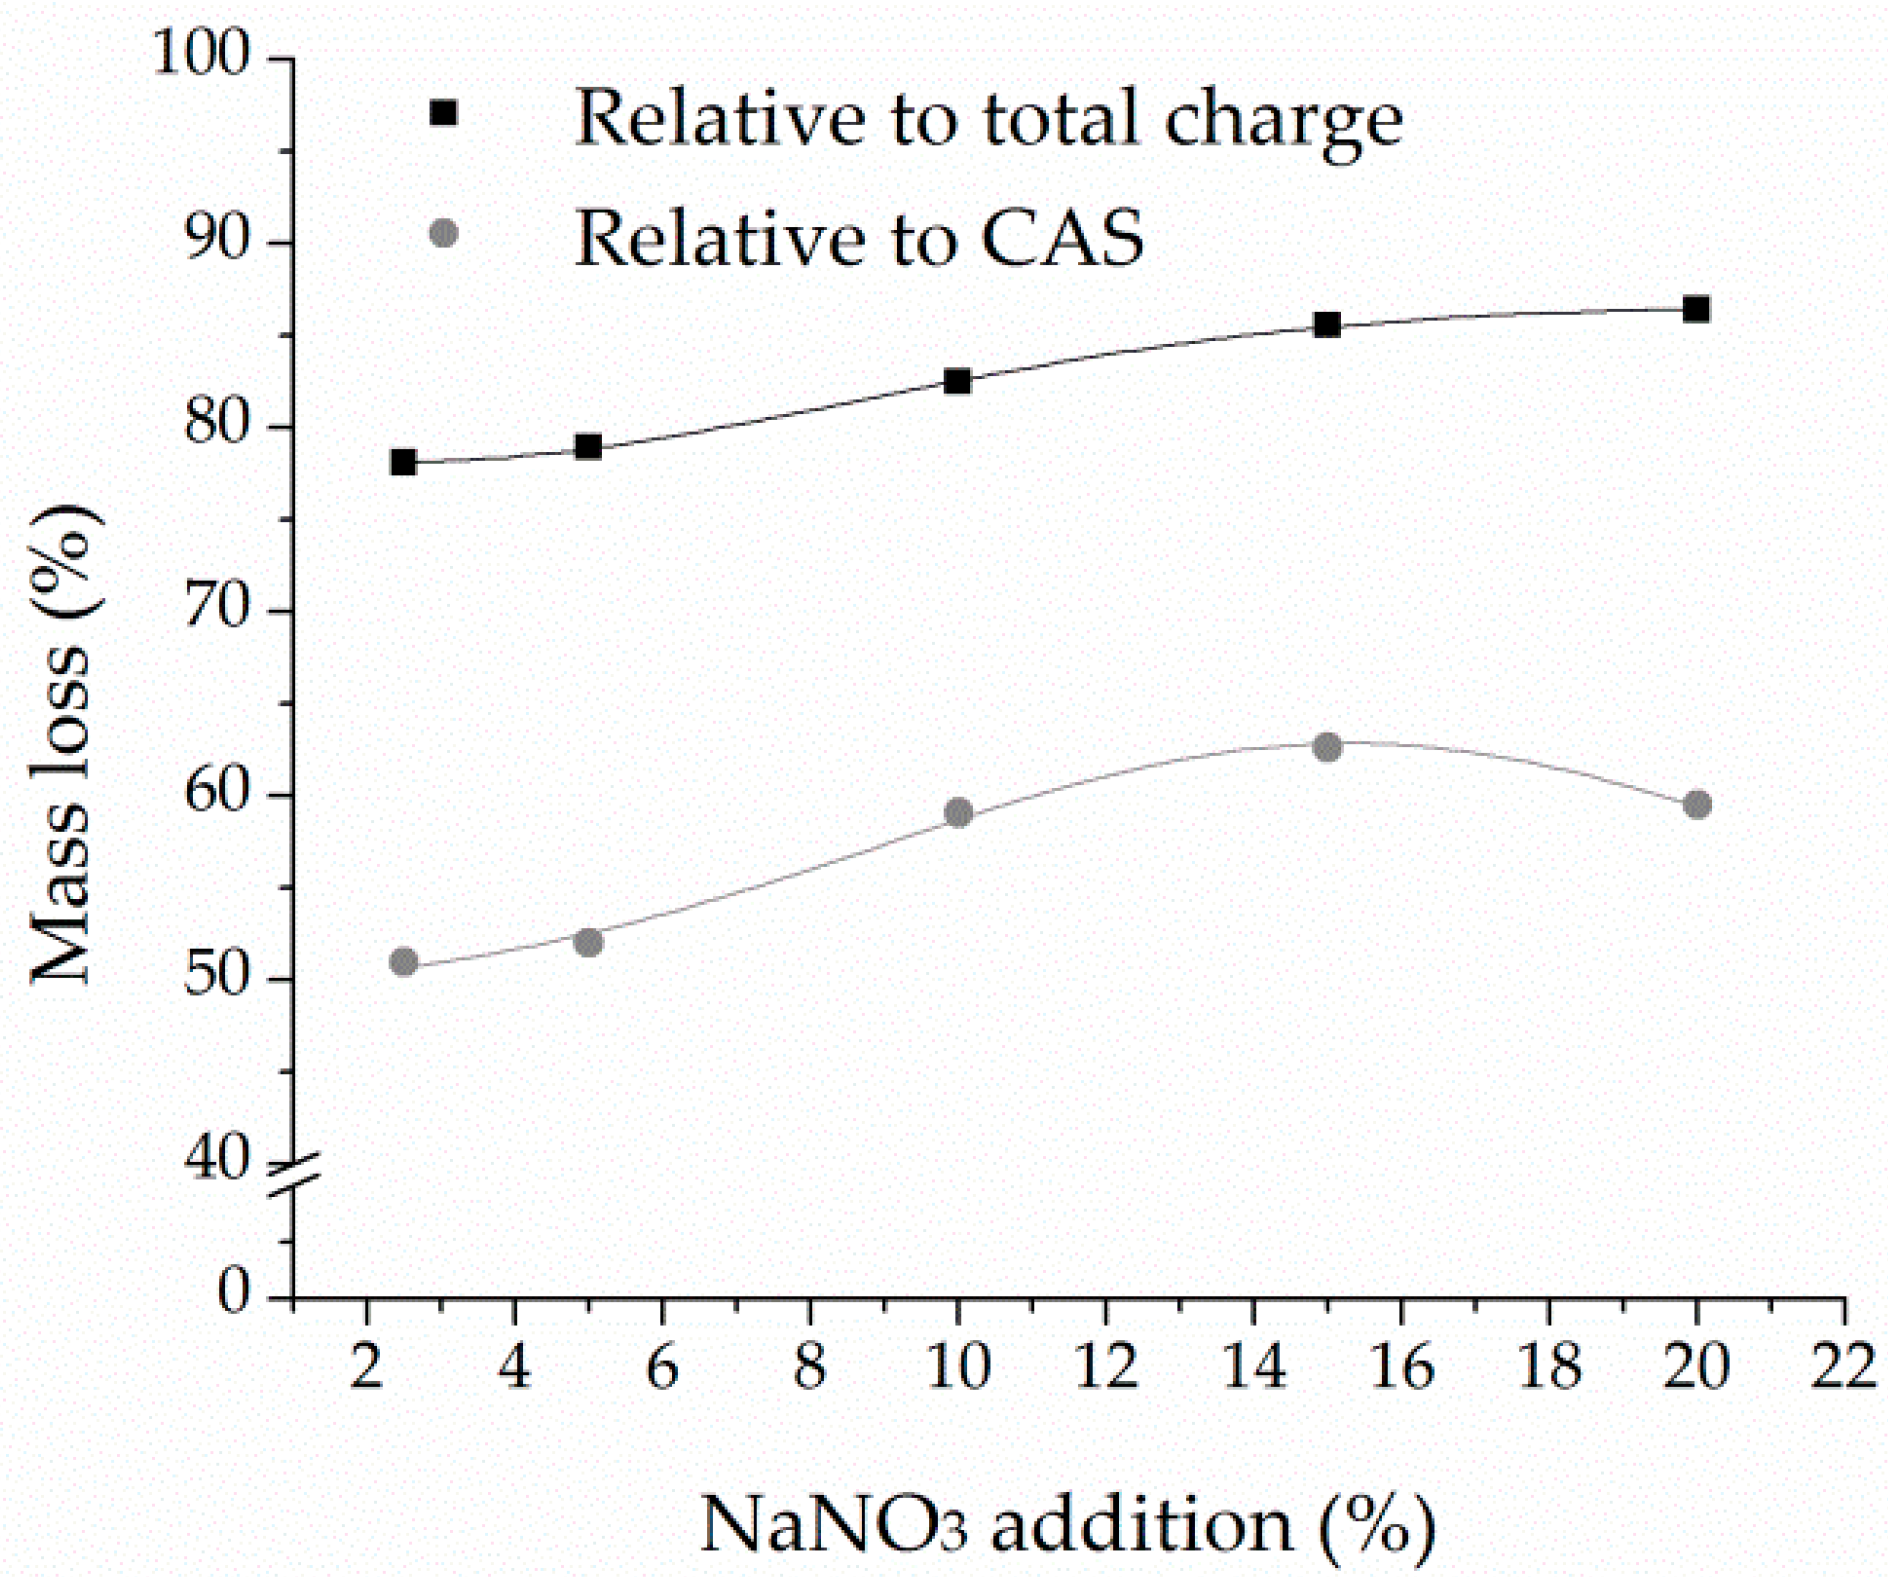
In the second series, the effect of NaNO3 addition (2.5 to 20 wt.% relative to CAS) on the efficiency of compound transformation and the selective removal of metals, primarily tin, from CAS through leaching was investigated. The conditions for fusion and leaching were identical, following the same procedure described earlier. The charge composition of CAS:NaOH = 40:60, previously determined as optimal, was kept constant. The results showing the mass change after leaching as a function of NaNO3 dosage are presented in Figure 7.
In contrast to the CAS–NaOH system, the mass loss after alkali fusion with NaNO3 in the system was higher, ranging from 12.3% to 31.75%, and this can be attributed not only to the crystalline water and partial sulfur loss but also to nitrate decomposition at elevated temperature (results not presented). However, the analysis of solid residues revealed that NaNO3 addition had no significant effect on the overall mass loss after leaching. Within the investigated range, total mass reduction compared to the total fusion charge remained relatively uniform (78–86%), and it was 51–59.5% when calculated per CAS content, indicating a slight increase compared to the NaOH-only system (77.92% and 50.81% for CAS:NaOH = 40:60 and CAS, respectively). These results suggest that the influence of oxidant does not significantly enhance the transformation of stable compounds, primarily metastannic acid, into water-soluble species. This aligns well with the thermodynamic modeling results and with the expected behavior of accompanying metals under the given process parameters.
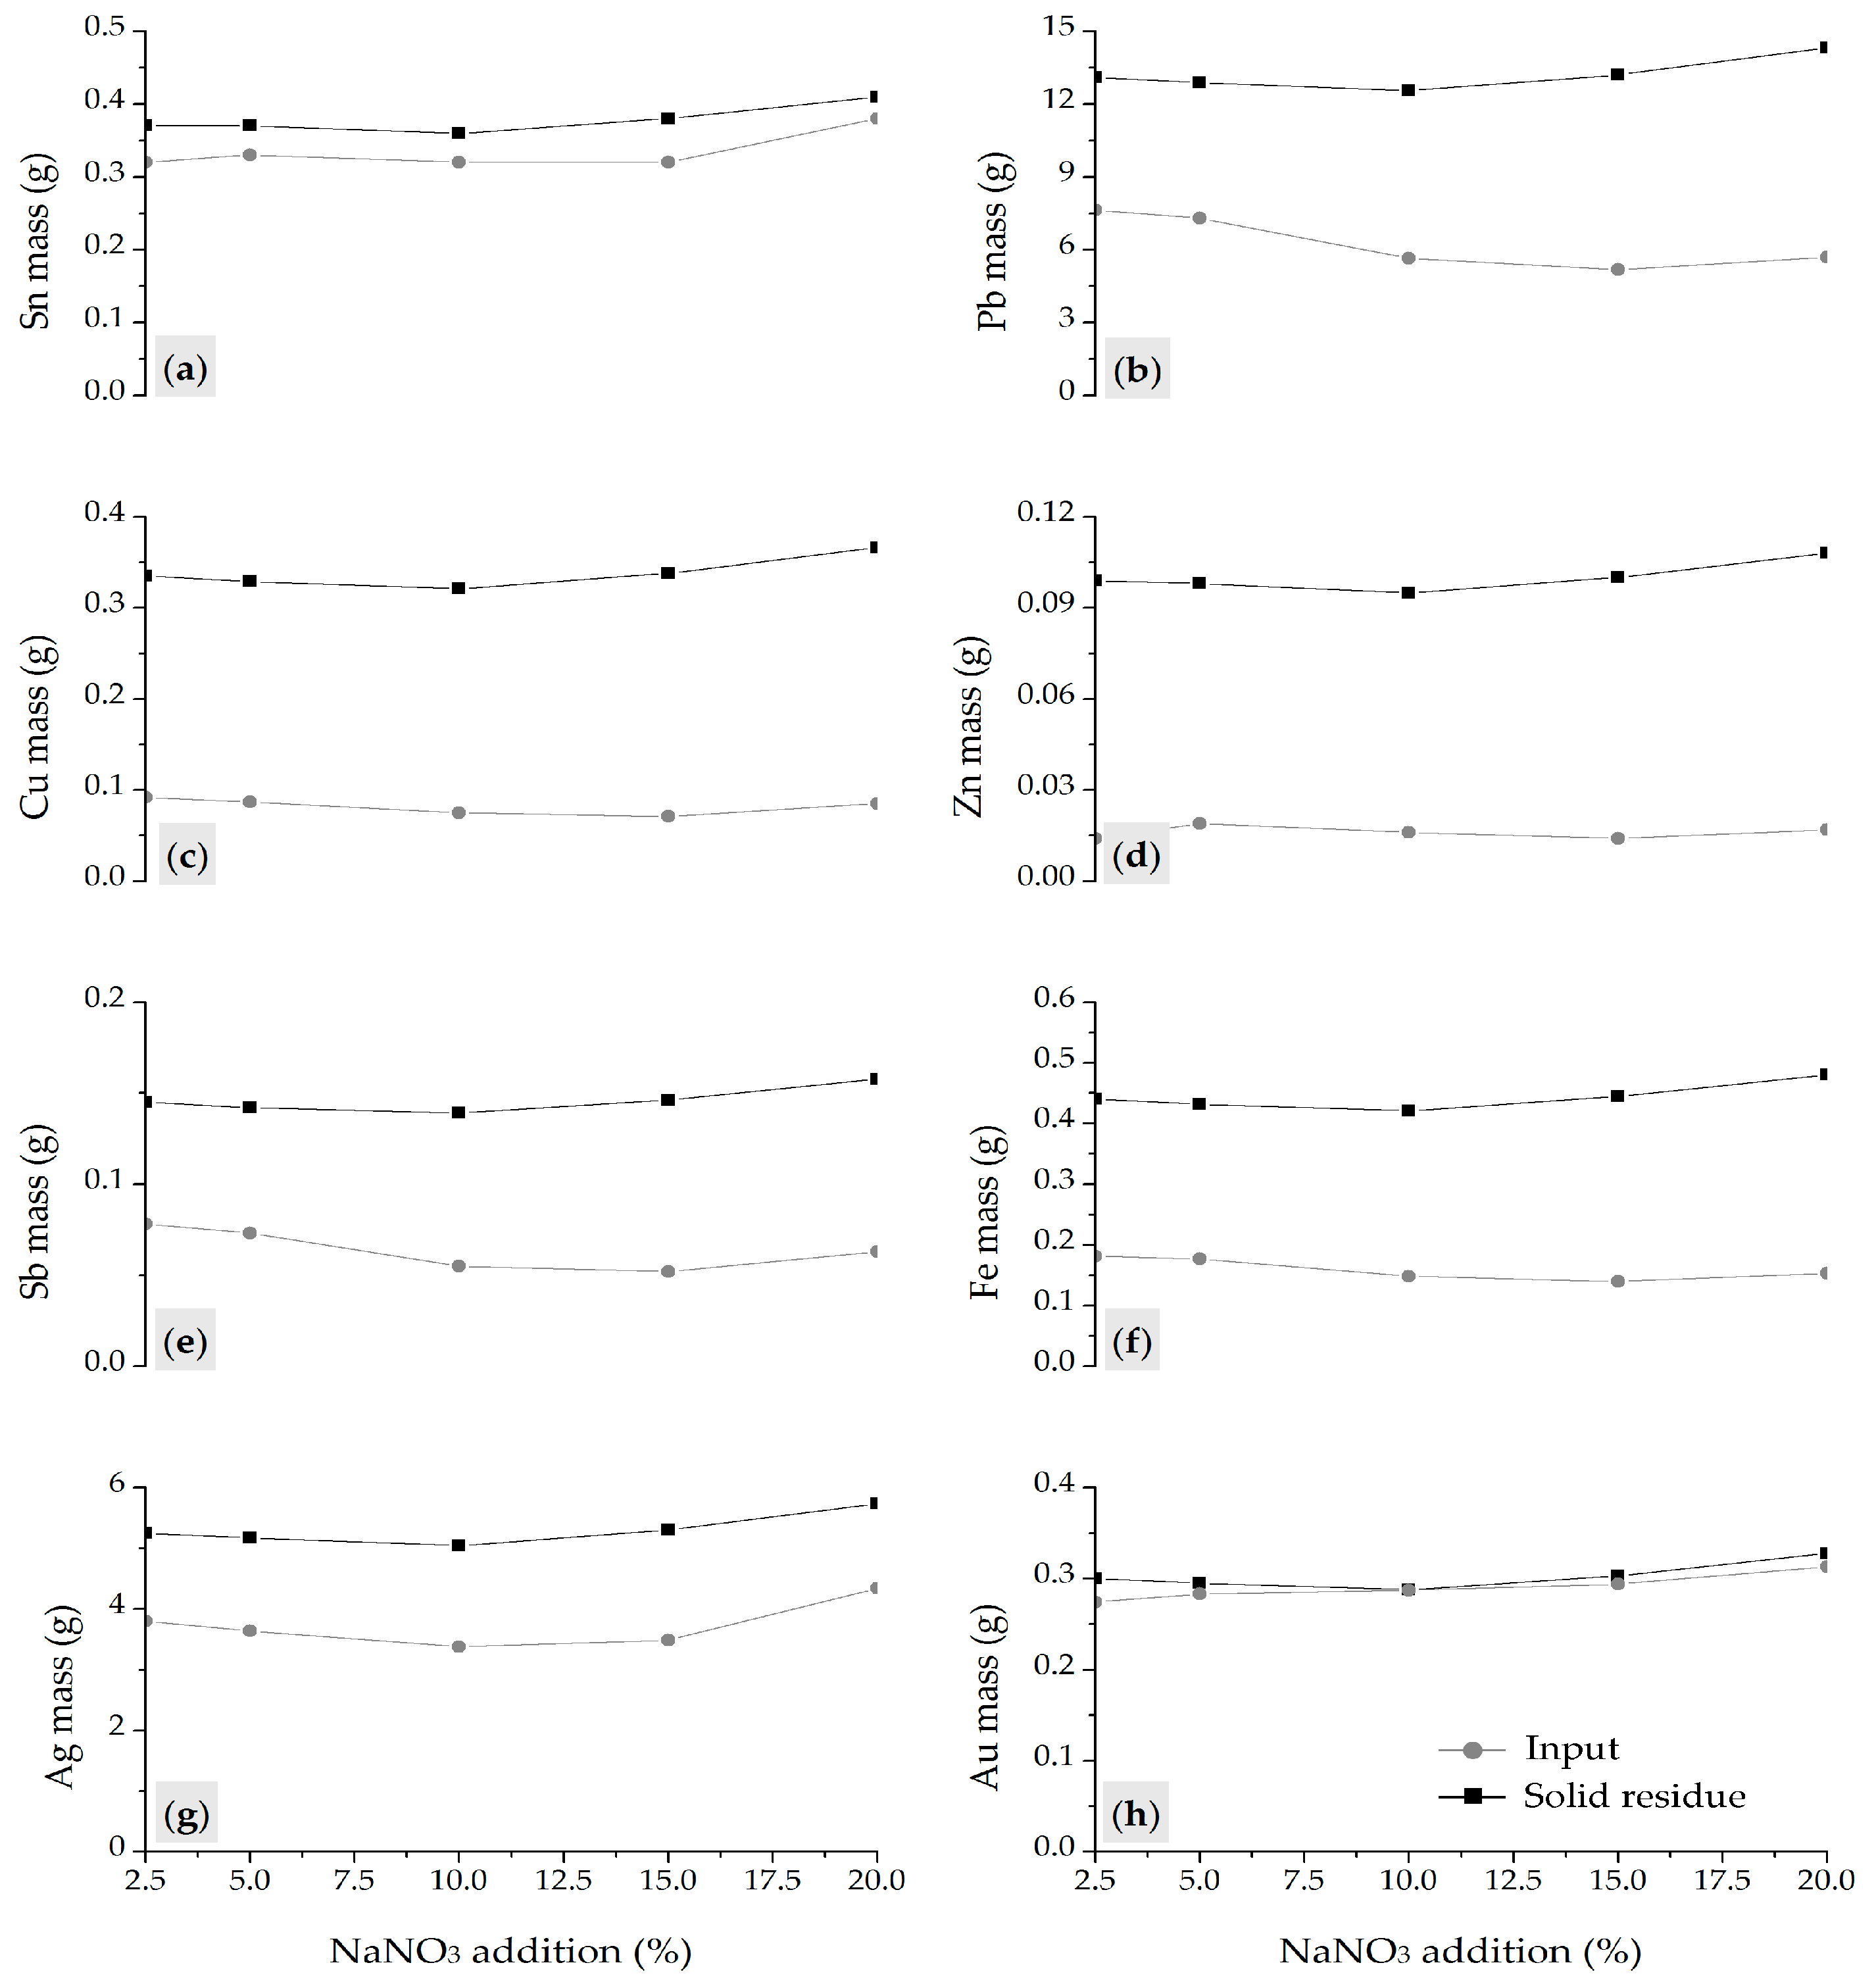
The chemical composition of the solid residues (trace and accompanying elements are not presented) obtained after the leaching of fusion products as a function of NaNO3 addition (Table 7), along with the metal mass balance and leaching efficiency (Figure 8), confirms that the observed mass losses result from the formation of water-soluble compounds of base metals and their co-leaching with tin. In addition, partial decomposition of NaNO3 at elevated temperatures likely generated NO2 and O2. These oxidizing species imply potential NOx emissions under industrial conditions, requiring off-gas treatment. This represents an additional negative aspect of NaNO3 use in the alkali fusion process.
Based on the calculated mass balance and leaching efficiencies, dissolution was particularly prominent for Cu, Zn, and Fe (Figure 8c,d,f), with solubility exceeding 85%, 72%, and 58%, respectively. However, given that these metals accounted for less than 3 wt.% of the non-standard CAS sample, the most significant losses occurred for Pb and Ag (Figure 8b,g), whose contents were considerably higher. Specifically, over 40% of Pb and more than 25% of Ag were converted into soluble species and leached. These results confirm that the addition of NaNO3 to the alkali fusion system does not significantly enhance tin transformation into water-soluble salts (Figure 6a vs. Figure 8a), yet it promotes the formation of soluble nitrate species of accompanying metals, which negatively affects process selectivity and further complicates downstream valorization and overall economic efficiency.
Comparative leaching efficiency for the two tested systems (NaOH in stoichiometric excess relative to Sn and Pb content and NaNO3 addition at the optimal NaOH ratio) is presented for all targeted metals (Figure 9). The results show that Sn removal is highly efficient when NaOH is used as the sole additive (Figure 9a), while the presence of the oxidant (NaNO3) during fusion significantly increases the solubility of base metals in the subsequent leaching step, thus reducing the overall selectivity of the process (Figure 9b).

3.3. Scaled-Up Test

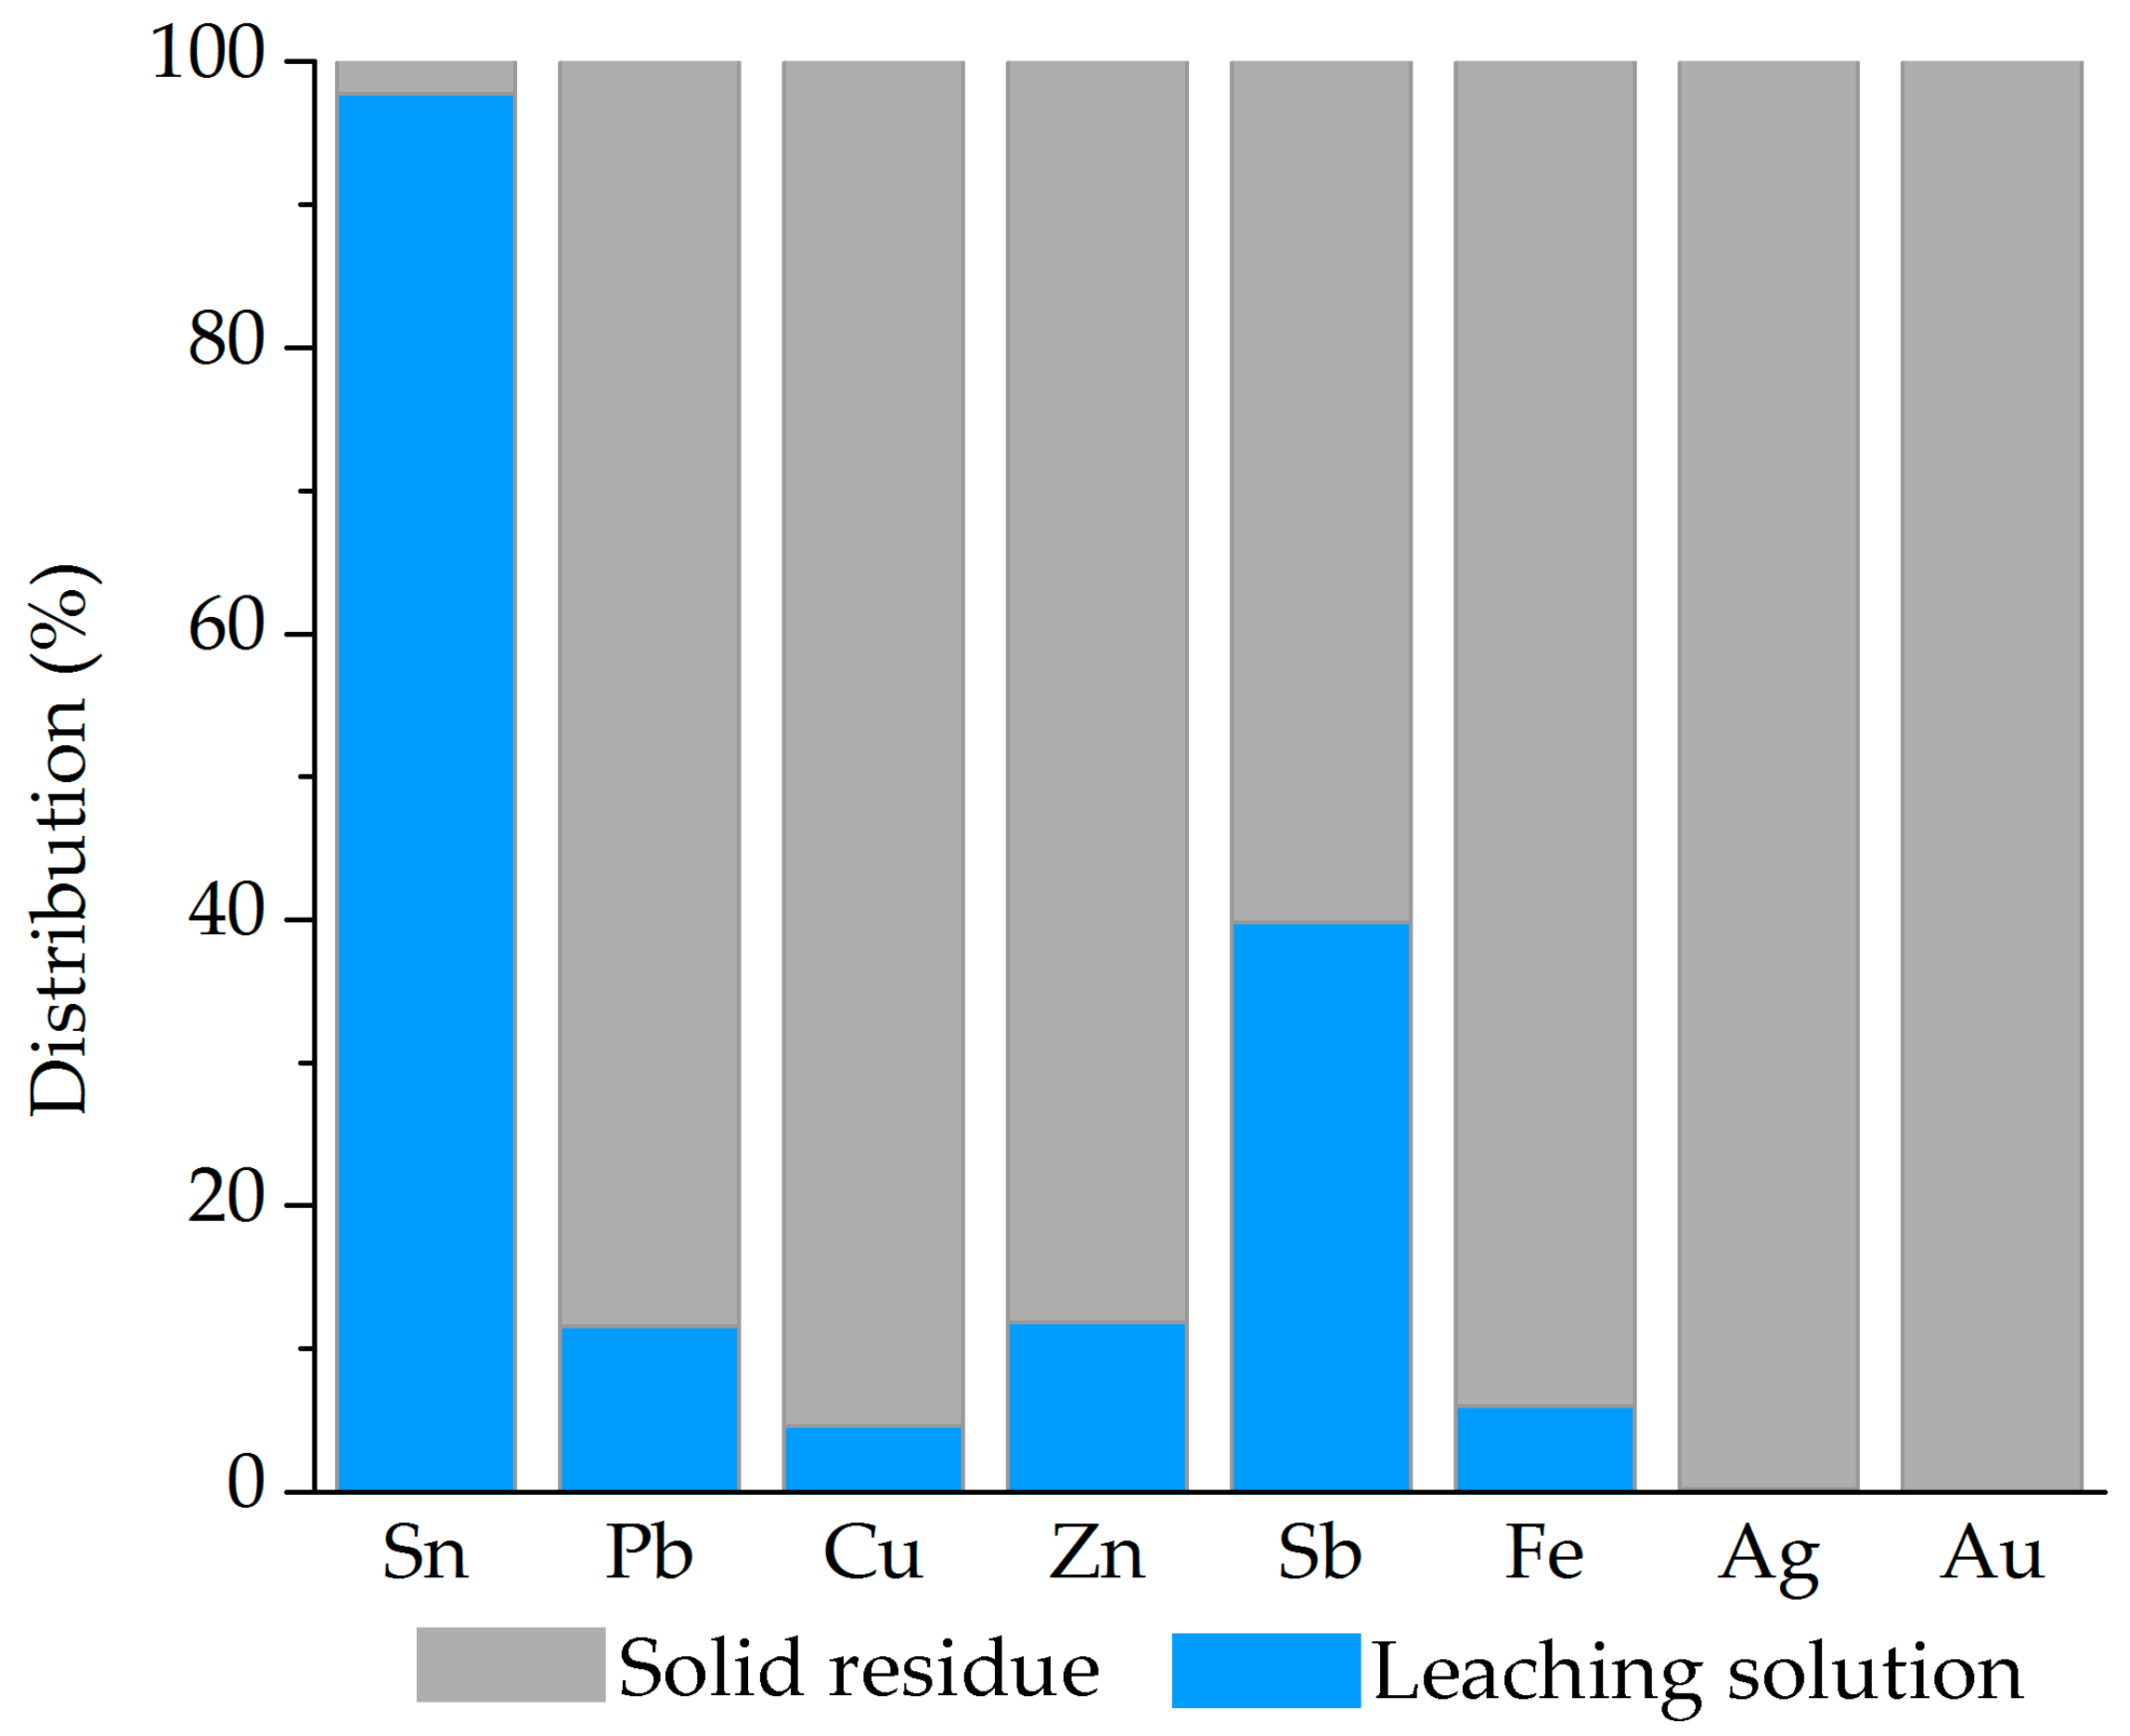
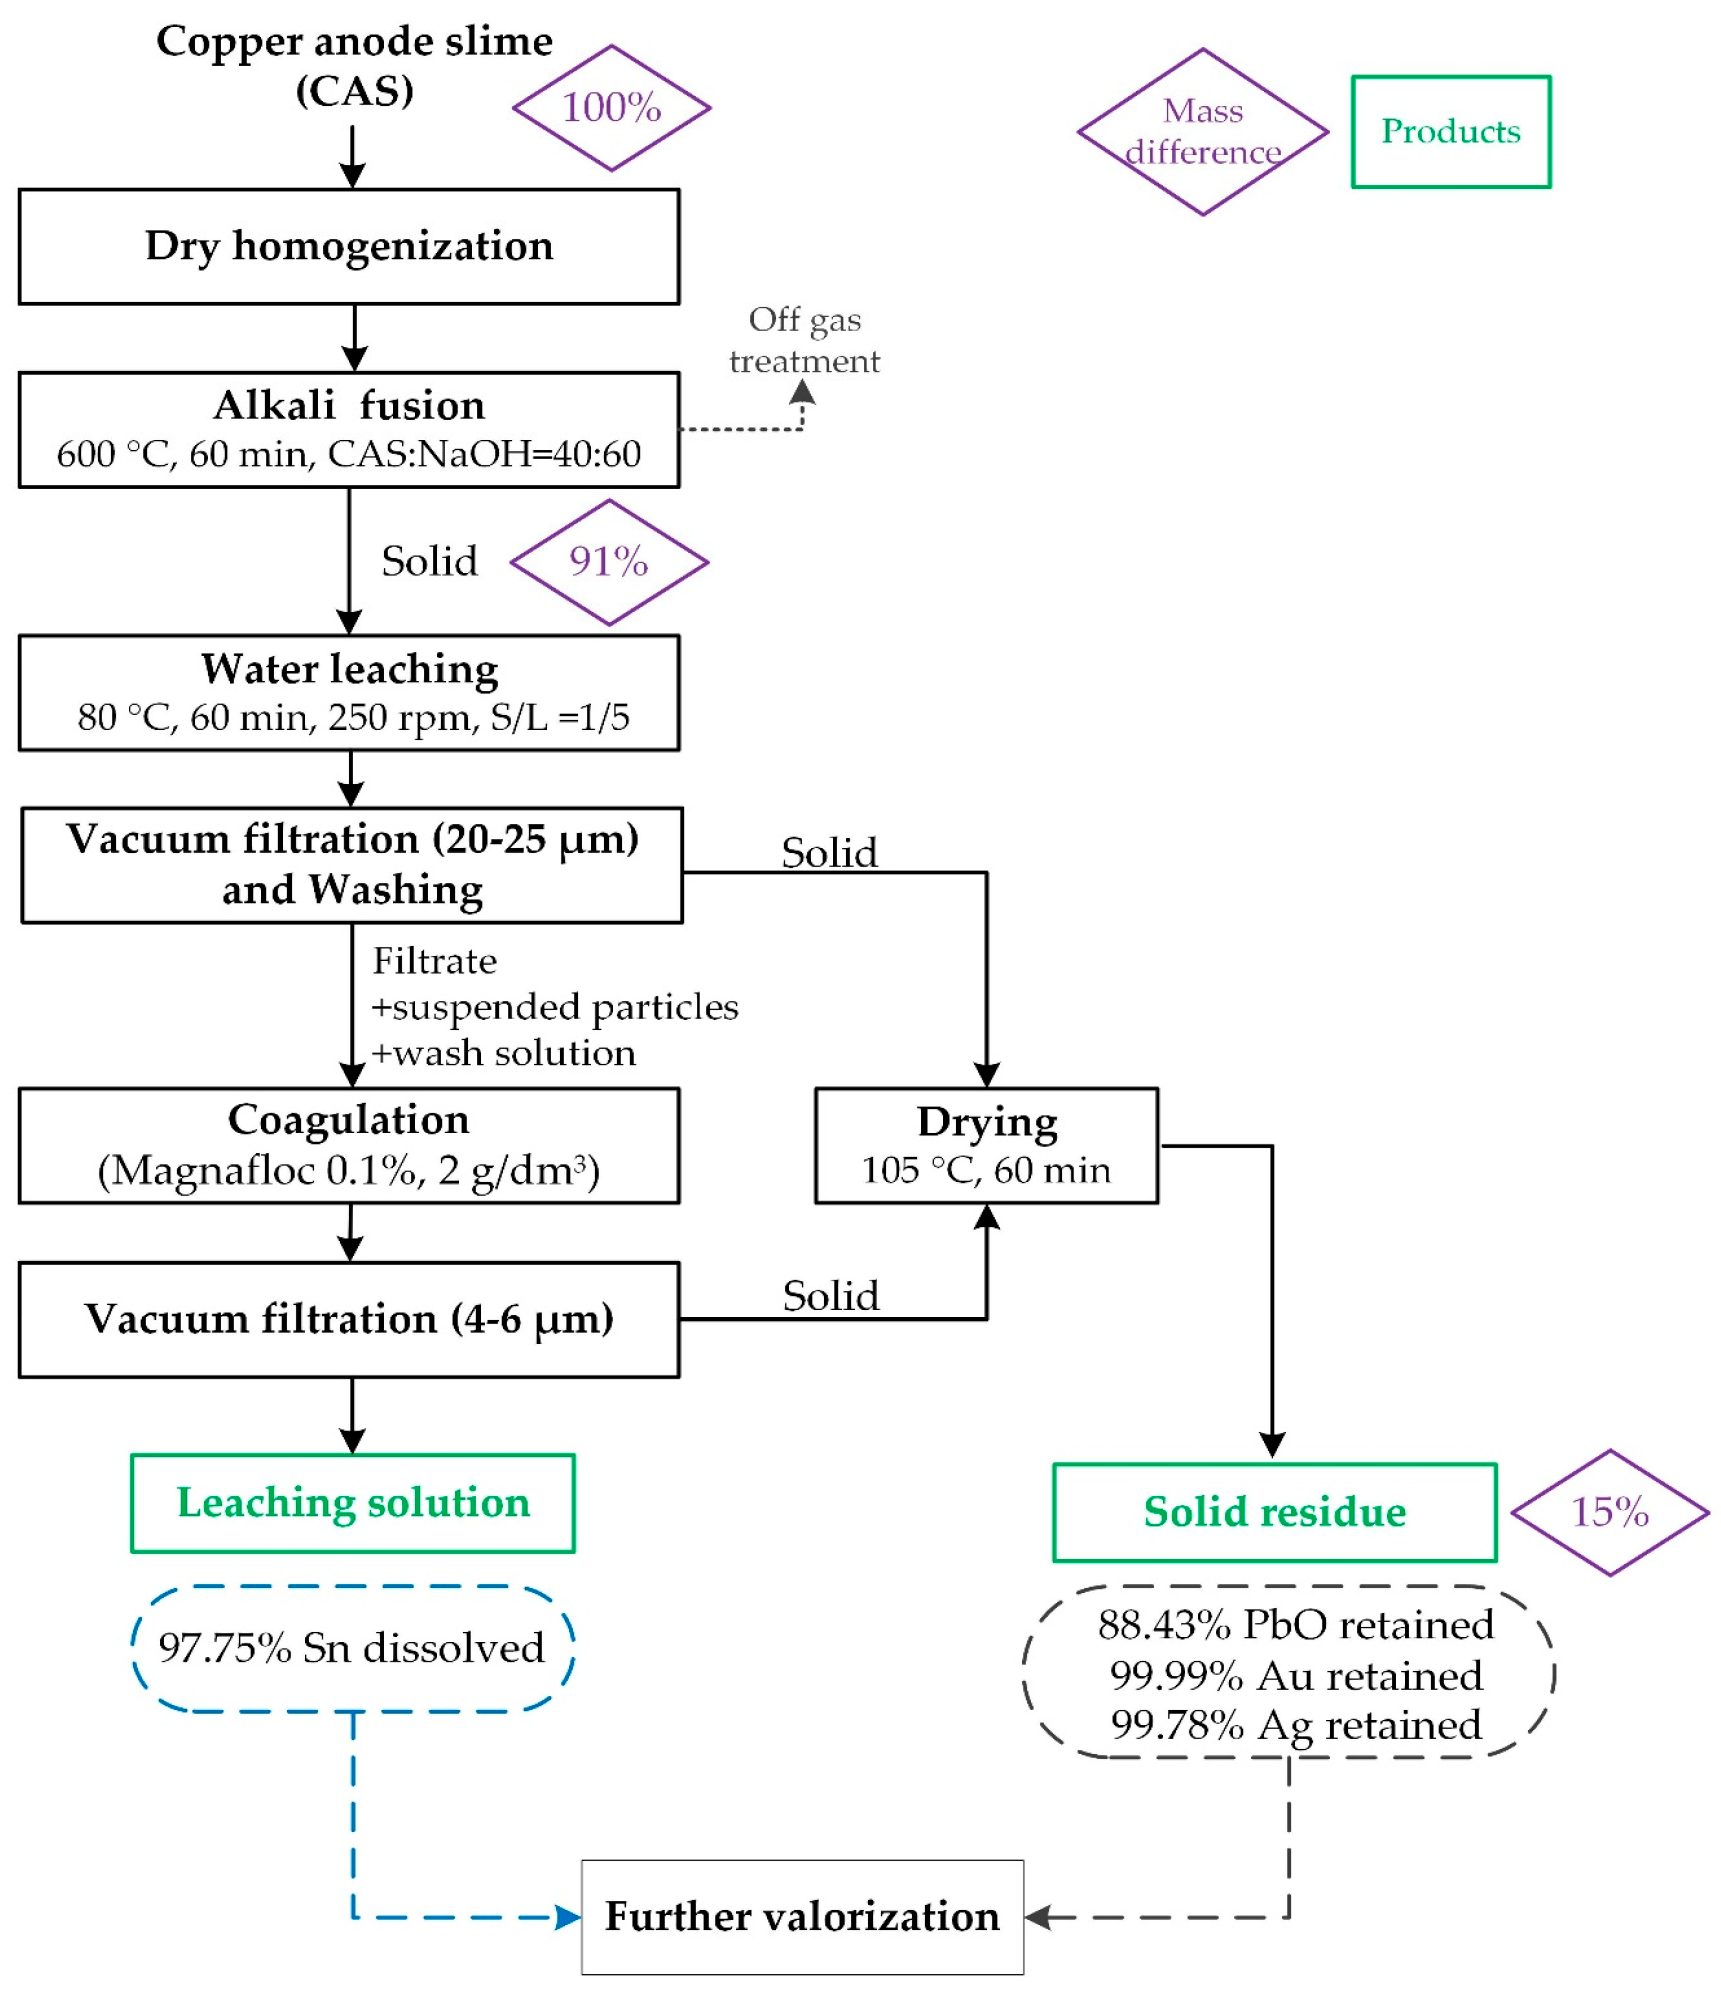
In accordance with the previously described procedures and optimized process parameters (Section 3.2.1), a scaled-up experiment was carried out. The mass loss during alkali fusion was determined to be 8.96%, slightly lower compared to the laboratory-scale optimization test (10.88%). The mass loss after leaching reached 85.33% relative to the total charge or 77.74% relative to the CAS content only. These values indicate slightly higher efficiency compared to the optimization test, where the corresponding losses were 77.92% and 50.81%, respectively (Figure 5). A mass balance for the scaled-up test, including chemical composition and metal distribution (trace and accompanying elements are not presented), was established to illustrate the overall process efficiencies (Table 8, Figure 10, and Supplementary Files Table S1). The overall material balance was calculated based on chemical analysis and the measured masses of the process products. The results confirm process closure within analytical limits and are consistent with the previously reported efficiencies and elemental distributions among the alkali fusion–leaching products.
The scaled-up test confirmed the high selectivity of the applied process, with 97.75% of Sn (as metastannic acid) converted into water-soluble stannate concentrated in the liquid phase. Simultaneously, more than 88.43 wt.% of Pb, 99.99 wt.% of Au, and 99.78 wt.% of Ag remained concentrated in the solid phase. Apart from Sb, which was relatively evenly distributed among the phases, all other base metals were predominantly retained in the solid residue.
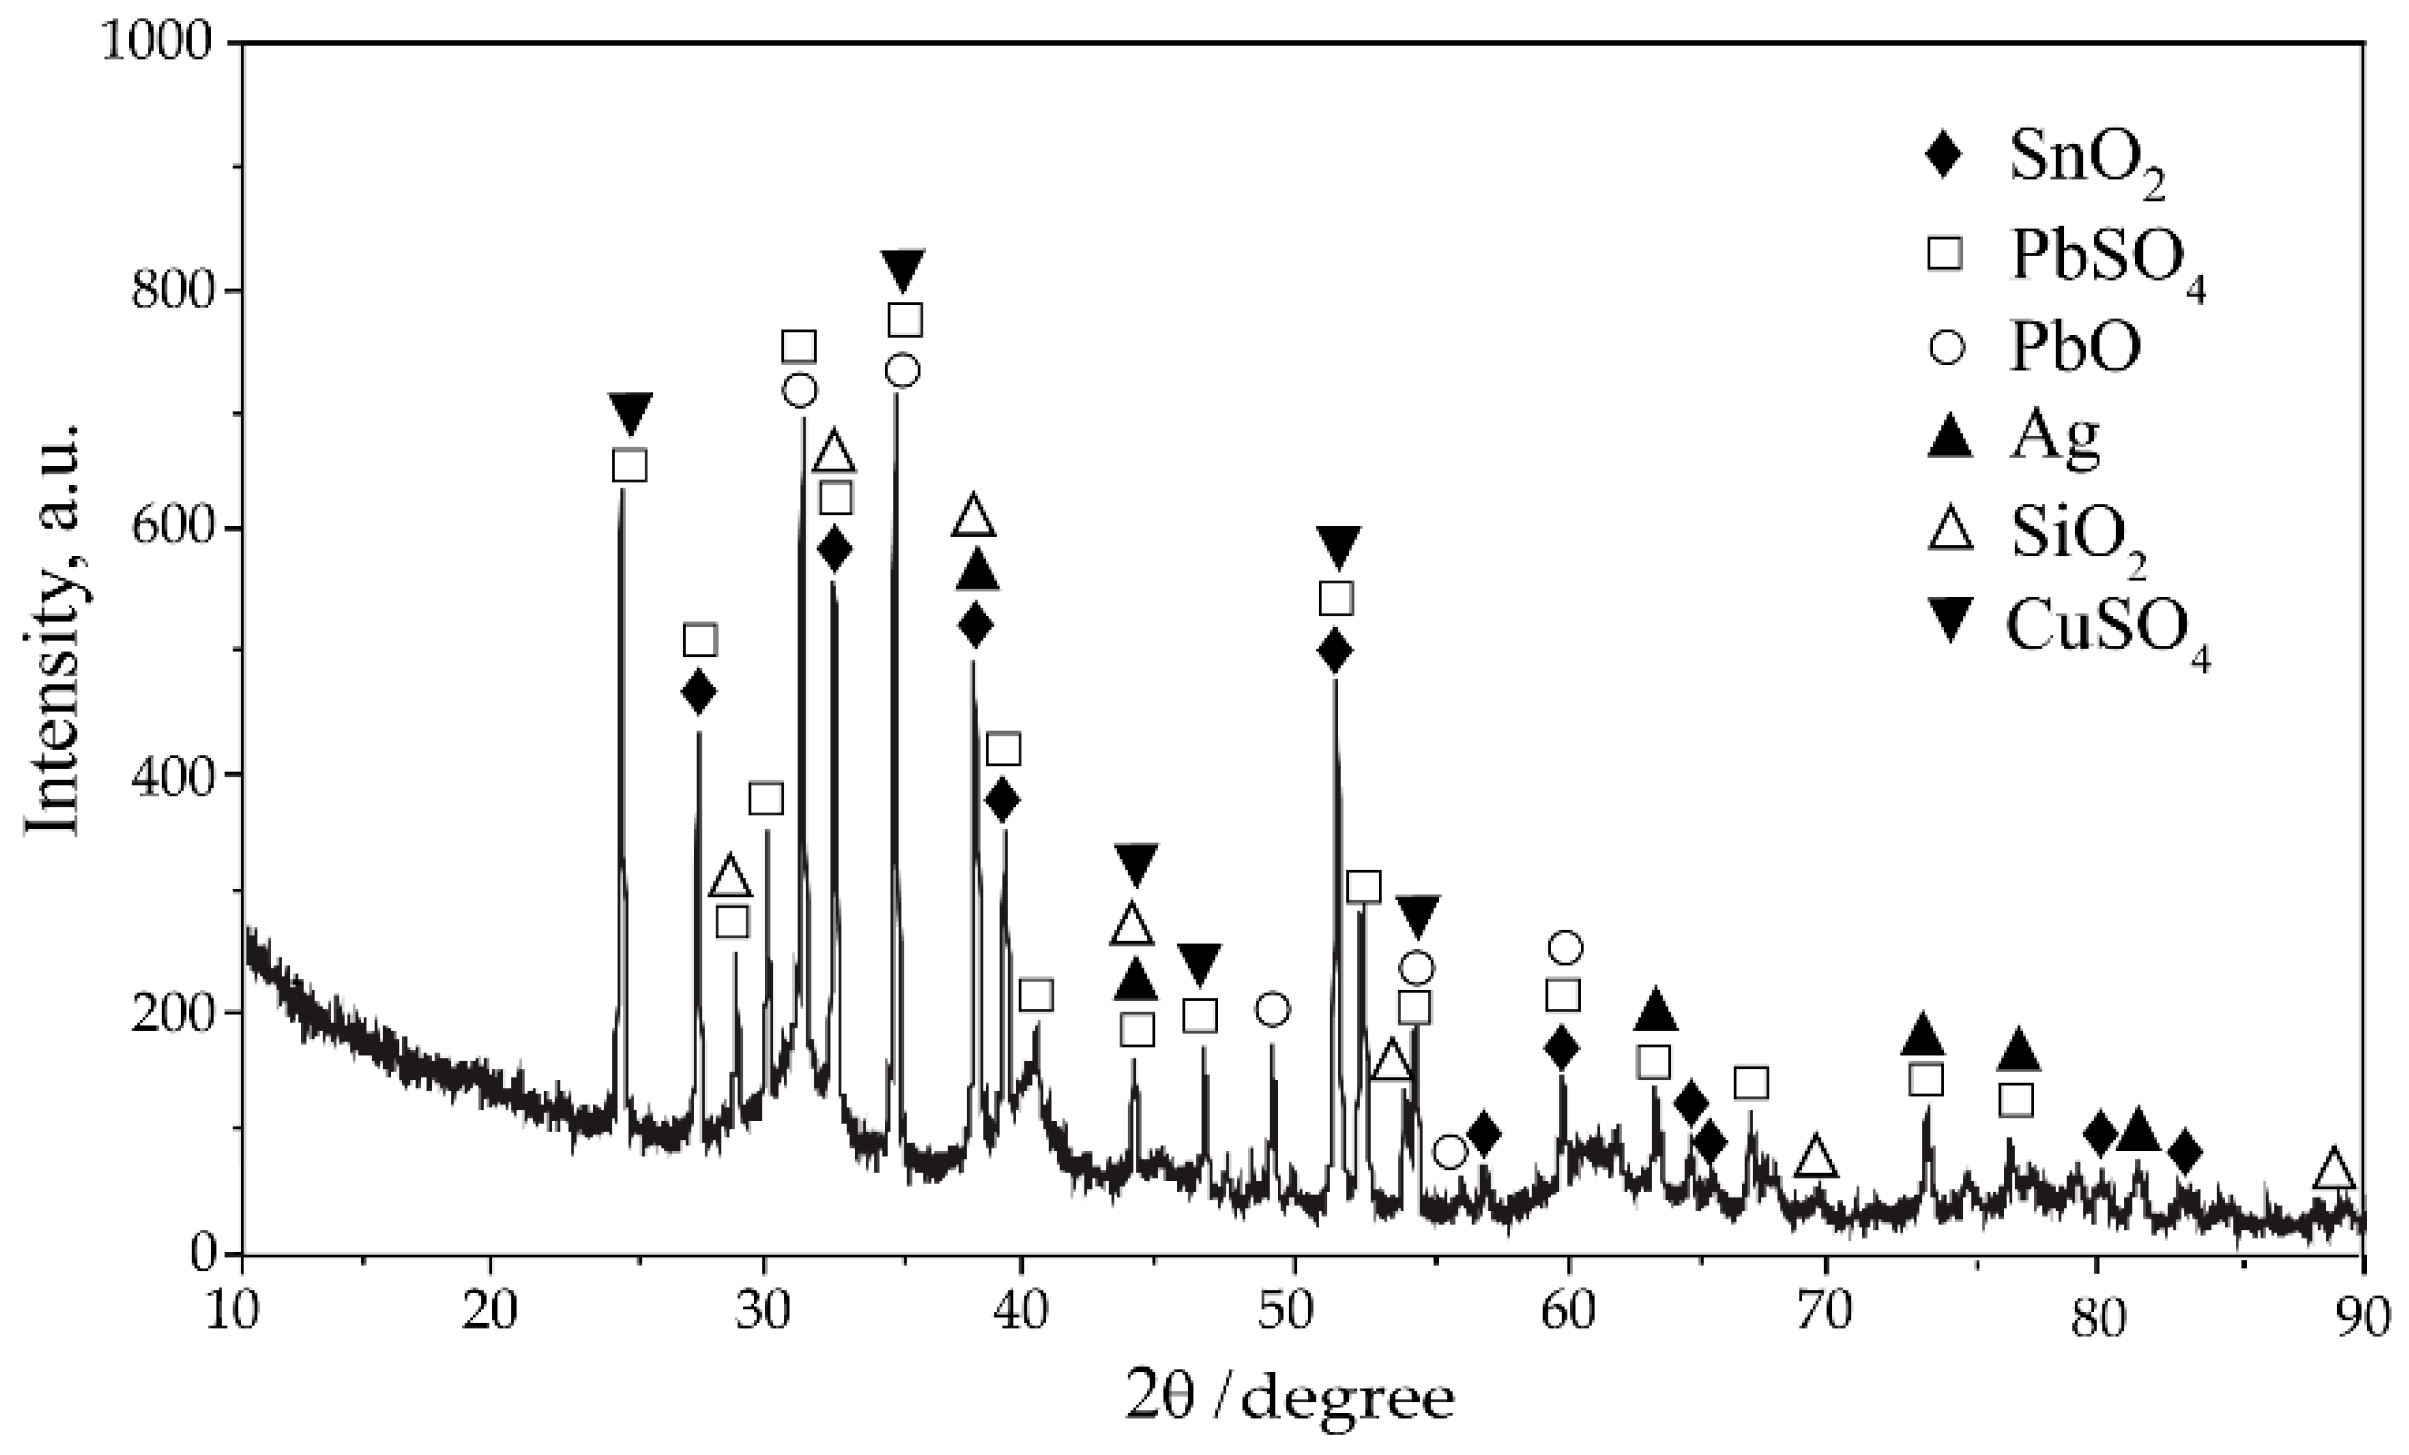
Phase composition analysis of the solid residue (Figure 11) confirmed the presence of PbO, PbO2, Ag, and SnO2 (JCPDS/ICDD no.05-0561, 04-019-9071/04-019-9072, 04-0783, and 04-003-3991, respectively). The dominant phases were lead oxides and metallic Ag, while SnO2 was at the detection limit (~3%). Tin was also partially identified as FeSn2 and Fe2.8Sn0.2O4 (Figure 11b); however, their presence remains uncertain due to overlapping diffraction peaks with Ag. Nevertheless, the detection of such phases is consistent with the assumption that residual Fe and Zn may be present as complex minerals (Cux(Fe, Zn)ySnzOδ), either formed during processing or inherited from heterogeneous input materials and upstream processing. Based on these findings, the solid residue can be considered as a precious metal concentrate in a PbO matrix, making it highly suitable for further valorization.
The presented results, based on thermodynamic modeling, laboratory-scale optimization, and scaled-up validation, do not explicitly account for kinetic factors such as diffusion resistance, sintering, local heterogeneity, or leaching kinetics. However, these effects were experimentally mitigated through system control. The consistency and reproducibility of the results indicate that kinetic limitations were not rate-determining under the applied parameters.
Compared to previously reported alkali fusion and multi-step treatment systems (e.g., 700 °C for 2 h [32], hydroxy–carbonate–nitrate mixtures [33], or oxidative roasting + acid–chloride + soda-roasting [41]), which require higher reagent consumption, prolonged treatment times, or additional acid leaching steps (e.g., H2SO4–H2O2–tartaric acid or acid–sulfide [31]), the NaOH-based process presented here operates under milder conditions (600 °C, 60 min) and employs a single fusion reagent (NaOH) without oxidants or acids for leaching. In contrast to complex routes, the proposed two-step process achieves comparable Sn transformation and dissolution (97.75%) with >99% retention of precious metals in the solid residue, demonstrating high selectivity while requiring no extensive pre-treatment, multiple fusion additives, or secondary leaching steps. The simplified chemical inventory, lower reagent and thermal input, and validated scale-up performance underline the quantitative and operational advantages of this optimized route.

3.4. Downstream Valorization and Environmental Considerations

Following the alkali fusion–leaching step, the sodium-stannate-rich solution may be further processed to produce marketable tin products. Although detailed quantification of these downstream steps is beyond the present scope, the considerations discussed are based on available literature data. It has been demonstrated that precipitation with CaO can convert soluble Na2SnO3 into solid CaSnO3 with an efficiency exceeding 99% [42], offering a low-cost and low-pollution route for producing tin compounds while simultaneously neutralizing the alkaline solution. Electrochemical processes, including electrolysis and sponge-tin extraction in alkaline media, further support the feasibility of tin recovery from stannate solutions [43]. In their study, Zhu et al. [32] proposed tin recovery by neutralization to pH 1.82, achieving 99.9% efficiency. It is important to note that the leaching solution could be recirculated, leading to an increased concentration of dissolved elements, primarily tin, which would facilitate and potentially improve the economic efficiency of downstream valorization steps.
The PbO-based solid residue enriched in precious metals could be further treated by conventional cupellation to recover noble metals, representing an efficient and established metallurgical route for downstream valorization [44]. Another possibility is acid leaching followed by precious metal precipitation and reduction to the metallic form [24].
In line with recent comparative reviews and LCA insights on CAS processing [45], the avoidance of nitrates/chlorination and the use of moderate operating conditions support a lower hazard potential. The cited study demonstrated that reagent and energy intensities, as well as waste streams, can substantially influence environmental impacts. In this context, for the optimized oxidant-free alkali fusion and water leaching route proposed in the present study, NaOH consumption equals 1.5 kg per 1.0 kg of non-standard CAS. The absence of supplemental additives and minimal number of process steps with a simple apparatus configuration suggest reduced secondary emissions (e.g., NOx emission occurring if NaNO3 is used as an oxidant) and lower material throughput compared to multi-step hybrid flowsheets. A compact comparison of operating conditions and reagent intensity is provided in the Supplementary Files (Table S2).
Although a full LCA was not executed to benchmark this route against established processes, the simplified material balance, metal distribution, and high recoveries position the proposed route favorably from a preliminary sustainability perspective. However, conducting a comprehensive life-cycle assessment for such a complex and compositionally heterogeneous secondary material remains methodologically challenging, as variability in composition and undefined system boundaries hinder direct comparison with standardized processing routes. Considering that non-standard CAS contains substantial metal value, with significant amounts of both base and precious metals, even small quantities of this material represent considerable worth. Therefore, each improvement in recovery efficiency provides measurable resource and environmental benefits.
Based on the proposed integrated process for alkali fusion–leaching of non-standard copper anode slime (CAS) and the obtained results, a process flow sheet with overall efficiencies was developed (Figure 12). The proposed process resulted in the distribution of metals into two distinct phases: (i) a tin-rich liquid phase and (ii) a solid PbO concentrate enriched with precious metals.

4. Conclusions

In this study, a clear correlation between alkali fusion parameters, phase transformations, and leaching efficiency for a non-standard CAS with a complex chemical and phase composition that challenges conventional recovery routes has been established. The application of an integrated thermodynamic modeling, laboratory optimization, and scaled-up validation approach to non-standard CAS enabled a distinct separation of metals, where tin was selectively dissolved into the liquid phase, while lead and precious metals were concentrated in the solid product, demonstrating validated scalability.
Thermodynamic modeling provided insight into the transformation behavior of key components and the optimal conditions for both the fusion and leaching steps. The correspondence between the modeling and experimental results confirms the overall process selectivity and supports the experimental observation. Minor deviations between the modeling and experimental results are attributed to the complexity of the system and the use of a real sample in the laboratory tests.
The optimized two-step process involved fusion at 600 °C for 60 min with a CAS:NaOH ratio of 40:60, followed by leaching at 80 °C for 60 min at 250 rpm, with a solid-to-liquid ratio of 200 g/dm3. High metal separation efficiency was achieved, with 97.58% of Sn leached, while Pb and precious metals remained in the solid residue. Additionally, accompanying base metals (Cu, Fe, Zn, and Sb) showed low solubility under optimal conditions, contributing to process selectivity.
The addition of NaNO3 as an oxidant negatively affected the process by increasing the dissolution of base metals, promoting partial dissolution of Ag and Pb, and hindering the transformation of tin into soluble species. These results are in accordance with thermodynamic modeling, confirming reduced process efficiency and low selectivity in the presence of nitrate within the fusion system.
The proposed process was successfully validated through a scaled-up laboratory test, achieving 97.78% Sn dissolution and more than 99.99% of Au and 99.78% of Ag retention in the PbO-based solid residue, confirming the feasibility and reproducibility of the method. These findings define a selective, efficient, and scalable pyro-hydrometallurgical route for the recovery of tin and precious metals from non-standard CAS, addressing industrial needs related to increased e-waste co-processing and providing a framework which aligns with sustainable resource utilization.
Supplementary Materials

The following supporting information can be downloaded at: https://www.mdpi.com/article/10.3390/met15121308/s1, Figure S1: Calculated thermodynamic parameters for reactions of CAS phases with NaOH: (a) ΔHθ, (b) ΔSθ, and (c) ΔGθ; Figure S2: Calculated thermodynamic parameters for reactions of CAS–NaOH–NaNO3: (a) ΔHθ, (b) ΔSθ, and (c) ΔGθ; Table S1: General mass balance of scaled-up test; Table S2: Comparative overview of the proposed alkali fusion–leaching process versus benchmark CAS treatment routes, including a preliminary environmental indicator 1.

Author Contributions

Conceptualization, J.D. and Ž.K.; Methodology, N.G. and S.D.; Validation, J.D., N.G. and Ž.K.; Formal Analysis, D.R. and M.Š.; Data Curation, N.G., S.D. and N.V.; Writing—Original Draft Preparation, J.D.; Writing—Review and Editing, S.D., D.R. and N.V.; Visualization, N.G. and M.Š.; Supervision, Ž.K. All authors have read and agreed to the published version of the manuscript.

Funding

This work was financially supported by the Ministry of Science and Technological Development and Innovation of the Republic of Serbia (Contract Nos. 451-03-136/2025-03/200288, 451-03-136/2025-03/200287, and 451-03-136/2025-03/200023).

Data Availability Statement

The original contributions presented in this study are included in the article/Supplementary Materials. Further inquiries can be directed to the corresponding author.

Acknowledgments

The expertise on the alkali fusion process provided by Milisav Ranitović is highly appreciated.

Conflicts of Interest

Author Jovana Djokić was employed by the company Innovative Center of the Faculty of Chemistry in Belgrade Ltd. Authors Nataša Gajić, Dragana Radovanović, Marija Štulović, and Stevan Dimitrijević were employed by the company Innovation Center of the Faculty of Technology and Metallurgy in Belgrade Ltd. The remaining authors declare that the research was conducted in the absence of any commercial or financial relationships that could be construed as a potential conflict of interest.

Abbreviations

The following abbreviations are used in this manuscript:
CASCopper Anode Slime
e-wasteElectronic Waste
JCPDS/ICDDJoint Committee on Powder Diffraction Standards/International Centre for Diffraction Data
ICP-OESInductively Coupled Plasma–Optical Emission Spectroscopy
XRFX-ray Fluorescence
XRDX-ray Diffraction

References

  1. Forti, V.; Baldé, C.P.; Kuehr, R.; Bel, G. The Global E-Waste Monitor 2020; United Nations University (UNU)/United Nations Institute for Training and Research (UNITAR)—Co-Hosted SCYCLE Programme: Bonn, Germany; International Telecommunication Union (ITU): Geneva, Switzerland; International Solid Waste Association (ISWA): Rotterdam, The Netherlands, 2020; ISBN 978-92-808-9114-0. [Google Scholar]
  2. Sverdrup, H.U.; Ragnarsdottir, K.V. A System Dynamics Model for Platinum Group Metal Supply, Market Price, Depletion of Extractable Amounts, Ore Grade, Recycling and Stocks-in-Use. Resour. Conserv. Recycl. 2016, 114, 130–152. [Google Scholar] [CrossRef]
  3. Sokić, M.; Marković, B.; Stanković, S.; Kamberović, Ž.; Štrbac, N.; Manojlović, V.; Petronijević, N. Kinetics of Chalcopyrite Leaching by Hydrogen Peroxide in Sulfuric Acid. Metals 2019, 9, 1173. [Google Scholar] [CrossRef]
  4. Tesfaye, F.; Shen, L.; Moroz, M.; Demesa, A.G. Extraction and Recovery of Valuable Metals from Waste and Mineral Materials: Editorial Review. Processes 2025, 13, 359. [Google Scholar] [CrossRef]
  5. Moosavi-Khoonsari, E.; Tripathi, N. Copper Anode Slime Processing with a Focus on Gold Recovery: A Review of Traditional and Recent Technologies. Processes 2024, 12, 2686. [Google Scholar] [CrossRef]
  6. Dehghanpoor, M.H.; Zivdar, M.; Torabi, M. Extraction of Copper and Gold from Anode Slime of Sarcheshmeh Copper Complex. J. S. Afr. Inst. Min. Met. 2016, 116, 1153–1157. [Google Scholar] [CrossRef]
  7. Schlesinger, M.E.; Sole, K.C.; Davenport, W.; Alvear, G.R.F.; Schlesinger, M.E. Extractive Metallurgy of Copper, 6th ed.; Elsevier: Amsterdam, The Netherlands, 2022; ISBN 9780128218754. [Google Scholar]
  8. Khakmardan, S.; Rezai, B.; Abdollahzadeh, A.; Ghorbani, Y. From Waste to Wealth: Unlocking the Value of Copper Anode Slimes through Systematic Characterization and Pretreatment. Miner. Eng. 2023, 200, 108141. [Google Scholar] [CrossRef]
  9. González De Las Torres, A.; Moats, M.; Ríos, G.; Rodríguez Almansa, A.; Sánchez-Rodas, D. Removal of Sb Impurities in Copper Electrolyte and Evaluation of As and Fe Species in an Electrorefining Plant. Metals 2021, 11, 902. [Google Scholar] [CrossRef]
  10. Dong, Z.; Jiang, T.; Xu, B.; Yang, J.; Chen, Y.; Li, Q.; Yang, Y. Comprehensive Recoveries of Selenium, Copper, Gold, Silver and Lead from a Copper Anode Slime with a Clean and Economical Hydrometallurgical Process. Chem. Eng. J. 2020, 393, 124762. [Google Scholar] [CrossRef]
  11. Blanco-Vino, W.; Ordóñez, J.I.; Hernández, P. Alternatives for Copper Anode Slime Processing: A Review. Miner. Eng. 2024, 215, 108789. [Google Scholar] [CrossRef]
  12. Xian, J.; Zhu, N.; Zhu, W.; Wang, J.; Wu, P. A Green and Economical Process for Resource Recovery from Precious Metals Enriched Residue of Copper Anode Slime. J. Clean. Prod. 2022, 369, 133341. [Google Scholar] [CrossRef]
  13. Dabkowski, A.; Yusheng, L. The World Copper Factbook; International Copper Study Group: Lisbon, Portugal, 2024. [Google Scholar]
  14. Ilankoon, I.M.S.K.; Dilshan, R.A.D.P.; Dushyantha, N. Co-Processing of e-Waste with Natural Resources and Their Products to Diversify Critical Metal Supply Chains. Miner. Eng. 2024, 211, 108706. [Google Scholar] [CrossRef]
  15. Hait, J.; Jana, R.K.; Sanyal, S.K. Processing of Copper Electrorefining Anode Slime: A Review. Min. Proc. Ext. Met. 2009, 118, 240–252. [Google Scholar] [CrossRef]
  16. Havuz, T.; Dönmez, B.; Çelik, C. Optimization of Removal of Lead from Bearing-Lead Anode Slime. J. Ind. Eng. Chem. 2010, 16, 355–358. [Google Scholar] [CrossRef]
  17. Xing, W.D.; Sohn, S.H.; Lee, M.S. A Review on the Recovery of Noble Metals from Anode Slimes. Min. Proc. Ext. Met. Rev. 2020, 41, 130–143. [Google Scholar] [CrossRef]
  18. Singh Randhawa, N.; Hait, J. Characteristics and Processing of Copper Refinery Anode Slime. In Sustainable and Economic Waste Management; Md Anawar, H., Strezov, V., Abhilash, Eds.; CRC Press: Boca Raton, FL, USA, 2020; pp. 263–288. ISBN 9780429279072. [Google Scholar]
  19. Ali Topçu, M.; Rüşen, A.; Alper Yıldızel, S. High Efficiency Copper Recovery from Anode Slime with 1-Butyl-3-Methyl Imidazolium Chloride by Hybrid Taguchi/Box–Behnken Optimization Method. J. Ind. Eng. Chem. 2023, 120, 261–270. [Google Scholar] [CrossRef]
  20. Furuzono, T.; Fujimoto, A.; Takeuchi, T.; Takebayashi, K. Unique Hydrometallurgical Process for Copper-Anode Slime Treatment at Saganoseki Smelter and Refinery. In Extraction 2018; Davis, B.R., Moats, M.S., Eds.; Springer International Publishing: Cham, Switzerland, 2018; pp. 2075–2083. ISBN 9783319950211. [Google Scholar]
  21. Liu, G.; Wu, Y.; Tang, A.; Pan, D.; Li, B. Recovery of Scattered and Precious Metals from Copper Anode Slime by Hydrometallurgy: A Review. Hydrometallurgy 2020, 197, 105460. [Google Scholar] [CrossRef]
  22. Hsu, E.; Barmak, K.; West, A.C.; Park, A.-H.A. Advancements in the Treatment and Processing of Electronic Waste with Sustainability: A Review of Metal Extraction and Recovery Technologies. Green Chem. 2019, 21, 919–936. [Google Scholar] [CrossRef]
  23. Lu, S.; Li, J.; Chen, D.; Sun, W.; Zhang, J.; Yang, Y. A Novel Process for Silver Enrichment from Kaldo Smelting Slag of Copper Anode Slime by Reduction Smelting and Vacuum Metallurgy. J. Clean. Prod. 2020, 261, 121214. [Google Scholar] [CrossRef]
  24. Kamberović, Ž.; Ranitović, M.; Korać, M.; Andjić, Z.; Gajić, N.; Djokić, J.; Jevtić, S. Hydrometallurgical Process for Selective Metals Recovery from Waste-Printed Circuit Boards. Metals 2018, 8, 441. [Google Scholar] [CrossRef]
  25. Djokić, J.; Jovančićević, B.; Brčeski, I.; Ranitović, M.; Gajić, N.; Kamberović, Ž. Leaching of Metastannic Acid from E-Waste by-Products. J. Mater. Cycle. Waste Manag. 2020, 22, 1899–1912. [Google Scholar] [CrossRef]
  26. Gibson, R.W.; Goodman, P.D.; Holt, L.; Dalrymple, I.M.; Fray, D.J. Process for the Recovery of Tin, Tin Alloys or Lead Alloys from Printed Circuit Boards. U.S. Patent 6641712B1, 4 November 2003. [Google Scholar]
  27. Xu, B.; Chen, Y.; Dong, Z.; Jiang, T.; Zhang, B.; Liu, G.; Yang, J.; Li, Q.; Yang, Y. Eco-Friendly and Efficient Extraction of Valuable Elements from Copper Anode Mud Using an Integrated Pyro-Hydrometallurgical Process. Resour. Conserv. Recycl. 2021, 164, 105195. [Google Scholar] [CrossRef]
  28. Wu, D.; Liu, W.; Han, J.; Jiao, F.; Xu, J.; Gu, K.; Qin, W. Direct Preparation of Sodium Stannate from Lead Refining Dross after NaOH Roasting-Water Leaching. Sep. Purif. Technol. 2019, 227, 115683. [Google Scholar] [CrossRef]
  29. Li, D.; Guo, X.; Xu, Z.; Tian, Q.; Feng, Q. Leaching Behavior of Metals from Copper Anode Slime Using an Alkali Fusion-Leaching Process. Hydrometallurgy 2015, 157, 9–12. [Google Scholar] [CrossRef]
  30. Ding, Y.; Zhang, S.; Liu, B.; Li, B. Integrated Process for Recycling Copper Anode Slime from Electronic Waste Smelting. J. Clean. Prod. 2017, 165, 48–56. [Google Scholar] [CrossRef]
  31. Li, D.; Guo, X.; Xu, Z.; Xu, R.; Feng, Q. Metal Values Separation from Residue Generated in Alkali Fusion-Leaching of Copper Anode Slime. Hydrometallurgy 2016, 165, 290–294. [Google Scholar] [CrossRef]
  32. Zhu, W.; Zhu, N.; Xian, J.; Xi, Y.; Li, F.; Wu, P.; Chen, Y. A Green Process for Simultaneously Efficient Base Metals Removal and Precious Metals Enrichment from Copper Anode Slime. Resour. Conserv. Recycl. 2022, 180, 106200. [Google Scholar] [CrossRef]
  33. Liu, J.; Guo, X.; Liu, Y.; Jiang, X.; Huang, G. Effects of Alkali-Salt Fusion Process on Recovery of Amphoteric Metals from Waste Printed Circuit Boards. Min. Proc. Ext. Metall. 2016, 125, 211–215. [Google Scholar] [CrossRef]
  34. ISO 3310-1:2016; Test Sieves—Technical Requirements and Testing—Part 1: Test Sieves of Metal Wire Cloth. International Organization for Standardization: Geneve, Switzerland, 2016.
  35. ISO 11465:1993; Soil Quality—Determination of Dry Matter and Water Content on a Mass Basis—Gravimetric Method. International Organization for Standardization: Geneve, Switzerland, 1993.
  36. ISO 12743:2021; Copper, Lead, Zinc and Nickel Concentrates—Sampling Procedures for Determination of Metal and Moisture Content. International Organization for Standardization: Geneve, Switzerland, 2021.
  37. Roine, A. HSC Chemistry®, v 9; Outotec Research Oy Center: Pori, Finland, 2016.
  38. Puigdomenech, I. HYDRA (Hydrochemical Equilibrium-Constant Database) and MEDUSA (Make Equilibrium Diagrams Using Sophisticated Algorithms) Programs; Royal Institute of Technology: Stockholm, Sweden, 2006. [Google Scholar]
  39. Lide, D.R. CRC Handbook of Chemistry and Physics, 97th ed.; CRC Press: Boca Raton, FL, USA; London, UK; New York, NY, USA , 2017; ISBN 978-1-4987-5429-3. [Google Scholar]
  40. Đokić, J.; Gajić, N.; Radovanović, D.; Štulović, M.; Kamberović, Ž. Thermodynamic modeling of the alkali fusion-leaching process for non-standard anode slime. In Book of Proceedings of XV Conference of Chemists, Technologists and Environmentalists of the Republic of Srpska, Banja Luka, Bosnia and Herzegovina 18–19 October 2024; University of Banja Luka: Banja Luka, Bosnia and Herzegovina, 2024; pp. 72–80. ISBN 978-99976-14-09-4. [Google Scholar]
  41. Liu, S.; Cai, Y.; Zhang, Y.; Su, Z.; Jiang, T. Selective Separation of Base Metals and High-Efficiency Enrichment of Precious Metals from Scrap Copper Anode Slime. Sep. Purif. Technol. 2022, 296, 121378. [Google Scholar] [CrossRef]
  42. Liu, W.; Gu, K.; Han, J.; Ou, Z.; Wu, D.; Zhao, D.; Qin, W. Innovative Methodology for Comprehensive Use of Tin Anode Slime: Preparation of CaSnO3. Miner. Eng. 2019, 143, 105945. [Google Scholar] [CrossRef]
  43. Kékesi, T.; Török, T.I.; Kabelik, G. Extraction of Tin from Scrap by Chemical and Electrochemical Methods in Alkaline Media. Hydrometallurgy 2000, 55, 213–222. [Google Scholar] [CrossRef]
  44. Mkhohlakali, A.; Ramfumedzi, T.; Refiloe Letsoalo, M.; Mapukata, S.; Happy Mabowa, M.; Mokgosi, D.; Sehata, J.; Ntsasa, N.; Tshilongo, J. Recycling, Analytical Quantification and Re-Purpose of Critical Minerals from Fire Assay Waste Streams. In Environmental Sciences; Fernando Bustillo-LeCompte, C., Ed.; IntechOpen: London, UK, 2024; Volume 33, ISBN 9781837699377. [Google Scholar]
  45. Li, Y.; Baker, J.; Fang, Y.; Cao, H.; Pleydell-Pearce, C.; Watson, T.; Chen, S.; Zhao, G. Comparative Environmental Impacts Analysis of Technologies for Recovering Critical Metals from Copper Anode Slime: Insights from LCA. J. Environ. Chem. Ecotoxicol. 2025, 7, 275–285. [Google Scholar] [CrossRef]
Figure 1. X-ray diffraction patterns of the non-standard CAS sample.
Metals 15 01308 g001
Figure 2. Process development methodology.
Metals 15 01308 g002
Figure 3. Equilibrium composition of the CAS–NaOH system as a function of temperature (0–1000 °C): (a) major components and (b) minor components.
Metals 15 01308 g003
Figure 4. Eh–pH diagrams for the metal systems in aqueous media at 80 °C: (a) Sn, (b) Pb, (c) Cu, (d) Zn, (e) Sb, and (f) Fe.
Metals 15 01308 g004
Figure 5. Mass loss after leaching of alkali fusion products as a function of NaOH addition (fusion: 60 min, 600 °C; leaching: 60 min, 80 °C) relative to total charge and relative to CAS content.
Metals 15 01308 g005
Figure 6. Metal content in the CAS and solid residue as a function of NaOH addition: (a) Sn, (b) Pb, (c) Cu, (d) Zn, (e) Sb, (f) Fe, (g) Ag, and (h) Au.
Metals 15 01308 g006
Figure 7. Mass loss after leaching of alkali fusion products as a function of NaNO3 addition (fusion: 60 min, 600 °C; leaching: 60 min, 80 °C) relative to total charge and relative to CAS content.
Metals 15 01308 g007
Figure 8. Metal content in the CAS and solid residue as a function of NaNO3 addition: (a) Sn, (b) Pb, (c) Cu, (d) Zn, (e) Sb, (f) Fe, (g) Ag, and (h) Au.
Metals 15 01308 g008
Figure 9. Comparative leaching efficiency for (a) CAS–NaOH and (b) CAS:NaOH–NaNO3 alkali fusion systems.
Metals 15 01308 g009
Figure 10. Metal distribution among the products of the scaled-up alkali fusion–leaching process.
Metals 15 01308 g010
Figure 11. X-ray diffraction patterns of the solid residue after scaled-up alkali fusion–leaching process: (a) full-scale and (b) enlarged view of low-intensity range.
Metals 15 01308 g011
Figure 12. Alkali fusion–leaching process flow sheet with overall mass balance and efficiencies.
Metals 15 01308 g012
Table 1. Chemical composition of the non-standard CAS sample.
ElementsContent, wt.%
Pb23.65
Sn 128.36
Cu0.40
Fe0.76
Zn0.17
Sb0.58
Si9.02
Au0.86
Ag6.86
S3.79
1 Recalculated as metastannic acid (H2SnO5 × 9H2O).
Table 2. Phase composition of the non-standard CAS sample.
PhaseContent, wt.%
PbSO430.00
PbO3.40
SnO2 136.00
FeS1.20
AgO2.70
Ag3.00
AgCl2.00
Au0.70
AuCl30.25
CuSO40.5
ZnS0.25
Sb2O30.70
SiO219.30
1 Representing metastannic acid (H2SnO5 × 9H2O).
Table 3. Calculated thermodynamic parameters (ΔHθ, ΔSθ, ΔGθ, and log K) for reactions of CAS phases with NaOH (graphical representation shown in Supplementary Figure S1).
Temperature, °CParameters 1Equation (1)Equation (2)Equation (3)Equation (4)Equation (5)Equation (6)Equation (7)Equation (8)Equation (9)Equation (10)
400ΔHθ (kJ)−101.46−72.35−90.48−206.9027.2356.08−14.50−357.99−199.21−74.56
ΔSθ (J/K)86.49−186.10−60.78107.3260.7571.38219.52291.6479.0558.69
ΔGθ (kJ)−159.6852.92−49.56−279.15−13.678.03−162.27−554.30−252.43−114.07
log K12.39−4.113.8521.661.06−0.6212.5943.0219.598.85
500ΔHθ (kJ)−105.48−91.01−95.04−211.4422.3551.26−81.63−370.64−205.07−79.33
ΔSθ (J/K)80.93−211.94−67.11101.0353.9864.71127.06274.1020.0052.08
ΔGθ (kJ)−168.0572.85−43.16−289.55−19.391.23−179.87−582.56−259.91−119.59
log K11.36−4.922.9219.561.31−0.0812.1539.3617.568.08
600ΔHθ (kJ)−109.57−109.62−99.21−215.3418.1446.92−92.86−382.49−210.66−84.31
ΔSθ (J/K)75.96−234.57−72.1896.2748.8559.42113.37259.6864.1346.03
ΔGθ (kJ)−175.8995.20−36.18−299.40−24.52−4.96−191.85−609.23−266.66−124.50
log K10.52−5.702.1717.911.470.3011.4836.4515.957.45
700ΔHθ (kJ)−113.51−128.19−103.02−218.2614.6543.20−102.00−393.52−286.64−87.44
ΔSθ (J/K)71.68−254.71−76.3293.1045.0755.38103.44247.71−18.6242.63
ΔGθ (kJ)−183.27119.68−28.75−308.86−29.20−10.69−202.66−634.58−268.53−128.92
log K9.84−6.431.5416.581.570.5710.8834.0614.426.92
800ΔHθ (kJ)−117.05−146.74−106.53−219.9111.9740.30−109.00−403.65−295.48−90.05
ΔSθ (J/K)68.21−272.86−79.7591.4742.4352.5396.57237.79−27.2640.07
ΔGθ (kJ)−190.25146.07−20.94−318.07−33.57−16.08−212.64−658.84−266.22−133.05
log K9.26−7.111.0215.481.630.7810.3532.0712.966.48
1 ΔHθ—enthalpy change; ΔSθ—entropy change; ΔGθ—Gibbs free energy change; log K—equilibrium constant.
Table 4. Calculated thermodynamic parameters (ΔHθ, ΔSθ, ΔGθ, and log K) for reactions of CAS–NaOH–NaNO3 (graphical representation shown in Supplementary Figure S2).
Temperature, °CParameter 1Equation (11)Equation (12)Equation (13)Equation (14)Equation (15)Equation (16)Equation (17)Equation (18)
400ΔHθ (kJ)−10.58−590.26−836.44−8470.98−3513.53276.19−116.63−854.81
ΔSθ (J/K)161.30398.05124.7819.94203.63825.25718.29−325.15
ΔGθ (kJ)−119.15−858.21−920.44−8484.40−3650.61−279.34−600.15−635.93
log K9.2566.6071.43308.00283.3021.6846.5749.35
500ΔHθ (kJ)−30.11−614.86−844.04−8512.87−3537.26134.67−135.13−931.91
ΔSθ (J/K)134.22363.99114.24−38.28170.71630.31692.65−431.93
ΔGθ (kJ)−133.88−896.28−932.36−8483.27−3669.24−352.66−670.65−597.96
log K9.0560.5663.00308.00247.9223.8345.3140.40
600ΔHθ (kJ)−48.18−640.09−850.32−8540.58−3556.77108.08−152.64−1009.95
ΔSθ (J/K)112.22333.31106.58−72.19146.92597.92671.34−526.84
ΔGθ (kJ)−146.17−931.12−943.38−8477.55−3685.05−413.99−738.82−549.94
log K8.7555.7156.44308.00220.4724.7744.2032.90
700ΔHθ (kJ)−64.98−664.73−854.64−8551.77−3570.8185.84−169.12−1265.43
ΔSθ (J/K)93.99306.58101.87−84.43131.63573.76653.46−804.75
ΔGθ (kJ)−156.45−963.08−953.78−8469.60−3698.91−472.51−805.04−482.29
log K8.4051.7051.20308.00198.5625.3743.2225.89
800ΔHθ (kJ)−80.68−687.50−856.49−8563.79−3578.0968.03−184.52−1354.47
ΔSθ (J/K)78.63284.28100.04−96.26124.46556.30638.38−891.84
ΔGθ (kJ)−165.06−992.58−963.85−8460.49−3711.65−528.97−869.61−397.39
log K8.0448.3246.92308.00180.6825.7542.3319.34
1 ΔHθ—enthalpy change; ΔSθ—entropy change; ΔGθ—Gibbs free energy change; log K—equilibrium constant.
Table 5. Thermodynamic parameters (ΔHθ, ΔSθ, ΔGθ, and log K) for reactions at 25, 50, and 80 °C.
Temperature, °CParameter 1Equation (19)Equation (20)Equation (21)
25ΔHθ (kJ)−136.98−28.65−87.29
ΔSθ (J/K)380.75162.03−3.12
ΔGθ (kJ)−250.51−76.96−86.36
log K43.8913.4915.13
50ΔHθ (kJ)−111.27−9.807−81.00
ΔSθ (J/K)463.57222.7217.17
ΔGθ (kJ)−261.07−81.78−86.55
log K42.2013.2213.99
80ΔHθ (kJ)−79.6513.49−74.99
ΔSθ (J/K)557.10291.6434.97
ΔGθ (kJ)−276.39−89.50−87.34
log K40.8813.2412.92
1 ΔHθ—enthalpy change; ΔSθ—entropy change; ΔGθ—Gibbs free energy change; log K—equilibrium constant.
Table 6. Chemical composition of solid residue, CAS–NaOH system.
Element, % 1NaOH (Stoich. Excess), %
203040506070
Sn47.0438.0820.118.612.572.24
Sb0.800.830.710.580.540.52
Pb38.0945.0159.3166.7070.8071.65
Ag11.4513.0116.0619.6519.6019.84
Au0.680.750.961.151.121.18
Cu0.720.861.041.211.251.18
Fe0.981.121.391.731.641.58
Zn0.210.260.320.350.370.36
1 Sn as H2SnO5 × 9H2O/SnO2; Pb as PbSO4/PbO; Cu, Fe, and Zn as Cux(Fe,Zn)ySnzOδ.
Table 7. Chemical composition of solid residue, CAS:NaOH–NaNO3 system.
Element, % 1NaNO3 (Relative to CAS), %
2.55101520
Sn3.203.403.914.074.15
Sb0.590.580.520.510.53
Pb63.0462.7458.4155.6952.17
Ag28.8928.7732.1434.5136.54
Au2.082.242.732.912.64
Cu0.700.690.710.700.72
Fe1.381.401.411.381.29
Zn0.110.150.150.140.14
1 Sn as H2SnO5 × 9H2O/SnO2; Pb as PbSO4/PbO; Cu, Fe, and Zn as Cux(Fe,Zn)ySnzOδ.
Table 8. Elemental distribution, mass balance, and efficiency of the scaled-up alkali fusion–leaching process.
ProductElement, %
SnPbSbCuFeZnAgAu
Leaching solution%93.34 15.69 10.560.020.080.030.02n.d. 3
g230.1627.083.100.110.440.170.14n.d. 3
Leaching efficiency%97.7511.5739.744.565.9711.810.2n.d. 3
Solid residue%3.56 266.87 21.410.692.080.3818.702.89
g11.89207.344.712.306.931.2732.479.68
Retention efficiency%2.2488.4360.2695.4494.0388.1999.7899.99
1 As Na2Sn(OH)6 and Pb(OH)2. 2 As H2SnO5 × 9H2O and PbO. 3 n.d. - below detection limit (0.01–0.1 ppm) of applied method.
Disclaimer/Publisher’s Note: The statements, opinions and data contained in all publications are solely those of the individual author(s) and contributor(s) and not of MDPI and/or the editor(s). MDPI and/or the editor(s) disclaim responsibility for any injury to people or property resulting from any ideas, methods, instructions or products referred to in the content.