Article

Statistical Evaluation of the Mechanical Properties of Welded and Unwelded ASTM A706 Reinforcing Steel Bars of Different Commercial Brands

by
Lenin Abatta-Jacome
1,2,*,
Daniel Rosero-Pazmiño
1,
Jeison Rosero-Vivas
1,
Bryan Fernando Chávez-Guerrero
1 and
Germán Omar Barrionuevo
3,4,*
1
Departamento de Ciencias de la Energía y Mecánica, Universidad de las Fuerzas Armadas ESPE, Sangolquí 171103, Ecuador
2
Department of Civil Engineering, Materials and Manufacturing, School of Engineering, University of Malaga, 29071 Malaga, Spain
3
Department of Mechanical Engineering, Universidad San Francisco de Quito USFQ, Diego de Robles y Vía Interoceánica, P.O. Box 17-0901, Quito 170157, Ecuador
4
Department of Mechanical and Metallurgical Engineering, School of Engineering, Pontificia Universidad Católica de Chile, Av. Vicuña Mackenna, Santiago 4860, Chile
*
Authors to whom correspondence should be addressed.
Metals 2025, 15(12), 1307; https://doi.org/10.3390/met15121307
Submission received: 22 October 2025 / Revised: 16 November 2025 / Accepted: 22 November 2025 / Published: 27 November 2025
(This article belongs to the Special Issue Failure Analysis and Evaluation of Metallic Materials)

Abstract

The future of reinforcing steel bars (rebar) is being shaped by technological advancements, sustainability initiatives, and evolving construction practices. Welding of rebar has a significant and evolving influence on construction practices, particularly with trends emphasizing speed, precision, and prefabrication. On the other hand, the variability in mechanical response depends not only on the chemical composition but also on the manufacturing and welding process. This study analyzed five commercial brands of ASTM A706 reinforcing steel rods available in the Ecuadorian market with different diameters (12, 14, 16, and 18 mm) subjected to tensile and bending tests. A total of 228 specimens were analyzed, and 114 samples were welded by shielded metal arc welding process using an E8018-C3 electrode, preparing the joint with a simple V-bevel at 45°. The tensile tests results allow for a comparison between the welded and unwelded steel bars, where it is identified that the welding process generates a slight decrease in the mechanical properties and increases the variability in the results, although it is emphasized that these variations do not affect compliance with the standards, since all the samples meet the mechanical strength requirements by being within the limits established by the ASTM A706/A706M standard.

1. Introduction

Reinforcing steel bars are essential components in reinforced concrete structures, responsible for resisting tensile stresses, controlling cracking, and providing ductility under seismic stresses. Their structural performance depends critically on properties such as yield strength, ultimate tensile strength, elongation, and localized deformation capacity, although several studies have shown that these properties can be affected by factors such as steel grade, manufacturing process, the presence of surface defects, welding conditions, and even the manufacturer [1,2,3].
Some of the main types of steel bars evaluated include ASTM A615, A706, A1035, HRB400, HRB400E, HTRB600, Fe500D, bars produced from recycled scrap, and GFRP–steel composites [4,5,6,7]. Nevertheless, even within the same grade, manufacturers have allowed for tolerances for alloying elements (C, Mn, Si, V, Nb, etc.), which can affect the mechanical response of reinforcing steel bars. These differences can alter the yield strength, ductility, weldability, and strain hardening behavior.
Several authors report a notorious variability in the behavior of reinforcing bars, from differences in geometric and mechanical quality among manufacturers [8,9,10] to effects induced by thermal processes, localized corrosion, or deficient splices [11,12,13]. Epoxy-coated bars [14] and electrowelded wire mesh [15] have been also evaluated. Brand-specific rolling dies define rib height, spacing, and angle—which influence the strength with concrete, slip resistance under load, and fatigue performance, particularly important for cyclic or seismic loading, where ASTM A706 is often preferred for its ductility and weldability [16,17].
Some of the common mechanical tests to evaluate the mechanical response of reinforcing steel bars include uniaxial tensile, bending, low-cycle fatigue, bar–concrete adhesion, accelerated corrosion, and complementary metallographic analyses such as optical and scanning electron microscopies OM/SEM, spectrometry, and microhardness [18,19,20]. Hojat Jalali et al. [2] analyzed the mechanical response of ASTM A615, A706, and A1035 bars under extreme thermal conditions. Similarly, Abbasa et al. [6] studied reinforcing bars produced from recycled scrap; tensile tests were used to evaluate the mechanical properties under monotonic loading.
Welding is commonly used to join reinforcing bars (rebars) in reinforced concrete structures to create continuous load paths or prefabricated reinforcement cages. However, welding alters the microstructure and mechanical properties of steels, particularly in the heat-affected zone (HAZ), where grain coarsening may take place [13], which may reduce toughness and, thus, performance under tensile, i.e., ductility, and bending loads. Several studies show that welded rebars can lose up to 10–30% of their yield strength and tensile strength depending on the welding technique and conditions [21,22]. Welded bars often show reduced bendability, especially near weld joints. Microcracks may form during bending due to residual stress or altered microstructure.
Welding plays a critical role in the evolving use of reinforcing steel bars, particularly with the increasing adoption of prefabrication and complex structural designs [17]. Welded rebar assemblies enhance design flexibility, allowing for precise and efficient construction, especially in high-rise buildings and precast concrete elements [23]. However, welding introduces challenges such as reduced ductility and potential cracking if not properly managed. Therefore, only specific rebar grades, like ASTM A706, are suitable for welding, and procedures must follow established standards such as AWS D1.4/D1.4M to ensure safety and performance [24].
The performance under cyclic loading of beam–column joints has been examined [25], and weldability has been evaluated by microstructure and chemical composition analysis [26,27]. Research on mechanical splices and geometric deviations in bar alignment has revealed their direct influence on structural integrity [28,29]. On the other hand, the influence of the welding process affects the microstructure, altering the dynamic properties and the degradation of the anchorage after severe thermal exposure, as well as modifying the low-cycle fatigue performance with inelastic buckling [12,30].
Recently, some studies employed constitutive models to interpret results like Johnson–Cook, Coffin–Manson, Weibull, and reliability analysis to assess variability and structural risk [13,31]. Another work has focused on modeling the effects of corrosion using numerical–experimental methods [32,33], while emphasis has been placed on the impact of rib geometry on the bond to concrete [34].
An important parameter to be investigated is the variation in mechanical properties of steel bars as a function of their manufacturing origin. Abubakar and Abdulmajeed [35] analyzed regional variability in recycled bars in Nigeria, while Carrillo et al. [9] compared the mechanical properties of steel reinforcing bars for concrete structures in Colombia, Mexico, Canada, and the US. In general, the results are satisfactory and meet the required standards. However, the impact of welding has not been reported.
According to the literature review, there is a lack of studies evaluating the effect of welding according to AWS D1.4 on ASTM A706 bars, considering tensile and bending conditions, key parameters to validate their safe application in structures subjected to seismic loads. In this context, the present study focuses on the experimental evaluation of ASTM A706 Grade 60 steel bars, analyzing their mechanical behavior with and without welding through tensile and bending tests.

2. Materials and Methods

2.1. Material Preparation

ASTM A706 Grade 60 low-alloy steel bars, typically used for concrete reinforcement, with a minimum yield strength of 420 MPa (60 ksi), were studied. Five commercial brands available in the Ecuadorian market were used. The diameters with the highest consumption in civil engineering were selected: 12 mm, 14 mm, 16 mm, and 18 mm, following previous studies that have evaluated these sizes due to their frequent use in structural elements [1,9]. The bars, with an initial length of 12 m, were first cut into 4 m lengths to facilitate transport and handling (Figure 1a). All specimens were identified utilizing a coded adhesive labeling system (Figure 1b), indicating brand, diameter, section of origin, type of test, and condition of the specimen, as implemented in traceability protocols in international comparative studies [6,10]. A total of 228 specimens were analyzed, 114 welded and 114 unwelded. Each test was repeated three times to ensure the reliability of the study and to statistically determine the mechanical response of the different brands.
This research focuses on the comparative evaluation of the mechanical behavior of reinforcing steel bars in two conditions: unwelded and welded. Figure 1a shows the scheme used to obtain the different types of specimens along a reinforcing bar. Specimens for tensile and bending tests were extracted with lengths of 400 mm and 350 mm, respectively, and were applied to both welded and non-welded samples.
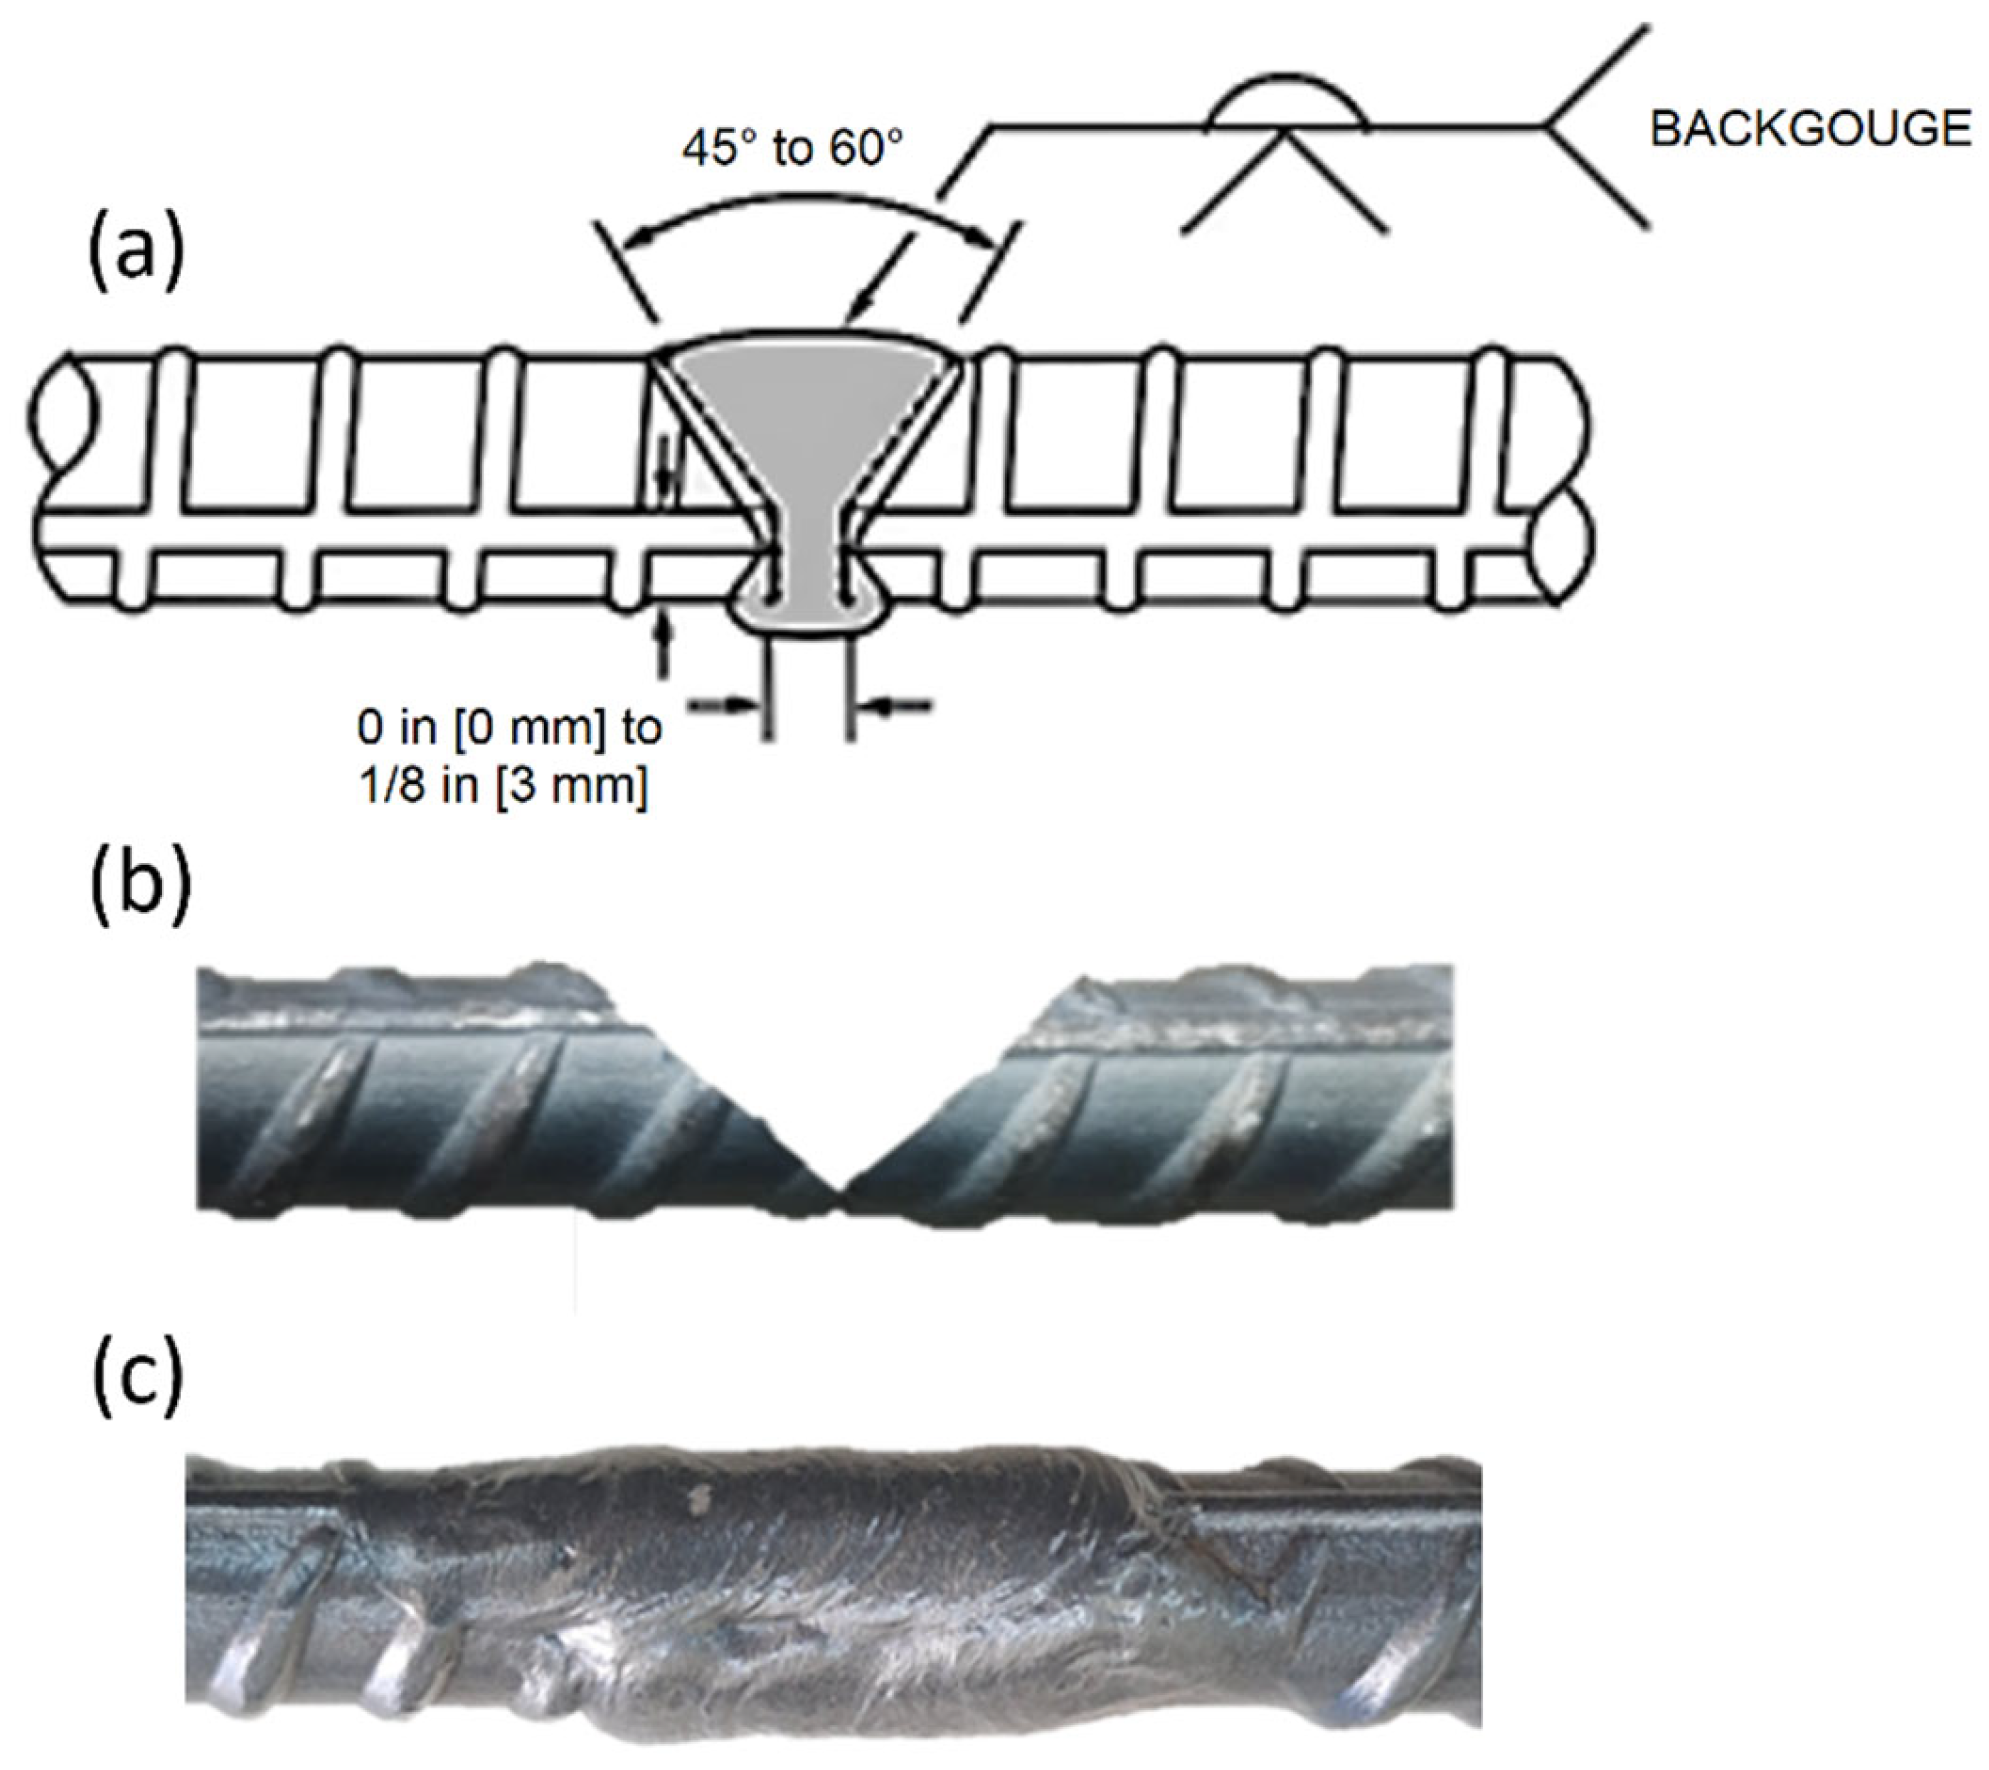
In the case of the bars joined by welding, the procedure was carried out in accordance with the guidelines established by the AWS D1.4 standard for welding in reinforcing steel. A 45° single bevel ‘V’ butt joint was used, as shown in Figure 2a, while the result of the bevel preparation can be seen in Figure 2b. The welding process was carried out by manual arc with a covered electrode (SMAW), using an E8018-C3 electrode (Lincoln Electric, EE.UU., Ohio) as filler material, without the application of preheating. Figure 2c shows a representative example of specimens in the welded condition.

2.2. Mechanical Response

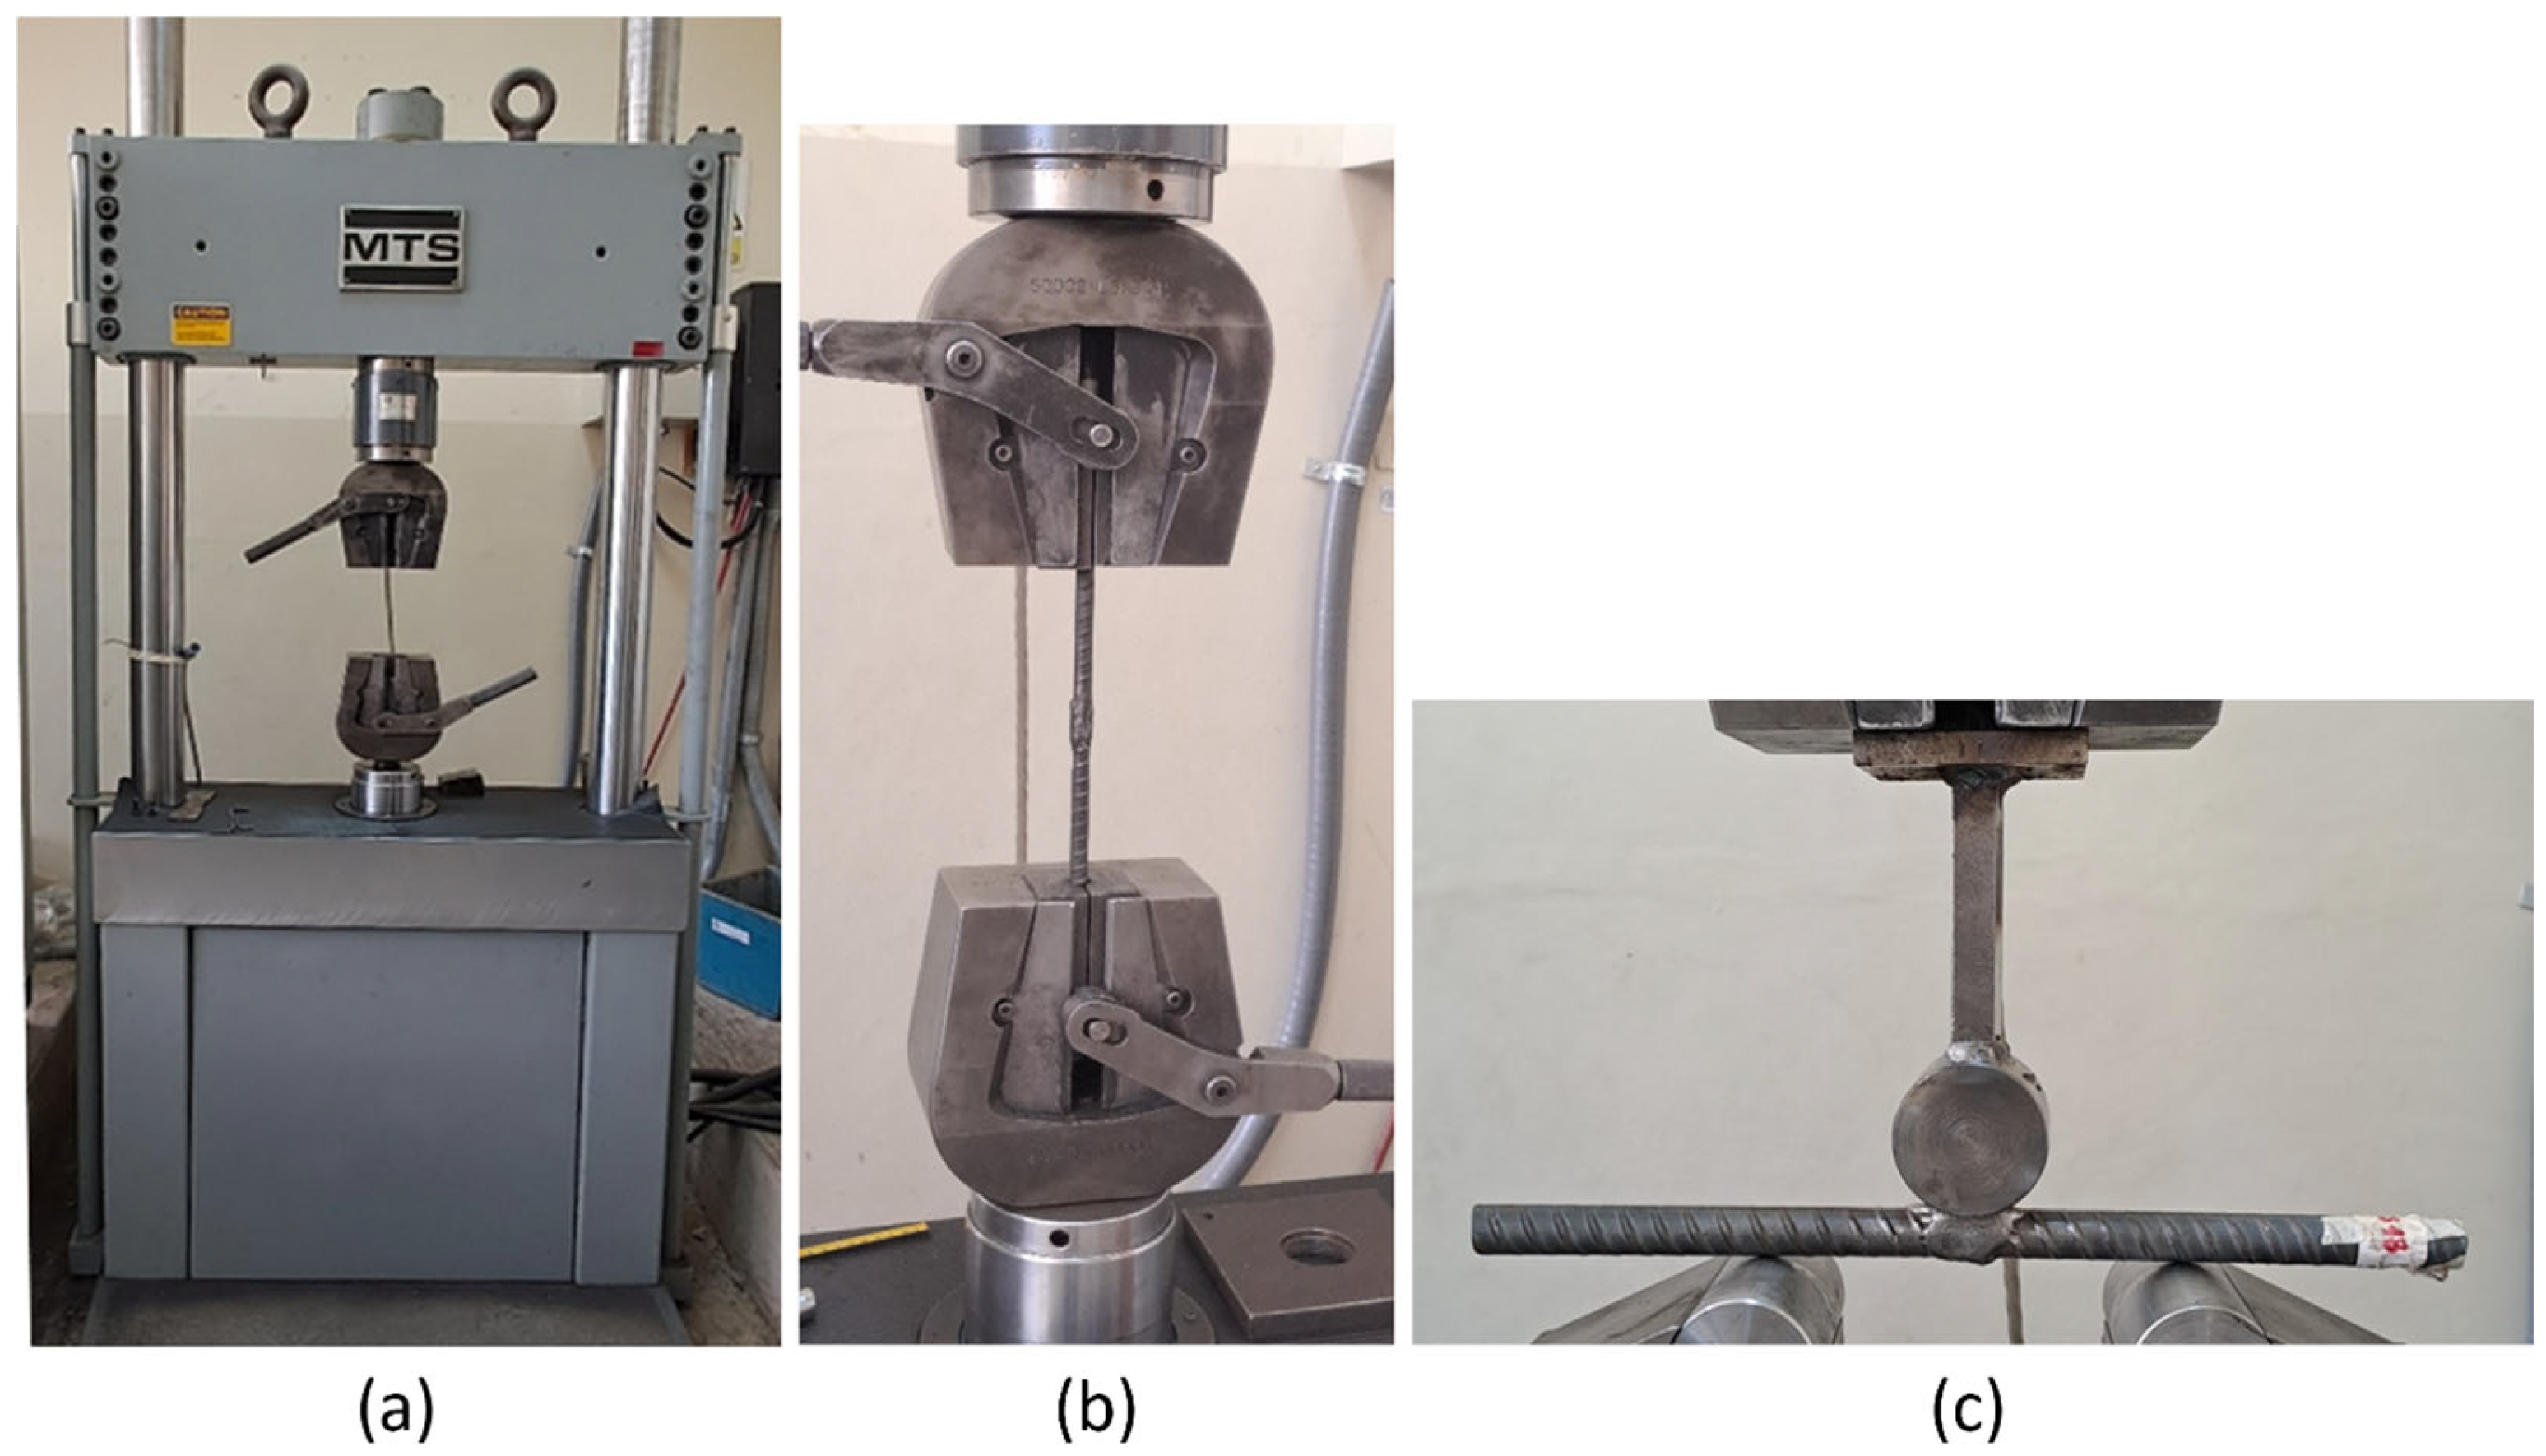
The specimens of the 5 different commercial brands were evaluated in both tensile and bending tests. The length of the specimens for the tensile test was 400 mm, according to ISO 6892-1 [36], widely used in the mechanical characterization of reinforcing bars [18,20]. For the bending tests, the recommendations of the ISO 7438 [37] and ACI 318 [38] standards were followed, with a specimen length of 350 mm, as applied in studies focused on the analysis of ductility and post-elastic behavior [7,39]. Monotonic tensile and bending tests were performed using a MTS model 810 universal testing machine (MTS Systems Corporation, EE.UU. Minneapolis, Minnesota) (Figure 3a), with a rated capacity of 500 kN, equipped with self-centering grips and an automatic load control system. The load application rate during the test was 155 N/s, a value selected to ensure stable quasi-static conditions. The calibrated length used for elongation measurement is summarized in Table 1. Before each test, this length was marked three times on each specimen to ensure visibility and traceability during the measurement. A representative example of a tensile test performed on a specimen in the welded condition is shown in Figure 3b.
The bending tests were performed according to the ISO 7438 guidelines, using an MTS 810 universal testing machine equipped with an adjustable bending bridge, which allows for adjusting the distance between supports according to the diameter of each specimen. The speed of the moving head during the tests was 60 mm/min, complying with the controlled deformation conditions established by the standard. Each bar was bent at 180°, using a specific punch for each diameter to ensure geometric compatibility and avoid localized stress concentrations, as shown in Figure 3c.
The distance between supports was calculated individually for each bar diameter and is presented in Table 2, under standardized criteria for the relationship between punch diameter and specimen diameter. Similar procedures have been employed in studies that analyzed the ductility and post-elastic behavior of thermo-mechanically treated (TMT) and welded bars, highlighting the sensitivity of the steel to bending geometry and edge conditions [7].
In addition to the general bending procedure described above, specimens were prepared for each commercial brand and bar diameter in both the unwelded and welded conditions, as shown in Figure 1. This specimen pairing allowed the bending tests to be performed under identical geometric and loading conditions for both configurations.
All bending procedures followed the requirements of the Ecuadorian standard INEN 2167-2020 [40] and the international standard ISO 7438, which establish the test configuration, deformation limits, and the visual inspection protocol to be applied after the 180° bend. In accordance with these standards, the punch diameter was defined proportionally to the bar diameter. For bars of 12, 14, and 16 mm, a punch equal to three times the nominal diameter was used, whereas for 18 mm bars, a punch equal to four times the nominal diameter was selected. These ratios ensure geometric compatibility during bending and minimize the introduction of non-standard localized stresses.
After bending to 180°, all specimens were subjected to a visual examination without magnification, as specified by ISO 7438, to document the surface condition of the tensile region. The combination of paired welded and unwelded specimens, standardized punch–diameter ratios, and a controlled test configuration ensured the consistency of the methodology across all brands and bar sizes evaluated in this study.

2.3. Statistical Evaluation

The RStudio software (v. 2024) was used for data processing and analysis. The analysis was based on descriptive statistical tools, considering the average and the coefficient of variation (CV), to directly compare the results between welded and non-welded bars. This methodology has been employed in previous studies examining the effects of welding on the mechanical properties of reinforcing steel, observing significant differences in ductility and strength, depending on the joining procedure [3].
Each mechanical property was analyzed employing box plots to identify central tendencies, dispersion, and possible outliers. In addition, an analysis of the statistics grouped by diameter without taking into account the brand was carried out. Several statistical tests were applied to determine the significance of the samples tested, including the Shapiro test, Anderson–Darling test, Lilliefors test [9,41], and non-parametric Mann–Whitney U test [42]. This type of analysis has been reported in research evaluating the intra-industry variability in reinforcing steel, and the effects of manufacturing processes and corrosion on strength and ductility [1,6,10].

3. Results and Discussion

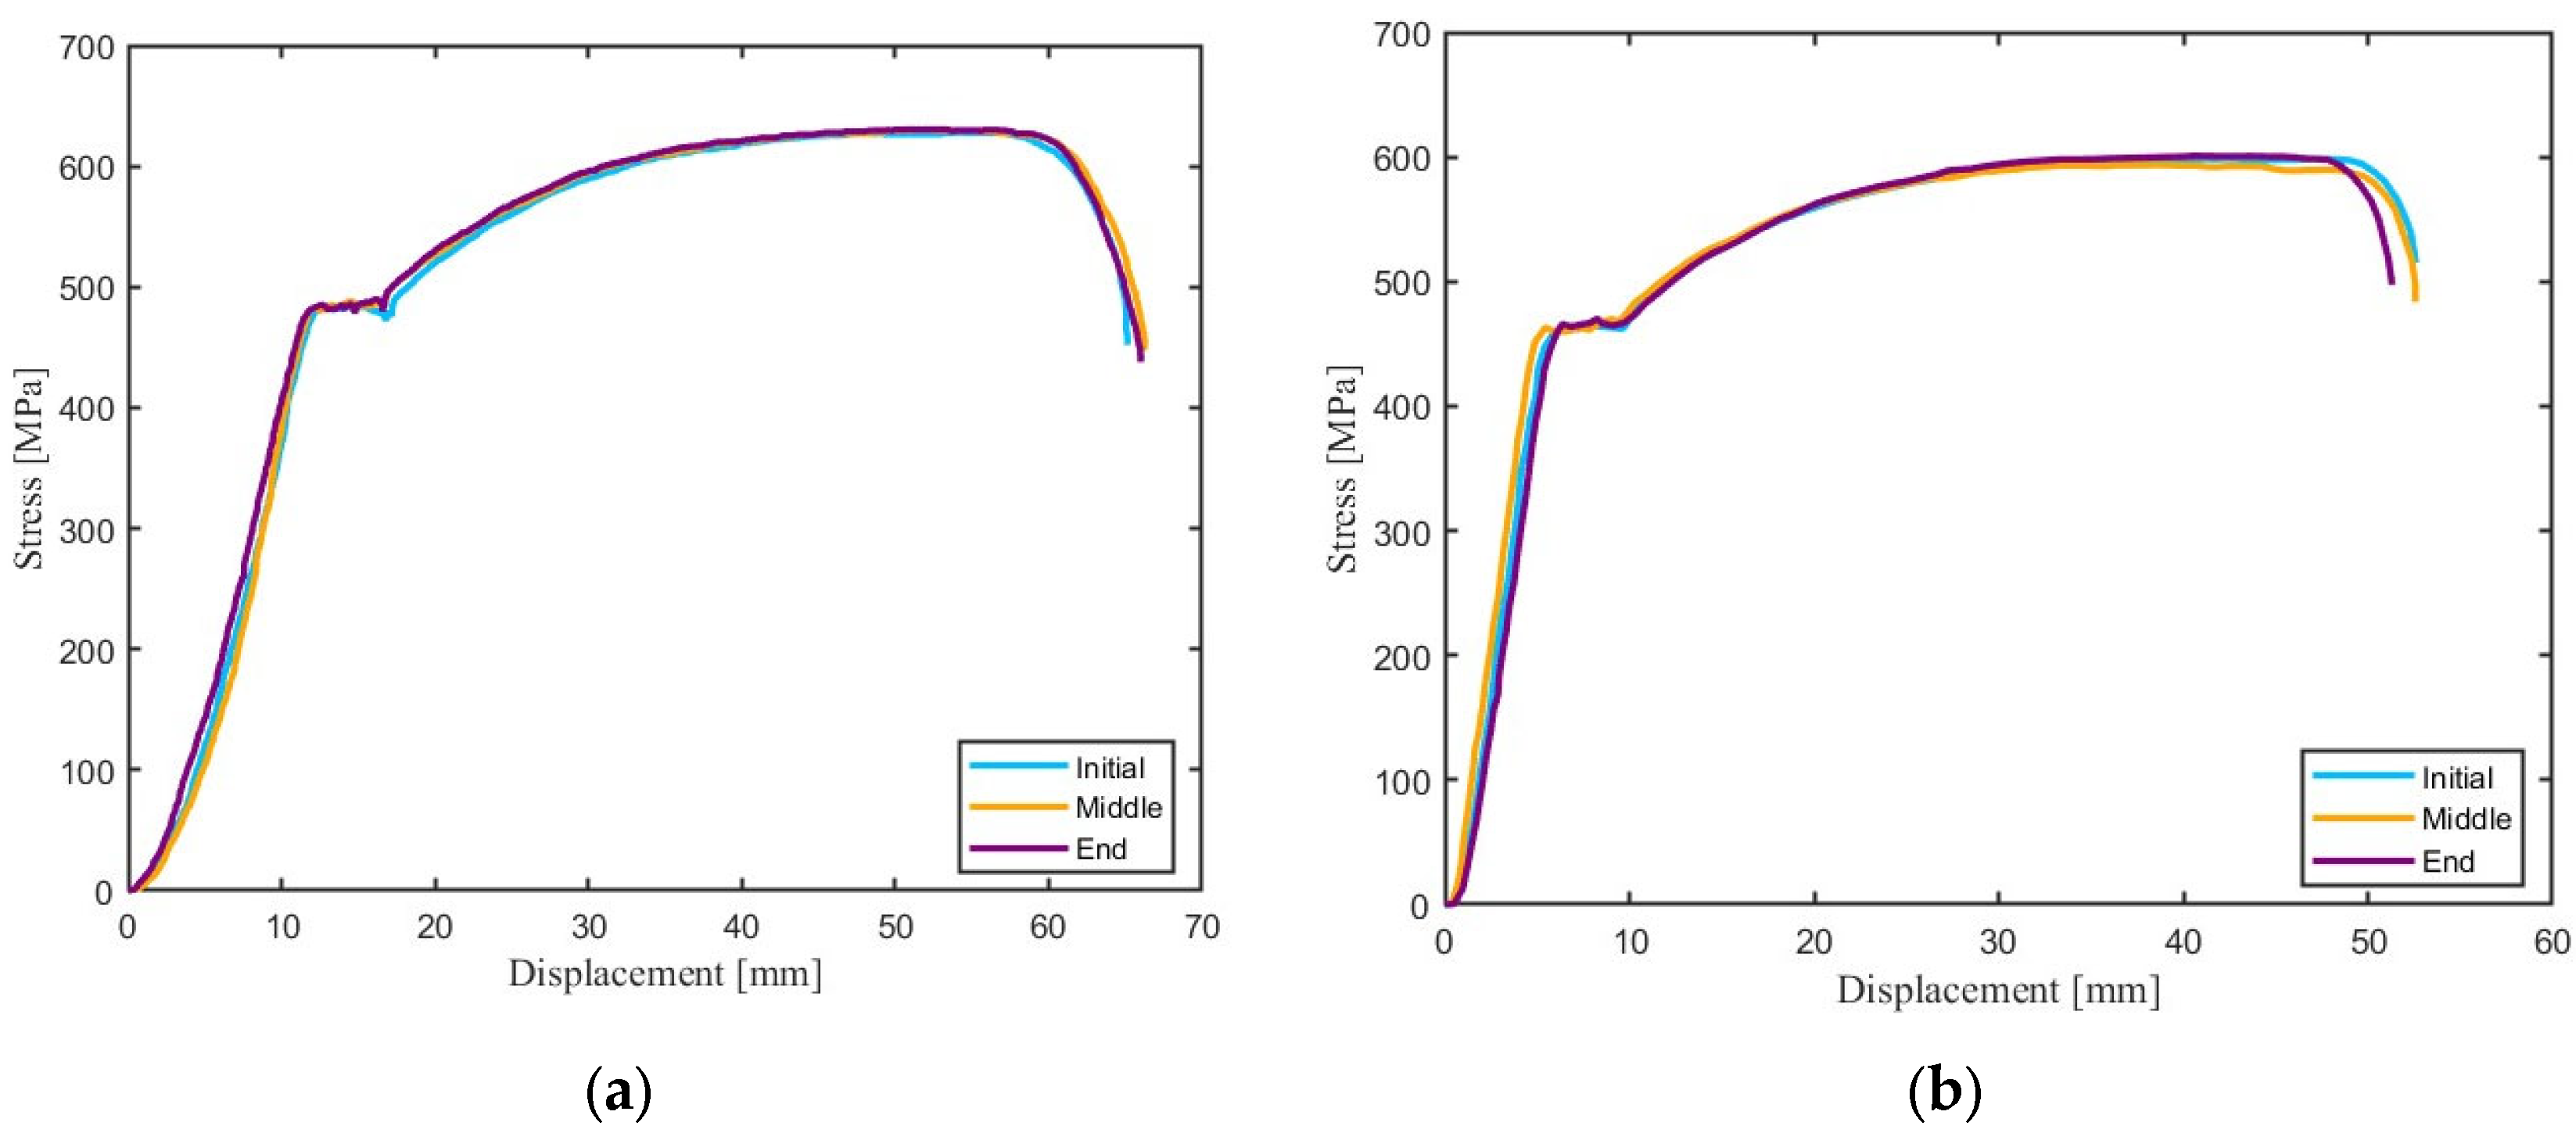
To ensure the reliability of the results, tensile tests were performed on different sections of the steel bar according to the distribution shown in Figure 1. As can be seen in Figure 4a, there is no significant difference in the tensile response of the tested specimens. Similarly, the specimens subjected to welding were tested, showing similar results (Figure 4b).
Table 3 shows the values of the coefficient of variation for diameters of 12 mm, 14 mm, 16 mm, and 18 mm, which allows for the evaluation of the homogeneity of mechanical properties among different brands and their variability for the average values. The dispersion of the data is presented in Figure 5, Figure 6 and Figure 7, analyzing the variability in yield strength (SY), tensile strength (SUT), and SUT/SY ratio.
Following the classification proposed by previous studies developed in Colombia [12], three levels of homogeneity were established: a CV lower than 5% indicates high homogeneity; values close to 20% represent moderate homogeneity; while a CV higher than 50% reflects low homogeneity in the mechanical properties analyzed.

3.1. Tensile Test of Unwelded and Welded Reinforcing Steel Bars

The results shown in Table 3 illustrate that, in general, the different brands evaluated comply with the minimum values required for both yield strength (SY) and tensile strength (SUT). However, one exception was identified: brand E, with a 12 mm diameter, does not reach the minimum value established for the SUT/SY ratio, both in the welded and unwelded conditions.

3.1.1. Yield Strength Response

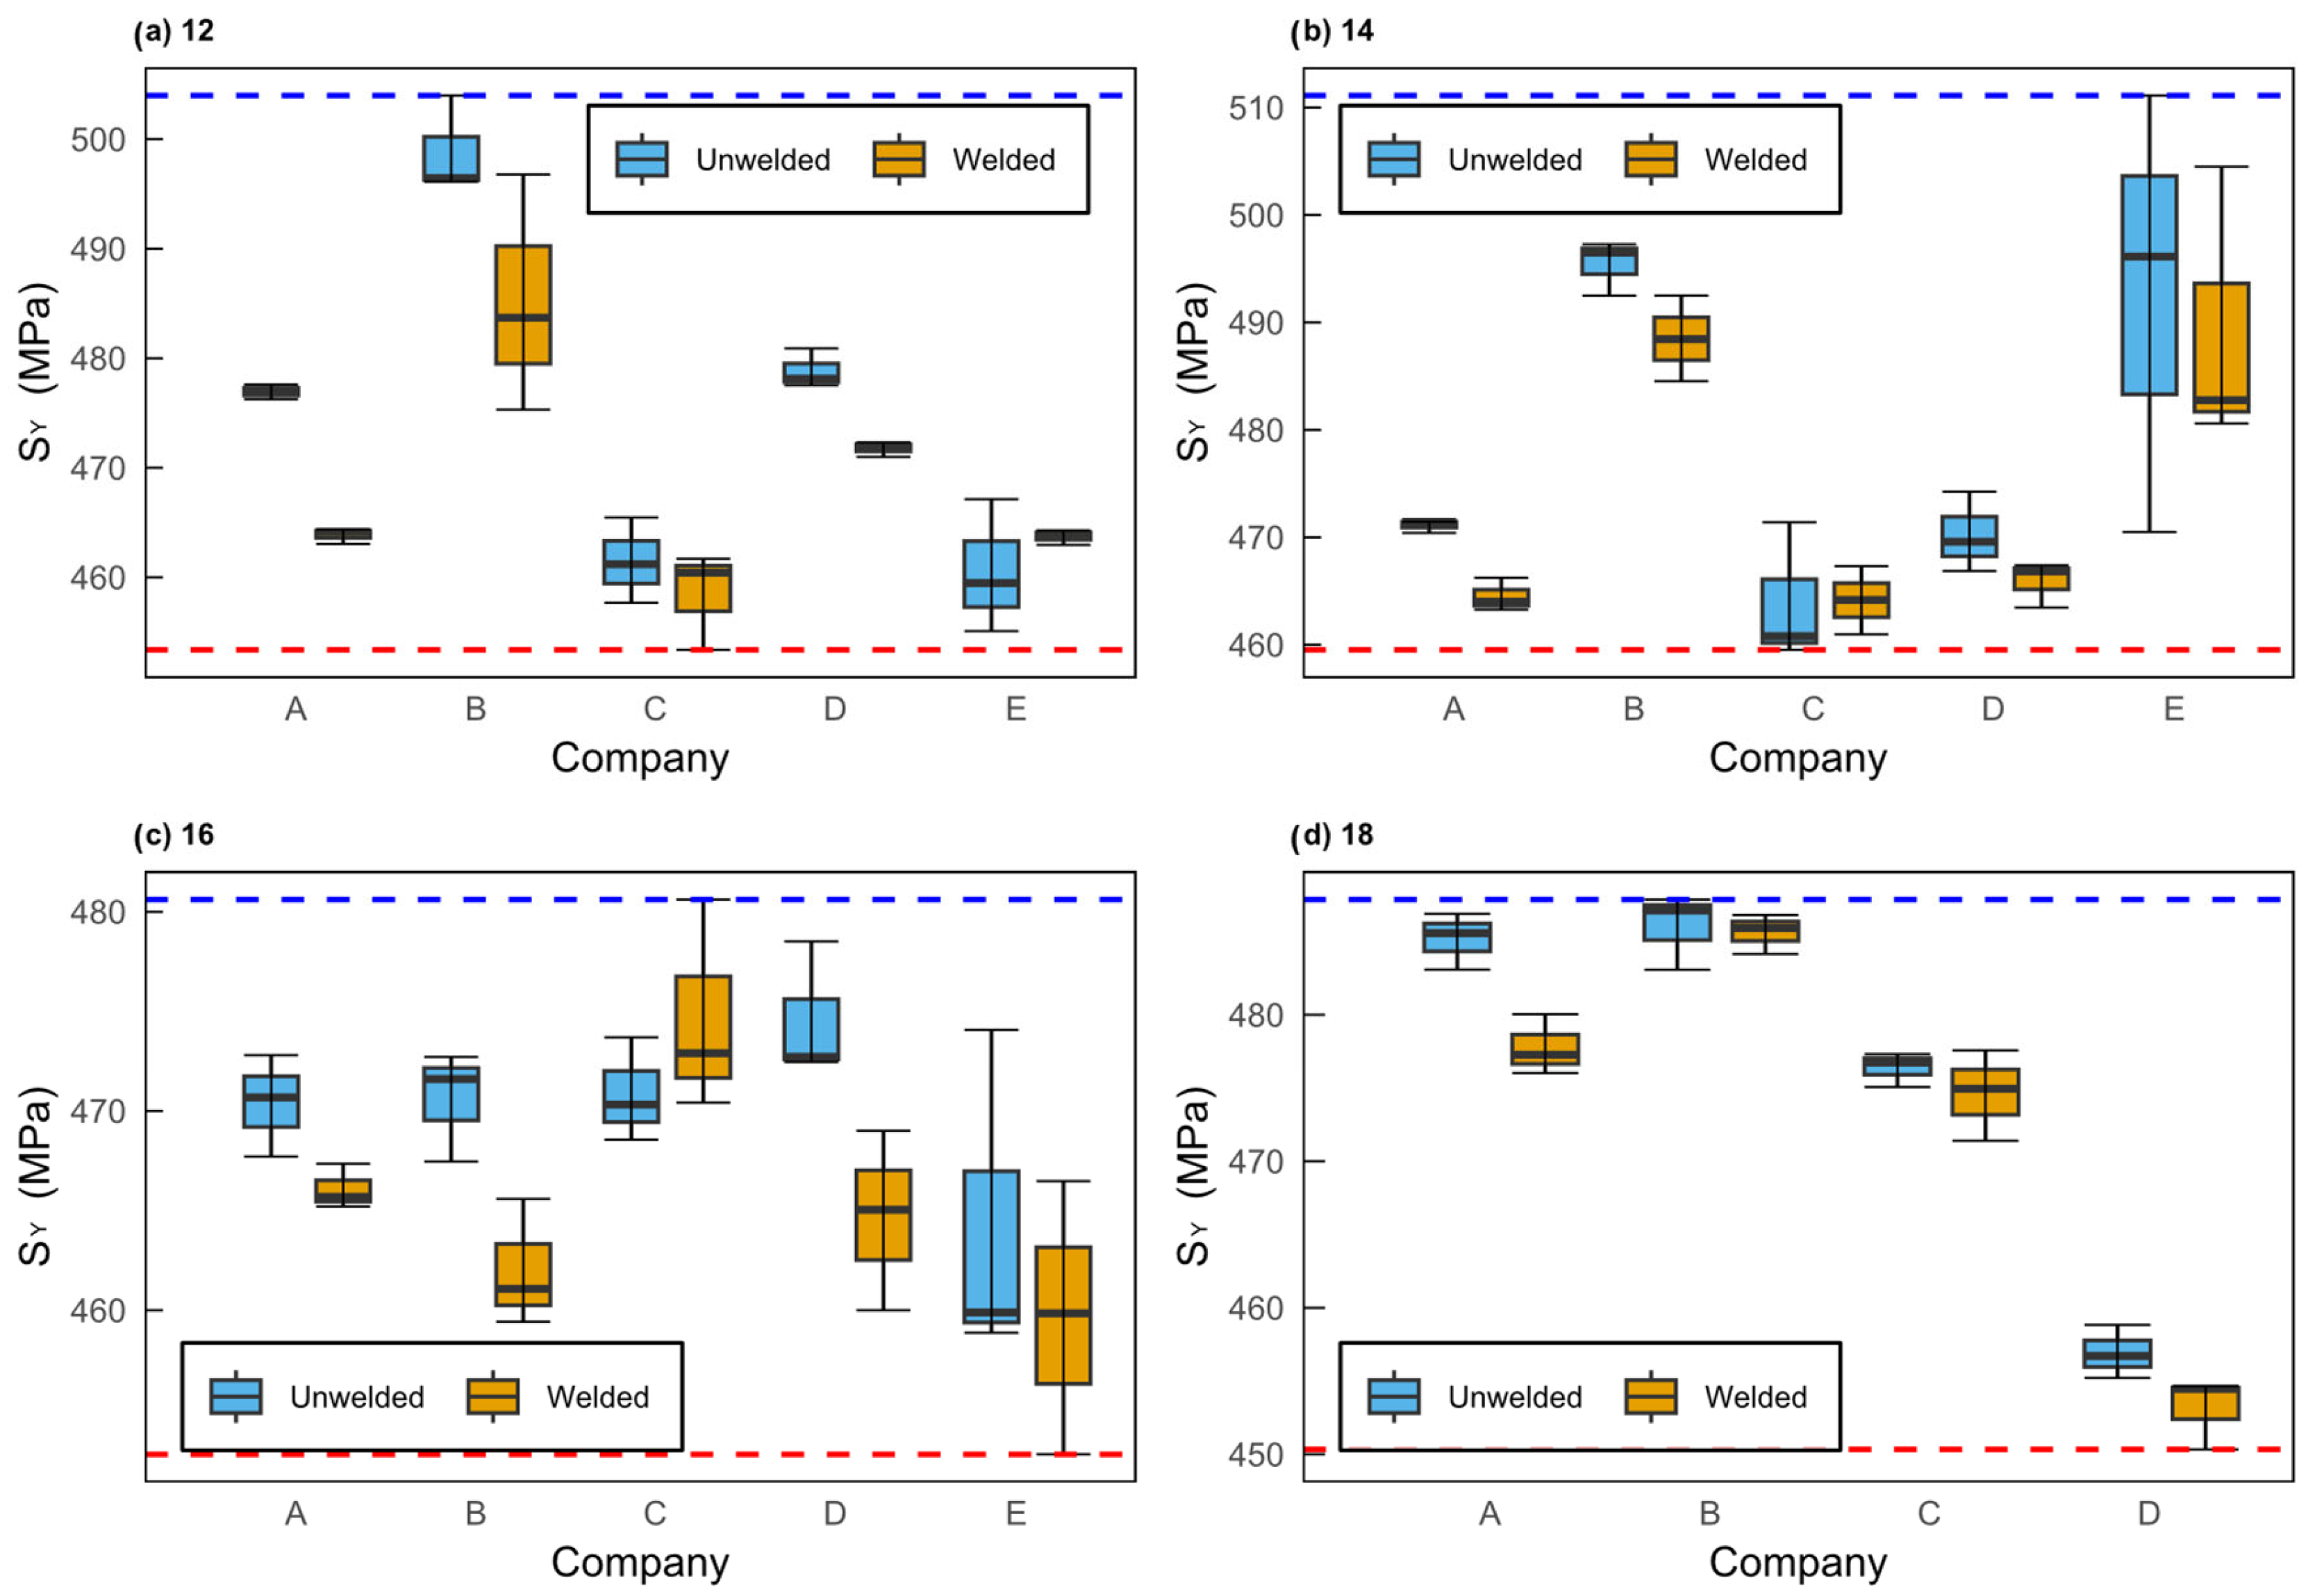
The box plot shown in Figure 5 illustrates the range of values obtained for SY in each diameter evaluated. The dashed lines represent the maximum and minimum values obtained in the tests, allowing for a visualization of the range of variation in the response of the steel bar. In all cases, the results are within the range established by ASTM A706/A706M, which requires a minimum value of 420 MPa and an upper limit of 540 MPa for this mechanical property [43]. It is worth noting that company E does not market 18 mm bars, so their comparison in that diameter is not included.
These results are consistent with the findings reported in previous studies that analyzed ASTM A706 bars subjected to different manufacturing processes and welding conditions, where compliance with the normative limit was observed, but with significant variations among manufacturers [18,20].
In Figure 5a, the upper limit of 503.99 MPa represents the highest yield strength SY recorded, and the lower limit of 453.38 MPa corresponds to the minimum obtained for 12 mm bars in all the companies evaluated. Companies A and D exhibit a more homogeneous distribution according to the calculated CV of 0.14% and 0.375%, respectively, remaining within the normative range. In contrast, company B presents a greater dispersion in the values of the 12 mm welded bars, suggesting a greater variability in their mechanical behavior. On the other hand, companies C and E show values that are more compact and closer to their lower limit, although without compromising compliance with the standard. Therefore, unwelded bars show less variability in most cases, with a minimum interquartile range (IQR) value of 0.669 MPa.
In contrast, for welded bars, company B exhibits an IQR of 10.741 MPa, which reflects greater dispersion. Likewise, it is observed that the highest coefficient of variation (CV) is registered precisely in company B with welded bars, reaching 2.231%. Despite this, it is still considered a moderate dispersion, since a CV of less than 5% indicates high homogeneity in the data.
In Figure 5a,c for 12 mm and 16 mm diameters, respectively, it can be seen that in company B, the welded bars show similar or even lower values than the unwelded ones. This situation could be related to differences in the microstructure of the base material or to the particularities of the welding process implemented. Factors such as input energy and cooling rate can directly affect metallurgical transformations and, consequently, mechanical properties [44,45].
In Figure 5b, the 14 mm bars coming from company E show a higher dispersion, according to the interquartile range IQR of 20.315 MPa in unwelded bars and 11.942 MPa in welded bars; a significantly higher dispersion is observed, especially in the unwelded rods. This behavior suggests that the variability is not only associated with the welding process but also with factors inherent in the fabrication of the material, such as differences in microstructure or variations in manufacturing parameters [1]. In addition, company E achieves a CV coefficient of variation of 2.7% in welded bars, confirming the high dispersion of SY. Figure 5c, which represents the 16 mm steel bars, indicates that the welded bars of company E also show the greatest dispersion, with an IQR of 6.852 MPa. Although this diameter shows more uniform values, it can be seen that company E in terms of welded bars has a CV of 1.491%, above the rest.
For the 18 mm diameter (Figure 5d), less variability is observed compared to other diameters: the interquartile ranges, IQRs, and coefficients of variation are lower in both welded and unwelded bars. The highest CV value found at 18 mm is around 0.652% for welded bars and 0.53% for unwelded bars, indicating that the values show high homogeneity in the yield resistance SY.
In general terms, when comparing the different diameters and companies, significant variations are noted in SY, although most of the variation coefficients analyzed are less than 5%. These variations could be associated with inconsistent manufacturing processes or inclusions in the composition of the raw materials [1]. In most of the cases analyzed, a slight decrease in the yield strength SY is observed after welding, which is consistent with previous studies indicating how elevated temperatures can modify mechanical properties and reduce strength [2]. However, contradictory results are reported in the literature. In this work, a decrease in yield strength SY was identified when comparing welded and unwelded bars, which raises the SUT/SY ratio. Studies carried out on rebars with diameters similar to those used in this research coincide with the results, where the yield strength SY decreases in welded steel bars due to the heat generated during welding [46]. However, according to Terán et al. [3], an increase in mechanical strength after welding, accompanied by a decrease in ductility, was found.

3.1.2. Ultimate Tensile Strength Response

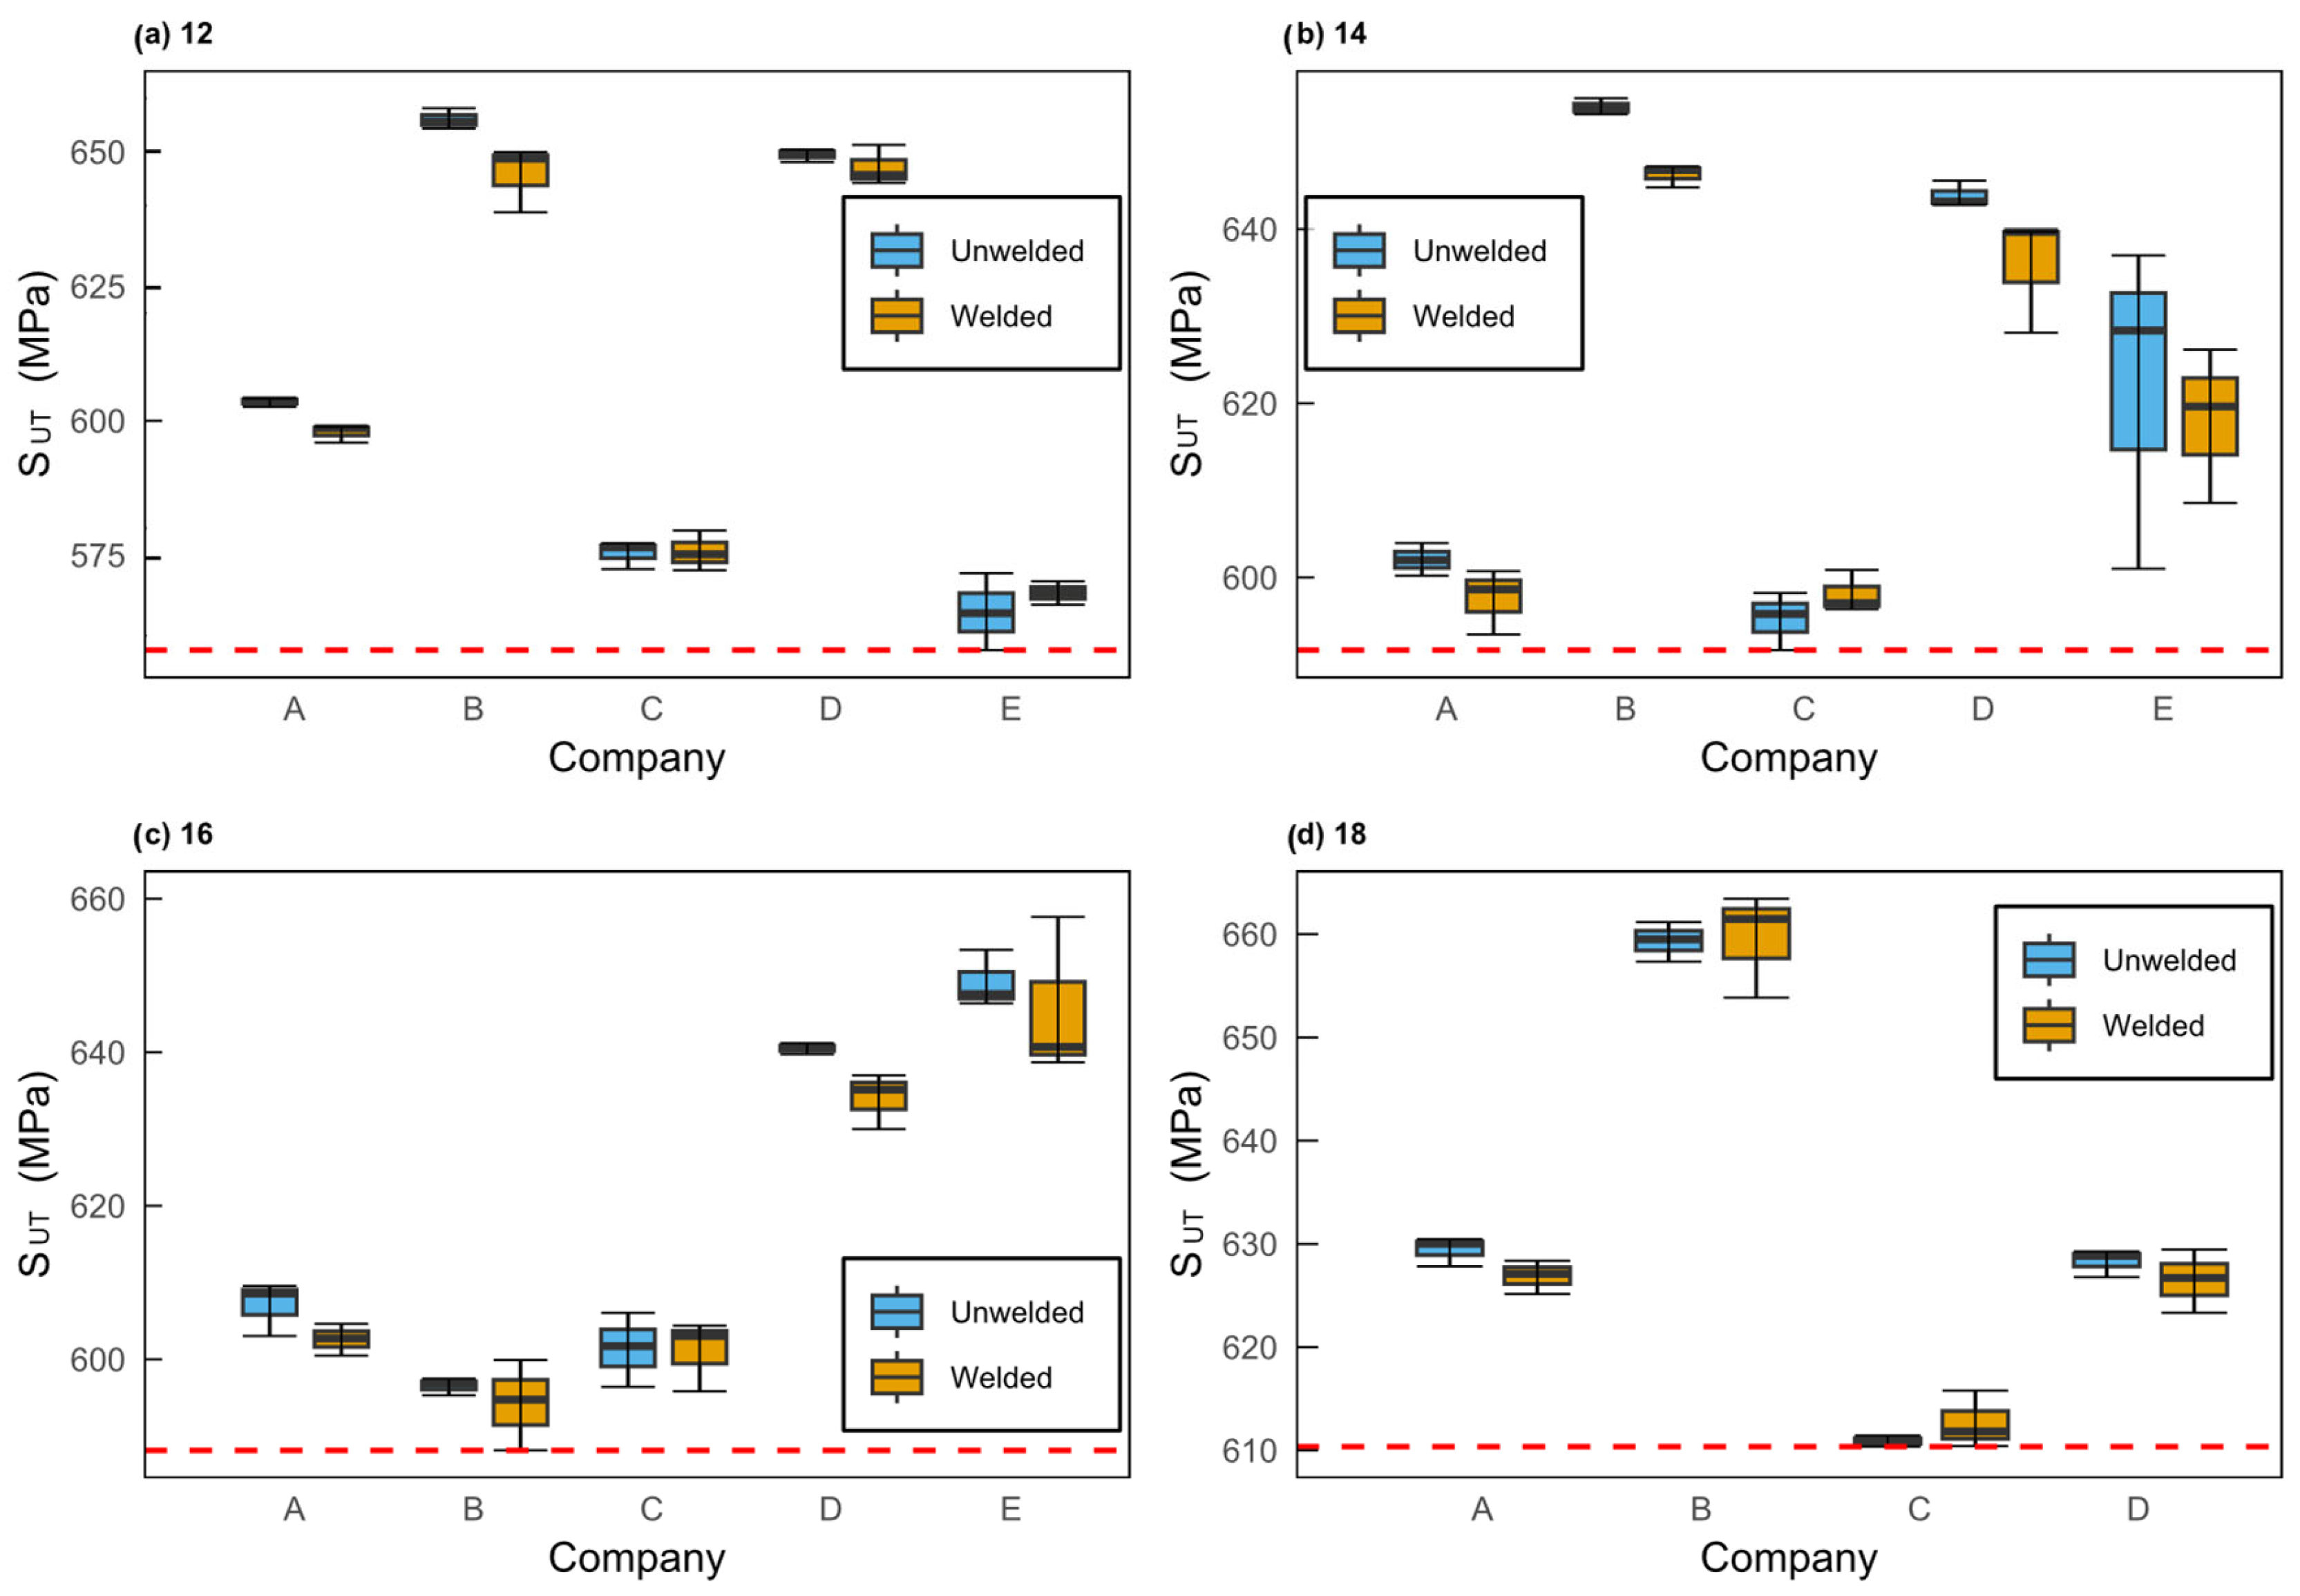
Figure 6 shows the tensile strength (SUT) of the steel bars under the same test conditions, differentiating between welded and non-welded bars. The red line represents the minimum value recorded for each diameter. In general, all measurements are above the 550 MPa threshold required by the ASTM A706 standard [43], so all commercial brands meet the standard and are suitable for the required service. The lowest resistance is presented in company C for the 12 mm diameter, with a value of 557.34 MPa, only 7.34 MPa above the normative limit.
The greatest dispersion is identified in company E for 14 mm unwelded bars (Figure 6b), with an interquartile range (IQR) of 17.993 MPa and a coefficient of variation (CV) of 3.02%, which, although maintaining high homogeneity according to statistical criteria, reflects considerable variability between samples. In 16 mm welded bars from the same company (Figure 6c), high dispersion is also observed, with an IQR of 9.471 MPa and a CV of 1.61%. As in the case of yield strength (SY), company E shows the greatest variability, suggesting differences in manufacturing processes compared to other companies [1]. On the other hand, companies A, B, and D show a low dispersion in all diameters, suggesting more uniform and controlled production processes. In general terms, the SUT values between welded and unwelded bars are similar. A particular case is observed in company B for the 18 mm diameter, where the welded bars reach an average of 659.586 MPa, exceeding the unwelded ones by 0.248 MPa. However, in most cases, the welded bars show a slight decrease in tensile strength, as was also observed for yield strength SY, shown in Figure 6. This behavior is expected, since the increase in temperature due to welding can decrease the mechanical strength [2].
The negative effects of welding are especially noticeable in company E for the 14 and 16 mm diameters, where not only a reduction in SUT is observed but also a greater dispersion of the welds. In the case of 16 mm welded bars, although the CV remains below 5%, the high IQR suggests that some samples could be affected by defects, which would compromise the integrity of the joint and, therefore, the mechanical strength [14,47].
Finally, companies B and D have the highest SUT values in the 12, 14, and 18 mm diameters, which indicates adequate control in the manufacture of their bars and, in the case of welded bars, a well-executed joining process. On the other hand, companies A and C show the lowest values, which could be associated with differences in manufacturing processes [1]. Company E, in addition to registering intermediate values, is distinguished by its high variability, which reflects possible inconsistencies in the welding procedures.

3.1.3. Ratio SUT/SY

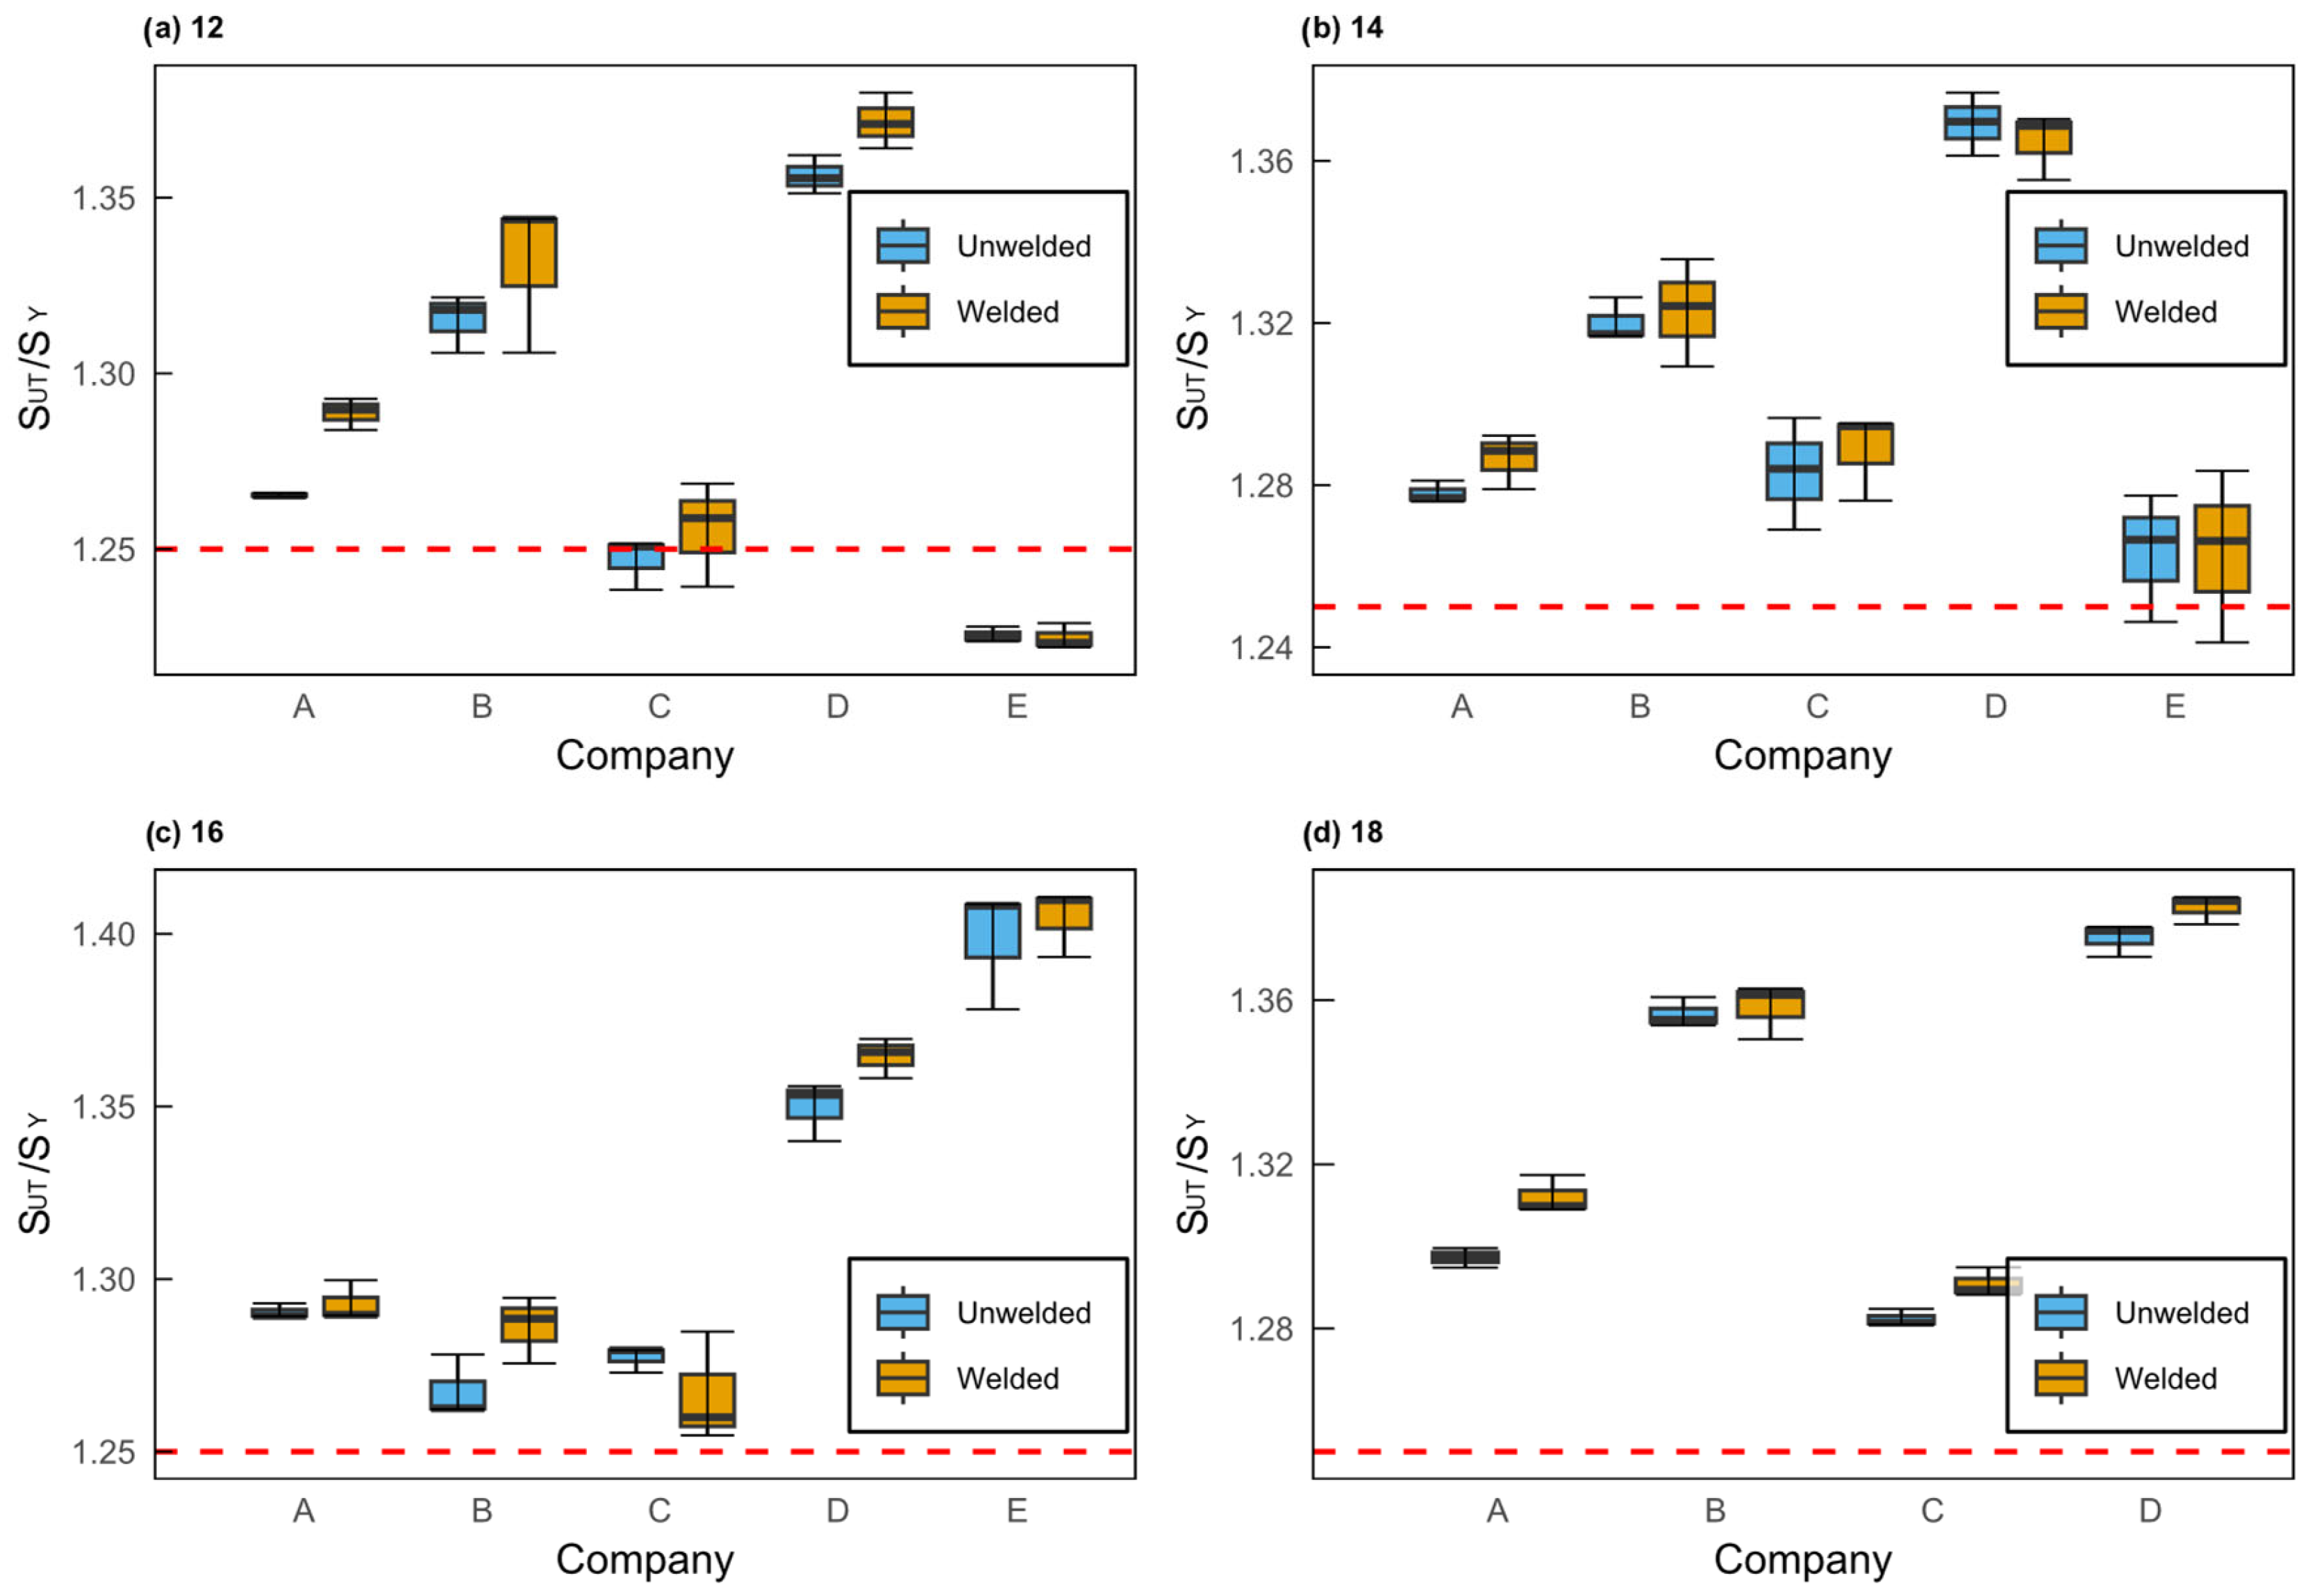
Figure 7 shows the relationship between tensile strength (SUT) and yield strength (SY) for 12, 14, 16, and 18 mm reinforcing steel bars under the same test conditions. Welded and unwelded bars are compared, and the minimum threshold of 1.25 required by the standard ASTM A706/A706M [43] is included.
In the case of 12 mm bars (Figure 7a), companies A, B, and D comply with the minimum value established. On the other hand, companies C and E present results close to or below the threshold. Although the medians for both states slightly exceed the minimum value in company C, some samples are at the lower limit. The most compromised situation is observed in E, where all samples, both welded and unwelded, show a low ratio, despite their remarkable homogeneity (CV of 0.18% and IQR of 0.002 MPa in welded bars).
For the 14 mm diameter (Figure 7b), companies A, B, C, and D satisfactorily comply with the regulatory requirement. However, in company E, samples below 1.25 are identified, although the medians remain within the allowed range. Therefore, when looking at their medians, it can be stated that all companies comply with the specified minimum ratio. The fact that the 12 mm and 14 mm steel bars in company E have values below 1.25 indicates that the difference between tensile strength and yield strength SUT/SY is small, suggesting a material with lower plastic deformation capacity before failure. In consequence, it can present low ductility of the steel, which is not desirable since, being steel reinforcing bars, they are used in structural applications, and what is sought in these cases is that they present high ductility and serve as structural reinforcement [5]. In addition, this characteristic is not desirable in structural applications, especially in seismic zones where adequate ductility is required [7]. A sample of this problem is observed in the 12 mm bars of company E, where, despite an adequate tensile strength, the low value of SY results in an SUT/SY ratio that does not reach the required threshold, thus compromising the material’s ability to withstand loads.
For the 16 mm diameter (Figure 7c), the results show that all the companies comply with the standard. However, company E shows greater variability in the results, in contrast to what was observed for the smaller diameters. In this case, most of the samples maintain a stable mechanical response, with less presence of extreme values and a more controlled dispersion. In the case of 18 mm bars (Figure 7d), the results confirm regulatory compliance by all the companies, without recording values below 1.25. The distribution of the data is more uniform, suggesting better control of the manufacturing process in this diameter.
A recurring pattern in Figure 7 is that welded members tend to have a slightly higher SUT/SY ratio than unwelded members. This phenomenon is particularly noticeable in companies such as E, where the variability is higher (IQR 0.021 MPa) and suggests that welding has not only modified the mechanical properties of the material but has also introduced a significant dispersion in the values obtained, which could be associated with an inadequate welding process. This behavior is due to the fact that upon thermal exposure, it significantly affects the microstructure by inducing grain growth in the heat-affected zone [48].

3.2. Analysis of Statistics Grouped by Diameter Without Considering Brands

In the previous section, an individual analysis by company and test condition was performed. In this section, a complementary approach is presented by pooling the data. A total of 114 tensile tests performed on reinforcing steel bars, both in the unwelded and welded condition, were analyzed. Table 4 summarizes the statistical parameters obtained for the mechanical properties evaluated, grouped only by nominal diameter (12, 14, 16, and 18 mm), regardless of the manufacturer.
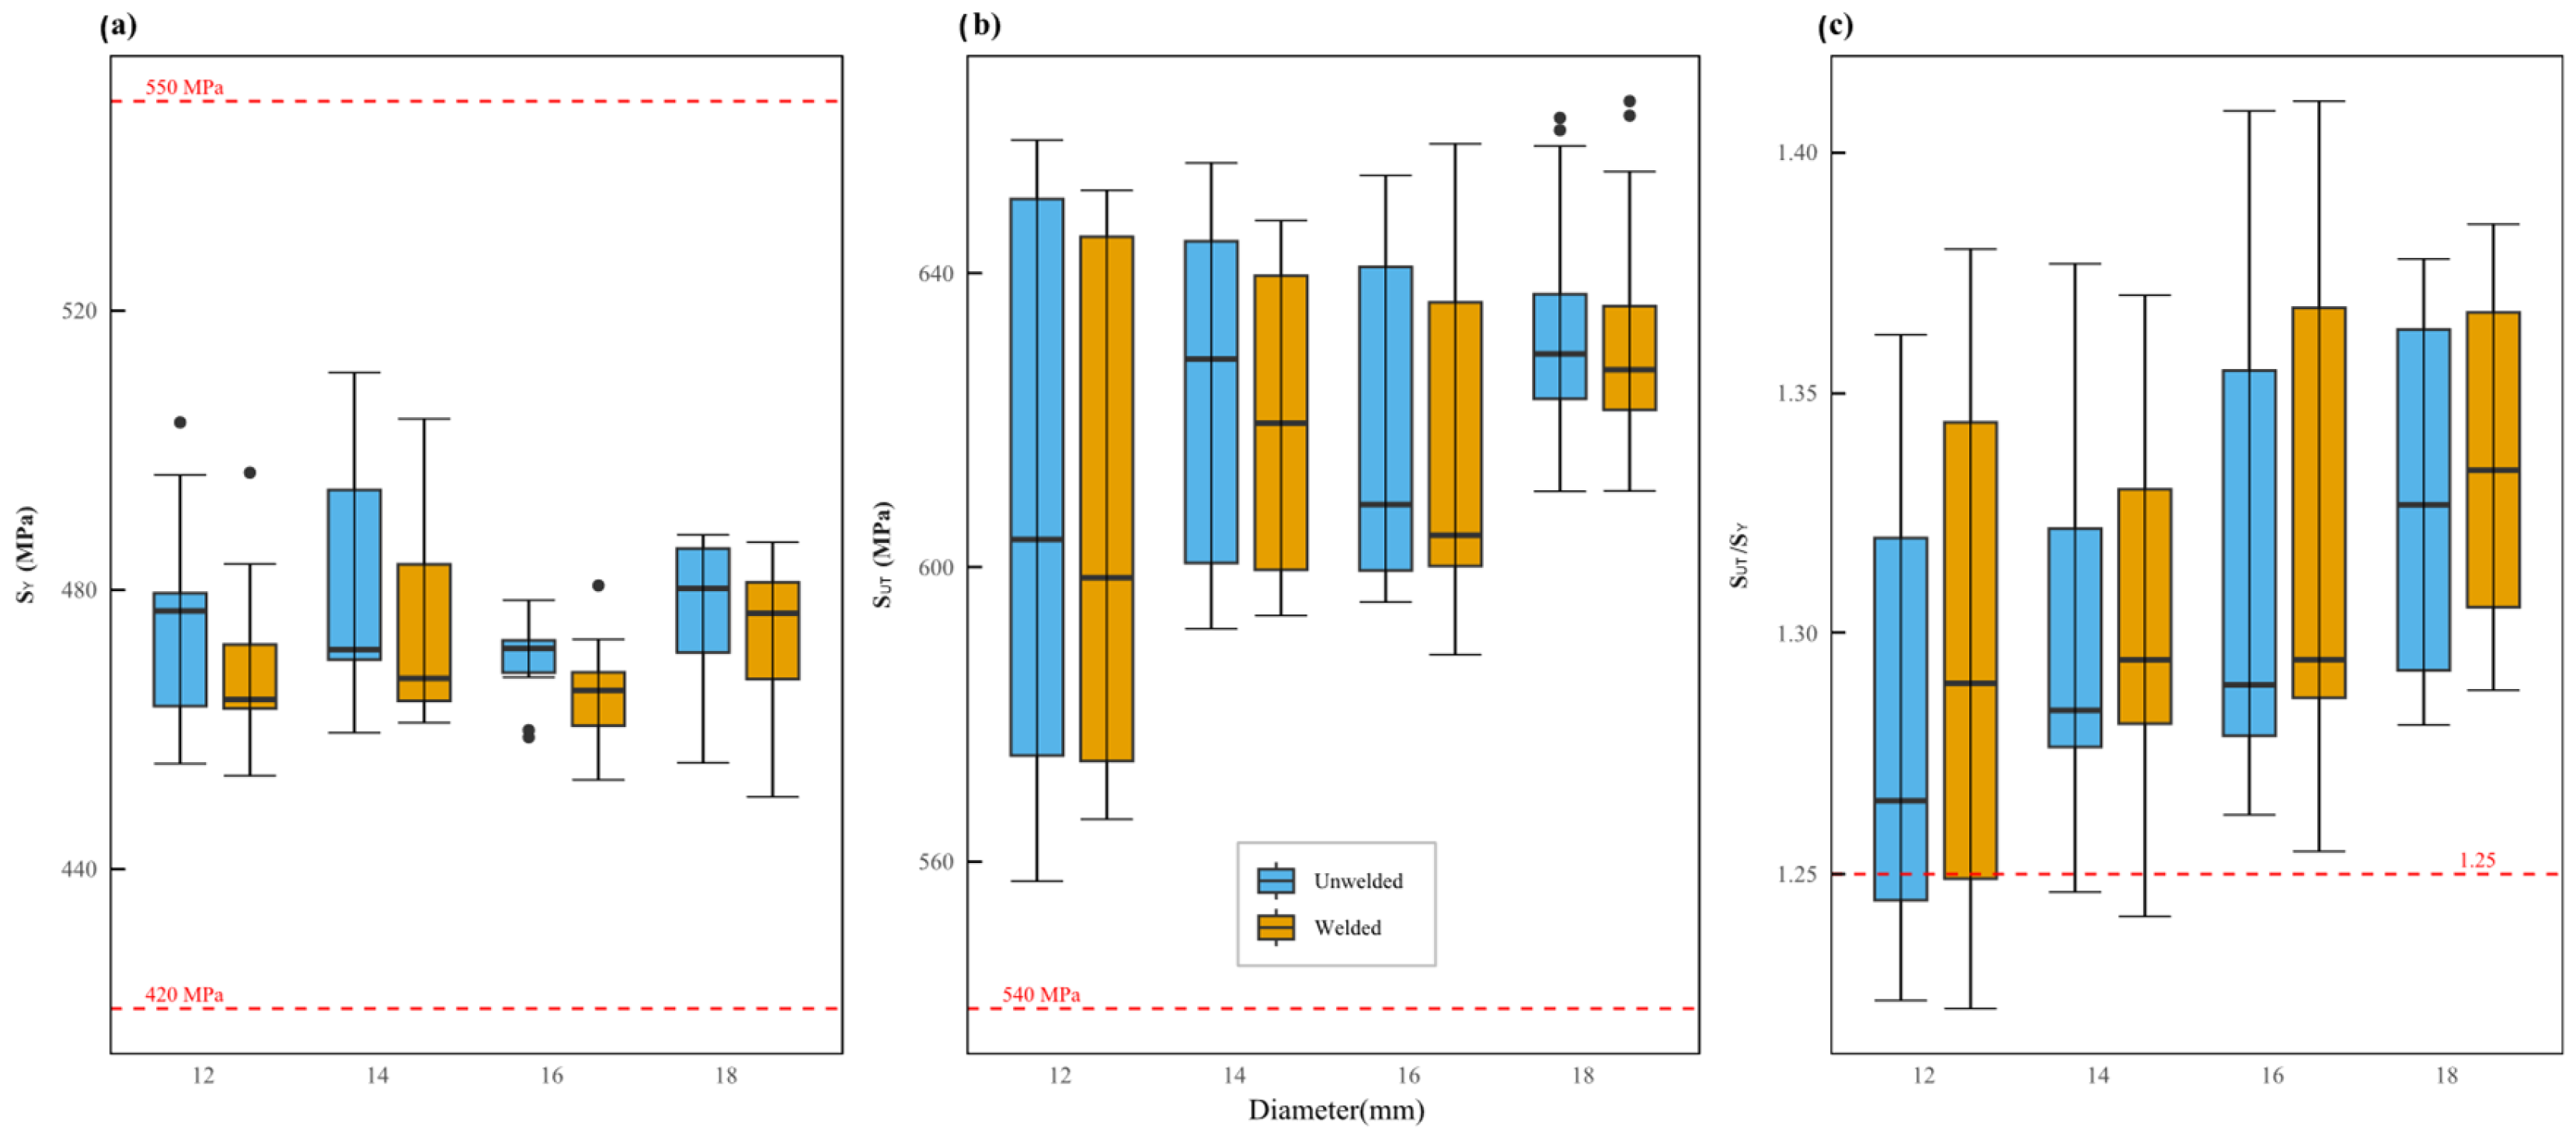
Figure 8 shows the comparison between welded and unwelded bars in terms of yield strength (SY), ultimate tensile strength (SUT), and SUT/SY ratio, considering only the diameter variable. This approach seeks to provide a more general representation of the mechanical behavior of reinforcing bars currently marketed in Ecuador. The reference lines in the graphs indicate the minimum values required according to ASTM A706/A706M: 420 MPa for SY, 540 MPa for SUT, and 1.25 for the SUT/SY ratio [43].
As for the yield strength SY (Figure 8a), all the diameters analyzed comply with the minimum required value. However, a greater dispersion is observed in the smaller diameters, especially in the unwelded 12 and 14 mm bars, with coefficients of variation higher than 3% (Table 5). In contrast, bars with diameters of 16 and 18 mm show a much more stable response, with CVs below 1.2% (Table 5), suggesting better control in the manufacturing process for these sizes.
The ultimate tensile strength SUT (Figure 8b) shows similar behavior. The 12 mm bars, both welded and unwelded, show the highest variability, with IQR exceeding 70 MPa and CV greater than 5.7%. This variability could be due, as we have already seen, to variations between brands when analyzed individually (Figure 7) by company and may also be associated with variation in production processes. From 14 mm upwards, the tensile strength tends to stabilize, and the average values remain clearly above the normative threshold. However, all diameters comply with the values specified in the standard.
Regarding the SUT/SY ratio (Figure 8), all samples meet the minimum requirement of 1.25. However, the 12 mm welded bars show values close to the limit, accompanied by relatively high variability (CV of 4.27%). This could compromise their plastic deformation capacity, especially under seismic loading conditions, where reinforcing bars are required to exhibit ductile behavior.
As the diameter increases, the mechanical behavior becomes more uniform. At 16 and 18 mm diameters, the SUT/SY ratio reaches more stable values with high homogeneity, according to CV coefficients of variation less than 3.5%, suggesting that these bars offer more reliable performance. This pattern also reflects better manufacturing process control in larger-cross-section bars. Finally, it is worth noting that welded bars show a slight decrease in strength and greater dispersion, especially in smaller diameters. Although they meet the minimum requirements, their performance shows a greater sensitivity to the variability in the manufacturing process [49].
As part of the pooled analysis, the statistical distribution of mechanical properties was explored at the global level, grouping the results of the 57 tests only by welded and non-welded conditions, without considering differences between brands or diameters. This grouping allows for a general evaluation of the response of the mechanical properties, yield strength (SY), ultimate tensile strength (SUT), and the SUT/SY ratio and for determining possible effects attributable to the welding process, regardless of the manufacturer or the geometry of the bars.
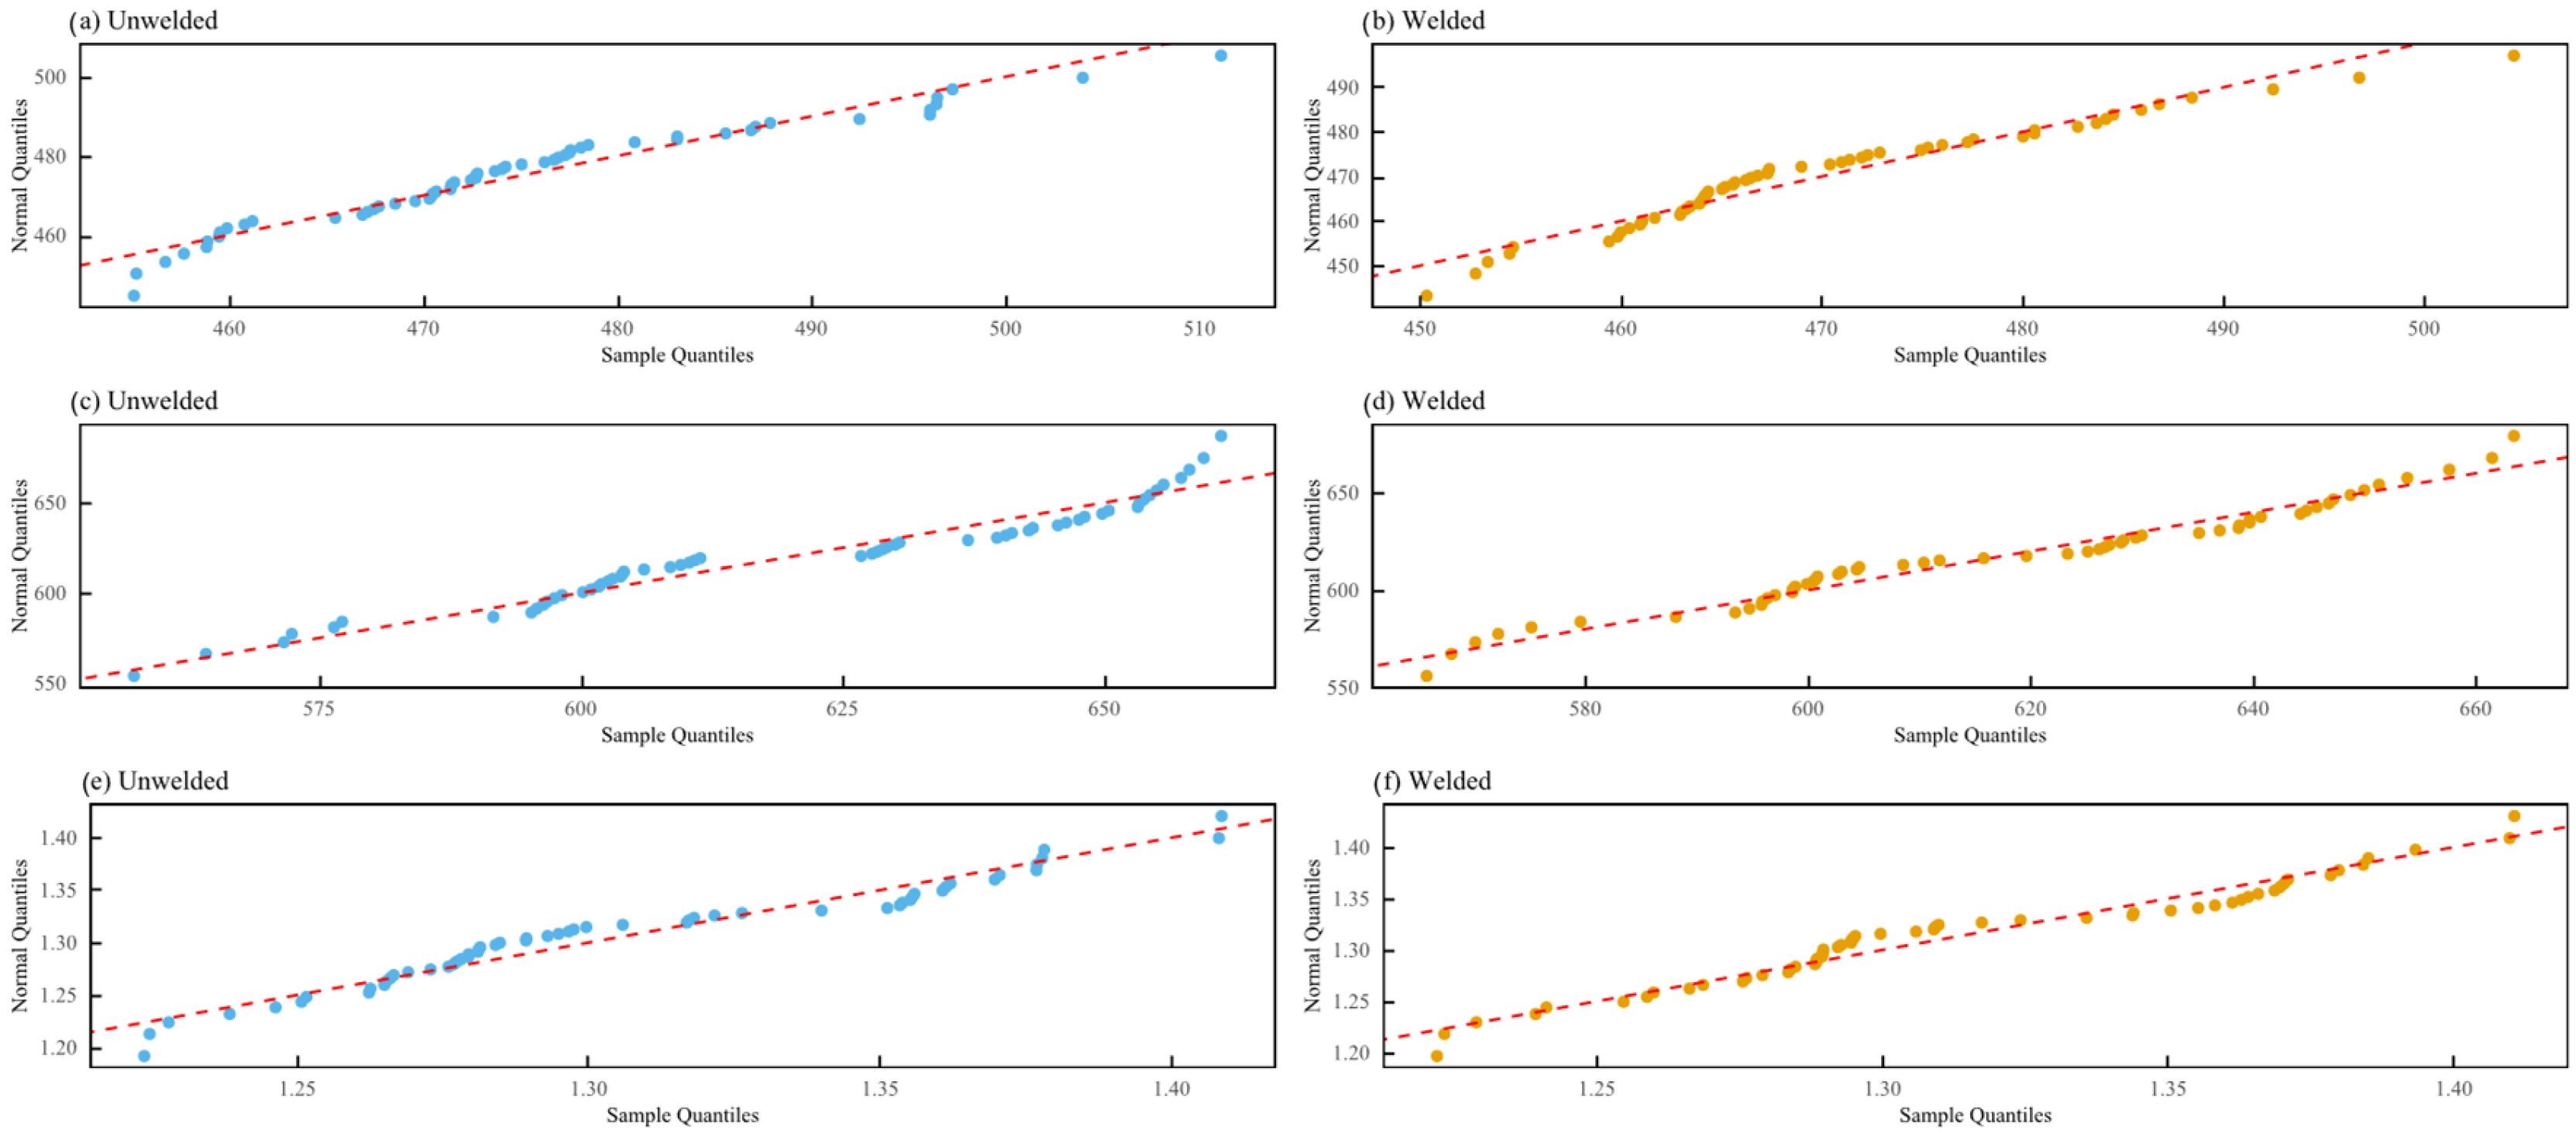
To determine the distribution of these variables and establish the validity of the use of parametric tests in the comparative analyses, three normality tests were applied: Shapiro–Wilk, Anderson–Darling, and Lilliefors [9]. The Shapiro–Wilk test was selected as the main decision criterion due to its recognized statistical power in small samples [41]. The results of these tests are summarized in Table 5, considering a p-value < 0.05 as indicative of a non-normal distribution, rejecting the null hypothesis that they meet the normal distribution.
The results indicate that, in the case of the unwelded bars, none of the properties follow a normal distribution. In contrast, for the welded bars, the ultimate tensile strength (SUT) is the only property that complies with normality under the Shapiro–Wilk and Lilliefors criteria. (p > 0.05). This result suggests that the welding process could be associated with an alteration in the mechanical properties.
Figure 9 presents the smoothed histograms of each mechanical property together with two reference curves. The continuous blue line corresponds to the empirical probability density estimated using kernel density estimation (KDE), which provides a non-parametric representation of the distribution of the measured data. The red dashed line represents the theoretical normal distribution constructed from the mean and standard deviation of each group. Clear deviations between both curves are observed, particularly for SY and the SUT/SY, ratio, visually supporting the rejection of the null hypothesis in most cases.
Figure 10 shows the Q–Q plots used to visually assess the agreement between the data and the theoretical normal distribution [50]. For the unwelded bars, all properties exhibit a noticeable deviation from the reference line, confirming non-normality. In contrast, for the welded bars, the distribution of tensile strength (SUT) (Figure 10d) displays acceptable alignment, consistent with the statistical tests indicating normality. Overall, the KDE histograms and Q–Q plots corroborate the conclusions derived from the normality tests.
Given the non-normal behavior of most variables, the nonparametric Mann–Whitney U test was applied to evaluate whether significant differences exist between welded and unwelded conditions [42]. The results, summarized in Table 6, show that for yield strength (SY), p-values were below 0.05, indicating a statistically significant difference between groups. This suggests that welding has a measurable influence on this property. Conversely, for the tensile strength (SUT) and the SUT/SY ratio, p-values of 0.3859 and 0.2716 indicate no significant differences between the two conditions.
In summary, the pooled analysis indicates that welding can partially modify the mechanical response of reinforcing steel bars, particularly affecting their yield strength (SY), while the ultimate strength (SUT) and the (SUT/SY) ratio remain statistically similar between welded and unwelded samples.
The validity of these conclusions is supported by graphical representations. Figure 10 shows histograms smoothed using kernel density estimation (KDE) together with the theoretical normal curve represented by a red dashed line constructed from the mean and standard deviation of each group. There are notable differences between the two curves, especially in SY and SUT/SY, which visually support the rejection of the null hypothesis in most cases.

3.3. Analysis of the Fracture Zone

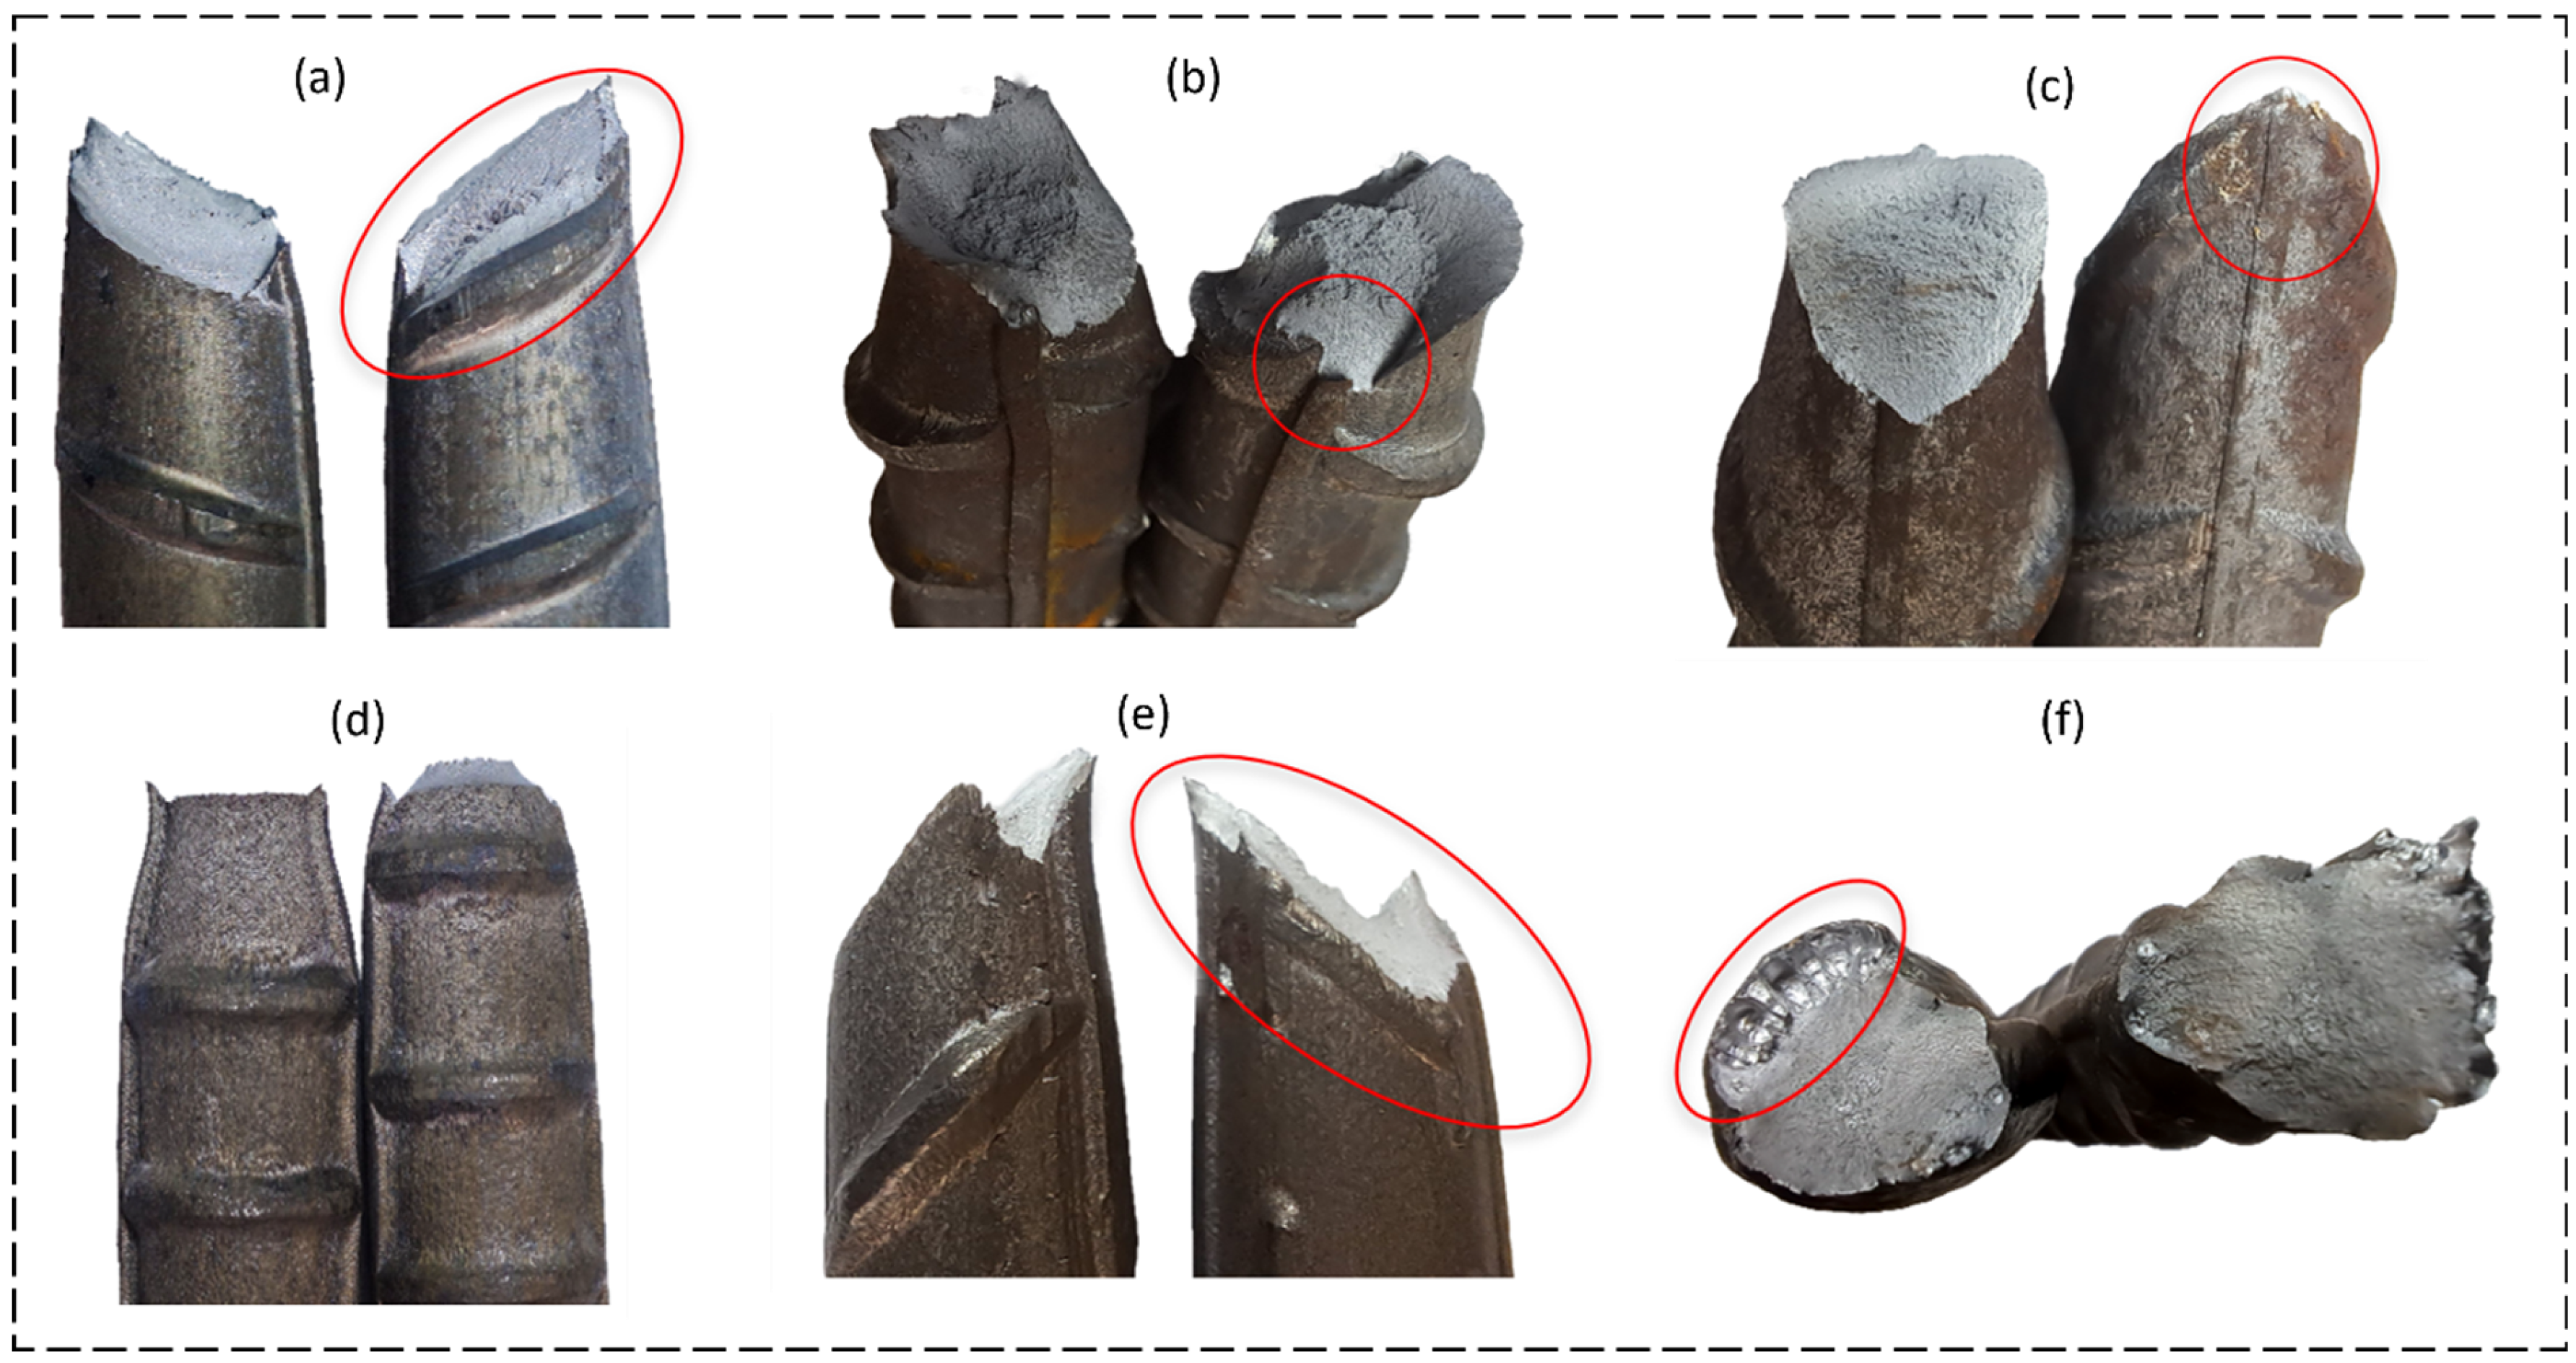
The fracture initiation zones of the tensile specimens were analyzed to determine the influence of shoulder geometry on the location where the fracture started. Five fracture initiation locations were identified in the unwelded specimens and seven in the welded specimens. Most of these initiation zones are associated with geometric differences between reinforcing steel bars, such as the inclination, height, and spacing of the rolled ribs. Figure 11 presents the list of the fracture initiation regions identified.
Fractures initiating in the base material typically produced a larger necking zone, resulting in the classic cup-and-cone morphology characteristic of ductile materials, as shown in Figure 11a–e. Similar to the findings reported by Hojat Jalali et al. [2], this fracture morphology was mainly observed in specimens exhibiting more pronounced necking prior to failure.
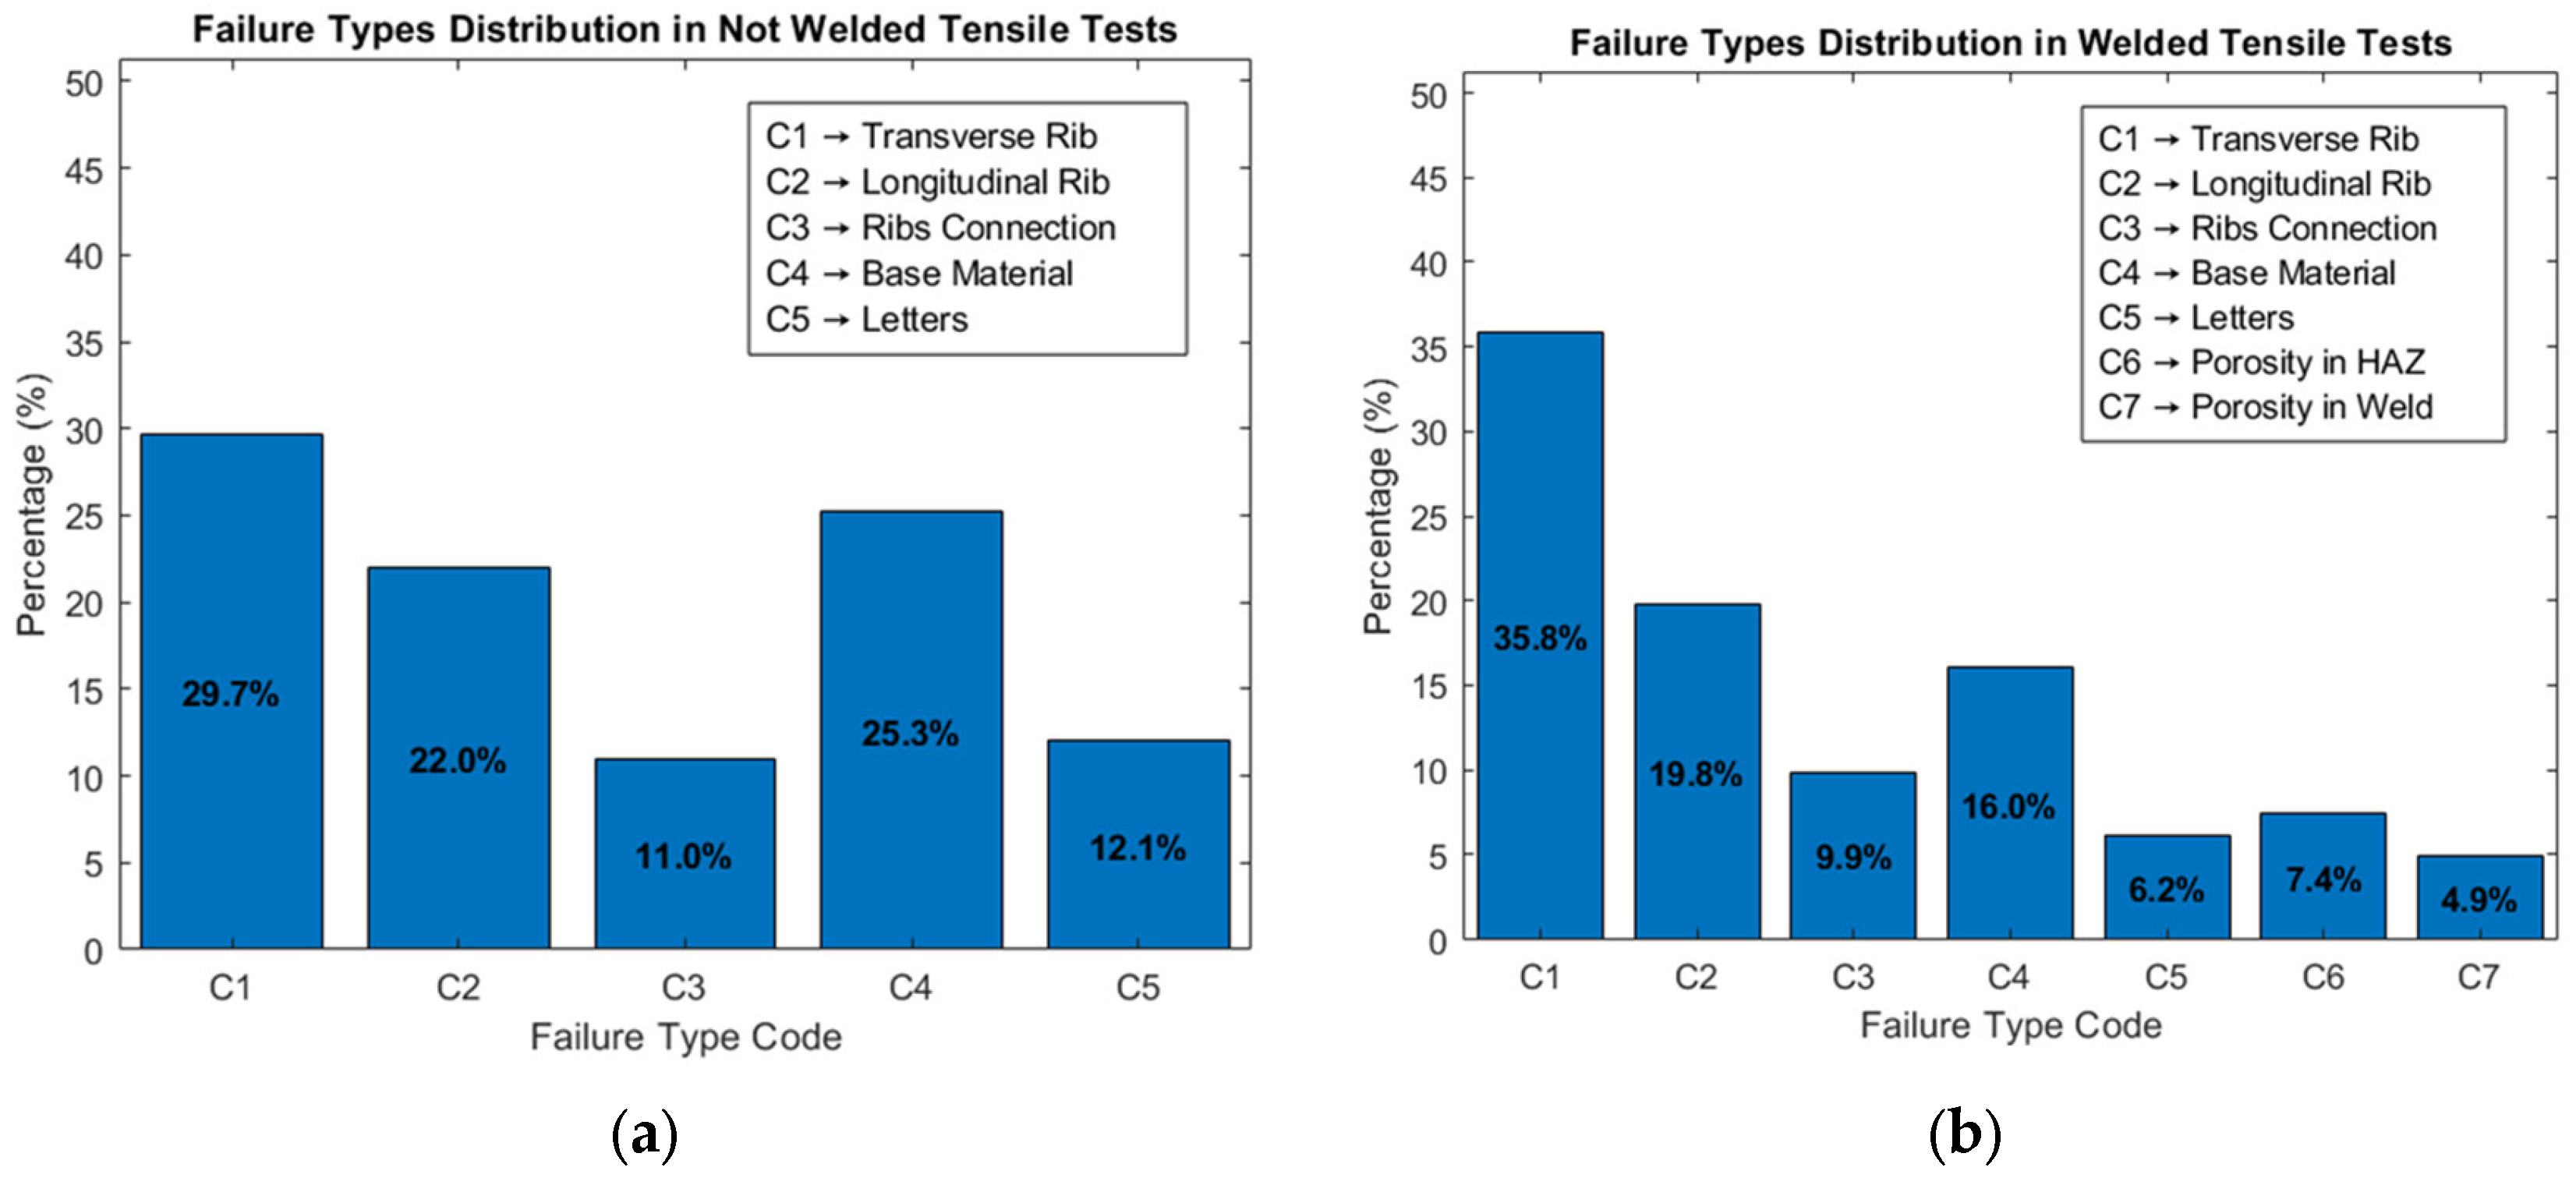
Figure 12a shows the distribution of fracture initiation zones in the unwelded specimens. The results indicate that the geometry of the rolled features significantly influences the location of fracture initiation. The most frequent initiation zone corresponds to the region of the transverse ribs (29.7%). In the welded specimens, the same trends were observed (Figure 12b); however, the proportion of fractures initiating near transverse ribs increased, and additional cases of fractures associated with porosity in the weld bead were identified.
A detailed analysis by brand confirms that the rolled geometry has a considerable influence on the fracture initiation location. Brands A, D, and E exhibit a high proportion of fractures starting near the transverse ribs. In particular, brand E shows 61.8% of fractures initiating in this region, indicating that its rib geometry acts as a strong stress concentrator. In contrast, brands B and C predominantly exhibit fractures initiating in the base material, suggesting that the inclination and shape of their ribs are not the primary contributors to fracturing in these specimens.

3.4. Bending Tests Response

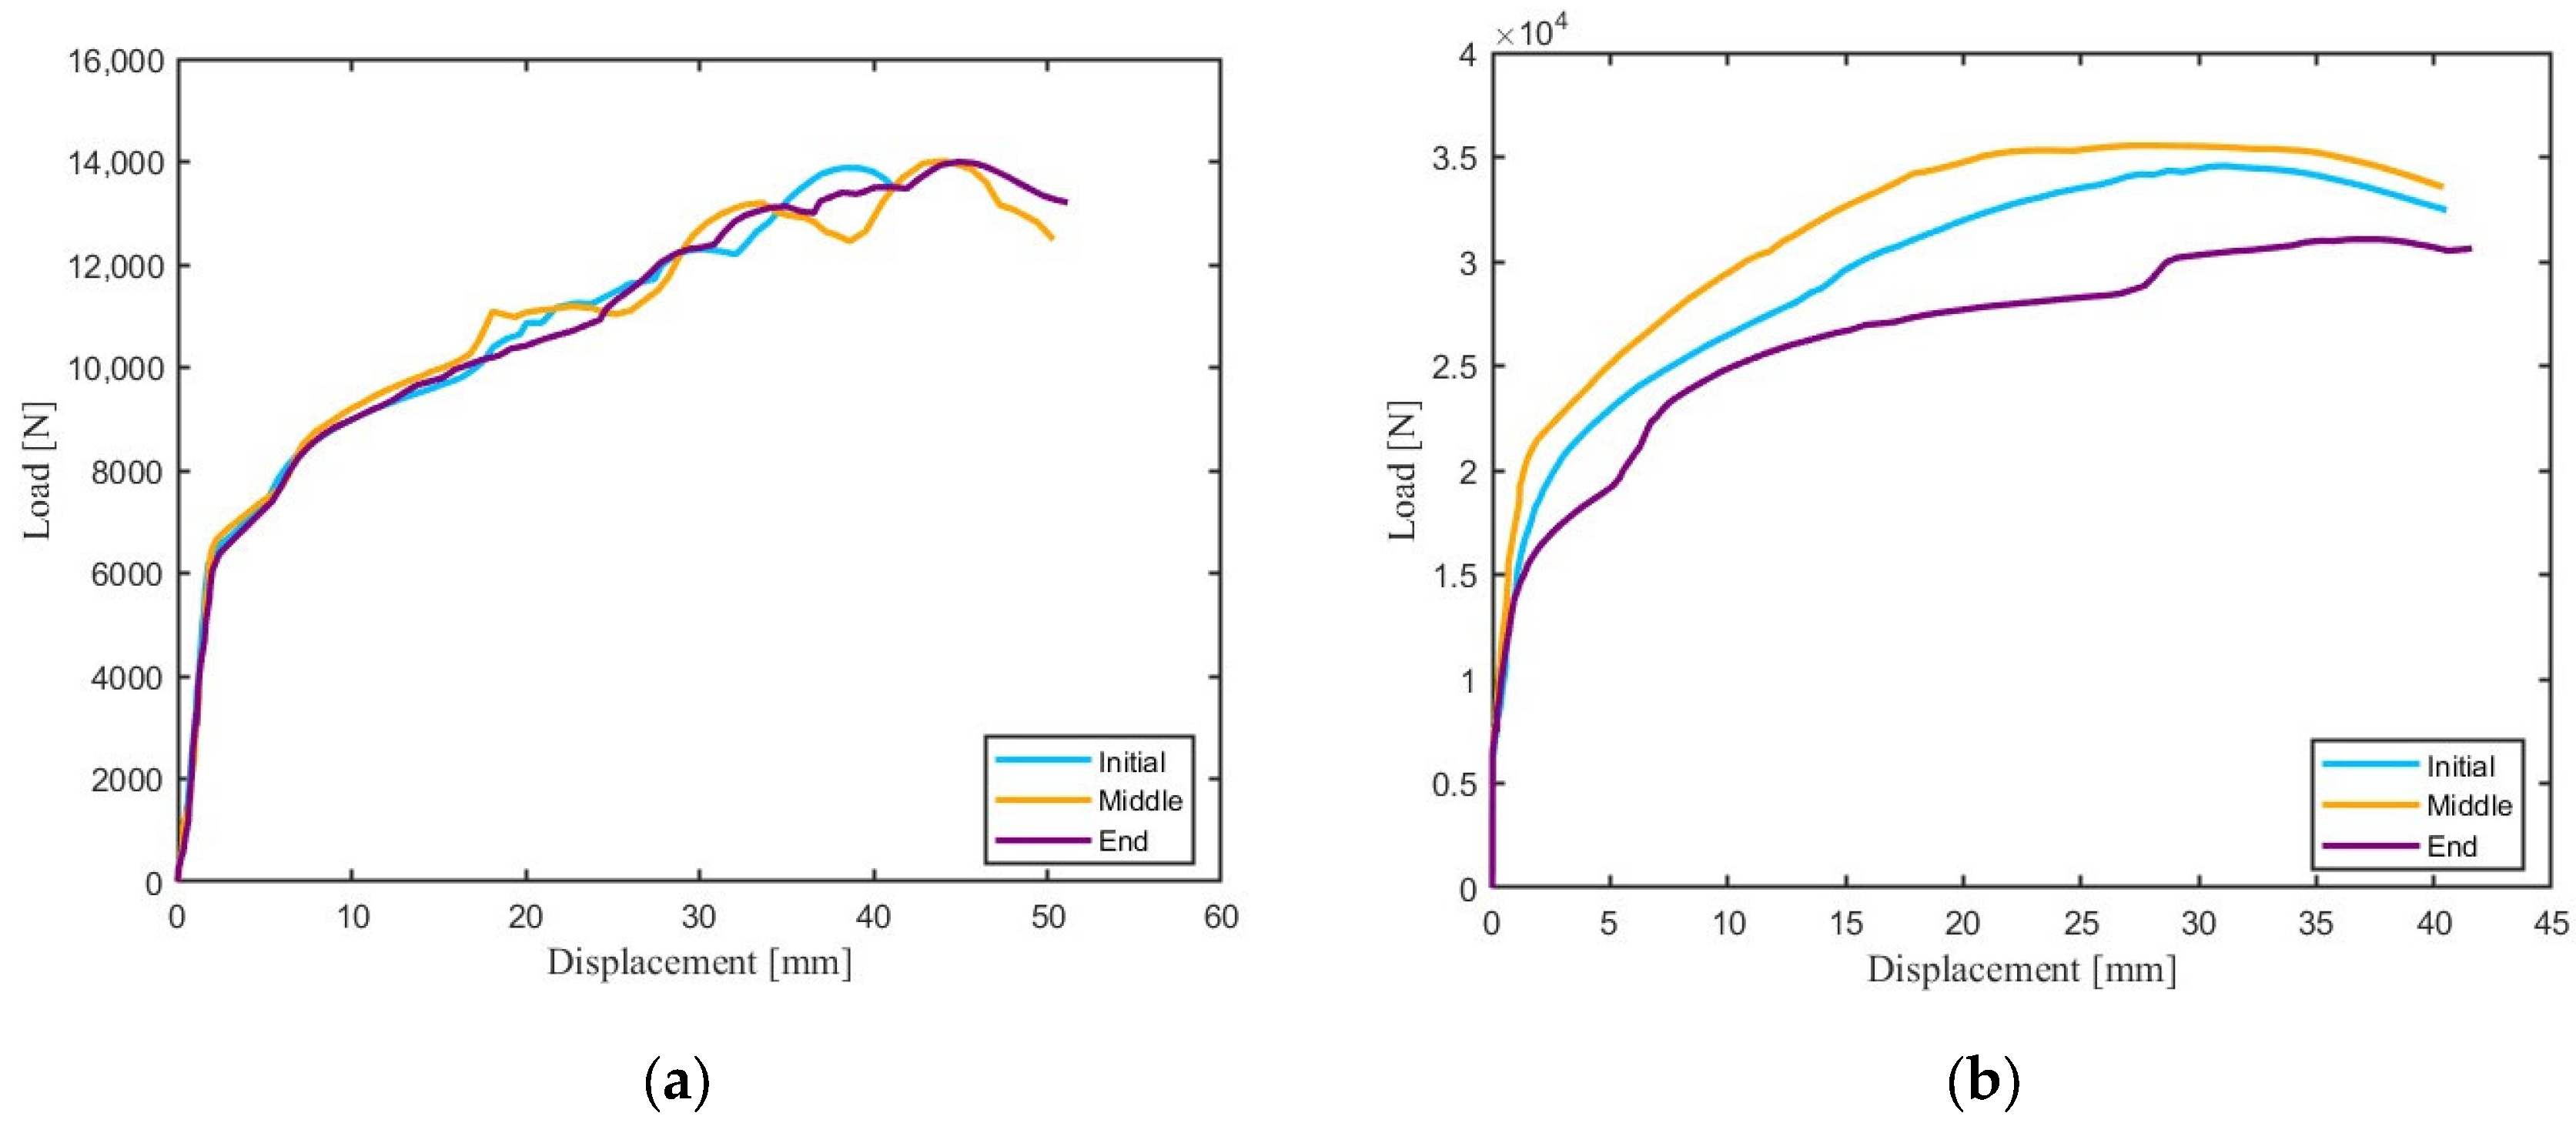
Figure 13 presents the load–displacement response of the bending tests [12,30], conducted on welded and unwelded specimens. In the unwelded condition, all brands exhibited homogeneous mechanical behavior during bending: as the bars entered the plastic deformation regime, the expected hardening mechanisms were activated, producing consistent load-carrying trends across all diameters. This uniformity indicates adequate ductility and a stable response typical of ASTM A706 Grade 60 steels.
The welded specimens, however, showed a markedly different behavior. Significant variations were observed not only in the elastic–plastic transition but also in the maximum load levels reached before bending to 180°. In several cases, the welded bars exhibited premature loss of load capacity associated with reduced ductility in the heat-affected zone [51,52]. The dispersion in mechanical response confirms that the localized thermal cycle of the welding process alters the microstructure and affects the steel’s ability to accommodate bending deformation.
According to the interpretation criteria of ISO 7438, a specimen is considered to satisfactorily pass the bending test only if no visible surface cracks appear after bending, without the aid of magnification. In this study, all unwelded specimens from all commercial brands fulfilled this requirement, regardless of diameter. This confirms that, in the absence of welding, the reinforcing bars possess sufficient ductility to undergo 180° bending without compromising material integrity.
In contrast, the welded specimens exhibited a critical reduction in ductility. Only 3 out of the 57 welded samples were able to complete the 180° bend without visible cracking. The remaining welded bars developed cracks either at the tensile face or adjacent to the weld bead, evidencing the detrimental effect of welding on bending performance. These findings align with the load–displacement responses, where the welded bars showed lower bending capacity and early onset of localized deformation.
The results clearly demonstrate that the welding process significantly compromises the bending performance of reinforcing steel bars, especially for larger diameters. This evidence supports the conclusions of the study and emphasizes the need for strict control—or complete avoidance—of welding operations in reinforcing bars intended for structural applications requiring high ductility [53,54].

4. Conclusions

This study analyzed five brands of ASTM A706 reinforcing steel rods available in the Ecuadorian market. Of the 228 specimens analyzed by tensile and bending tests, half were evaluated in the welded condition. The main findings of this work are summarized below:
  • It was identified that the welding process generates a slight decrease in mechanical properties. Yield strength decreases from 475 to 470 MPa and ultimate tensile strength from 620 to 617 MPa, while the SUT/SY ratio is not altered. Despite the decrease in mechanical response, the welded specimens are within the restrictions established by ASTM A706/A706M.
  • Bending tests revealed the influence of diameter on bending strength, as well as a marked difference in the performance of welded versus unwelded rods. The 57 unwelded specimens satisfactorily fulfilled the 180° bend without cracks. Meanwhile, in the welded specimens, only 3 out of 57 samples were able to reach the bending requirement; this shows that the welding process compromises the ductility of reinforcing steel bars.
  • Statistical analysis of the tensile response on welded and unwelded reinforcing bars shows that both welded and unwelded bars meet the requirements of ASTM A706/A706M. Welding introduces a slight decrease in mechanical properties and increases dispersion in samples with diameters less than 14 mm, especially in the E manufacturer.
  • For the larger-diameter bars (16 and 18 mm), a more homogeneous distribution in the mechanical response of the welded specimens is observed. This suggests that the effect of welding is more critical in smaller-diameter bars, since the reduction in the cross-sectional area can generate residual stresses affecting its strength, which may compromise its structural integrity.

Author Contributions

Conceptualization, L.A.-J.; methodology, L.A.-J., D.R.-P. and J.R.-V.; software, B.F.C.-G.; D.R.-P. and J.R.-V.; validation, L.A.-J., B.F.C.-G. and G.O.B.; formal analysis, L.A.-J. and G.O.B.; investigation, B.F.C.-G., D.R.-P. and J.R.-V.; writing—original draft preparation, D.R.-P. and J.R.-V.; writing—review and editing, L.A.-J. and G.O.B. All authors have read and agreed to the published version of the manuscript.

Funding

The authors acknowledge the support provided by the Universidad de las Fuerzas Armadas ESPE.

Data Availability Statement

The raw data supporting the conclusions of this article will be made available by the authors on request.

Acknowledgments

The authors would like to thank the Universidad de las Fuerzas Armadas ESPE for supporting publishing research.

Conflicts of Interest

The authors declare no conflicts of interest.

References

  1. Saleem, M.A.; Saleem, M.M.; Aziz, M.; Ahmed, T.; Aslam, F.; Mohamed, A. Statistical insight into the quality of reinforcing steel bars used in construction projects. Case Stud. Constr. Mater. 2024, 21, e03698. [Google Scholar] [CrossRef]
  2. Hojat Jalali, H.; Soltanabadi, R.; Abuhishmeh, K.; Soltanianfard, M.A.; Balderrama, J.A.; Correa, C.O.; Cornejo, J.S. High temperature effects on monotonic and low-cycle fatigue performance of different high strength rebars. Eng. Struct. 2025, 327, 119585. [Google Scholar] [CrossRef]
  3. Teran, J.; Arroyo-Olvera, M.; Mauricio, M.; Rendón, M.; López, M. Efecto de la soldadura en las propiedades mecánicas de dos tipos de acero de refuerzo. In Proceedings of the XXVIII Congreso Internacional Anual De La Somim, Bogotá, Colombia, 21–23 September 2022. [Google Scholar]
  4. Quiel, S.E.; Irwin, C.H.; Naito, C.J.; Vermaak, N. Mechanical Characterization of Normal and High-Strength Steel Bars in Reinforced Concrete Members under Fire. J. Struct. Eng. 2020, 146, 04020110. [Google Scholar] [CrossRef]
  5. Chen, W.; Zhen, H.; Liu, F.; Wu, B.; Li, H.; Wu, Z.; Huang, J.; Zhu, H.; Li, L.; Xiong, Z. Experimental and Theoretical Study on Tensile Mechanical Properties of GFRP–Steel Composite Bars. Buildings 2024, 14, 2513. [Google Scholar] [CrossRef]
  6. Abbas, S.; Hameed, R.; Nehdi, M.; Afzal, M.; Shaukat, S. Investigation of reinforcing steel rebar manufactured from local scrap at various finishing rolling temperature. Case Stud. Constr. Mater. 2023, 19, e02499. [Google Scholar] [CrossRef]
  7. Nair, S.A.O.; Mohandoss, P.; Ram, K.; Adnan, T.; Pillai, R.G. Mechanical characteristics of Quenched and Self-Tempered (QST or TMT) steel reinforcing bars used in concrete structures. Constr. Build. Mater. 2023, 363, 129761. [Google Scholar] [CrossRef]
  8. Dabiri, H.; Kheyroddin, A.; Dall’Asta, A. Splice methods used for reinforcement steel bars: A state-of-the-art review. Constr. Build. Mater. 2022, 320, 126198. [Google Scholar] [CrossRef]
  9. Carrillo, J.; Lozano, H.; Arteta, C. Mechanical properties of steel reinforcing bars for concrete structures in central Colombia. J. Build. Eng. 2021, 33, 101858. [Google Scholar] [CrossRef]
  10. Danso, H.; Sumaila, M. Experimental Investigation into Strength Properties of Ribbed Mild Steel Reinforcing Bars (RMSRBs) Produced by Local Companies in Ghana. Int. J. Eng. Mater. Manuf. 2024, 9, 41–51. [Google Scholar] [CrossRef]
  11. Liu, Y.; Miao, Z.; Yuan, H.; Geng, X.; Hogan, L.; Zhu, M. Experimental study of tensile behaviour of rebars with simulated pitting corrosion. Constr. Build. Mater. 2024, 445, 137952. [Google Scholar] [CrossRef]
  12. Abuhishmeh, K.; Hojat Jalali, H.; Ebrahimi, M.; Soltanianfard, M.A.; Correa, C.O.; Cornejo, J.S. Behavior of high strength reinforcing steel rebars after high temperature exposure: Tensile properties and bond behavior using pull-out and end beam tests. Eng. Struct. 2024, 305, 117730. [Google Scholar] [CrossRef]
  13. Aloisio, A.; Lavorato, D.; Xue, J.; Wu, J.; Rasulo, A.; Briseghella, B.; Nuti, C. The role of overstrength in welded joints for rebar substitution in damaged RC columns. Constr. Build. Mater. 2023, 409, 133952. [Google Scholar] [CrossRef]
  14. Schubnell, J.; Ladendorf, P.; Sarmast, A.; Farajian, M.; Knödel, P. Fatigue performance of high-and low-strength repaired welded steel joints. Metals 2021, 11, 293. [Google Scholar] [CrossRef]
  15. Carrillo, J.; Diaz, C.; Arteta, C.A. Tensile mechanical properties of the electro-welded wire meshes available in Bogotá Colombia. Constr. Build. Mater. 2019, 195, 352–362. [Google Scholar] [CrossRef]
  16. Cadoni, E.; Dotta, M.; Forni, D.; Tesio, N. High strain rate behaviour in tension of steel B500A reinforcing bar. Mater. Struct. Constr. 2015, 48, 1803–1813. [Google Scholar] [CrossRef]
  17. Abatta-Jácome, L.; Naranjo-Guatemala, C.; Naranjo-Torres, D.; Haro, E.E. Experimental Study of Low Cycle Fatigue in Welded Reinforcing Steel Bars ASTM A706 BT. In Communications in Computer and Information Science; Botto-Tobar, M., Zambrano Vizuete, M., Montes León, S., Torres-Carrión, P., Durakovic, B., Eds.; Springer Nature: Cham, Switzerland, 2023; pp. 3–15. [Google Scholar]
  18. Overby, D.; Kowalsky, M.; Seracino, R. Stress-strain response of A706 grade 80 reinforcing steel. Constr. Build. Mater. 2017, 145, 292–302. [Google Scholar] [CrossRef]
  19. Fernandez, I.; Bairán, J.M.; Marí, A.R. Corrosion effects on the mechanical properties of reinforcing steel bars. Fatigue and σ-ε behavior. Constr. Build. Mater. 2015, 101, 772–783. [Google Scholar] [CrossRef]
  20. Hassan, O.B.; Akin, O.O.; Lawan, A.; Amartey, Y.D. Mechanical and Chemical Properties of Reinforcement Bars Manufactured in Nigeria. Covenant J. Eng. Technol. 2021, 5, 56–68. [Google Scholar]
  21. Tristan, Y.; Taylor, S.; William, C.; Marc, M. Investigating the Mechanical Properties and Fracture Behavior of Welded-Wire Reinforcement. J. Mater. Civ. Eng. 2021, 33, 4021023. [Google Scholar] [CrossRef]
  22. Zhuang, Z.; Qian, X.; Zeng, L.; Lu, W.; Li, Z.; Xiang, Y. Response characterization on the microstructure, and mechanical and corrosion behavior of clad rebars of different weld materials. Case Stud. Constr. Mater. 2025, 22, e04316. [Google Scholar] [CrossRef]
  23. Bossio, A.; Lignola, G.P.; Prota, A. Theoretical effects of corrosion on lateral stress along reinforcement bars in concrete-NC-ND license. Procedia Struct. Integr. 2024, 64, 56–64. [Google Scholar] [CrossRef]
  24. AWS D1.4/D1.4M:2011; Structural Welding Code—Reinforcing Steel. American Welding Society: Miami, FL, USA, 2011.
  25. Sreeja, M.D. Behaviour of Steel Fibre Reinforced Concrete Beam under Cyclic Loading. IOSR J. Mech. Civ. Eng. 2013, 6, 1–4. [Google Scholar] [CrossRef]
  26. Leramo, R.O.; Adekoya, L.O.; Kilanko, O.; Oyedepo, S.O.; Eluwa, S.E.; Babalola, P.O.; Adeosun, S.O.; Leramo, N.T.; Aiyedun, P.O.; Ohunakin, O.S.; et al. A comparative analysis of the chemical composition and compliance level to established standards of concrete reinforcement steel rods rolled in Nigeria. Heliyon 2022, 8, e09597. [Google Scholar] [CrossRef]
  27. Loporcaro, G.; Cuevas, A.; Pampanin, S.; Kral, M.V. Strain-ageing effects on the residual low-cycle fatigue life of low-carbon steel reinforcement. Mater. Struct. Constr. 2022, 55, 35. [Google Scholar] [CrossRef]
  28. Shokrzadeh, M.; Nateghi-Alahi, F. Experimental study of seismic behavior and modification of the failure region of mechanical bar splices. Sharif Civ. Eng. J. 2025, 41, 84–97. [Google Scholar]
  29. Aiamsri, K.; Yaowarat, T.; Horpibulsuk, S.; Suddeepong, A.; Buritatum, A.; Hiranwatthana, K.; Nitichote, K. Bonding behavior of lap-spliced reinforcing bars embedded in ultra-high-performance concrete with steel fibers. Dev. Built Environ. 2024, 20, 100585. [Google Scholar] [CrossRef]
  30. Wu, D.; Ding, Y.; Su, J.; Li, Z.X.; Zong, L. Investigation on low-cycle fatigue performance of high-strength steel bars including the effect of inelastic buckling. Eng. Struct. 2022, 272, 114974. [Google Scholar] [CrossRef]
  31. Abatta-Jacome, L.; Caminos, L.; Gonzalez-Herrera, A.; Garcia-Manrique, J.M. Crack Growth Patterns of Aluminum Tubular Specimens Subjected to Cyclic Tensile Loads. Metals 2024, 14, 1094. [Google Scholar] [CrossRef]
  32. Richard, B.; Quiertant, M.; Bouteiller, V.; Delaplace, A.; Adelaide, L.; Ragueneau, F.; Cremona, C.; Richard, B.; Quiertant, M.; Bouteiller, V.; et al. Experimental and numerical analysis of corrosion-induced cover cracking in reinforced concrete sample. Comput. Concr. 2017, 18, 421–439. [Google Scholar] [CrossRef]
  33. Chen, J.; Agostini, F.; Shen, W.; Shao, J.; Bourbon, X.; Liu, S. Experimental and numerical studies of a reinforced concrete component subjected to corrosion. Mech. Res. Commun. 2023, 129, 104076. [Google Scholar] [CrossRef]
  34. Fröse, J.; Fischer, O. Influence of Rib Geometry on the Bond Strength of Reinforcing Steel in Coils. Lect. Notes Civ. Eng. 2023, 349 LNCE, 536–545. [Google Scholar] [CrossRef]
  35. Abubakar, M.; Abdulmajeed, I.S.A. Characterization, Mechanical Properties and Probabilistic Failure Analysis of Reinforcement Bars Produced from Scraps in Southern and Northern Region of Nigeria. J. Fail. Anal. Prev. 2023, 23, 1232–1241. [Google Scholar] [CrossRef]
  36. ISO 6892-1; Metallic Materials—Tensile Testing—Part 1: Method of Test at Room Temperature. International Organization for Standardization: Switzerland, Geneva, 2019.
  37. ISO 7438; Metallic materials—Bend Test. International Organization for Standardization: Switzerland, Geneva, 2020.
  38. ACI 318; Building Code Requirements for Structural Concrete. American Concrete Institute: Farmington Hills, MI, USA, 2020.
  39. Fente, T.E.; Tsegaw, A.A.; Abebe, A.T.; Admasu, B.T. Investigating the quality of ethiopian steel reinforcing bars through comprehensive analysis. Heliyon 2024, 10, e31661. [Google Scholar] [CrossRef] [PubMed]
  40. INEN 2167-2020; Hot-Rolled Deformed and Plain Steel Bars, Weldable, Micro Alloyed or Quenched and Self-Tempered, For Reinforced concrete. Requirements; Servicio Ecuatoriano de Normalización: Quito, Ecuador, 2020.
  41. Mohd Razali, N.; Bee Wah, Y. Power comparisons of Shapiro-Wilk, Kolmogorov-Smirnov, Lilliefors and Anderson-Darling tests. J. Stat. Model. Anal. 2011, 2, 13–14. [Google Scholar]
  42. Assiamah, S.; Kankam, C.K.; Banini, E.K.; Agyeman, S.; Adinkrah-Appiah, K. Standardization Issues in Africa: Bayesian analysis of physicogeometrical and mechanical characteristics of rebars in Ghana’s construction industry. J. Build. Eng. 2023, 73, 106835. [Google Scholar] [CrossRef]
  43. ASTM A706/A706M; Standard Specification for Low-Alloy Steel Deformed and Plain Bars for Concrete Reinforcement. ASTM International: West Conshohocken, PA, USA, 2011.
  44. Barrionuevo, G.O.; Ramos-Grez, J.A.; Sánchez-Sánchez, X.; Zapata-Hidalgo, D.; Mullo, J.L.; Puma-Araujo, S.D. Influence of the Processing Parameters on the Microstructure and Mechanical Properties of 316L Stainless Steel Fabricated by Laser Powder Bed Fusion. J. Manuf. Mater. Process. 2024, 8, 35. [Google Scholar] [CrossRef]
  45. Vidal, J.G.; Barrionuevo, G.O.; Ramos-grez, J.A.; Vergara, J.; Mullo, J.L. Vibration-assisted laser welding: Frequency and amplitude vibration effect on the microhardness of A36 steel. Proc. Inst. Mech. Eng. Part L J. Mater. Des. Appl. 2022, 236, 2139–2149. [Google Scholar] [CrossRef]
  46. Ahmed, G. Mechanical Properties of Welded Deformed Reinforcing Steel Bars. ARO Sci. J. Koya Univ. 2015, 3, 28–39. [Google Scholar] [CrossRef]
  47. Barrionuevo, G.O.; Toapanta, M.; Mullo, J.L.; Camacho-Játiva, L. Recovery of Hydro Turbines: From Welding to Additive Manufacturing. In Solid State Phenomena; Trans Tech Publications Ltd.: Bäch, Switzerland, 2022; Volume 338, pp. 55–62. [Google Scholar] [CrossRef]
  48. Kumar, V.; Sharma, U.K.; Singh, B.; Bhargava, P. Effect of temperature on mechanical properties of pre-damaged steel reinforcing bars. Constr. Build. Mater. 2013, 46, 19–27. [Google Scholar] [CrossRef]
  49. Caprili, S.; Salvatore, W. Mechanical performance of steel reinforcing bars in uncorroded and corroded conditions. Data Br. 2018, 18, 1677–1695. [Google Scholar] [CrossRef]
  50. Weine, E.; McPeek, M.S.; Abney, M. Application of Equal Local Levels to Improve Q-Q Plot Testing Bands with R Package qqconf. J. Stat. Softw. 2023, 106, 1–31. [Google Scholar] [CrossRef]
  51. Yan, S.; Zheng, Y.L.; Yan, Z.W.; Zhang, Z.C. Influence of bending angles on initial damage and mechanical properties of bent rebars. Constr. Build. Mater. 2025, 499, 144124. [Google Scholar] [CrossRef]
  52. Yelek, İ.; Ardalı, R.; Yılmaz, İ. Fracture investigation of different welded steel beam-column connections under three-point bending test. J. Constr. Steel Res. 2021, 187, 106945. [Google Scholar] [CrossRef]
  53. Cho, S.; Lim, M.; Lee, C. Study on the bending and joint performances of reinforced concrete beams using high-strength rebars. Sustainability 2021, 13, 3482. [Google Scholar] [CrossRef]
  54. Amirtharaj, J.; Leema Rose, A. A state-of-the-art review on the Structural Behavior of concrete structures reinforced with various rebars as alternative to steel rebars. J. Build. Eng. 2025, 111, 113387. [Google Scholar] [CrossRef]
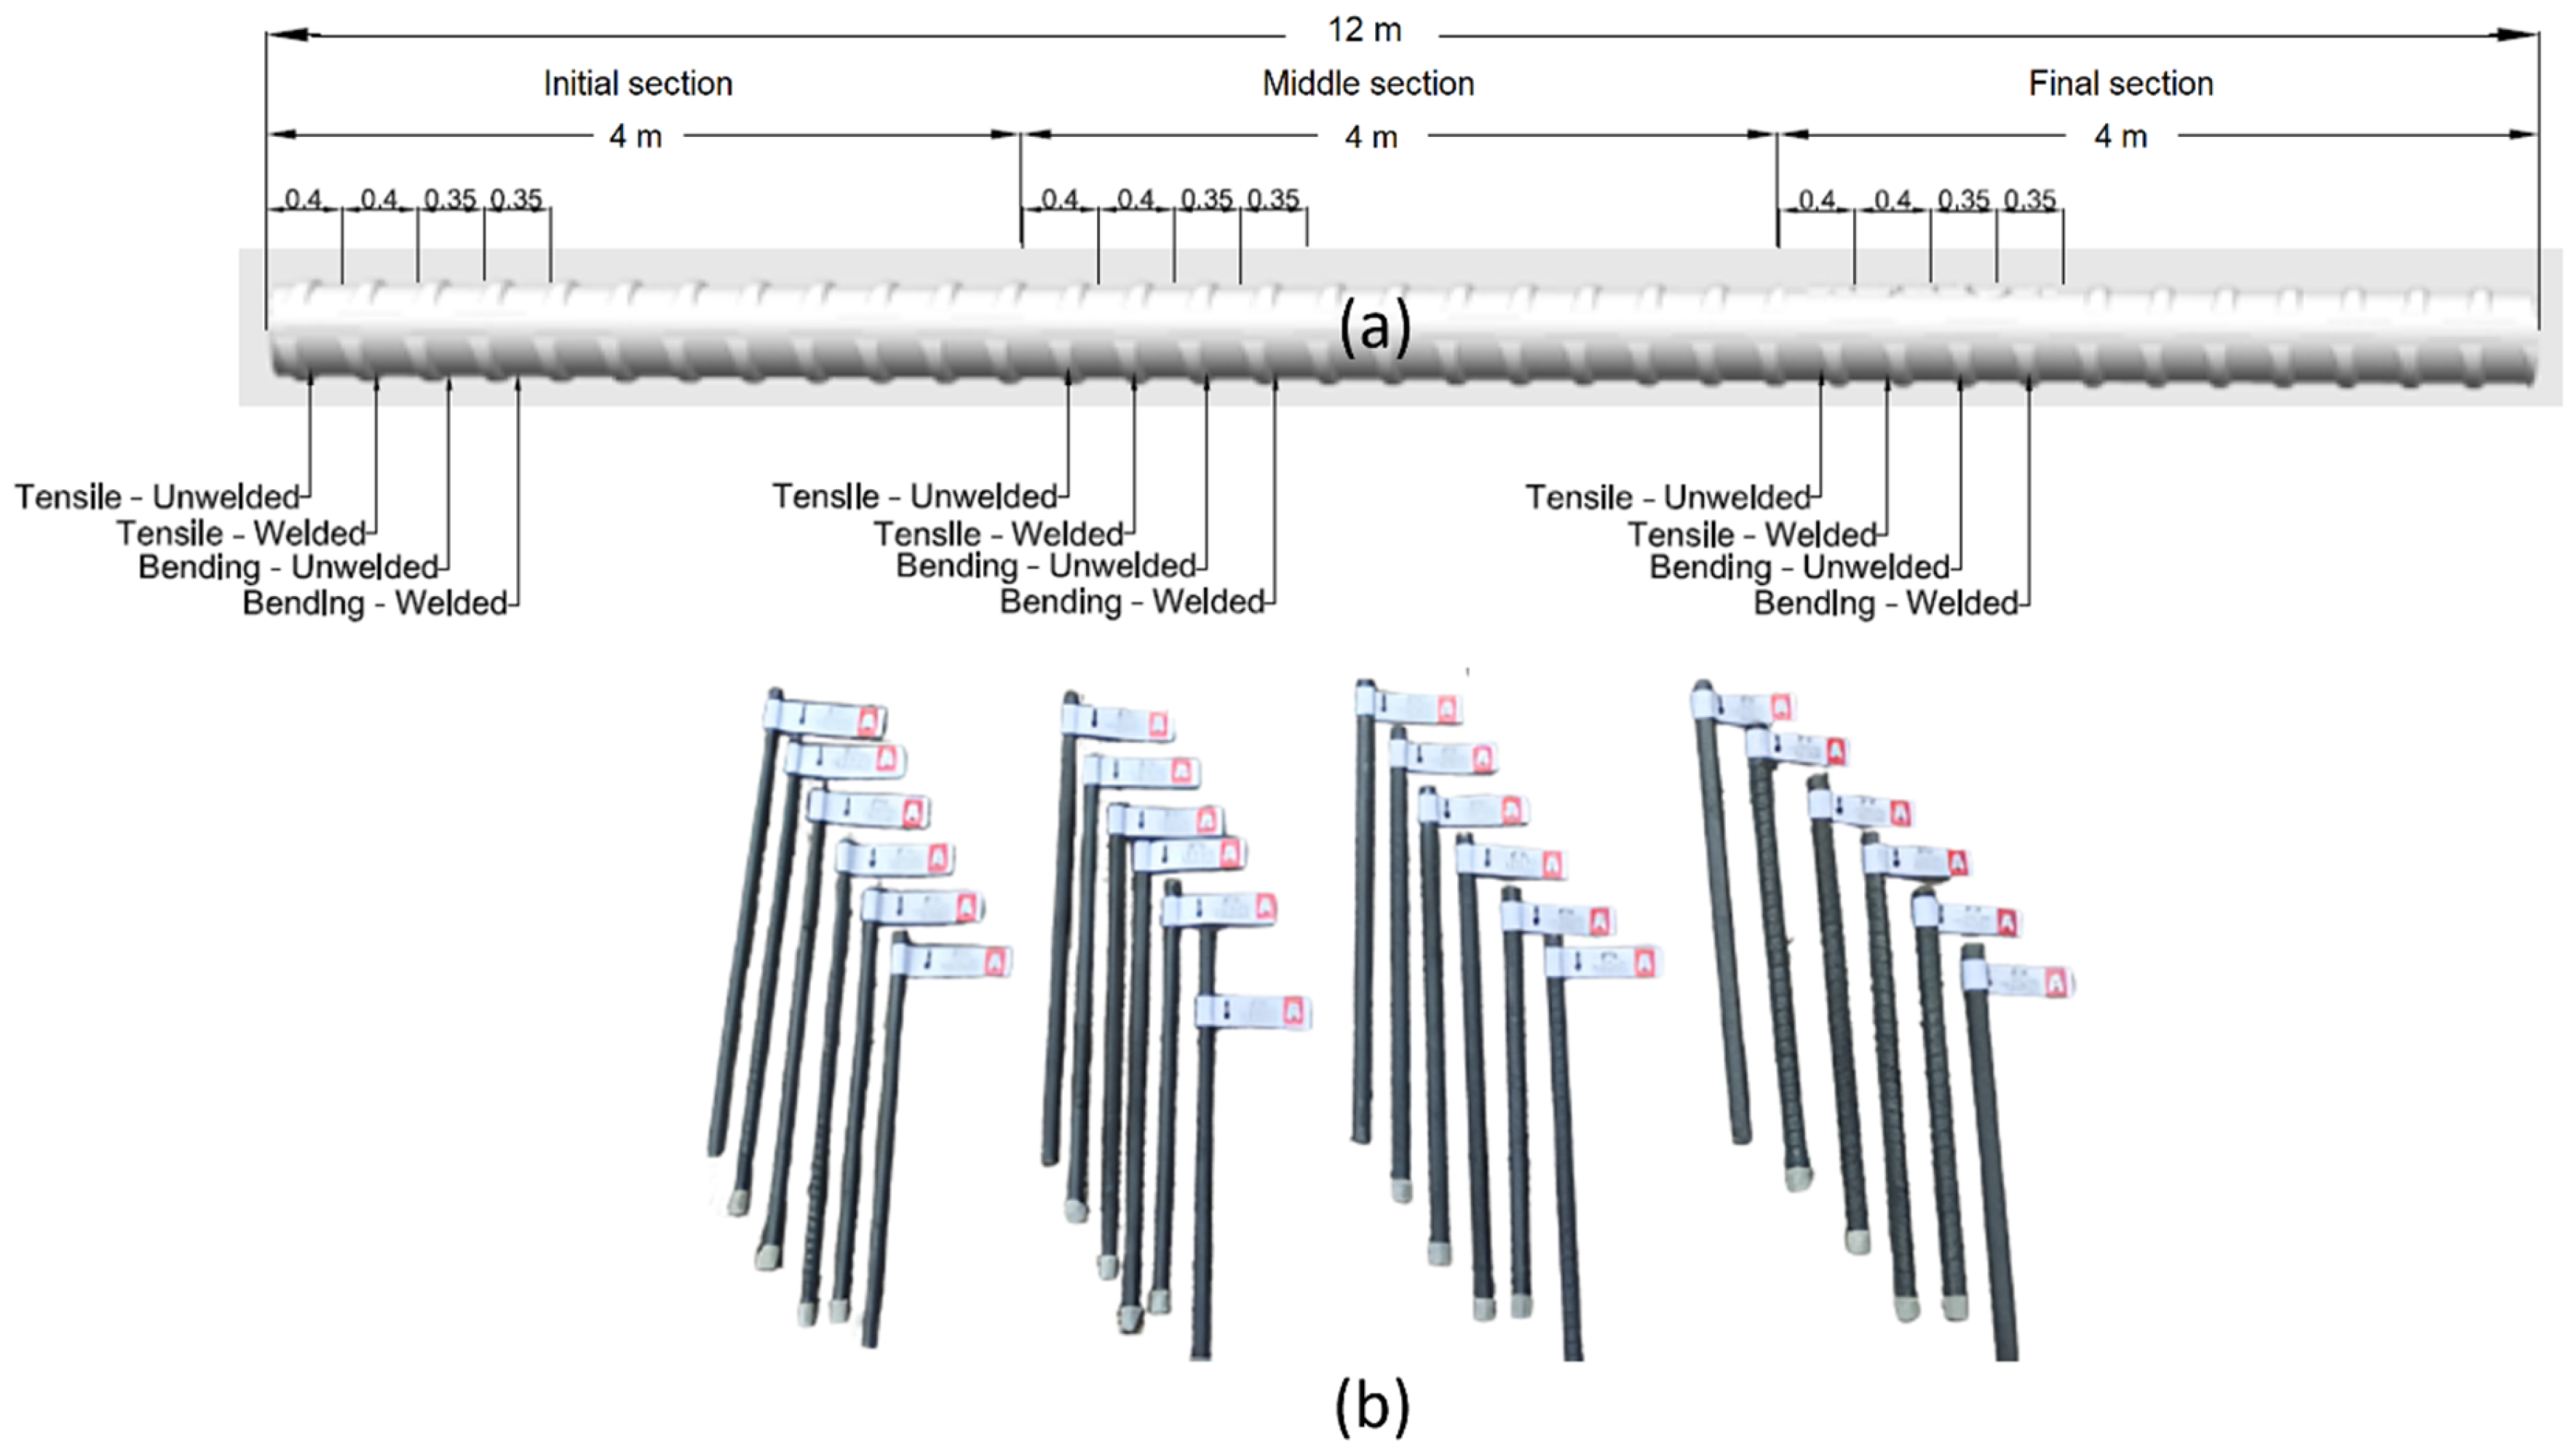
Figure 1. (a) Scheme for obtaining ASTM A706 Grade 60 specimens in a reinforcing steel bar. (b) Steel bar specimens coded. Dimensions in meters.
Metals 15 01307 g001
Figure 2. (a) Schematic representation of the single bevel ‘V’ butt joint, (b) sample preparation, (c) welded rebars.
Metals 15 01307 g002
Figure 3. (a) Experimental setup, (b) tensile test on welded specimen, (c) bending testing.
Metals 15 01307 g003
Figure 4. Representative stress vs. displacement graph of samples of brand A after tensile test. Diameter of 14 mm (a) unwelded sample, (b) welded sample.
Metals 15 01307 g004
Figure 5. Yield strength (SY) variability for welded and non-welded steel bars of different diameters: (a) 12 mm, (b) 14 mm, (c) 16 mm, (d) 18 mm.
Metals 15 01307 g005
Figure 6. Ultimate tensile strength (SUT) variability for welded and non-welded steel bars of different diameters: (a) 12 mm, (b) 14 mm, (c) 16 mm, (d) 18 mm.
Metals 15 01307 g006
Figure 7. Ratio between ultimate tensile strength (SUT) and yield strength (SY) for welded and unwelded steel bars: (a) diameter of 12 mm, (b) diameter of 14 mm, (c) diameter of 16 mm, (d) diameter of 18 mm.
Metals 15 01307 g007
Figure 8. Comparison between welded and unwelded bars grouped by diameters. (a) Yield strength (SY), (b) ultimate tensile strength (SUT), (c) SUT/SY ratio.
Metals 15 01307 g008
Figure 9. Smoothed KDE histograms for each mechanical property of welded and unwelded bars. (a,b) Yield strength SY, (c,d), ultimate tensile strength SUT, (e,f) SUT/SY ratio.
Metals 15 01307 g009
Figure 10. Q-Q plots for each mechanical property of welded and unwelded rebars. (a,b) Yield strength SY, (c,d), ultimate tensile strength SUT, (e,f) SUT/SY ratio.
Metals 15 01307 g010
Figure 11. Locations of fracture initiation in tensile specimens: (a) region of transverse ribs, (b) region of longitudinal ribs, (c) transition zone between shoulders, (d) base material region, (e) rolled-in alphanumeric markings, (f) porosity located in the weld seam.
Metals 15 01307 g011
Figure 12. Distribution of fracture initiation zones: (a) unwelded samples, (b) welded samples.
Metals 15 01307 g012
Figure 13. Representative load vs. displacement graph of samples of brand A after bending test. Diameter of 14 mm (a) unwelded sample, (b) welded sample.
Metals 15 01307 g013
Table 1. Calibrated length for tensile test.
Diameter (mm)Calibrated Length
(mm)
1260
1470
1680
1890
Table 2. Calibrated length for bending test.
Diameter (mm)Distance Between Supports
(mm)
1266
1477
1688
18117
Table 3. Statistics of mechanical properties of bars tested in welded and unwelded conditions.
Diameter
(mm)
TypeCompanySY (MPa)SUT (MPa)SUT/SY
MeanIQRCV(%)MeanIQRCV(%)MeanIQRCV(%)
12UnweldedA476.9400.6690.140603.5120.7800.1361.2650.0000.040
B498.8533.9370.893656.0601.8850.2921.3150.0080.629
C461.4403.8990.846575.3562.4060.4491.2470.0070.591
D478.8531.6820.375649.4611.1540.1841.3560.0050.402
E460.5666.0211.323564.3997.1571.2681.2250.0020.180
Mean value475.3303.2420.715609.7582.6760.4661.2820.0040.368
WeldedA463.8510.6620.153597.7991.4710.2731.2890.0040.349
B485.26110.7412.231645.8405.6030.9511.3310.0191.647
C458.4974.1580.977575.6403.6960.6461.2560.0151.188
D471.7680.6550.145647.0983.5280.5751.3720.0080.579
E463.7210.6660.148567.9562.1850.3851.2250.0030.299
Mean value468.6203.3760.731606.8673.2970.5661.2940.0100.812
14UnweldedA471.0990.5240.127602.0581.8680.3101.2780.0030.216
B495.4172.3950.518654.0080.9220.1441.3200.0050.406
C463.9045.9361.406595.2333.2770.5571.2830.0141.075
D470.2323.6890.793643.8541.3930.2341.3690.0080.568
E492.57720.3154.171622.12317.9933.0201.2630.0161.251
Mean value478.6466.5721.403623.4555.0900.8531.3030.0090.703
WeldedA464.5031.4830.332597.6123.6280.6251.2870.0070.529
B488.4873.9810.815646.2651.2010.1991.3230.0131.003
C464.1453.1720.683598.1012.2520.4051.2890.0100.839
D465.8941.9640.456635.8345.7861.0501.3650.0080.603
E489.28411.9422.700618.1238.8041.4401.2640.0211.684
Mean value474.4624.5080.997619.1874.3340.7441.3050.0120.932
16UnweldedA470.3952.5420.543607.0523.2570.5781.2910.0020.164
B470.5892.6240.588596.5351.0890.1871.2680.0080.716
C470.8572.5680.554601.3994.8190.8031.2770.0030.295
D474.5603.0270.721640.5210.7150.1121.3500.0080.634
E464.2767.5941.829649.1033.4820.5731.3980.0151.247
Mean value470.1353.6710.847618.9222.6720.4511.3170.0070.611
WeldedA466.0811.0720.241602.6132.0600.3421.2930.0050.451
B462.0263.0800.690594.2655.8860.9931.2860.0090.753
C474.6435.0981.120601.0834.2800.7651.2660.0151.269
D464.6814.5000.971634.0483.5000.5721.3650.0060.424
E459.6986.8521.491645.6779.4711.6111.4050.0090.695
Mean value465.4264.1200.903615.5375.0390.8571.3230.0090.718
18UnweldedA485.1901.9010.398629.4351.3140.2241.2970.0020.183
B486.0282.3950.530659.3381.9110.2911.3570.0030.268
C476.3751.1220.245610.8980.5350.0881.2820.0020.162
D456.9191.8080.398628.3001.2440.2121.3750.0040.289
Mean value476.1281.8060.393631.9931.2510.2031.3280.0030.226
WeldedA477.7732.0120.431626.8711.6080.2581.3120.0040.353
B485.6351.3280.278659.5864.7910.7671.3580.0060.494
C474.6403.0840.652612.6812.6860.4551.2910.0030.276
D453.1472.1520.537626.5013.0610.4891.3830.0030.259
Mean value472.7992.1440.475631.4103.0370.4921.3360.0040.345
Table 4. Statistics of mechanical properties of welded and unwelded bars grouped by diameters.
Diameter
(mm)
TypeSY (MPa)SUT (Mpa)SUT/SY
Mean IQRCV(%)MeanIQRCV(%)MeanIQRCV(%)
12Unwelded475.3316.183.13609.7675.76.371.280.083.86
Welded468.629.162.27606.8771.325.791.290.094.27
14Unwelded478.6524.313.27623.4643.773.971.30.053.1
Welded474.4619.562.82619.1940.013.361.310.052.92
16Unwelded470.144.621.1618.9241.33.631.320.083.96
Welded465.437.641.41615.5435.873.531.320.084.17
18Unwelded476.1314.92.59631.9914.232.881.330.073.07
Welded472.813.862.69631.4114.112.891.340.062.85
Table 5. p-value for normality tests.
TypePropertyNShapiro–Wilk TestAnderson–Darling TestLilliefors Test
p-ValueNormal
Shapiro–Wilk
p-ValueNormal
AD
p-ValueNormal
Lilliefors
UnweldedSY570.0167No0.0156No0.0197No
SUT570.0049No0.0022No0.0311No
SUT/SY570.0136No0.0024No0.0129No
WeldedSY570.0151No0.0058No0.0010No
SUT570.0602Yes0.0415No0.0719Yes
SUT/SY570.0315No0.0058No0.0018No
Table 6. p-value of the nonparametric Mann–Whitney test.
PropertyMean
Unwelded
Mean
Welded
p-ValueSignificant
SY475.0036778470.19651910.0308Yes
SUT620.454977617.55762350.3859No
SUT/SY1.3062159441.3135301360.2716No
Disclaimer/Publisher’s Note: The statements, opinions and data contained in all publications are solely those of the individual author(s) and contributor(s) and not of MDPI and/or the editor(s). MDPI and/or the editor(s) disclaim responsibility for any injury to people or property resulting from any ideas, methods, instructions or products referred to in the content.