Article

Probabilistic Modeling of Fatigue Life Prediction of Notched Specimens Combining Highly Stressed Volume and Theory of Critical Distance Approach

1
National Center for Materials Service Safety, University of Science and Technology Beijing, Beijing 100083, China
2
State Key Laboratory of Nuclear Power Safety Technology and Equipment, University of Science and Technology Beijing, Beijing 100083, China
*
Authors to whom correspondence should be addressed.
Metals 2025, 15(12), 1300; https://doi.org/10.3390/met15121300
Submission received: 16 October 2025 / Revised: 22 November 2025 / Accepted: 23 November 2025 / Published: 26 November 2025

Abstract

Notch and size effects significantly influence the fatigue performance of engineering components, which is crucial for ensuring structural integrity. A novel probabilistic fatigue life prediction Kt-V-L model considering both the size and the notch effect, based on the theory of critical distance L (TCD) and the improved highly stressed volume V (HSV) method, is proposed in this study. The new definition more accurately characterizes fatigue damage and accumulation, overcoming the underestimation issues of traditional HSV methods under high-stress or low cycle fatigue (LCF) conditions. Specifically, the Weibull distribution is also proposed to characterize the material fatigue failure probability. The experimental data of 26Cr2Ni4MoV, En3B, and TC4 materials with varying notched sizes are utilized for the model validation and comparison. In addition, the predictive ability of the point method (Kt-V-L-PM) and line method (Kt-V-L-LM) under the novel proposed model was explored and evaluated. The predicted lives of 26Cr2Ni4MoV specimens fall within the ±2 scatter band of the Kt-V-L-LM, while the Kt-V-L-PM shows increasing deviation with larger notches due to its limited ability to capture stress gradients. For En3B and TC4, the predicted lives are within ± 2 life factors, verifying the model’s reliability and accuracy. Furthermore, fracture morphology analysis reveals the influence of notches on fatigue performance and elucidates the fracture failure mechanisms.

1. Introduction

In mechanical components, geometric discontinuities such as holes, screw threads, and grooves are inevitable due to functional performance requirements [1]. In real working conditions, these structural features typically experience cyclic loading throughout their service life, resulting in complex stress–strain states at the geometrically discontinuous locations [2,3,4]. Therefore, ensuring sufficient fatigue strength at these critical locations is essential for structural integrity and long-term reliability.
Stress concentration phenomena have been a critical point in materials mechanics and structural engineering due to its significant impact on fatigue life. The amplification of local stresses caused by stress concentration increases the susceptibility of structures to fatigue failure. The study of fatigue life analysis based on stress concentration has evolved from early empirical models to advanced integrated analytical frameworks.
The Energy-Based Fracture Theory [5,6,7,8] established the fundamental relationship between crack size and fracture strength by analyzing the stress field at crack tips, thereby revealing how geometric discontinuities such as cracks and voids affect local stress distributions. Based on this foundation, the concept of the stress concentration factor (Kt) was introduced to describe the influence of geometric parameters (e.g., notch radius and depth) on stress intensification, based on both theoretical analysis and experimental evidence [9]. Despite its wide application, the Kt approach exhibits inherent limitations, relies solely on geometric characteristics, neglects material properties, and cannot accurately characterize stress–strain behavior within plastic zones. Moreover, it requires coupling with additional models to ensure reliable fatigue life predictions. To address these issues, the Local Stress–Strain Method was proposed [10,11], which incorporates elastic–plastic stress–strain responses in localized regions. This method enables a more accurate description of nonlinear deformation and offers distinct advantages for fatigue analysis in complex stress fields and geometries. Nevertheless, its computational complexity and dependence on experimental data have hindered its widespread application in engineering applications. To overcome these challenges, Neuber and Taylor [12,13] introduced the theory of critical distance (TCD), which has been widely applied in notch fatigue analysis to address the shortcomings of conventional stress concentration approaches. Unlike methods that rely solely on the peak stress at the notch root, TCD considers the stress distribution within a characteristic material-dependent length, which provides a more comprehensive understanding of how stress gradients influence fatigue behavior and establish a practical framework for analyzing material fatigue failures. Since the introduction of the TCD, substantial advancements and refinements have been made to enhance its applicability. As engineering demands evolve, particularly under complex loading conditions, material properties, and varied operational environments, the application of TCD continues to expand the frontiers of fatigue analysis.
To improve the accuracy of crack propagation predictions, numerous studies have sought to refine crack length models by incorporating the effects of local plastic zones. For instance, Zhang et al. [14] introduced the concept of critical crack size for both smooth and notched specimens, accounting for the fatigue initiation region. They further integrated the effective stress, estimated using the TCD and HSV methods to more accurately characterize the high-stress volume in fatigue analysis. In another notable development, He et al. [15] combined TCD with crystal plasticity theory, establishing a novel fatigue life prediction model that accounts for the grain size effect. The model’s validation using GH4169 alloy demonstrated that the predicted fatigue lives closely aligned with the experimental P-S-N curves. Furthermore, the notch geometric significantly affects the critical distance, highlighting the importance of geometric factors in fatigue prediction. Based on these insights, various studies have investigated the impact of geometric dimensions on the critical distance. Shuai et al. [16] proposed a strain energy reconstruction TCD model incorporating notch radius and stress concentration effects, achieving improved fatigue life predictions for notched components. Liu et al. [17] utilized energy gradient approach to define the damage zone, effectively capturing the complex, non-uniform energy distribution around the notch. This method reflects the influence of stress and strain gradients on fatigue life. Nevertheless, further research is required to determine the suitability of TCD for jointly modeling of notch effects and size effects.
The HSV methodology was recognized as an effective approach for analyzing fatigue size effects, as it incorporates both stress distribution and volume influence within localized regions. By emphasizing the average stress over the critical material volume, the HSV approach provides a reliable criterion for assessing fatigue strength in components with varying geometrical dimensions. Taylor [18] and Susmel [19] pioneered the groundwork of HSV by incorporating the volume effect into high-stress regions, building upon the critical material volume concept. Subsequent studies [20,21,22] have further validated the effectiveness and accuracy of the HSV in notch fatigue analysis. Since fatigue damage typically initiates and propagates within a finite volume rather than a single point. In this perspective, the integration of HSV with TCD provides a more accurate framework for fatigue life prediction compared to traditional models that rely solely on effective stress within a specific range. This integrated approach enhances predictive capabilities, particularly in complex geometries and variable loading conditions, making it a valuable tool in fatigue assessment.
The Weibull distribution has been widely applied in fatigue analysis due to its robustness in characterizing statistical variability and uncertainty in fatigue life [23,24,25,26]. Extensive studies have confirmed its effectiveness in quantifying scatter arising from inherent material heterogeneity and fatigue life distribution. In this study, the theory of critical distance and highly stressed volume is integrated with the Weibull distribution. This integration enables probabilistic fatigue analyses that explicitly incorporate both notch size effects and inherent uncertainty, thereby improving the reliability assessment of structural components.
In addition, finite element method (FEM) was employed to design Ultra-Pure 26Cr2Ni4MoV notched specimens with diameters of 10 mm (notch depth of 1 mm, root radius of 0.15/0.4/1.0 mm, considering different Kt values), 18 mm (with a constant notch depth of 1 mm), and 16 mm (with identical Kt values). A review of fatigue analysis methods highlights that Kt characterizes the notch stress quite well, but fatigue estimation quality suffers if it is there alone, as highly stressed volume (HSV) and the theory of critical distance (TCD) exhibit varying dependencies under different stress concentrations. A novel Kt-V-L model integrating SCF, HSV, and TCD is proposed for fatigue life prediction. Parameters were determined using small-size notched specimens (10 mm), then applied to the fatigue strength evaluations of large-scale samples. Fatigue data from En3B [27] and TC4 [28] were used for validation. The Weibull distribution was incorporated to establish P-S-N curves, and model accuracy was compared with traditional TCD methods. The proposed approach enables fatigue strength assessment of large, notched components with minimal testing. Fracture mechanisms were analyzed via smooth and notched specimen fractography.

2. Theoretical Background

2.1. Theory of Critical Distance

Using only the maximum peak stress/strain at the notch root for fatigue life prediction is inadequate, as it fails to capture the comprehensive influence of notch and size effects on fatigue behavior. To comprehensively characterize the effects of the fatigue life in notched components, it is essential to consider the entire stress field and stress concentration characteristics near the notch root, as these factors significantly influence the fatigue process.
In the aforementioned research, the maximum principal stress near the notch root decreases progressively with the increasing distance from the notch root [13]. This insight laid the foundation for the development of TCD. The basic assumption of TCD is that failure occurs when the effective stress exceeds the fatigue limit σ 0 of a smooth specimen under the same stress ratio.
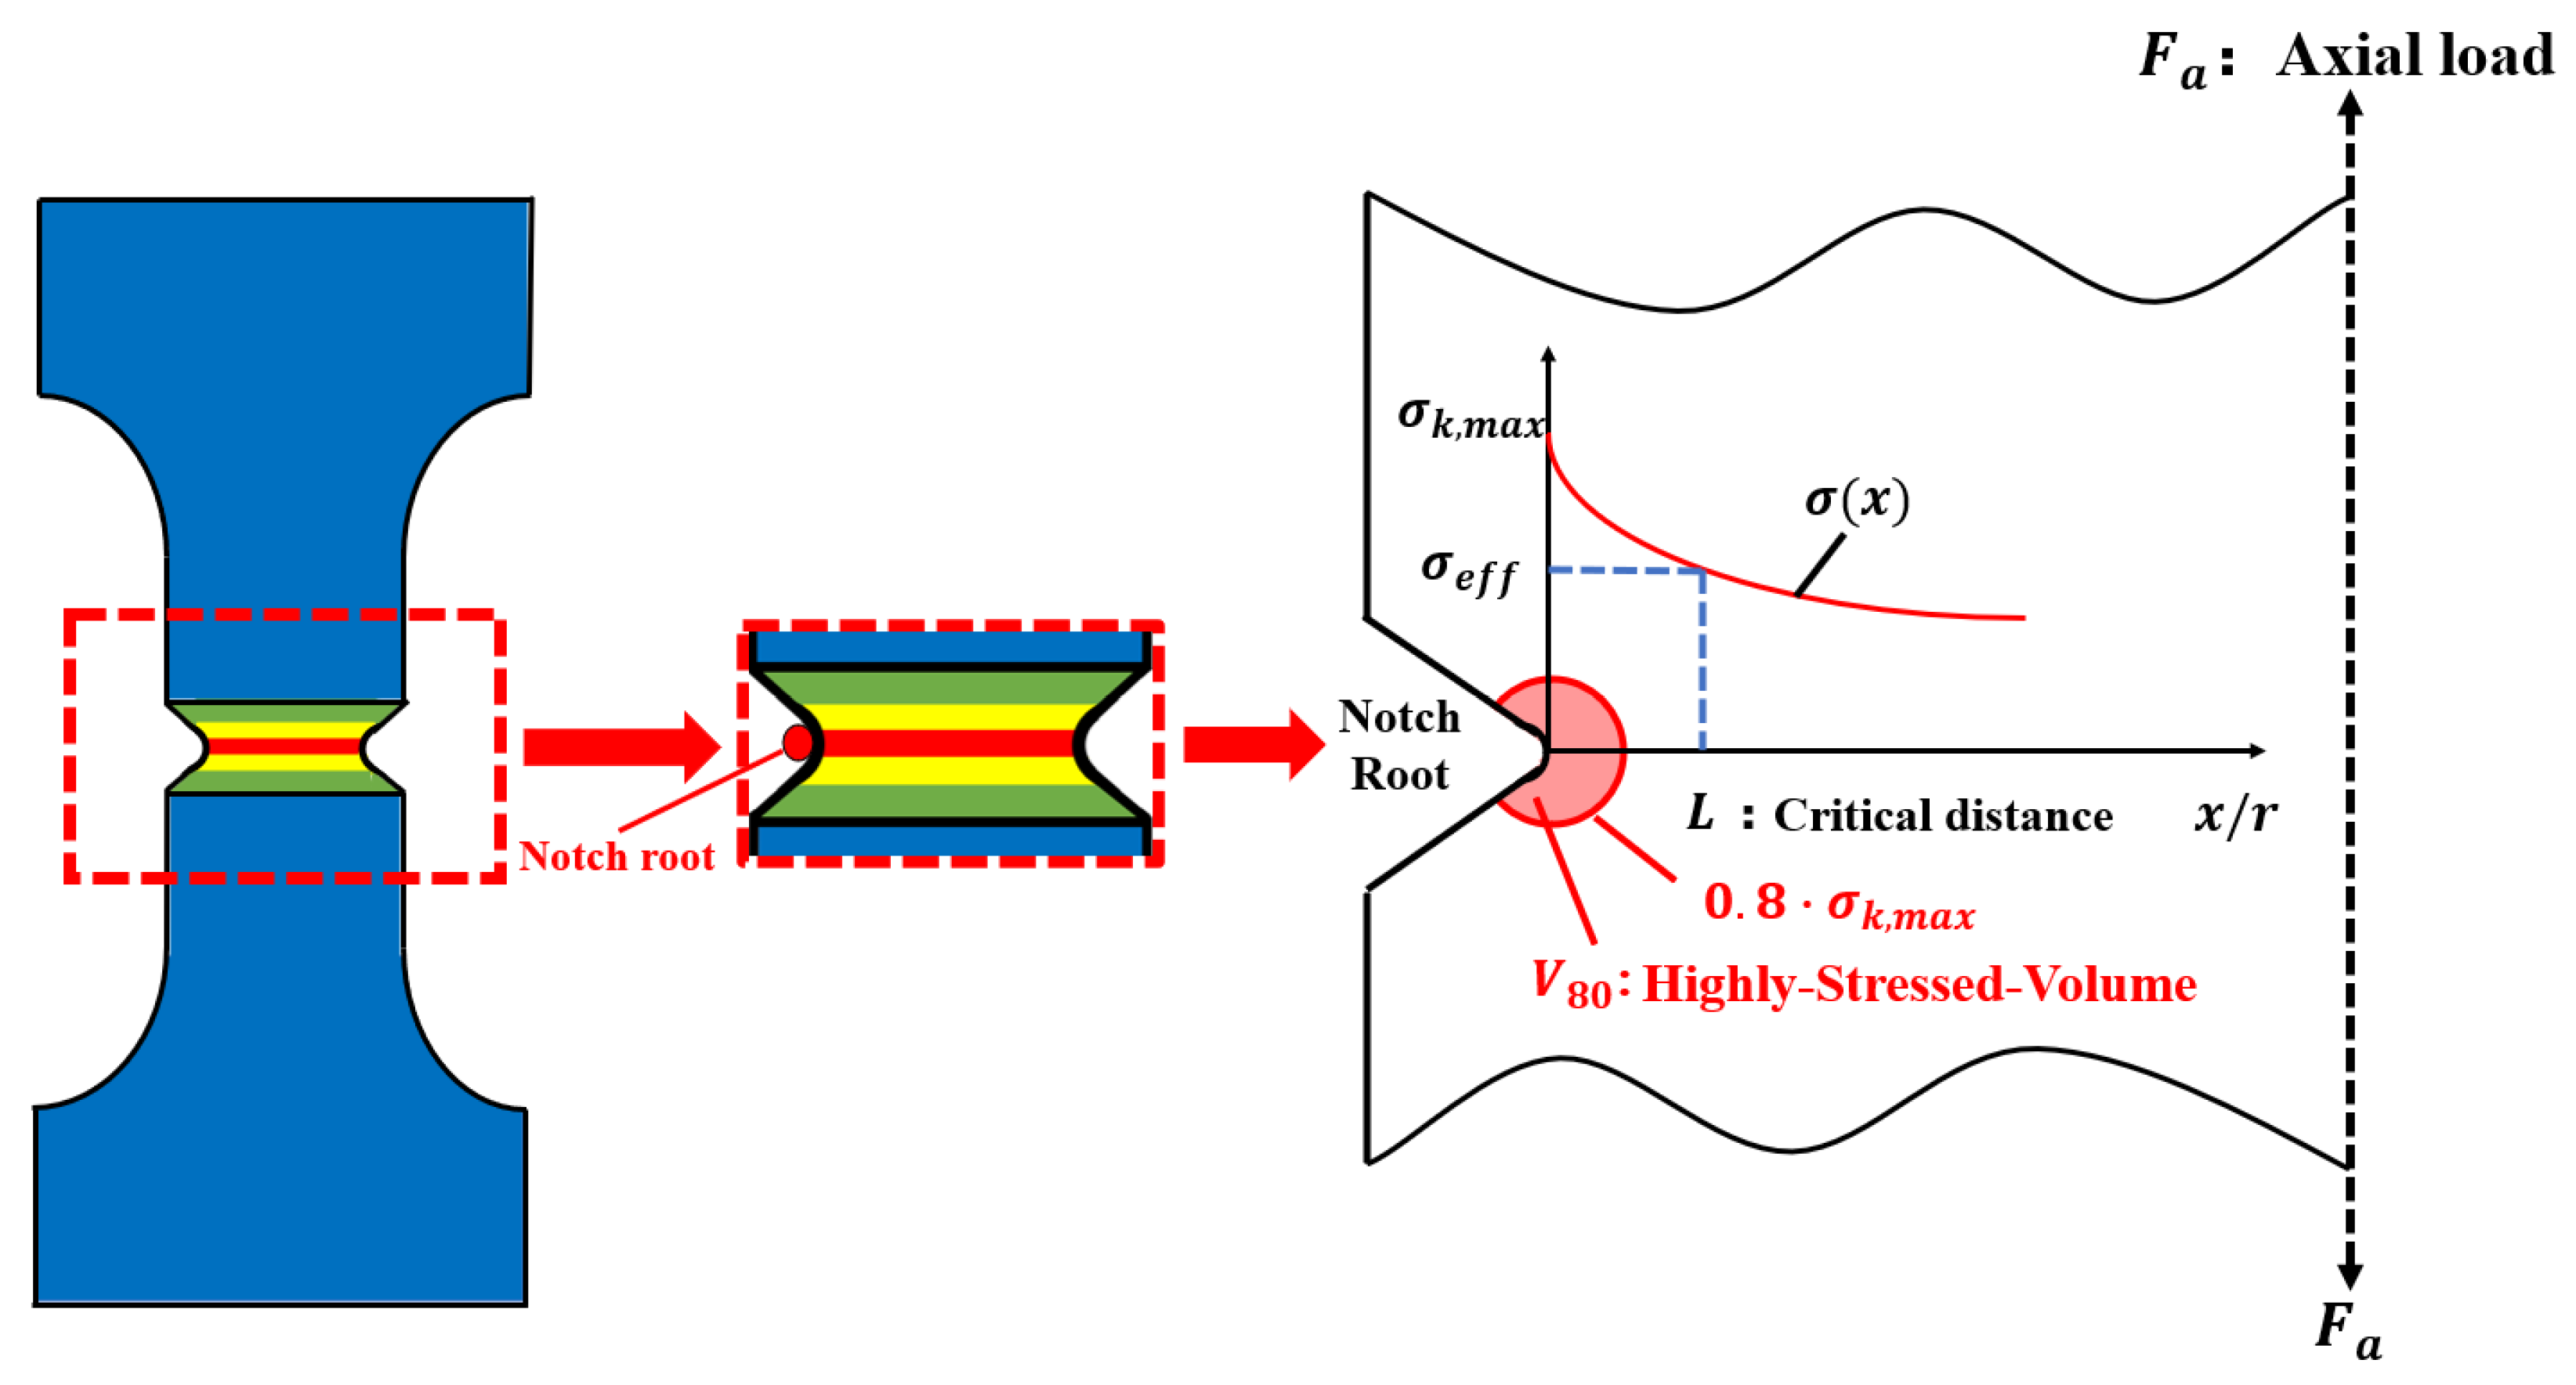
Traditional TCD encompasses two primary methods, the point method (PM) and the line method (LM), as depicted in Figure 1. According to the approaches, if the local stress at the distance L/2 from the crack tip exceeds the fatigue limit of the smooth specimen, the crack will propagate, ultimately leading to fatigue failure. Otherwise, the crack will not extend, and fatigue failure will not occur. Consequently, the stress at a distance of L/2 from the crack tip can be regarded as the effective local stress σ e f f , a determining factor for crack-induced fatigue failure. Beyond the PM and LM, additional TCD-based methods, including the Area Method (AM) in Equation (3) and the Volume Method (VM) in Equation (4), refined the effective stress as the average stress over a specified area and volume, respectively. The formulas for these methods are expressed as follows:
σ e f f = σ 1 r = L 2 = σ 0
σ e f f = 1 2 L 0 2 L σ 1 d r = σ 0
σ e f f = 2 π 1.32 L 2 π 2 π 2 0 1.32 L σ 1 · r d r d θ = σ 0
σ e f f = 3 2 π 1.54 L 3 0 π π 2 π 2 0 1.54 L σ 1 · r 2 · s i n θ d r d θ d φ = σ 0
where σ 1 is the maximum principal stress and the path was chosen where the stress decreases fastest. The characteristic critical distance can be determined as follows in Equation (5):
L = 1 π K t h σ 0 2
where K t h is the threshold of stress intensity factor range and σ 0 is the fatigue limit, while the two parameters must be determined under the same stress ratio.
Susmel, L. and Taylor, D. [29] subsequently demonstrated that the S-N curves of both smooth and notched specimens can be utilized to establish the relationship between fatigue life and critical distance L. This relationship can be further extended to the middle cycle fatigue (MCF) regime, as defined in Equation (6):
L = a · N f b
where a and b are the material constants for fitting the S-N curves of smooth and notched specimens. The critical distance L varies with the specimen size and the applied load level, and the uncertainty of the critical distance comes from the specimen size and the notched geometry, which influence the local stress distribution and fatigue behavior.

2.2. Highly Stressed Volume

The highly stressed volume (HSV) method has been widely adopted due to its simple formulation and low computational cost. To characterize the HSV of notched specimens, an empirical parameter n % was introduced, which assumes that fatigue damage in components subjected to stress gradients predominantly occurs within the HSV region, as shown in Figure 2. However, the values of this empirical parameter vary across the different literature, as they are influenced by materials properties, load types, and notch geometries. Experimental results indicate that the ratio of highly stressed volumes between smooth and notched specimens correlates well with the corresponding fatigue life ratio, suggesting that fatigue damage accumulation depends not only on the local stress magnitude but also on the effective stressed volume. The fatigue life prediction model under a consistent stress level can be expressed as shown in Equation (7):
N n o t c h N s m o o t h = V n o t c h V s m o o t h β
where N n o t c h and N s m o o t h are fatigue lifes of notched and smooth specimens, and V n o t c h and V s m o o t h are highly stressed volumes under FE analysis.
To calculate the V n o t c h and V s m o o t h , the highly stressed surface area or node was utilized, which is defined as the region where the stress does not exceed n % of the maximum principal stress, in order to incorporate the statistical size effect.
The stress concentration induced by geometric discontinuities leads to a steep increase in the stress gradient within the localized region, while the stress in the surrounding area rapidly attenuates, resulting in a highly non-uniform stress distribution. Consequently, fatigue cracks tend to initiate from these high-stress concentration zones, and the fatigue life of the material is primarily governed by the stress level in these local regions rather than by the average stress state of the entire volume. Based on this consideration, a lower HSV threshold is adopted in the present study. HSV is defined as the local volume where the stress exceeds 80% of the maximum stress under different notch geometries and loading conditions [30,31]. This threshold is selected to more accurately represent the effective region contributing to fatigue damage, since higher reference levels (e.g., 90% or 95%) often overemphasize the extreme peak stress zone and underestimate the actual damage-related volume.
Traditional HSV is defined based on the elastic stress distribution. However, this approach has limitations as it neglects plastic deformation. High-stress regions may enter the plastic stage, particularly under high-stress or low cycle fatigue (LCF) conditions, leading to an underestimation of the actual affected area. Notch-induced stress concentration further amplifies plastic deformation, causing fatigue crack initiation over a broader stress distribution region and this means an increasing prediction errors in conventional HSV methods. The revised HSV definition extends beyond the elastic stage by incorporating material plasticity behavior. Compared to traditional HSV methods, the modified approach more accurately captures damage accumulation mechanisms, thus enhancing the fatigue life prediction model.

2.3. Theoretical Model Construction

The existence of various type of notches results in nonlinear stress–strain distribution, primarily characterized by the stress concentration factor (Kt). Consequently, the effect of notch characteristics on the service life of notched components under complex stress conditions is particularly significant. As highlighted in references [32,33], conventional fatigue strategies based on the maximum stress or strain at the notch root are generally insufficient for accurately predicting the fatigue life of engineering structures with pronounced stress concentrations. These traditional approaches often yield overconservative life estimations, especially in the LCF regime [34,35].
During fatigue analysis of notched structures, the stress and strain distribution in the vicinity of the notch regions becomes particularly complex. Plastic deformation occurs in the material near the surface when the local stress exceeds the material’s yield strength, while the material farther from the surface of the notch root supports the highly stressed region [36,37]. To quantify the notch effect and the degree of stress concentration, the stress concentration coefficient Kt is defined as shown in Equation (8):
K t = σ m a x , n o t c h   r o o t σ n o m i n a l
where σ m a x , n o t c h   r o o t is the maximum stress at the tip of the notch root, and σ n o m i n a l is the nominal stress at the net cross-sectional of the notch root. Under similar Kt conditions, a smaller notch radius corresponds to a reduced fatigue damage area of the specimen, leading to an increased fatigue limit. Nevertheless, the Kt is inadequate for accurately estimating the fatigue life of notched components with similar Kt values. This limitation arises because Kt primarily reflects the geometric stress amplification but does not account for the local plasticity, stress gradient, or size effects, which are crucial in fatigue life prediction.
Currently, the effect of notch geometry and specimen size on fatigue modeling have been extensively investigated using various methodologies. In the previous research, the highly stressed volume approach [38,39,40], plastic strain energy theory [41,42], stress/strain gradient concept [43,44,45], and the theory of critical distance [46,47,48,49] have been examined. Particularly, due to the simple formation and lower computational cost, TCD has been widely employed in the analysis of notched component, evaluating notch fatigue strength based on linear elastic-stress (LES) field. TCD defines the effective stress by integrating stress on a constant distance line from the notch root, corresponding to twice the critical distance L, known as the line method (LM). Subsequently, Peterson et al. [50] simplified this approach by considering the stress at a specific distance from the vertex at the point, representing the maximum principal stress at half the critical length L, referred to as the point method (PM). Thereafter, Taylor [51] extended this concept by averaging the elastic stress within a defined surface region, determining the average principal stress in an area enclosed by a radius of 1.32L, known as the Area Method (AM). Furthermore, Bellett [52] introduced the Volume Method (VM), which calculates the equivalent stress based on the volume circumscribed by a radius of 1.54L critical distance in the vicinity of notch vertex. Notably, Yang et al. [53] further established that for directionally solidified (DS) high-temperature alloys, both the critical distance L and the linear Kt remain constant throughout multiple loading cycles, reinforcing the reliability of this relationship in fatigue life prediction. By incorporating the Kt into the conventional TCD, they successfully improved prediction accuracy of fatigue life for specimens with varying notch sizes. This model has also been applied to evaluate the notch fatigue strength of 3D-printed titanium alloy Ti-6Al-4V with diverse geometric features [54,55]. Validation studies demonstrated the high accuracy of the proposed model, with predictions predominantly falling within the scatter band of the fatigue curve. The effectiveness and reliability of TCD-based notch fatigue analysis have been substantiated across various applications. However, further research is required to determine the applicability of TCD for combined modeling of notch and size effects. The model can be reformulated as Equation (9):
K t α · L = A 1 · N f B 1
where α is related the stress concentration cofficient Kt.
The HSV concept was originally introduced by Kugual et al. [56] to evaluate the fatigue strength of various materials by examining the correlation between fatigue strength and HSV. Typically, the fatigue strength of structures and components decreases as the high-stress size or volume increases. Wang et al. [54] utilized V90 as a reference volume to access the influence of size and notches on a wide range of materials and components, validating the effectiveness of a novel model that integrates the critical distance and highly stressed volume concepts. Additionally, Lin et al. [57] noted that the fatigue limit of Austempered Ductile Irons (ADI) tends to decrease with the increase in material volume under high stress. They further developed predictive equations for the highly stressed volume and the fatigue limit under various heat treatment conditions. Following these principles, the equation can be expressed as Equation (10):
V β · L = A 2 · N f B 2
where β is related to the highly stressed volume V85/90/95.
Therefore, for notches of varying size, the critical distance L may also be different. Hence, it is imperative to consider the combined influence of the highly stressed volume and the stress concentration factor on the critical distance. Considering the material’s intrinsic parameters, the Kt value alone cannot fully represent the degree of stress distribution at the notch. The HSV method address this limitation by enabling the quantification of the notch size effect. Consequently, V85/90/95 and Kt are introduced together to jointly characterize the impact of notch and size effect on the critical distance L. The proposed model assumes that larger values of V80 and Kt may lead to more significant material damage with the notch field. Based on the above assumptions, the novel model Kt-V-L, incorporating both notch and size effect, can be reformulated as Equation (11):
K t α · V β · L = A · N f B
In this study, the effect of both notch geometry and size effects on the fatigue property were investigated. The proposed framework encompasses Kt, HSV, and TCD. Additionally, the Weibull distribution was employed to quantify the uncertainty in fatigue analysis.

2.4. Weibull Probabilistic Analysis

The fatigue characteristics would inevitably exhibit an uncertainty in prediction results, which must be quantified in fatigue analysis. In this study, a two-parameter Weibull distribution was employed to characterize the dispersion of fatigue strength and life in 26Cr2Ni4MoV smooth specimens. It is recognized that notched specimens typically exhibit a narrower fatigue life scatter than unnotched specimens, owing to the more localized crack initiation process. The assumption of identical Weibull distributions was employed for simplification and comparison purposes. The fatigue life and strength analysis process can be summarized as follows:
  • Use the Weibull distribution to describe the dispersion of fatigue life of the smooth specimens, and obtain the Weibull scale parameters N * and shape parameters β ;
  • Perform finite element analysis on the notched specimens to obtain the linear elastic stress distribution at the notch root and calculate the effective stress σ e f f ;
  • Obtain fatigue life distribution of the predicted notched specimen. The expression is as follows:
P f = 1 e x p N f N * β
Assuming the effective stress of a smooth specimen σ e f f equals nominal stress σ m a x , a connection can be established between the fatigue lives of notched and smooth specimens. The relation between the nominal stress σ m a x to the Weibull scale parameters N * can be written as follows:
σ m a x = a 1 · N * b 1
Linking the maximum stress with the PM/LM in the critical distance theory, the σ e f f can be expressed as follows:
σ e f f = a 2 · N * b 2
where a 1 , a 2 , b 1 , and b 2 are material constants.
The P-S-N curve represents a probabilistic extension of the conventional S-N relationship, where parallel S-N curves correspond to different failure probabilities P f .

2.5. Parameter Determination

Based on the fatigue test of smooth specimens, the characteristic fatigue life N * and fatigue life distribution index φ were fitted under different stress levels. Subsequently, based on a series of characteristic fatigue life N * at various stress levels (responding effective stress), the related coefficient A and B were determined through statistical fitting. The fatigue life distribution index φ was determined by averaging the fatigue life distribution index across all stress levels.
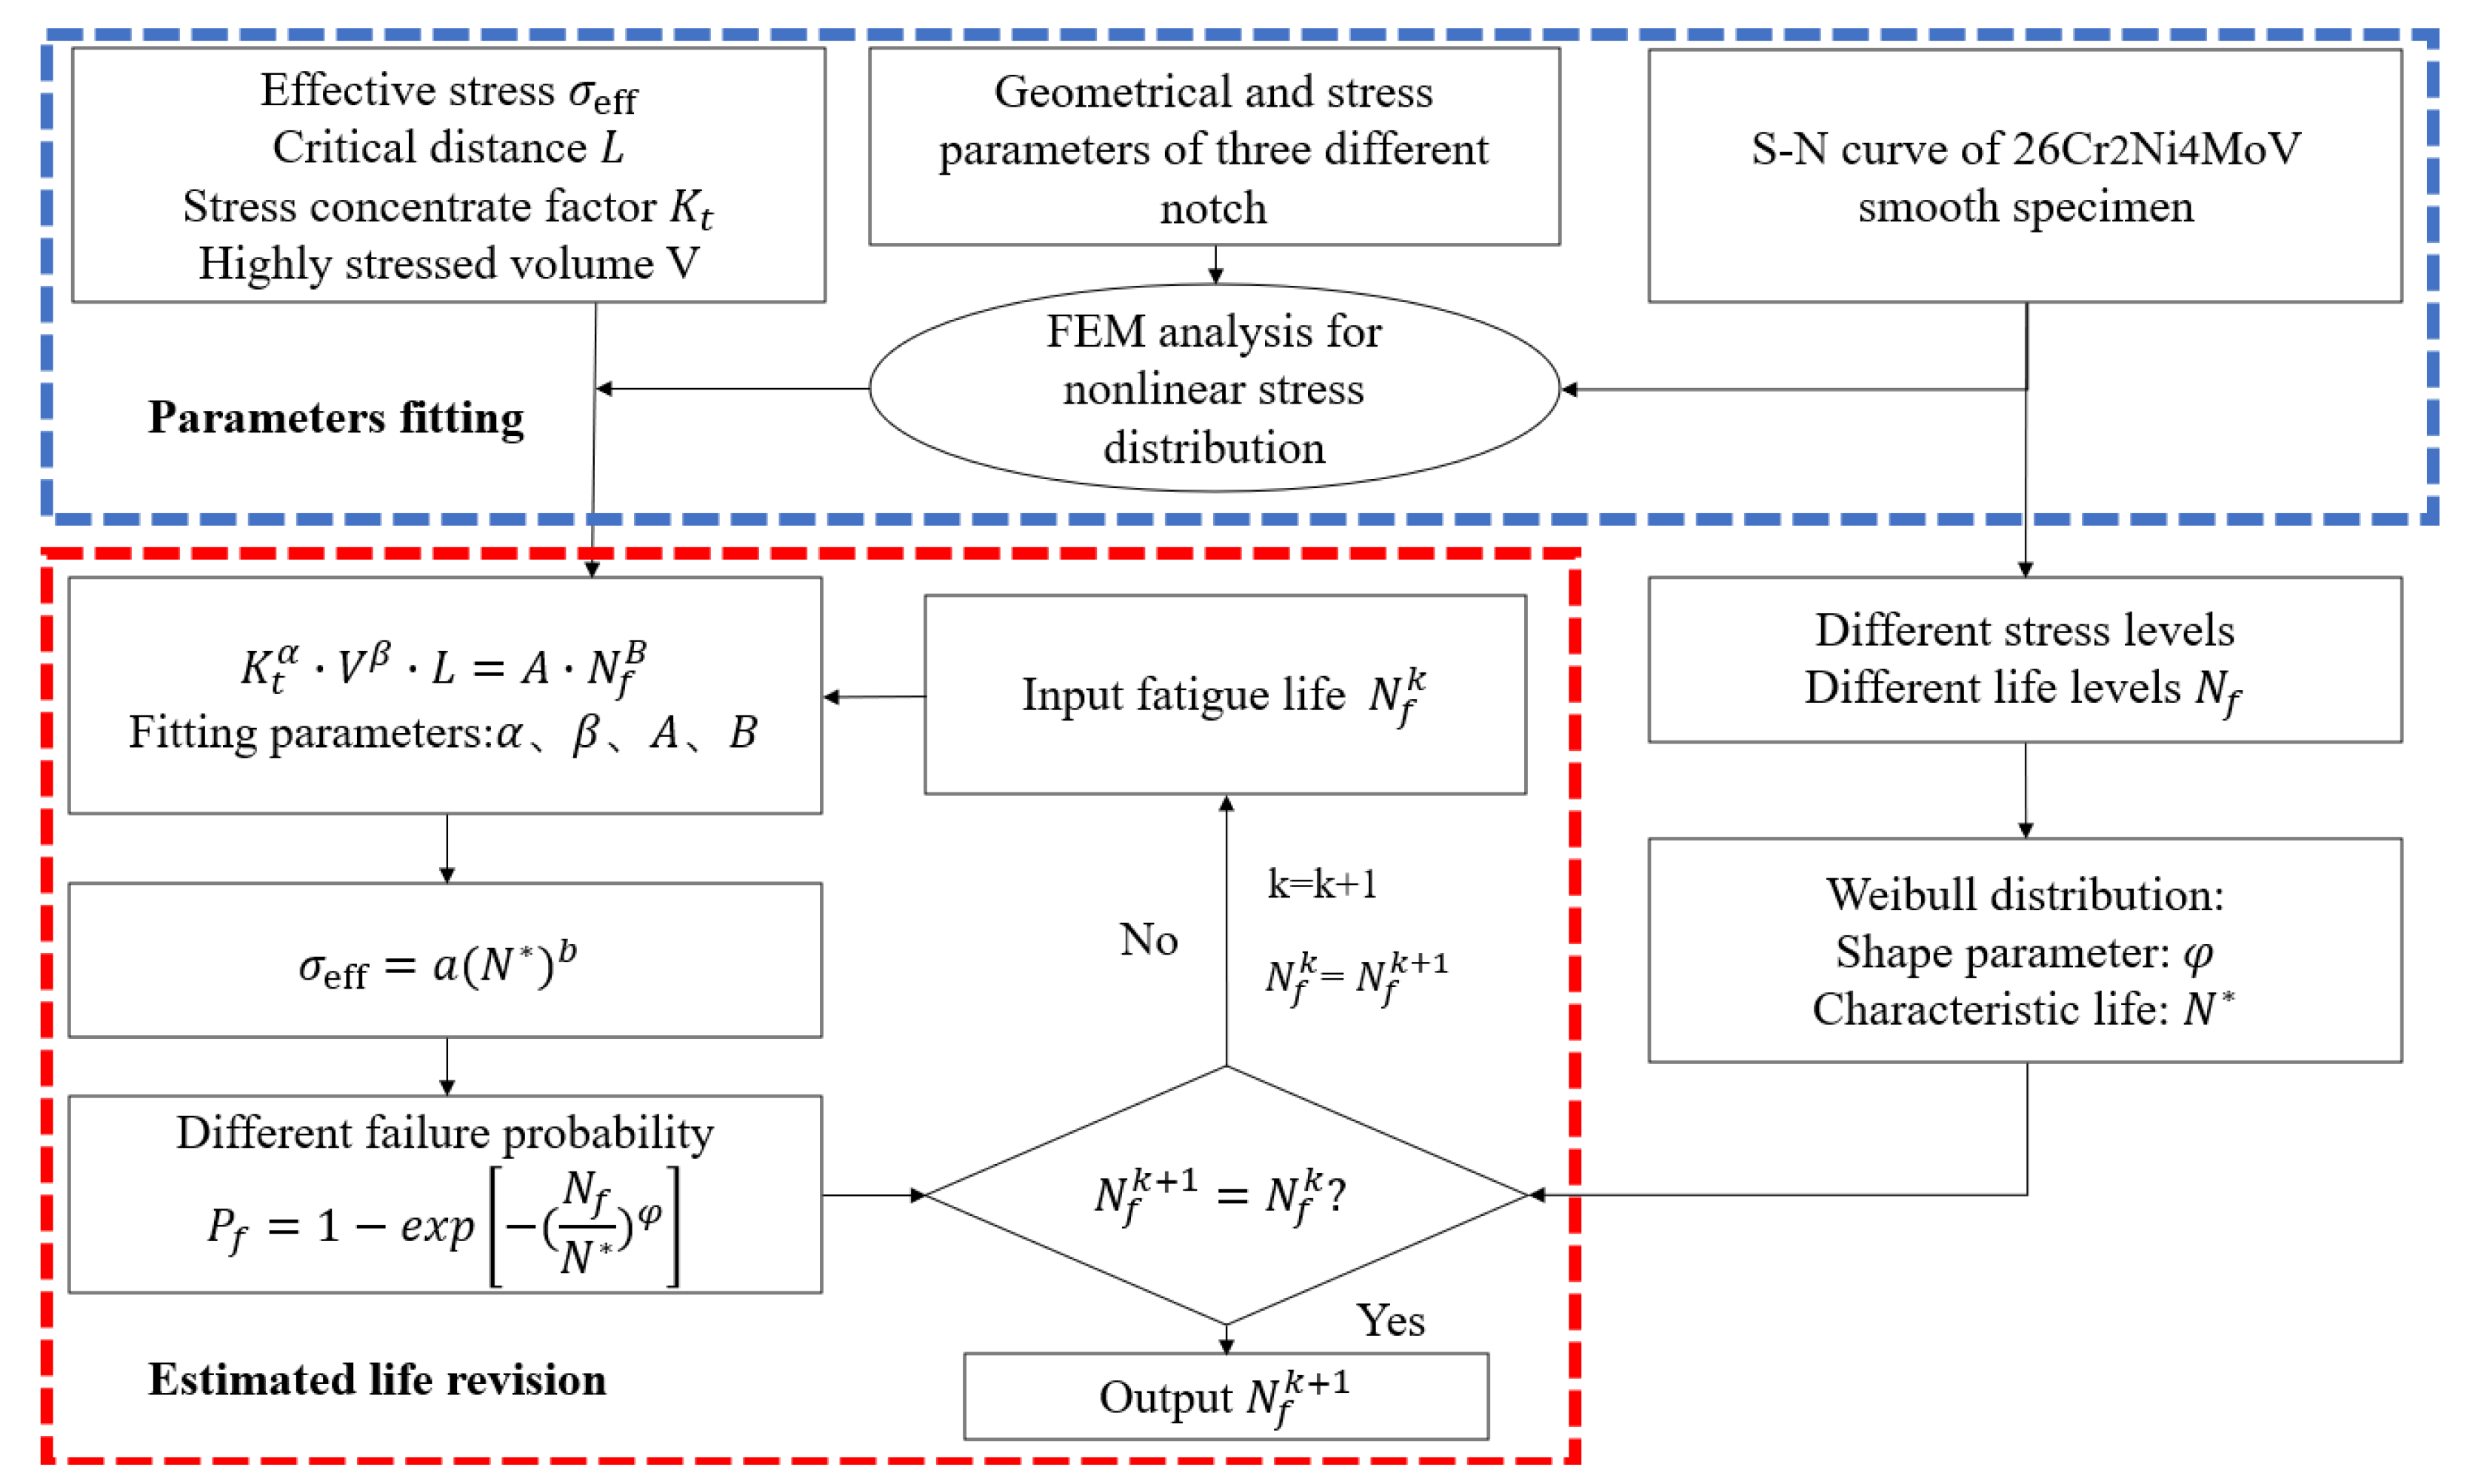
Additionally, this study integrates the model parameter fitting process for the fatigue life analysis of various components. Weibull distribution parameters are utilized to refine the recursive process, resulting in a probability-based fatigue analysis framework focused on notches, as shown in Figure 3. Fundamentally, this model comprises the following steps:
  • Based on the fatigue data of smooth and notched specimen, and the FEM analysis for linear stress distribution of different notches. The N * , φ are determined by smooth specimen under different stress levels and α , β , A , and B can be fitted by the data of highly stressed volume V, stress concentration factor Kt and critical distance L;
  • Input life N k , calculated L, receive σ e f f k , and compute N k + 1 through Equation (14);
  • Determine value of N k and N k + 1 , and output the N k if above two values are equal. If not, repeat this calculation cycle until N k = N k + 1 .
This framework provides a robust, probabilistic fatigue life prediction model that integrates experimental data, FEM analysis, and the theory of critical distances for both smooth and notched specimens.

3. Materials and Methods

3.1. Material

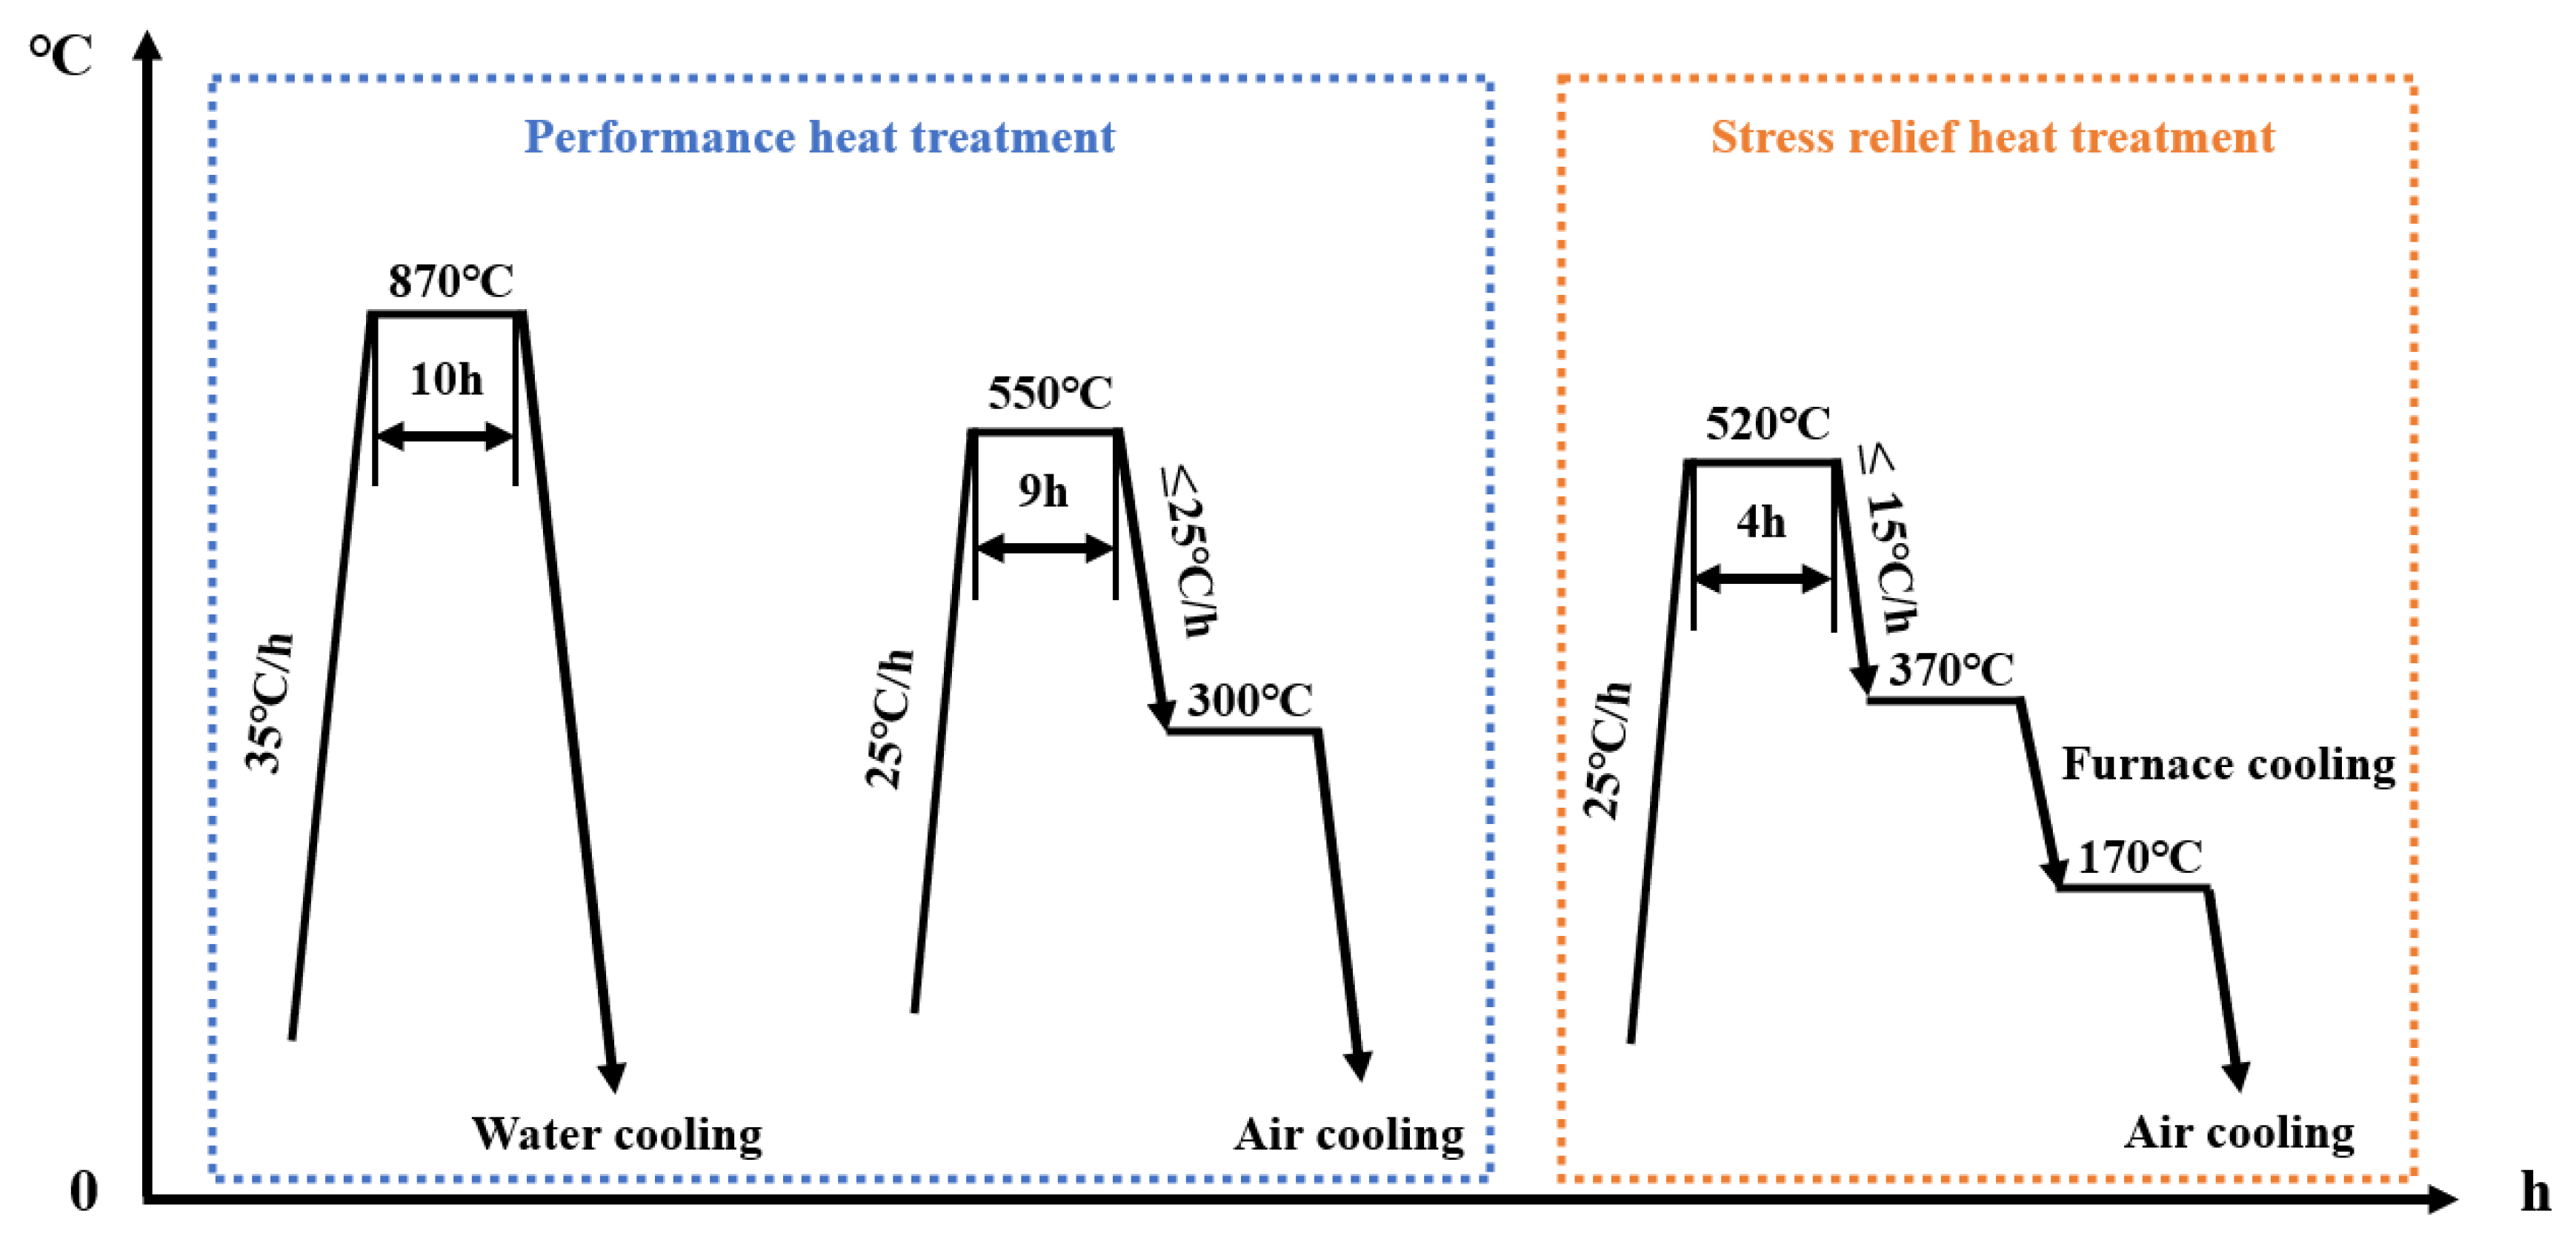
In this work, the experimental material is Ultra-Pure 26Cr2Ni4MoV alloy. The forging stock with a diameter of 200 mm was maintained at 870 °C for an adequate duration to ensure complete Austenitization, followed by water quenching and tempering. The heat treatment program is shown in Figure 4. The chemical composition was analyzed using inductively coupled plasma emission spectroscopy (ICP) (Thermo Fisher Scientific, Waltham, MA, USA), as presented in Table 1.
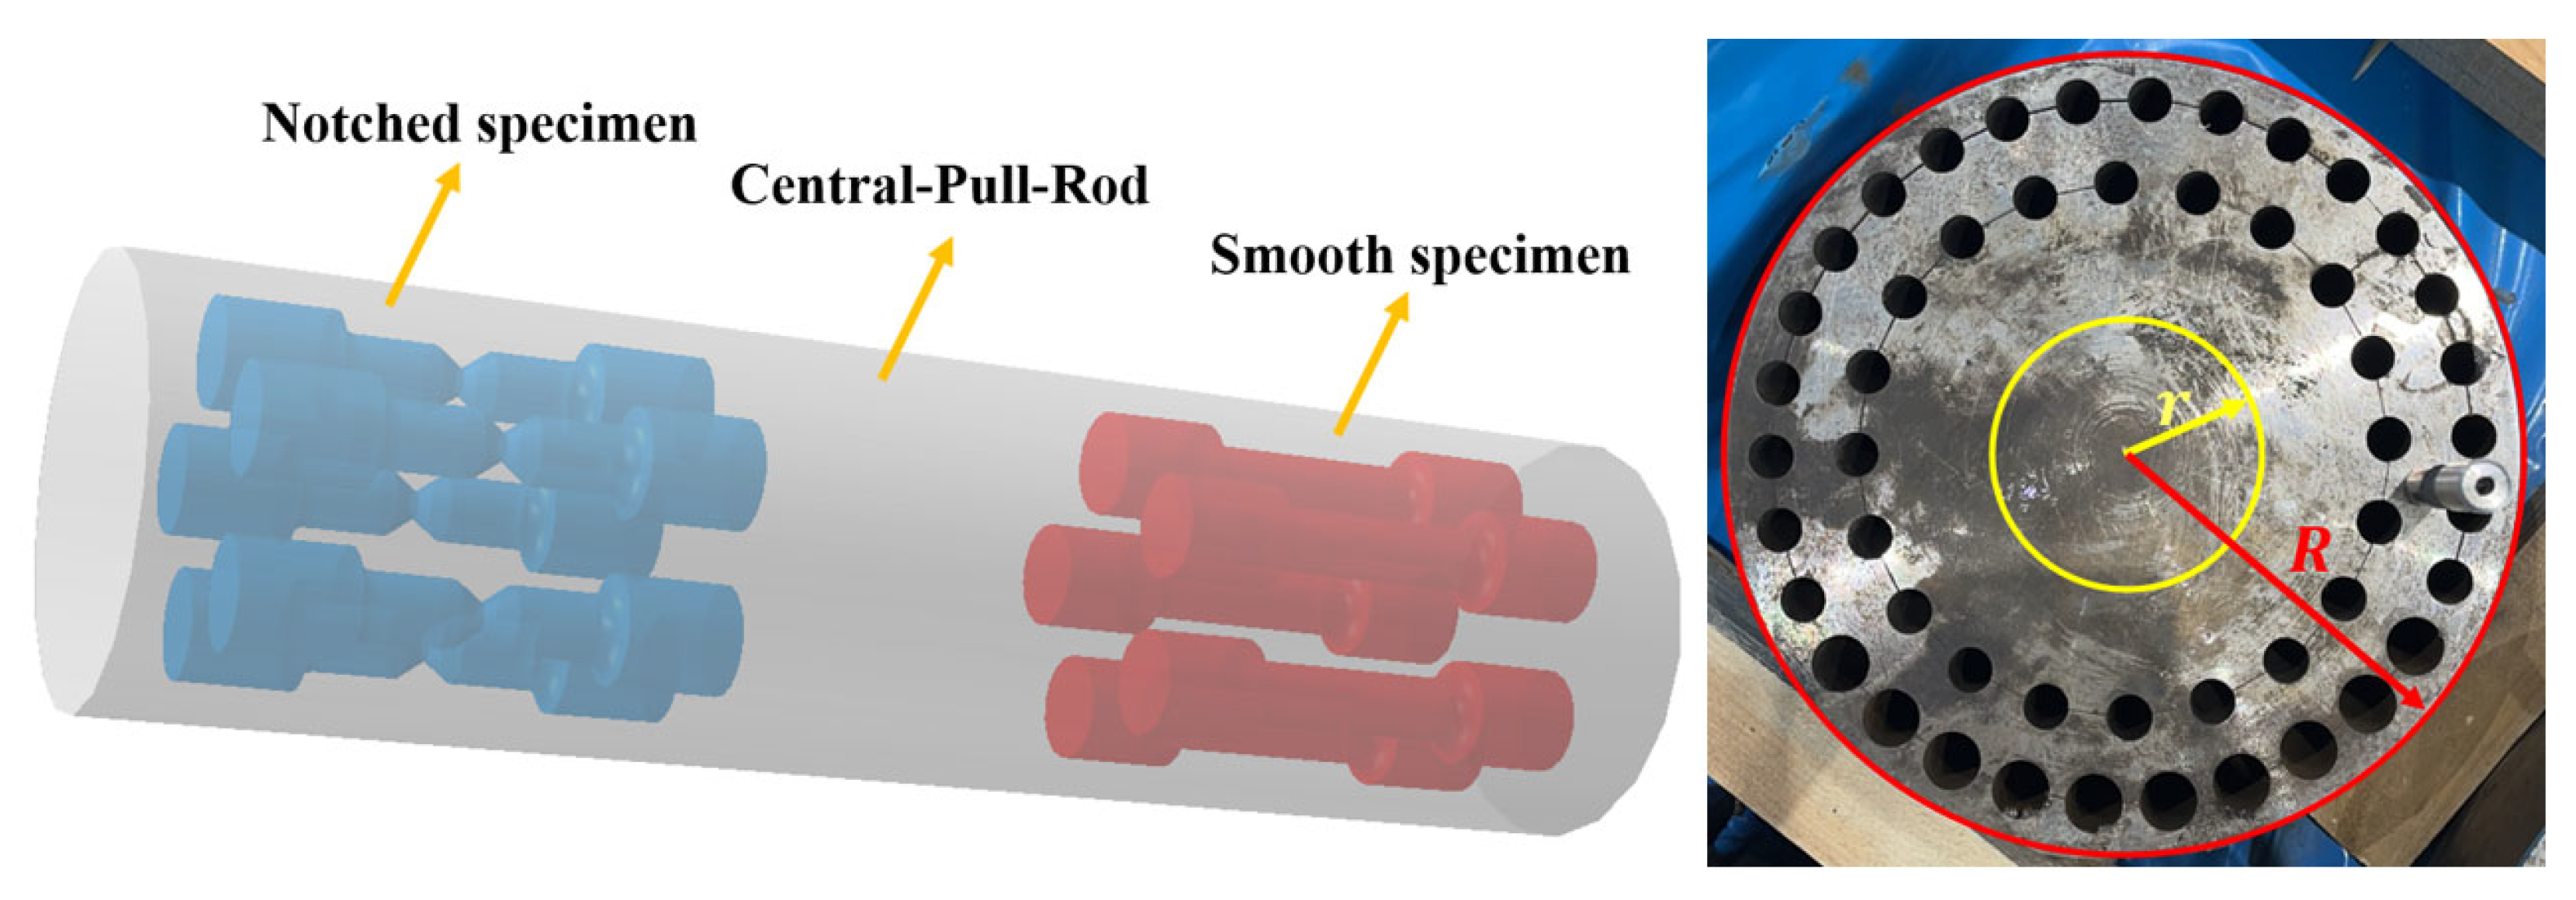
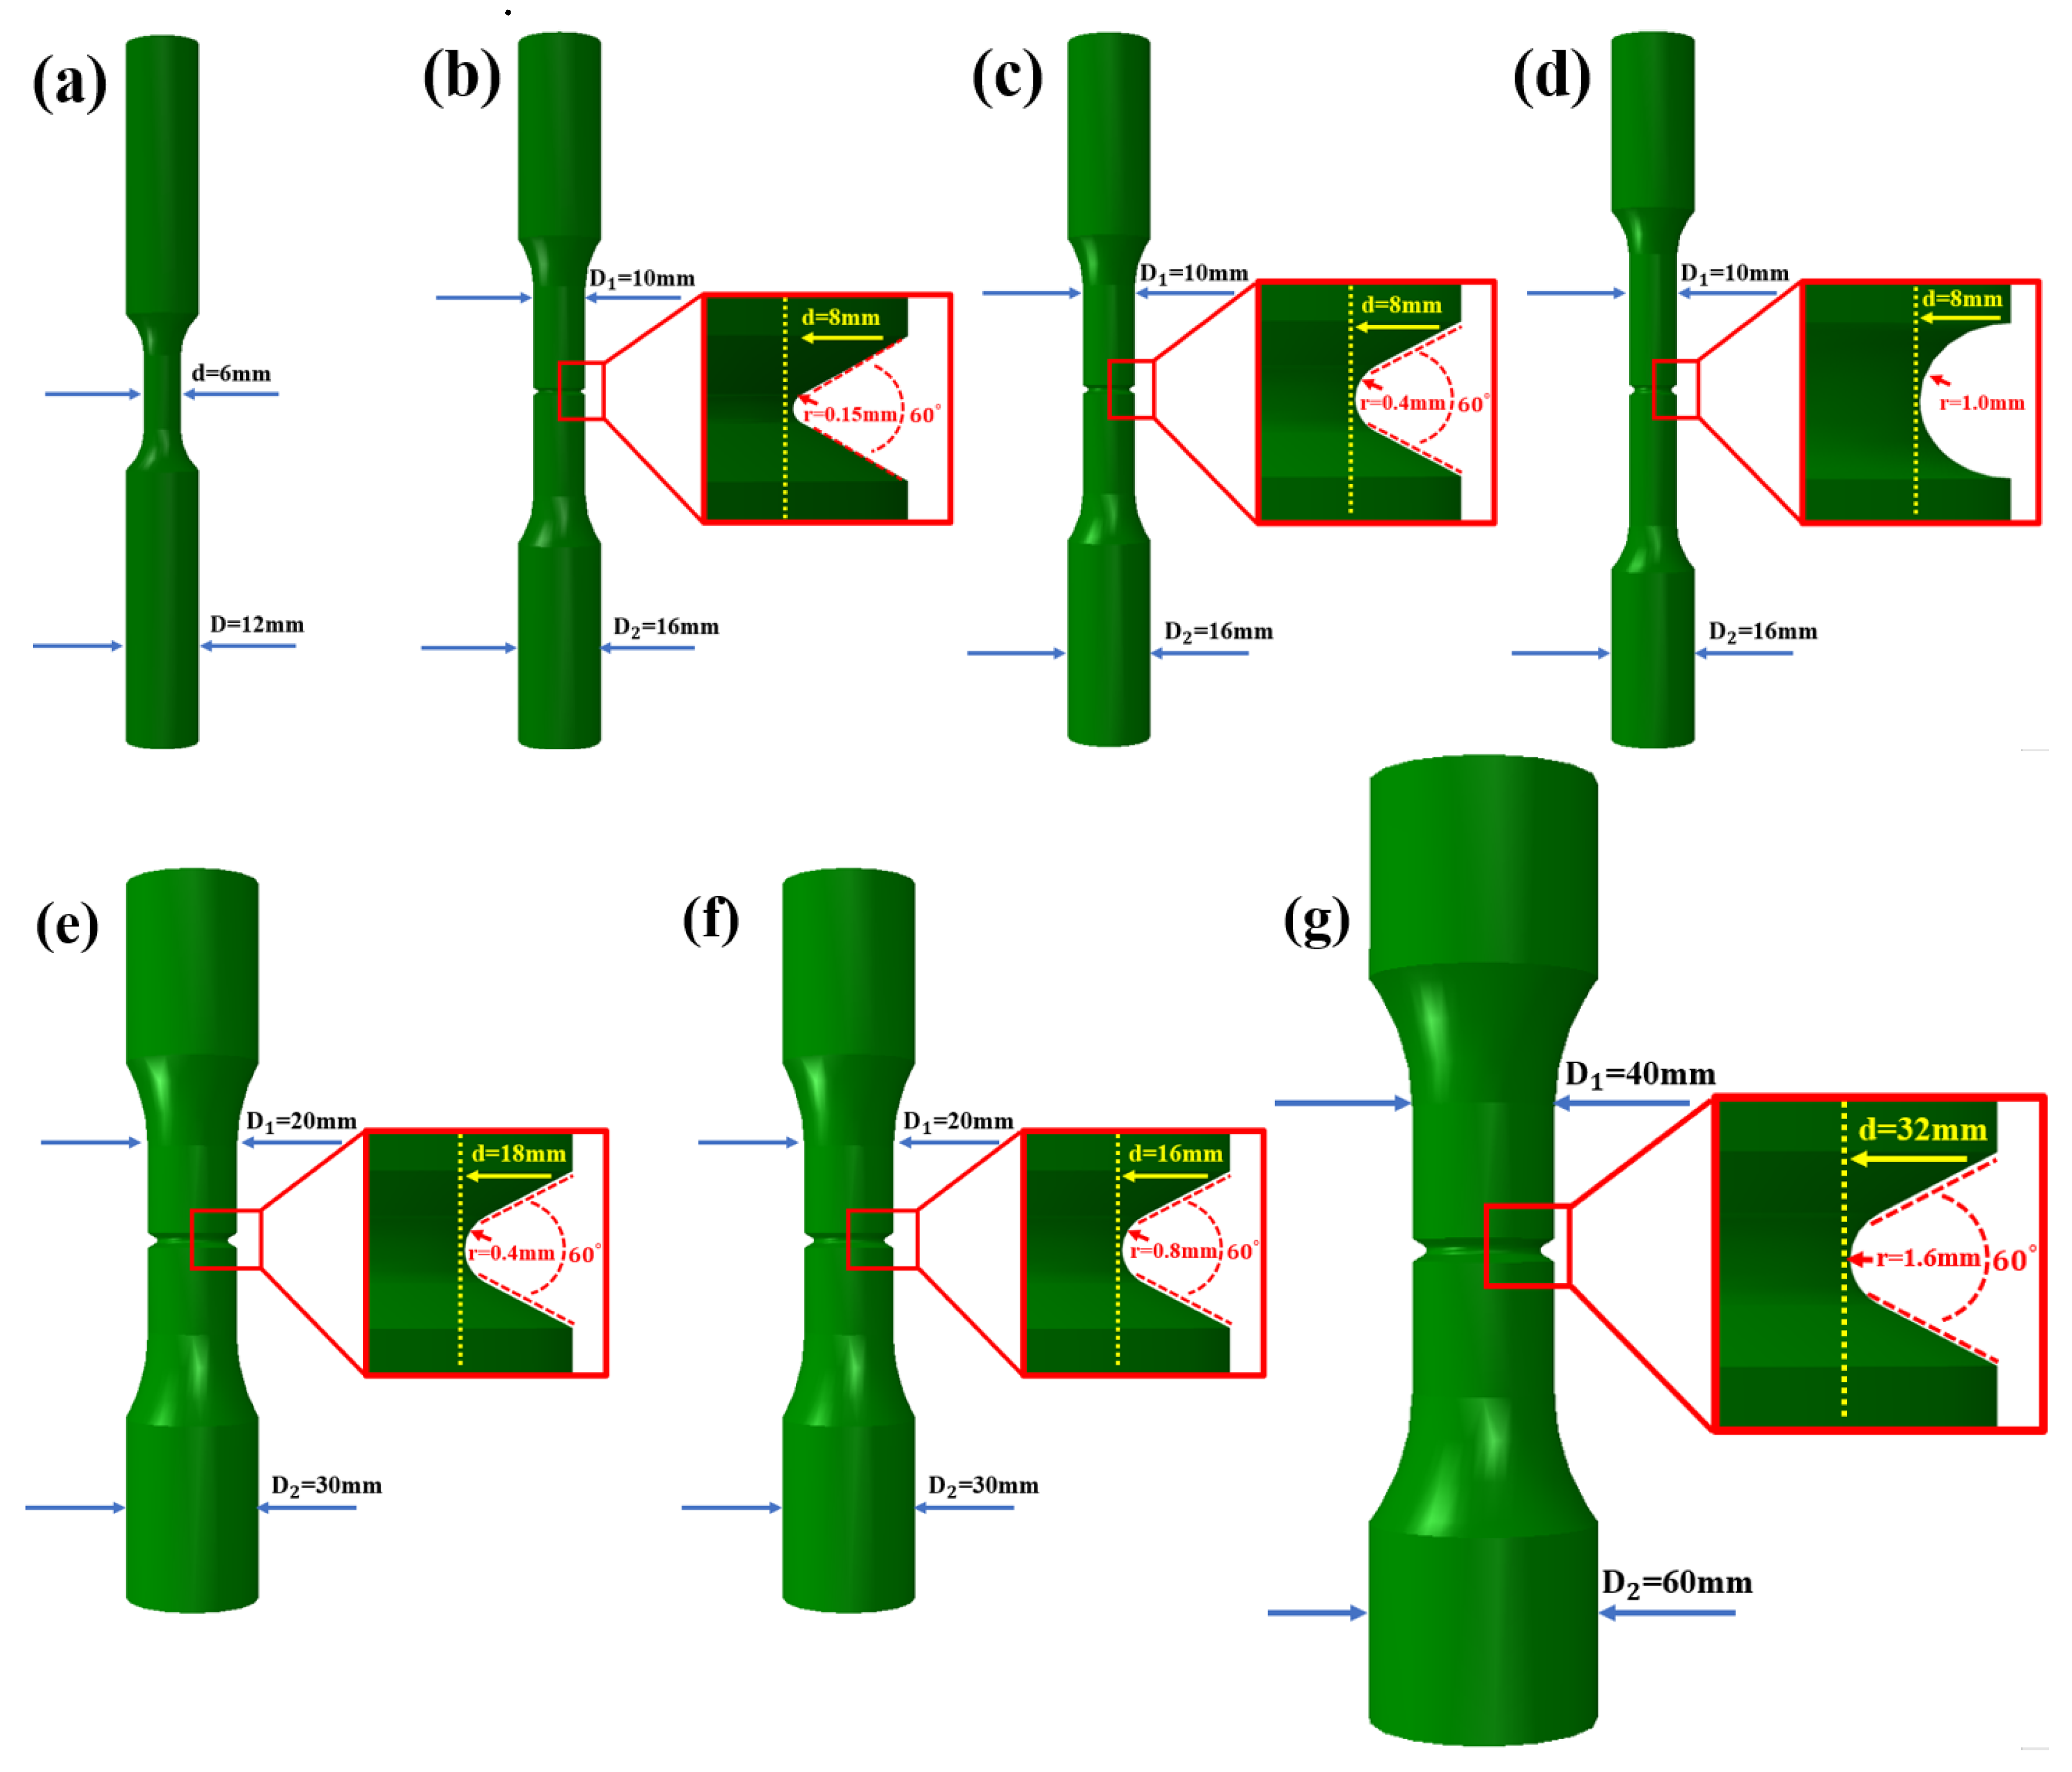
The actual experimental material was processed into smooth specimens and six types of notched fatigue specimens (Figure 5), based on finite element analysis (FEA), and the detailed notch geometries were determined under two conditions. For specimens d   ( r ) (d: notch inside diameter/r: root radius of notch) with identical stress concentration factors (Kt) but different sizes, the geometries correspond to 8   ( r   =   0.4 ) , 16   ( r   =   0.8 ) , and 32   ( r   =   1.6 ) . For specimens with identical sizes but varying Kt values, the geometries were defined as 8   ( r   =   0.15 ) , 8   r   =   0.4 , and 8   ( r   =   1.0 ) , characterizing the fundamental fatigue properties of the material and evaluating the influence of notches. The elastic modulus of material is 207.17GPa, and the Poisson’s ratio is 0.3, and the cyclic strength coefficient and cyclic strain hardening exponent are 1011.11 MPa and 0.05.
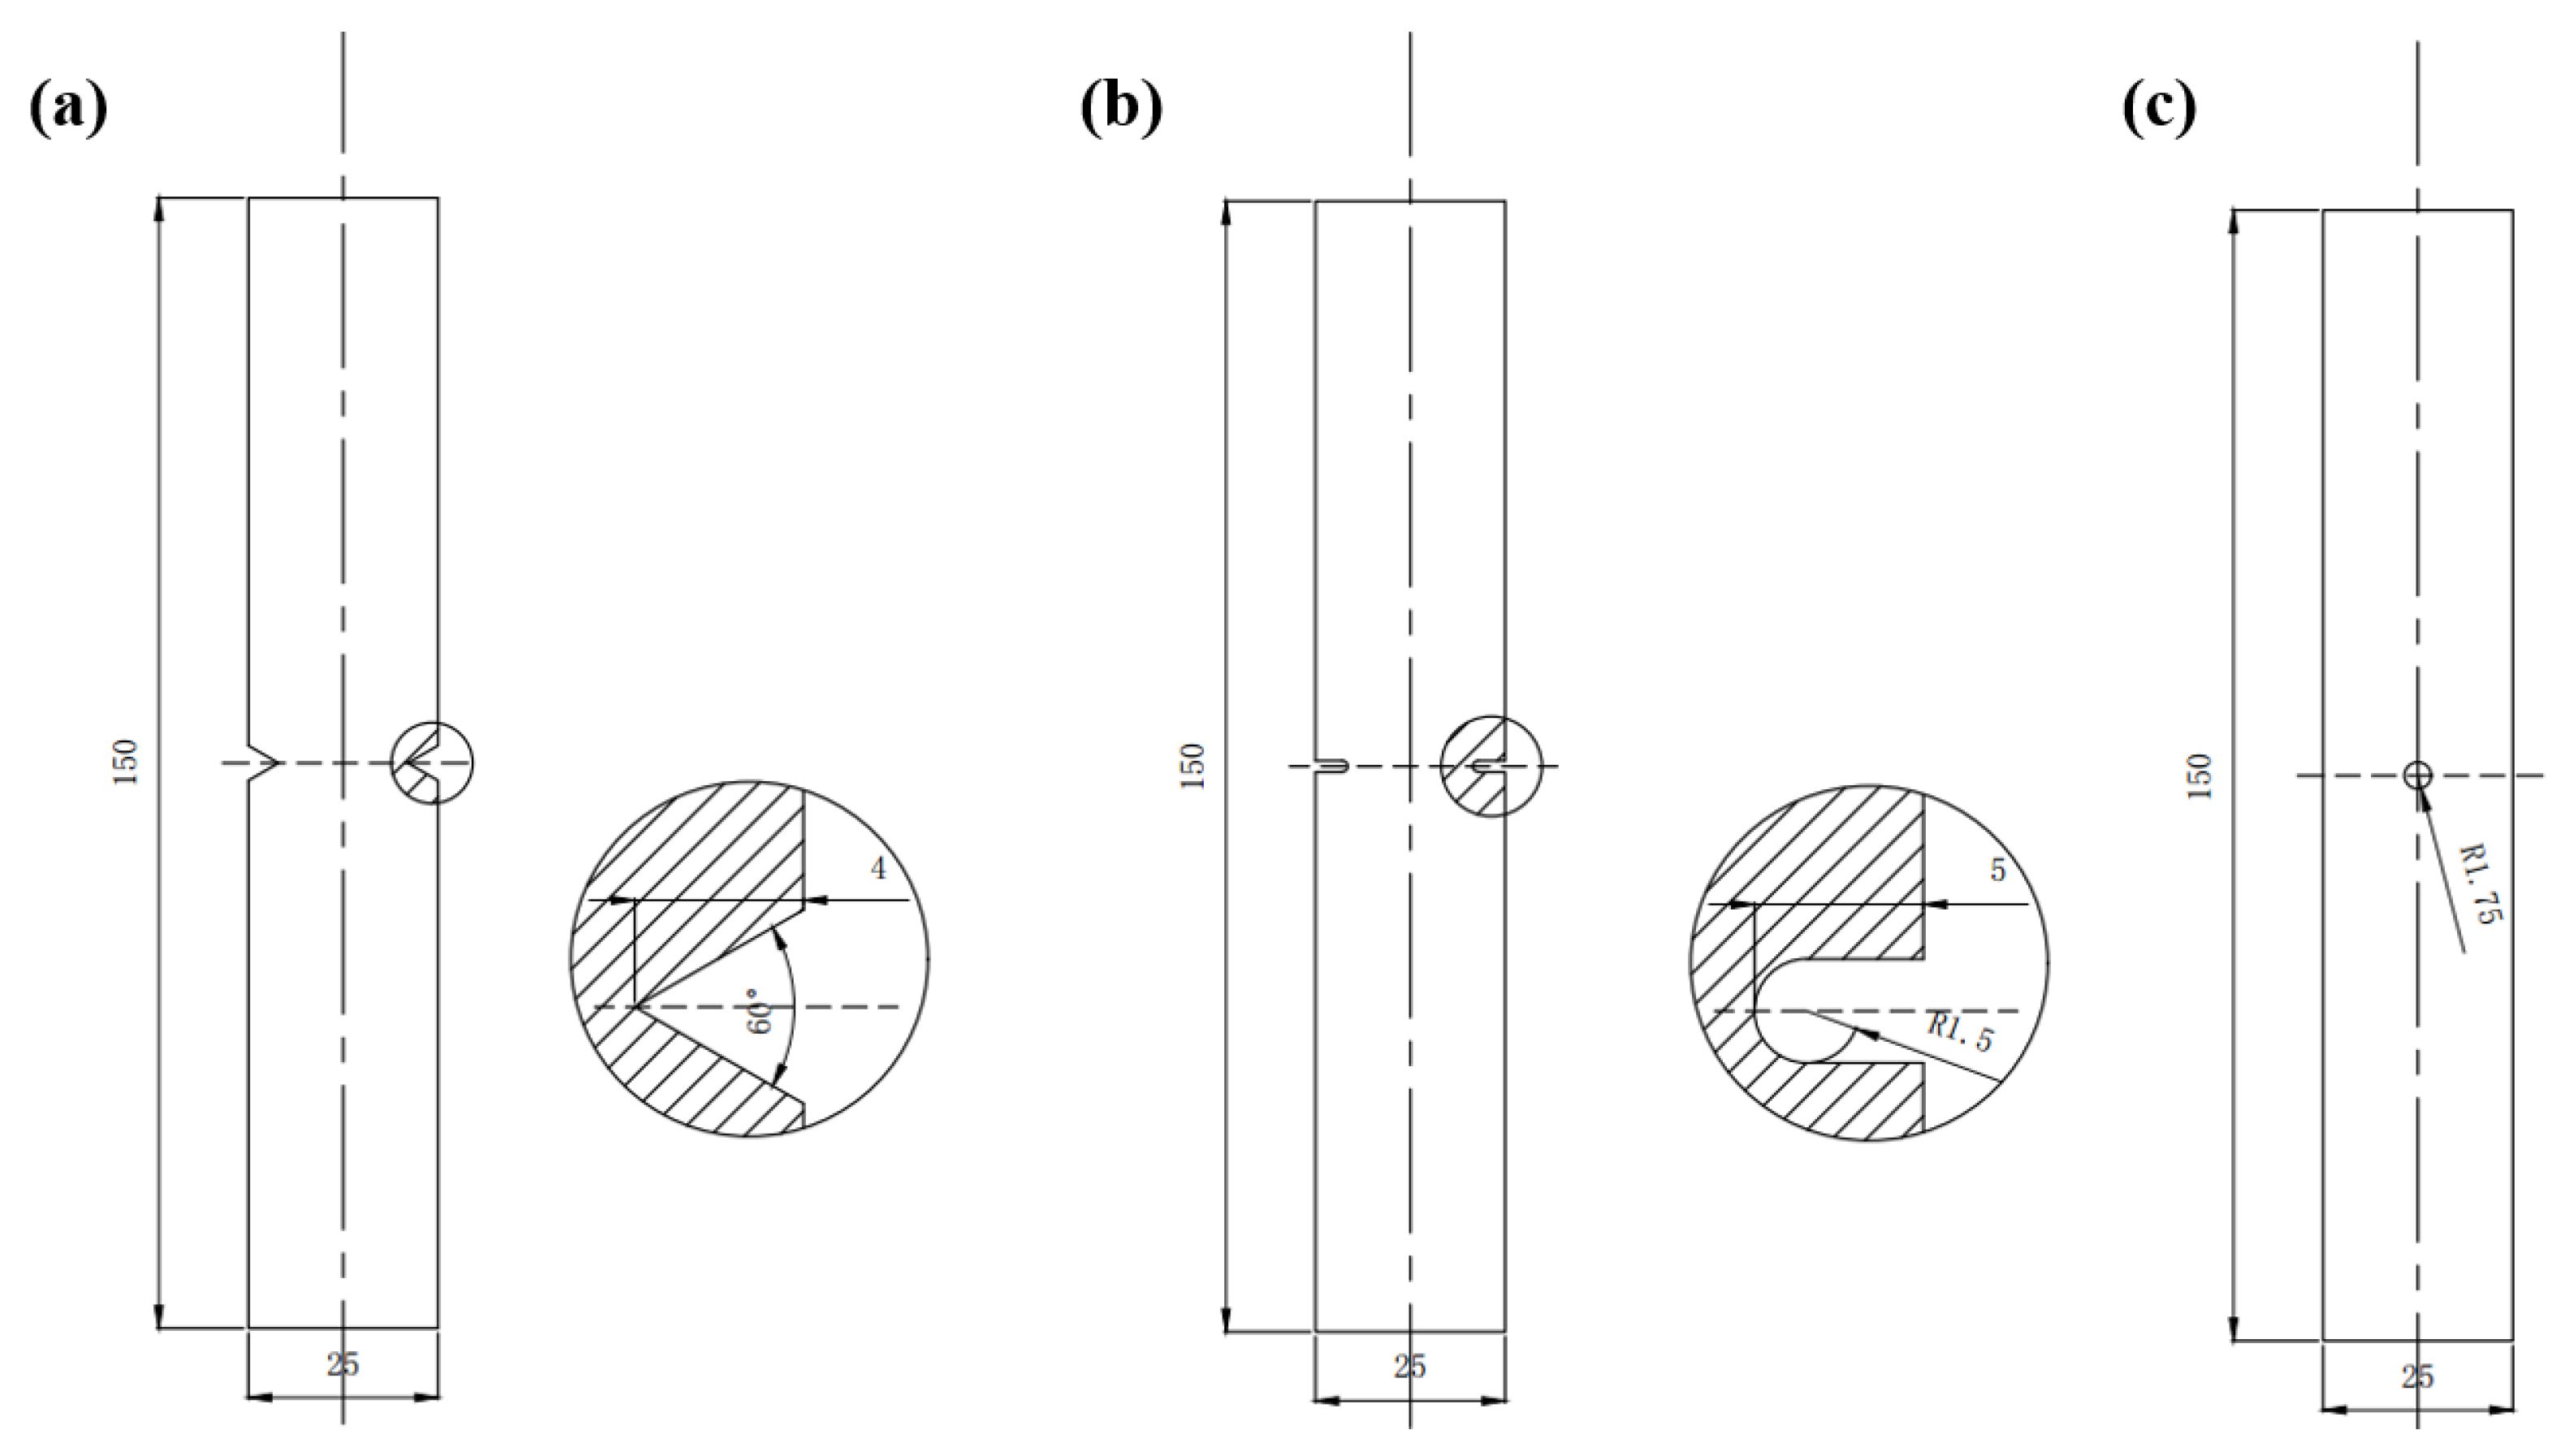
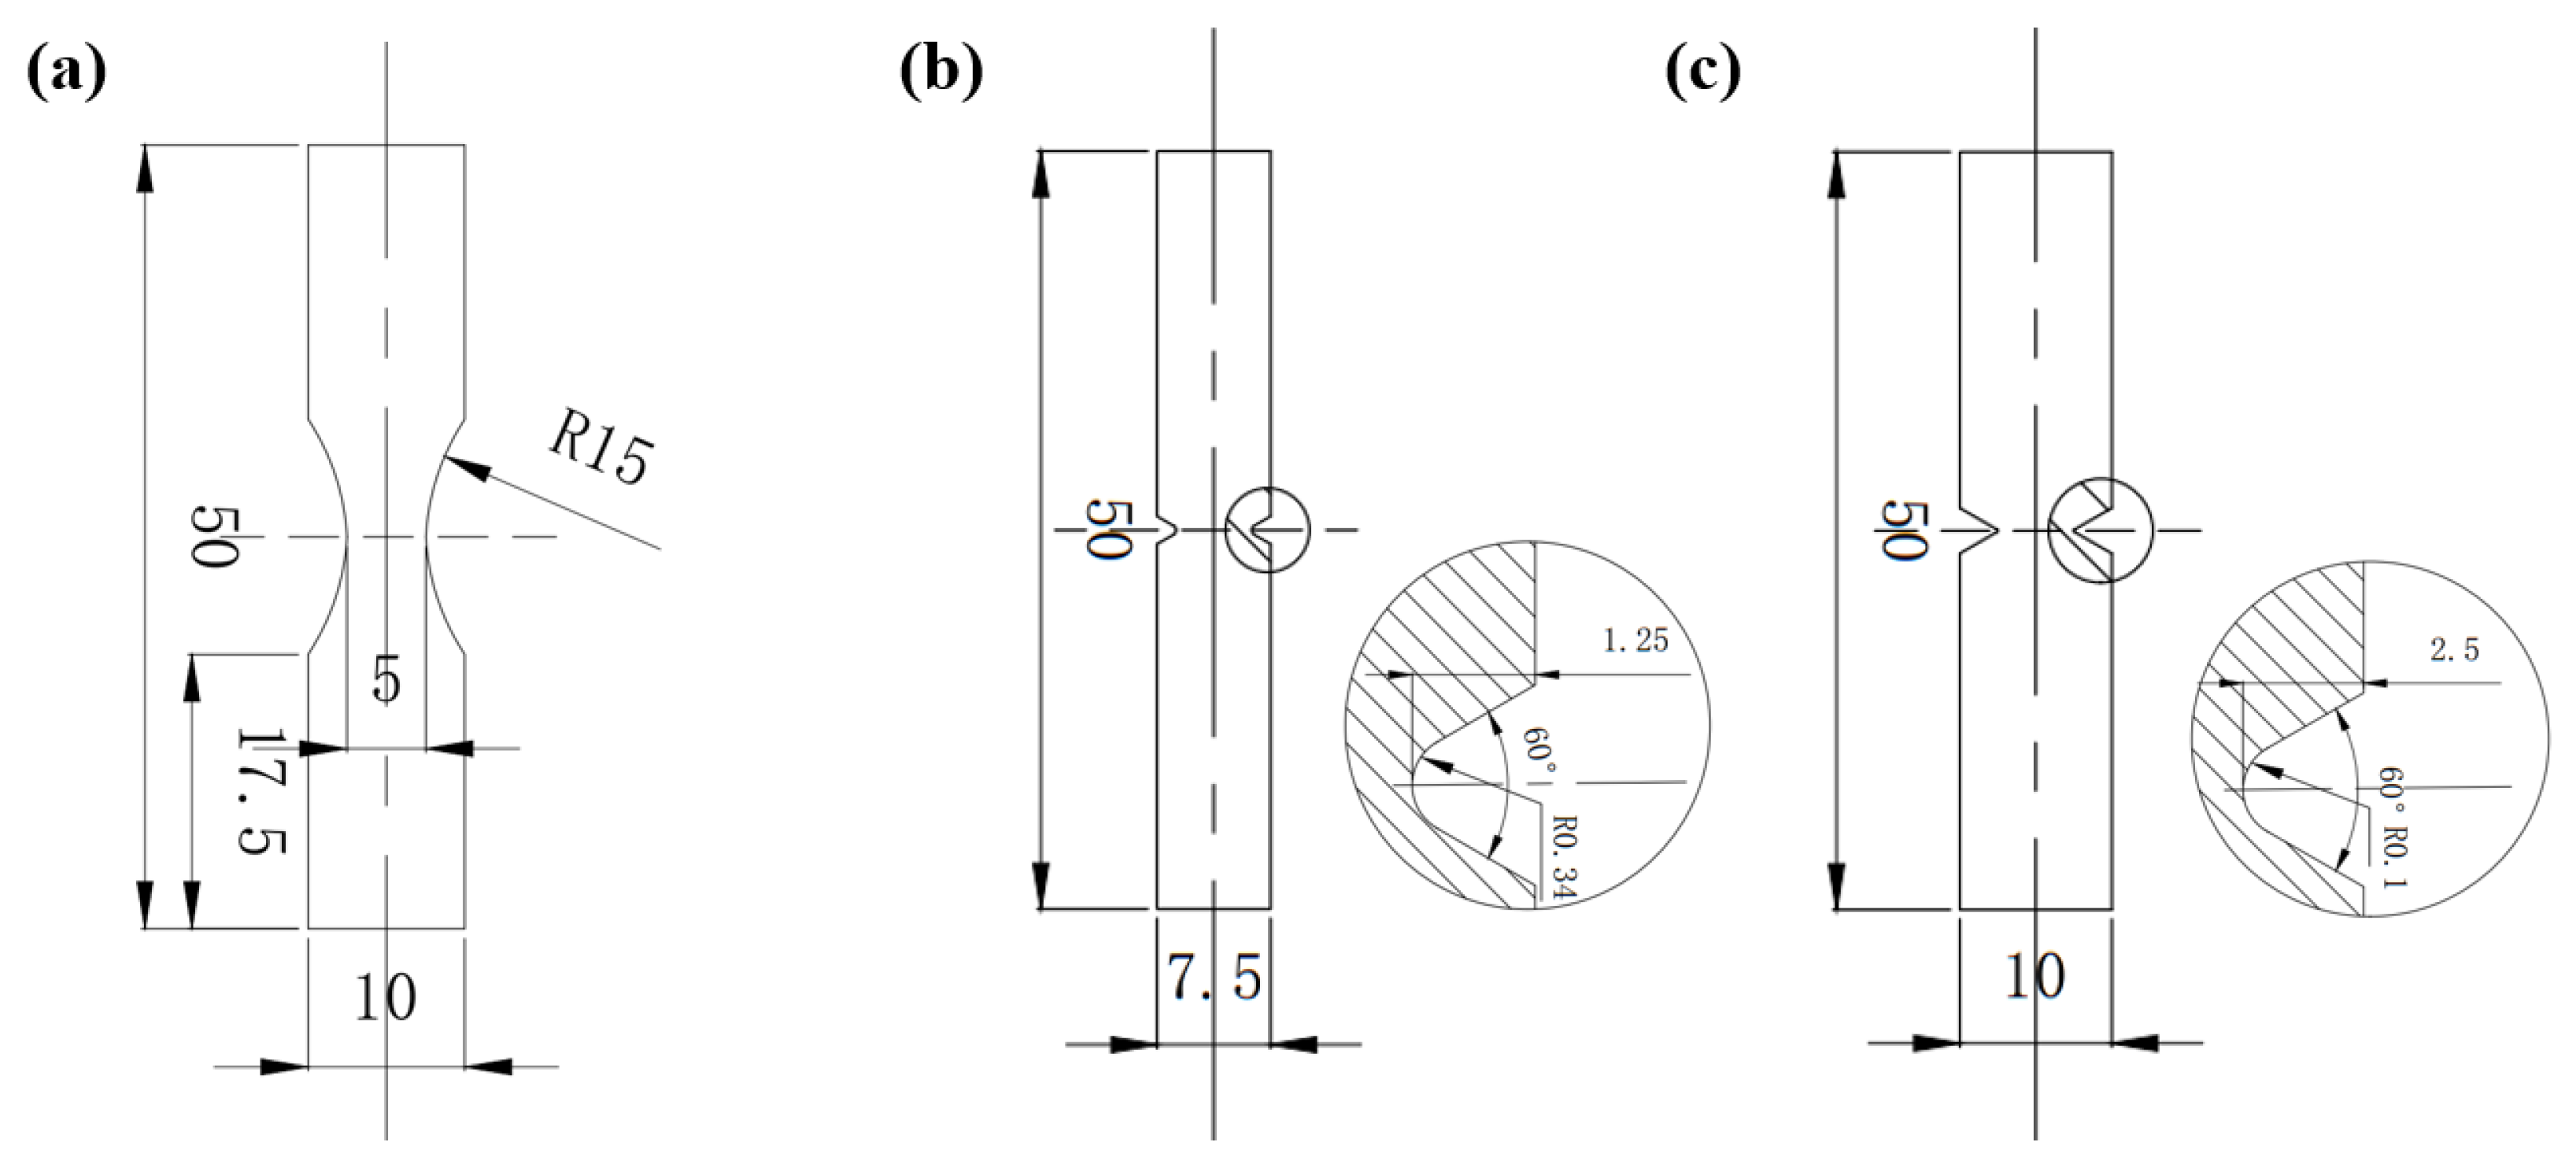
To enhance the uniformity of material properties and reduce the scatter in test results, specimens were sampled from positions with a radial distance of r     R / 3 , where R denotes the radius of the cylindrical billet. The geometries of the smooth and notch specimens are depicted in Figure 6. The experimental data of notched En3B [27], and titanium-based alloy TC4 [28], were used for model validation and comparison. The geometric shape and dimensions of the specimen are shown in Figure 7 and Figure 8.

3.2. Test Condition and Methods

Based on the actual operating conditions of the Central Pull-Rod during the start–stop process, the effective stress ratio was determined to be approximately 0.425. Accordingly, the fatigue tests were conducted under a tension–tension loading condition with a stress ratio of R   =   0.425 , according to the cyclic loading requirements of different fatigue specimens. Zwick 100 kN electromagnetic high-frequency fatigue testing machine (Zwick/Roell Group, Ulm, Germany) was used for smooth specimen, with a test frequency of 90 Hz. MTS 370.10 100 kN hydraulic servo fatigue testing machine (MTS Systems Corporation, Eden Prairie, MN, USA) was utilized for 8 (r = 1.0, r = 0.4, r = 0.15 mm) size specimens, and the test frequency was 25 Hz. For larger specimens, including 16 (r = 0.8 mm), 18 (r = 0.4 mm), and 32 (r = 1.6 mm), W + B LFV-500 kN hydraulic servo-controlled fatigue testing machine (Swiss W+B company, Lausanne, Switzerland) was selected, and the test frequency was 10 Hz. The end condition of the fatigue test was fatigue fracture failure or 1   ×   10 7 cycles. During the testing, the applied stress level ranged from 10 ~ 25 MPa, and each subsequent stress level was determined based on the results of the previous fatigue test. The fatigue limit of the specimen was determined using the staircase method with 12 ~ 14 specimens, while the grouping method employed three stress levels, with two to six specimens per level.
The fatigue crack propagation (FCG) tests were conducted at room temperature (RT) using a 25 kN MTS testing machine (MTS Systems Corporation, Eden Prairie, MN, USA) in accordance with ASTM E647-15. The tests were performed under stress-controlled mode, utilizing the K-decreasing method with a stress ratio R = 0.425 and a frequency of 10 Hz. The metallographic samples of the 26Cr2Ni4MoV were analyzed using Zeiss Field Emission Scanning Electron Microscopy (FE-SEM) (Carl Zeiss AG, Jena and Oberkochen, Germany). Prior to observation, the specimen was etched in a 4% nitric acid liquor solution for 20 s. After fatigue test, the fracture morphology of the specimens was observed using FE-SEM.
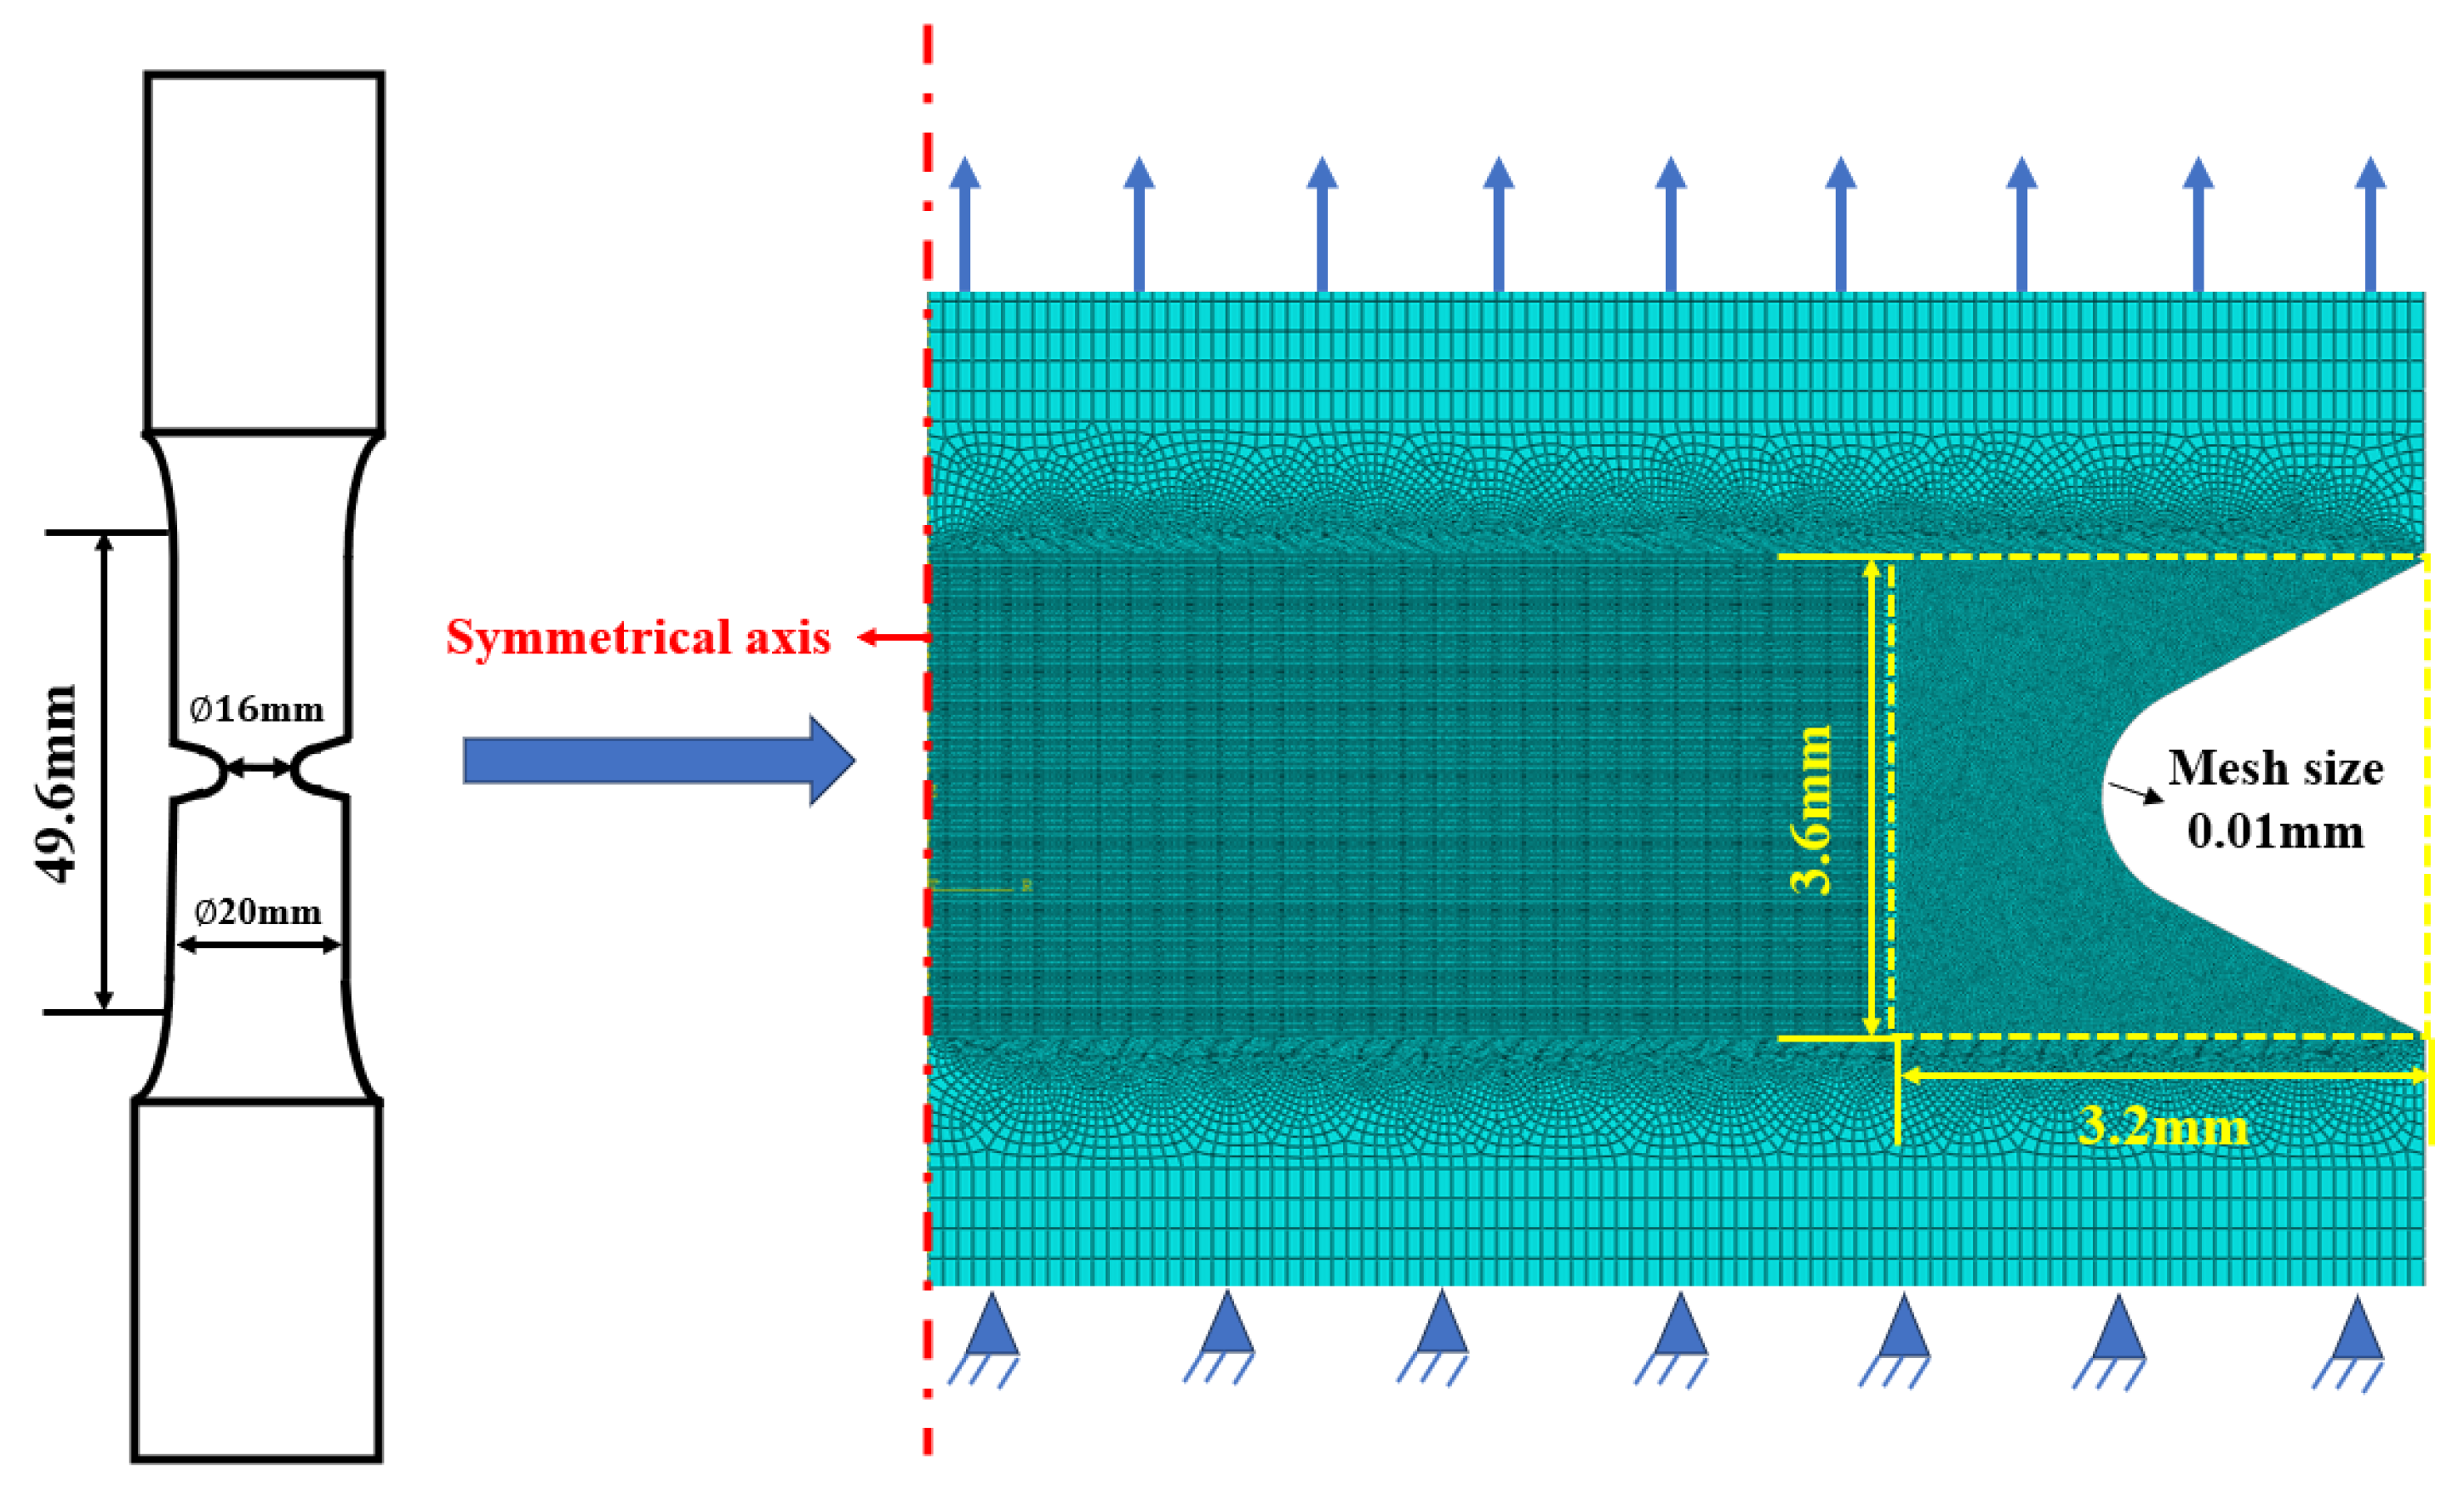
The finite element analysis software ABAQUS (2024 version) was utilized to model and analyze the notched specimens. A linear elastic–plastic material model was adopted, with plasticity defined using a Von Mises yield criterion and isotropic hardening to capture the cyclic stress–strain response. The material parameters, including the cyclic strength coefficient and strain hardening exponent for 26Cr2Ni4MoV, were explicitly applied. As shown in Figure 9, the mesh was generated using the progressive refinement approach, with finer mesh applied in the vicinity of the notch to accurately capture stress concentration effects, and coarser mesh in regions farther from the notch to reduce computational cost. This strategy ensured the stability of the finite element model and the reliability of the results. The arrow on the right side of the figure represents the direction of the applied load, while the symbol on the other end represents complete fixation.

4. Results and Discussion

4.1. Microstructure and Tensile Properties

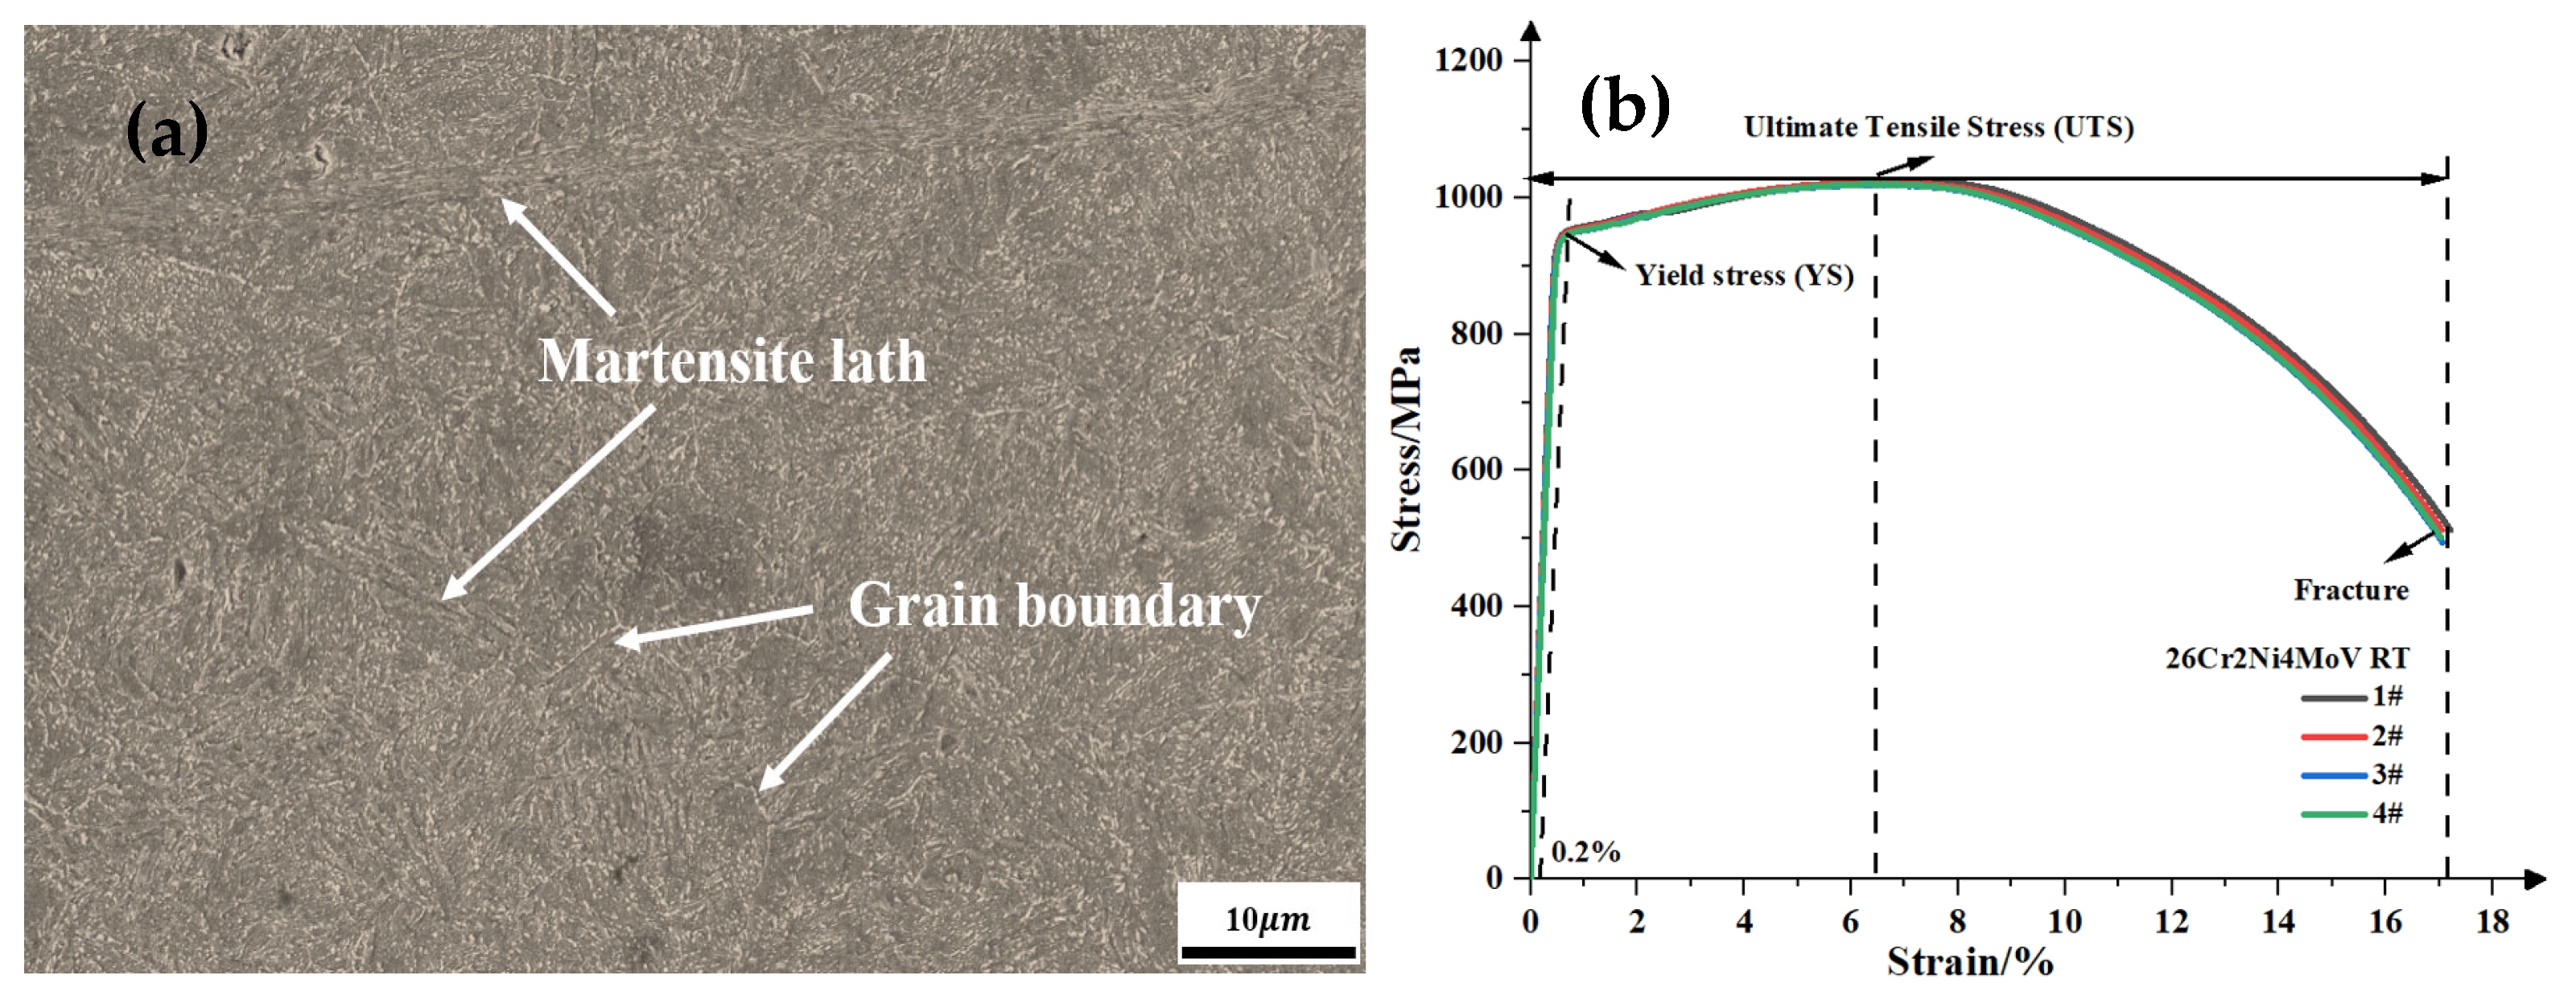
The microstructure and tensile test results are illustrated in Figure 10. The tempered sorbite microstructure with uniformly distributed ferrite and fine carbide particles is shown in Figure 10a, indicating that the quenching and tempering process produced a homogeneous microstructure throughout the specimen. Sampling took place at different positions along the radial direction with four parallel specimens selected for the monotonic tensile testing. The tensile properties are summarized in Table 2, indicating that the material exhibits high strength and good ductility.

4.2. Fatigue Properties

The Basquin formula has always been the most important method for fitting S-N curves, with the main representation form Equation (15):
N f = σ m a x m · C
Taking the derivative on both sides of the equation yields Equation (16). All linear regressions were performed using ordinary least squares in Origin software, with l g N f as the response variable. The residuals of l g N f were minimized to obtain the m and C.
l g N f = m · l g σ m a x + l g C
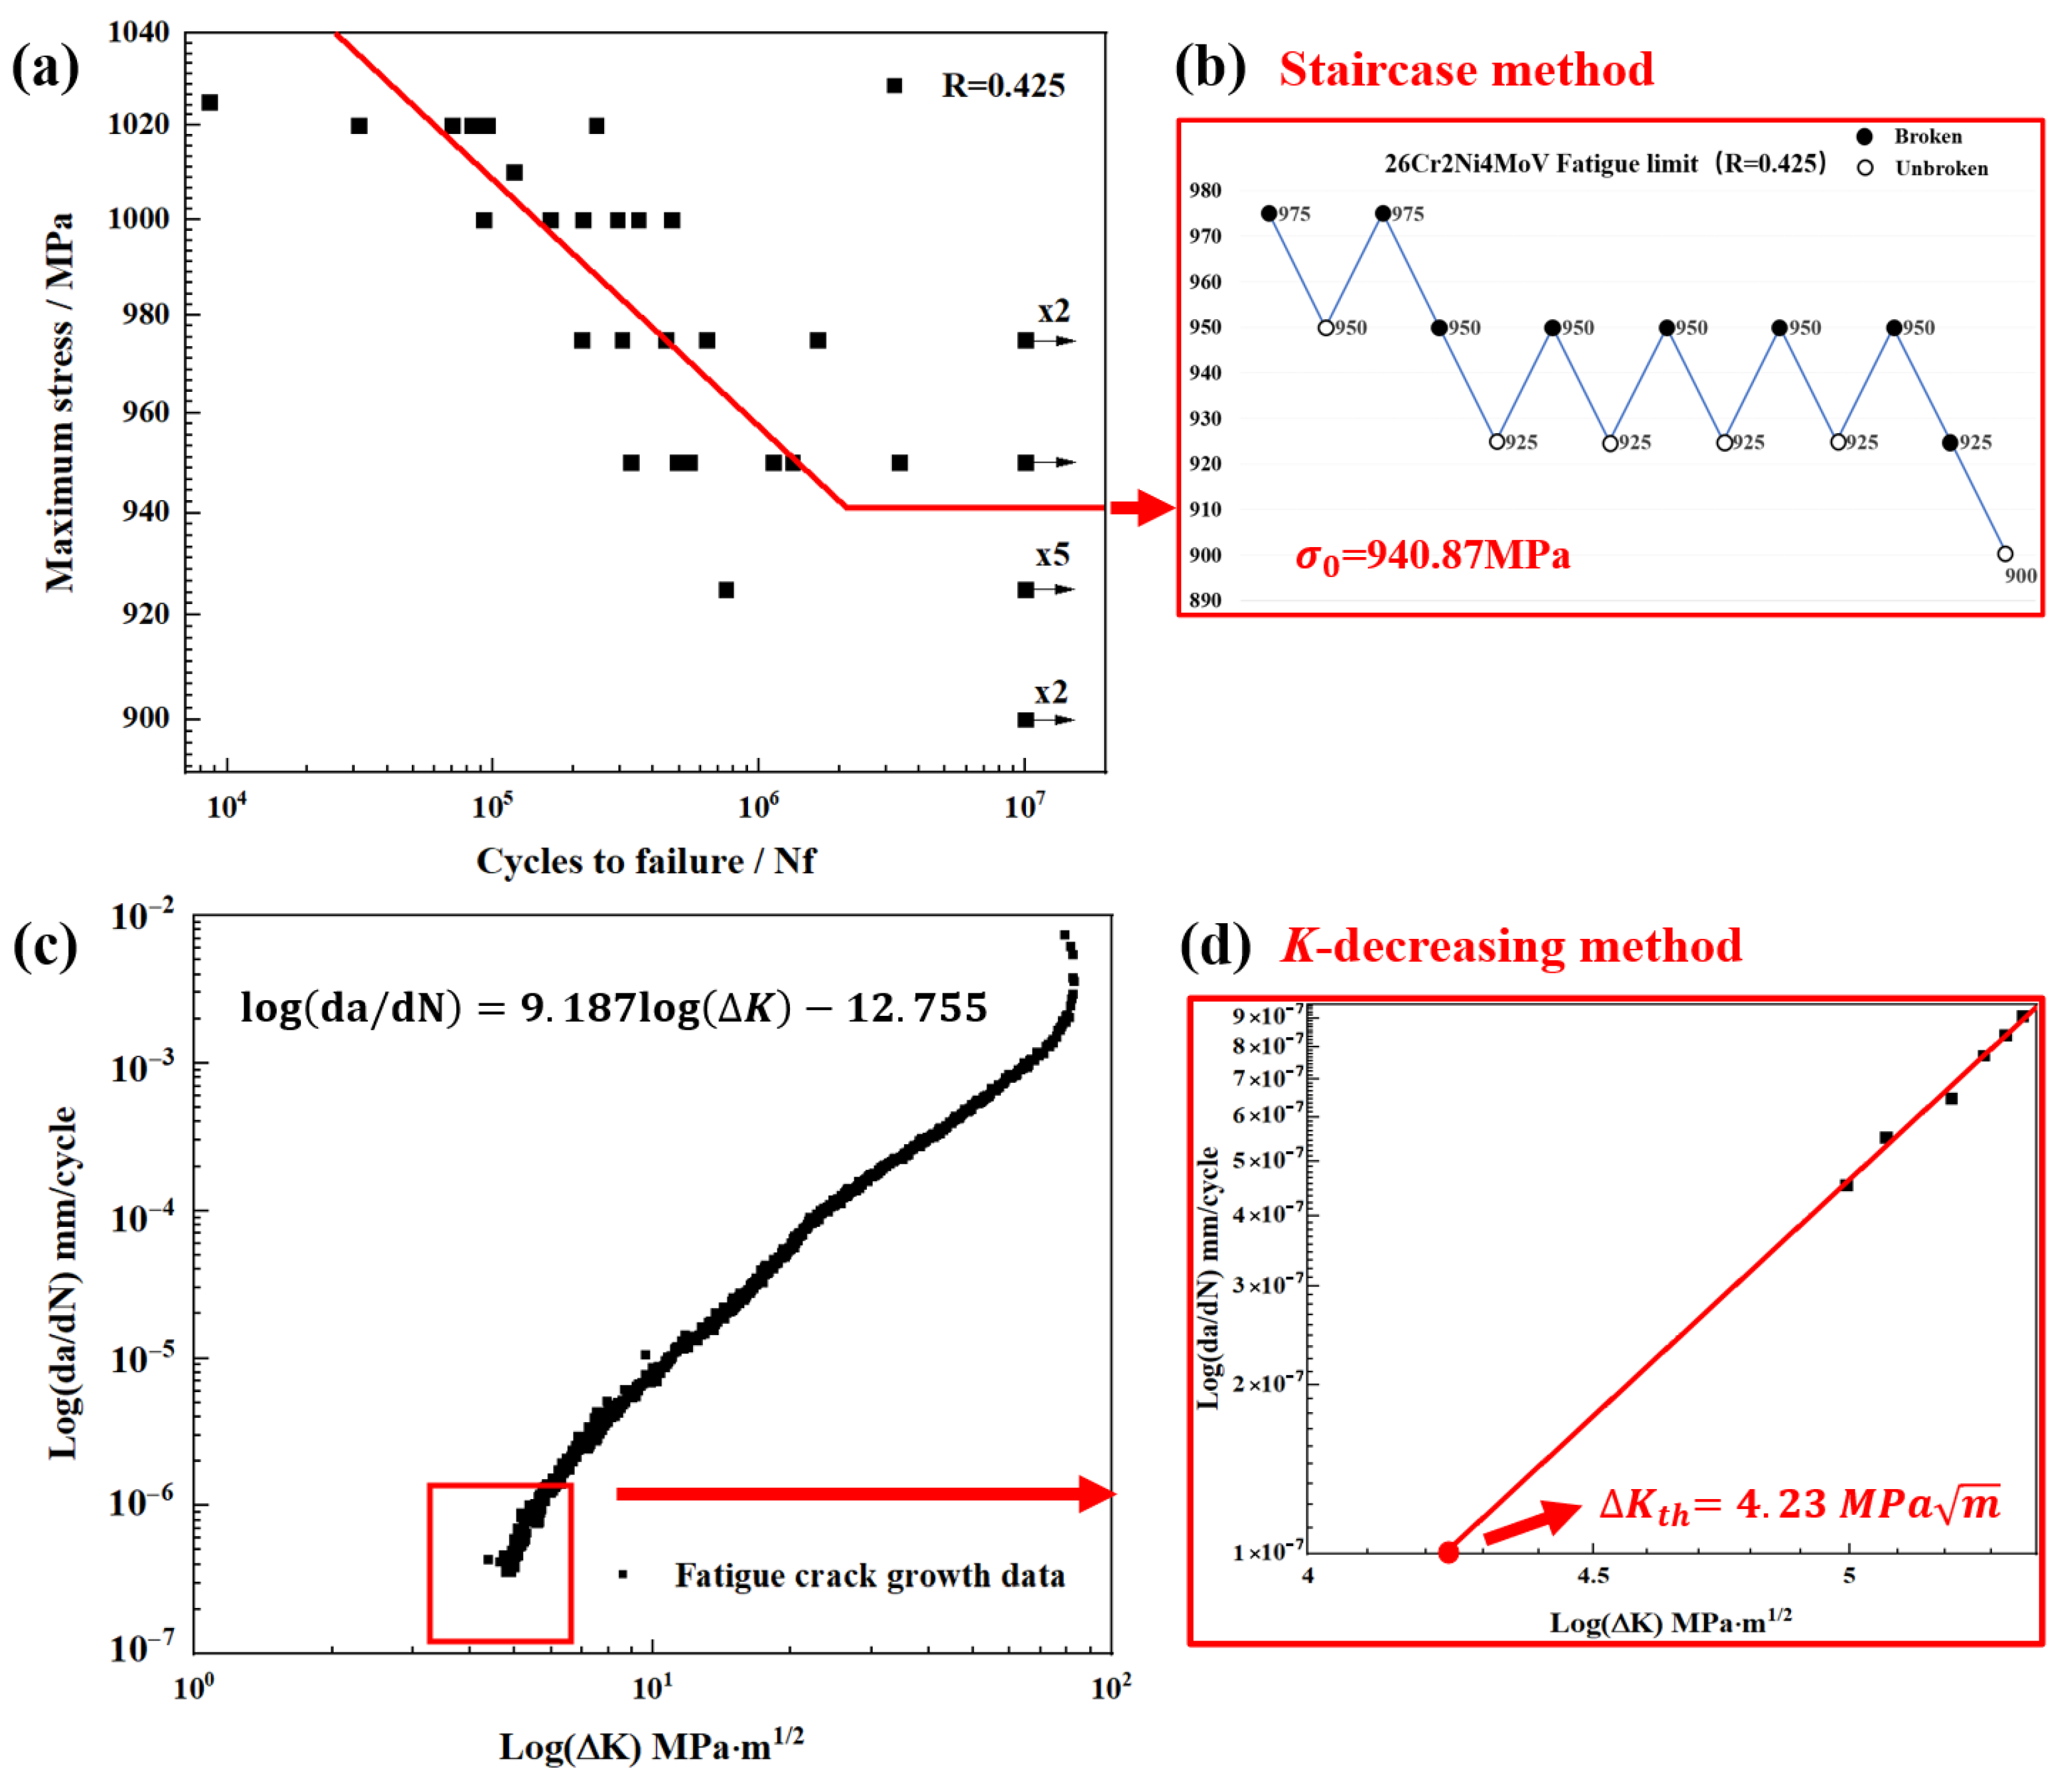
The fatigue test of 26Cr2Ni4MoV smooth specimens were conducted with a stress ratio of 0.425. The S-N data are plotted in Figure 11b and the fatigue limit is approximately 940.87 MPa, while the σ 0 = 540.01 MPa. The Basquin function is as follows:
lg N f = 32.73 l g σ m a x + 103.42
According to the data, the fatigue limit was tested using staircase method for the 12–14 specimens, calculated by formula Equation (18):
σ 0.425 = 1 K v 1 · σ 1 + v 2 · σ 2 + + v n · σ n = 1 K i = 1 n v i · σ i
where K is the total number of the effective fatigue test data, n is the number of stress levels, σ i is the stress level and v i is the test numbers.
The fatigue crack propagation threshold of 26Cr2Ni4MoV was approximately 4.23 M P a m , as shown in Figure 11d. Subsequently, the critical distance was calculated using Equation (5) to be 0.02 mm.
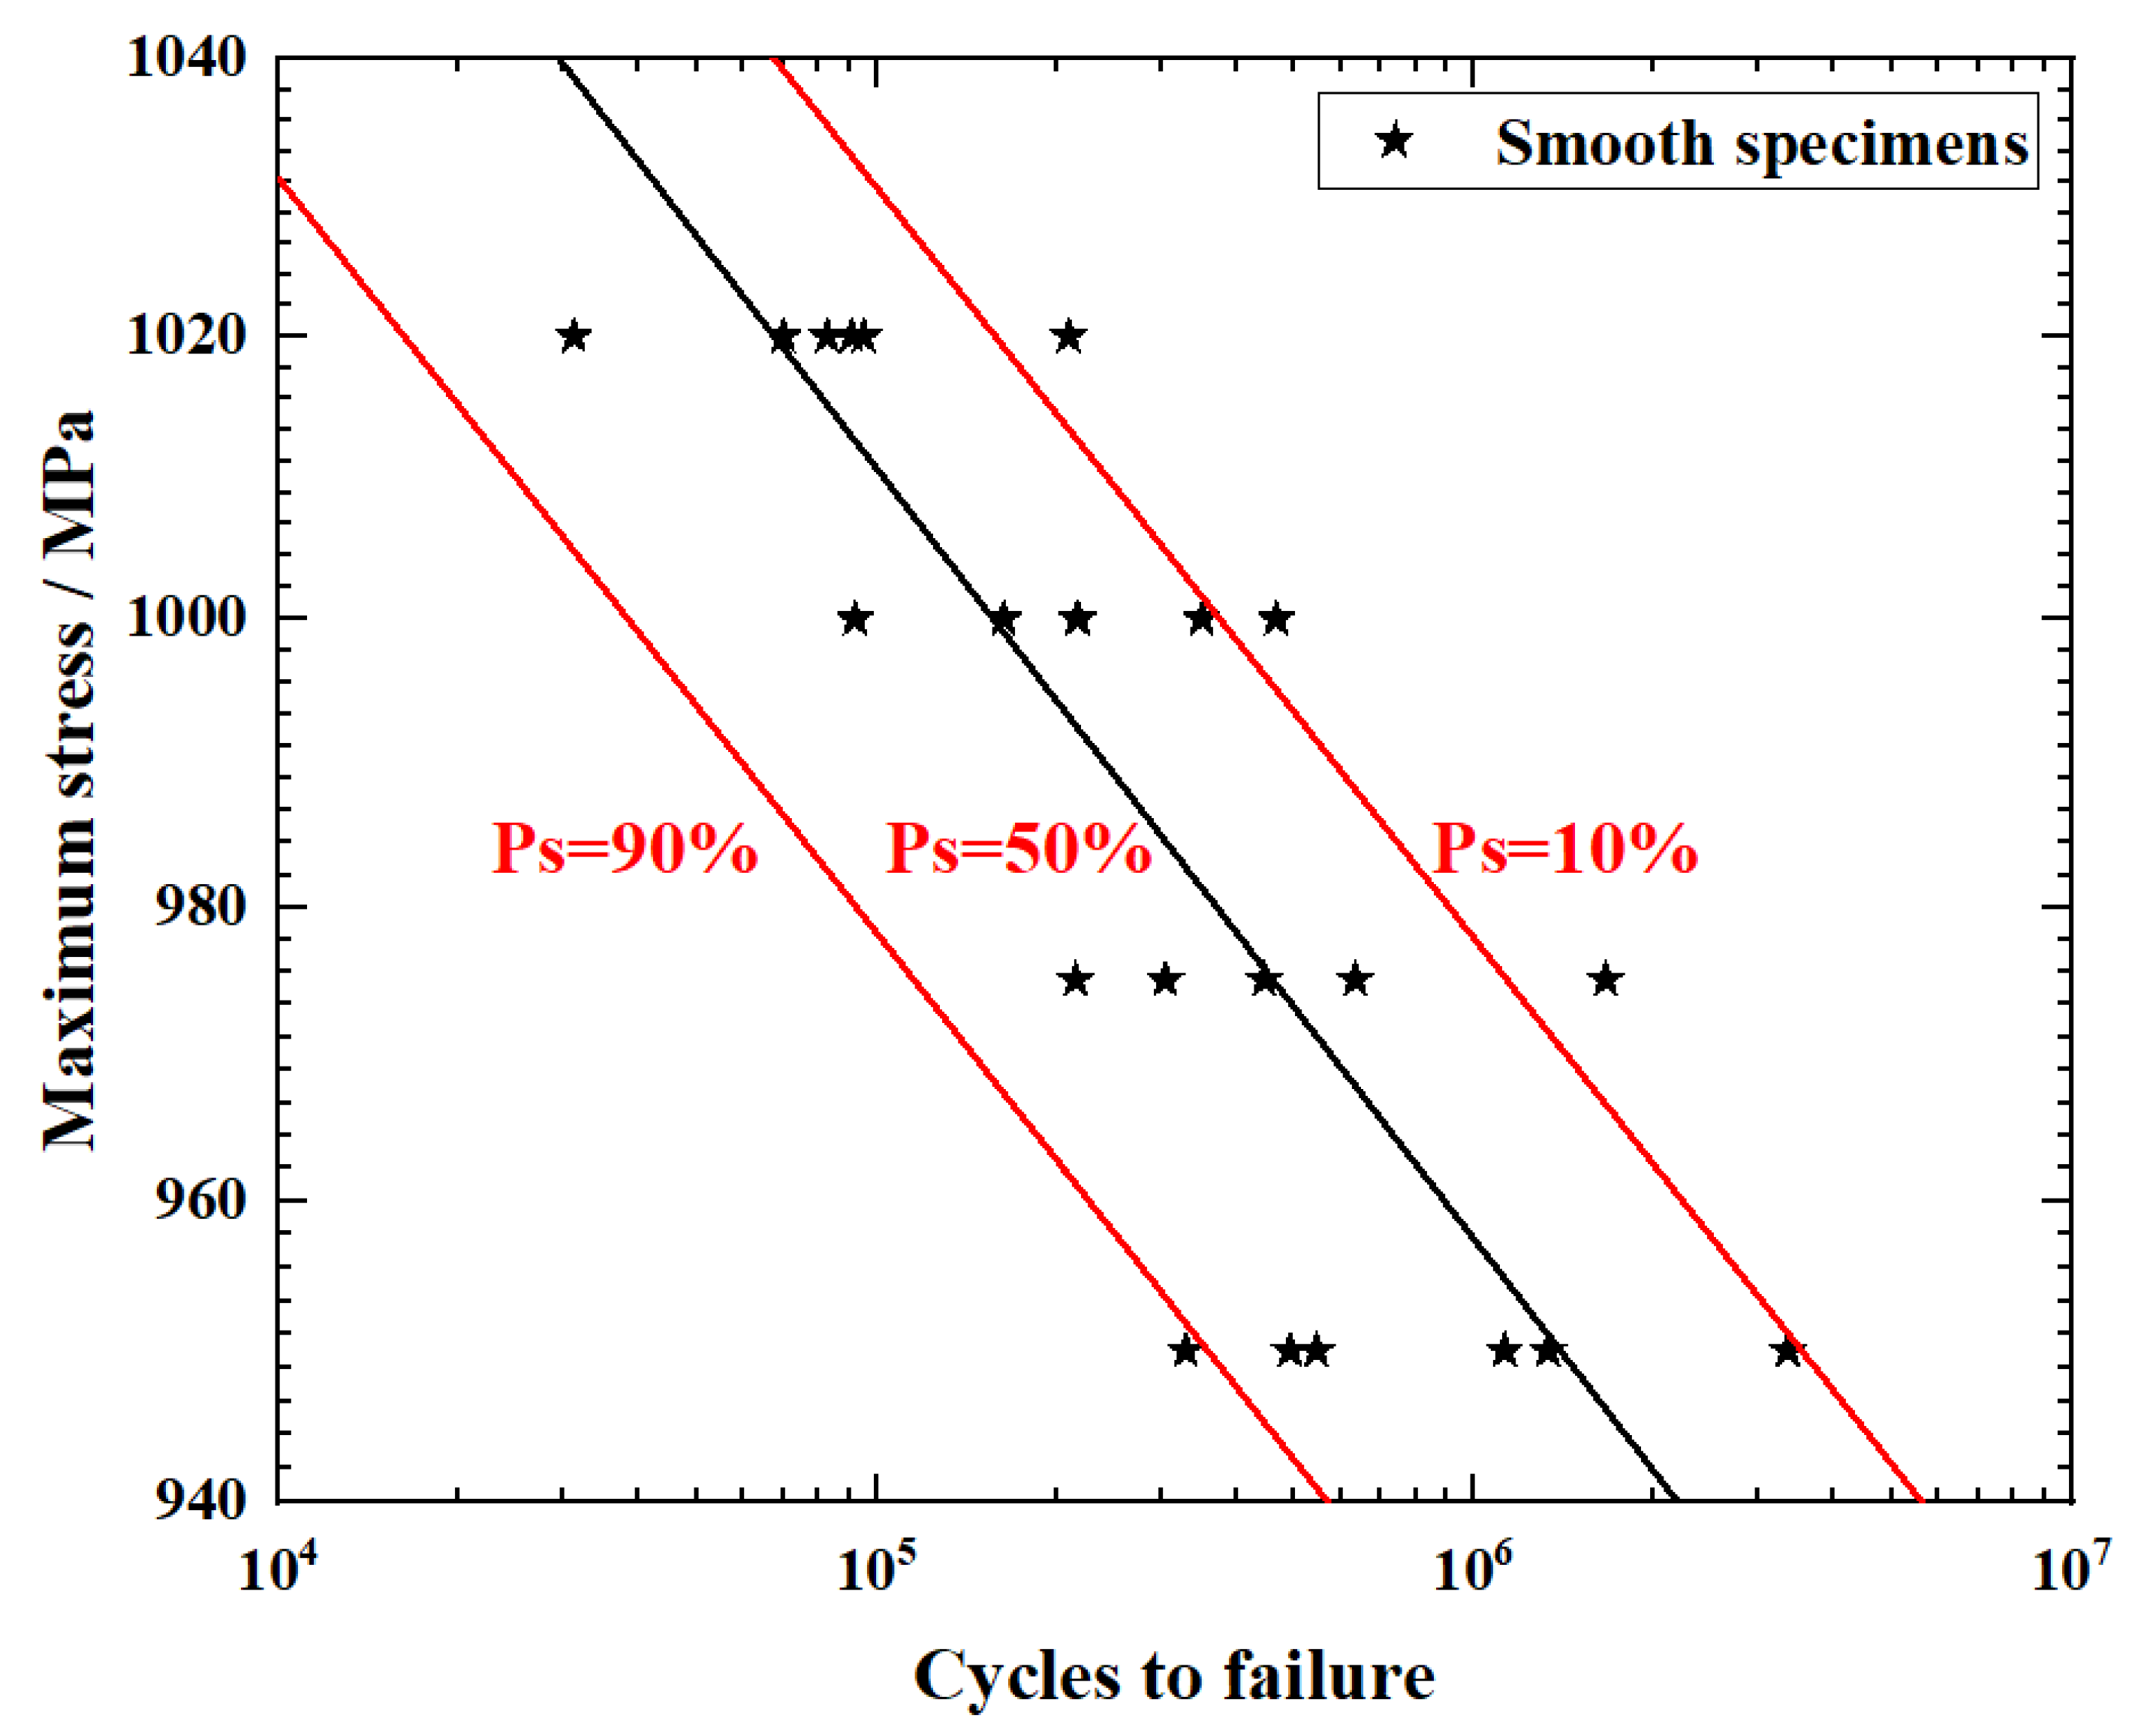
The P-S-N curve and scatter bands for 26Cr2Ni4MoV smooth specimens at three different survival probabilities (10%, 50%, and 90%) are plotted, as shown in Figure 12. It can be seen that the data points are mostly distributed within the survival probability dispersion band, which validates that the Weibull distribution is a reasonable method for quantitatively characterizing the dispersion in fatigue life.
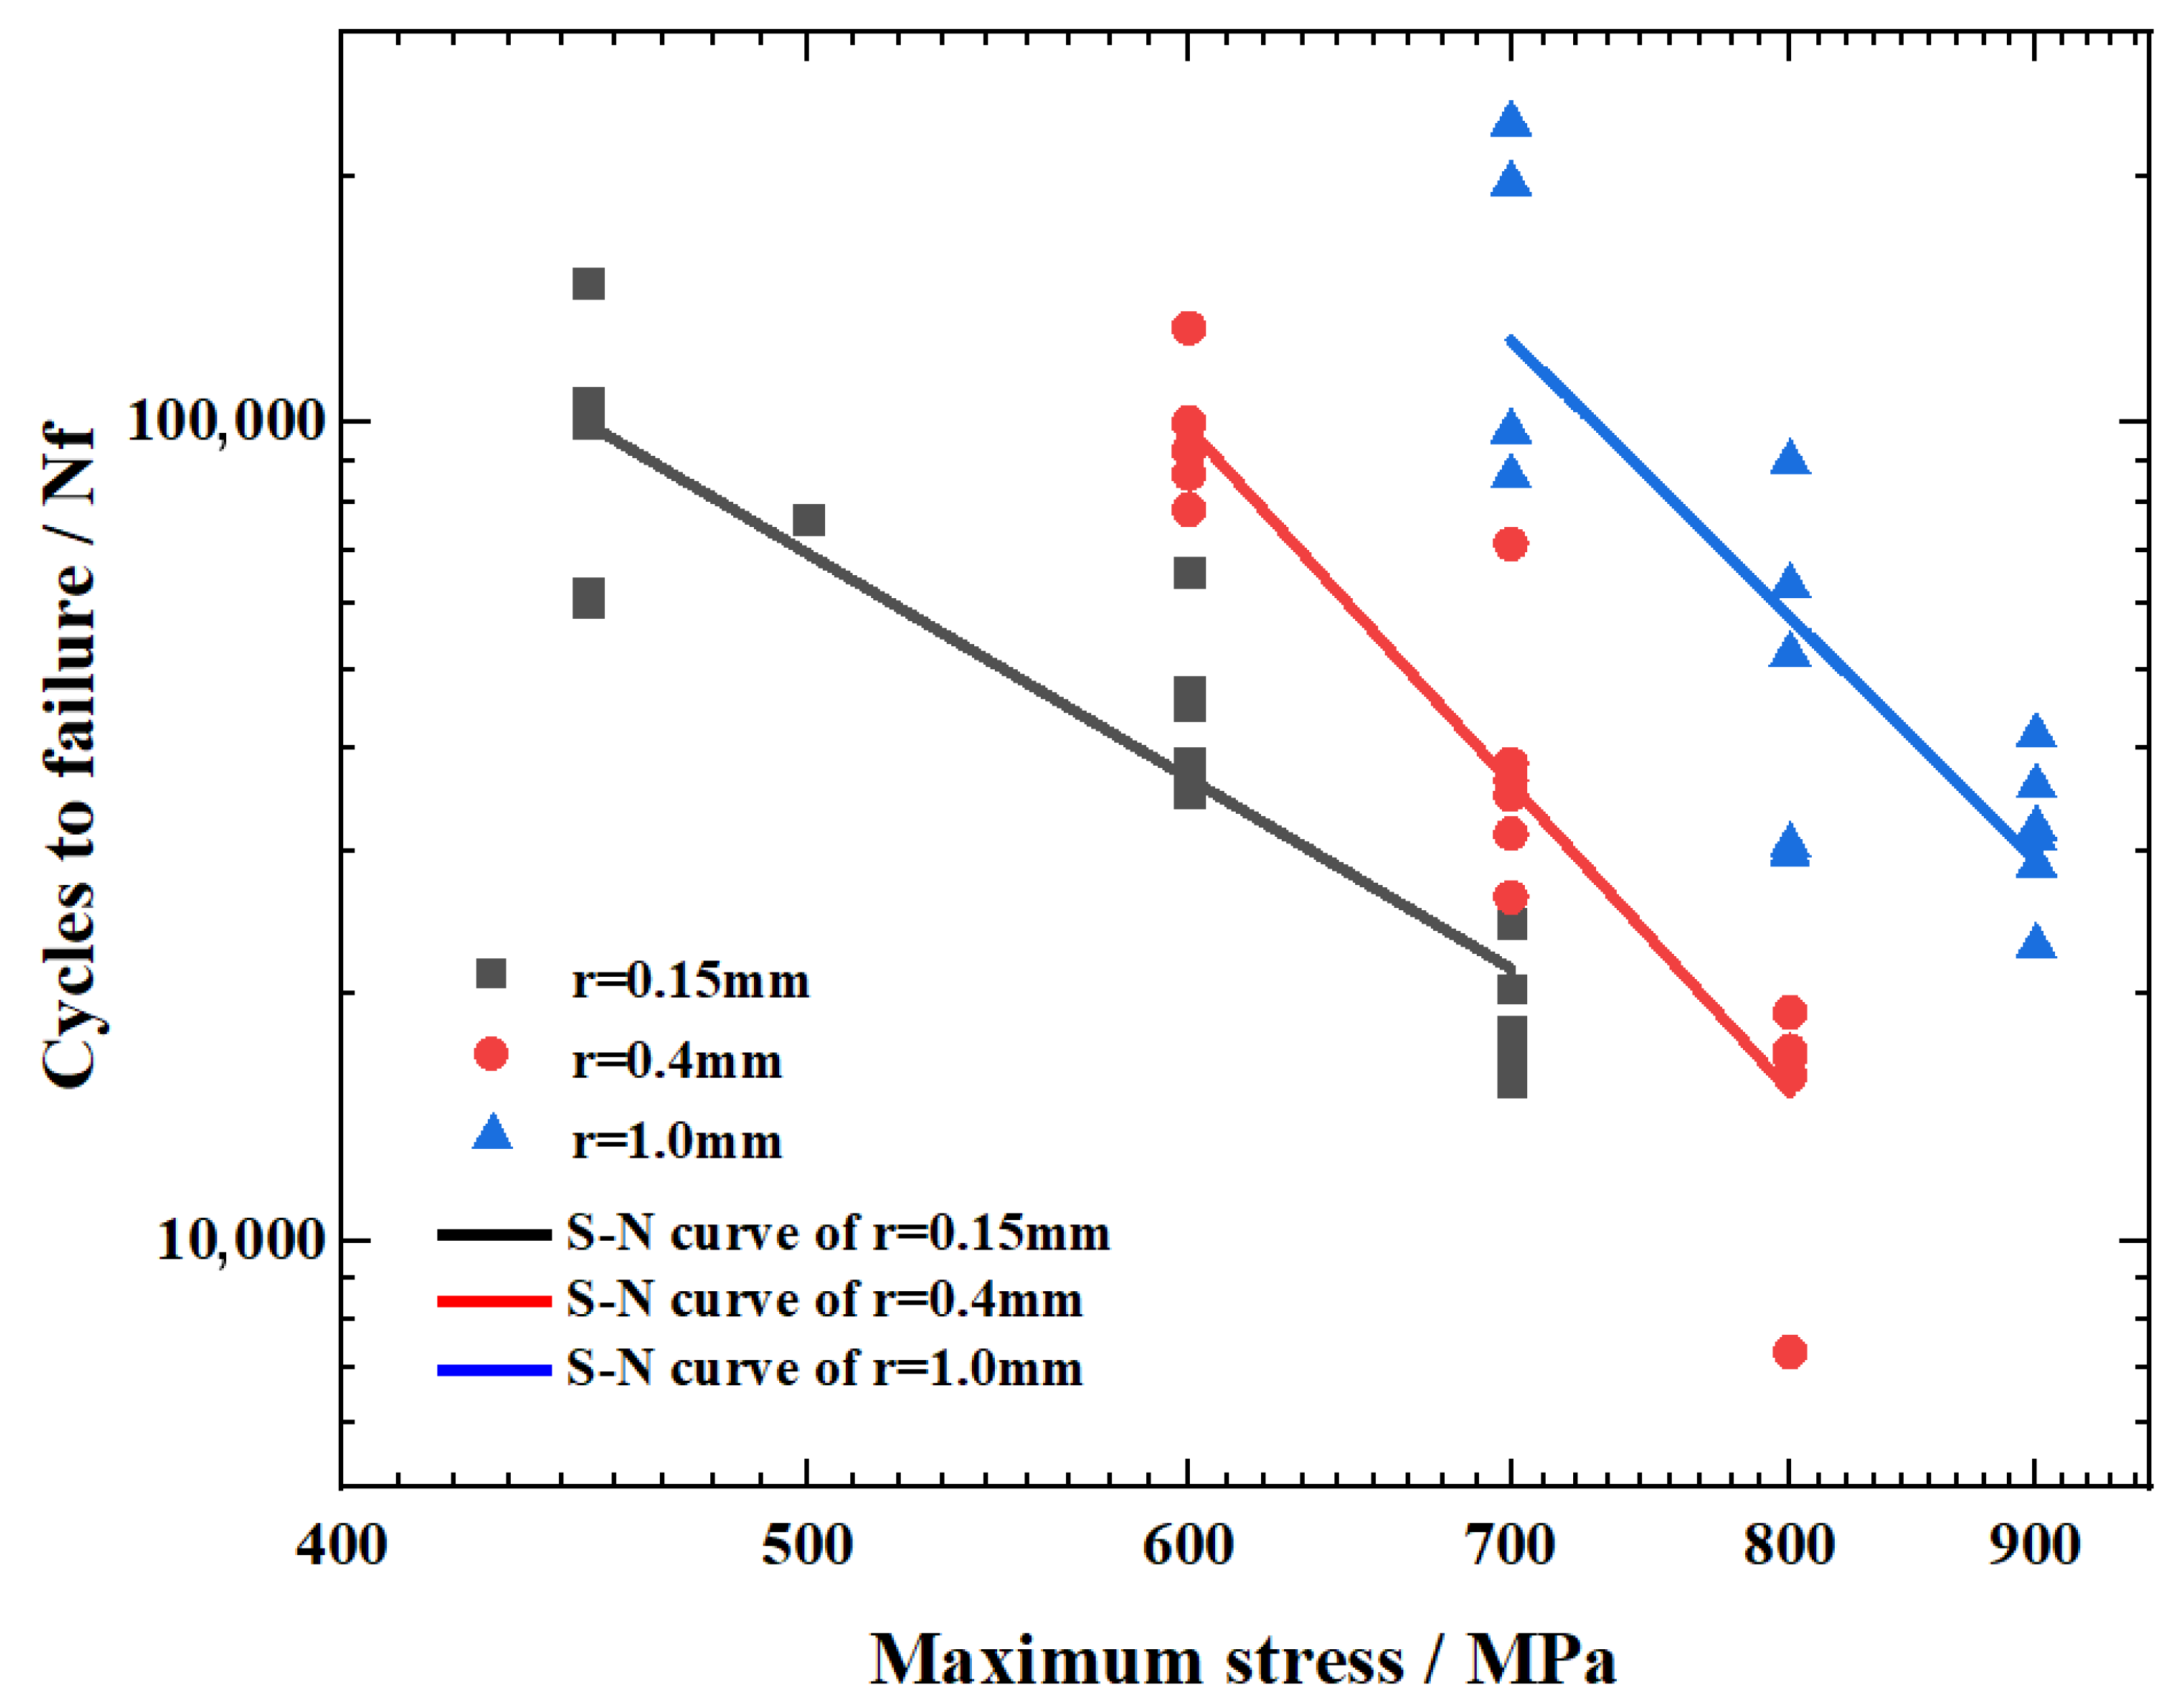
The S-N curves for notched specimens with notch root radium of 8 (r = 1.0, r = 0.4, r = 0.15 mm) are shown in Figure 13. It can be observed that fatigue life increases with increasing notch root radius. The S-N curves for 8 (r = 0.15 mm) notch root radius lies significantly below that of the 8 (r = 0.4 mm), which is also lower than that of the 8 (r = 1.0 mm). This trend highlights the strong sensitivity of fatigue performance to notch sharpness, confirming that sharper notches cause higher stress concentrations and earlier fatigue failure. The Basquin equations for S–N analysis are expressed in double-logarithmic form. To ensure proper regression direction, stress is strictly treated as the independent variable, and the linear regression is performed by minimizing the residuals of l g N f , which are given in Equations (19)–(21):
l g N f = 3.47 · lg σ m a x + 14.21
l g N f = 6.49 · lg σ m a x + 23.05
l g N f = 5.83 · lg σ m a x + 21.71

4.3. Fatigue Fracture Analysis

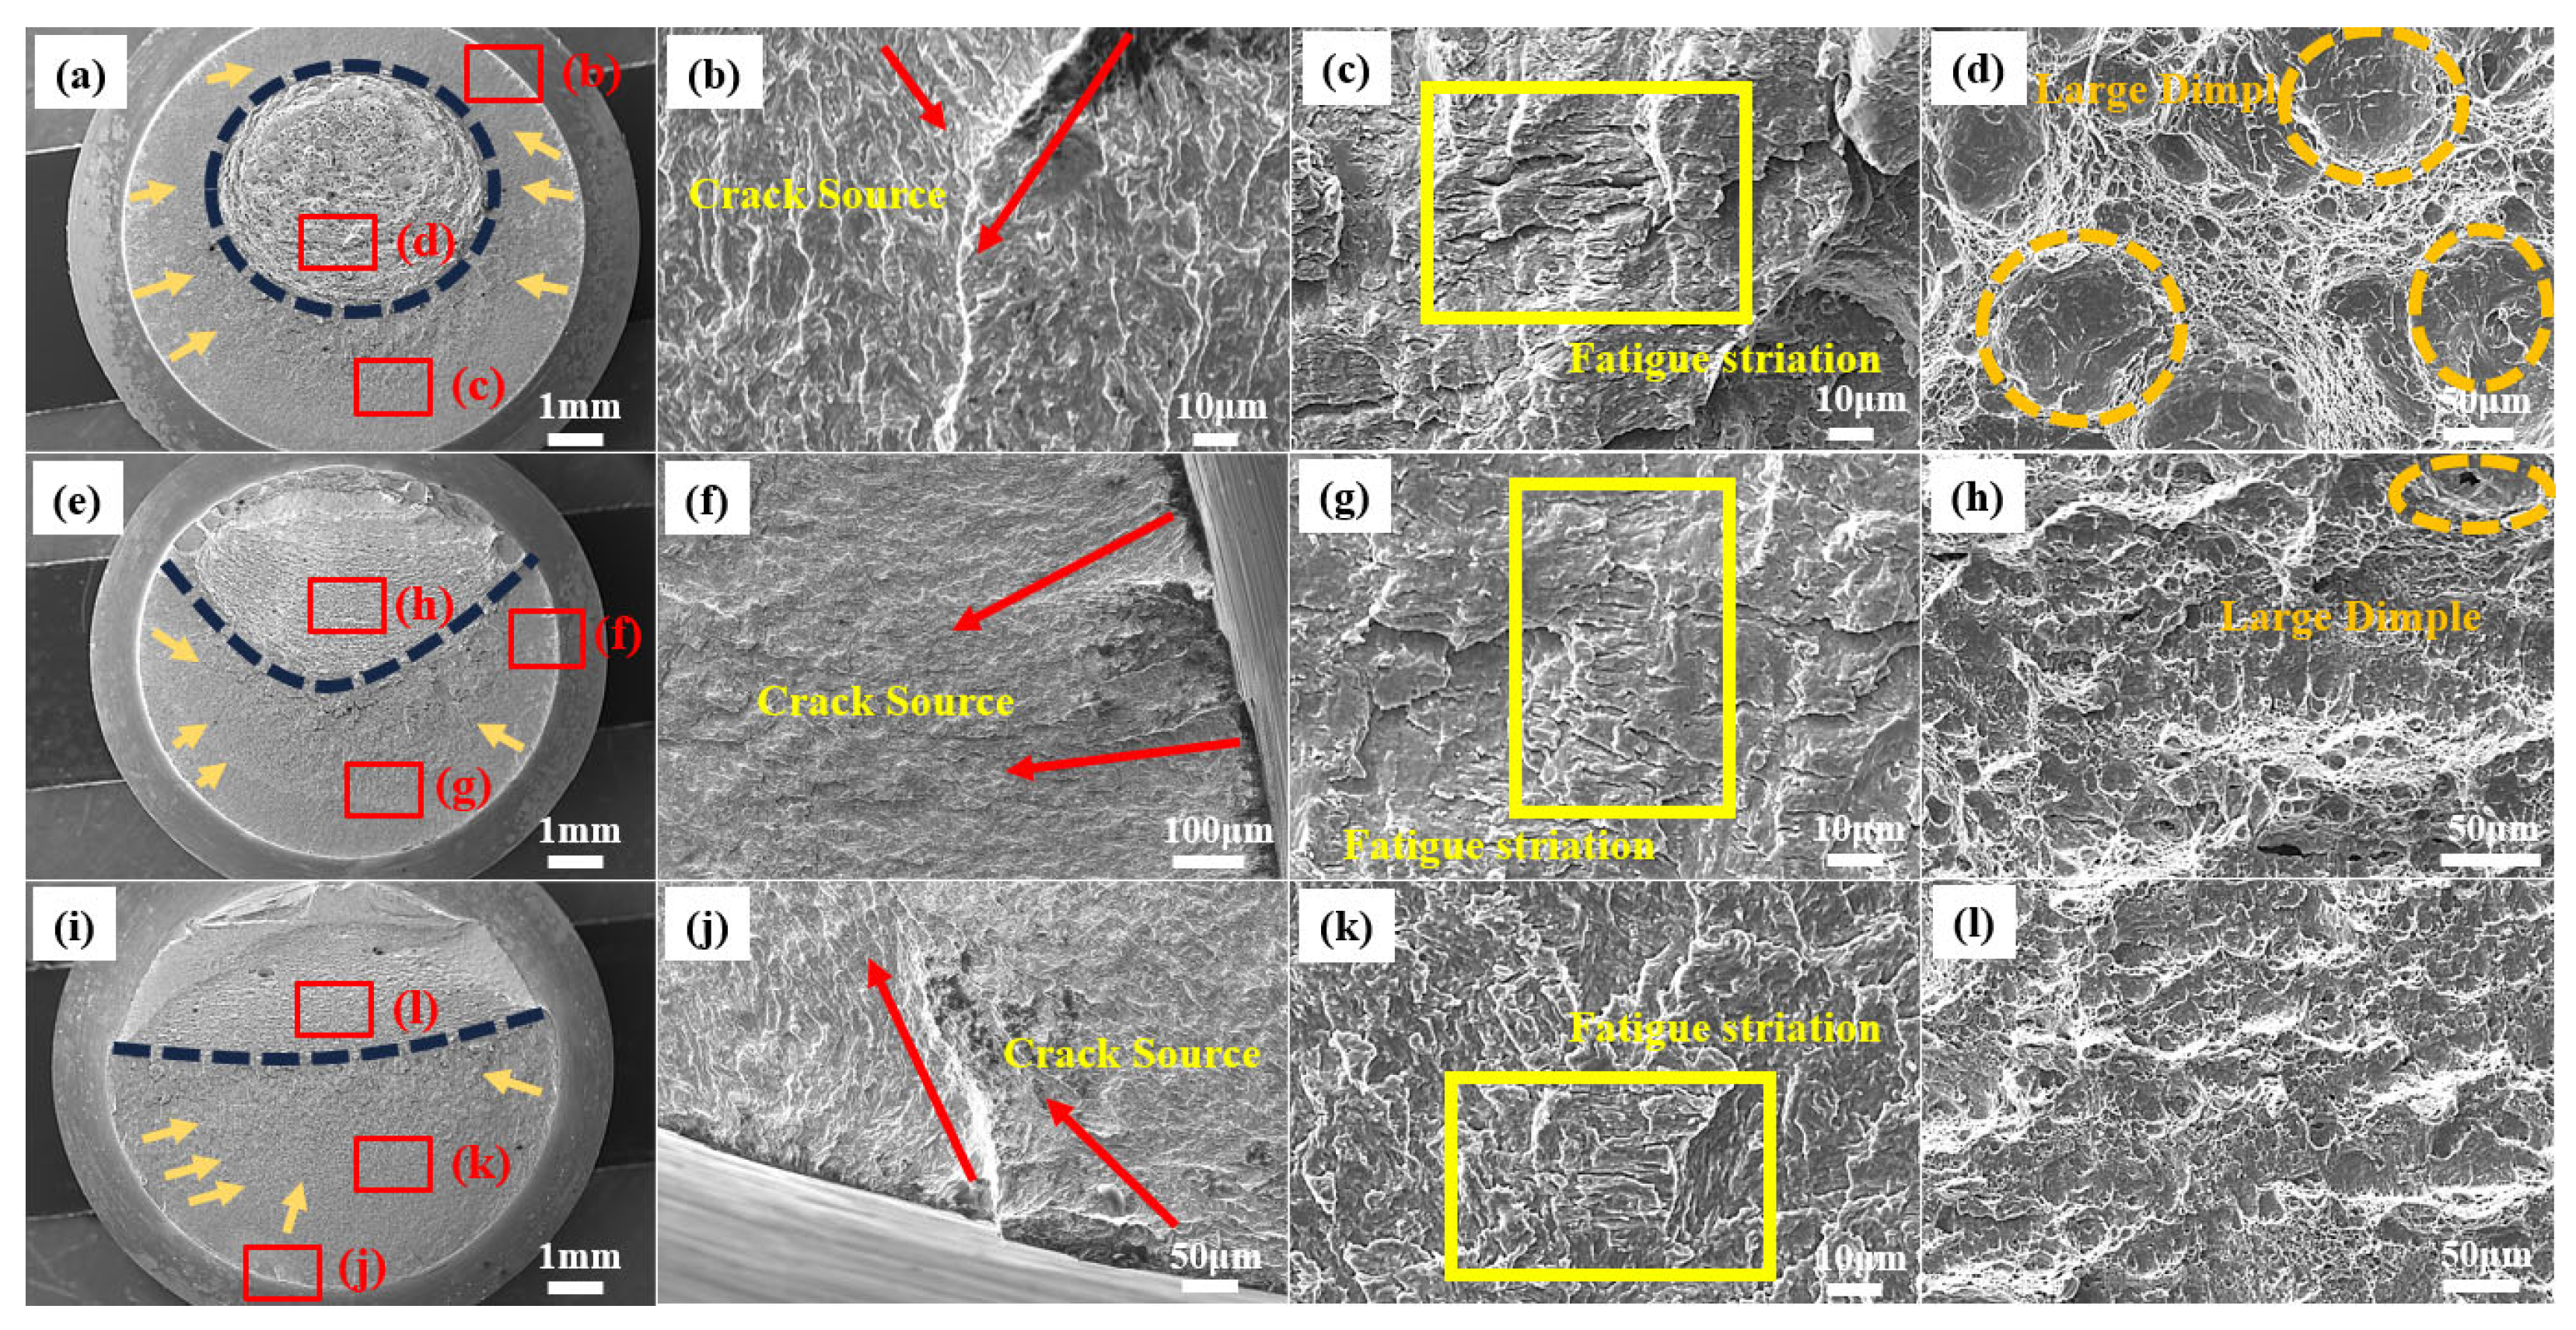
Due to the presence of notch, under cyclic loading, the stress concentration occurs at the notch root, leading to high surface stresses at the notch root, which are sustained by the subsurface material. This accelerates fatigue crack initiation, facilitating stress to reach critical threshold. Consequently, the notch is a decisive factor in crack initiation. Once the crack length exceeds the material’s critical state (fracture toughness), the specimen becomes unstable, and the remaining cross-section cannot support the cyclic load, resulting in rapid fracture. SEM analysis was conducted to reveal the fatigue fracture morphology, which is essential for assessing fracture quality. The overall and locally magnified views of the fracture surface are presented in Figure 14. The key fracture regions, including the crack initiation zone (FS), stable crack propagation zone (CP), and the rapid fracture zone (FF) were distinctly identified.
As shown in Figure 14, the fracture surfaces of notched specimens with different notch root radius 8 (r = 1.0, r = 0.4, r = 0.15 mm) exhibit distinct characteristics. For the specimen with the smallest notch radius 8 (r = 0.15 mm), a higher stress concentration leads to earlier crack initiation and a shorter crack propagation path. Due to the high local stress gradient, the crack propagates more rapidly, resulting in relatively stable and large crack growth increments per cycle. Consequently, the fatigue striations observed in the CP are denser compared to those specimens with larger notch radius. Meanwhile, the FF in the 8 (r = 0.15 mm) specimen is located near the center of the fracture surface and displays larger dimples, indicating more severe plastic deformation and a rapid overload fracture process. This observation highlights the interplay between notch geometry, stress ratio, and local crack-driving force in determining the fatigue fracture behavior.

4.4. Finite Element Result

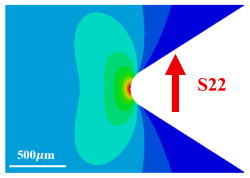
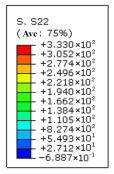
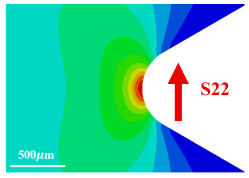
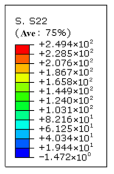
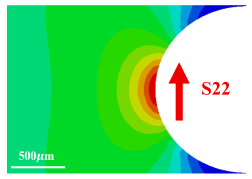
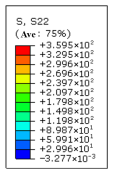
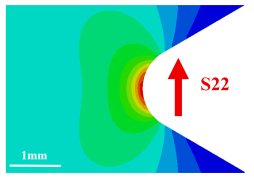
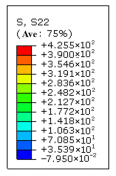
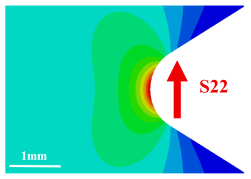
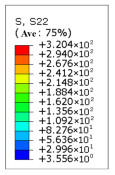
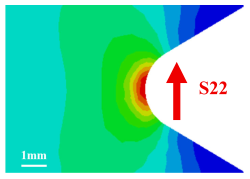
The finite element analysis software ABAQUS was utilized to model and analyze the notched specimens, enabling the extraction of the maximum local elastic stress, the resulting elastic stress concentration factor (SCF) and highly stressed volume (HSV) values are listed in Table 3, Table 4 and Table 5. Among them, the arrows and S22 in the text represent the maximum principal stress in the y-axis direction. The HSV was calculated using the ABAQUS and AutoCAD (2019 version) method proposed in the research. The calculation process is summarized as follows:
  • Perform axisymmetric finite element analysis on notched specimens in ABAQUS to extract the maximum stress;
  • Second item; extract the cross-sectional area ( A r )of the high-stress region;
  • Import the cross-sectional area after obtaining high stress into AutoCAD;
  • Perform axisymmetric rotation and calculate volume ( V r ).
As detailed in Table 4, specimens with different notch geometries exhibited smaller HSV values as SCF values increased. This is attributed to the relatively smaller highly stressed area at the stress concentration region. For V-shaped notches with high SCF values, the corresponding HSV was notably smaller. SCF calculations were conducted under a uniform cross-sectional nominal stress of 120 MPa, with HSV defined as a region encompassing 80%~100% of the maximum local stress. The stress distribution across different cross-sections was obtained by selecting various paths beneath the notches, with path selection based on the direction of the steepest stress gradient.

5. Model Validation and Comparison

This section applies the proposed model to analyze the notch fatigue life of 26Cr2Ni4MoV steel, comparing the predicted results with experimental notch fatigue test data to validate the effectiveness of the Kt-V-L model. Cyclic tensile–tensile loading tests were conducted on pre-notched 26Cr2Ni4MoV steel under a stress ratio of R = 0.425 at room temperature.
The critical distance was calculated using Equations (1) and (2), and the results are summarized in Table 6. According to Taylor’s theory of critical distances (TCD), the failure criterion varies depending on the applied method. In the point method (PM), failure occurs when the local stress at L/2 from the crack tip equals the fatigue limit σ 0 of smooth specimens. In contrast, the line method (LM) defines failure as the condition where the average stress within a distance of 2 L line in the notch area, serving as the equivalent stress σ e f f , equals to σ 0 . Crack propagation leads to failure, whereas non-propagation indicates no fatigue failure. Notably, the fatigue limit of smooth specimens must be at the same stress ratio (R = 0.425) as used in this study. The maximum stress corresponding to this analysis was 941.0 MPa.
As shown in Table 5, under identical notch size conditions, a decrease in stress amplitude leads to a reduction in the critical distance. The finite element (FE) analysis results of the highly stressed volume (HSV) are presented in terms of the 80% volume ratio. Under the same stress amplitude, specimens with different notch geometries exhibit varying HSV value, and a larger HSV corresponds to a shorter critical distance and a longer fatigue life, thereby confirming the validity of the Kt-V-L model. To further validate the proposed model, experimental data from previous reference on En3B and TC4 alloys were adopted [27,28]. The geometries of the corresponding specimens are shown in Figure 7 and Figure 8.
The PM/LM method of the Kt-V-L model was established based on the stress concentration factor for different notch types and sizes, alongside the HSV and critical distance calculations of various specimens. To determine the model parameters, MATLAB (2022 version) was employed to solve the overdetermined equation system. The parameter’s derivation and detailed code for programming are provided in Equations (S1)–(S18) of the Supplementary Materials.
The fitting equations are
  • PM (26Cr2Ni4MoV):
    K t 0.1790 · V 0.4148 · L = 0.4109 · N f 0.0624
  • LM (26Cr2Ni4MoV):
    K t 0.2023 · V 0.3443 · L = 0.4958 · N f 0.1617
This article uses linear regression method to estimate the characteristic fatigue life ( N * ) and fatigue life distribution index (φ) of the Weibull distribution. After determining the effective stress, the characteristic life N * can be obtained. The parameters a 2 / b 2 and φ are derived from the fatigue data of smooth specimens.
Based on the fatigue life of smooth specimens, linear regression method was used to fit the characteristic fatigue life and its distribution parameter under different stress levels. Among them, the distribution index φ was determined by averaging the fatigue life distribution indices across different stress levels. Subsequently, based on a series of characteristic fatigue lives and corresponding fitting parameters at each stress level, Equation (12) was fitted using the least squares method. The fitting formula for 26Cr2Ni4MoV steel is presented in Equation (24), with the parameters summarized in Table 6.
σ e f f = 1341.219 · N * 0.0229
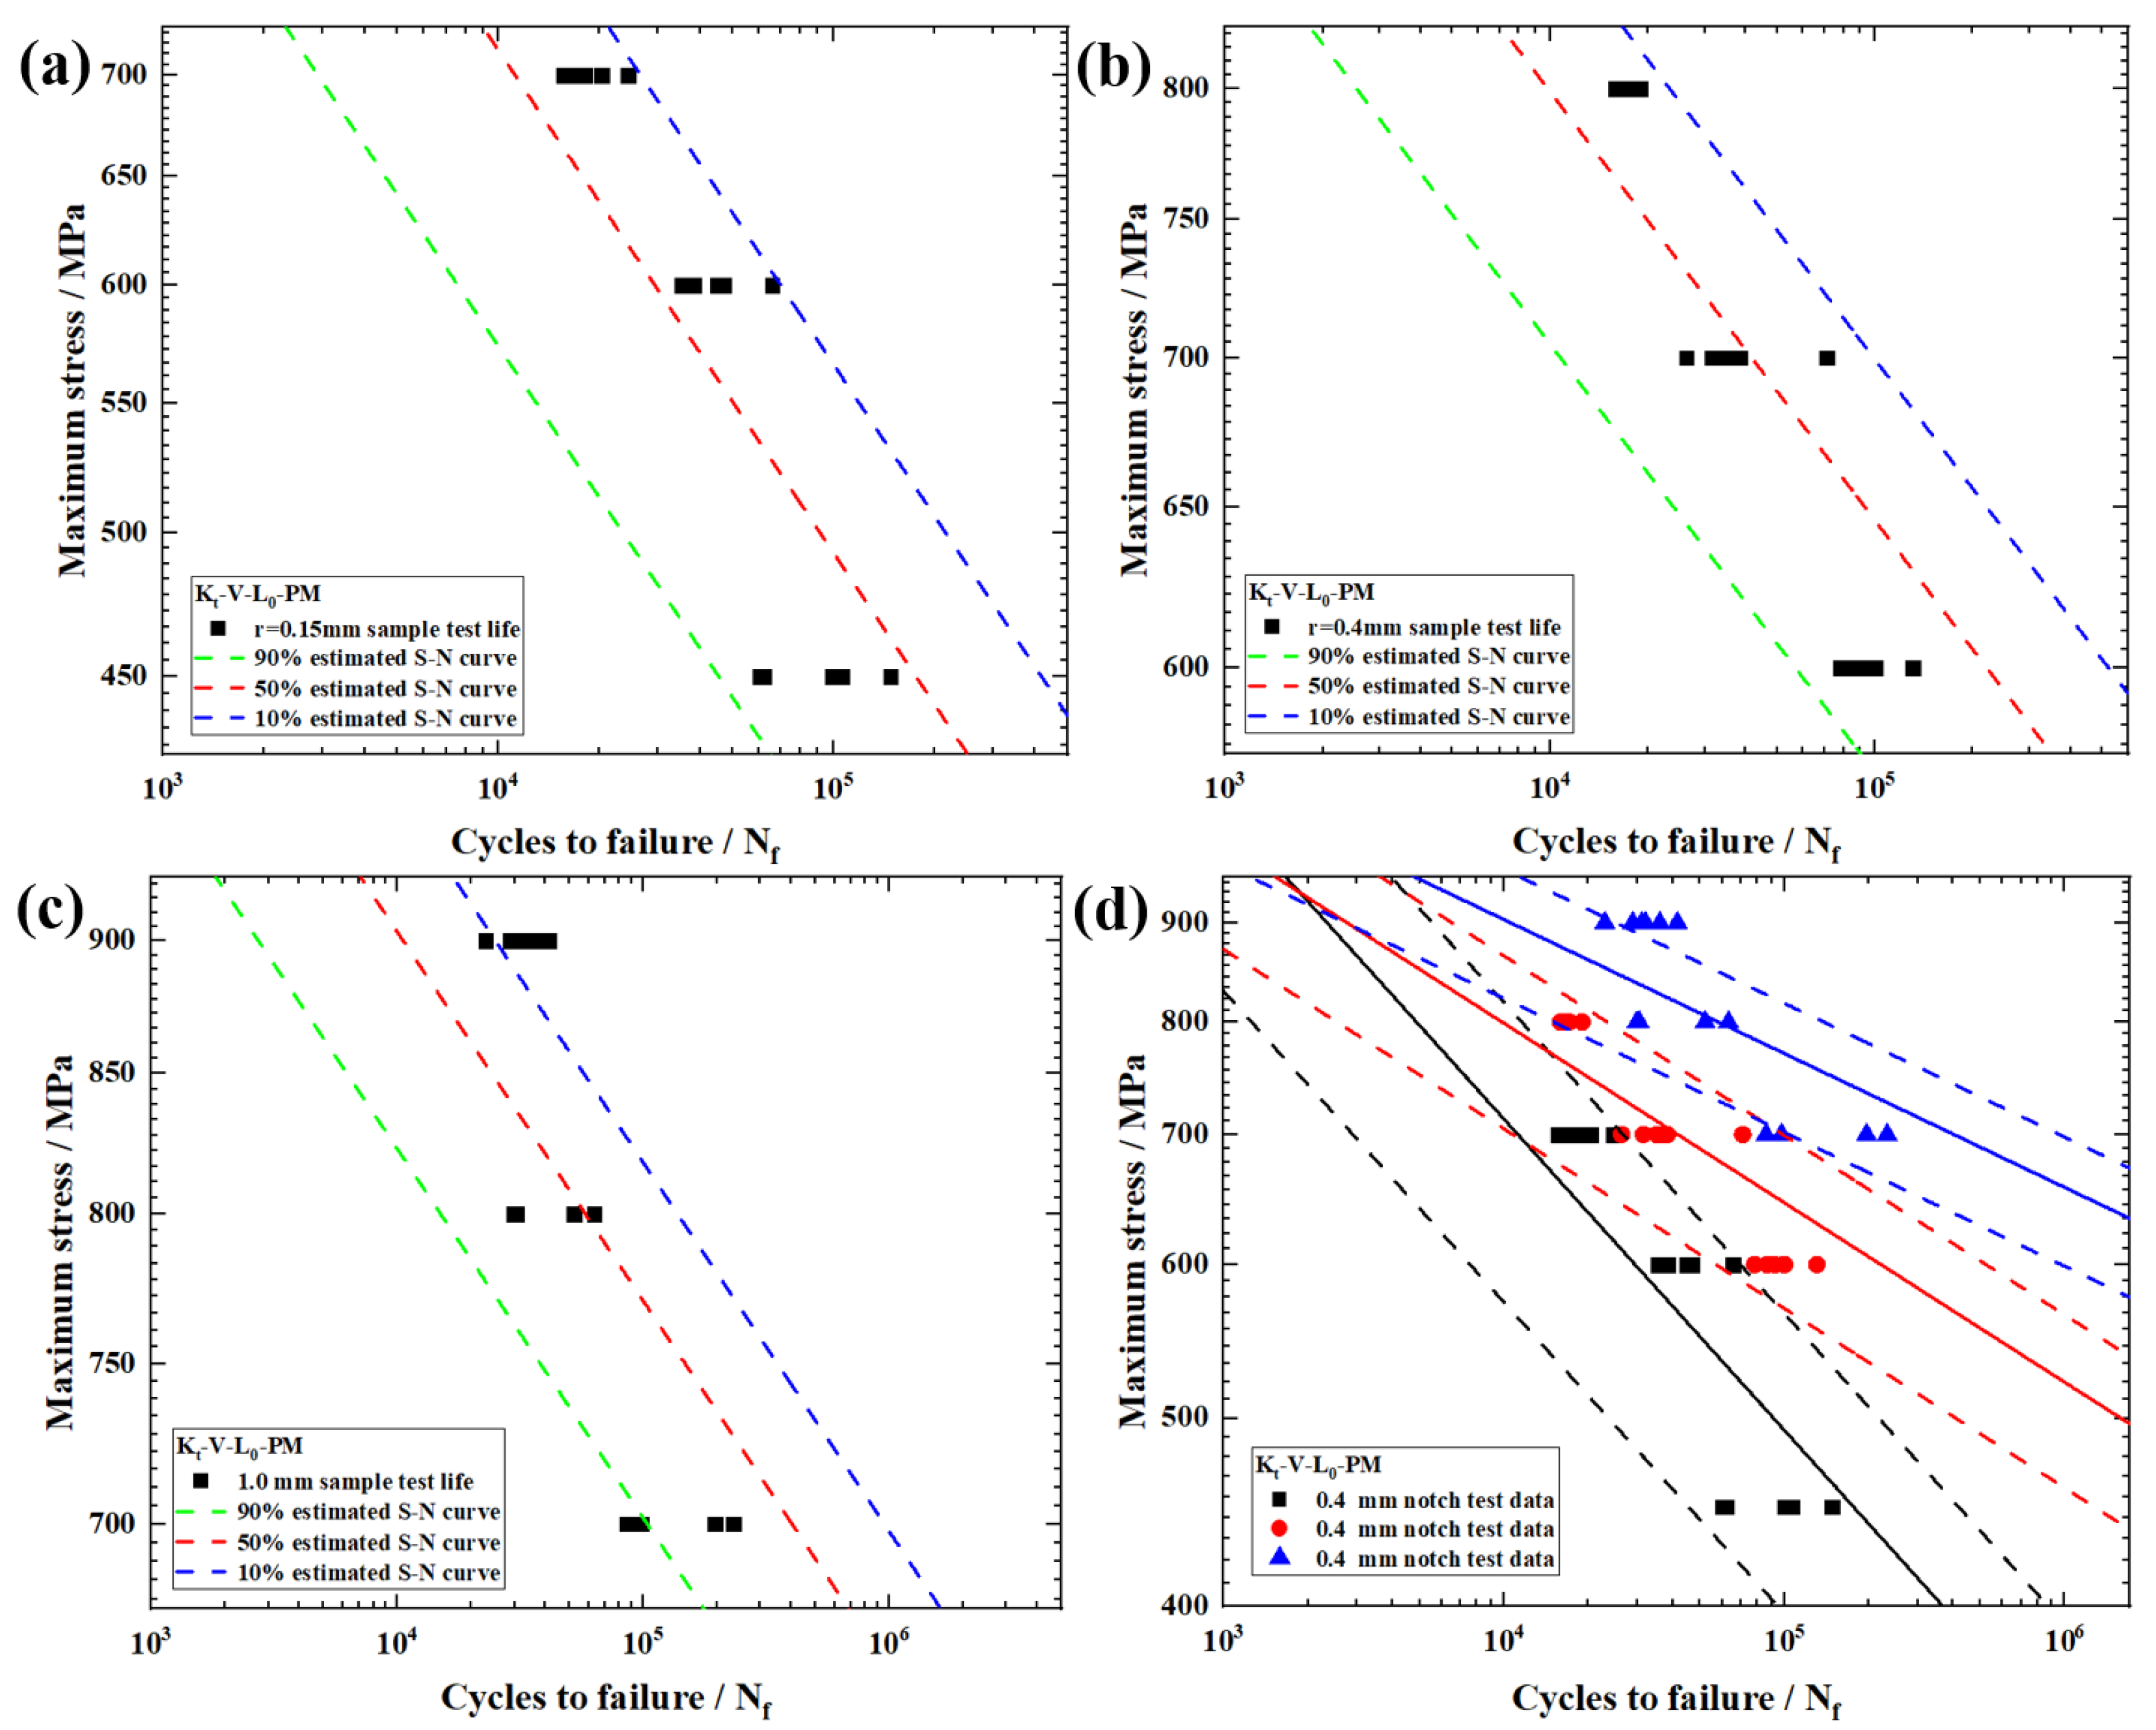
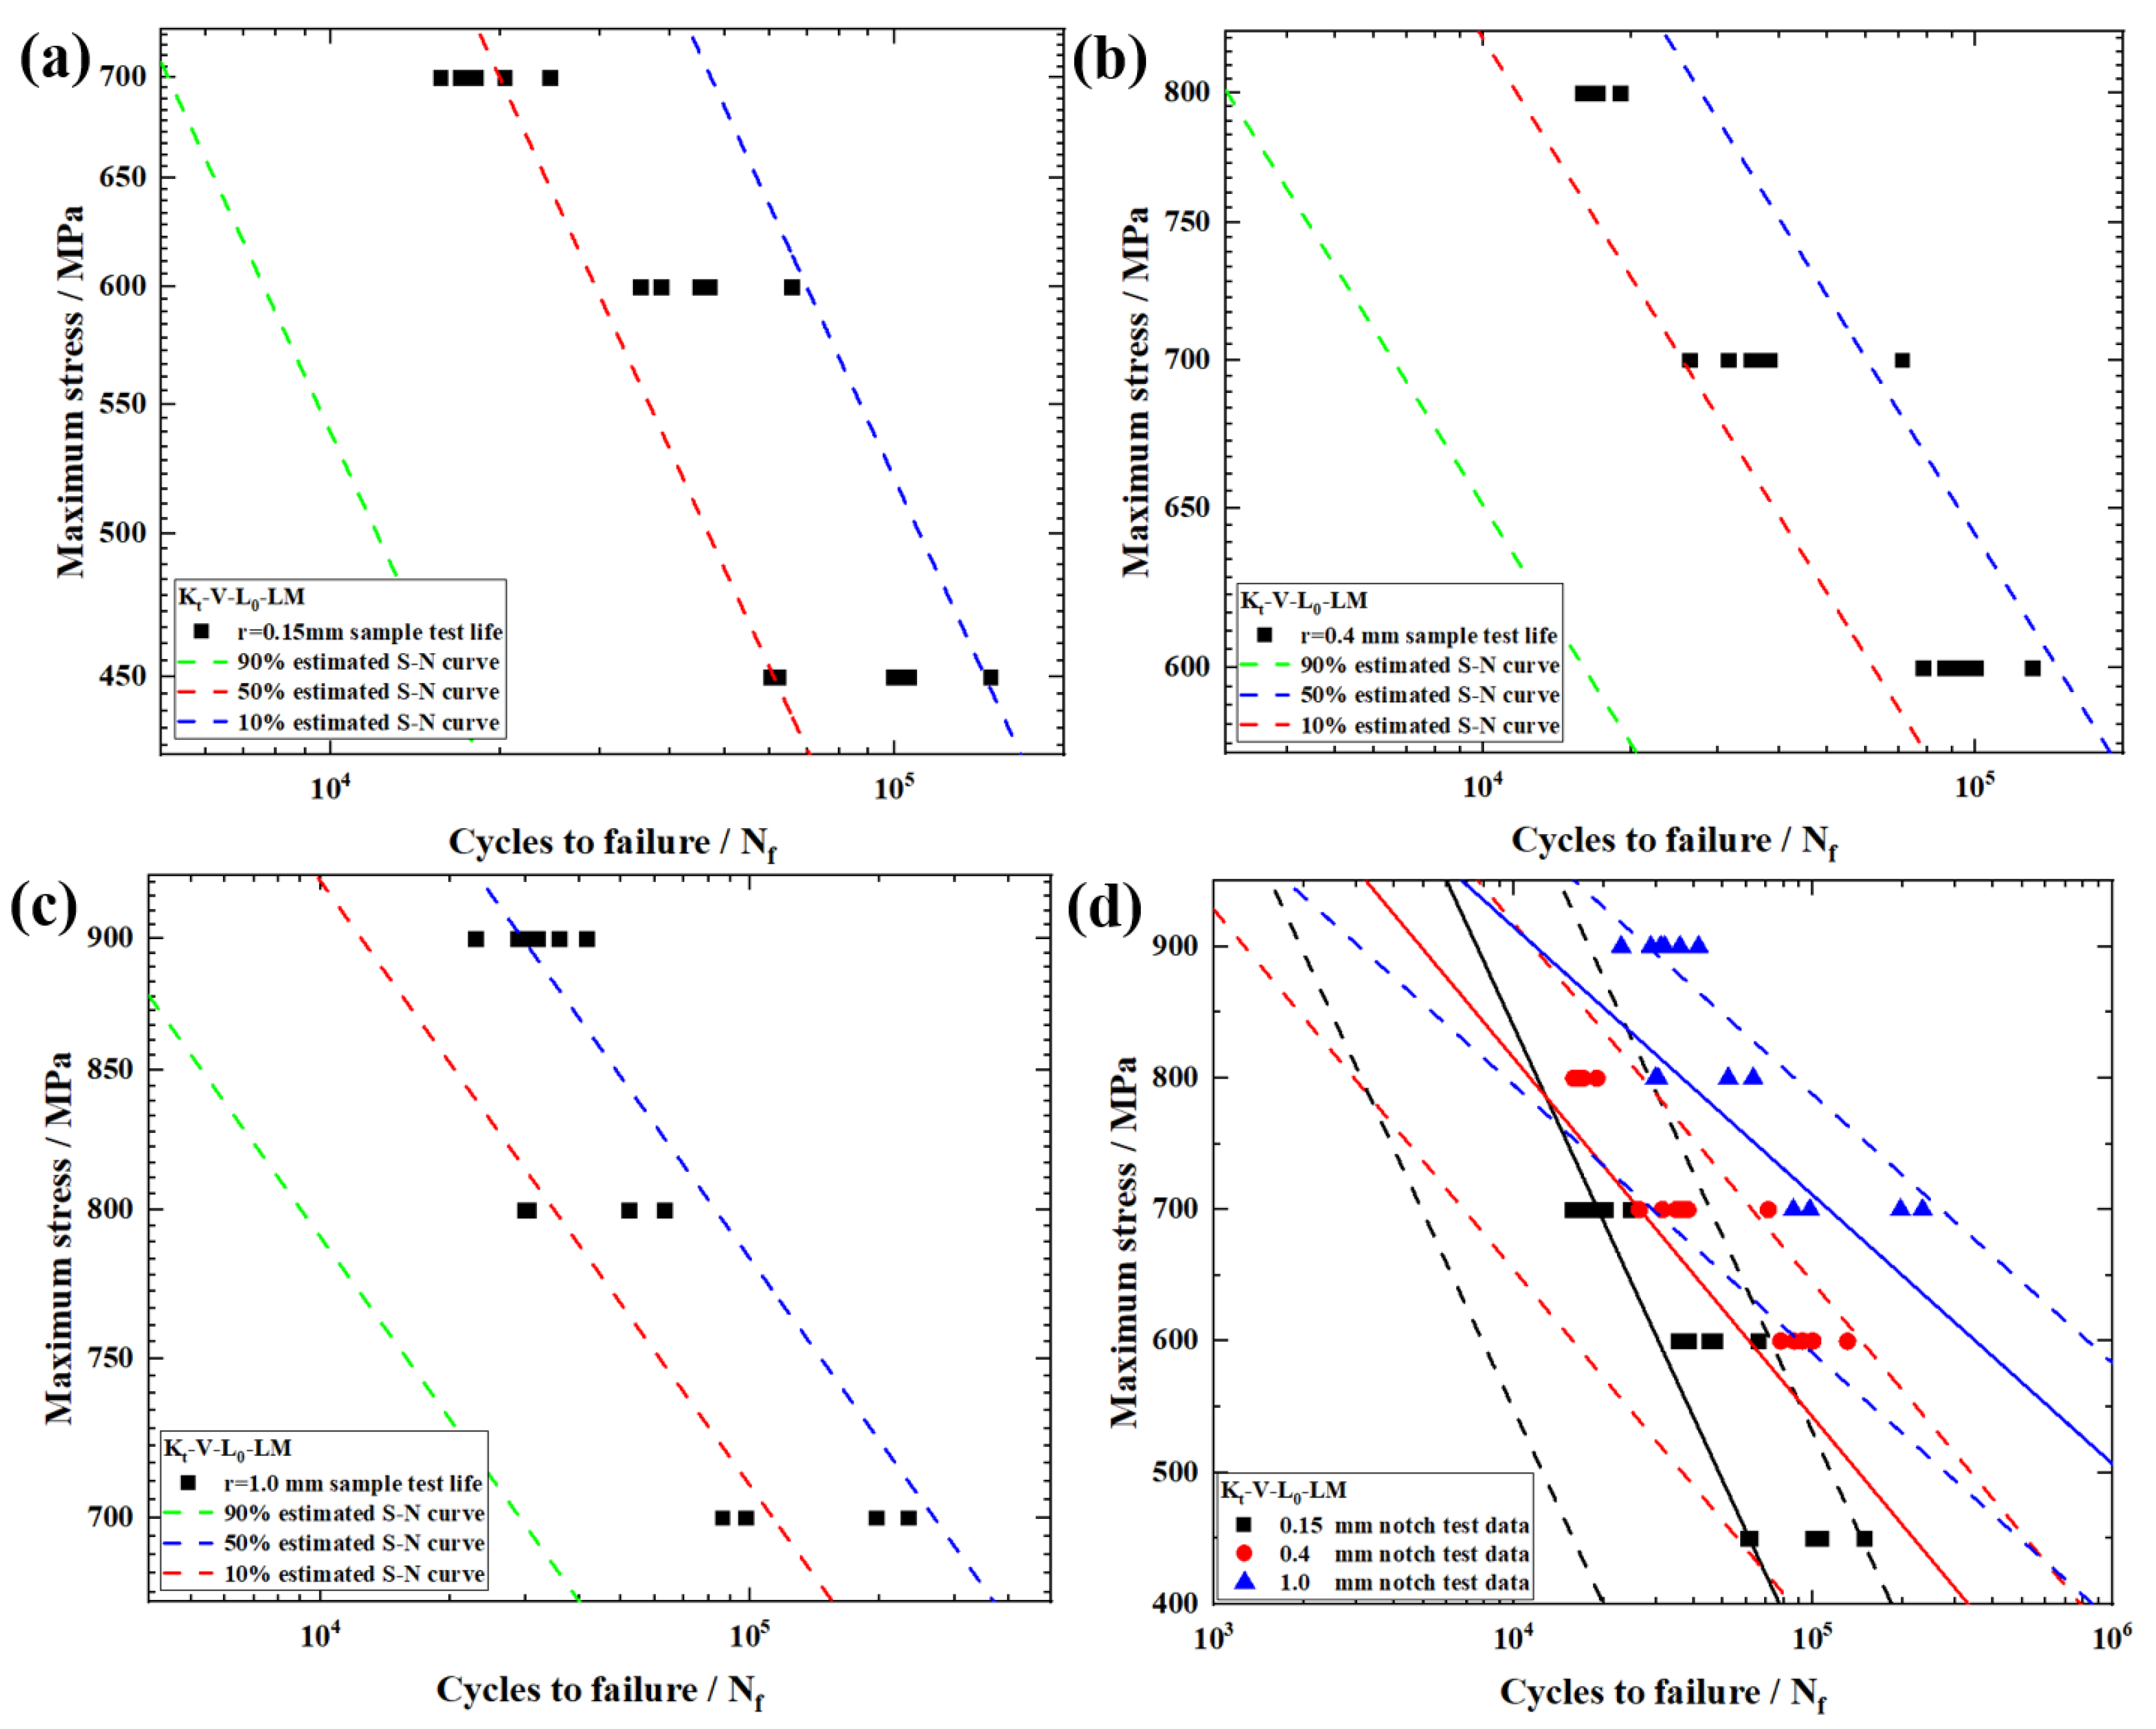
Using the probabilistic fatigue life prediction model, the failure probabilities ( P f ) in the Kt-V-L model were set to 10%, 50%, and 90%, corresponding to survival probabilities of 90%, 50%, and 10%. Respectively, a set of parallel curve clusters of PM/LM P-S-N with predicted survival rates of 90%, 50%, and 10% was generated, as shown in Figure 15 and Figure 16.
Analysis of the predicted P-S-N curves indicates that the experimental fatigue life predominantly falls within the scatter bands under three different values of the survival probability, demonstrating the effectiveness of the Kt-V-L model. The estimated P-S-N curves exhibit strong agreement with experimental data of notched specimens. Similarly, the critical distance of large-scale specimens was determined using both the point method and the line method, as summarized in Table 7.
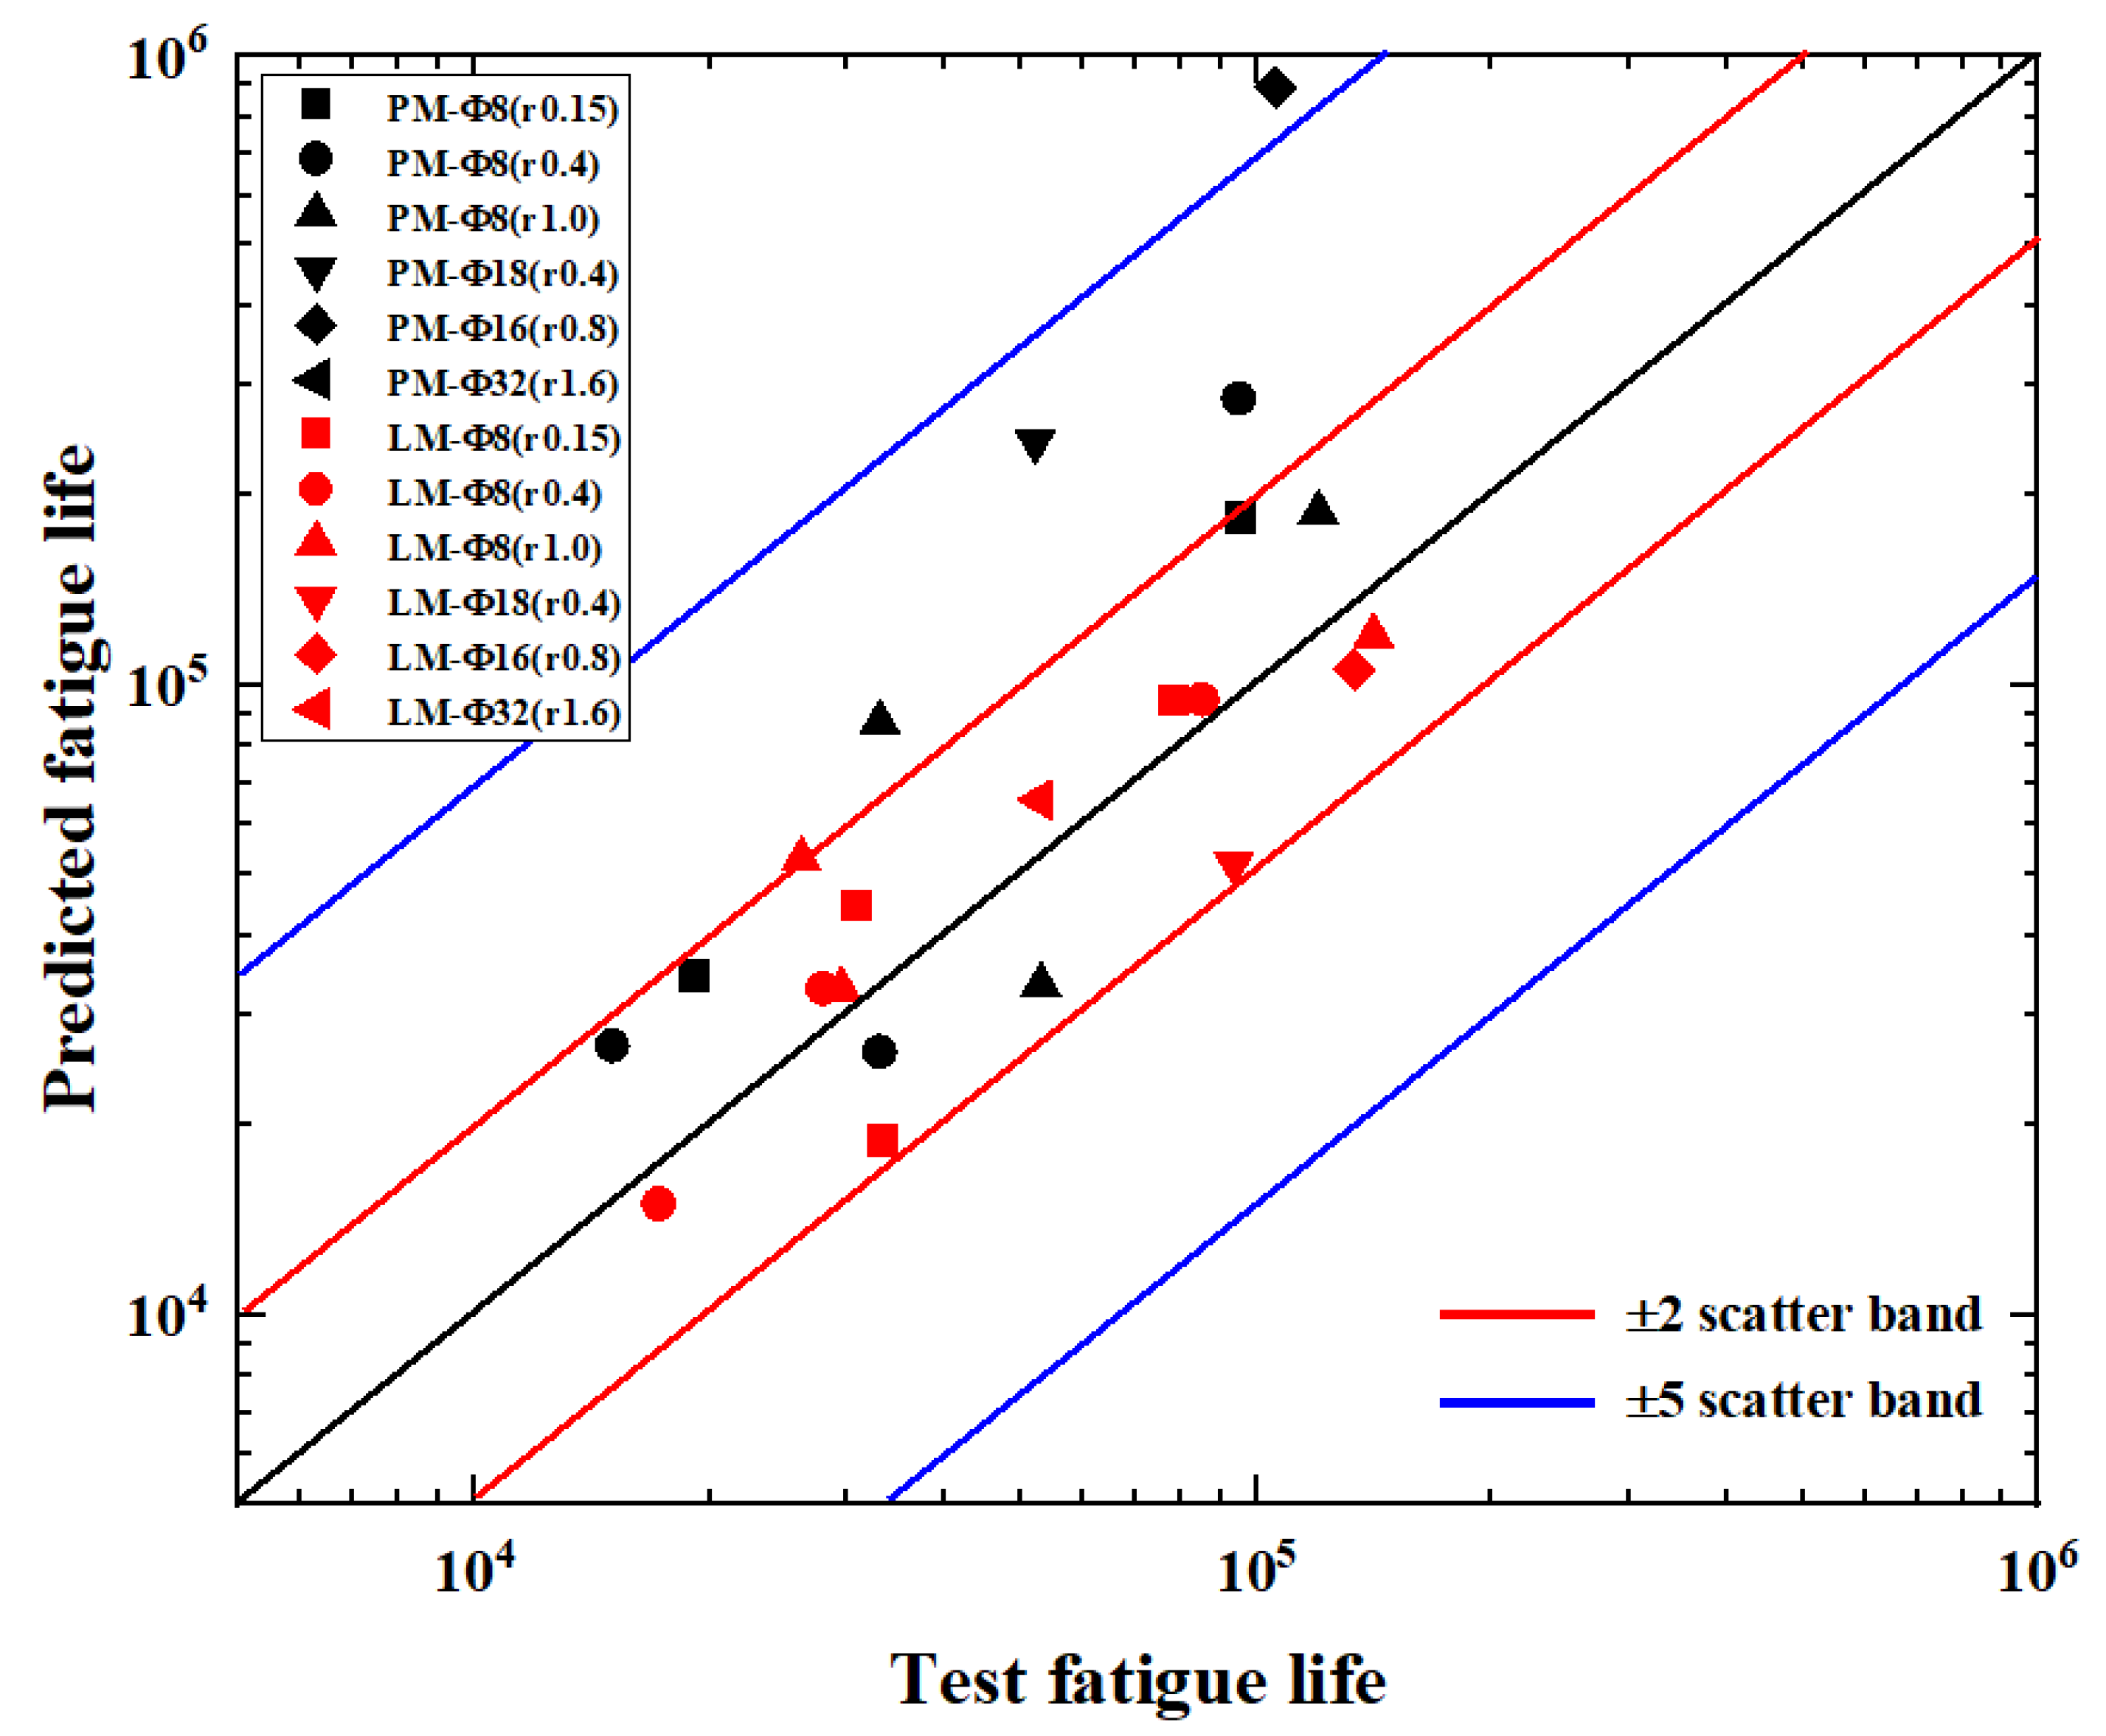
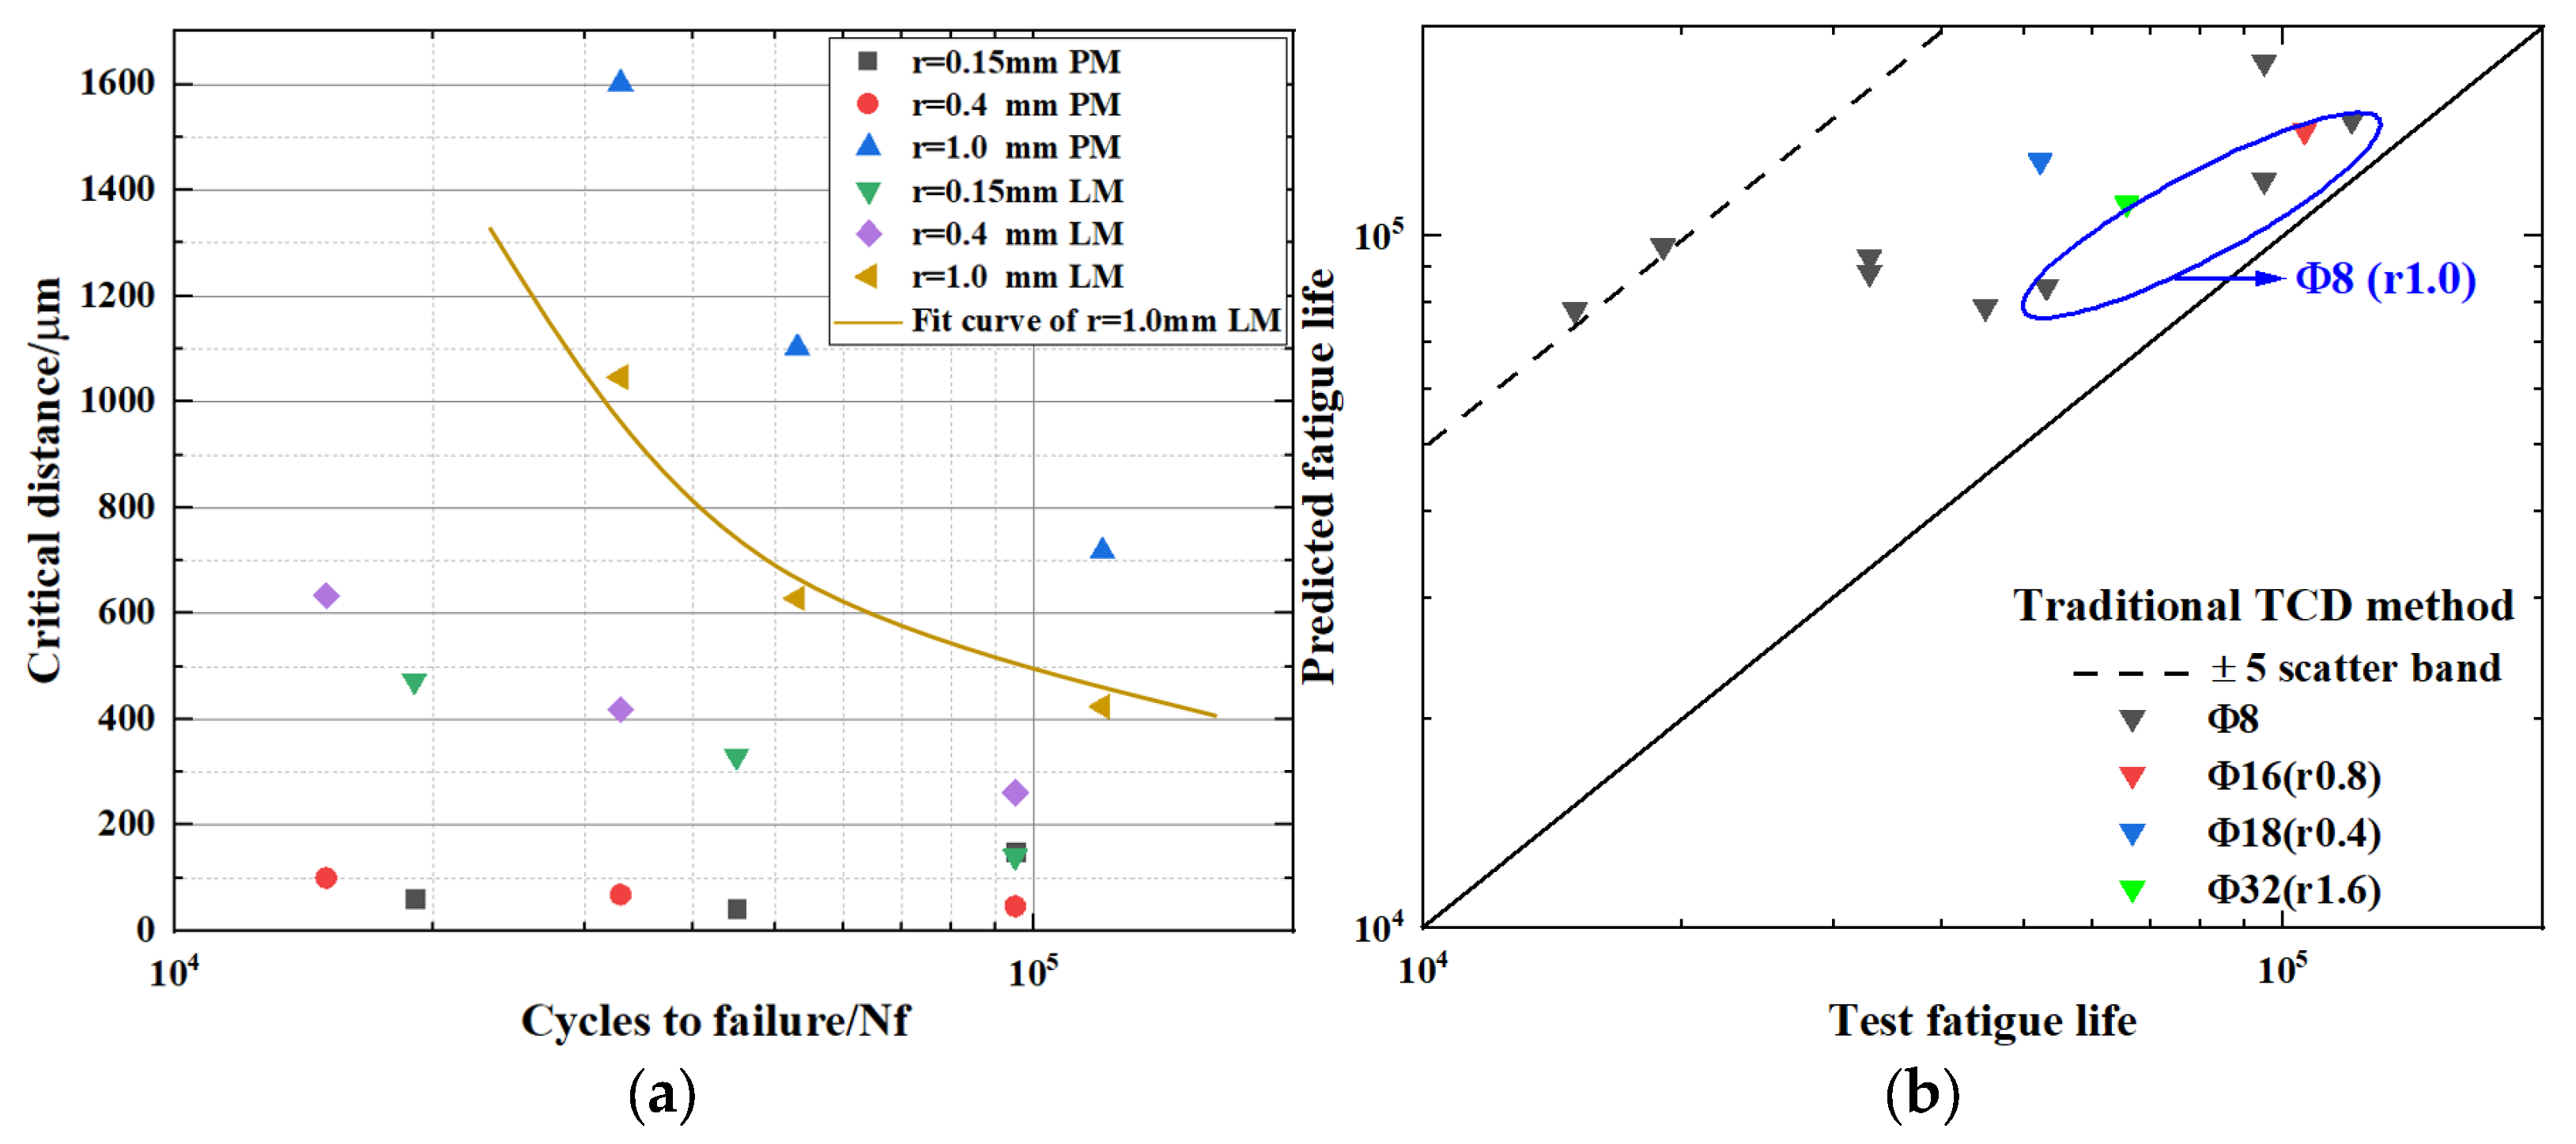
Figure 17 illustrates the comparison between the predicted and experimentally measured fatigue lives of notched specimens with various geometries, based on the critical distance theory using both the point method (Kt-V-L-PM) and the line method (Kt-V-L-LM). Because the fatigue tests involved specimens of different geometrical sizes, the experimental fatigue lives within each size category exhibited noticeable variation among repeated tests. To improve the clarity of data visualization and avoid excessive overlap of individual points, the experimental fatigue lives plotted in Figure 17 represent the mean fatigue life of each specimen size group, rather than individual replicate values. Consequently, each size category corresponds to a single horizontal coordinate (mean experimental life), against which predicted fatigue life values from the PM and LM models are plotted. Overall, most of the predicted data points fall within the ±2 scatter band, indicating good predictive capability of the model. For small notched specimens ( 8), both PM and LM yield accurate predictions. As the notch size increases, such as in 18 (r = 0.4 mm), 16 (r = 0.8 mm), and 32 (r = 1.6 mm), the prediction results of the point method become increasingly scattered, with several data points falling outside the ±5 scatter band. In contrast, the line method produces consistent and reliable predictions across all specimen sizes. This suggests that the line method, which accounts for the averaged stress over a finite distance, is more capable of capturing the effects of stress gradients in large or severely notched components, making it more suitable for fatigue life prediction in practical engineering applications.
Based on the research of SUSMEL et al. [58], the relationship between critical distance and fatigue life was first established using experimental data from three different types of notched specimens (Equation (25)). Specifically, in this study, r = 1.0 mm LM v-notch specimens were utilized to establish an expression for the critical distance of 26Cr2Ni4MoV steel. The fitted curve of the experimental results together with the model prediction results are shown in Figure 18. The obtained results are as follows:
L = 26.64 · N f 0.516
From Figure 18, it is evident that only the v-notch sample with r = 1.0 mm exhibited superior prediction accuracy, whereas specimens of other sizes showed larger prediction deviations. This prediction discrepancy is attributed to the increasing influence of the size effect as the notch root radius decreases.
Additionally, fatigue life predictions were extended to En3B carbon steel [27] and TC4 alloy [28] at room temperature with a stress ratio of R = −1. The mechanical properties and stress concentration factors for these materials are presented in Table 8 and Table 9. Their probabilistic fatigue lives were analyzed using the same methodology as the proposed Kt-V-L model.
For the PM of materials TC4 and En3B, the fitting equation of the new model can be obtained as follows in Equations (26)–(29):
  • En3B PM:
    K t 0.130 · V 0.454 · L = 86.098 · N f 0.409
  • En3B LM:
    K t 0.119 · V 0.414 · L = 40.821 · N f 0.430
  • TC4 PM:
    K t 0.243 · V 0.627 · L = 93.411 · N f 0.512
  • TC4 LM:
    K t 0.118 · V 0.325 · L = 50.247 · N f 0.539
Similarly, the proposed prediction equation was applied to TC4 and En3B materials to assess the adaptability of the Kt-V-L model. The parameters a 2 , b 2 , and the fatigue life distribution exponent ( φ ) were determined based on fatigue data obtained from smooth specimens of En3B and TC4 material.
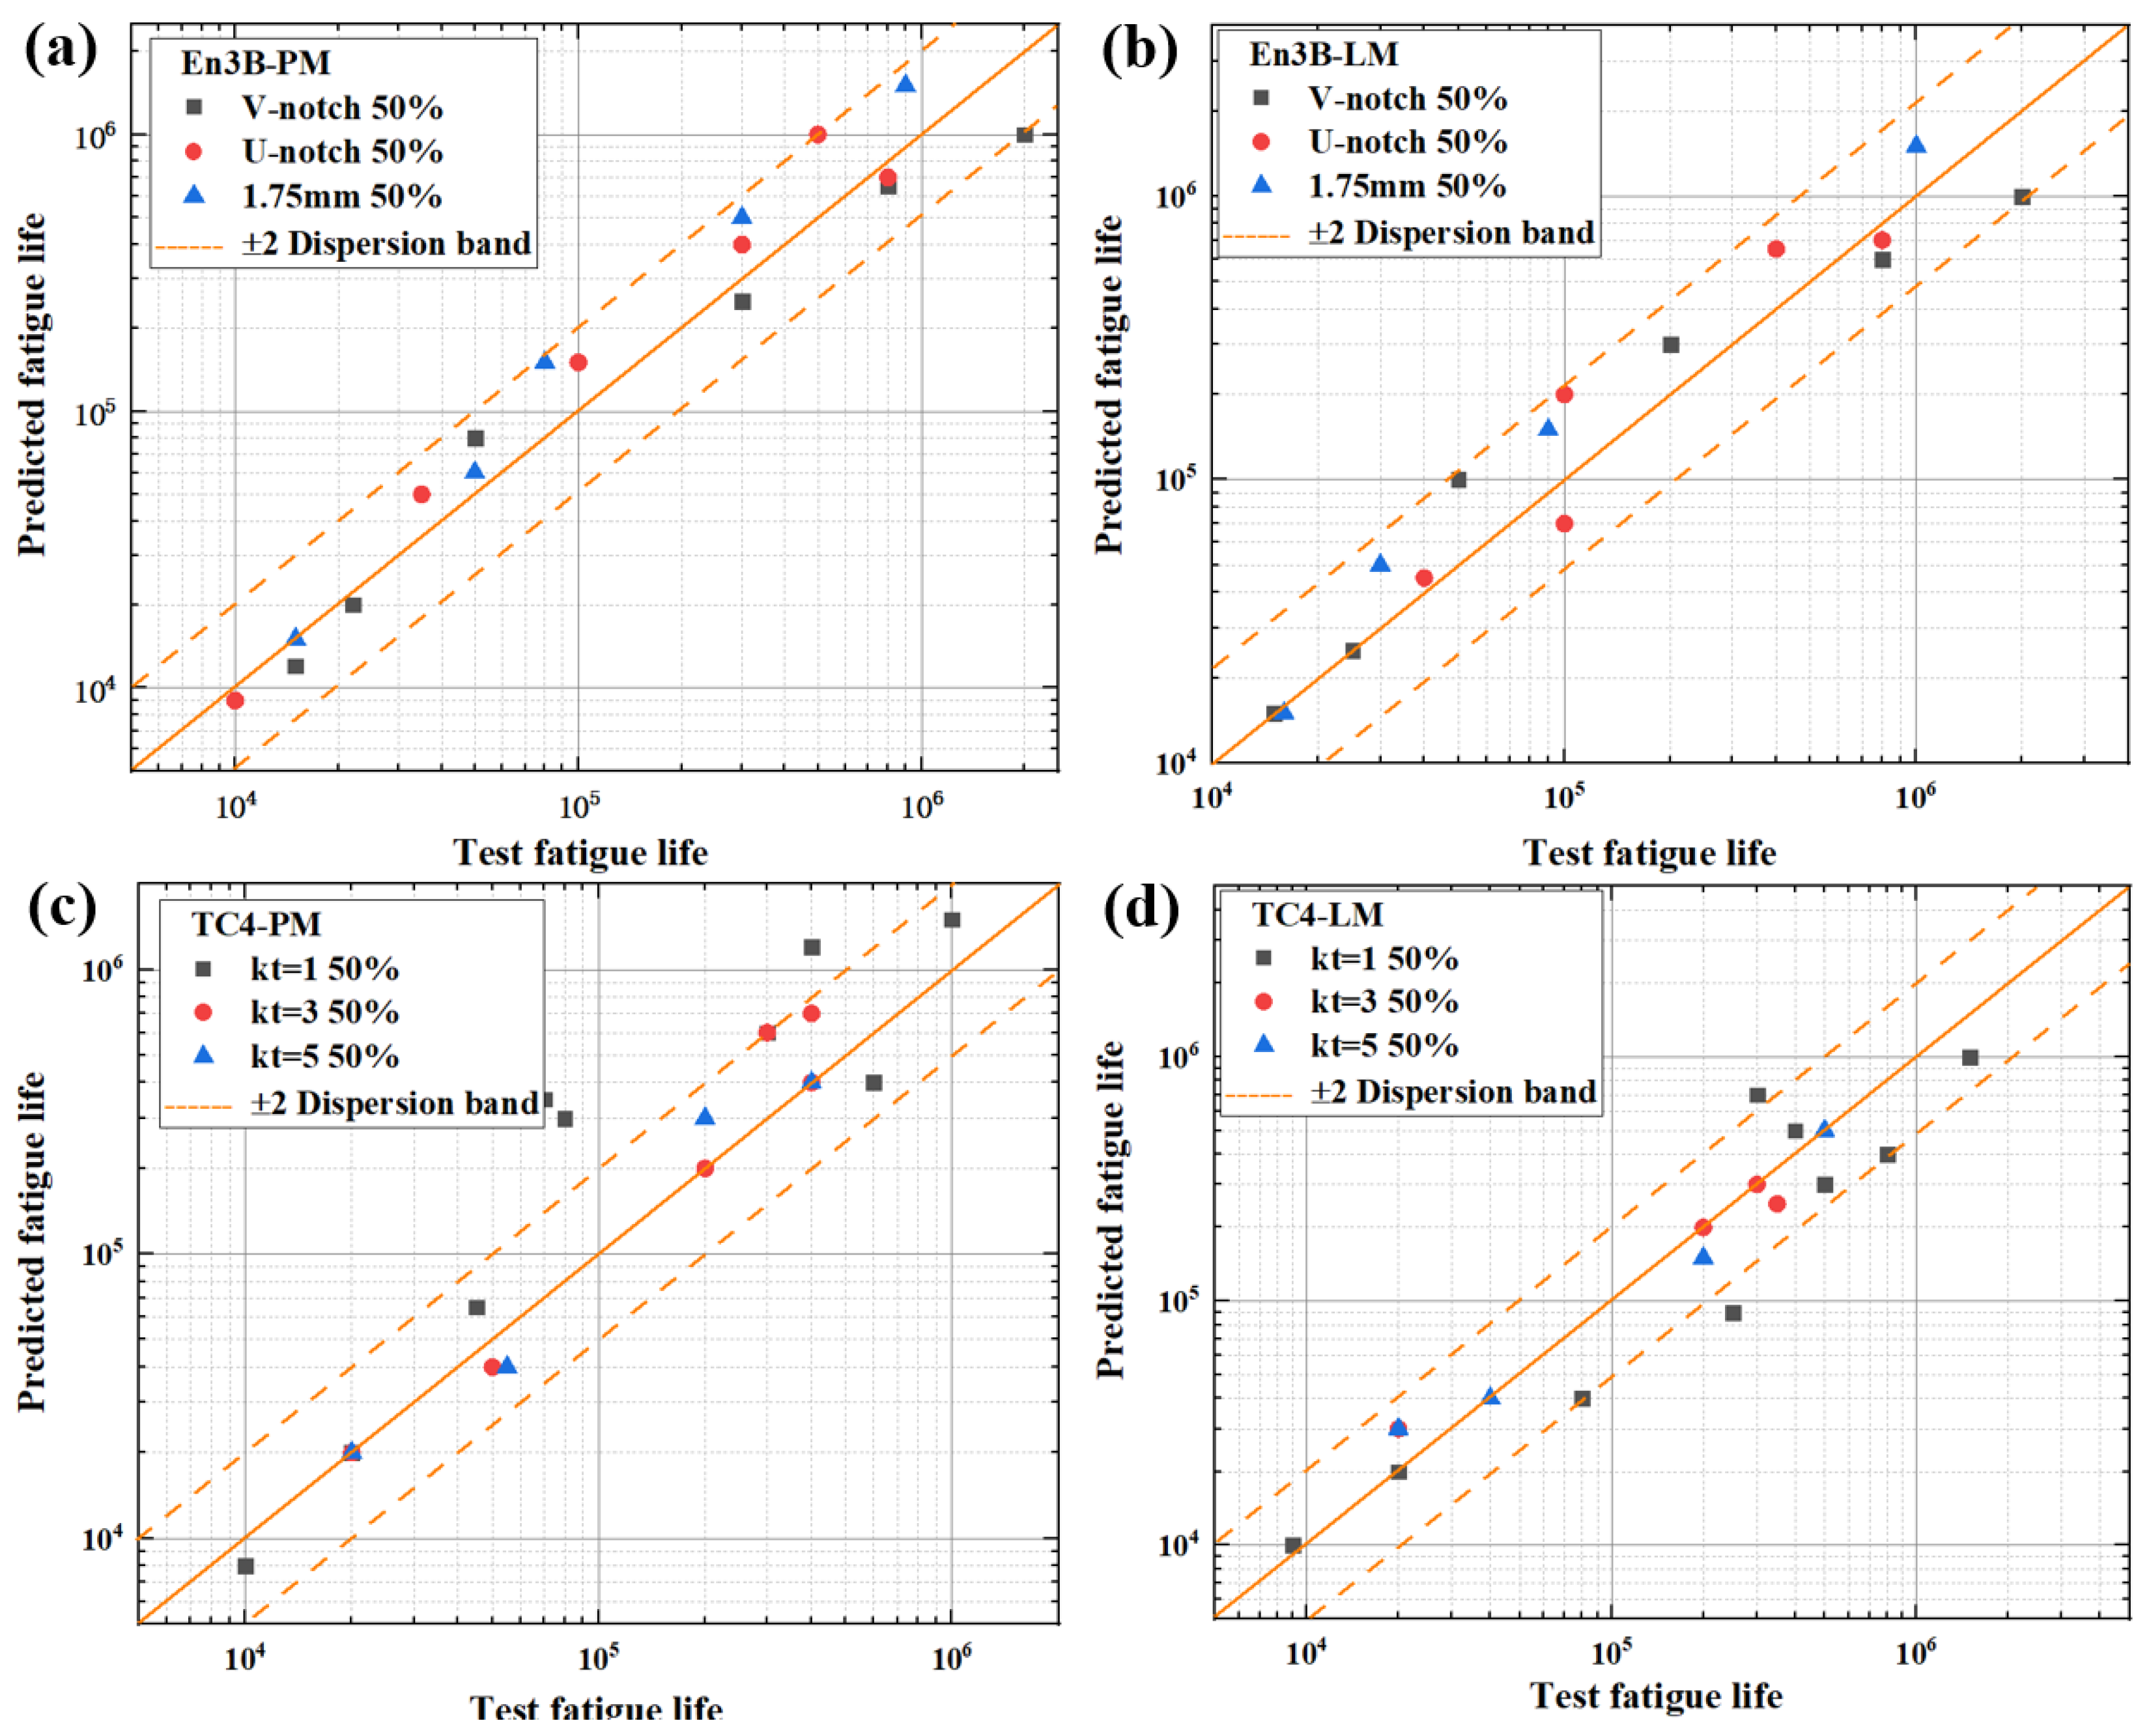
The characteristic fatigue life and distribution parameters under different stress levels were initially established through linear regression analysis of experimental fatigue life data from smooth specimens. Subsequently, the fatigue life distribution exponent ( φ ) was then determined by averaging the distribution indices across multiple stress levels. A series of characteristic fatigue life values corresponding to various stress levels, along with the fitted parameters, are presented in Table 10. The results are illustrated in Figure 19.
From Figure 19, it was revealed that at a 50% survival probability in the proposed model exhibits varying prediction accuracies for TC4 material with Kt equals to 3 and 5, and the model demonstrates enhanced precision, with predictions confined within a twice dispersion band. Conversely, for Kt = 1, the predictions were more conservative, with the maximum prediction error exceeding the twice dispersion band. For En3B carbon steel, the model provided accurate predictions across all three notch types, with fatigue life estimates remaining within the twice dispersion band. This indicates that the proposed model demonstrates good robustness and accuracy.

6. Conclusions

This study established the Kt-V-L probabilistic fatigue analysis model by investigating the notch fatigue when considering both notch and size effects. By incorporating the Weibull statistical model and the critical distance theory, the proposed model effectively describes fatigue probability dispersion and the influence of notch and size effects on critical distance. The model was validated using experimental data from three different materials with various notch types, leading to the following conclusions:
A probabilistic fatigue life prediction model was developed by integrating the Weibull statistical approach with the theory of critical distances (TCD) and highly stressed volume (HSV), enabling simultaneous consideration of notch and size effects. For 26Cr2Ni4MoV notched specimens, the line method (Kt-V-L-LM) provided more accurate and consistent predictions than the point method (Kt-V-L-PM), especially for large or sharp notches. The TC4 and En3B experimental data fell within the predicted P-S-N curves, validating the model’s reliability. Additionally, decreasing notch root radius led to shorter fatigue life due to stronger stress concentration effects. Fractographic analysis revealed multiple crack initiation sites at notch roots, contributing to rapid failure. The proposed framework, combining small-scale fatigue tests, finite element analysis, and TCD, offers an efficient approach for evaluating large-scale notched components while reducing full-scale testing demands.

Supplementary Materials

The following supporting information can be downloaded at: https://www.mdpi.com/article/10.3390/met15121300/s1, Equations (S1)–(S18).

Author Contributions

Conceptualization, B.L. and X.R.; methodology, B.L. and X.R.; software, B.L.; validation, B.L., P.L. and Y.C.; investigation, P.L.; writing—original draft preparation, B.L.; writing—review and editing, B.L., X.W. and X.R.; software, B.L.; investigation, P.L.; data curation, Y.C.; visualization, X.W.; supervision, X.W. and X.R.; project administration, X.R.; funding acquisition, X.W. and X.R. All authors have read and agreed to the published version of the manuscript.

Funding

This research was funded by National Natural Science Foundation of China, grant number 11932020, Opening Project Fund of Materials Service Safety Assessment Facilities and Interdisciplinary Research Project for Young Teachers of USTB (Fundamental Research Funds for the Central Universities), grant number FRF-IDRY-24-022.

Data Availability Statement

The data are not publicly available due to institutional confidentiality. Data may be provided by the corresponding author upon reasonable request and organizational approval.

Conflicts of Interest

The authors declare no conflicts of interest.

Abbreviations

The following abbreviations are used in this manuscript:
LCFLow cycle fatigue
MCFMiddle cycle fatigue
HSVHighly stressed volume
TCDTheory of critical distances
SCFStress concentration factor
PMPoint Method
LMLine Method
AMArea Method
VMVolume Method
FEMFinite element method
FCGFatigue crack propagation
FSCrack initiation zone
CPCrack propagation zone
FFRapid fracture zone
LESLinear elastic stress
ICPInductively coupled plasma emission spectroscopy

References

  1. Härkegård, G.; Denk, J.; Stärk, K. Growth of naturally initiated fatigue cracks in ferritic gas turbine rotor steels. Int. J. Fatigue 2005, 27, 715–726. [Google Scholar] [CrossRef]
  2. Tang, Y.; Song, Y.; Yin, G.; Nie, Y. Notch fatigue life prediction model considering stress gradient influence depth and weight function. Metals 2023, 13, 539. [Google Scholar] [CrossRef]
  3. He, J.C.; Zhu, S.P.; Niu, X.P.; Liao, D.; Wang, Q.Y. Notch fatigue life prediction under size effect: Stress gradient-based theory of critical distance. J. Mech. Eng. 2023, 59, 90–106. [Google Scholar]
  4. Ni, H.; Guo, S.; Zhang, S.; Lei, H. Experimental and Numerical Investigation of Constant-Amplitude Fatigue Performance in Welded Joints of Steel Tubular Flange Connections for Steel Structures. Buildings 2025, 15, 1574. [Google Scholar] [CrossRef]
  5. Xu, W.; Ren, Y.; Xiao, S.; Liu, B. A finite crack growth energy release rate for elastic-plastic fracture. J. Mech. Phys. Solids 2023, 181, 105447. [Google Scholar] [CrossRef]
  6. Mirzaei, A.M.; Mirzaei, A.H.; Sapora, A.; Cornetti, P. Strain based finite fracture mechanics for fatigue life prediction of additively manufactured samples. Int. J. Fract. 2025, 249, 44. [Google Scholar] [CrossRef]
  7. Dutkiewicz, M.; Hembara, O.; Chepil, O.; Hrynenko, M.; Hembara, T. A new energy approach to predicting fracture resistance in metals. Materials 2023, 16, 1566. [Google Scholar] [CrossRef]
  8. Amsterdam, E.; Wiegman, J.W.E.; Nawijn, M.; De Hosson, J.T.M. On the strain energy release rate and fatigue crack growth rate in metallic alloys. Eng. Fract. Mech. 2023, 286, 109292. [Google Scholar] [CrossRef]
  9. De Jesus, A.M.P.; Pereira, H.F.S.G.; Ribeiro, A.S.; Fernandes, A.A. Cyclic elastoplastic analysis of structures concerning a fatigue assessment according to the local strain approach: An overview. J. Press. Vessel. Technol. 2008, 130, 034503. [Google Scholar] [CrossRef]
  10. Pan, X.; Liu, J.; Li, Y.; Hua, F.; Chen, X.; Zhang, Z. Finite element analysis of stress field and fatigue life prediction of notched specimens under multiaxial load. Int. J. Struct. Integr. 2023, 14, 663–680. [Google Scholar] [CrossRef]
  11. Rice, J.R.; Rosengren, G.F. Plane strain deformation near a crack tip in a power-law hardening material. J. Mech. Phys. Solids 1968, 16, 1–12. [Google Scholar] [CrossRef]
  12. Neuber, H. Theory of Notch Stresses: Principles for Exact Stress Calculation; J.W. Edwards: Braintree, MA, USA, 1946. [Google Scholar]
  13. Taylor, D. Geometrical effects in fatigue: A unifying theoretical model. Int. J. Fatigue 1999, 21, 413–420. [Google Scholar] [CrossRef]
  14. Zhang, Y.; Zhang, K.; Hu, Z.; Chen, T.; Zhang, W.; Jin, K.; Sun, C.; Susmel, L.; Wei, B. A modified highly stressed volume (HSV) method to predict fatigue life considering the critical crack size. Int. J. Fatigue 2023, 172, 107644. [Google Scholar] [CrossRef]
  15. He, J.C.; Zhu, S.P.; Luo, C.; Li, W.; Liu, Q.; He, Y.; Wang, Q. Probabilistic notch fatigue assessment under size effect using micromechanics-based critical distance theory. Int. J. Fatigue 2024, 183, 108280. [Google Scholar] [CrossRef]
  16. Shuai, Z.; Zhu, S.P.; He, J.C.; Liao, D.; Correia, J.; Macek, W.; Branco, R.; Wang, Q. Fatigue life prediction of notched components under size effect using strain energy reformulated critical distance theory. Int. J. Fatigue 2023, 175, 107805. [Google Scholar] [CrossRef]
  17. Liu, J.; Lu, J.; Zhou, F.; Zhao, H.; Wang, J. Multiaxial fatigue life prediction model for notched specimen based on modified energy gradient and critical plane method. Theor. Appl. Fract. Mech. 2023, 125, 103880. [Google Scholar] [CrossRef]
  18. Taylor, D.; O’Donnell, M. Notch geometry effects in fatigue: A conservative design approach. Eng. Fail. Anal. 1994, 1, 275–287. [Google Scholar] [CrossRef]
  19. Susmel, L. On the estimation of the material fatigue properties required to perform the multiaxial fatigue assessment. Fatigue Fract. Eng. Mater. Struct. 2013, 36, 565–585. [Google Scholar] [CrossRef]
  20. He, J.C.; Zhu, S.P.; Taddesse, A.T.; Niu, X. Evaluation of critical distance, highly stressed volume, and weakest-link methods in notch fatigue analysis. Int. J. Fatigue 2022, 162, 106950. [Google Scholar] [CrossRef]
  21. Fryer, Y.D.; Bailey, C.; Cross, M.; Lai, C.H. A control volume procedure for solving the elastic stress-strain equations on an unstructured mesh. Appl. Math. Model. 1991, 15, 639–645. [Google Scholar] [CrossRef]
  22. Marques, J.M.E.; Mžourek, M.; Papuga, J.; Růžička, M.; Benasciutti, D. A probabilistic stress-life model supported by weakest link principle and highly-stressed volume/surface area concepts. Int. J. Fatigue 2024, 178, 108006. [Google Scholar] [CrossRef]
  23. Ghazal, M.G.M. A new extension of the modified Weibull distribution with applications for engineering data. Probabilistic Eng. Mech. 2023, 74, 103523. [Google Scholar] [CrossRef]
  24. Strzelecki, P. Determination of fatigue life for low probability of failure for different stress levels using 3-parameter Weibull distribution. Int. J. Fatigue 2021, 145, 106080. [Google Scholar] [CrossRef]
  25. Shahriari, M.; Shahrasbi, H.; Zaretalab, A. Reliability analysis of lifetime systems based on Weibull distribution. Int. J. Nonlinear Anal. Appl. 2024, 15, 321–329. [Google Scholar]
  26. Karolczuk, A. Validation of the weakest link approach and the proposed Weibull based probability distribution of failure for fatigue design of steel welded joints. Eng. Fail. Anal. 2016, 67, 46–62. [Google Scholar] [CrossRef]
  27. China Aeronautical Materials Handbook Editorial Committee. China Aeronautical Materials Handbook vol. 4 Titanium Alloy; China Standards Press: Beijing, China, 2002. [Google Scholar]
  28. Susmel, L.; Taylor, D. A novel formulation of the theory of critical distances to estimate lifetime of notched components in the medium-cycle fatigue regime. Fatigue Fract. Eng. Mater. Struct. 2007, 30, 567–581. [Google Scholar] [CrossRef]
  29. Susmel, L.; Taylor, D. On the Use of the Theory of Critical Distances to Estimate KIc and ∆ Kth from Experimental Results Generated by Testing Standard Notches. Key Eng. Mater. 2010, 417, 25–28. [Google Scholar]
  30. Lipp, K.; Baumgartner, J.; Beiss, P. Fatigue design of sintered steel components: Effect of stress concentrations and mean stresses on local strength using highest stressed volume approach. Powder Metall. 2013, 56, 337–341. [Google Scholar] [CrossRef]
  31. Sonsino, C.M.; Moosbrugger, E. Fatigue design of highly loaded short-glass-fibre reinforced polyamide parts in engine compartments. Int. J. Fatigue 2008, 30, 1279–1288. [Google Scholar] [CrossRef]
  32. Akiniwa, Y.; Miyamoto, N.; Tsuru, H.; Tanaka, K. Notch effect on fatigue strength reduction of bearing steel in the very high cycle regime. Int. J. Fatigue 2006, 28, 1555–1565. [Google Scholar] [CrossRef]
  33. Ren, W.; Nicholas, T. Notch size effects on high cycle fatigue limit stress of Udimet 720. Mater. Sci. Eng. A 2003, 357, 141–152. [Google Scholar] [CrossRef]
  34. Cunningham, B.M.D.; Evangelou, A.; You, C.; Morris, A.; Wise, J.; Reed, P.A.; Hamilton, A.R. Fatigue crack initiation and growth behavior in a notch with periodic overloads in the low-cycle fatigue regime of FV566 ex-service steam turbine blade material. Fatigue Fract. Eng. Mater. Struct. 2022, 45, 546–564. [Google Scholar] [CrossRef]
  35. Sakane, M.; Zhang, S.; Kim, T.J. Notch effect on multiaxial low cycle fatigue. Int. J. Fatigue 2011, 33, 959–968. [Google Scholar] [CrossRef]
  36. Liao, D.; Zhu, S.P.; Correia, J.A.F.O.; De, J.A.M.; Berto, F. Recent advances on notch effects in metal fatigue: A review. Fatigue Fract. Eng. Mater. Struct. 2020, 43, 637–659. [Google Scholar] [CrossRef]
  37. Mäde, L.; Schmitz, S.; Gottschalk, H.; Beck, T. Combined notch and size effect modeling in a local probabilistic approach for LCF. Comput. Mater. Sci. 2018, 142, 377–388. [Google Scholar] [CrossRef]
  38. Ai, Y.; Zhu, S.P.; Liao, D.; Correia, J.A.; De, J.A.M.; Keshtegar, B. Probabilistic modelling of notch fatigue and size effect of components using highly stressed volume approach. Int. J. Fatigue 2019, 127, 110–119. [Google Scholar] [CrossRef]
  39. Wang, R.; Li, D.; Hu, D.; Meng, F.; Liu, H.; Ma, Q. A combined critical distance and highly-stressed-volume model to evaluate the statistical size effect of the stress concentrator on low cycle fatigue of TA19 plate. Int. J. Fatigue 2017, 95, 8–17. [Google Scholar] [CrossRef]
  40. Zeng, Y.; Li, Z.; Deng, W.; Wang, F.; Wang, Z. A novel line method of the theory of critical distance for predicting the notched specimen’s fatigue life based on the relative stress gradient variation. Appl. Phys. A 2025, 131, 1–15. [Google Scholar] [CrossRef]
  41. Liu, S.; Wang, X.; Wang, P.; Chen, H.; Wang, Y.; Liu, Z.; Liu, X. The plastic strain energy density-based fatigue life prediction method incorporating geometric-mechanical-microstructural characteristic parameters of machined surface integrity. Results Eng. 2025, 28, 107299. [Google Scholar] [CrossRef]
  42. Jirandehi, A.P.; Khonsari, M.M. On the determination of cyclic plastic strain energy with the provision for microplasticity. Int. J. Fatigue 2021, 142, 105966. [Google Scholar] [CrossRef]
  43. Lyu, H.; Hamid, M.; Ruimi, A.; Zbib, H.M. Stress/strain gradient plasticity model for size effects in heterogeneous nano-microstructures. Int. J. Plast. 2017, 97, 46–63. [Google Scholar] [CrossRef]
  44. As’ad, F.; Avery, P.; Farhat, C. A mechanics-informed artificial neural network approach in data-driven constitutive modeling. Int. J. Numer. Methods Eng. 2022, 123, 2738–2759. [Google Scholar] [CrossRef]
  45. Conoscenti, M.A.; Smith, N.J.; Fanselow, M.S. Dissociable consequences of moderate and high volume stress are mediated by the differential energetic demands of stress. PLoS ONE 2022, 17, e0273803. [Google Scholar] [CrossRef]
  46. Braun, M.; Müller, A.M.; Milaković, A.S.; Fricke, W.; Ehlers, S. Requirements for stress gradient-based fatigue assessment of notched structures according to theory of critical distance. Fatigue Fract. Eng. Mater. Struct. 2020, 43, 1541–1554. [Google Scholar] [CrossRef]
  47. Benedetti, M.; Santus, C. Statistical properties of threshold and notch derived estimations of the critical distance according to the line method of the theory of critical distances. Int. J. Fatigue 2020, 137, 105656. [Google Scholar] [CrossRef]
  48. Cicero, S.; Madrazo, V.; Carrascal, I.A. Analysis of notch effect in PMMA using the Theory of Critical Distances. Eng. Fract. Mech. 2012, 86, 56–72. [Google Scholar] [CrossRef]
  49. Neuber, H. Theory of Notch Stresses: Principles for Exact Calculation of Strength with Reference to Structural Form and Material; J.W. Edwards: Braintree, MA, USA, 1961. [Google Scholar]
  50. Peterson, T.D. A refined technique for measuring crystal size distributions in thin section. Contrib. Mineral. Petrol. 1996, 124, 395–405. [Google Scholar] [CrossRef]
  51. Taylor, D. Applications of the theory of critical distances in failure analysis. Eng. Fail. Anal. 2011, 18, 543–549. [Google Scholar] [CrossRef]
  52. Bellett, D.; Taylor, D.; Marco, S.; Mazzeo, E.; Guillois, J.; Pircher, T. The fatigue behaviour of three-dimensional stress concentrations. Int. J. Fatigue 2005, 27, 207–221. [Google Scholar] [CrossRef]
  53. Yang, X.; Wang, J.; Liu, J. High temperature LCF life prediction of notched DS Ni-based superalloy using critical distance concept. Int. J. Fatigue 2011, 33, 1470–1476. [Google Scholar] [CrossRef]
  54. Wang, J.; Yang, X. HCF strength estimation of notched Ti–6Al–4V specimens considering the critical distance size effect. Int. J. Fatigue 2012, 40, 97–104. [Google Scholar] [CrossRef]
  55. Al, Z.I.; Razavi, S.M.J.; Berto, F.; Susmel, L. The critical distance method to estimate the fatigue strength of notched additively manufactured titanium alloys. Procedia Struct. Integr. 2020, 28, 994–1001. [Google Scholar] [CrossRef]
  56. Kuguel, R. A relation between theoretical stress concentration factor and fatigue notch factor deduced from the concept of highly stressed volume. Proc. ASTM 1961, 61, 732–748. [Google Scholar]
  57. Lin, C.K.; Lee, W.J. Effects of highly stressed volume on fatigue strength of Austempered Ductile Irons. Int. J. Fatigue 1998, 20, 301–307. [Google Scholar] [CrossRef]
  58. Susmel, L.; Taylor, D. The Theory of Critical Distances as an alternative experimental strategy for the determination of KIc and ΔKth. Eng. Fract. Mech. 2010, 77, 1492–1501. [Google Scholar] [CrossRef]
Figure 1. PM and LM of TCD.
Metals 15 01300 g001
Figure 2. Schematic diagram of highly stressed volume.
Metals 15 01300 g002
Figure 3. Flow chart for life prediction of notch fatigue failure probability analysis.
Metals 15 01300 g003
Figure 4. The actual heat treatment of 26Cr2Ni4MoV steel.
Metals 15 01300 g004
Figure 5. The sampling method diagram.
Metals 15 01300 g005
Figure 6. The geometries of specimen: (a) smooth specimen; (b) 8 (r = 0.15); (c) 8 (r = 0.4); (d) 8 (r = 1.0); (e) 16 (r = 0.8); (f) 18 (r = 0.4); and (g) 32 (r = 1.6).
Metals 15 01300 g006
Figure 7. Geometrics of the notched En3B low-carbon steel specimen: (a) V—4 mm notch; (b) U—R1.5 mm notch; and (c) central hole—R1.75 mm [27].
Metals 15 01300 g007
Figure 8. Geometrics of the TC4 specimen: (a) smooth; (b) R 0.34 mm notch; and (c) R 0.1 mm notch [28].
Metals 15 01300 g008
Figure 9. Finite element modeling of 16 (r = 0.8) notched specimen.
Metals 15 01300 g009
Figure 10. The microstructure and tensile test results: (a) SEM image; (b) monotonic tensile stress–strain curve.
Metals 15 01300 g010
Figure 11. The stress-life data of 26Cr2Ni4MoV: (a,b) S-N data and the fatigue limit; (c,d) fatigue crack growth threshold.
Metals 15 01300 g011
Figure 12. The P-S-N curves of 26Cr2Ni4MoV smooth specimens.
Metals 15 01300 g012
Figure 13. The S-N curve of 26Cr2Ni4MoV notched specimen.
Metals 15 01300 g013
Figure 14. SEM image of the fracture surface of notched specimens: (a) macro fatigue fracture morphology ( 8 r = 0.15, σ m a x = 600 MPa, and N f = 16,410); (b) micro morphology of FS; (c) micro morphology of CP; (d) micro morphology of FF; (e) macro fatigue fracture morphology ( 8 r = 0.4, σ m a x = 600 MPa, N f = 48,021); (f) micro morphology of FS; (g) micro morphology of CP; (h) micro morphology of FF; (i) macro fatigue fracture morphology ( 8 r = 1.0, σ m a x = 600 MPa, N f = 96,448); (j) micro morphology of FS; (k) micro morphology of CP; and (l) micro morphology of FF.
Metals 15 01300 g014
Figure 15. PM method estimated P-S-N curve: (a) 0.15 mm radius v-notch; (b) 0.4 mm radius v-notch; (c) 1.0 mm radius v-notch; and (d) P-S-N curves of different notch.
Metals 15 01300 g015
Figure 16. LM method estimated P-S-N curve: (a) 0.15 mm radius v-notch; (b) 0.4 mm radius v-notch; (c) 1.0 mm radius v-notch; and (d) P-S-N curves of different notch.
Metals 15 01300 g016
Figure 17. PM/LM method scatter band of 26Cr2Ni4MoV notched specimens.
Metals 15 01300 g017
Figure 18. (a) Relationship between critical distance and fatigue life; (b) fatigue life predicted based on traditional TCD method fitting.
Metals 15 01300 g018
Figure 19. Estimated P-S-N curves: (a) TC4-PM 50% curve; (b) En3B-PM 50% curve; (c) En3B-PM 50% curve; and (d) En3B-LM 50% curve.
Metals 15 01300 g019
Table 1. Chemical composition (wt.%) of 26Cr2Ni4MoV materials.
CCrNiMoVMnSi
0.31.5 ~ 2.03.25 ~ 3.750.3 ~ 0.60.07 ~ 0.150.2 ~ 0.40.17 ~ 0.37
Table 2. Room temperature tensile stress–strain results.
Material R p 0.2 /MPa R m /MPaElongation/%Reduction in Area/%
26Cr2Ni4MoV950102521.573
959102319.573
945101921.076
946102020.574
Average947102220.574
Table 3. FE analysis of SCF of different notches.
Specimens
Notch Diameter
(Root Radius)
σ m a x /MPa σ n o m /MPa K t Maximum Stress Reduction Path
8 (r = 0.15 mm)5121204.2Metals 15 01300 i001Metals 15 01300 i002
8 (r = 0.4 mm)3371202.8Metals 15 01300 i003Metals 15 01300 i004
8 (r = 1.0 mm)2501202.1Metals 15 01300 i005Metals 15 01300 i006
16 (r = 0.8 mm)4251203.5Metals 15 01300 i007Metals 15 01300 i008
18 (r = 0.4 mm)3401202.8Metals 15 01300 i009Metals 15 01300 i010
32 (r = 1.6 mm)3311202.8Metals 15 01300 i011Metals 15 01300 i012
Table 4. HSV results of 26Cr2Ni4MoV different notched specimens.
MaterialRatio of High-Stress ZonesNotch Diameter (Root Radius)Maximum Stress/
MPa
HAS—High-Stress Area  ( A r ) /mm2HSV  ( V r ) /mm3
26Cr2Ni4MoVV-notch 8 (r = 0.15 mm)4500.0210.546
6000.0681.633
7000.1683.995
8 (r = 0.4 mm)6000.0982.442
7000.1694.309
8000.4069.893
8 (r = 1.0 mm)7000.3288.024
8000.52714.128
9001.65939.403
18 (r = 0.4 mm)6000.19510.972
16 (r = 0.8 mm)6000.37919.377
32 (r = 1.6 mm)6001.553146.725
Table 5. Calculated critical distances of 26Cr2Ni4MoV notched specimens.
Notch Type Maximum Stress ( σ 0 ) and Critical Distance ( L )
Cycles / N f 1.5 × 10 4 1.9 × 10 4 3.3 × 10 4 4.5 × 10 4 5.3 × 10 4 9.5 × 10 4 1.2 × 10 5 4.0 × 10 5
8 (r = 0.15 mm)
PM
Maximum Stress/
MPa
700 600 450 400
L /mm 0.294 0.224 0.116 0.0184
8 (r = 0.4 mm)
PM
Maximum Stress/
MPa
800 700 600
L / m m 0.468 0.332 0.226
8 (r = 1.0 mm)
PM
Maximum Stress/
MPa
900 800 700
L / m m 0.812 0.563 0.400
8 (r = 0.15 mm)
LM
Maximum Stress/
MPa
700 600 450 400
L / m m 0.107 0.091 0.049 0.046
8 (r = 0.4 mm)
LM
Maximum Stress/
MPa
800 700 600
L / m m 0.183 0.129 0.071
8 (r = 1.0 mm)
LM
Maximum Stress/
MPa
900 800 700
L / m m 0.281 0.208 0.128
Table 6. Fitted model parameters for 26Cr2Ni4MoV materials.
Material a 2 b 2 φ R
26Cr2Ni4MoV1341.219−0.02291.39040.9396
Table 7. Calculated critical distance L for 26Cr2Ni4MoV notched specimen.
MaterialNotch Type PM ( L )/mmPM ( L )/mm
26Cr2Ni4MoV 16 (r = 0.8 mm)0.5040.156
18 (r = 0.4 mm)0.4090.129
32 (r = 1.6 mm)1.0870.340
Table 8. Mechanical properties of En3B and TC4.
MaterialE/MPa σ U /MPa σ y /MPa K /MPa n
En3B197,400638.5606.2890.70.1635
TC4107,000950.0902.01032.00.0729
Table 9. Kt value of notched specimen for En3B and TC4.
MaterialNotch TypeKt
En3BV-4 mm notch16.2
U-R1.5 mm notch6.1
central hole-R1.75 mm3.1
TC4smooth1.0
R0.34 mm notch3.0
R0.1 mm notch5.0
Table 10. Fitted model parameters for TC4/En3B materials.
Material a 2 b 2 φ
En3B873−0.1192.47
TC49430.1522.68
Disclaimer/Publisher’s Note: The statements, opinions and data contained in all publications are solely those of the individual author(s) and contributor(s) and not of MDPI and/or the editor(s). MDPI and/or the editor(s) disclaim responsibility for any injury to people or property resulting from any ideas, methods, instructions or products referred to in the content.