Article

Enhancing Automotive Valve Guide Tribomechanical Performance Through Alloy Optimization in Powder Metallurgy

1
School of Materials Science and Engineering, Guangdong Ocean University, Yangjiang 529500, China
2
Yang Jiang Advanced Alloys Laboratory, Yangjiang 529500, China
3
State Key Laboratory for Advanced Metals and Materials, University of Science and Technology Beijing, Beijing 100083, China
*
Authors to whom correspondence should be addressed.
Metals 2025, 15(12), 1301; https://doi.org/10.3390/met15121301
Submission received: 14 October 2025 / Revised: 21 November 2025 / Accepted: 22 November 2025 / Published: 26 November 2025

Abstract

Given the critical role of valve guides in the performance and lifespan of automotive engines, it is crucial to understand and improve their wear resistance. This study focuses on the wear resistance of powder metallurgy valve guides, aiming to systematically analyze the intrinsic relationship between their composition, microstructure, and properties. Three powder metallurgy valve guide samples with different compositions—specifically, a high-MoS2 Fe-C-Mo-Cu-S alloy (1.5 wt.% C, 1.9 wt.% Mo, 1.5 wt.% Cu, 1.4 wt.% S), a low-MoS2 Fe-C-Mo-Cu-S alloy (1.2 wt.% C, 0.3 wt.% Mo, 0.8 wt.% Cu, 0.2 wt.% S), and a Mo-free high-C-Cu Fe-C alloy (1.8 wt.% C, 5 wt.% Cu, 0 wt.% Mo, 0.01 wt.% S)—were studied using field emission scanning electron microscopy, metallographic microscopy, a reciprocating friction testing machine, and a 3D optical profilometer. The results show that the friction coefficient of the high-MoS2 Fe-C-Mo-Cu-S alloy is the highest at 0.5, the low-MoS2 Fe-C-Mo-Cu-S alloy is 0.25, and the Mo-free high-C-Cu Fe-C alloy is the lowest at 0.22. Since the minor wear amount cannot be accurately measured by the gravimetric method, the concave area of the wear-induced average roughness curve is employed to qualitatively indicate the magnitude of material loss: the area of the high-MoS2 Fe-C-Mo-Cu-S alloy is 2964 μm2, the low-MoS2 Fe-C-Mo-Cu-S alloy is 1580 μm2, and the Mo-free high-C-Cu Fe-C alloy is 1502 μm2. The hardness results of the material show that the high-MoS2 Fe-C-Mo-Cu-S alloy reaches 154 HB, the low-MoS2 Fe-C-Mo-Cu-S alloy is 134 HB, and the Mo-free high-C-Cu Fe-C alloy is 145 HB. The porosity results show a difference of about 2% among the three alloys. Based on the microstructure characterization results, it can be concluded that the Mo-free high-C-Cu Fe-C alloy—with high carbon (C) and copper (Cu) content and fine pearlite layers—exhibits excellent wear resistance: high C can improve the hardness of the matrix, while Cu can act as a lubricating phase to enhance the material’s wear resistance. In contrast, although the addition of MoS2 is intended to improve wear resistance, the irregular pearlite generated by MoS2 reduces the wear resistance of the high-MoS2 and low-MoS2 Fe-C-Mo-Cu-S alloys; among them, the high-MoS2 Fe-C-Mo-Cu-S alloy contains a higher amount of MoS2, and large chunks appearing in the tissue easily cause abrasive wear and aggravate material wear during friction. This study provides solid theoretical and practical support for the material selection and performance optimization of powder metallurgy engine valve guides: the identified intrinsic relationship between alloy composition (MoS2, C, and Cu contents), microstructure (pearlite morphology and second-phase distribution), and tribological performance establishes a clear theoretical basis for regulating the wear resistance of such components.

1. Introduction

In the automotive industry, the engine, serving as the heart of the vehicle, directly influences the operational efficiency and service life of the entire automobile. The valve system, a pivotal component within the engine, bears the responsibility of regulating the inflow and outflow of gases within the cylinder, ensuring the normal operation of the engine [1,2,3]. The core constituents of the valve system include valves, valve seat inserts, valve guides, and valve springs, which work together to precisely control the opening and closing of the valves, thereby maintaining efficient gas exchange within the engine combustion chamber. Among these, the valve guide plays a crucial role as the guiding element in this system. It not only needs to guide the valve in maintaining precise linear reciprocating motion during high-speed operation to reduce friction and wear but also effectively transfers heat from the valve stem to the cylinder head, preventing overheating that could lead to performance degradation or damage [4,5,6,7]. The performance of the valve guide directly affects the stability of valve motion, sealing performance, and the thermal efficiency and durability of the entire engine. Therefore, the design, material selection, and manufacturing process optimization of valve guides have always been key areas of focus in engine technology research and development.
However, valve guides face numerous challenges in practical applications. On the one hand, due to the extremely harsh working environment of the engine, including high temperatures, high pressures, high speeds, and corrosive substances, the materials for valve guides are subjected to extremely high requirements. Traditional cast iron materials, due to their poor machinability and low hardness, can no longer meet the demands of modern high-performance engines. On the other hand, if there are manufacturing defects or there is improper assembly in the valve guide, such as dimensional deviations, excessive surface roughness, or poor coaxiality, it can lead to eccentric wear or even fracture during use. Eccentric wear not only accelerates the wear of the valve and valve seat insert, reducing the sealing performance of the cylinder, but also causes engine power loss and poor fuel economy [8]. Fracture is even more severe, as it not only increases oil consumption but may also allow oil to seep into the intake and exhaust pipes through the fracture site, resulting in incomplete oil combustion and the production of a large amount of harmful emissions, severely polluting the atmospheric environment while also causing irreversible damage to the engine’s power and economy [9]. Given the importance of valve guides and the challenges they face, researchers and technicians have been continuously exploring and improving their materials, designs, and manufacturing processes. Powder metallurgy technology, due to its unique advantages, has gradually become the mainstream choice for valve guide manufacturing. Powder metallurgy technology allows for flexible adjustment of material composition and microstructure, significantly improving material thermal conductivity, wear resistance, and fatigue resistance through the addition of alloy elements, hard particles, and lubricating solid lubricants. This “tailor-made” capability enables powder metallurgy valve guides to better adapt to the harsh working environments of modern engines, extending their service life and improving the overall performance of the engine [10,11,12].
Despite this, compared with other components in the valve system such as valve seat inserts, valves, and camshafts, research on valve guides is relatively limited, especially in exploring the impact of composition and microstructure on their wear resistance. Wear resistance is a crucial indicator for evaluating the performance of valve guides, directly related to their service life and engine operational efficiency. Therefore, deeply investigating the influence of different compositions and microstructures of powder metallurgy valve guides on wear resistance in order to reveal the underlying mechanisms is of great significance for advancing the further development of valve guide technology, enhancing the economy and power of engines.
This study aims to fill this research gap by systematically analyzing the wear resistance of powder metallurgy valve guides with different compositions and microstructures, revealing the intrinsic relationship between material composition, microstructure, and wear resistance. Advanced material analysis techniques and experimental methods are employed to systematically compare and investigate the effects of critical factors—including alloy element addition levels, types and distribution of hard particles, and content of solid lubricants—on the wear resistance characteristics of valve guides. Throughout this research, the focus is on clarifying the regulatory mechanisms of these critical factors on valve guide wear resistance, as well as verifying how composition and microstructure jointly influence tribological performance. This work thereby provides solid theoretical and practical support for the material selection and performance optimization of powder metallurgy engine valve guides, while contributing to the advancement of engine technology and the sustainable development of the automotive industry.

2. Materials and Methods

There were three samples analyzed in this experiment, and the three catheters were prepared by powder metallurgy process. At room temperature, the mixed metal powder wood was placed in the mold according to a certain filling coefficient, and then a certain pressure was applied to the die punch to obtain the compact. Then, the compact obtained certain physical and mechanical properties by sintering. All three valve guide samples had the following main dimensions: outer diameter of 10 mm, inner diameter of 5 mm, and length of 40 mm. Their shapes and compositions are shown in Figure 1 and Table 1.
To focus on the core objective of analyzing the relationship between alloy composition, final microstructure, and tribomechanical performance, powder size was controlled as a constant variable to avoid confounding effects. All three valve guide samples were fabricated using raw powders (Fe, C, Cu, MoS2, etc.) from the same industrial batch, with a consistent particle size distribution. This uniform powder size across samples ensures that performance differences among samples are solely derived from variations in alloy composition and the resulting microstructure, rather than powder size.
From Table 1, the sample contains high C, and has Mo, Cu and S elements, which have the characteristics of good high temperature strength, high hardness, and high density [13,14,15]. Cu can promote the sintering process, have a solution strengthening effect on Fe, and improve the strength of the material. On the other hand, after copper is melted, it leaves holes in the matrix, so copper also has the effect of adjusting the size of the product. Because copper is softer than iron, it is often added to iron-based self-lubricating oil-impregnated bearings to play a wear-resistant role. Copper and phosphorus may be used in combination, in iron-based powder metallurgy, not only to improve the friction performance of the product, but also to improve the strength [15,16,17,18,19]. Copper also has the effect of permanently sealing pores in iron-based powder metallurgy; MoS2 has good chemical stability and low friction factor.
The samples were polished with sandpaper (400, 800, 1000, 1500, 2000 mesh). Then, polishing spray with different particle sizes (2.5 μm, 0.5 μm) was used for polishing. The surface erosion was carried out with HNO3:C2H5OH = 5%:95% erosion solution. The microstructure of the samples was observed by field emission scanning electron microscopy (SEM, Tescan, Brno, Czech Republic, mira3 LMH). The experimental parameters were magnification 2000×, resolution 1024 × 1024, acceleration voltage 10 kV, and working distance 10 mm. The phase composition at room temperature was determined by X-ray diffraction (XRD, Shimadzu, Kyoto, Japan, 7000 s). The experimental parameters were as follows: radiation source cu-k α, voltage 40 kV, current 30 mA, angle 30~90°, scanning speed 2°/min, and step size 0.02°. The reciprocating friction tester (hsr-2m, Lanzhou Zhongke Huakai Technology Development, Lanzhou, China) was used for friction and wear experiments, and the experimental parameters were: 5 N load, 250 t/min reciprocating frequency, and 20 min of experimental duration. The surface morphology was characterized by a 3D optical profilometer (UPS dual).
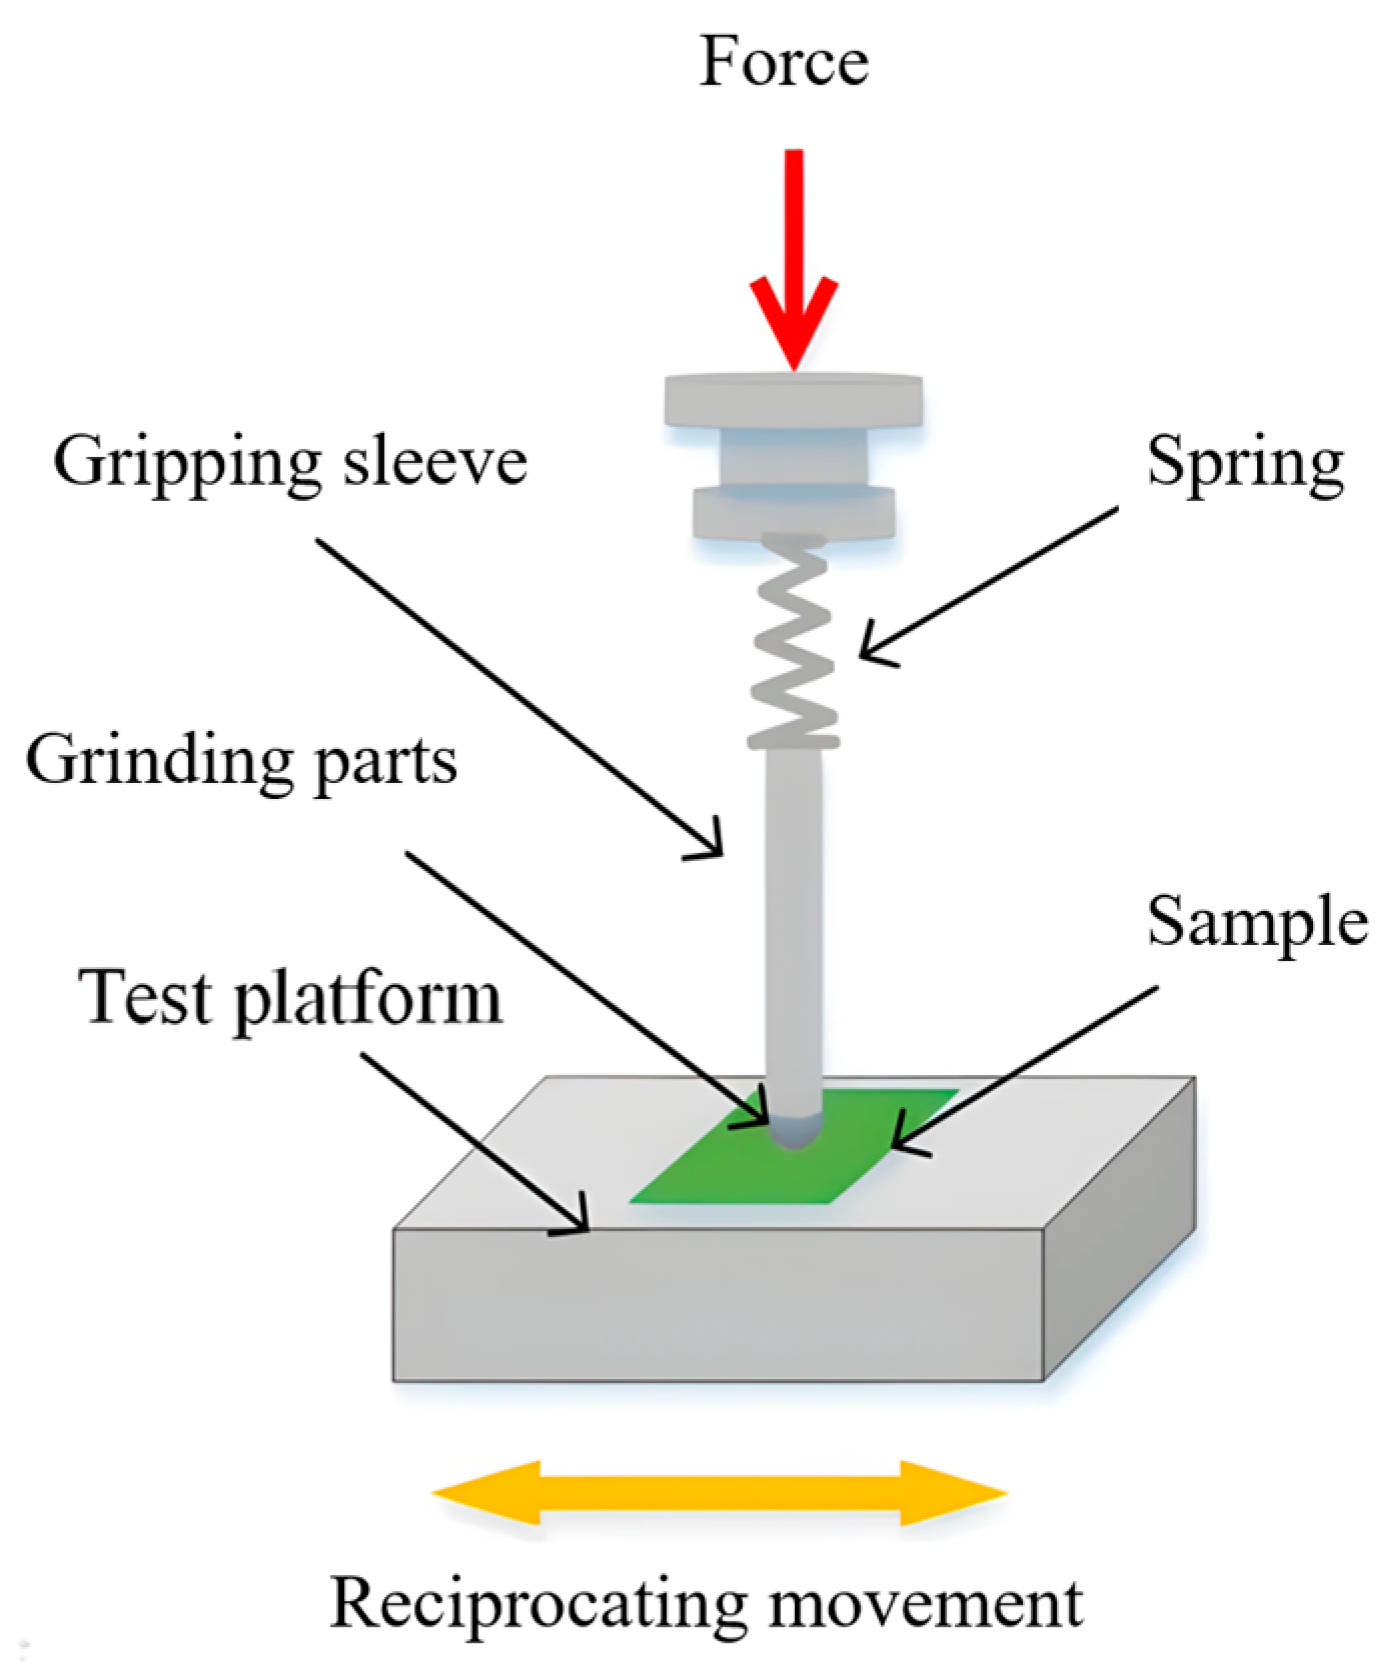
The experimental process is shown in Figure 2. Before the friction tests, all samples underwent oil impregnation pre-treatment to simulate their intrinsic lubrication capability in service. At the beginning of the experiment, a load was applied to the top and transmitted to the grinding component (i.e., friction counterbody) through a spring. The testing platform at the bottom fixed the experimental sample, and the specific fixing method is as follows: the valve guide sample (with a size of 5 mm × 10 mm) was first embedded in an embedding material to ensure structural stability and was then clamped and fixed on the test platform using a dedicated fixture. The “Sample” labeled in Figure 2 (green plate) is a simplified representation of the sample-embedding fixture assembly for clarity, and the actual valve guide sample corresponds to the shape shown in Figure 1 (Schematic diagram and Entity diagram of the valve guide).
The friction counterbody used in this experiment is a GCr15 bearing steel ball with a diameter of 5 mm. The surface roughness of the steel ball is Ra = 0.1–0.2 μm, and its hardness is HRC 60–62, which is a common choice for tribological tests of automotive structural materials due to its good wear resistance and mechanical stability.

3. Results

3.1. Tribological Performance and Dominant Wear Mechanisms

The surface of the sample was polished with 400, 800, 1200, and 2000 sandpaper, and the 3.5 diamond spray was thrown on the polishing disc until there were no obvious scratches, and it was fixed on the fixture of the friction testing machine. The test parameters were: 5 N load, 250 t/min reciprocating frequency, and 20 min of experimental duration. Two experimental replicates were conducted for each sample.
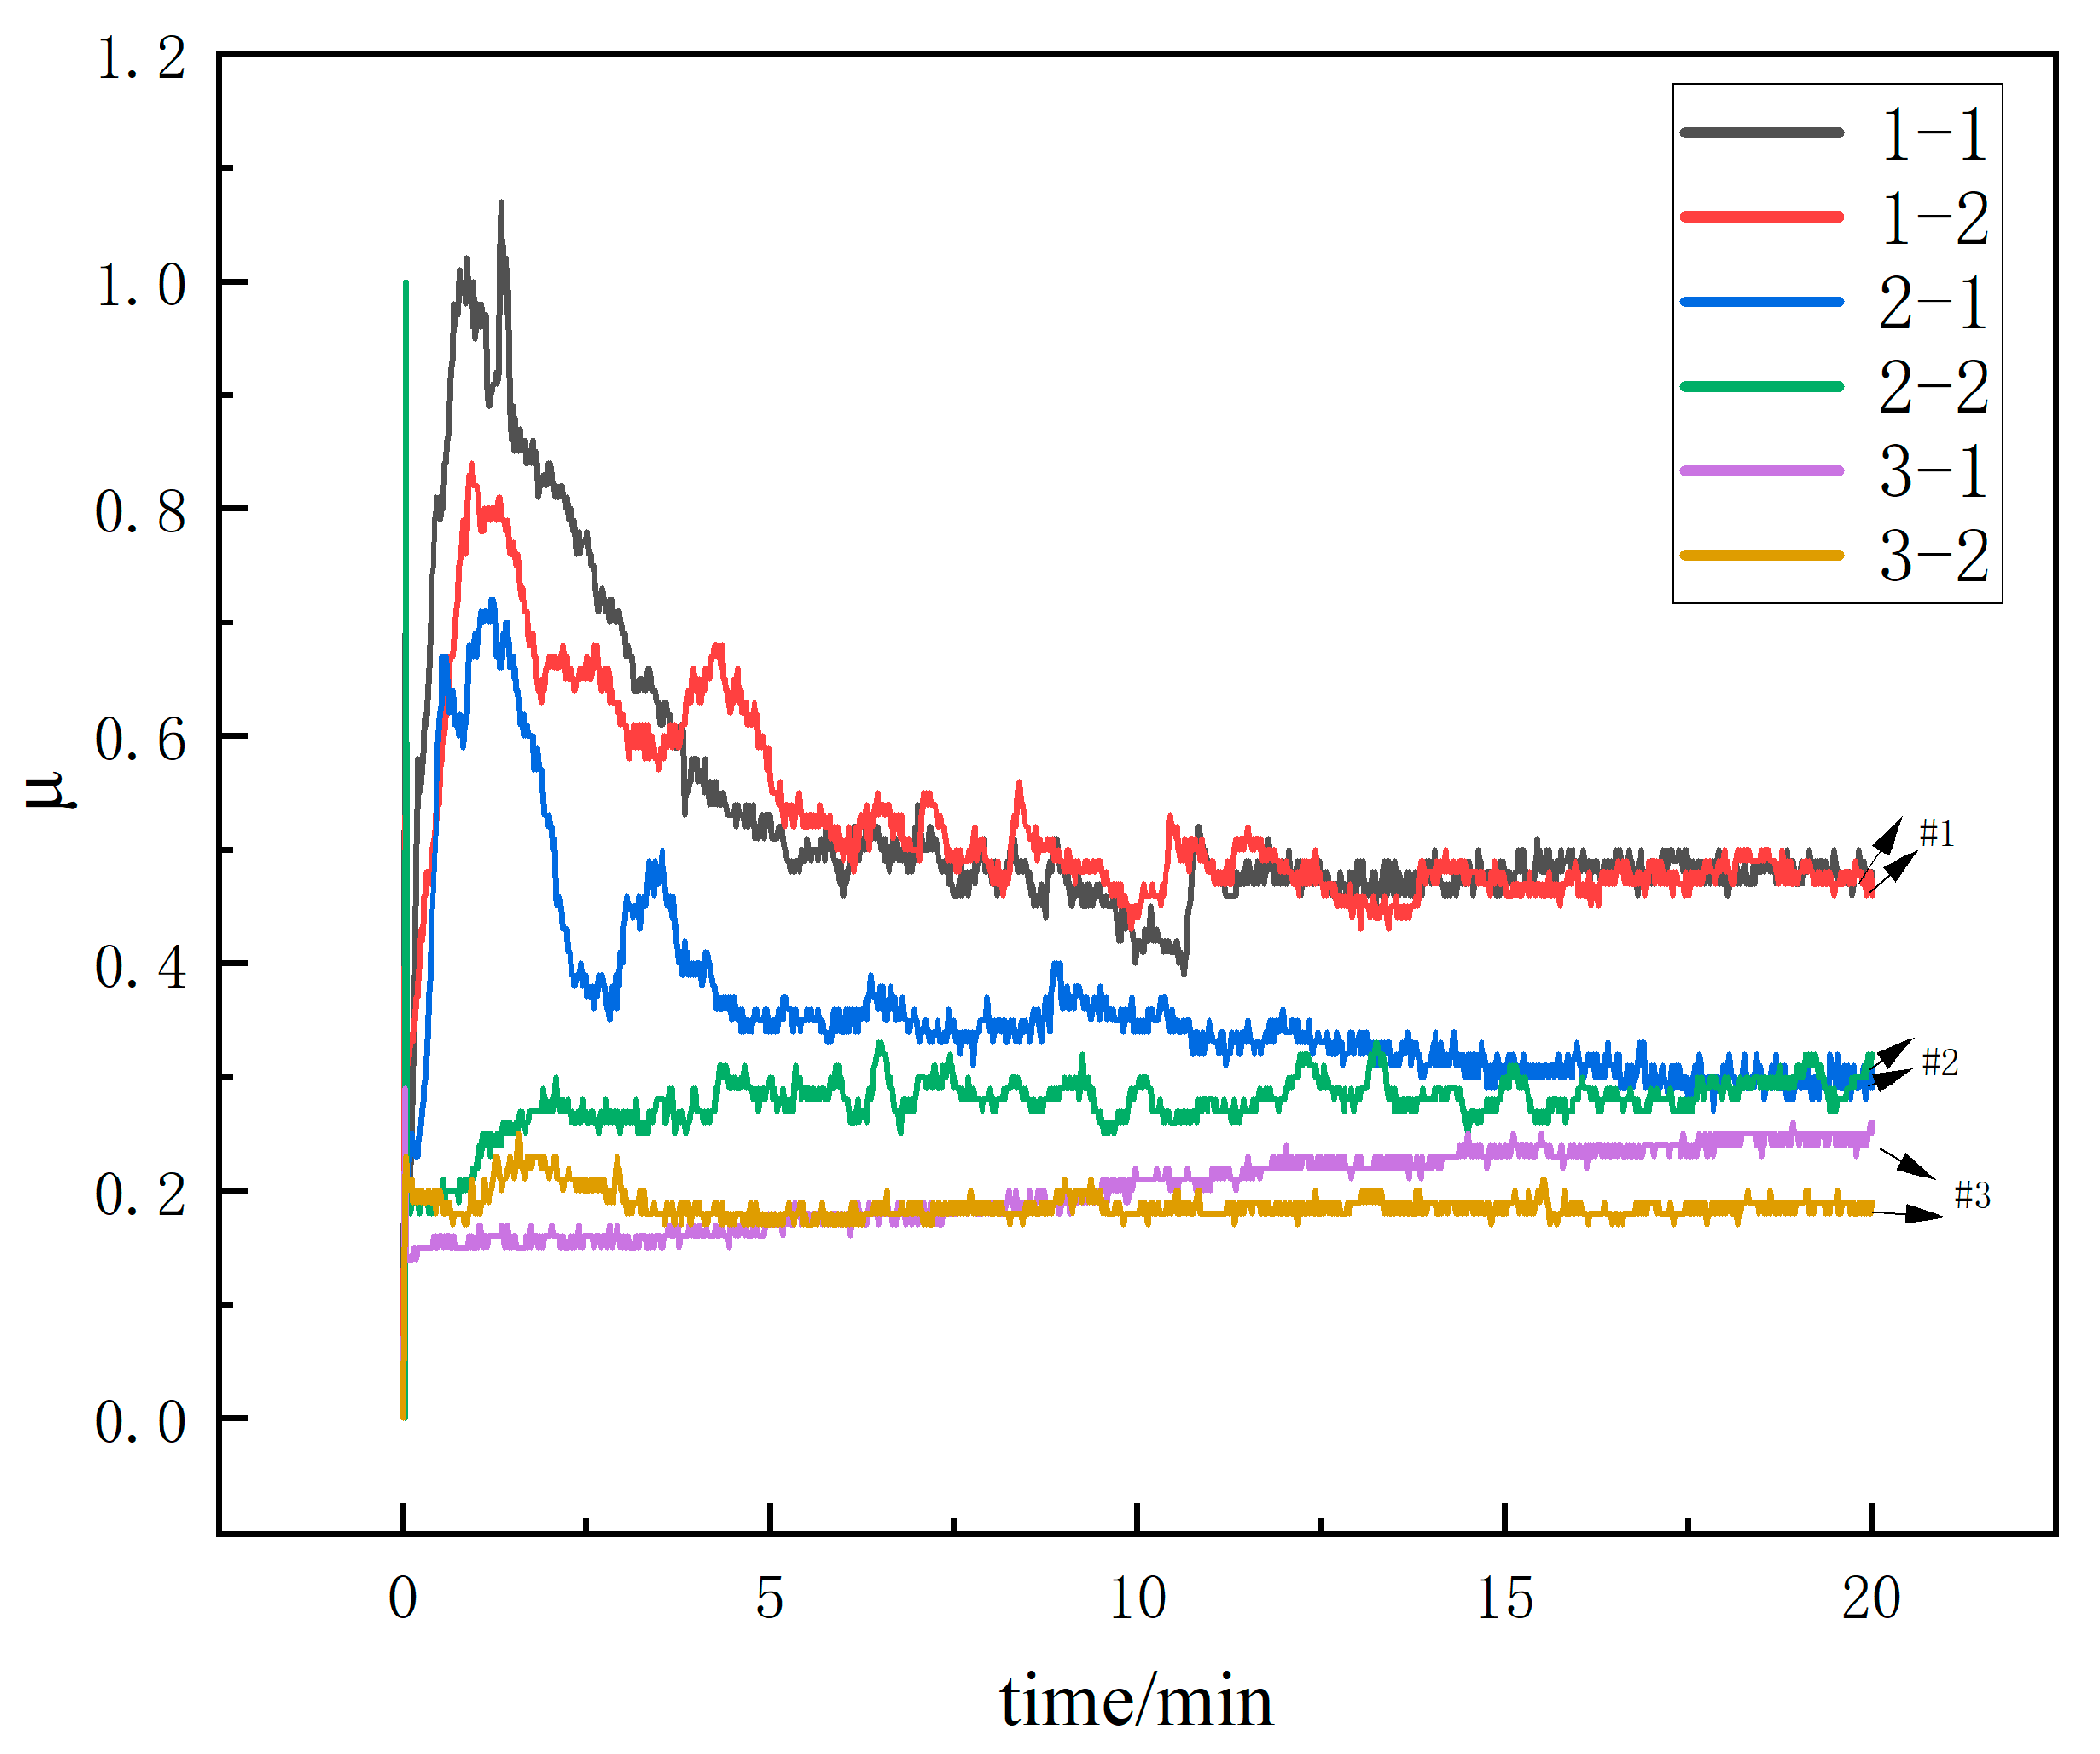
As shown in Figure 3 (X-axis: Time (min); Y-axis: Friction Coefficient), the large friction coefficient at the initial stage of friction is due to the elastic deformation of the surface microconvex body due to the impact force at the contact point at the beginning of loading, which increases the contact area and increases the friction coefficient, accordingly, forming a peak [20,21,22], the friction coefficient of all samples stabilized after 15 min, and the difference directly correlated with their alloy composition: the high-MoS2, low-Cu Alloy 1 showed the highest stable friction coefficient (0.5), attributed to coarse MoS2-rich phases and irregular pearlite; the low-MoS2, low-Cu Alloy 2 had a lower coefficient (0.3) as reduced MoS2 alleviated phase coarsening; and the Mo-free, high-C-Cu Alloy 3 exhibited the lowest coefficient (0.22), benefiting from fine pearlite (boosting hardness) and Cu (acting as a lubricating phase) that synergistically lowered friction.
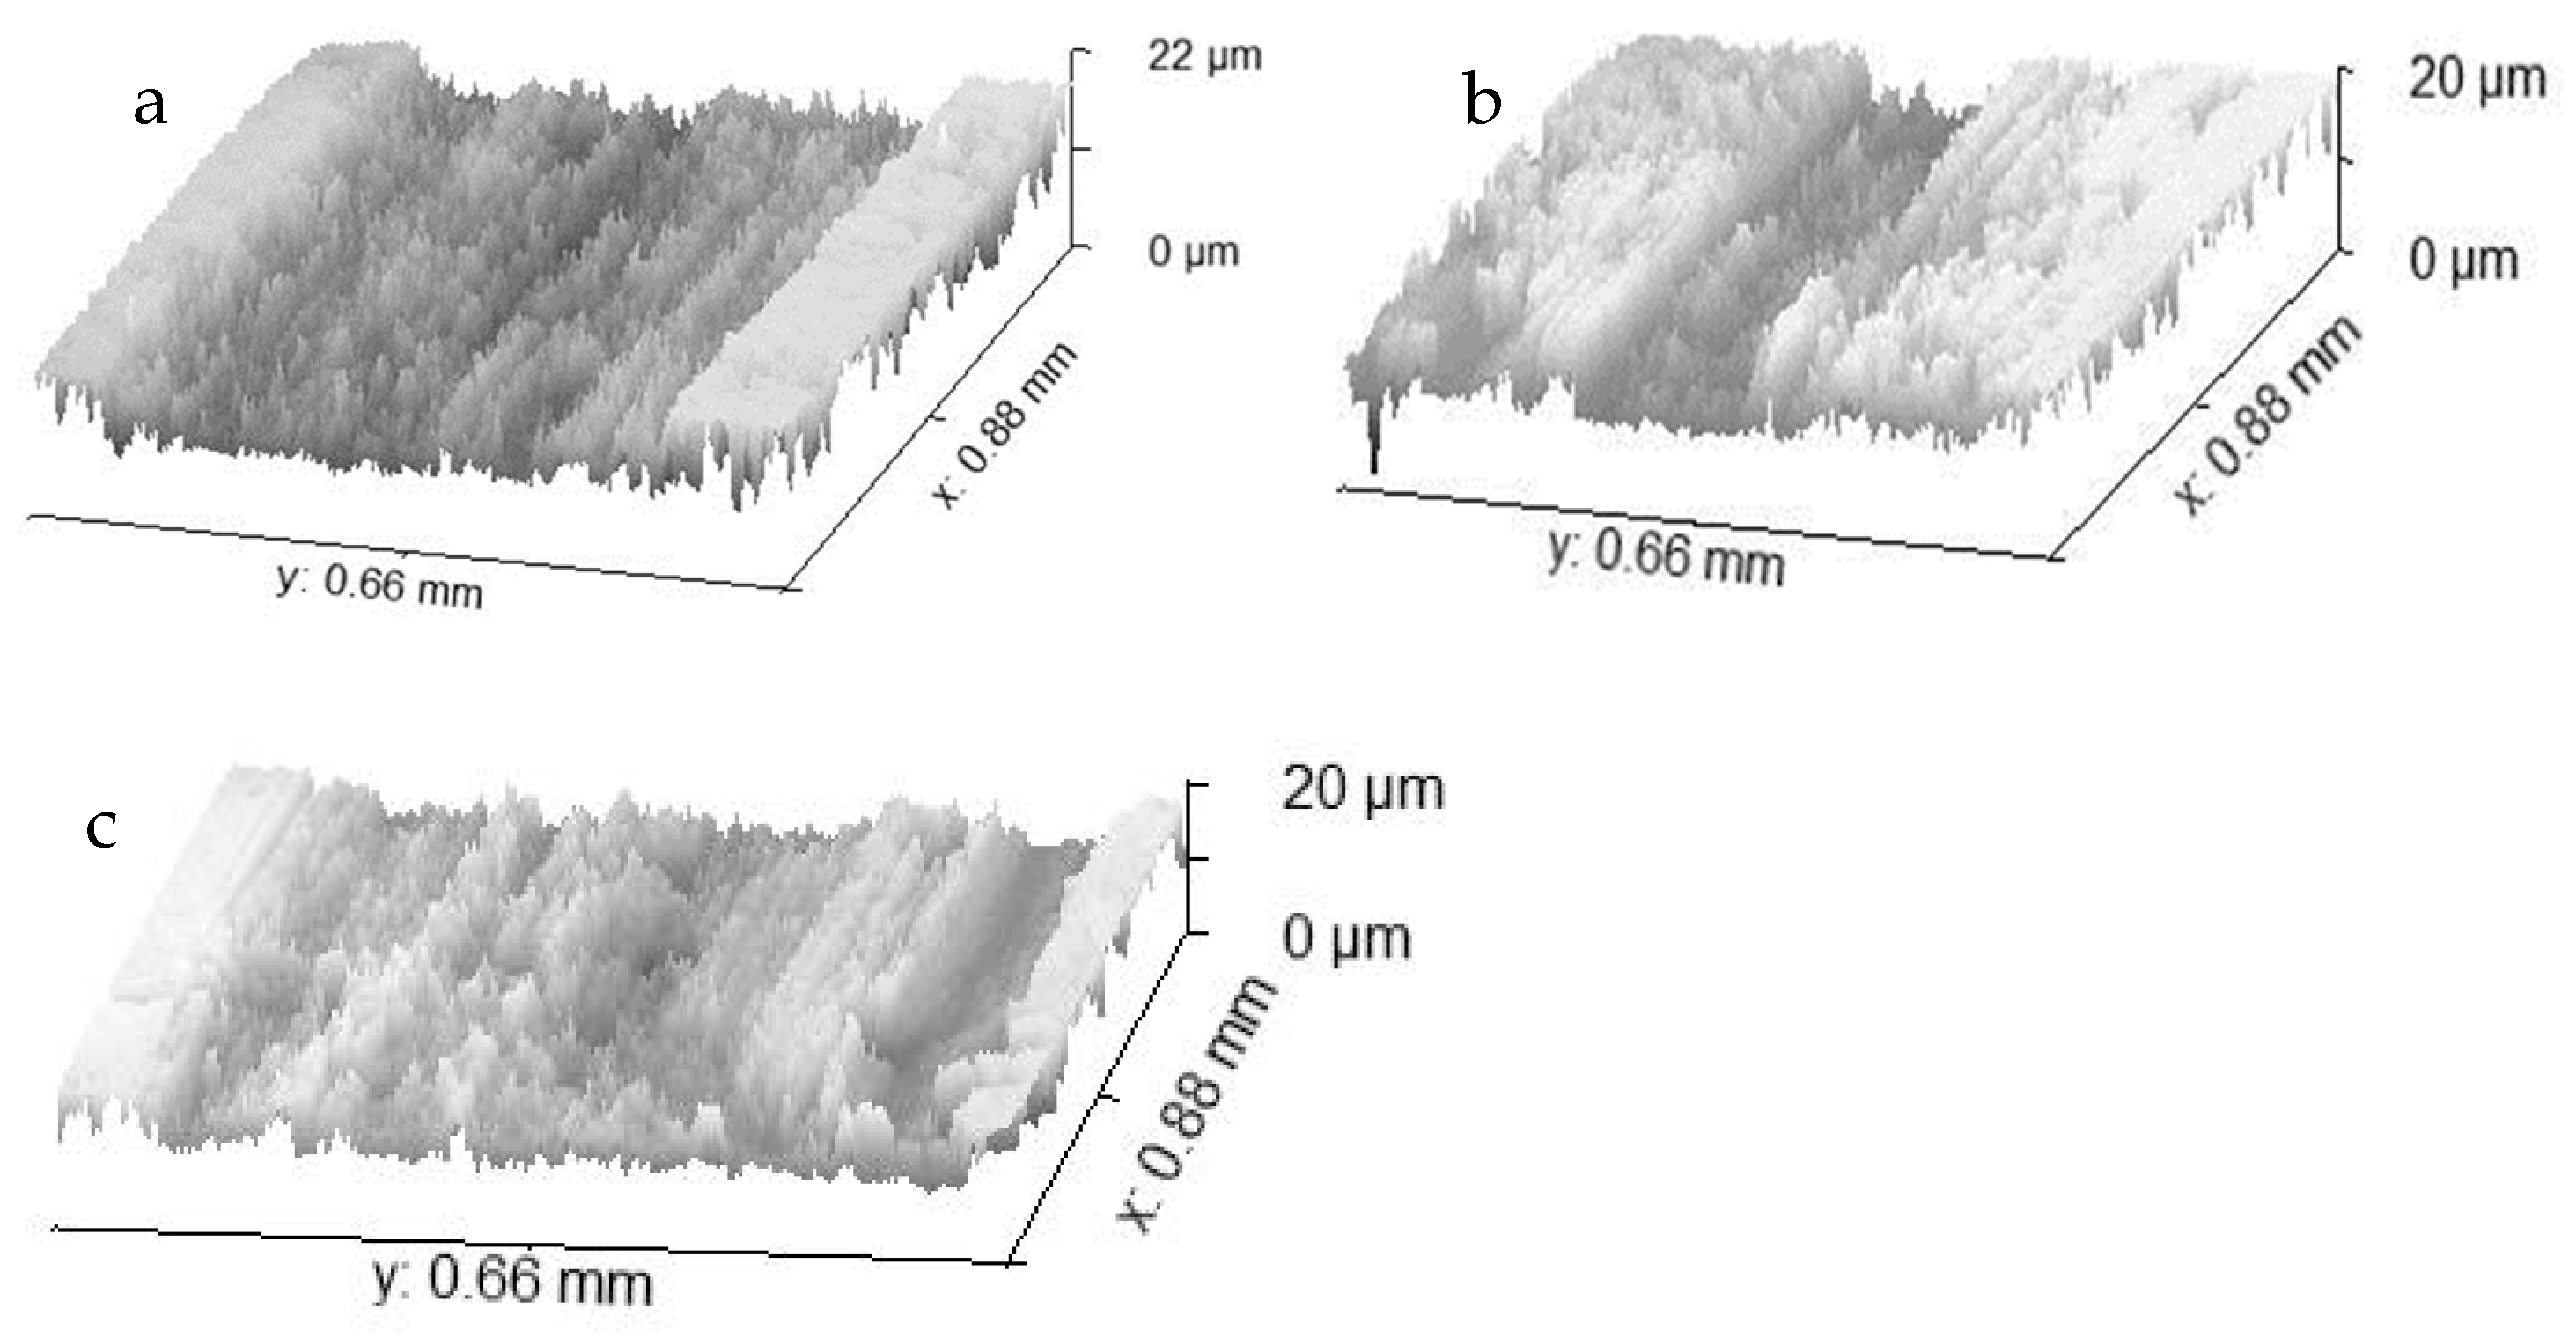
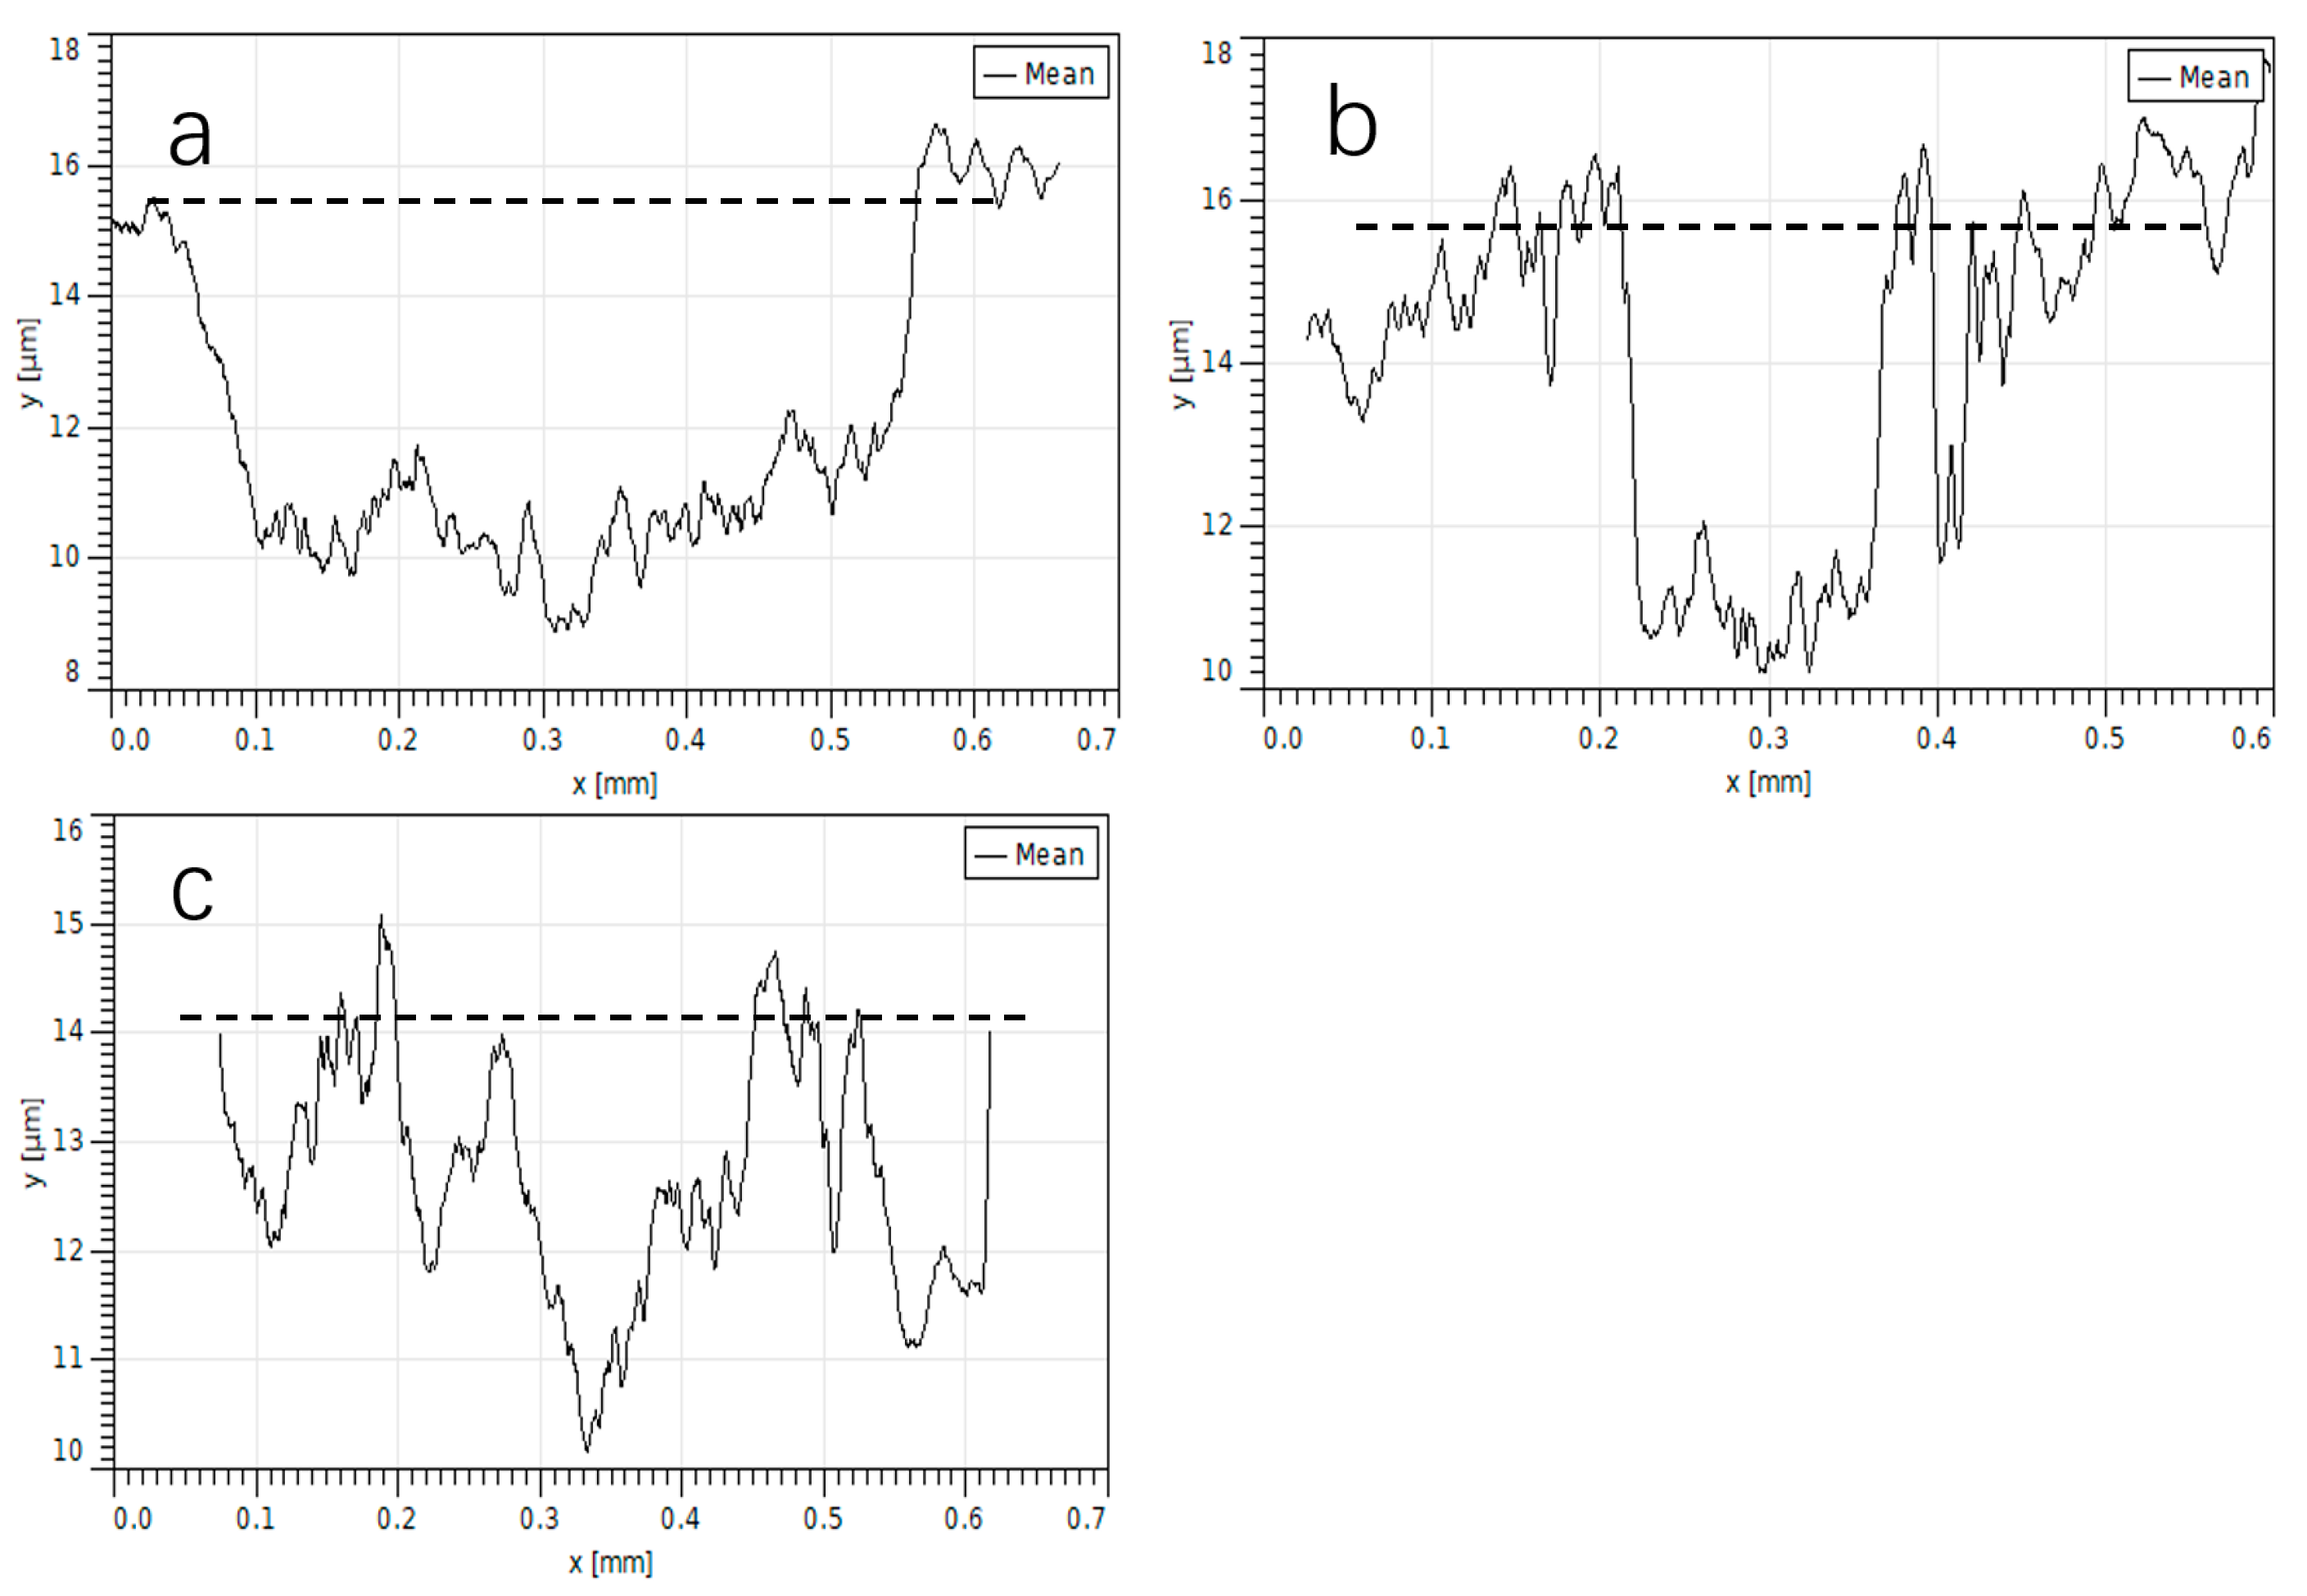
The optical profiler was used to collect the surface information of the sample after the friction test, and the results shown in Figure 4 were obtained. Each x-point on the profile corresponded to a roughness curve in the y-direction, and the roughness curve of the entire friction region was obtained by calculating the average of the roughness curves corresponding to all x-points, as shown in Figure 5, the dashed line is a horizontal position auxiliary line.
Combined with the contour data and roughness curve, it is found that the wear depth of Sample 1 is deeper and the wear width is larger, the wear depth of Sample 2 is deeper but the wear width is smaller, and the overall wear width of Sample 3 is larger, but the depth is shallow and the wear marks are undulating. The maximum depth of the scratch on Sample 1 is 7.5 μm, and the minimum depth is 4.3 μm; the maximum depth of the scratch on Sample 2 is 6.6 μm, and the minimum depth is 4.4 μm; the maximum depth of the scratch on Sample 3 is 4.9 μm, and the minimum depth is 2.9 μm. By integrating the depression area of the roughness diagram to characterize the degree of wear, the area of Sample 1 is 2964 μm2, the area of Sample 2 is 1580 μm2, and the area of Sample 3 is 1502 μm2. From the wear results, it can be seen that the wear of Sample 1 is the most serious, and the wear of Samples 2 and 3 is light.
Based on the friction coefficient curves (Figure 3) and wear morphology (Figure 4), the dominant wear mechanisms of the three samples are clarified as follows: For the high-MoS2 Fe-C-Mo-Cu-S alloy (Sample 1), severe abrasive wear dominates, as the coarse MoS2-rich phases in the microstructure easily detach during friction to form third-body abrasive particles that scratch the sample surface—this leads to its highest friction coefficient (0.5) and wear area (2964 μm2); for the low-MoS2 Fe-C-Mo-Cu-S alloy (Sample 2), mild abrasive–adhesive composite wear is dominant, where reduced MoS2 content mitigates the formation of abrasive particles but the low Cu content limits lubrication, resulting in slight adhesive wear between the sample and steel ball (reflected in its moderate friction coefficient of 0.25 and wear area of 1580 μm2); for the Mo-free high-C-Cu Fe-C alloy (Sample 3), mild adhesive wear dominates, since the fine pearlite structure enhances matrix hardness to resist surface scratching while the dispersed Cu phase acts as a solid lubricant to reduce direct metal-to-metal contact between the sample and steel ball—this explains its lowest friction coefficient (0.22) and smallest wear area (1502 μm2), consistent with the dominant adhesive wear mechanism of valve guides in service.

3.2. Spectroscopy Analysis

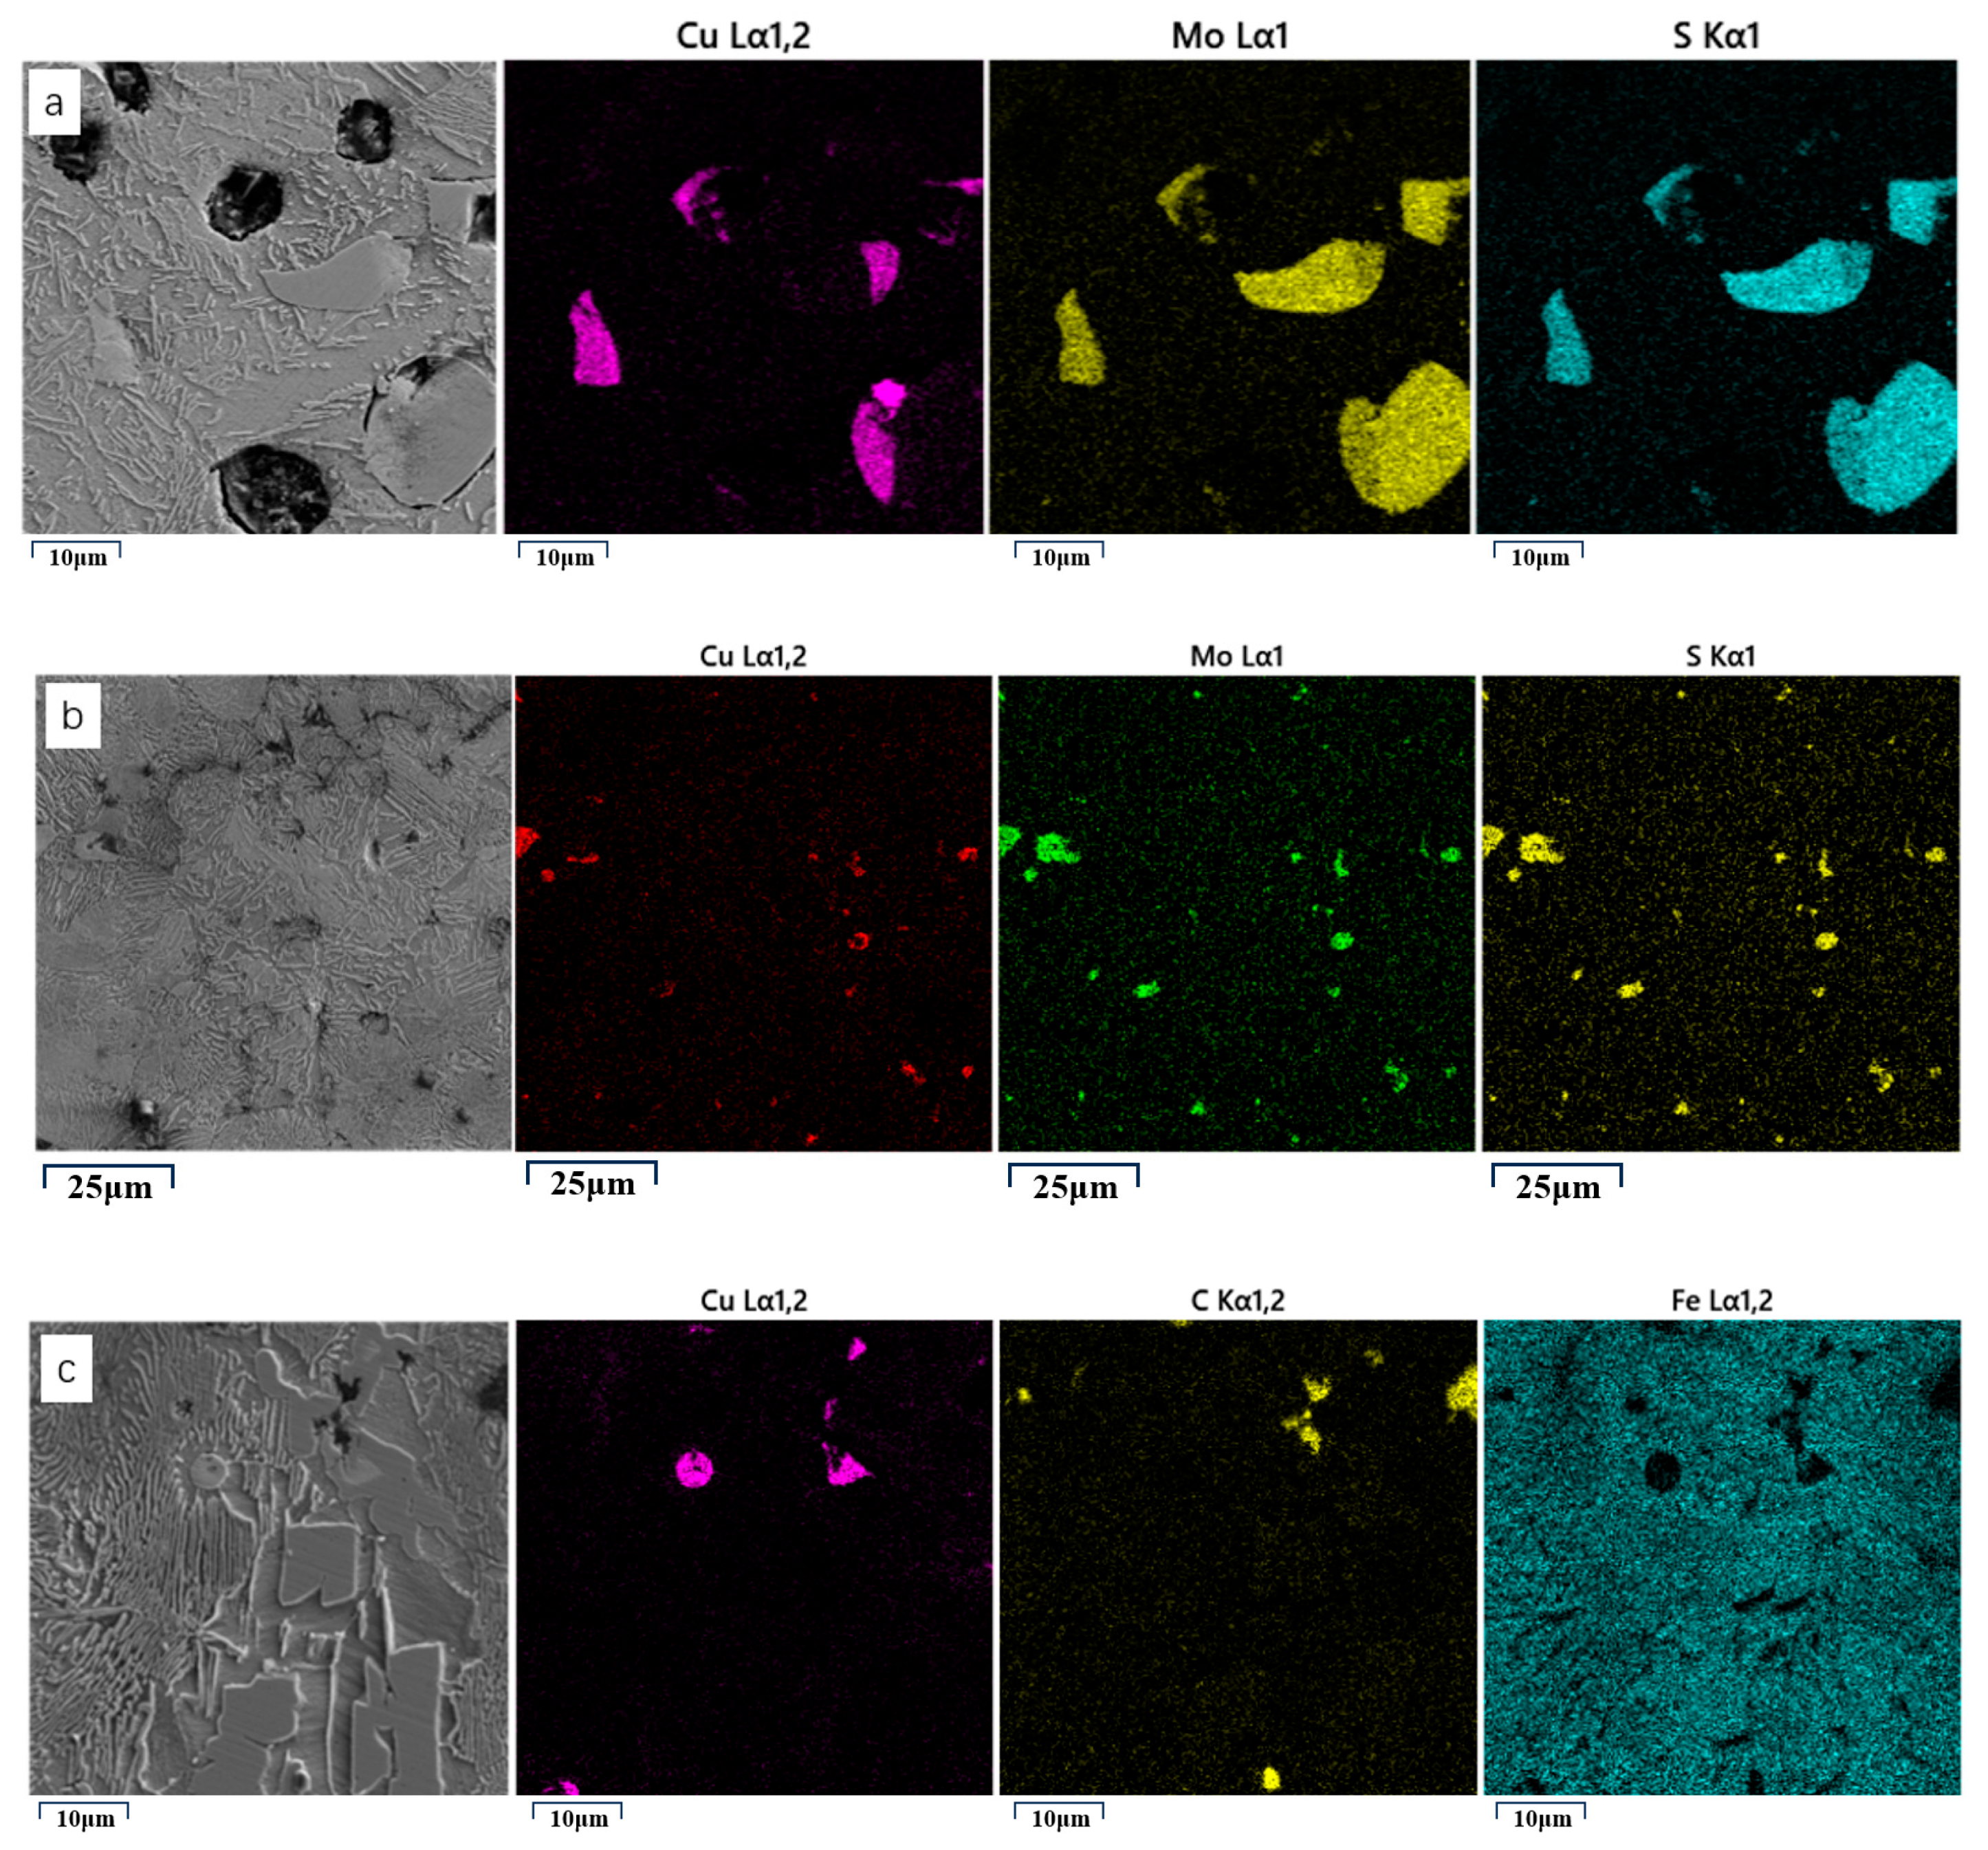
To further clarify the distribution characteristics of alloying elements (and their correlation with microstructure and wear resistance), electron dispersive spectroscopy (EDS) was performed on the three samples. This analysis aims to verify how the dispersion state of key phases (MoS2, Cu) varies with alloy composition—an essential link between composition and wear performance. The EDS results are shown in Figure 6.
As can be seen from the figure, massive MoS2 and Cu distributions are observed in Sample 1 and Sample 2, while Sample 3 is dominated by bulk Cu element distribution; the black area corresponds to C-enriched regions. In terms of alloy type, Samples 1 and 2 belong to the same system (Fe-C-Mo-Cu-S), whereas Sample 3 is a distinct system (Fe-C-Cu). Morphologically, the alloy phases in Sample 1 are coarse, while those in Sample 2 are fine and dispersed; Sample 3 exhibits a fine-dispersed Cu phase. Combined with the previous wear resistance analysis, it is evident that a fine-dispersed alloy phase contributes to better wear resistance compared with a coarse-concentrated alloy phase.

3.3. Microstructure Analysis

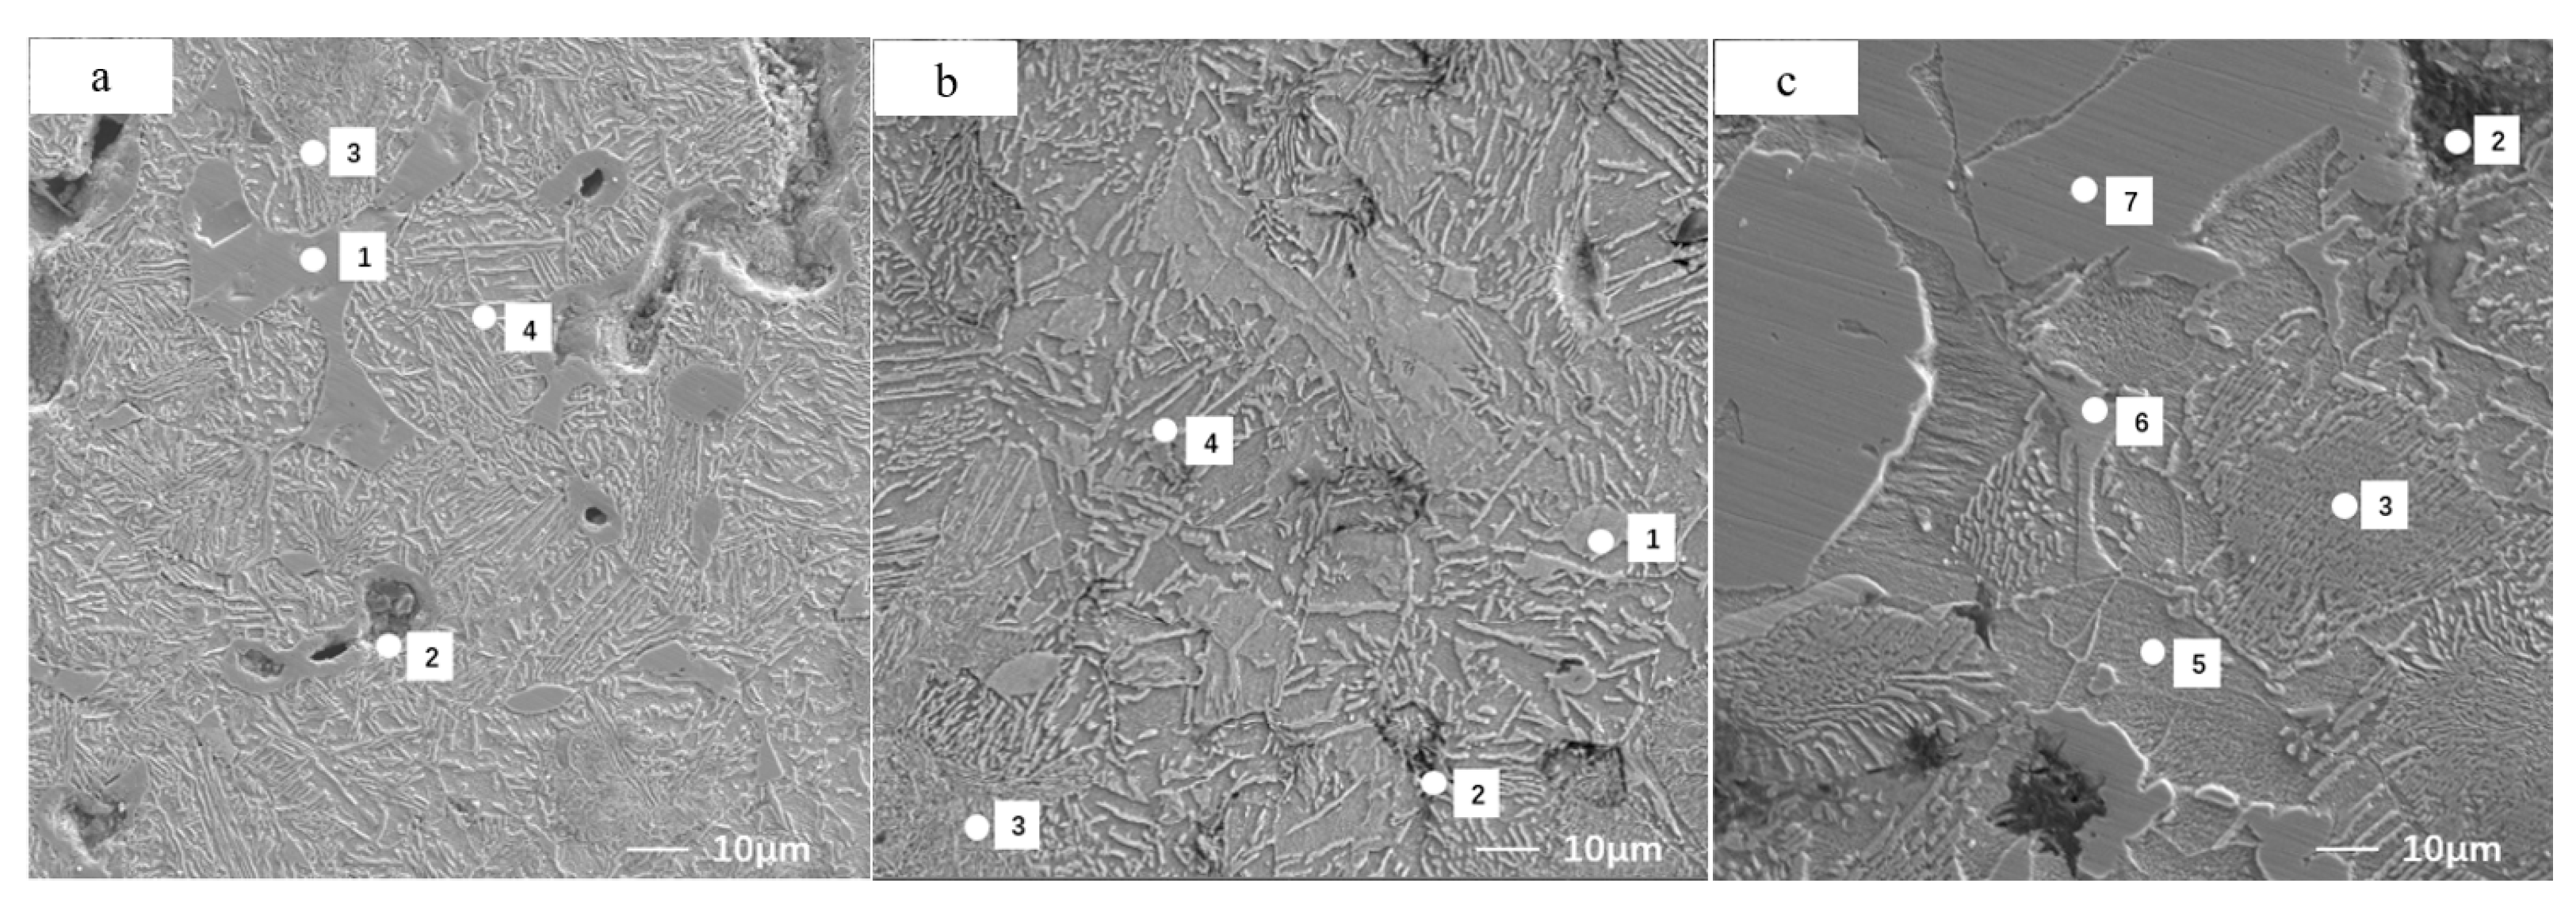
Based on the actual working conditions, since the eccentric grinding phenomenon often occurs in the middle of the catheter, to better study the microstructure of the catheter, the section in the middle of the material is selected, and the section is ground and polished to make the surface smooth and bright. Subsequently, the surface after grinding and polishing was eroded with 4% nitric acid alcohol erosion agent, and the microstructure of the material was observed and analyzed by a scanning electron microscope. This is shown in Figure 7.
From Figure 7, we can see 7 key areas:
Point 1: This is an alloy phase composed of MoS2 and Cu. This alloying phase plays a lubricating role in the material and can effectively reduce friction and wear.
Point 2: This is the porosity in the material. Although these pores influence the strength and stiffness of the material, the porosity can store oil and provide lubrication while the catheter is operating.
Point 3: This is a fine pearlite structure. Pearlite is a material with a highly lamellar structure, and its structure is composed of ferrite and carbide. This fine pearlite structure can improve the strength and hardness of the material.
Point 4: It is an irregular pearlite. The production of this pearlite is due to the Mo produced by the decomposition of MoS2. Since Mo is a strong carbide forming element, it can be dissolved into the iron lattice to form a solid solution, which causes the distortion of the iron lattice. In addition, Mo can also affect the normal diffusion and lattice recombination of Fe and C during pearlite transformation, resulting in the formation of non-lamellar irregular pearlite [23,24,25].
Point 5: Ferrite is a gap solid solution of carbon dissolved in α-Fe.
Point 6: For the Cu phase, the addition of Cu can be used as a solid solution with Fe to improve the strength of the material, and the wear resistance of the material can be improved because it is softer.
Point 7: The cementite has a high C content and a high hardness, which can improve the wear resistance of the material.
Regarding the microstructure, Sample 1 (high-MoS2 alloy) and Sample 2 were similar, but Sample 1 exhibited coarser MoS2-rich alloy phases (Point 1 in Figure 7a) and more irregular pearlite (Point 4 in Figure 7a)—consistent with the tribological results in Section 3.1, these microstructural features are exactly what caused Sample 1 to have the highest friction coefficient (0.5) and severe abrasive wear. In contrast, the alloy phase of Sample 2 was small, and the proportion of pearlite in the tissue was larger; the alloy phase of Cu was only in the structure of Sample 3, and the pearlite sheet in the tissue was fine and normal. According to the microstructure, the matrix of the material is mainly pearlite, and the alloy phase is used as an auxiliary to further improve the wear resistance of the material. Based on the wear resistance results, it can be seen that the matrix structure of Samples 1 and 2 is the same, the type of alloy phase is the same, and the difference is the distribution of alloy phase. The alloy phase of Sample 1 with poor wear resistance is coarse, and the voids in the alloy phase will lead to the grinding of the alloy phase during wear, resulting in abrasive wear and aggravating the wear of the material.

3.4. Porosity Analysis

The catheter material is fabricated via a powder metallurgy process, which inevitably introduces internal pores. When the valve stem moves within the guide, the oil splashed by the valve mechanism alone is insufficient for lubrication—this can easily induce wear. Thus, the material is pre-impregnated with oil to enhance lubrication performance. The presence of pores enables the material to store more oil, which improves both lubricity and lubrication durability [26,27,28,29,30]; theoretically, this oil-storage capacity reduces direct metal-to-metal contact between the tribo-pair, thereby contributing to enhanced adhesive wear resistance.
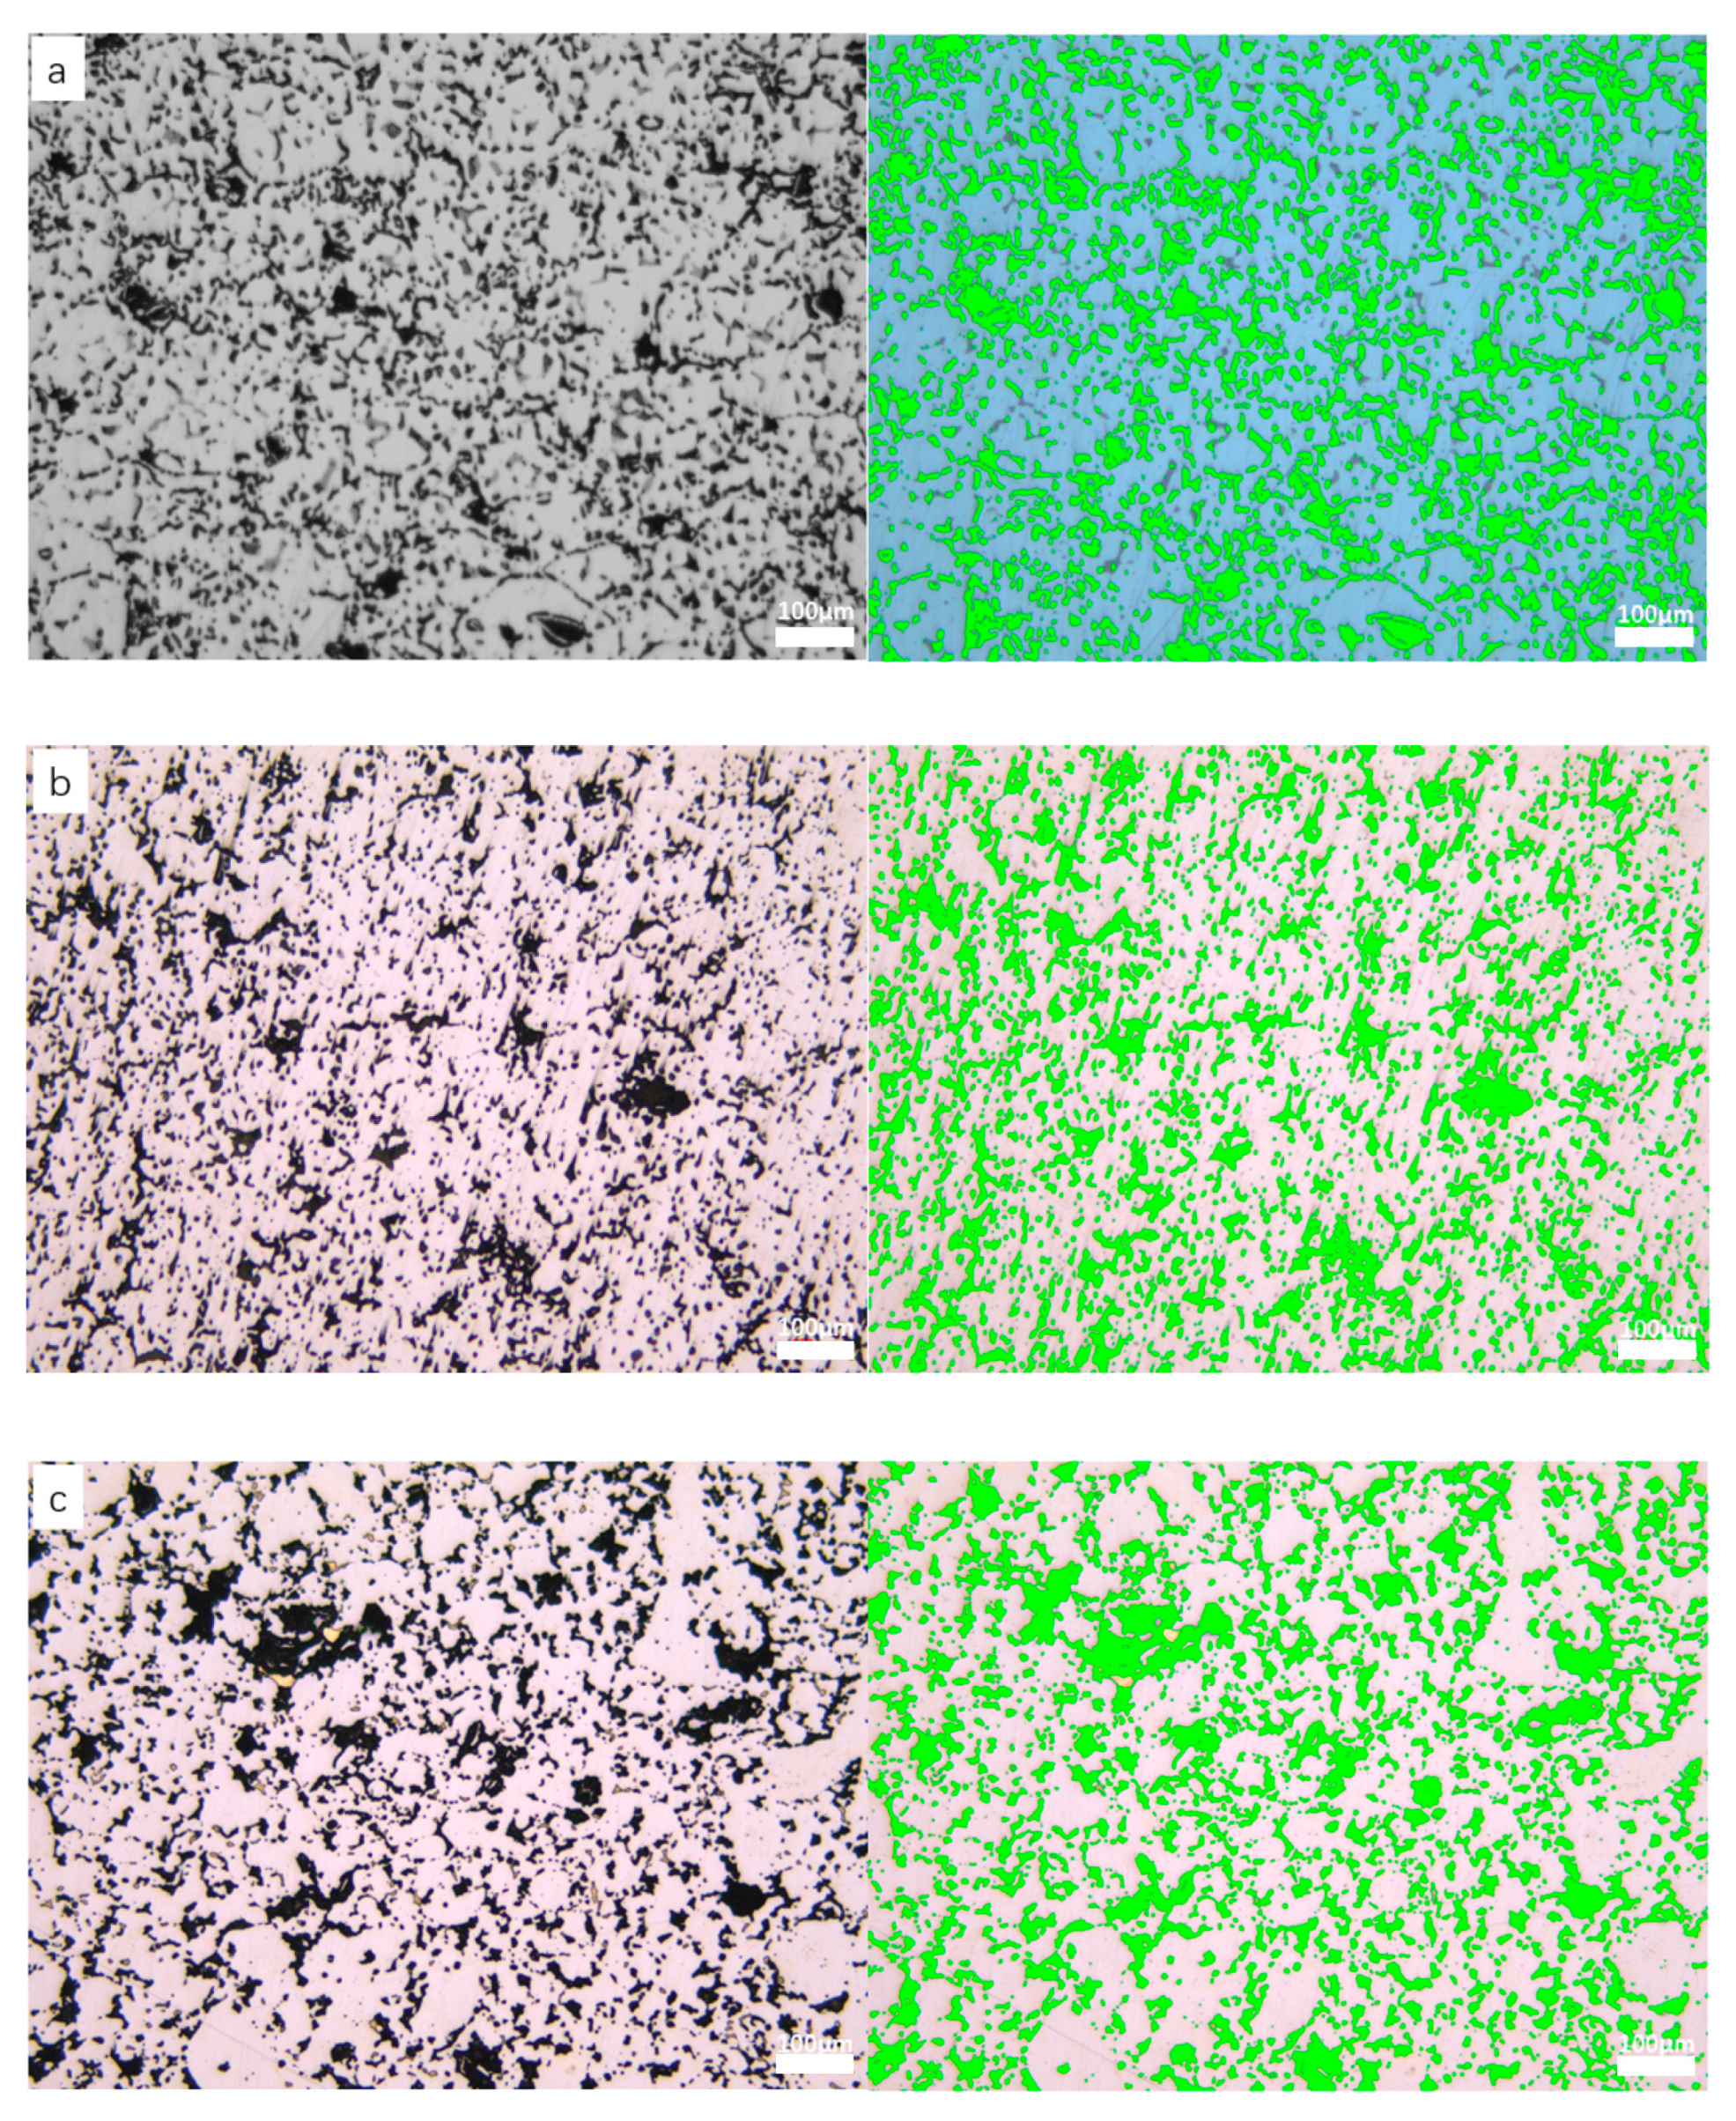
Metallographic observation of the polished samples allows direct visualization of material pores, which appear as black areas in Figure 8. Leica intelligent inverted microscope software (V22.3.8.15) was used for image-based second-phase statistics, enabling pore identification and quantification (green areas in Figure 8 represent software-labeled pores). As shown in Figure 8, all three samples contain pores. Consistent with the aforementioned lubrication mechanism, the presence of these pores allows the catheter material to store oil, which theoretically supports improved adhesive wear resistance.
From the porosity statistics in Table 2, the three samples exhibit minimal porosity differences: Sample 3 has a slightly higher porosity (25.14%) than Sample 1 (23.74%) and Sample 2 (22.99%), with a maximum variation of only ~2.15%. This small difference results in negligible variation in oil-storage capacity. Combined with the wear resistance results, it can be concluded that porosity has little effect on adhesive wear resistance for samples with different compositions and microstructures. This indicates that the material’s wear resistance is primarily governed by its composition and microstructure.
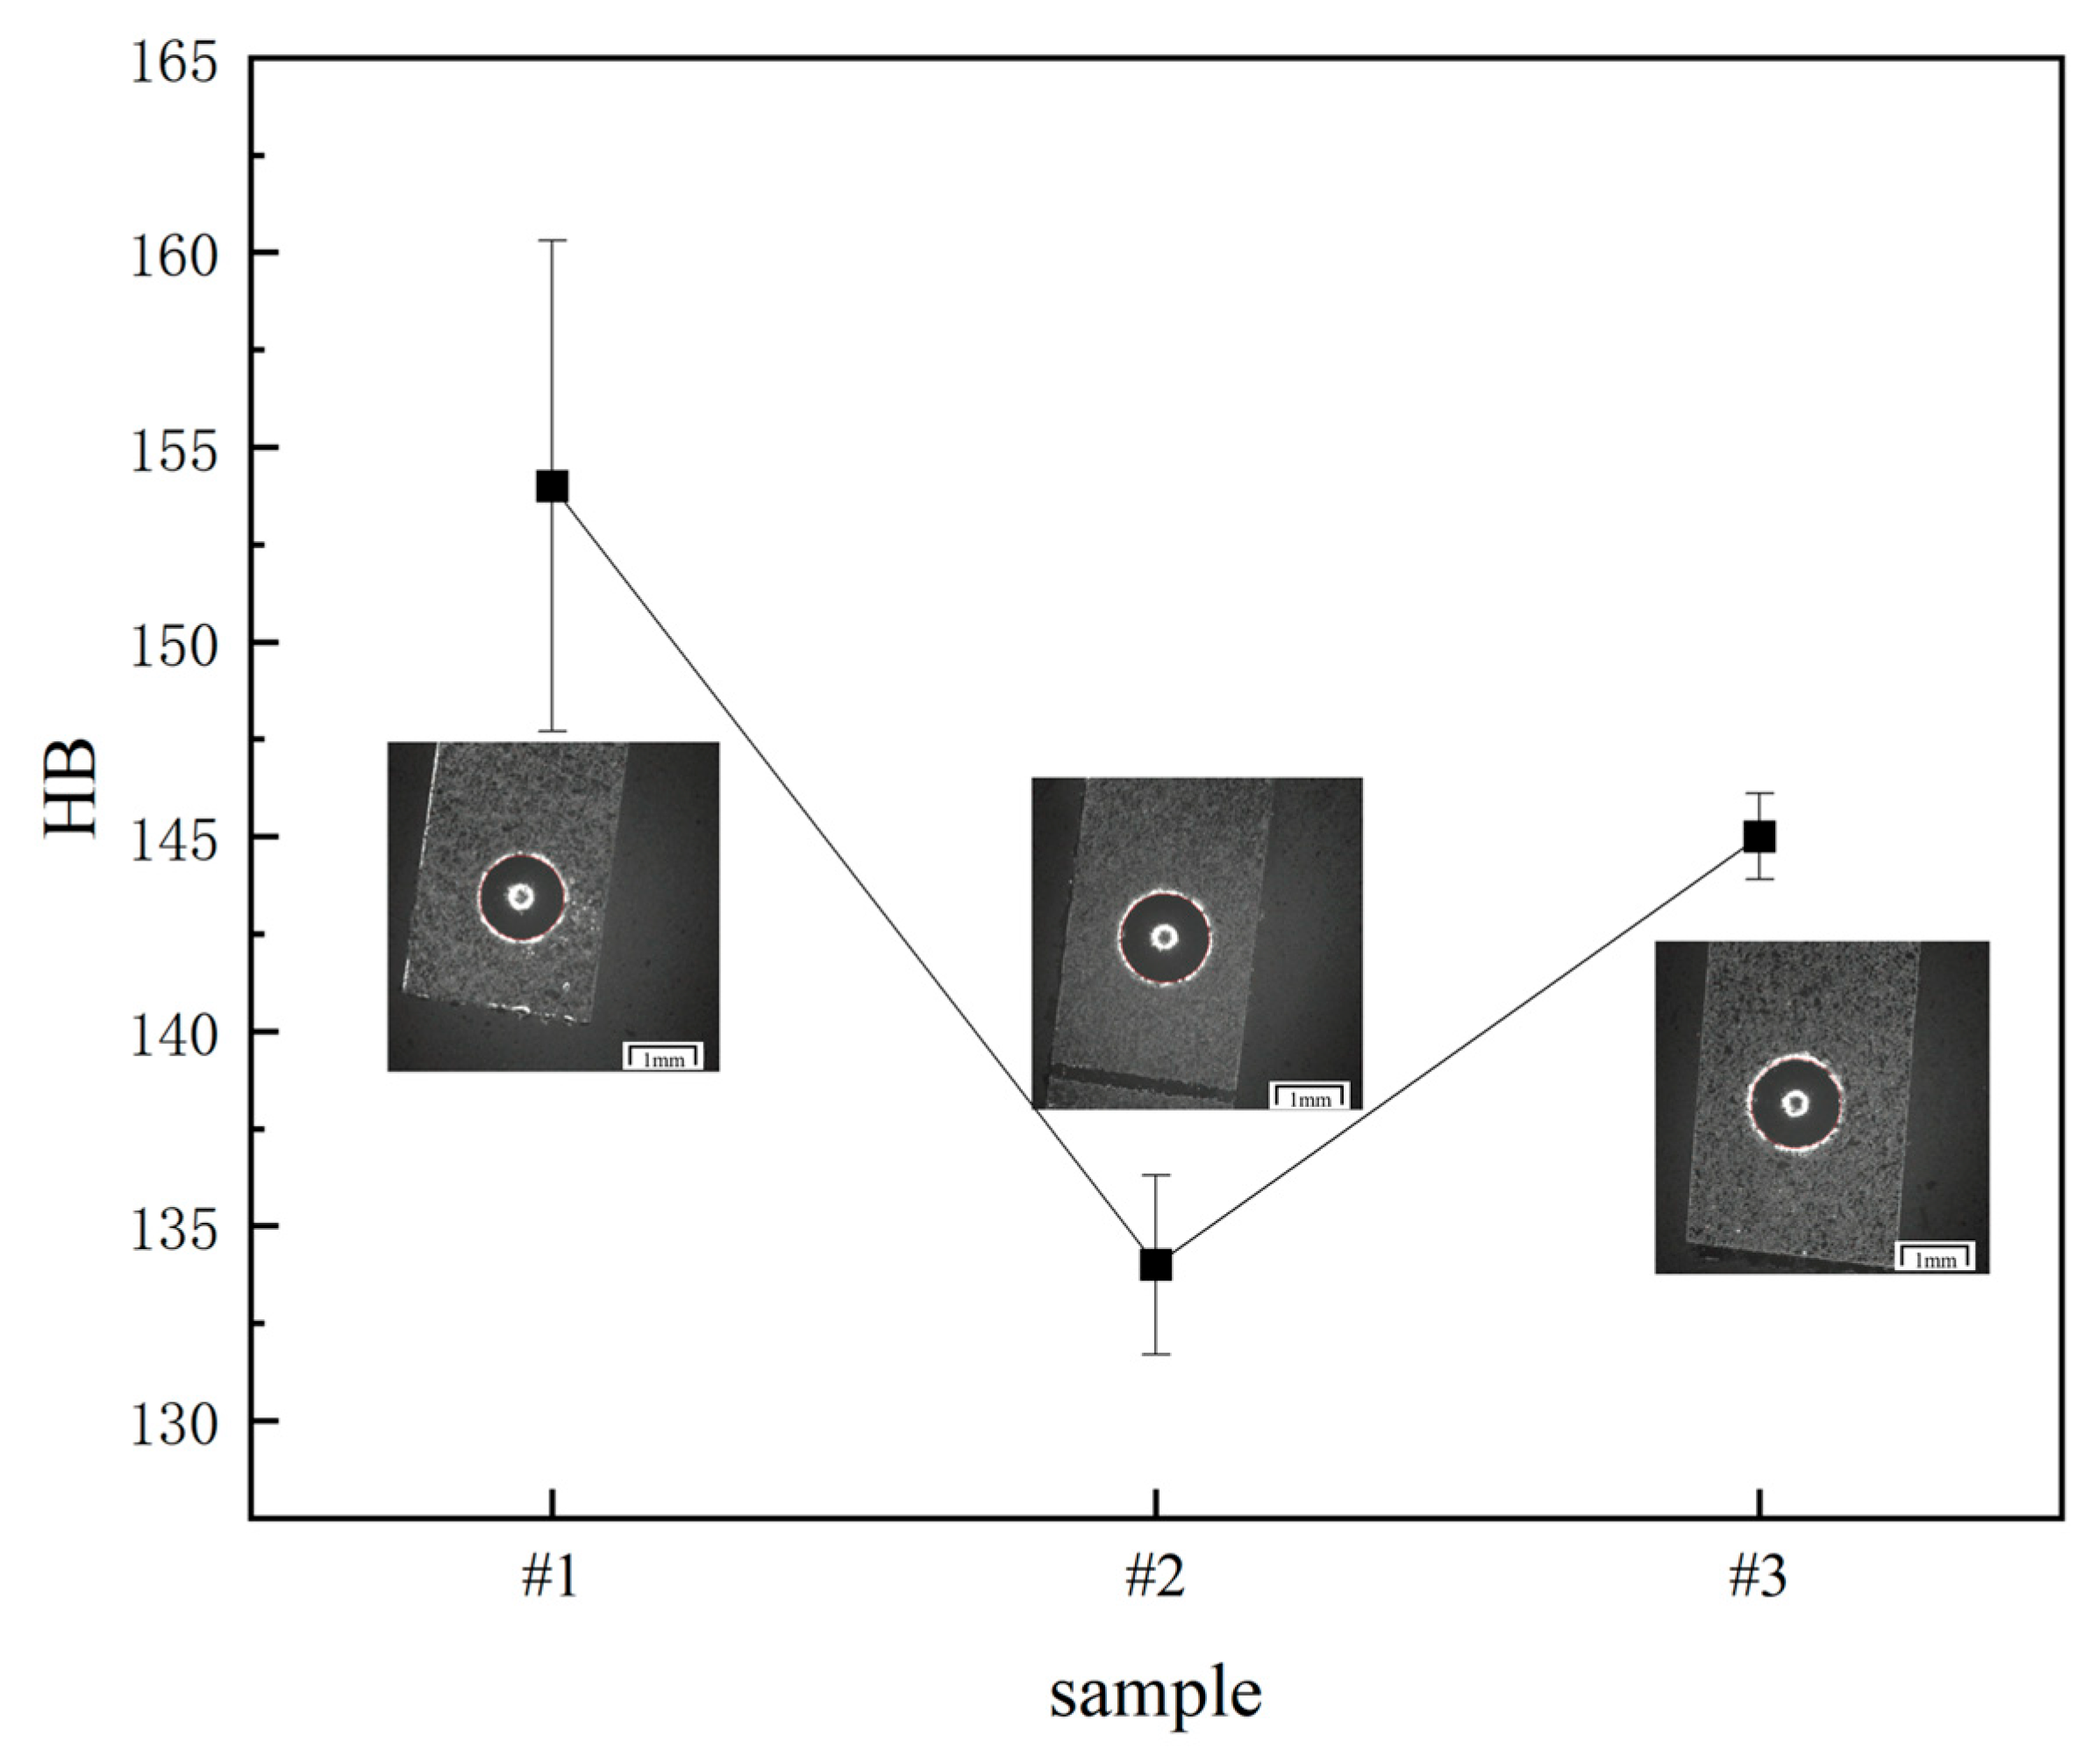
From the hardness distribution in Figure 9, Sample 1 exhibits the highest hardness, followed by Sample 3, with Sample 2 having the lowest. Compositional analysis reveals that the high carbon content in Samples 1 and 3 contributes to their higher matrix hardness. Microstructural analysis further explains that Sample 3 has lower hardness than Sample 1: Sample 3’s matrix contains relatively soft Cu, whereas Sample 1’s matrix includes hard MoS2. Although MoS2 is also present in Sample 2, its content is lower; additionally, Sample 2 has low carbon content, resulting in its lowest overall hardness.
Nanoindentation was used to characterize the hardness of microstructural components, with experimental parameters set to a 5000 μN load; results are shown in Table 3. A Berkovich diamond indenter—commonly used as a standard for nanohardness characterization of microstructural constituents—was adopted, owing to its sharp pyramidal geometry, excellent measurement reproducibility, and ability to ensure consistent contact with microscale phases. For Samples 1 and 2, the MoS2 phase has a hardness of 4.6–7.14 GPa, the matrix hardness is 3.2–3.5 GPa, and the black pores have a hardness of ~50–300 MPa. Sample 3’s matrix has a higher hardness (4.3 GPa) due to its high carbon content, with pores at 170 MPa; it also contains Cu (3.5 GPa) and Fe3C (13.5 GPa).
Notably, the wear resistance correlates with both the hardness and dispersion of hard phases: Sample 2’s MoS2 has a higher hardness of 7.14 GPa than Sample 1’s 4.6 GPa, and it is finer and more uniformly dispersed—this prevents easy detachment and the subsequent formation of abrasive particles, which explains why Sample 2 has better wear resistance than Sample 1. Sample 3 achieves the best wear resistance due to its combination of high matrix hardness of 4.3 GPa, high-hardness Fe3C of 13.5 GPa (which resists surface scratching), and pore-assisted oil storage that mitigates adhesive wear.

4. Conclusions

  • The influence of alloy elements on wear resistance: Research has found that adding MoS2 and Cu can improve the wear resistance of materials. MoS2 provides stable performance in harsh working environments due to its high temperature strength, hardness, and low density; Cu can not only promote the sintering process but can also improve the strength and wear resistance of materials through the formation of solid solutions. Sample 3 did not add MoS2, but it did add a large amount of Cu to improve its wear resistance, while Sample 1 added a large amount of MoS2; however, its wear resistance was worse than that of Sample 2 with a small amount of MoS2 added. Therefore, a reasonable adjustment of the types and contents of alloy elements is the key to improving the wear resist.
  • The influence of microstructure on wear resistance: The microstructure of the three samples is mainly pearlite, and pores and alloy phases of MoS2 and Cu are added to improve the wear resistance of the materials. Comparing the three samples, it was found that the morphology of pearlite has a significant impact on the wear resistance of the material. Sample 3 had finer pearlite layers with better wear resistance, while Samples 1 and 2 had poorer wear resistance due to the addition of MoS2 causing their pearlite layers to widen. The large amount of MoS2 alloy phase in Sample 1 reduces the tightness of the material, making it easy to detach and form abrasive wear during friction, further exacerbating the wear of the material. Although there is not much difference in porosity among the three samples, the presence of pores still has a certain impact on the wear resistance of the material. Pores can store oil and provide lubrication, thereby improving the wear resistance of materials. However, high porosity may reduce material strength and rigidity, which is not conducive to improving wear resistance. Therefore, the porosity should be reasonably controlled in the manufacturing process of powder metallurgy valve guides.
  • Regarding the wear mechanisms of the alloys: Alloy 1 (high MoS2, low Cu) undergoes severe abrasive wear, as its coarse MoS2-rich phases and irregular pearlite easily detach during friction to form abrasive particles that scratch the surface, leading to the highest friction coefficient (0.5) and wear loss (2964 μm2). Alloy 2 (low MoS2, low Cu) experiences mild abrasive wear, where reduced MoS2 mitigates but does not eliminate phase coarsening, and low Cu provides limited lubrication, resulting in a moderate friction coefficient (0.3) and wear loss (1580 μm2). Alloy 3 (no Mo, high C-Cu) exhibits mild adhesive wear, with fine pearlite enhancing matrix hardness (145 HB) to resist scratching, Cu acting as a solid lubricant to reduce metal-to-metal contact, and pores (25.14% porosity) storing oil for further lubrication, thus achieving the lowest friction and wear.
  • Based on the current research results, future work can focus on the following aspects: Further exploration of the influence of different alloy elements and their contents on the wear resistance of materials in order to find the best alloy element combination and content so as to maximize the wear resistance of materials. By adjusting the preparation process and heat treatment conditions, such as refining the pearlite layer and controlling the porosity and the distribution of alloy phase, the microstructure of the material can be optimized so as to improve the wear resistance and comprehensive properties of the material. The optimized material can then be applied to actual working conditions for long-term wear resistance testing and performance evaluation in order to verify its feasibility and reliability in practical applications.

Author Contributions

Conceptualization, P.Z.; Methodology, W.L.; Software, Z.Y.; Writing—original draft, F.G.; Writing—review & editing, G.S.; Supervision, G.L. All authors have read and agreed to the published version of the manuscript.

Funding

This work is financially supported by the Key Industry Talent Revitalization Project of Alloy Materials and Hardware Knife and Scissors in Yangjiang, grant number RCZX2024023, RCZX2023012 and the Scientific Research Start-up Project of Guangdong Ocean University 360302032201.

Data Availability Statement

The original contributions presented in this study are included in the article. Further inquiries can be directed to the corresponding authors.

Conflicts of Interest

The authors declare no conflicts of interest. No financial or non-financial competing interests exist among the authors that could influence the design, execution, analysis, or interpretation of the research presented in this manuscript.

References

  1. Ramakrishnan, P. Automotive applications of powder metallurgy. In Advances in Powder Metallurgy; Elsevier: Amsterdam, The Netherlands, 2013; pp. 493–519. [Google Scholar]
  2. Zhang, X.; Xuan, T.; Dai, Z.; Yuan, C. Analysis of Unbalanced Wear Failure of Exhaust Valve Ducts in Automotive Engines. Hot Process. Technol. 2016, 45, 255–258. [Google Scholar]
  3. Liu, J.; Xuan, T.; Dai, Z.; Yuan, C. Research on sintering temperature of iron-based powder metallurgy valve guide. Powder Metall. Ind. 2014, 24, 37–41. [Google Scholar]
  4. Li, X.; Fang, M.; Pei, X.; Hua, J. Research on Powder Metallurgy Valve Guide Materials. Automot. Parts 2022, 5, 30–35. [Google Scholar]
  5. Endoh, H.; Di, Y. Powder metallurgy valve guides for internal combustion engines. Automot. Engine 1982, 6, 50–55. [Google Scholar]
  6. Li, C. Research on Common Defects of Engine Valve Stem and Valve Guide. Agric. Dev. Equip. 2007, 8, 44. [Google Scholar]
  7. Qi, Y. Common damage forms and repairs of valves. Agric. Mach. Use Maint. 2013, 6, 72. [Google Scholar]
  8. Qu, S.; Xia, W.; Han, L. Wear and sealing characteristics of engine valve guide. Chin. J. Mech. Eng. 2005, 3, 18. [Google Scholar] [CrossRef]
  9. Fujiki, A. Present state and future prospects of powder metallurgy parts for automotive applications. Mater. Chem. Phys. 2001, 67, 298–306. [Google Scholar] [CrossRef]
  10. Lei, Q.; Chen, W.; Yan, J. Failure analysis and improvement application evaluation of a certain model of valve guide. Foreign Intern. Combust. Engines 2020, 3, 76–79. [Google Scholar]
  11. Zhong, W. Homemade Valve Guide for 280/285 Diesel Engine. Railw. Locomot. Electr. Veh. 2007, 5, 27–28+50. [Google Scholar]
  12. Chikahata, K.; Hayashi, K. Development of Sintered Valve Guide Material with Improved Machinability; SAE: Warrendale, PA, USA, 2002. [Google Scholar]
  13. Qian, Z.; Sheng, W. The influence of graphite content on the microstructure and properties of iron-based powder metallurgy oil containing friction reducing materials. Locomot. Roll. Stock. Technol. 2003, 4, 11–14. [Google Scholar]
  14. Lv, W.; Wang, T.; Hua, J. The effect of adding Cu3P on the microstructure and mechanical properties of iron-based powder metallurgy valve guide materials. Powder Metall. Ind. 2023, 33, 81–87. [Google Scholar]
  15. Peng, Y.; Wu, H.; Yi, J.; Li, L.; Liang, C. The Effect of C Content on the Properties of Fe-Cu-C Alloy. Met. Mater. Metall. Eng. 2007, 6, 15–18. [Google Scholar]
  16. Qin, Q.; Wang, T. Effect of mo content on the microstructure and properties of powder metallurgy iron based friction materials. J. Phys. Conf. Ser. 2024, 2760, 012071. [Google Scholar] [CrossRef]
  17. Feng, D.; Liu, W.; Xue, Q. The lubrication mechanism of cerium dithiomolybdate from room temperature to 600 °C. Mater. Sci. Eng. A 2002, 326, 195–201. [Google Scholar] [CrossRef]
  18. Yin, Y.; Jiao, M.; Yu, J.; Ma, S.; Xie, T.; Zheng, Z. The influence of carbon content and sulfurization treatment on the friction and wear properties of iron-based powder metallurgy materials. China Mech. Eng. 2006, 17, 5. [Google Scholar]
  19. Miao, J. The influence of carbon, copper, and nickel content on the properties and dimensional changes of iron-based powder metallurgy materials. Powder Metall. Ind. 2005, 15, 5. [Google Scholar]
  20. Sudha, G.T.; Stalin, B.; Ravichandran, M.; Balsubramanian, M. Mechanical Properties, Characterization and Wear Behavior of Powder Metallurgy Composites—A Review. Mater. Today Proc. 2020, 22, 2582–2596. [Google Scholar] [CrossRef]
  21. Chowdhury, M.A.; Khalil, M.K.; Nuruzzaman, D.M.; Rahaman, M.L. The effect of sliding speed and normal load on friction and wear property of aluminum. Int. J. Mech. Mechatron. Eng. 2011, 11, 53–57. [Google Scholar]
  22. Yu, C.; Chen, J.; Zhang, Q.; Li, W. Research progress on friction and wear properties of powder metallurgy brake pad. Adv. Mech. Eng. 2022, 14, 16878132221126854. [Google Scholar] [CrossRef]
  23. Xiong, X.; Chen, J.; Yao, P.; Li, J.; Huang, B. The influence of MoS2 on the sintering behavior and mechanical properties of iron-based friction materials. Powder Metall. Technol. 2006, 24, 182–186. [Google Scholar]
  24. Erden, M.A.; Yaşar, N.; Korkmaz, M.E.; Ayvacı, B.; Nimel Sworna Ross, K.; Mia, M. Investigation of microstructure, mechanical and machinability properties of Mo- added steel produced by powder metallurgy method. Int. J. Adv. Manuf. Technol. 2021, 114, 2811–2827. [Google Scholar] [CrossRef]
  25. Chen, J.; Yao, P.; Xiong, X.; Qiao, W. Study on the behavior of MoS2 during the sintering process of iron-based friction materials. Non Met. Miner. 2003, 26, 50–52. [Google Scholar]
  26. Yan, H.; Hu, W.; He, G. Analysis of contact stress on gear tooth surface considering surface roughness. Mech. Des. Res. 2012, 28, 5. [Google Scholar]
  27. Jiang, Z. A control method for porosity of powder metallurgy conduits for automobiles. In Proceedings of the 2017 National Powder Metallurgy Academic Conference, Las Vegas, NE, USA, 13–16 June 2017; Hong Kong Chinese Medicine Association, Education Research Foundation: Hong Kong, China, 2017. [Google Scholar]
  28. Zherdin, A.G.; Podrezov, Y.N.; Firstov, S.A.; Shytka, L.G. Effect of porosity on microplastic deformation of iron base powder materials. Sov. Powder Metall. Met. Ceram. 1989, 28, 579–584.5. [Google Scholar] [CrossRef]
  29. Park, J.; Lee, S.; Kang, S.; Jeon, J.; Lee, S.H.; Kim, H.K.; Choi, H. Complex effects of alloy composition and porosity on the phase transformations and mechanical properties of powder metallurgy steels. Powder Technol. Int. J. Sci. Technol. Wet Dry Part. Syst. 2015, 284, 459–466. [Google Scholar] [CrossRef]
  30. Mutlu, I.; Sugözü, İ.; Keskin, A. The effects of porosity in friction performance of brake pad using waste tire dust. Polímeros 2015, 25, 440–446. [Google Scholar] [CrossRef]
Figure 1. Sample shape diagram. (a) Schematic diagram. (b) Entity diagram.
Metals 15 01301 g001
Figure 2. Schematic diagram of friction experiment.
Metals 15 01301 g002
Figure 3. Friction coefficient curve of different samples.
Metals 15 01301 g003
Figure 4. Friction topography images of different samples. (a) Sample 1. (b) Sample 2. (c) Sample 3.
Metals 15 01301 g004
Figure 5. Roughness curves of different samples. (a) Sample 1. (b) Sample 2. (c) Sample 3.
Metals 15 01301 g005
Figure 6. Energy spectrum surface scanning result diagram. (a) Sample 1. (b) Sample 2. (c) Sample 3.
Metals 15 01301 g006
Figure 7. Microstructure of different samples. (a) Sample 1. (b) Sample 2. (c) Sample 3.
Metals 15 01301 g007
Figure 8. Undamaged metallographic and pore calibration diagrams of different samples. (a) Sample 1. (b) Sample 2. (c) Sample 3.
Metals 15 01301 g008
Figure 9. Brinell hardness of different materials.
Metals 15 01301 g009
Table 1. Chemical composition of the sample (wt.%).
SamplesCMoCuSFe
#11.51.91.51.493.7
#21.20.30.80.297.5
#31.8050.0193.19
Table 2. Statistical results of porosity of different samples.
TrademarkSample 1Sample 2Sample 3
Porosity/%23.7422.9925.14
Table 3. Nanoindentation hardness (HIT) of matrix and second phases in different samples.
SampleHIT (GPa)-MoS2HIT (MPa)-Black PorosityHIT (GPa)-MatrixHIT (GPa)-CuHIT (GPa)-Fe3C
#14.63063.5
#27.1446.83.2
#3 170.64.33.513.5
Disclaimer/Publisher’s Note: The statements, opinions and data contained in all publications are solely those of the individual author(s) and contributor(s) and not of MDPI and/or the editor(s). MDPI and/or the editor(s) disclaim responsibility for any injury to people or property resulting from any ideas, methods, instructions or products referred to in the content.