Article

Research on Arc Characteristics and Microstructure of 6061 Aluminum Alloy Multi-Pulse Composite Arc Welding

1
College of Materials Science and Engineering, Shanghai University of Engineering Science, Shanghai 201620, China
2
School of Materials Science and Engineering, Shanghai Jiao Tong University, Shanghai 200240, China
3
COMAC Shanghai Aircraft Manufacturing Co., Ltd., Shanghai 201324, China
*
Author to whom correspondence should be addressed.
Metals 2025, 15(12), 1294; https://doi.org/10.3390/met15121294
Submission received: 16 October 2025 / Revised: 17 November 2025 / Accepted: 21 November 2025 / Published: 25 November 2025
(This article belongs to the Special Issue Processing, Microstructure and Properties of Aluminium Alloys)

Abstract

To mitigate welding defects and optimize the microstructure of aluminum alloys, this study introduces a multi-pulse hybrid arc welding process. A comparative investigation was carried out between this novel process (AC/DC composite 1 kHz pulsed welding) and conventional methods (AC pulsed, AC/DC pulsed) during wire-fed overlay welding of 6061 aluminum alloy. Analyses were conducted on electrical signals, arc morphology, joint microstructure, and hardness. The results indicate that the AC/DC hybrid 1 kHz pulsed process combines the characteristics of both AC and DC pulsed signals with full-cross-section frequency pulse superposition, thereby optimizing arc welding process control. The frequency pulses induce a magnetoelectric effect, leading to significant arc constriction, which enhances arc energy density and arc pressure. This intensifies the fluid flow in the molten pool and accelerates cooling, thereby suppressing the growth of columnar grains and promoting the formation of fine equiaxed grains and an increased proportion of high-angle grain boundaries. Meanwhile, this process effectively reduces the number, area fraction, and overall porosity, and facilitates the distribution of a large amount of Al–Si eutectic structure along grain boundaries, enhancing the impediment to dislocation motion. The microstructural optimization significantly improves the hardness at the weld center to 73.1 HV, leading to enhanced mechanical properties.

1. Introduction

Due to its light weight and high strength, 6061 aluminum alloy is increasingly widely used with the rapid development of the aerospace and marine engineering industries. However, during the welding process of 6061 aluminum alloy, there are often problems such as hot cracking, joint softening, and porosity in welding defects [1,2,3,4,5]. Nikseresht et al. [6] demonstrated that the strength of 6061 aluminum alloy was improved through precipitation hardening during heat treatment. However, during the welding process, the joint microstructure exhibited varying degrees of phase transformation and softening due to the influence of heat input. Therefore, how to reduce softening phenomena and lower defects should draw people’s attention.
Common welding methods for aluminum alloys include tungsten inert gas welding (TIG) [7], laser welding (LBW) [8], friction stir welding (FSW) [9], gas metal arc welding (MIG) [10], and electron beam welding (EBW) [11]. Laser welding and electron beam welding are limited by high equipment costs, complex structures, and stringent requirements for operational platforms and experimental spaces. Conversely, friction stir welding and gas metal arc welding are more suitable for experimental workpieces with high rigidity and large thickness. Tungsten inert gas welding is widely recognized for its low cost, flexible operation, and stable arc. Moreover, the joints formed are dense, with high joint strength, good plasticity, and the ability to weld aluminum alloy plates ranging from 1 to 20 mm thick [12].
Ye et al. [13] investigated the hybrid AC/DC dual-wave TIG welding of 304 stainless steel, revealing that this technique refines the grain structure within the weld seam, transitioning from columnar to equiaxed crystals. The application of an AC/DC mixed current waveform enhances joint hardness compared to single DC-TIG welding. Guo et al. [14] examined the effects of AC/DC hybrid gas tungsten arc welding (GTAW) on AZ31B magnesium alloy. Their findings indicate that increasing the AC/DC ratio decreases the average grain size in the fusion zone (FZ), with the optimal tensile strength achieved at a 60% AC ratio. Han et al. [15] studied aluminum alloy welding using AC/DC hybrid variable polarity plasma arc (VPPA). They observed that the arc force in AC/DC hybrid VPPA welding was significantly stronger than in typical VPPA, influencing droplet behavior and weld formation.
Wang et al. [16] investigated the high-frequency pulse-assisted square wave AC TIG welding of 6061-T6 aluminum alloy, demonstrating that, compared to conventional AC TIG welding, this method results in more stable arc contraction and smoother transitions between AC positive and negative polarities. The process achieves a penetration depth increase of over 90%, a reduction in welding porosity by 82%, and a refinement of the weld grain size by 37.21%. Furthermore, 1 kHz pulse current improves the strength, hardness, and plasticity of the weld zone by 6.1%, 22.7%, and 50.8%, respectively. Morisada et al. [17] reported that the high-frequency TIG welding method used for A1050 aluminum alloy plates significantly reduced the pore area of the molten pool, decreasing it to less than one-eighth of that found in conventional TIG welds. Meng et al. [18] highlighted that when welding AA2219 aluminum alloy with composite frequency oscillation laser arc, the porosity decreased from 10.7% to 0.7% compared to welding without frequency oscillation. Additionally, the ultimate tensile strength and elongation increased by 12% and 72%, respectively.
Based on the aforementioned findings, it can be concluded that the AC/DC combined waveform heat source signal, in comparison to the conventional AC pulse heat source signal, improves thermal efficiency, promotes grain refinement, and effectively suppresses porosity. Additionally, it enhances the overall performance of the joint. Frequency pulse arc welding is influenced by variations in the heat source signal frequency, which generates a “magnetoelectric effect” around the arc and within the molten pool. This effect influences arc contraction and arc pressure, facilitates the “stirring” of the molten pool, and promotes the circulation of molten material [19]. Consequently, these changes impact the transfer direction of the thermal cycle, the cooling rate, and weld formation. The process also aids in the expulsion of pores and the recombination of microstructures, thereby improving the mechanical and tensile properties of the joint. However, research on the TIG welding process utilizing three-pulse AC and DC composite frequency pulses remains insufficient.
Therefore, wire filling and welding experiments were conducted in this study to compare three types of heat source signals: AC pulse, AC/DC pulse, and AC/DC composite 1 kHz pulse. Firstly, by analyzing the waveform of the collected current signal and the changes in arc shape, the influence of the signal and arc on thermal cycling was analyzed. Secondly, the macroscopic forming control of welded joints and the statistical analysis of joint performance were assessed. Finally, the microstructure and internal components of the tissue were analyzed, and the relationship and advantages between the signal heat source of AC/DC composite 1 kHz pulse and the microstructure and performance of the joint were comprehensively analyze. By combining AC/DC pulses with frequency pulses, a new multi-pulse composite welding process called AC/DC composite frequency pulse TIG welding is developed, which improves the flexibility and structural optimization of the welding process, and further enriches the relevant research on arc composite welding technology.

2. Experimental Methods and Materials

2.1. Experimental Materials, Equipment and Processes

The substrate size of the test was a AlMg1SiCu (6061) aluminum alloy T4 state thin plate with a size of 200 mm × 100 mm × 3 mm, and the welding wire was an ER4043 aluminum alloy with a diameter of 1.2 mm. The composition of the 6061-T4 aluminum alloy thin plate and the ER4043 welding wire is shown in Table 1 and Table 2.
Based on the AC/DC composite 1 kHz pulse TIG experiment, wire-filled ER4043 surfacing welding was carried out on the 6061-T4 board. Figure 1 shows the schematic diagram of the experimental system construction, which mainly includes the welding machine power supply of REHM t INVERTIG i 350AC/DC from Blaubeuren, Germany. The welding robot uses the intelligent welding arm of FANUC’s M-10iD/12 (Rochester Hills, MI, USA) and the Fronius-KD 7000 multi-functional automatic wire feeder (Pettenbach, Austria). Before the experimental welding, the substrate was mechanically ground and cleaned with acetone to remove the oxide film and oil stains on the substrate. The tungsten electrode adopts lanthanum tungsten with a diameter of 4.0 mm. When welding, the appropriate tungsten electrode-substrate height and the wire feeding angle of the wire feeding nozzle were ensured.
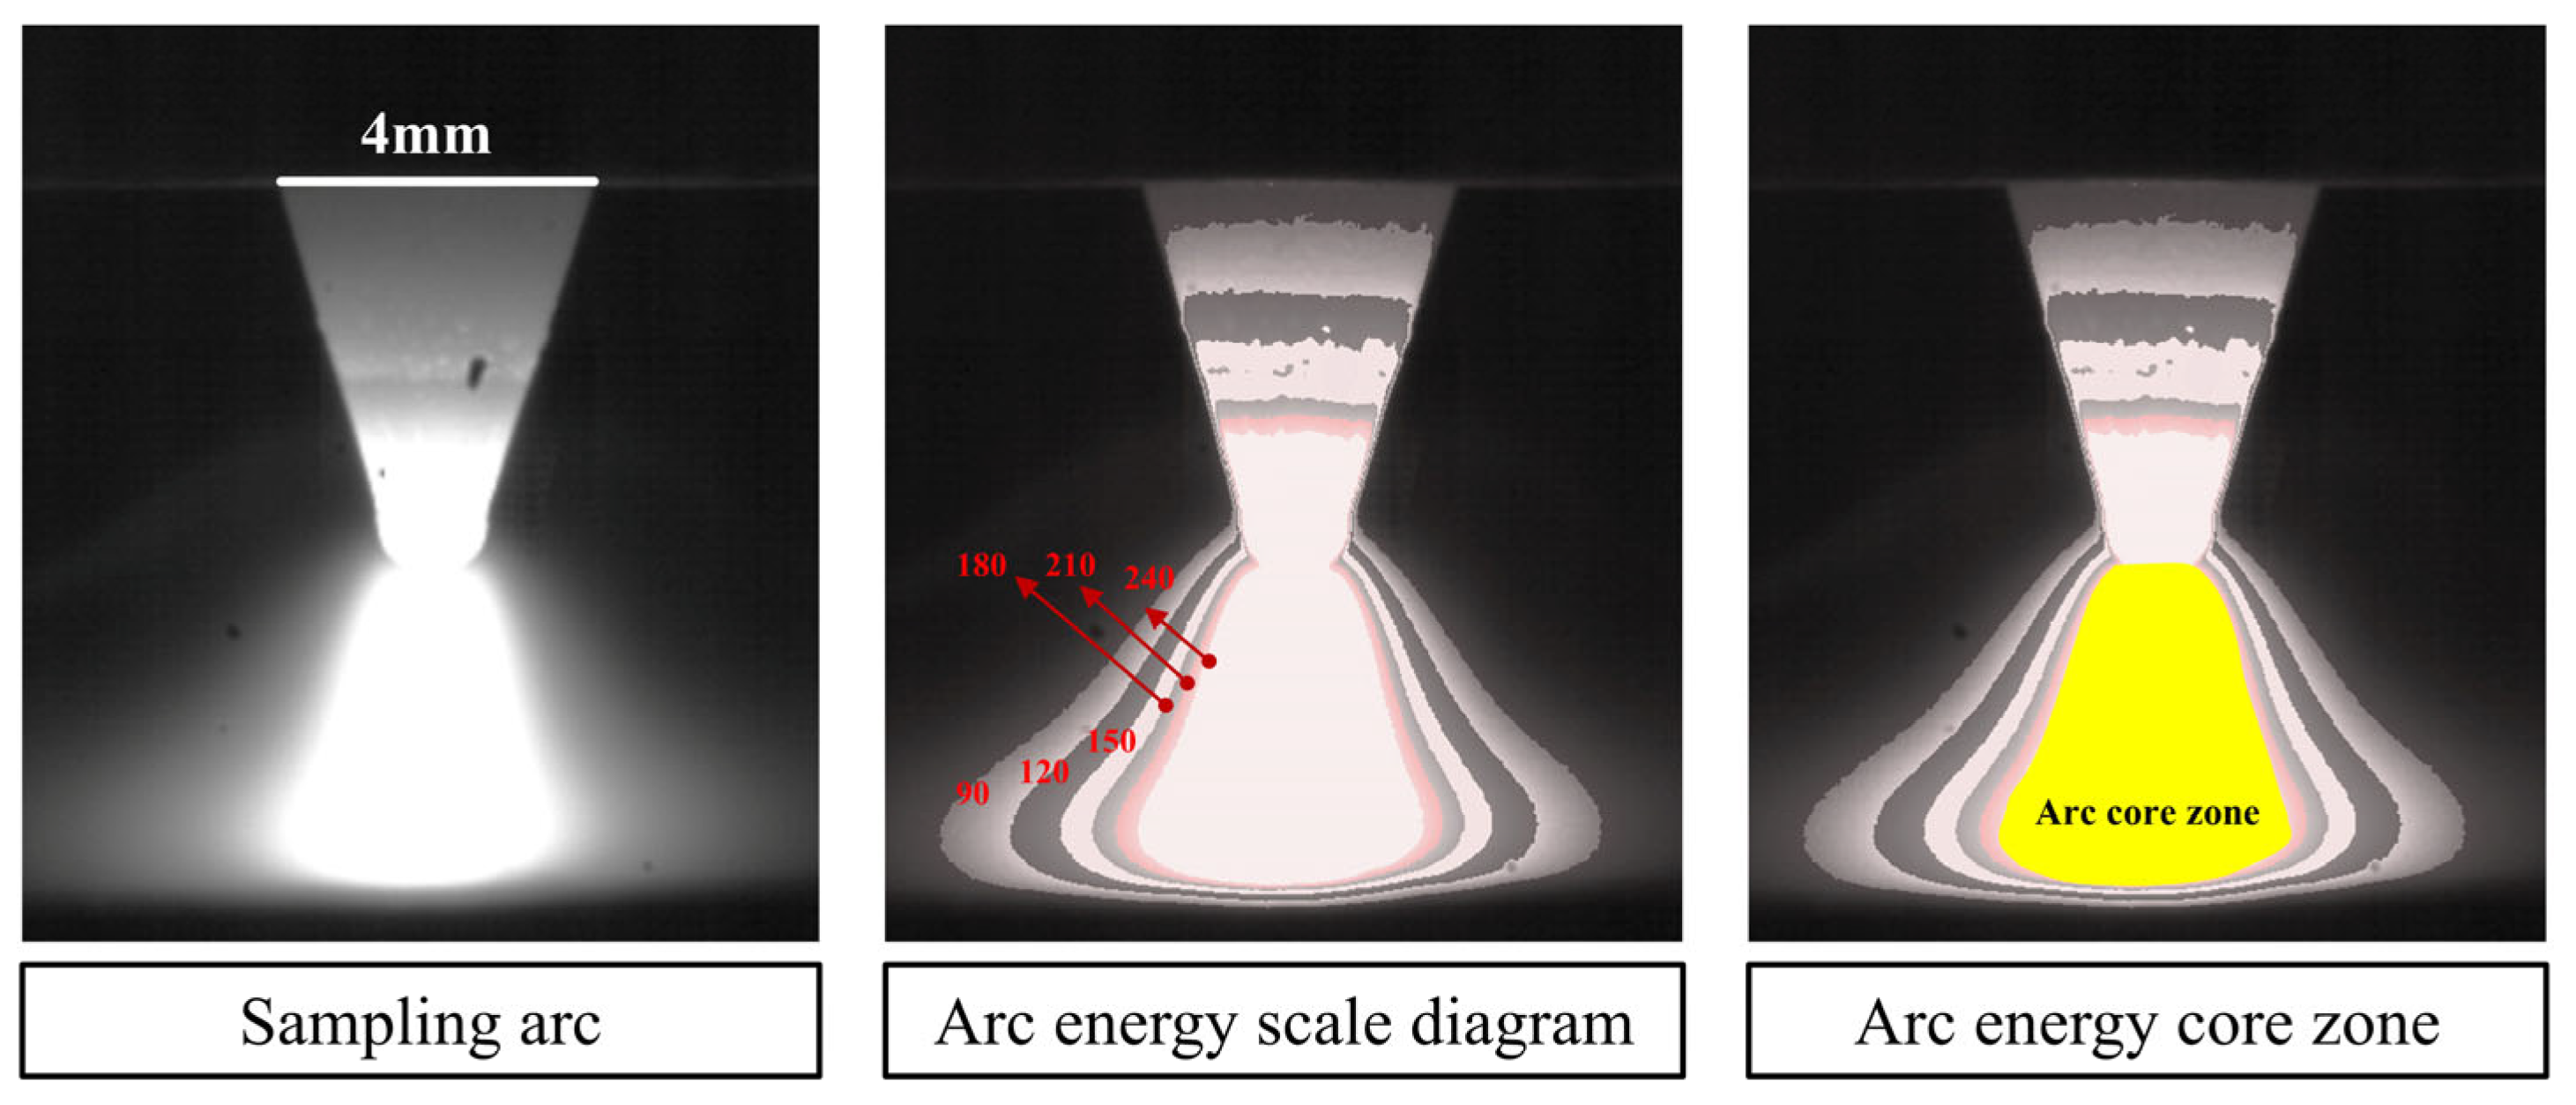
Current sensors and oscilloscopes (DSOX4034A, Keysight Technologies, Santa Rosa, CA, USA) were used to collect waveforms of welding current signals, using a high-speed camera (Phantom VEO 710S, Vision Research, Wayne, NJ, USA) with a sampling rate of 28,000 fps and an exposure time of 1μs to capture the arc contour. When shooting, the camera and welding gun were at the same horizontal line, the lens was focused on the tip of the tungsten electrode, and the tungsten electrode diameter of 4 mm was used as the arc analysis ruler. With the help of image processing software, the arc was stratified in energy levels according to different gray values as shown in Figure 2. Based on the core energy theory, the core area of the arc energy was defined. The gray value of 240 was set as the core area of the arc, and the gray value of 90 was set as the edge area of the arc. The brightness of arc plasma reflects the thermal energy of the arc. According to optical and image processing theories, the light intensity of a region is determined by multiplying the gray value by the area. Arc energy can be expressed as E = G · S (E = arc energy, G = gray value, S = area of the region).
To improve the accuracy of the results, a wire cutting machine was used to cut one sample from each of the front, middle, and back sections of the weld seam for metallographic analysis and hardness testing. The sample was cut at a position perpendicular to the welding direction. The small sample was sanded with SiC sandpaper ranging from 400# to 2000#, then finely polished with a 50 nm SiO2 suspension. The sample was etched with Keller reagent (with a volume ratio of HNO3:HCl:HF: H2O = 2.5:1.5:1:95) for about 15 s. The macroscopic formation and microstructure of the weld seam were analyzed using an optical microscope (OM, VHK-600K, Keyence, Osaka, Japan). A scanning electron microscope (SEM, Hitachi S-3400N, Hitachi, Tokyo, Japan) with built-in EDS spectrometer, working voltage of 15 kV, and working distance of 9.5 mm was used to analyze the microstructure and element distribution of the organization. Electron backscatter diffraction (EBSD, Sigma 500, ZEISS, Oberkochen, Germany) was used to analyze grain size and orientation with an acceleration voltage of 20 kV and a step size of 2 μm; the porosity inside the weld seam was measured using ImageJ 1.53e software.
Figure 3 shows the schematic diagram of hardness testing. According to the ASTM RR-B07-1001 2010 hardness testing standard document [20], the hardness test was conducted using the VHS-1000HVS-1000Z Vickers microhardness tester (Shanghai Taiming Optical Instrument Co., Ltd., Shanghai, China). The load value was 300 gf and the loading time was 15 s. The sampling direction is from the centerline of the weld seam to the base metal area (BM), with a sampling interval of 0.5 mm.

2.2. Signals and Experimental Parameters

The welding pulse signals used in the experiment consisted of AC signals, DC signals and frequency pulse signals. The waveform diagram of the current is shown in Figure 4.
The basic parameters of the welding waveform in Figure 4 are as follows: peak current (Ip), fundamental current (Ib), and effective current of the AC positive half-wave are {Ieff = [ δ Ip2 + (1 − δ )Ib2]1/2}; the positive half-wave time of the AC pulse signal is (tEN), the negative half-wave time of the AC pulse signal is (tEP), and the fundamental action times of the 1 kHz pulse peak are (tpp) and (tpb); the AC waveform signal time is (TAC) and the DC waveform signal time is (TDC), expressing the high-frequency pulse current duty cycle { δ = t pp/(tpp + tpb) = 50%}, the AC current signal duty cycle { θ = t p/(tp + tb) = 50%}, the low-frequency pulse frequency { f 1 = 1/(tp + tb)}, and the 1 kHz pulse frequency { f 2 = 1/(tpp + tpb)}.
Table 3 shows the fixed welding parameters during welding. The process parameters of the experimental groups with different power supply pulse signal methods are shown in Table 4.

3. Results and Discussion

3.1. Welding Process and Forming

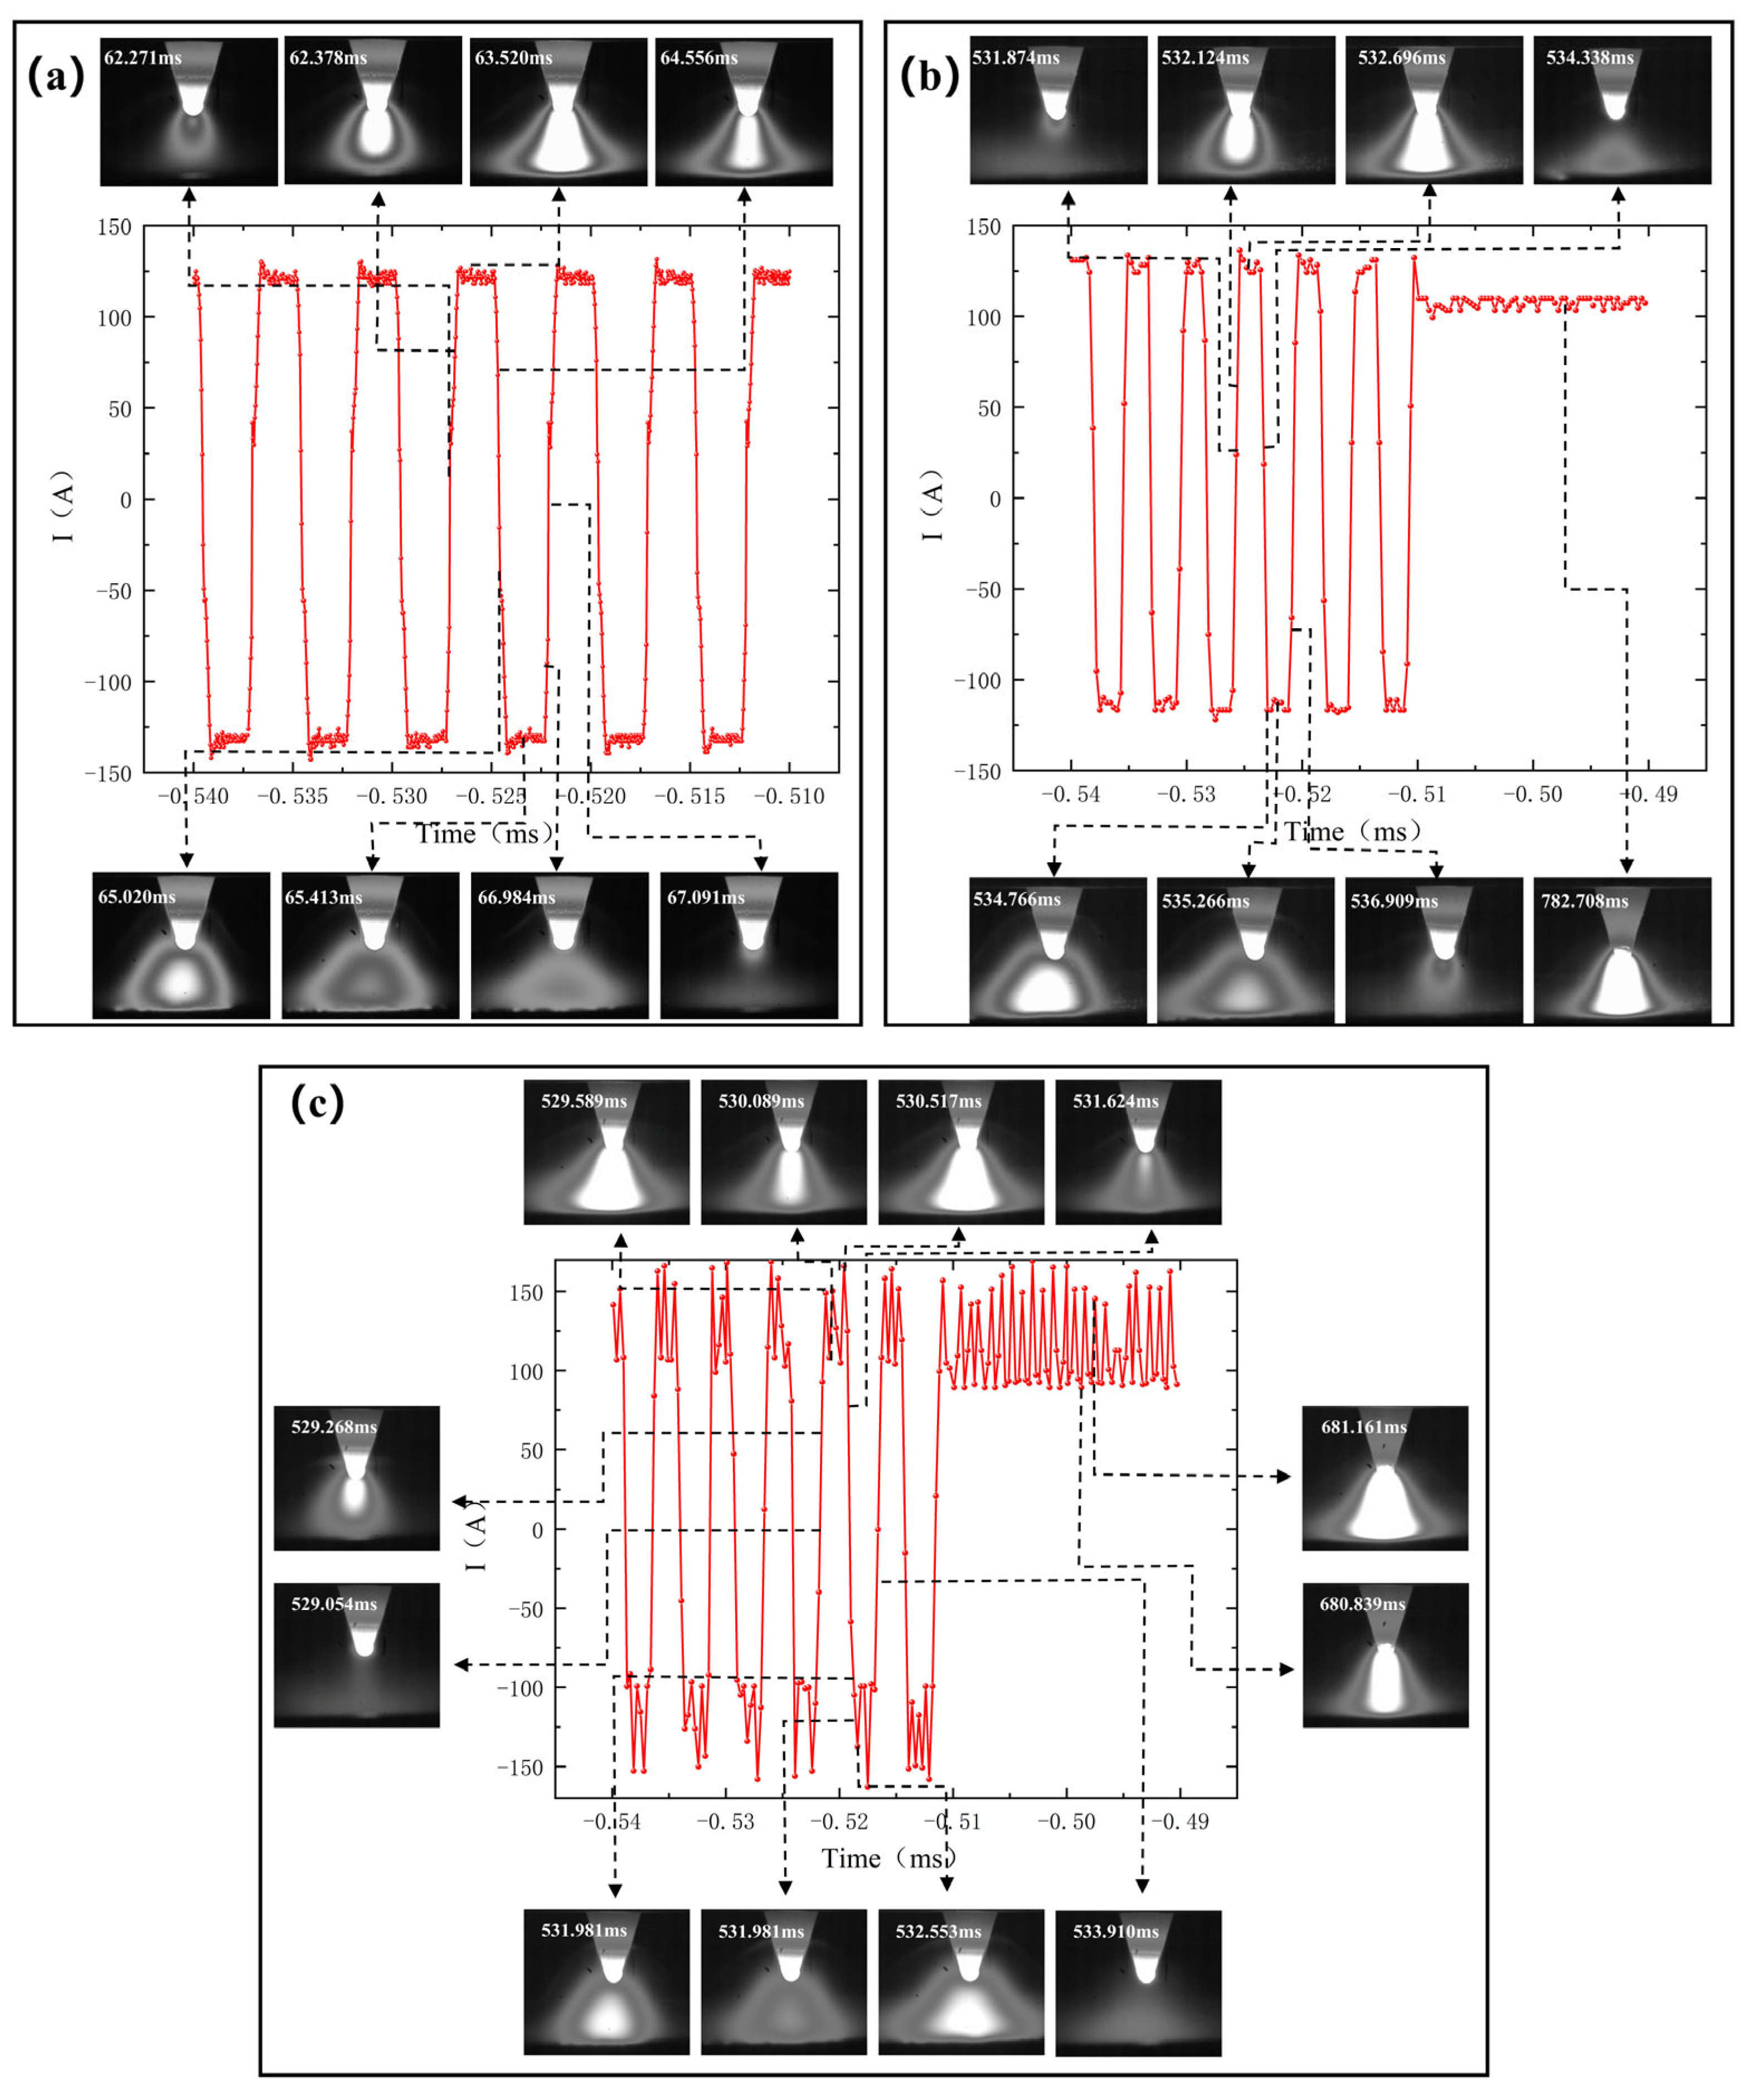
Figure 5 shows the electrical waveforms for (a) an AC pulse, (b) an AC/DC pulse, and (c) an AC/DC composite 1 kHz pulse signal, together with the arc-morphology transitions captured during the AC-band portion of a single cycle for each waveform type. In Figure 5a, the AC pulse arc exhibits distinctive morphology when acting on the base material. During the EN (positive polarity) phase, the arc column appears as a bright, bell-shaped column enveloping the molten pool surface. When switched to the EP (negative polarity) phase, the arc shifts and becomes diffuse—serving mainly to remove the oxide layer, with its lower portion showing a wavy, irregular profile. Brightness decreases significantly in EP, leading to reduced heat input. This reduction mitigates long exposure of the tungsten electrode to high temperature, thereby enhancing its service life [21]. As shown in Figure 5b, introducing a DC component under otherwise equivalent current conditions retains an arc morphology in the AC phase very similar to that of the pure AC pulse. However, in the DC phase of the AC/DC pulse waveform, the arc becomes more concentrated, exhibits higher energy density, and maintains temporal persistence. Compared to the AC pulse alone, the AC/DC pulse delivers greater average heat input to the weld bead and yields an arc that is more focused.
Figure 5c illustrates the electrical waveform of the AC/DC composite 1 kHz pulse TIG welding process, achieved by superimposing a 1 kHz pulse onto the AC/DC pulse signal. This configuration generates a multi-pulse combined heat source waveform. The introduction of the 1 kHz pulse induces waveform distortion, characterized by numerous triangular waveforms across different phases. This distortion results from rapid transitions between peak and base currents due to the pulse frequency.
In the corresponding arc morphology, during the EN (positive polarity) phase at peak current, the high-density region of the arc plasma expands significantly. However, the overall arc contour does not exhibit a noticeable enlargement. The pulsed current variation induces a magnetoelectric effect around the arc column. The resulting Lorentz force exerts an inward compressive force on the plasma, constricting the arc and enhancing its stiffness. At the base current level, the high-density arc column contracts into a cylindrical shape, maintaining arc ignition while accelerating the cooling rate of the molten pool. A similar trend is observed in the EP (negative polarity) phase. The high-density arc region, where plasma is highly concentrated, acts as the core of the arc. According to arc physics principles, the increase in arc brightness and the elevated thermal flux density acting on the molten pool surface generate a thermal impact (arc pressure) on the pool. The variation in arc energy density is positively correlated with the arc pressure exerted on the molten pool surface.
Therefore, the AC/DC composite 1 kHz pulsed heat source causes arc contraction, increasing the heat input to the weld seam. Simultaneously, periodic oscillations in arc pressure form on the molten pool surface, influencing the growth of the weld’s internal microstructure. The alternating arc contraction and transformation disrupt the stability of heat accumulation in the molten pool, thereby accelerating its cooling rate.
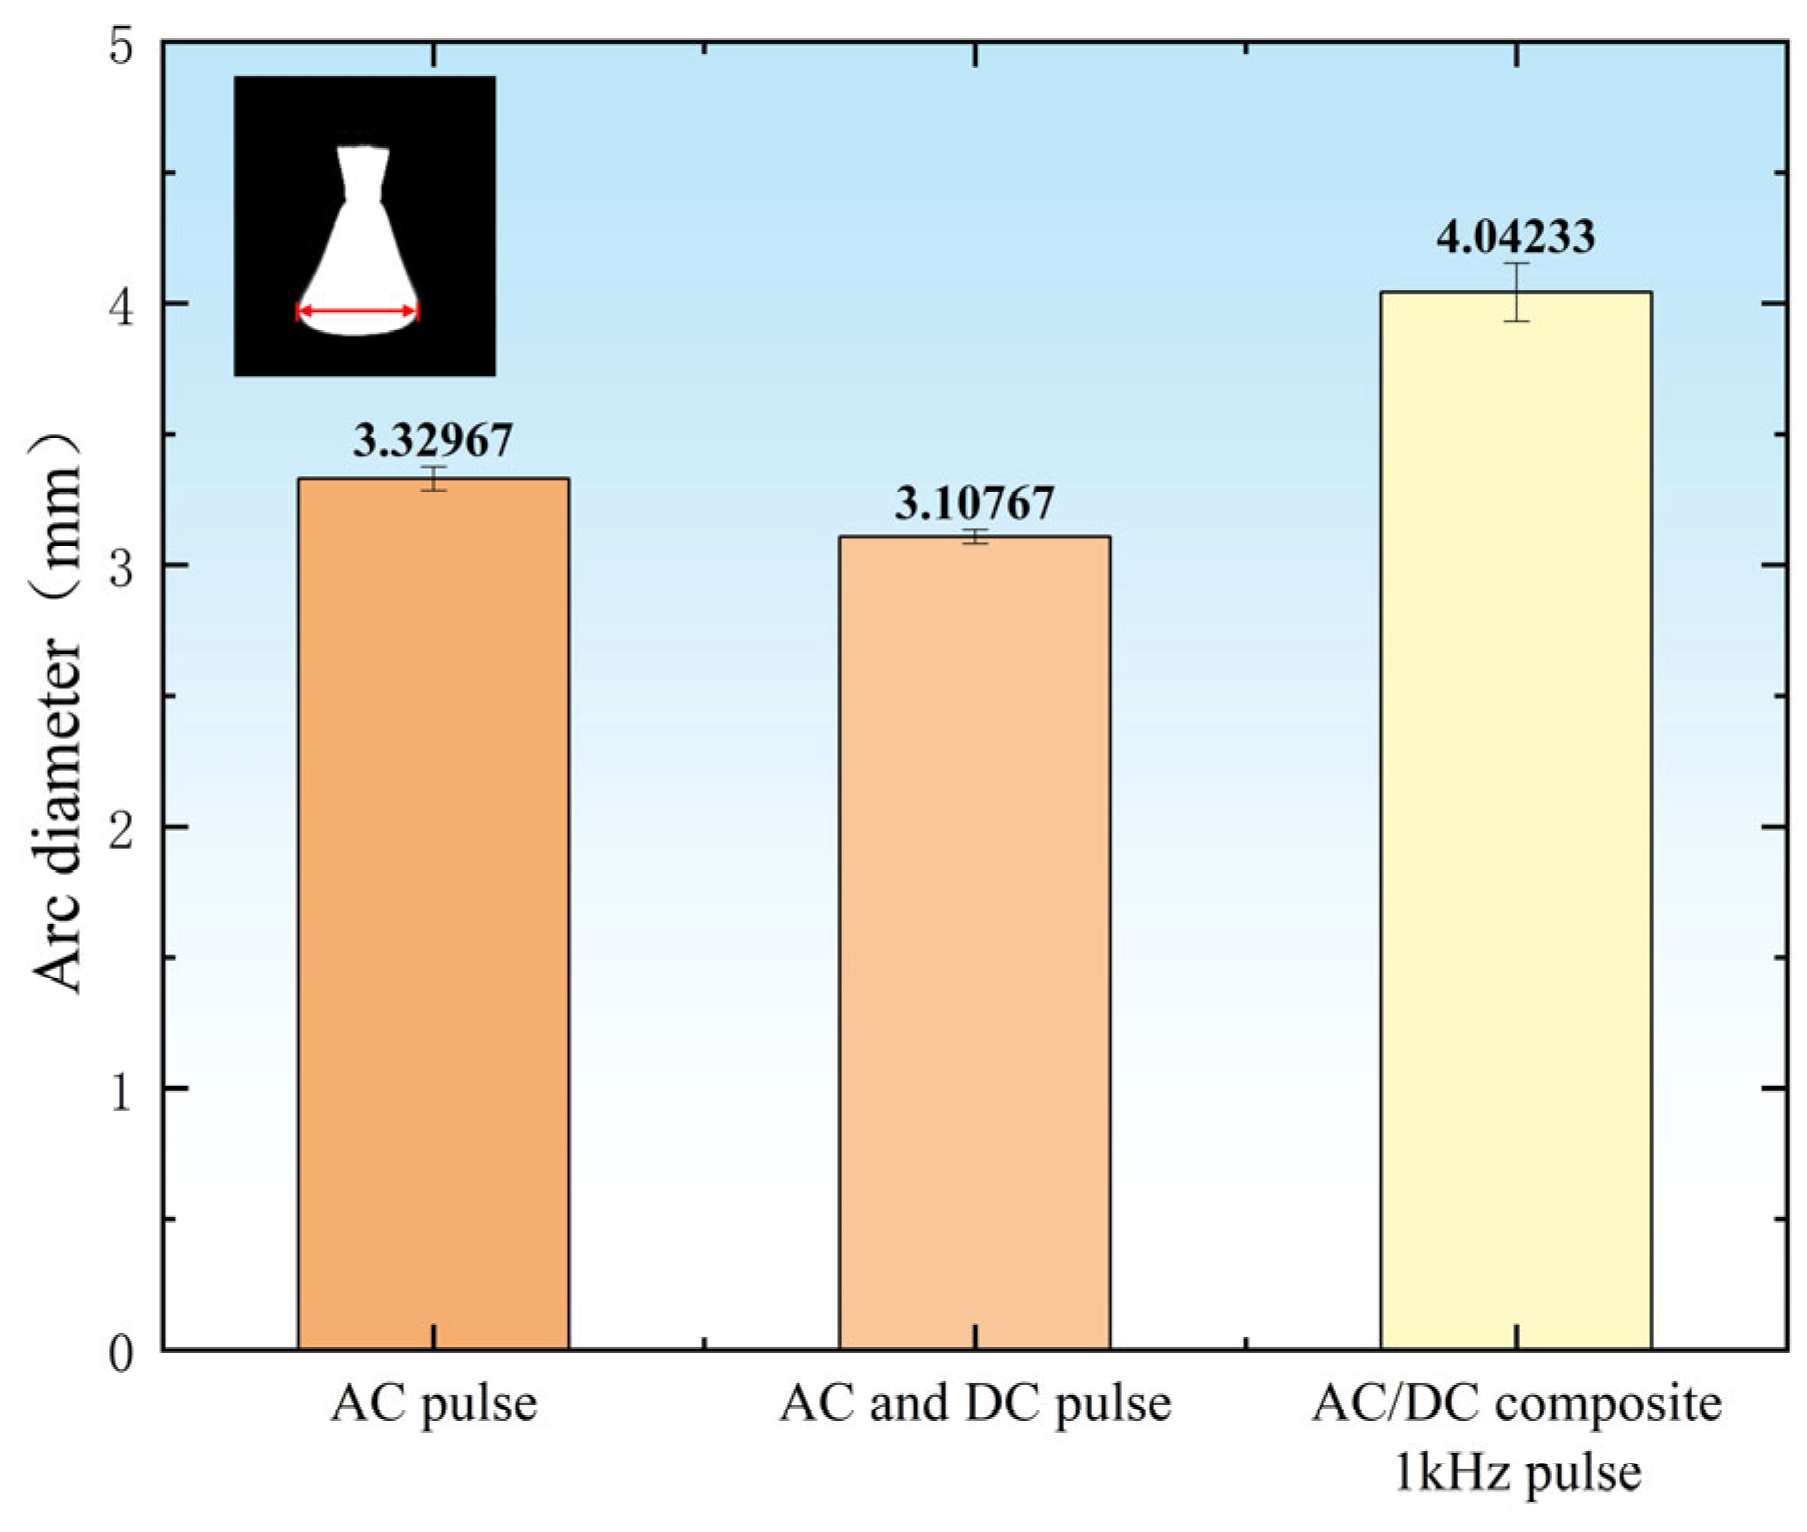
High-speed photography was used to capture the peak arc profile of the EN band for three cycles of each group of processes AC band, as shown in Figure 6. The average arc-core diameter was calculated from the arc diameter in the core area of the arc captured, and the statistical results are shown in Figure 7. The maximum average diameter of the arc core area for the AC/DC composite 1 kHz pulse signal was 4.042 mm. The AC phases of the AC pulse and AC/DC pulse were consistent, with approximate average arc core diameters of 3.329 mm and 3.107 mm, respectively. Compared to the AC pulse, the average diameter of the arc core area for the AC/DC composite 1 kHz pulse increased by 0.713 mm.
This increase in arc core diameter indicates a significant effect of the AC/DC composite 1 kHz pulse signal on arc contraction. The superimposed 1 kHz pulse induces rapid transitions between peak and base currents, generating a magnetoelectric effect around the arc column. The resulting Lorentz force exerts an inward compressive force on the plasma, constricting the arc and enhancing its stiffness. This phenomenon is consistent with the arc contraction trends observed in studied by Peng et al. [22]. Furthermore, the increased arc pressure associated with the AC/DC composite 1 kHz pulse waveform leads to a more focused energy distribution, promoting deeper penetration and improved weld quality. The periodic oscillations in arc pressure also influence the growth of the weld’s internal microstructure, accelerating the cooling rate and enhancing the mechanical properties of the joint.
In summary, the AC/DC composite 1 kHz pulse signal significantly affects arc behavior, leading to arc contraction, increased heat input, and improved weld quality. These findings align with the arc contraction trends observed in previous studies and underscore the potential benefits of utilizing 1 kHz pulsed currents in TIG welding processes.
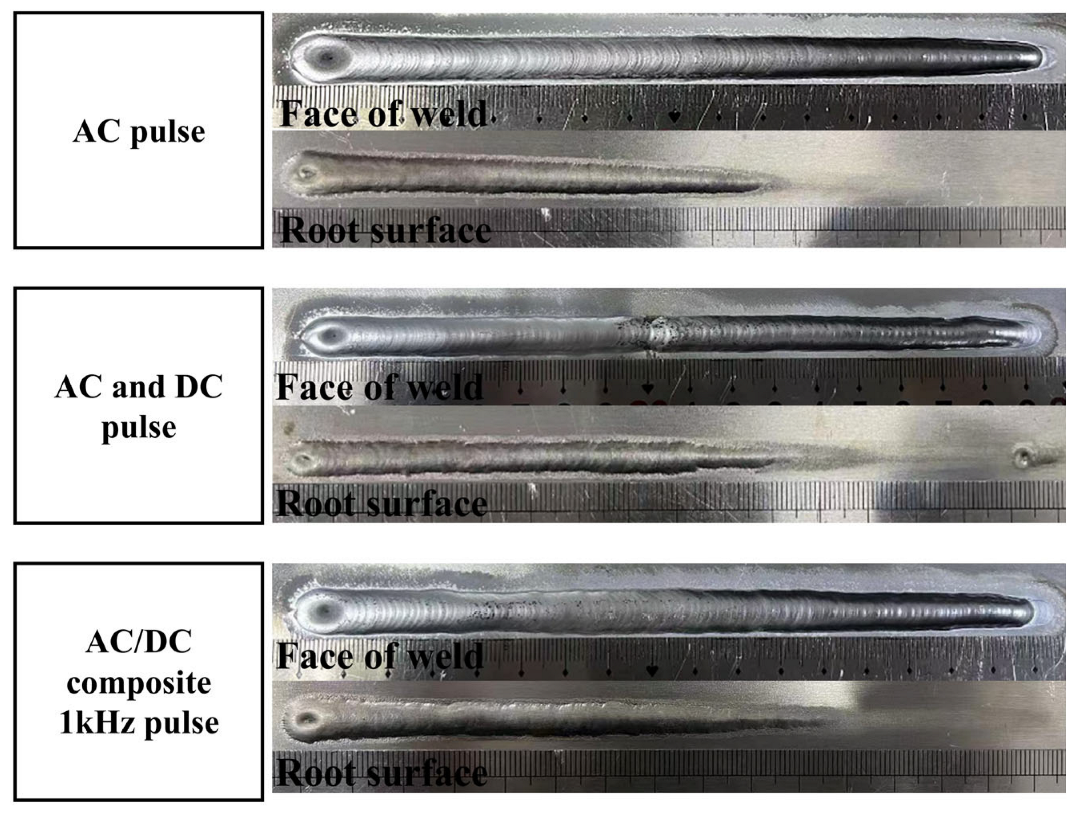
The variation in the heat source electrical signal alters the arc morphology, thereby influencing joint melting and solidification behavior. Figure 8 illustrates the macroscopic appearance of weld beads obtained under three different processes. All three welds exhibit favorable surface formation without noticeable defects and present an aesthetically pleasing appearance. Throughout the welding process, no spatter or arc extinction issues occurred, indicating stable welding operation. The top surfaces of all welds display a fish-scale pattern, attributed to the periodic alternation of the electrical signals. Among the three weld types, it is clearly observed that the weld produced with the AC/DC composite 1 kHz pulsed heat source is the first to achieve full penetration.
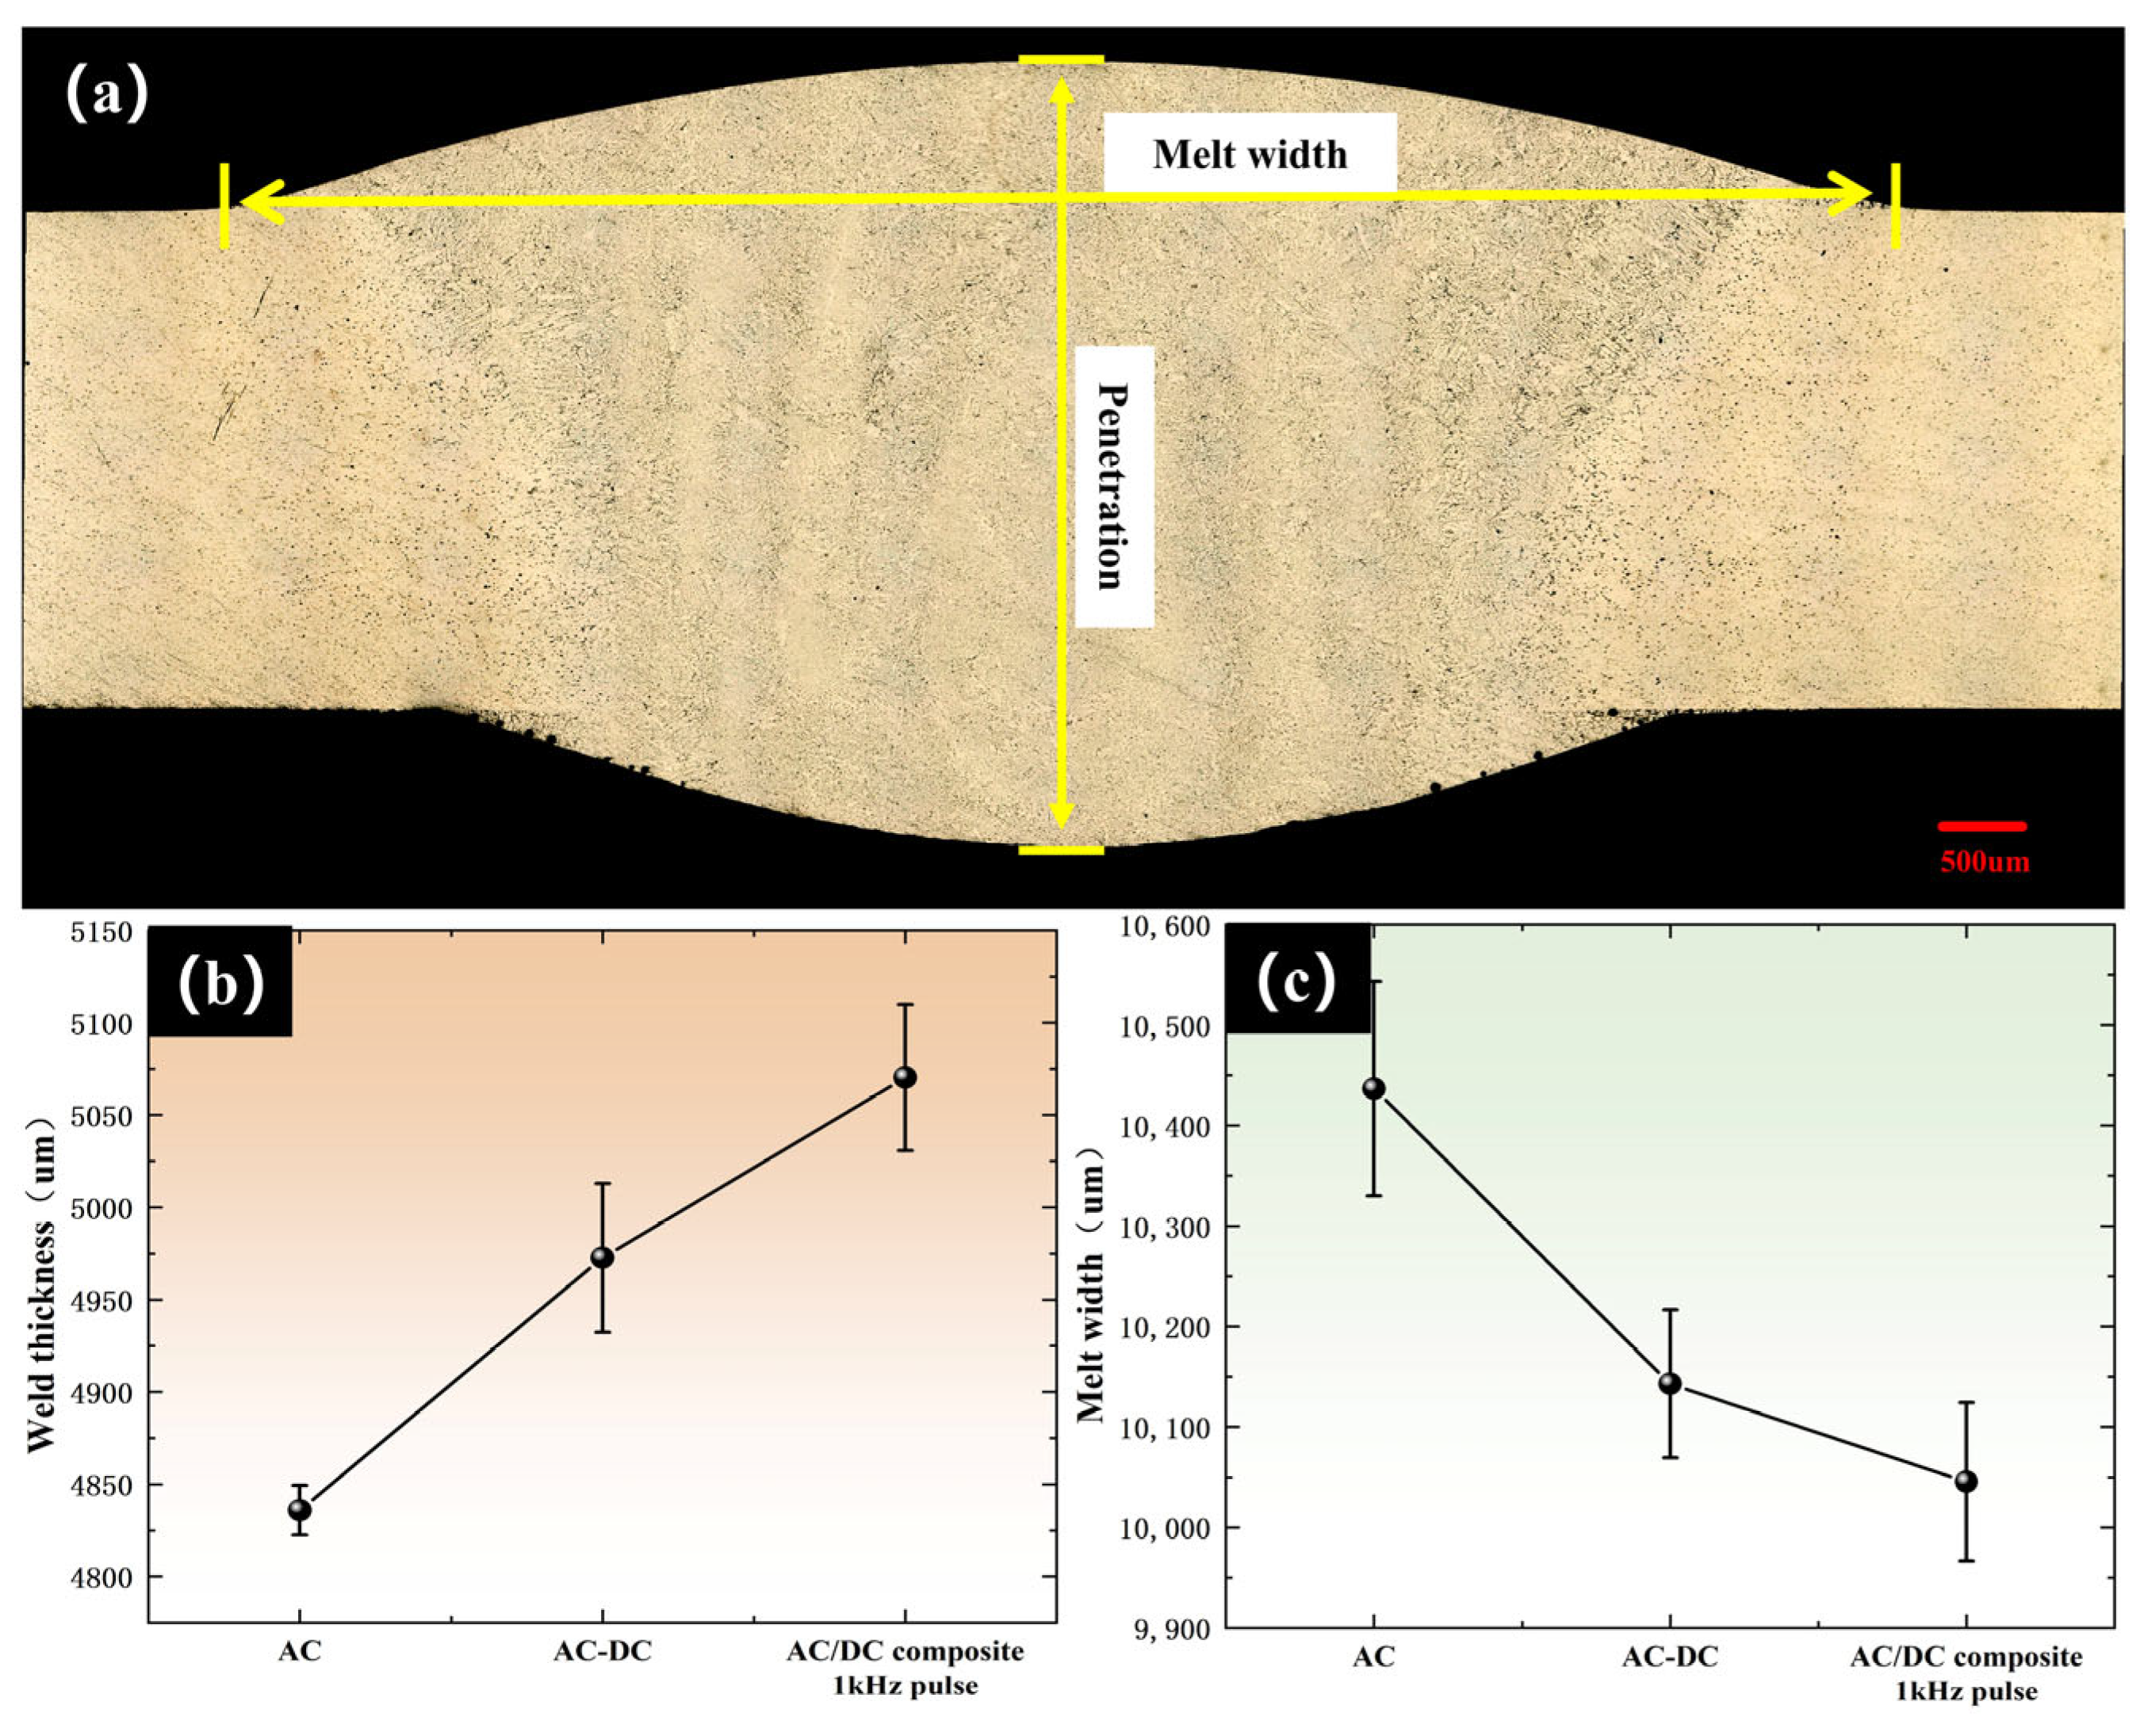
As shown in the statistics of the molten pool width in Figure 9, the weld thickness of the AC/DC pulse signal weld in Process 2 increased by 136.7 μm (2.95%) compared with that of the AC pulse signal weld in Process 1, and the weld width decreased by 293.7 μm (28.13%). Compared with the AC pulse weld of Process 1, the thickness of the AC/DC composite 1 kHz pulse weld in Process 3 increased by 234.3 μm (4.81%), and the weld width decreased by 391 μm (37.46%). Typically, conventional TIG welding produces a shallow and wide molten pool. The arc increases the temperature field on the pool surface and leads to an increase in joint width. As reported by Wu et al. [23], 1 kHz pulsed arc welding accelerates the flow of molten metal in the weld pool and enhances its downward movement, thereby transferring a significant amount of heat from the top to the bottom of the pool.
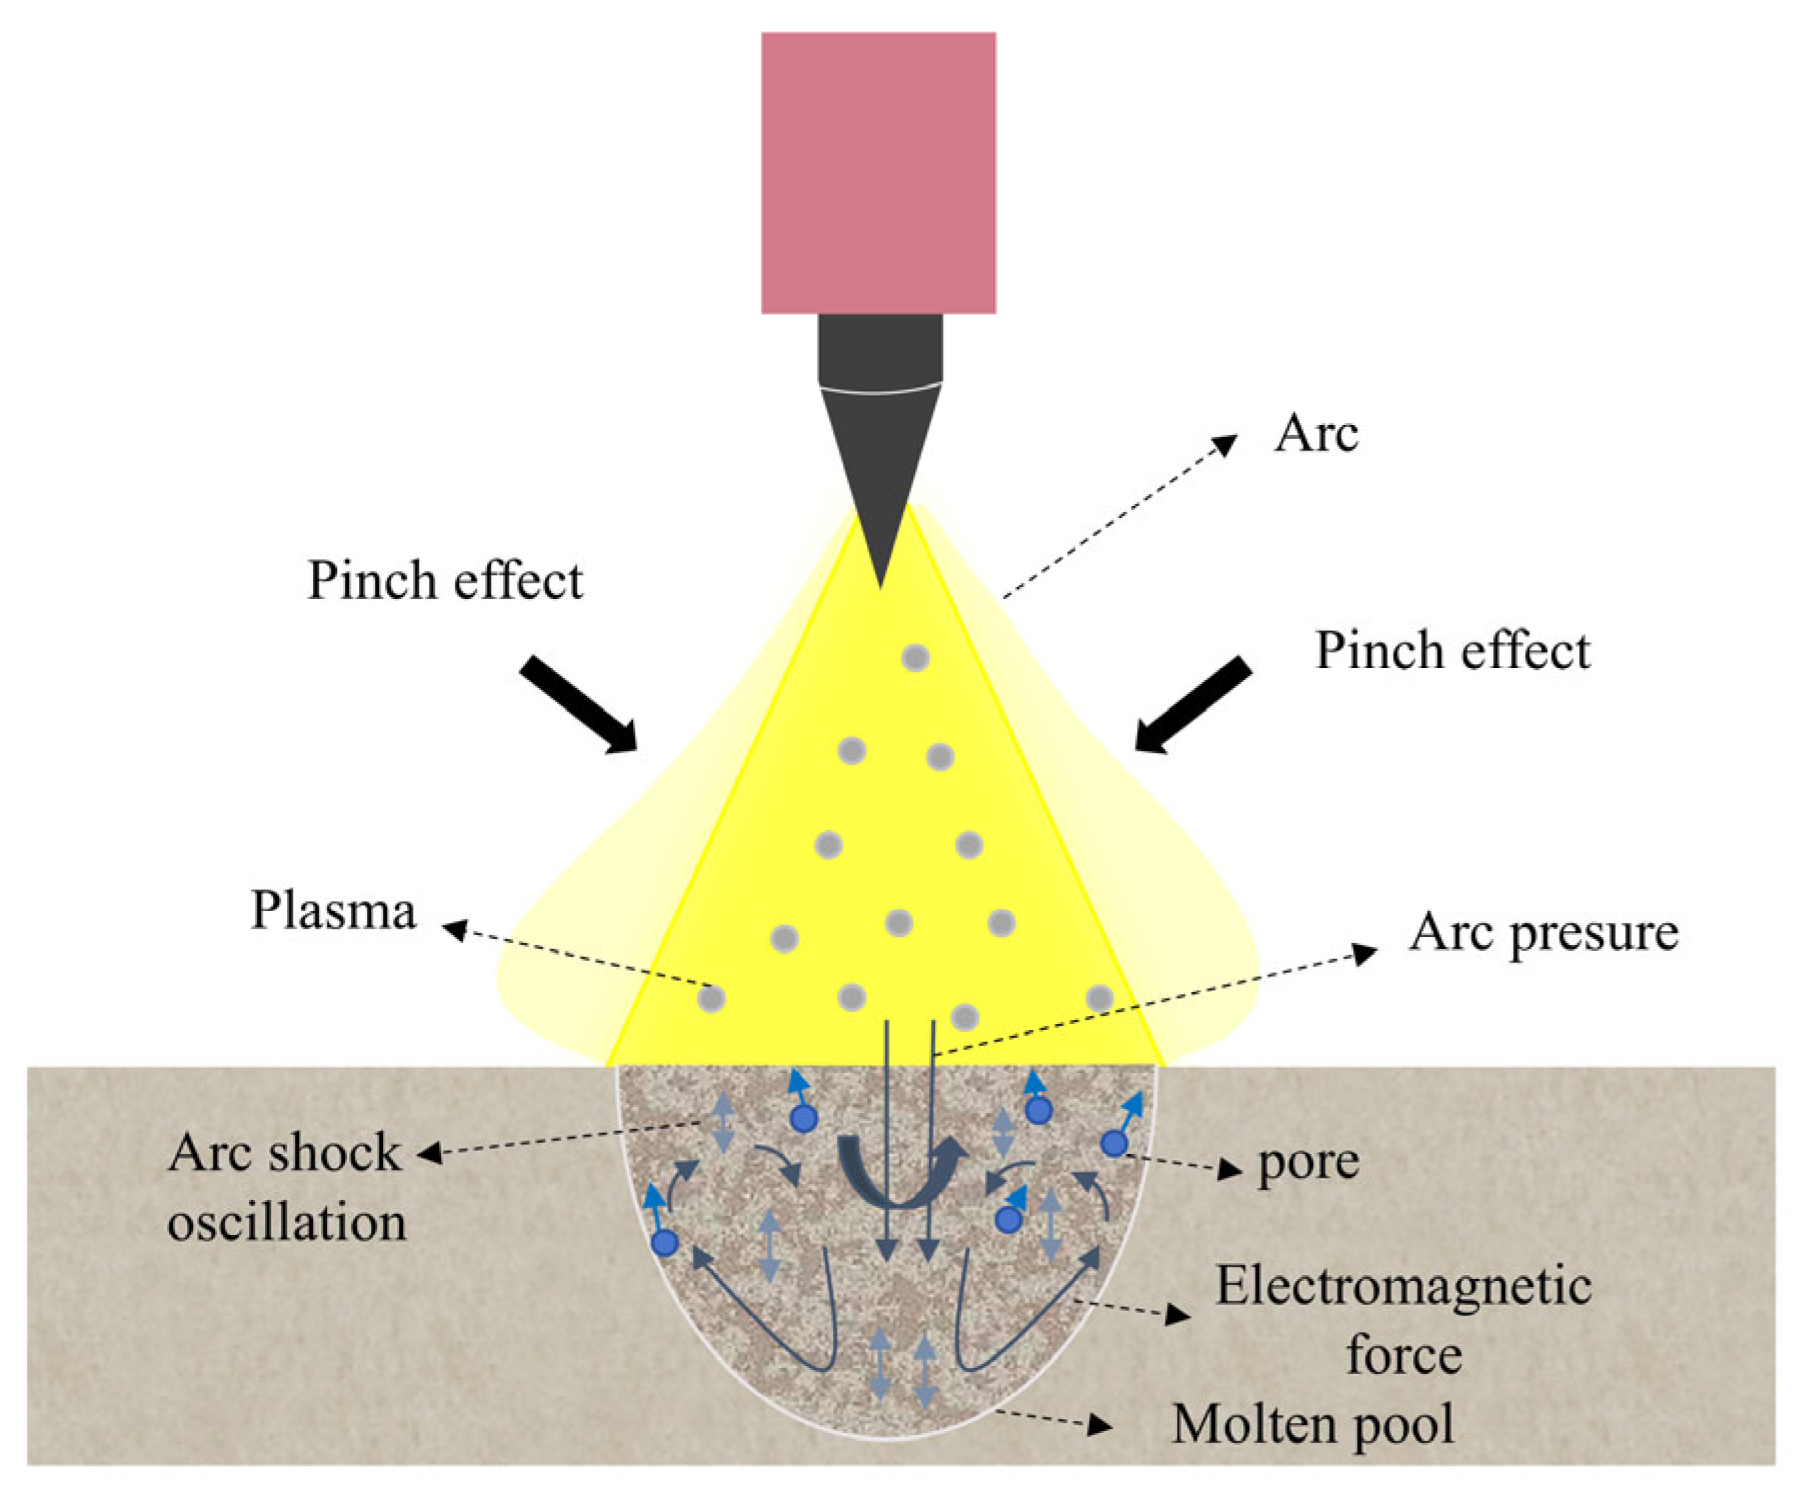
This mechanism improves the depth-to-width ratio of the weld. The arc serves as the primary source of both heat and force, directly influencing heat and mass transfer within the molten pool. With the superposition of a frequency pulse, a magnetoelectric effect is generated between the electrode and the workpiece. The resulting Lorentz force causes the arc to contract, increasing its energy density. The thermal energy released by the arc exerts an arc pressure on the pool surface, which varies periodically. This, combined with gravity, surface tension, electromagnetic force, and the induced Marangoni effect (as illustrated in Figure 10), promotes vigorous stirring within the molten pool. Under the influence of arc pressure, the molten metal is driven continuously downward and inward, enhancing heat exchange among the molten material itself and between the molten material and the base metal. Consequently, this affects the formation of the internal structure of the weld pool and the final joint morphology.

3.2. Microstructure

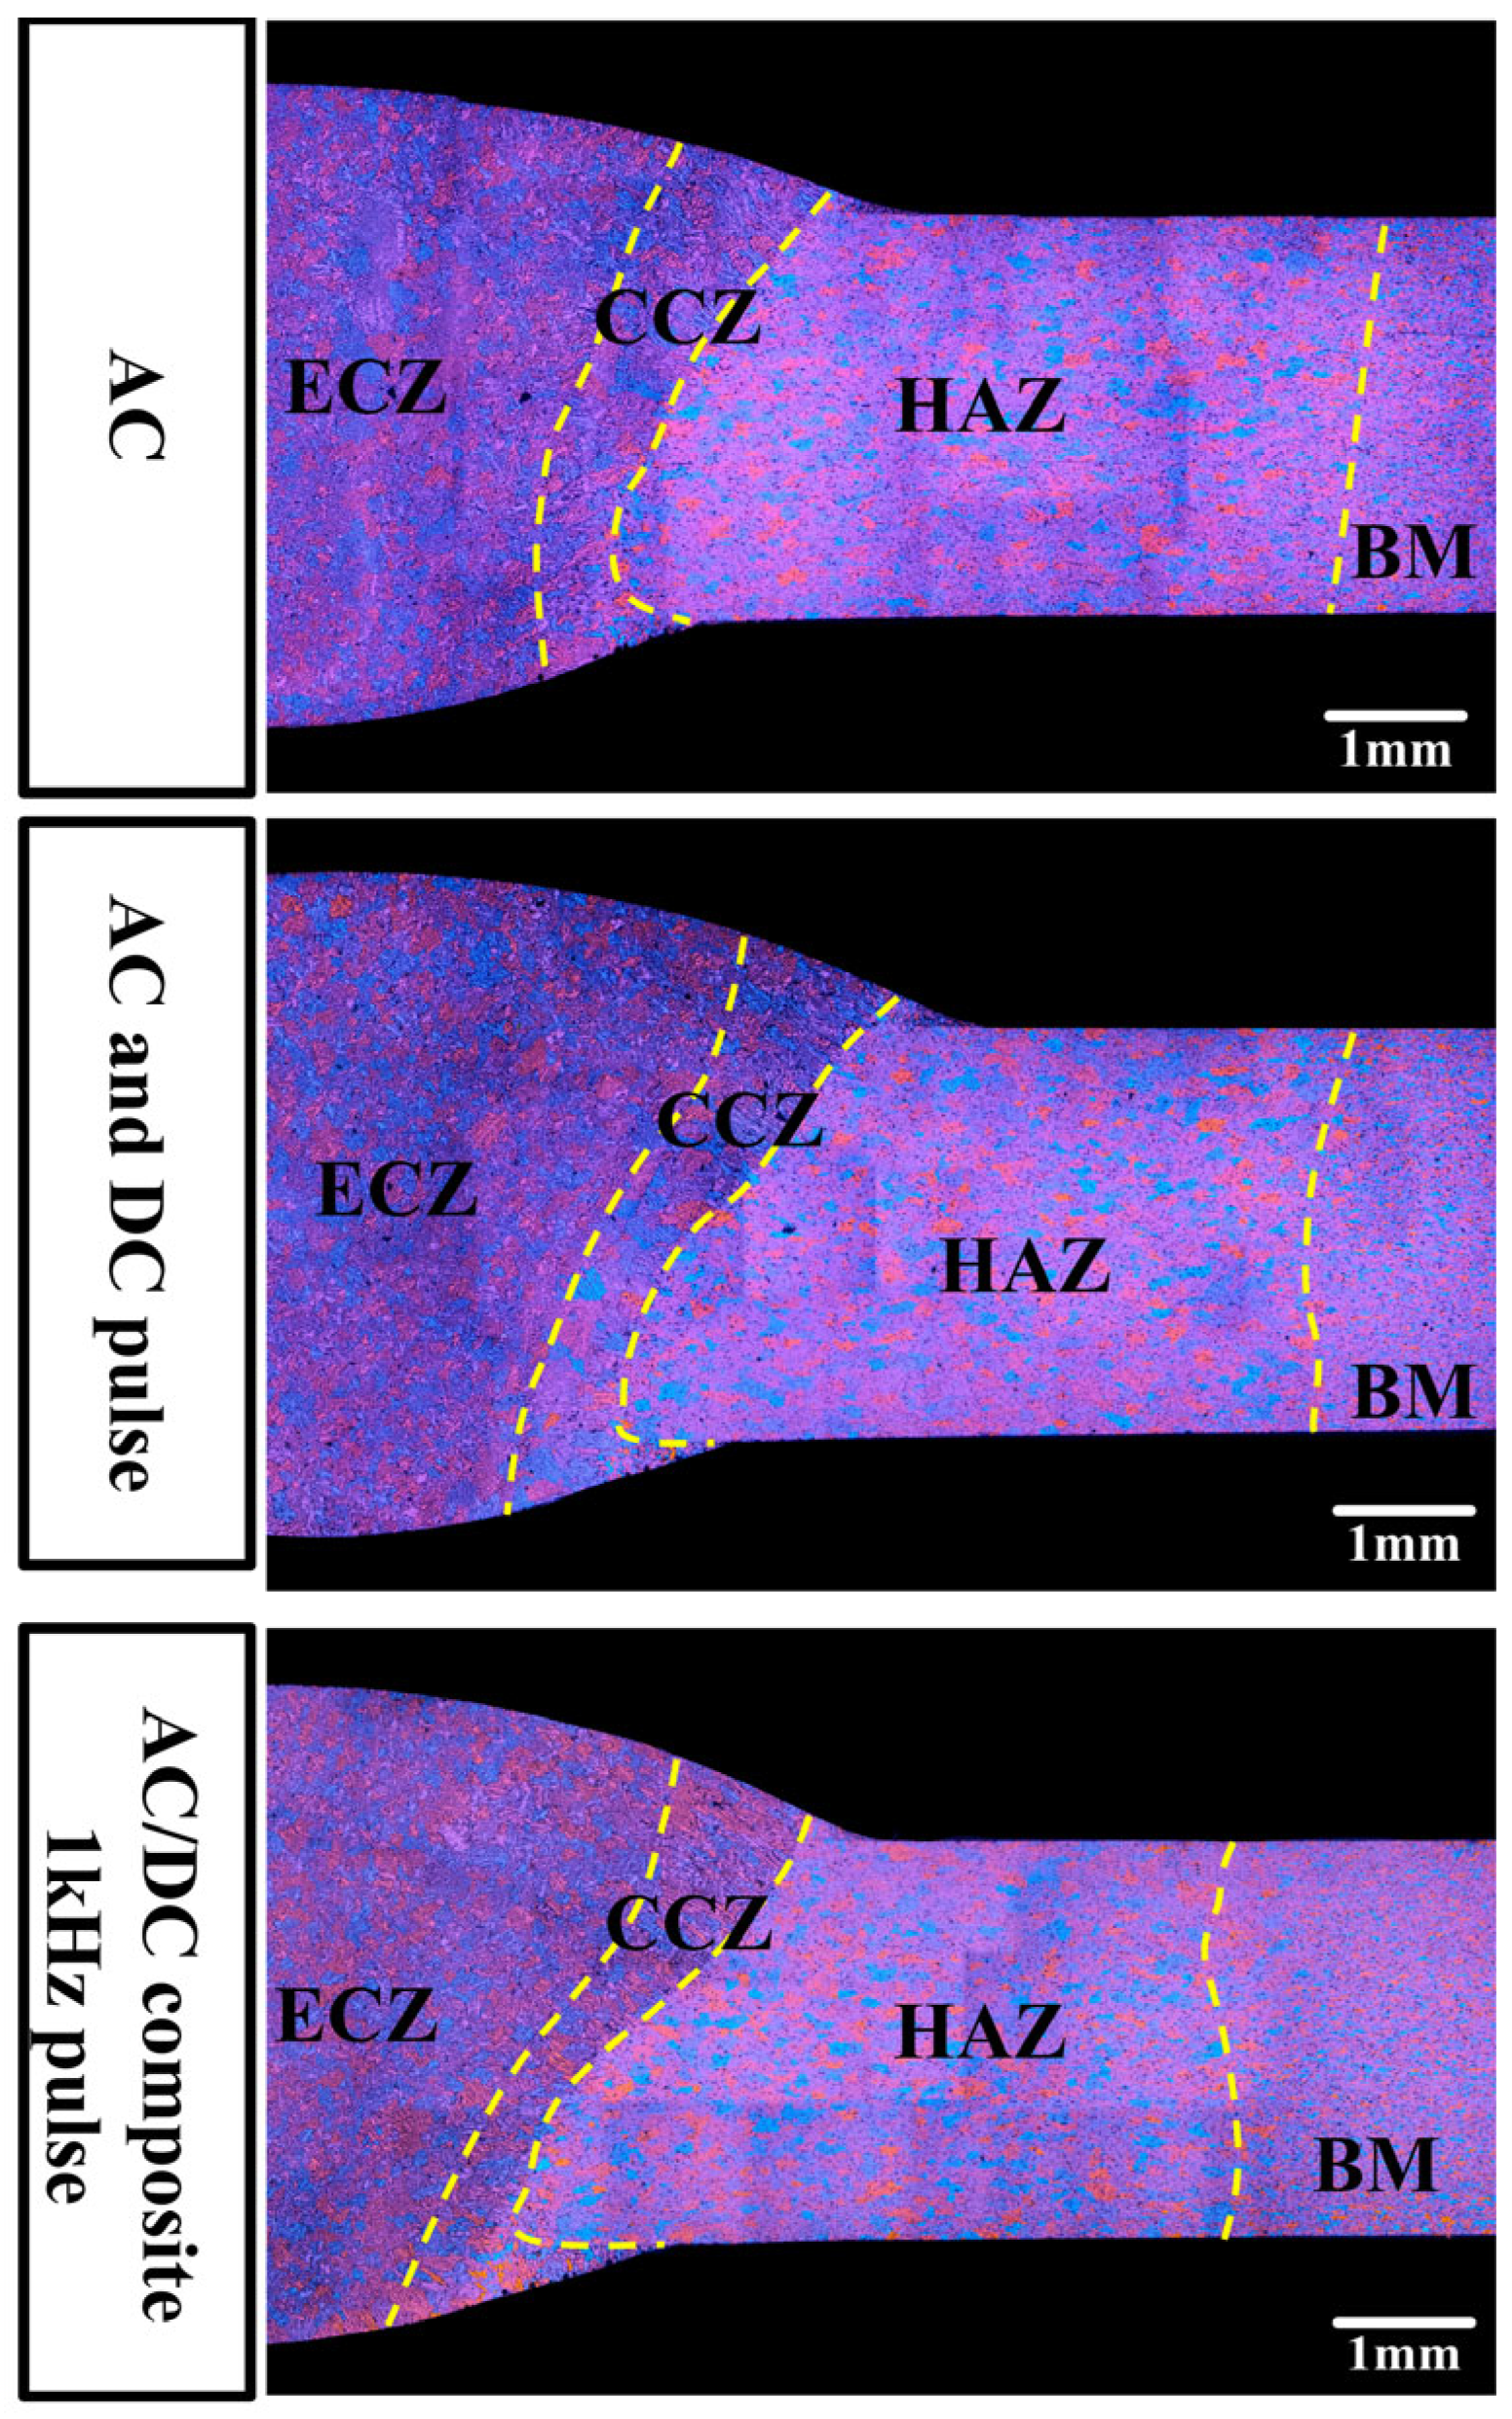
The metallographic designs of the joint sections of the three groups of processes are shown in Figure 11. The molten pools of the three groups of joints are all single-sided welded and double-sided formed, and the depth of the molten pools exceeds the thickness of the base material. Among the three groups of processes, the CCZ of the AC/DC composite 1 kHz pulse weld is the narrowest, and the width of the HAZ is the smallest. According to the principles of heat conduction and molecular dynamics, the arc contraction of the AC/DC composite 1 kHz pulse heat source signal is stronger, the radiation range of the arc heat energy is reduced, and the flow of molten metal in the molten pool accelerates the heat transfer between atoms and molecules from top to bottom, reduces the lateral heat transfer on the surface of the molten pool, lowers the width of the HAZ interval, and reduces the softening of the joint.
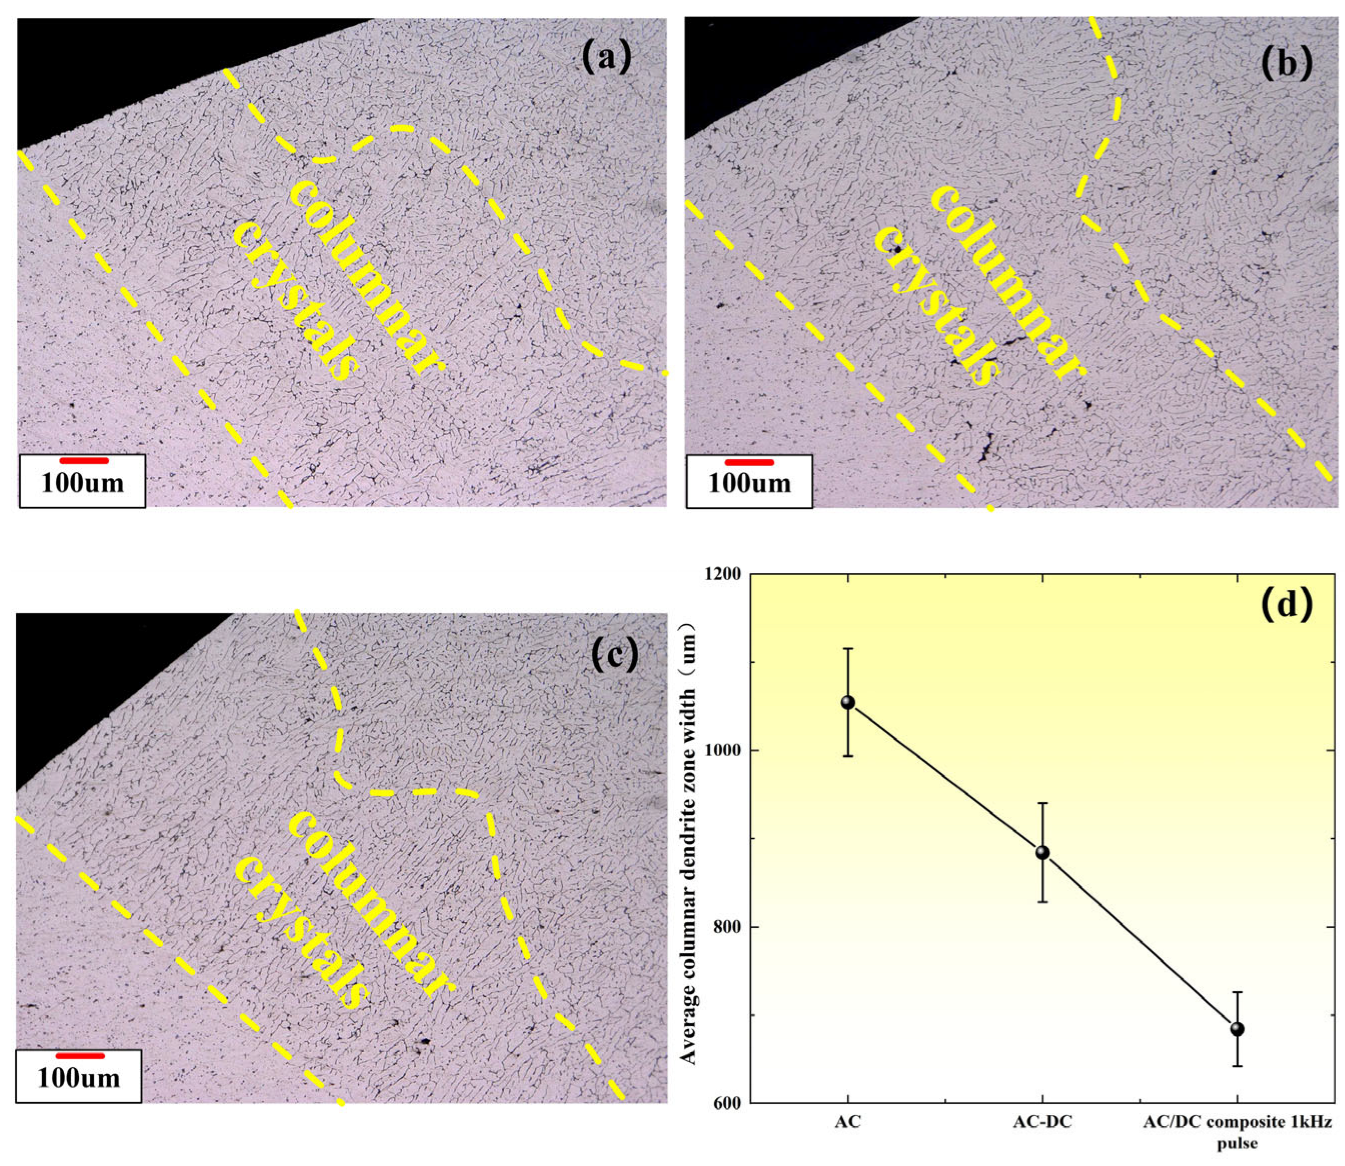
Figure 12 illustrates the microstructure of the columnar crystals zone (CCZ) within the weld seam. The width of the CCZ in welds using AC/DC pulse signals is reduced by 16.15% compared to those using AC pulse signals. Furthermore, the CCZ width in welds employing the AC/DC composite 1 kHz pulse signal is reduced by 35.13% compared to AC pulse welds. The narrowest CCZ is observed in the AC/DC composite 1 kHz pulse welds.
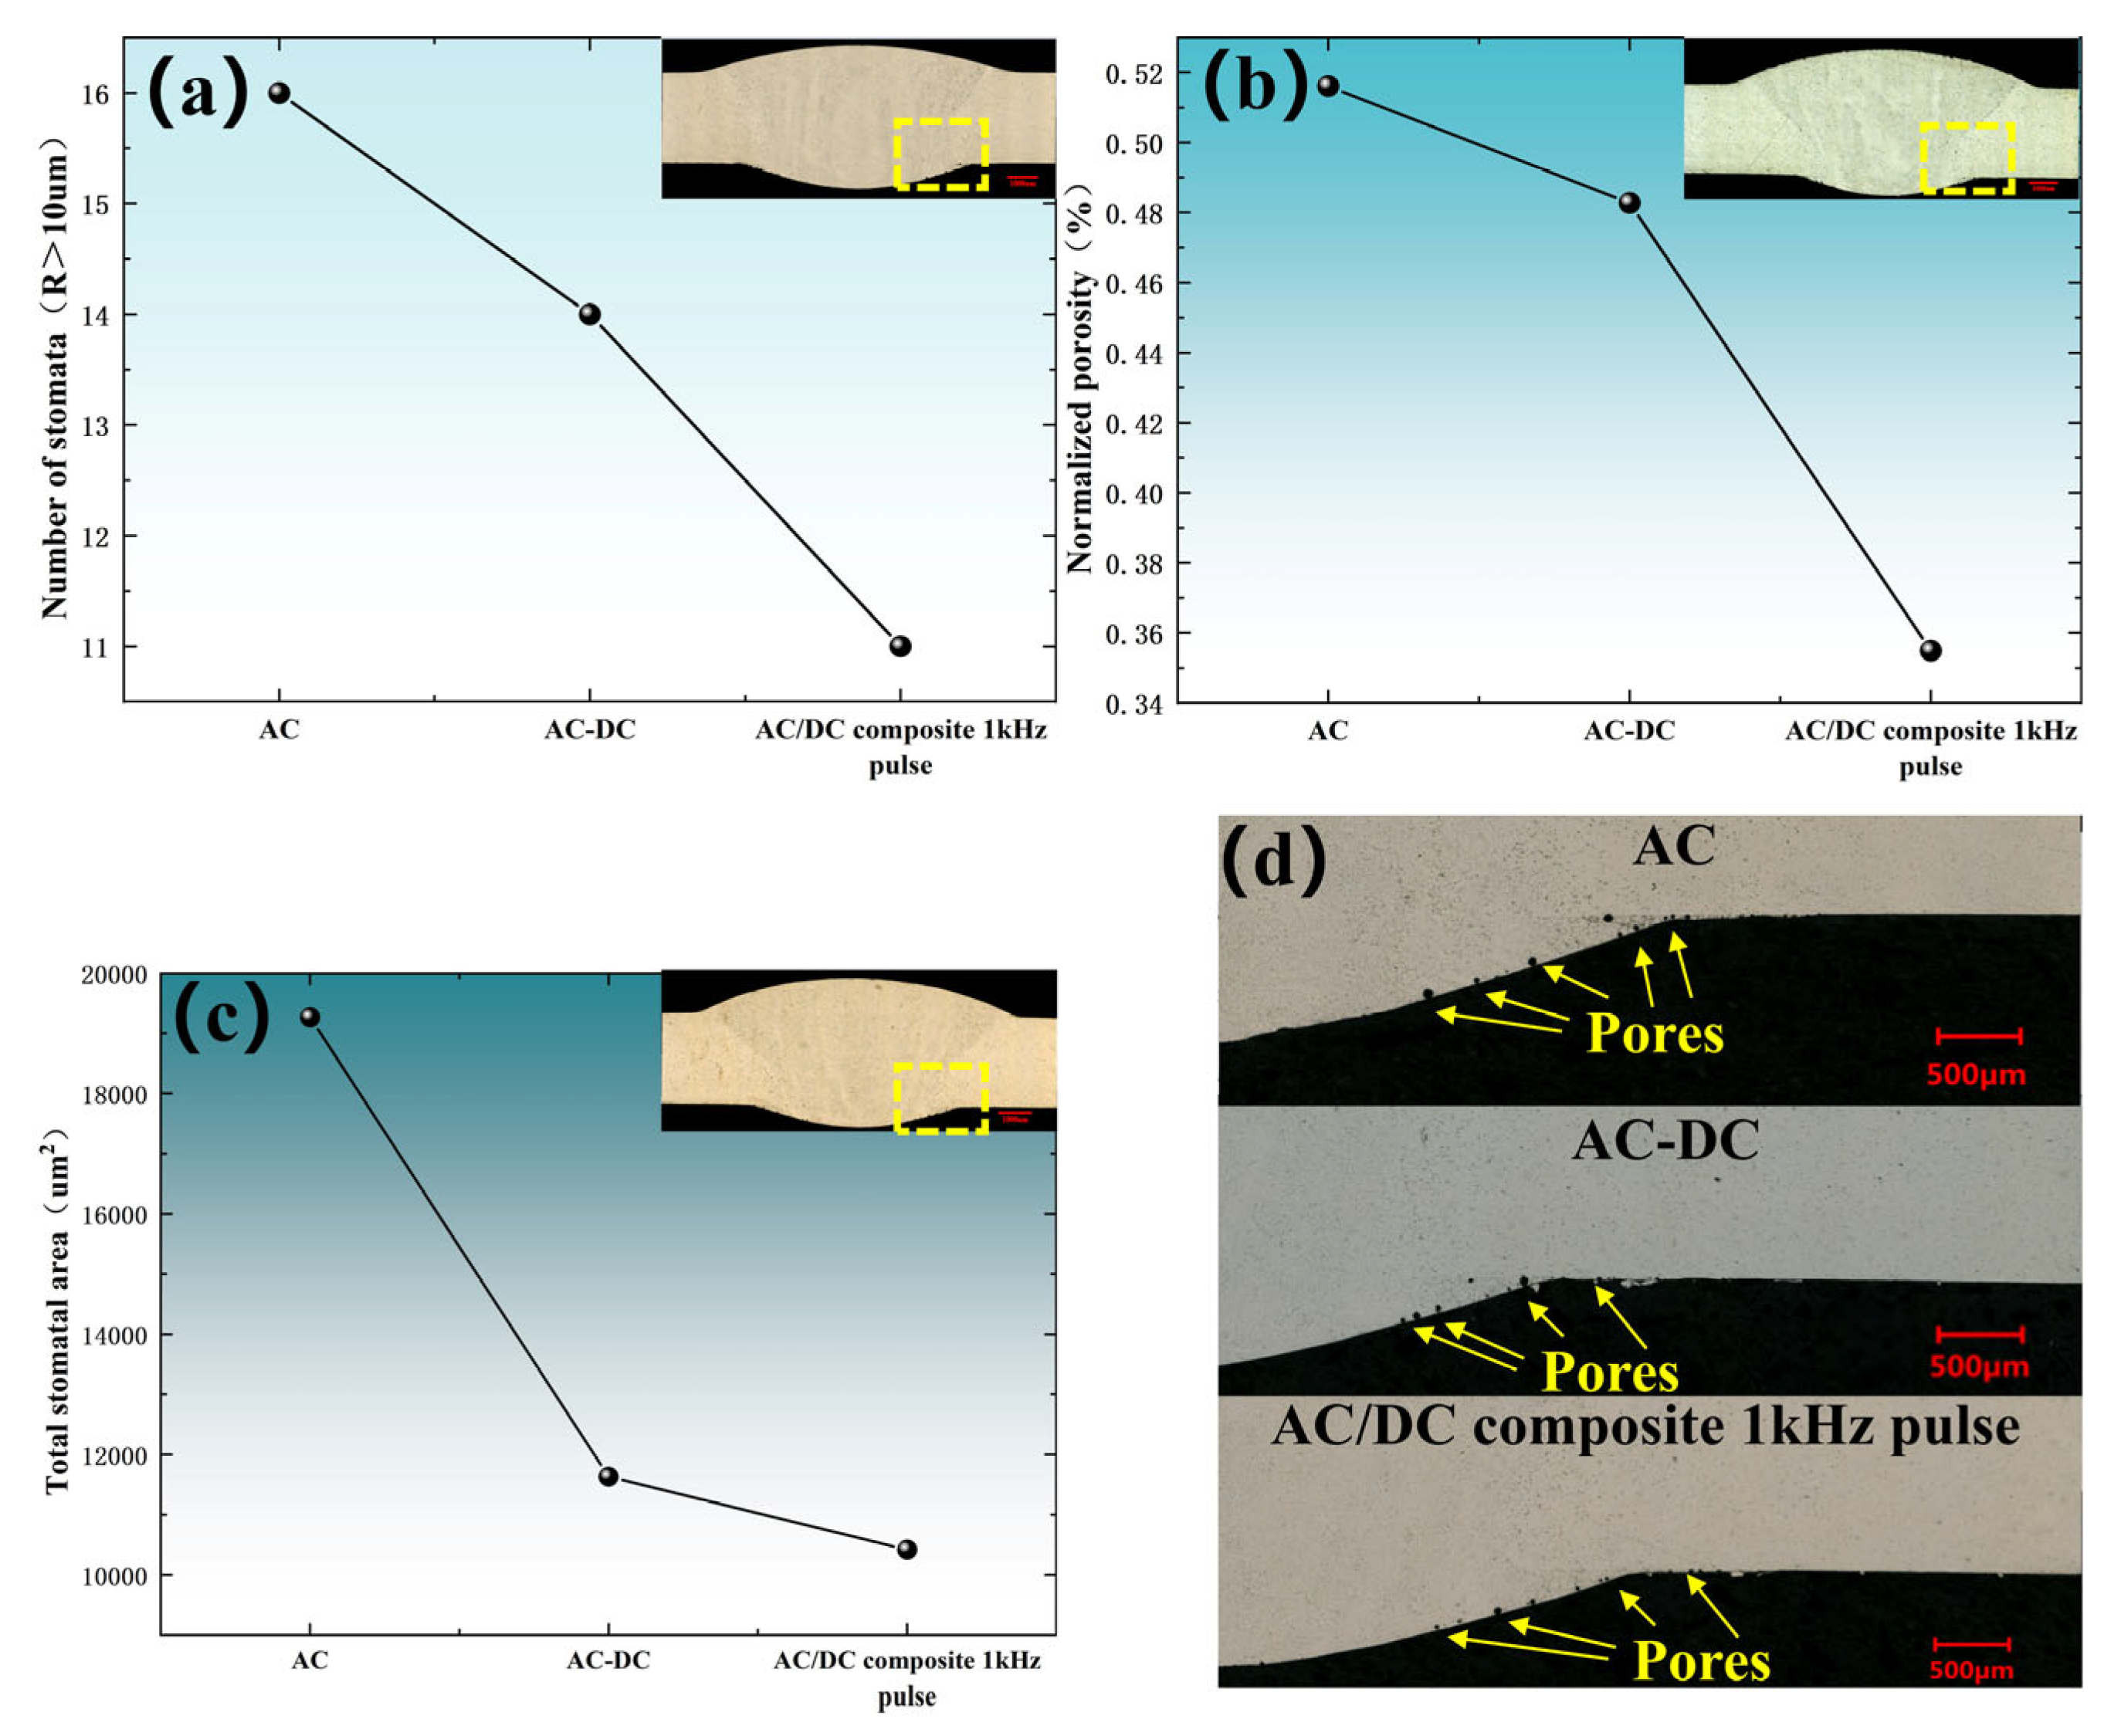
Figure 13 presents the porosity characteristics (number, normalized area, and total area) of welds processed under three different conditions. Compared to AC pulse welds, the total porosity area, number of pores, and normalized porosity in AC/DC pulse welds are reduced by 39.6%, 3.3%, and 12.5%, respectively. When using the AC/DC composite 1 kHz pulse signal, these values are further reduced by 45.9%, 16.1%, and 31.2%, respectively, compared to AC pulse welds.
The growth of columnar crystals is primarily influenced by the temperature gradient, leading to their growth towards the heat source. The “stirring” effect within the molten pool accelerates the cooling rate of the paste-like zone, inhibiting the growth of columnar crystals. As shown in Figure 13, the columnar crystals in the AC/DC composite 1 kHz pulse welds are finer and exhibit a more regular growth pattern.
The peak arc impacts the bottom of the molten pool, reducing the path for pore overflow. The Marangoni effect and arc pressure oscillations disrupt the surface tension of the molten pool, accelerating the aggregation and expulsion of pores. The inhibition of columnar crystals crystal growth reduces the interception of pore formation in the paste-like zone. Wang et al. [24] research has shown that 1 kHz pulsed currents can refine the weld microstructure and reduce porosity by enhancing melt pool dynamics and promoting better heat distribution.
In summary, the application of AC/DC composite 1 kHz pulse signals in TIG welding significantly refines the microstructure by reducing the width of the columnar crystals zone and minimizes porosity. These improvements are attributed to enhanced arc dynamics, increased heat input, and the beneficial effects of arc pressure and the Marangoni effect on the molten pool.
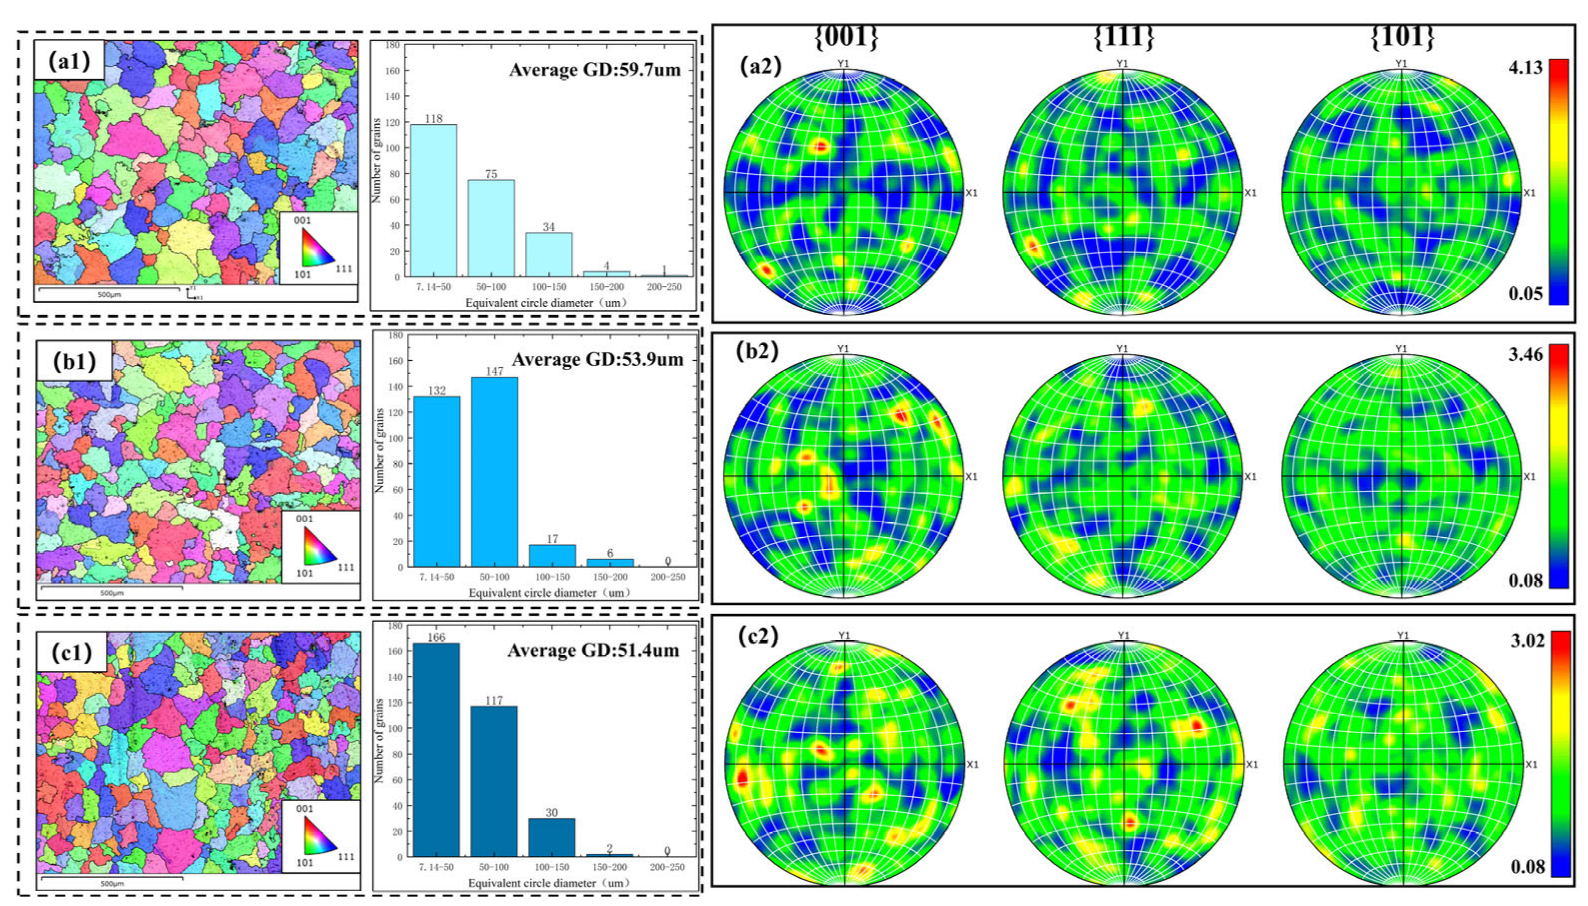
Figure 14 shows the grain mapping, grain size distribution, and inverse pole figure (IPF) orientations at the center of the welds for the three process groups. The IPF maps reveal no dominant orientation in the weld center, indicating anisotropic equiaxed dendrites. The average grain sizes for Processes 1, 2, and 3 are 59.7 μm, 53.9 μm, and 51.4 μm, respectively, demonstrating continuous grain refinement. The proportion of small grains (less than 100 μm) in the weld center is higher in Processes 2 and 3 compared to the Process 1, with these grains primarily located at grain boundaries. Comprehensive analysis of the small grain proportion and average grain size indicates that Process 3 achieves the highest degree of grain refinement in the weld zone. Moreover, Process 3 exhibits the lowest texture strength and the most uniform grain orientation distribution. During refinement, large original grains are fragmented into numerous fine grains. The formation of new grains is influenced by the local strain field and adjacent grains, resulting in orientations that do not inherit from the original grains. This leads to the emergence of many grains with new orientations, diluting the original dominant textures. According to the Hall–Petch effect, the increased density of small grains enhances the grain boundary network, raising grain boundary energy and strengthening intergranular dislocation barriers. Consequently, grain refinement weakens microstructure texture strength, disperses orientation differences, and reduces dislocation mobility at the joint [25].
Figure 15 shows the statistical results of grain boundary angles and grain orientation diffusion (GOS) of the organization. Adjacent grain boundaries with a phase difference between 2° and 15° are called low-angle grain boundaries (LAGB), and those with a phase difference greater than 15° are called high-angle grain boundaries (HAGB) [26]. The proportion of large grain boundary angles in the three groups of welds gradually increased. Among them, the proportion of HAGBs in the AC/DC composite 1 kHz pulse weld was the highest at 88.9%, and LAGBs was composed of dislocation walls, which had a much smaller hindrance effect on dislocations than HAGBs. The atomic arrangement of HAGBs in the organization is disordered, with a higher degree of misalignment and a strong obstructive effect of grain boundary dislocations. The value of grain orientation diffusion (GOS) in the AC/DC composite 1 kHz pulse weld is the highest. The internal orientation deviation value of the grains calculated by GOS can map the microscopic strain of the grains. A high GOS value indicates a large number of dislocation entanglements and high strain energy within the grains, resulting in severe lattice distortion and work hardening effect. There is also a relatively high strain within the grains. When the resistance to grain boundary migration is increased, the growth of adjacent grains is inhibited [27].
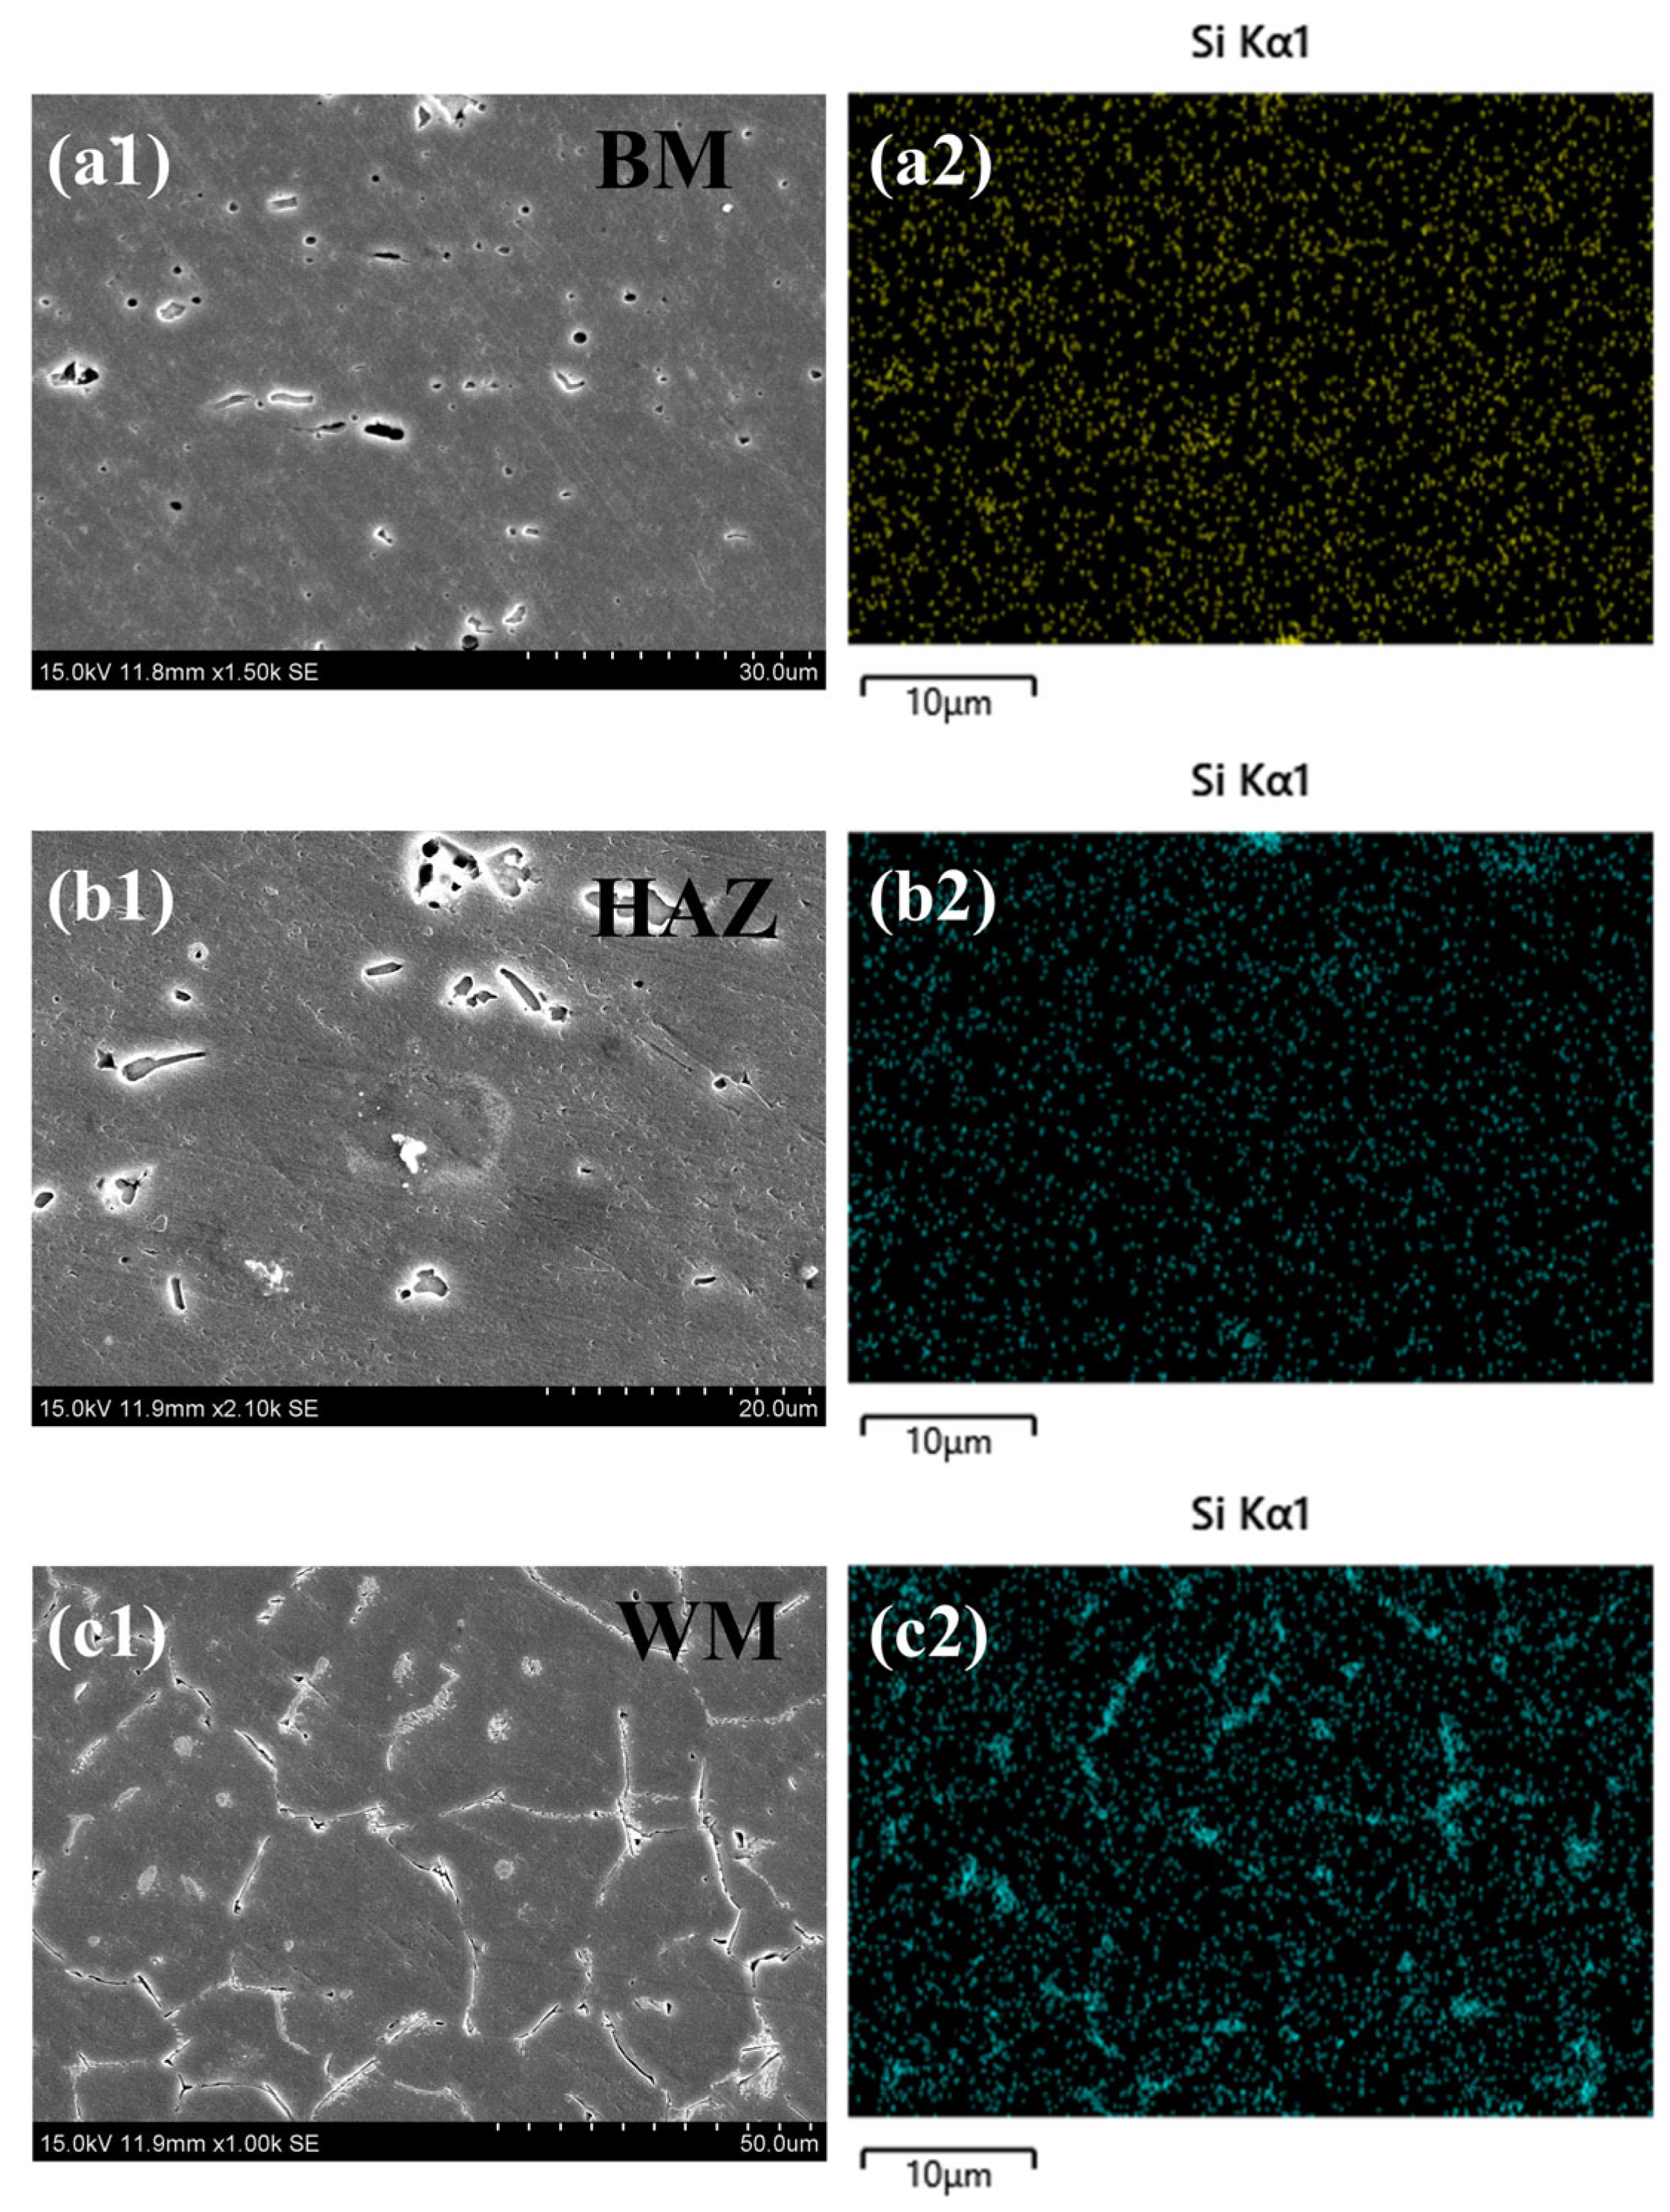
Mg and Si are the main elements in the Al6061 substrate and ER4043 filler metal, respectively. Generally speaking, the main precipitated phase at the joint is Mg2Si. Liang et al. [28] research reported that when WM is subjected to a temperature greater than 500 °C, the hardened phase completely dissolves. The high temperature of the molten pool can also cause the loss of element Mg due to combustion and evaporation. As shown in Figure 16, the SEM surface scanning of the 1 kHz pulse weld joint structure of AC/DC composite from the base material area to the weld area is illustrated. In the surface scan of the base material area (BM), Si atoms are uniformly and diffusively distributed in the tissue. Due to the rapid heating and cooling process of welding, the temperature of the heat-affected zone (HAZ) is between the aging temperature and the solution temperature, which will promote the diffusion and aggregation of Si atoms in the supersaturated solid solution. The center zone (WM) of the weld seam is located at the center of the heat source. High-temperature heating melts the Mg2Si strengthening phase in the joint, causing a large number of Mg atoms to evaporate. Due to grain refinement, WM has a large number of grain boundaries, which are fast channels for atomic diffusion and accumulation sites.
The atomic arrangement at the grain boundaries is irregular, and the atomic activity is relatively high. Si atoms also tend to aggregate near the grain boundaries. A large amount of eutectic Si combines with α -Al to form an Al-Si eutectic structure [29]. The energy at the grain boundaries is relatively high, while the atomic diffusion activation energy is relatively low, making it easier for silicon atoms to migrate and aggregate towards the grain boundaries. There is a difference in the solubility of silicon in the solid phase and the liquid phase. As solidification proceeds, the concentration of silicon in the liquid phase gradually increases. At the solid–liquid interface, silicon atoms tend to diffuse into the liquid phase. Since the grain boundaries are the last solidified areas during the solidification process, silicon in the liquid phase will be enriched at the grain boundaries, thereby promoting the segregation of Al-Si eutectic distribution at the grain boundaries.
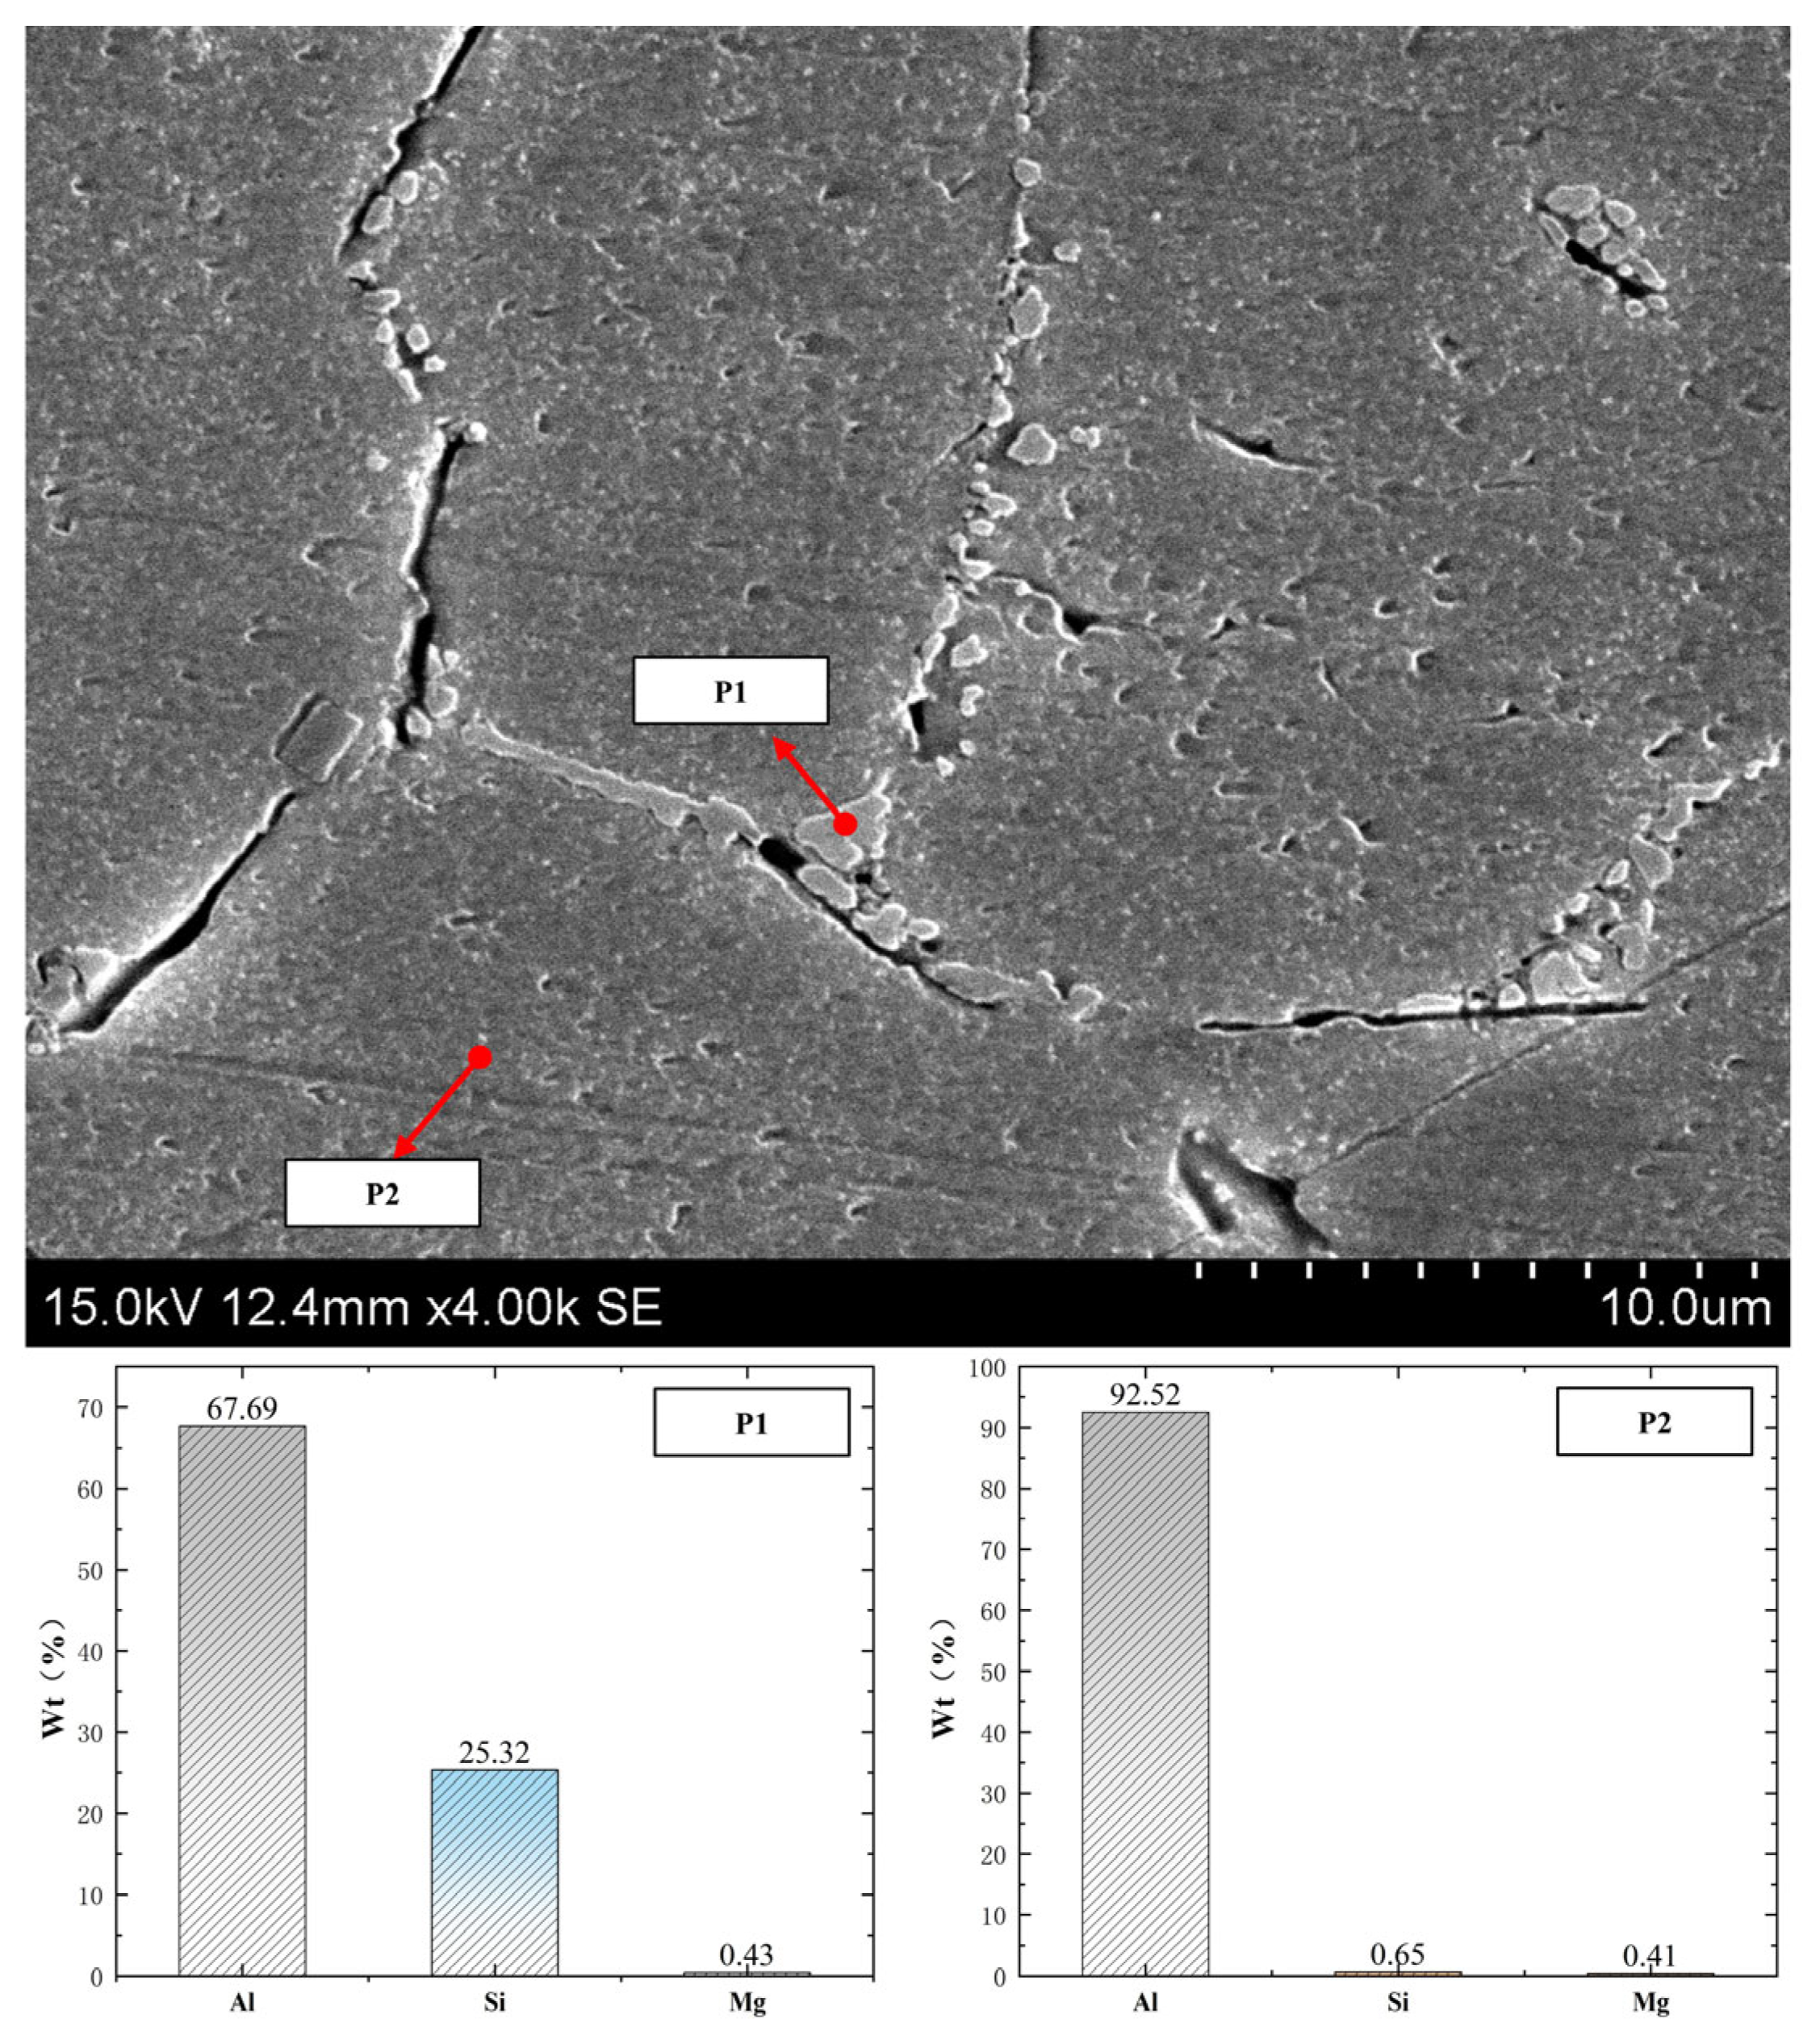
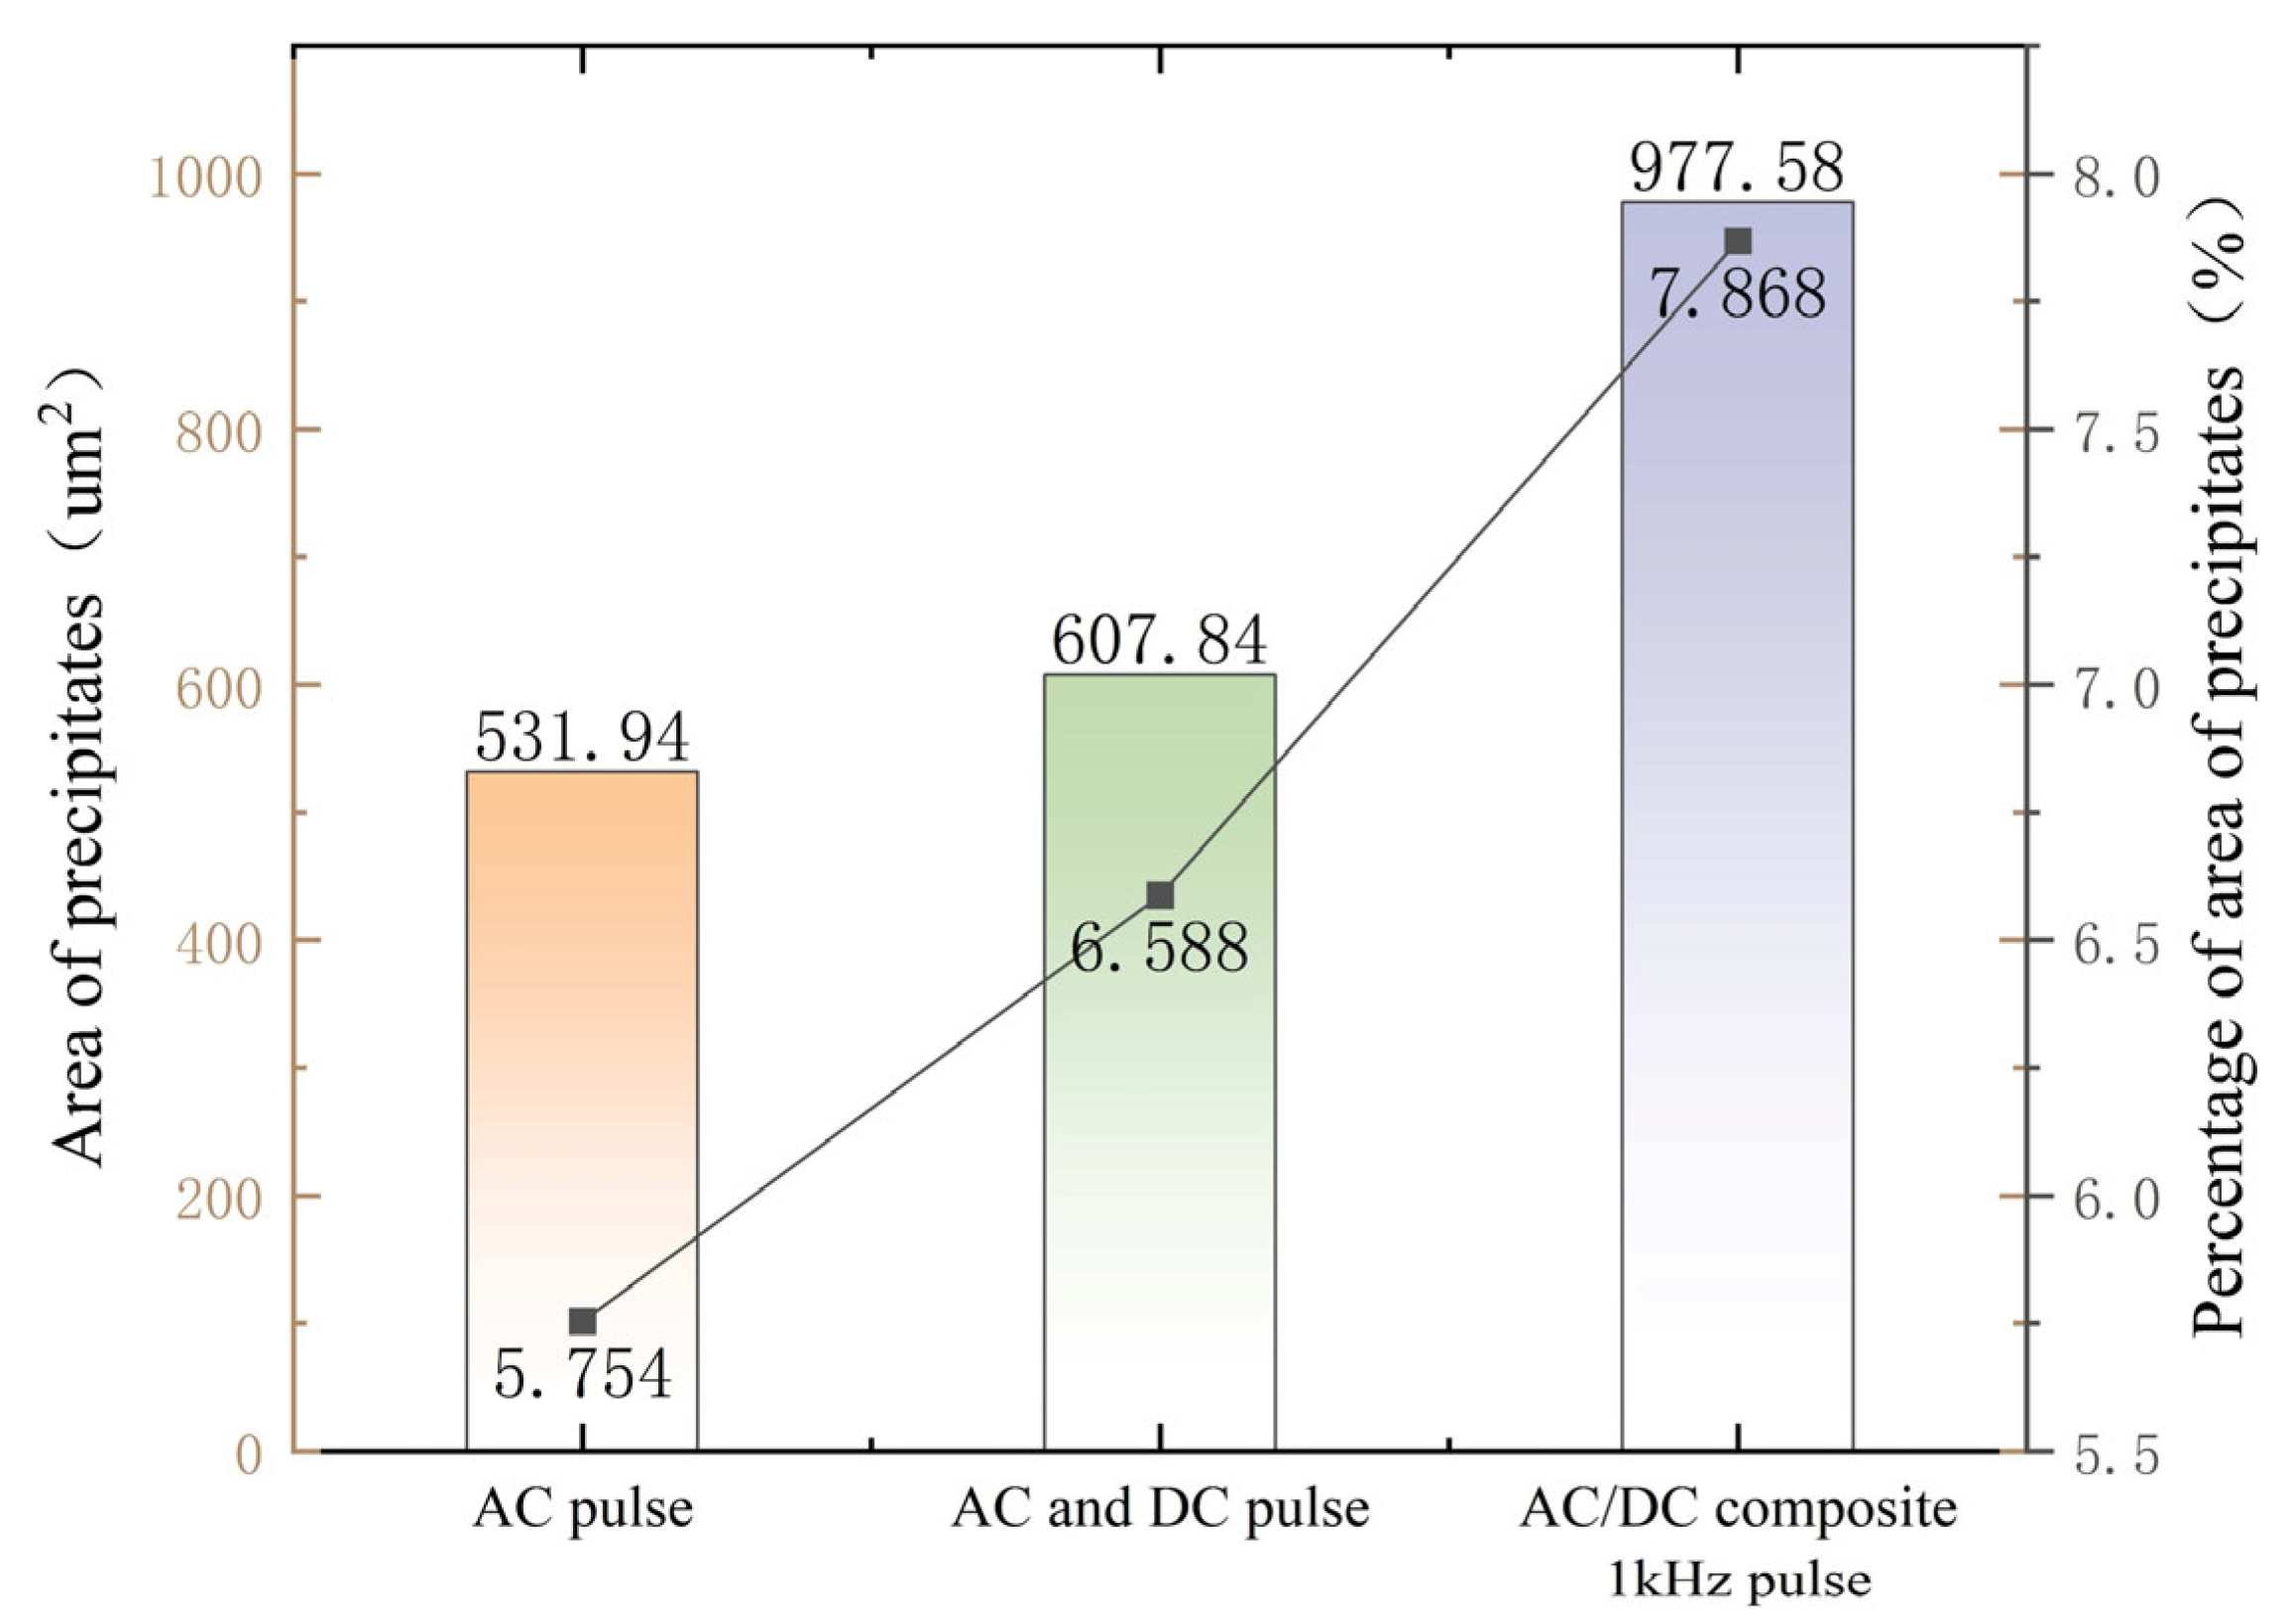
Energy spectrum analysis was performed on the grain boundary and two points inside the grain at the center of the weld seam, as shown in Figure 17. The scan result of point P1 was mainly Al-Si eutectic (Al-67.69%, Si-25.32%), and point P2 was the α -Al phase (Al-92.52%), mainly Al element. Under the influence of the thermal cycle, the Si within the grains continuously moves towards the grain boundary position and forms an Al-Si eutectic structure with α -Al, which is distributed in the intercrystals arms of WM [30], and forms silvery-white, plate-like distribution at the grain boundary as shown in Figure 16. Li et al. [31] pointed out that uniformly distributed Al-Si eutectics have a beneficial effect on the performance of the joint. The Al-Si eutectic has stronger mechanical properties compared to α -Al. The increased distribution and dispersion of the Al-Si eutectic structure can hinder the sliding movement of adjacent grains and enhance the overall hardness of the weld seam. Therefore, the statistics of the Al-Si eutectic area and Si element content at the grain boundaries of the three process test groups are shown in Figure 18 and Figure 19. The statistical results of the Al-Si eutectic area at the grain boundaries of the three process groups are respectively: 531.94 μm2, 607.84 um2, and 977.58 μm2. The precipitation area of the AC/DC composite 1 kHz pulse weld seam increased by 445.64 μm2 compared with the AC pulse weld seam. The average wt% of Si element in the three groups of processes for the precipitate area of the AC/DC composite 1 kHz pulse weld seam was 23.83%, 24.93%, and 27.32%, respectively. Therefore, the Si element content at the grain boundaries in the AC/DC composite 1 kHz pulse test group was the highest. Grain refinement increased the number of grain boundaries and also accelerated the segregation of Si elements towards the grain boundary positions. The aggregation of Si atoms towards the grain boundaries and the formation of the Al-Si eutectic structure increases the grain boundary energy at the grain boundaries and enhances the mechanical properties of the joints.

3.3. Hardness Test

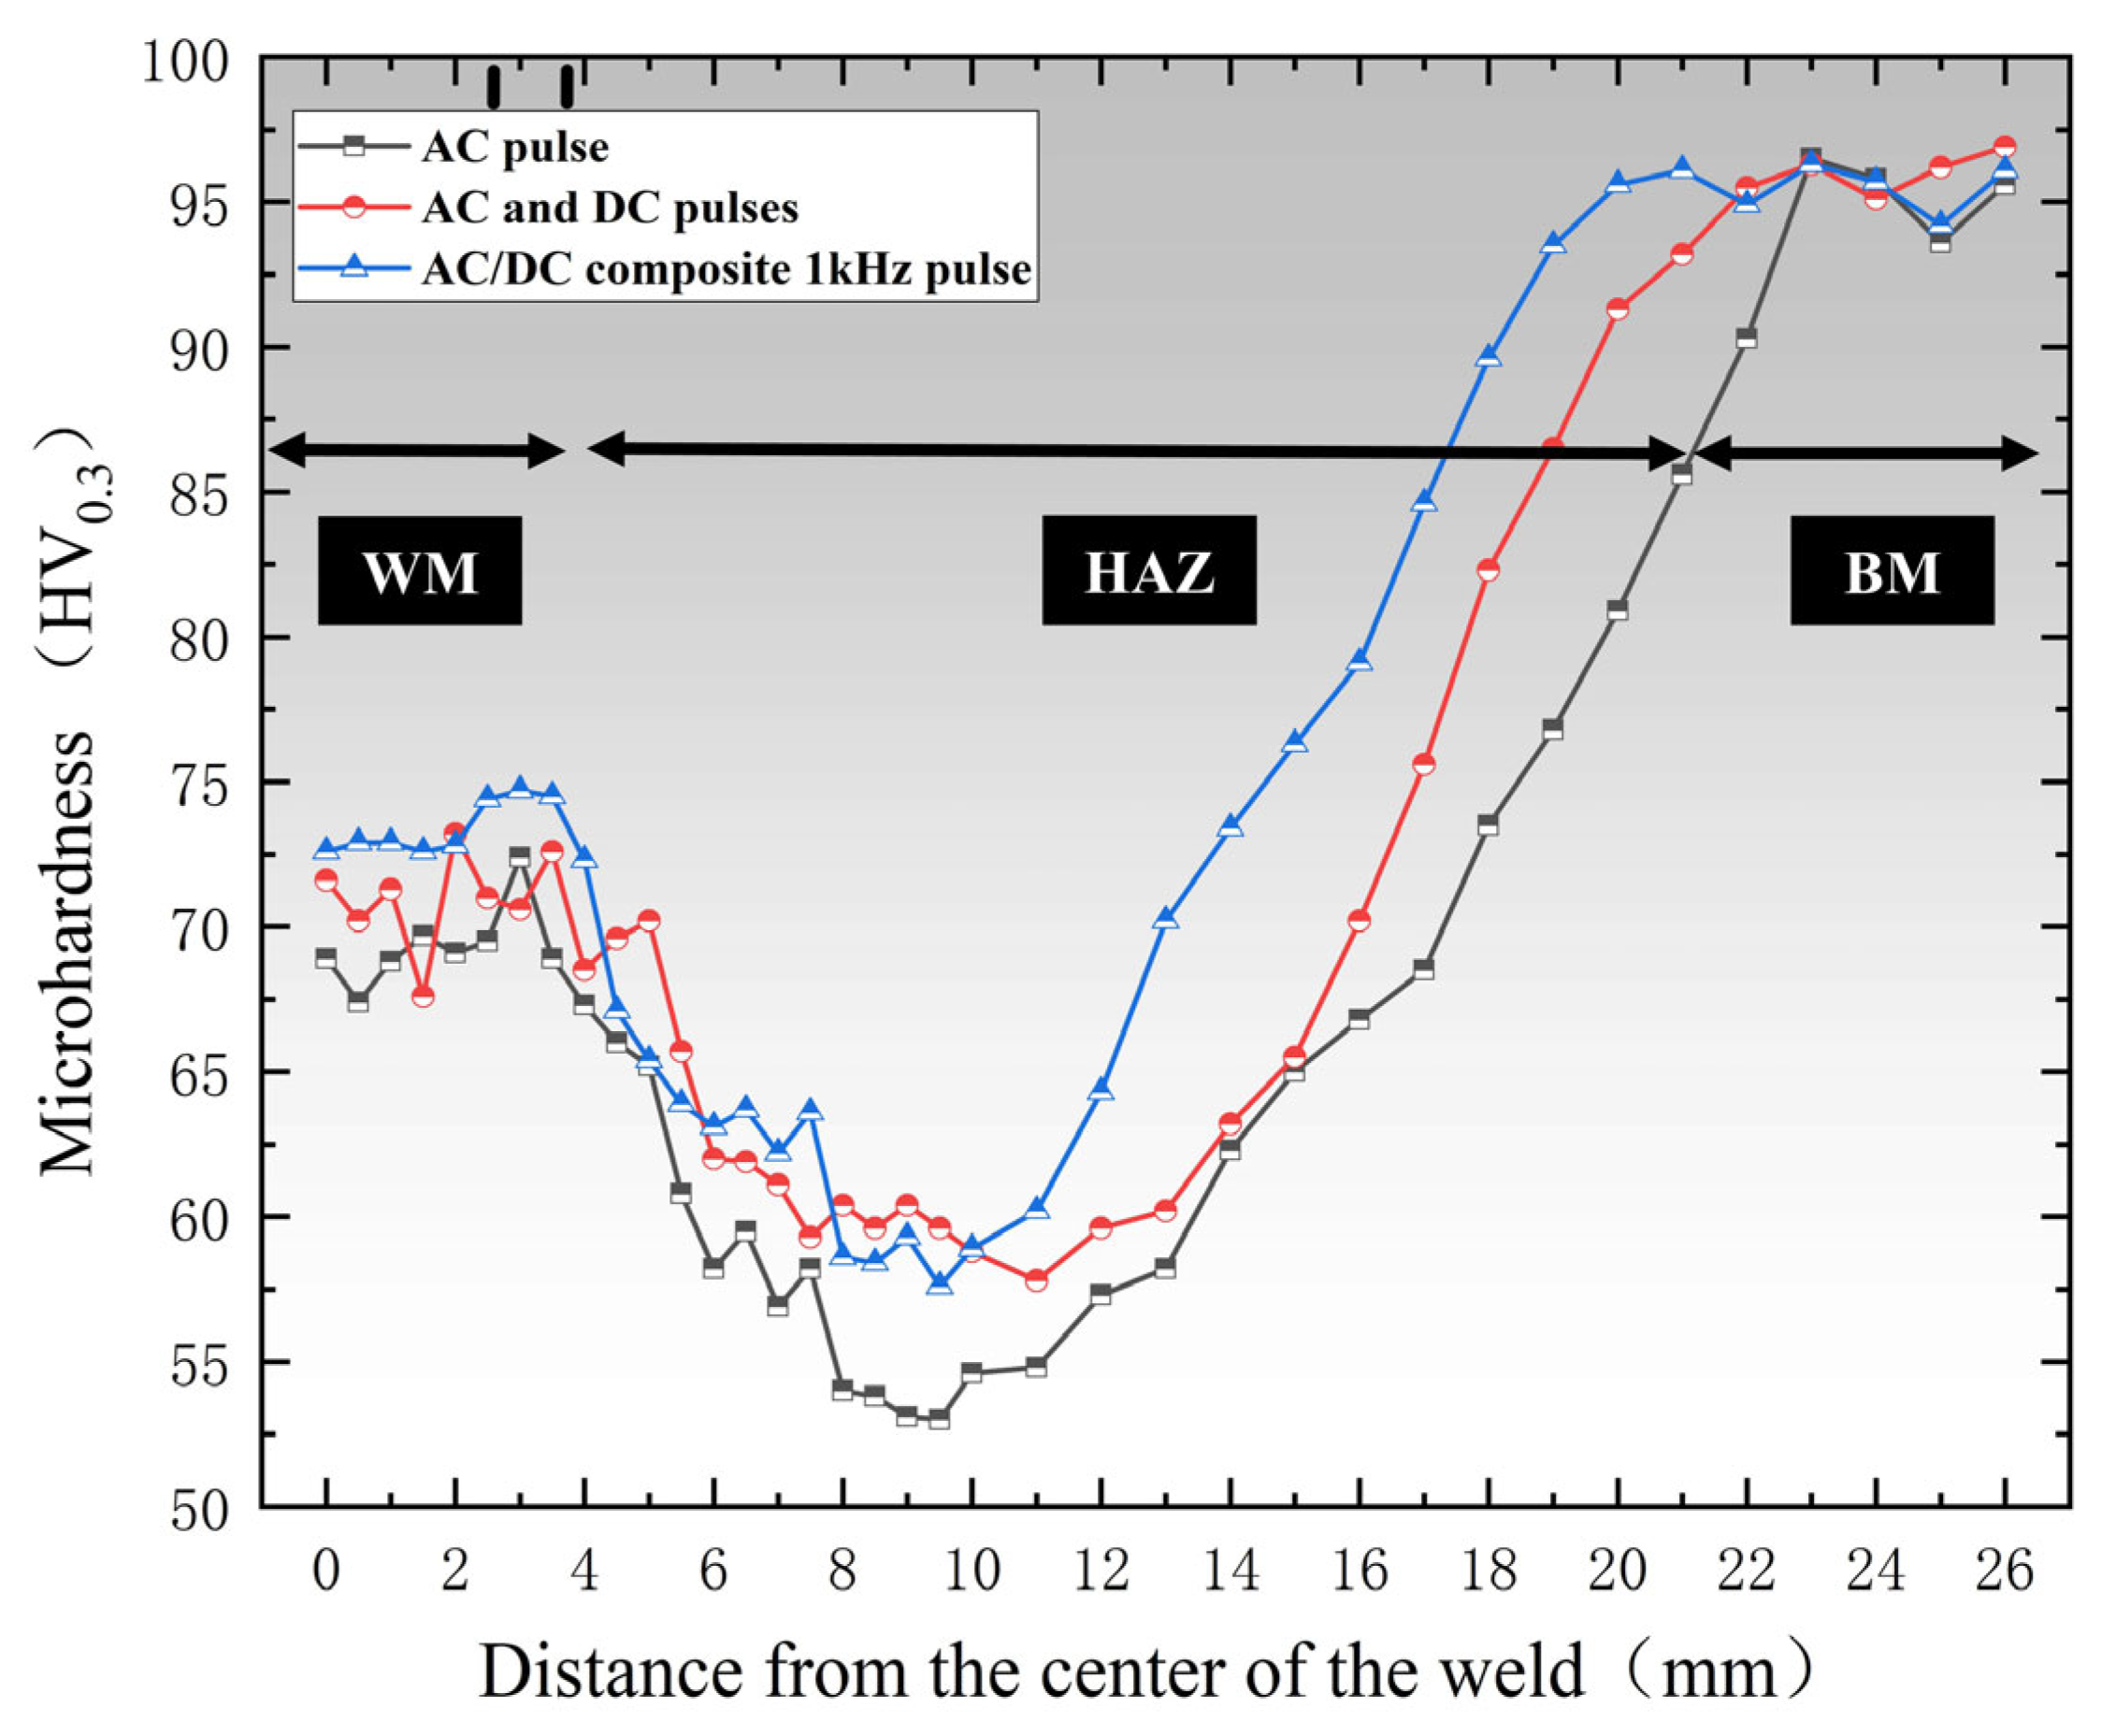
Figure 20 shows the microhardness tests of three groups of wave welds. The changing trends of the hardness test results of the three groups are the same. The fusion line is close to the solid–liquid phase line of the molten pool. The test near the molten pool is due to the precipitation of Si in the filler wire and the precipitation of Mg in the base metal into the molten pool, which promotes the formation of Mg2Si and the hardness is higher than that of WM. The average hardness of the AC pulse, AC/DC pulse and AC/DC composite 1 kHz pulse experimental groups within WM (the first six sample points) was 68.9 HV, 70.8 HV, and 73.1 HV, respectively, and the average hardness value of the base material was 94.2 HV [16]. The hardness of the WM zone of the AC/DC composite 1 kHz pulse joint could reach 77.6% of the base material. The average hardness value of the WM zone in the AC/DC composite 1 kHz frequency pulse weld was increased by 6.09% compared with the AC pulse weld experimental group, which is similar to the trend of Peng et al.’s research results [22]. The AC/DC composite 1 kHz pulse process narrows the heat-affected zone of the weld seam, reducing the coarsening and melting degree of the strengthening phase in the heat-affected zone. The 1 kHz pulse process of AC/DC composite can enhance the hardness of the joint by improving the grain refinement at the center of the weld [32], the dislocation hindrance of the weld center structure and the high density of the grain boundary network [33], and the extensive distribution of the Al-Si eutectic structure at the grain boundaries.

4. Conclusions

The changes in electrical signal and arc morphology, macroscopic forming of joints, and characterization of joint microstructure were compared and hardness analysis under different processes for 3 mm thin sheets of 6061 aluminum alloy was conducted. The following conclusions were drawn:
(1)
The AC/DC composite 1 kHz pulse process features flexibility, arc contraction (The arc diameter has increased to 4.042 mm), and enhanced input efficiency of the molten pool. The “stirring” of the molten pool accelerates its cooling and reduces the heat-affected zone.
(2)
AC/DC compound 1 KHZ pulse process can effectively improve the weld joint of depth-to-width ratio, inhibit columnar dendrite area expansion, and inhibit the growth of weld porosity.
(3)
AC/DC compound 1 KHZ pulse process refining the WM zone of weld grain (the average grain size has decreased to 51.4 μm). The texture strength is reduced, the proportion of HAGBs is high, and the Al-Si eutectic structure is uniformly distributed, resulting in strong dislocation obstruction.
(4)
AC/DC compound 1 KHZ pulse technology improves the hardness of the weld joint; WM can be up to 77.6% of the average hardness of the parent metal hardness.

Author Contributions

Conceptualization, F.L. and X.Y., methodology, G.Z., G.C., P.X., F.L. and X.Y., software—validation, F.L. and X.Y., formal analysis, G.Z., G.C., P.X. and Y.D., investigation, F.L. and X.Y., resources, F.L. and X.Y., data curation, G.Z., writing—original draft preparation, G.Z., writing—review and editing, F.L. and X.Y., visualization—supervision, Y.D., F.L. and X.Y., project administration, F.L. and X.Y. funding acquisition, F.L. and X.Y. All authors have read and agreed to the published version of the manuscript.

Funding

This research was supported by the Innovation Fund of the National Engineering Research Center for Commercial Aircraft Manufacturing (COMAC-SFGS-2024-569) and the National Natural Science Foundation of China (NSFC, No. 52475384).

Data Availability Statement

The original contributions presented in this study are included in the article. Further inquiries can be directed to the corresponding author.

Acknowledgments

The authors acknowledge the Innovation Fund of the National Engineering Research Center for Commercial Aircraft Manufacturing (COMAC-SFGS-2024-569) and the National Natural Science Foundation (NSFC, No. 52475384) for their support of this article.

Conflicts of Interest

Author Yonggang Du was employed by the company COMAC Shanghai Aircraft Manufacturing Co., Ltd. The remaining authors declare that the research was conducted in the absence of any commercial or financial relationships that could be construed as a potential conflict of interest.

References

  1. Huang, C.; Liu, J.; Jia, X. Effect of thermal deformation parameters on the microstructure, texture, and microhardness of 5754 aluminum alloy. Int. J. Miner. Metall. Mater. 2019, 26, 1140–1150. [Google Scholar] [CrossRef]
  2. Yang, Y.; Li, M.; Li, K.R. Comparison and analysis of main effect elements of machining distortion for aluminum alloy and titanium alloy aircraft monolithic component. Int. J. Adv. Manuf. Technol. 2014, 70, 1803–1811. [Google Scholar] [CrossRef]
  3. Hakem, M.; Lebaili, S.; Mathieu, S.; Miroud, D.; Lebaili, A.; Cheniti, B. Effect of microstructure and precipitation phenomena on the mechanical behavior of AA6061-T6 aluminum alloy weld. Int. J. Adv. Manuf. Technol. 2019, 102, 2907–2918. [Google Scholar] [CrossRef]
  4. Li, Y.; Zou, W.; Lee, B.; Babkin, A.; Chang, Y. Research progress of aluminum alloy welding technology. Int. J. Adv. Manuf. Technol. 2020, 109, 1207–1218. [Google Scholar] [CrossRef]
  5. Wang, Z.; Lu, G.; Hu, C.; Lin, S.; Ren, X.; Wu, J.; Tian, J. A review on fast-frequency pulse TIG welding technology. Weld. Int. 2022, 36, 510–521. [Google Scholar] [CrossRef]
  6. Nikseresht, Z.; Karimzadeh, F.; Golozar, M.A.; Heidarbeigy, M. Effect of heat treatment on microstructure and corrosion behavior of Al6061 alloy weldment. Mater. Des. 2010, 31, 2643–2648. [Google Scholar] [CrossRef]
  7. Samiuddin, M.; Li, J.; Taimoor, M.; Siddiqui, M.N.; Siddiqui, S.U.; Xiong, J.-T. Investigation on the process parameters of TIG-welded aluminum alloy through mechanical and microstructural characterization. Def. Technol. 2021, 17, 1234–1248. [Google Scholar] [CrossRef]
  8. Chen, X.; Tang, S.; Xie, W.; Zhang, D. Numerical Simulation Study of Laser-arc Hybrid Welding of 6063/5083 Aluminum Alloy. J. Mater. Eng. Perform. 2025, 34, 9342–9351. [Google Scholar] [CrossRef]
  9. Yue, Y.; Wang, G.; Yang, K.; Wu, B.; Yan, D. Friction stir butt welding thin aluminum alloy sheets. Int. J. Adv. Manuf. Technol. 2018, 96, 3139–3147. [Google Scholar] [CrossRef]
  10. Zhang, W.; Wang, S. Investigation of Laser-MIG Hybrid Welding of Al-Mg-Si Aluminum Alloy. Metals 2024, 14, 729. [Google Scholar] [CrossRef]
  11. Bardel, D.; Nelias, D.; Robin, V.; Pirling, T.; Boulnat, X.; Perez, M. Residual stresses induced by electron beam welding in a 6061 aluminium alloy. J. Mater. Process. Technol. 2016, 235, 1–12. [Google Scholar] [CrossRef]
  12. Norrish, J. 1—An introduction to welding processes. In Advanced Welding Processes; Norrish, J., Ed.; Woodhead Publishing: Sawston, UK, 2006; pp. 1–15. [Google Scholar]
  13. Ye, Y.; Yang, B.; Yang, Y.; Pan, Z.; Chen, C.; Zhang, X. Research on the Formation, Microstructure, and Properties of 304 Stainless Steel AC-DC Hybrid TIG Welding. Metals 2023, 13, 1127. [Google Scholar] [CrossRef]
  14. Guo, B.; Cong, X.; Du, W.; Zhang, H.; Chen, C. Effect of AC signal ratio on the formation, microstructure and mechanical properties of welded joint of AZ31B Mg alloy during the AC/DC mix GTAW. J. Manuf. Process. 2023, 85, 306–313. [Google Scholar] [CrossRef]
  15. Han, Y.; Chen, S.; Yin, S. Principle of produced heat by arc properties in VPPA of aluminum alloy. Trans. China Weld. Inst. 2007, 12, 35–37,42. [Google Scholar]
  16. Wang, Y.; Chen, M.; Wu, C. High-frequency pulse-modulated square wave AC TIG welding of AA6061-T6 aluminum alloy. Weld. World 2020, 64, 1749–1762. [Google Scholar] [CrossRef]
  17. Morisada, Y.; Fujii, H.; Inagaki, F.; Kamai, M. Development of high frequency tungsten inert gas welding method. Mater. Des. 1980–2015 2013, 44, 12–16. [Google Scholar] [CrossRef]
  18. Meng, Y.; Yu, Q.; Gao, M.; Chen, H.; Jiang, Y.; Yang, Z. High-frequency oscillating laser-arc hybrid welding of 8-mm-thick high-strength aluminum alloy through synchronous wire-powder feeding. Int. J. Heat Mass Transf. 2024, 222, 125180. [Google Scholar] [CrossRef]
  19. Yang, M.; Zheng, H.; Li, L. Arc Shape Characteristics with Ultra-High-Frequency pulsed Arc Welding. Appl. Sci. 2017, 7, 45. [Google Scholar] [CrossRef]
  20. ASTM RR-B07-1001; B0647—Test Method for Indentation Hardness of Aluminum Alloys by Means of a Webster Hardness Gage. ASTM: West Conshohocken, PA, USA, 2023.
  21. Han, Y.; Hong, H.; Guo, L.; Yao, Q. Vertical welding of aluminum alloy during variable polarity plasma arc welding process with AC-DC mixing output current. Trans. China Weld. Inst. 2013, 9, 59–62. [Google Scholar]
  22. Peng, Z.; Liang, Y.; Liu, H.; Wang, F.; Yang, J.; Song, Y. Research on Process Characteristics and Properties in Deep-Penetration Variable-Polarity Tungsten Inert Gas Welding of AA7075 Aluminum Alloy. Metals 2024, 14, 1068. [Google Scholar] [CrossRef]
  23. Wu, K.; Liu, Z.; Chen, Q.; Wu, Y.; Chen, Z.; Hong, X. Effect of high-frequency pulse frequency on arc characteristics and weld formation of aluminum alloy in variable polarity 1 kHz pulse GMAW. Weld. World 2025, 69, 2691–2709. [Google Scholar] [CrossRef]
  24. Wang, Z.; Jiang, D.; Wu, J.; Xu, M. A review on high-frequency pulsed arc welding. J. Manuf. Process. 2020, 60, 503–519. [Google Scholar] [CrossRef]
  25. Mesbah, M.; Fadaeifard, F.; Nasiri-Tabrizi, B.; Matori, K.; Basirun, W. The impacts of grain boundary on the scattering of intermetallics in friction-stir-welded AA6061-T6. Mater. Lett. 2021, 300, 130206. [Google Scholar] [CrossRef]
  26. Liu, X.; Jia, R.; Zhang, H.; Cheng, W.; Zhai, X. EBSD Characterization of the Microstructure of 7A52 Aluminum Alloy Joints Welded by Friction Stir Welding. Materials 2021, 14, 6362. [Google Scholar] [CrossRef] [PubMed]
  27. Wang, Z.; Xu, Y. A quasi-in-situ EBSD study on abnormal grain growth in 2219 aluminum alloy friction stir welded joints during post-weld heat treatment. Mater. Des. 2024, 247, 113386. [Google Scholar] [CrossRef]
  28. Liang, Y.; Hu, S.; Shen, J.; Zhang, H.; Wang, P. Geometrical and microstructural characteristics of the TIG-CMT hybrid welding in 6061 aluminum alloy cladding. J. Mater. Process. Technol. 2017, 239, 18–30. [Google Scholar] [CrossRef]
  29. Liang, Y.; Shen, J.; Hu, S.; Wang, H.; Pang, J. Effect of TIG current on microstructural and mechanical properties of 6061-T6 aluminium alloy joints by TIG–CMT hybrid welding. J. Mater. Process. Technol. 2018, 255, 161–174. [Google Scholar] [CrossRef]
  30. Selvamani, S.T. Microstructure and stress corrosion behaviour of CMT welded AA6061 T-6 aluminium alloy joints. J. Mater. Res. Technol. 2021, 15, 315–326. [Google Scholar] [CrossRef]
  31. Li, R.; Yuan, X.; Zhang, H.; Yang, J.; Wu, K.; Li, T.; Wang, G.; Tao, S. Effect of axial magnetic field on TIG welding–brazing of AA6061 aluminum alloy to HSLA350 steel. J. Mater. Res. Technol. 2021, 12, 882–893. [Google Scholar] [CrossRef]
  32. Han, J.; Shi, Y.; Zhang, G.; Volodymyr, K.; Le, W.-Y. Minimizing defects and controlling the morphology of laser welded aluminum alloys using power modulation-based laser beam oscillation. J. Manuf. Process. 2022, 83, 49–59. [Google Scholar] [CrossRef]
  33. Xia, Y.; Dong, B.; Cai, X.; Chen, Q.; Fan, Y.; Lin, S. Ultrasonic-driven grain refinement in high-frequency pulsed welding of Inconel 690 alloy: Interplay between ultrasonic and molten pool dynamic. J. Manuf. Process. 2025, 146, 172–190. [Google Scholar] [CrossRef]
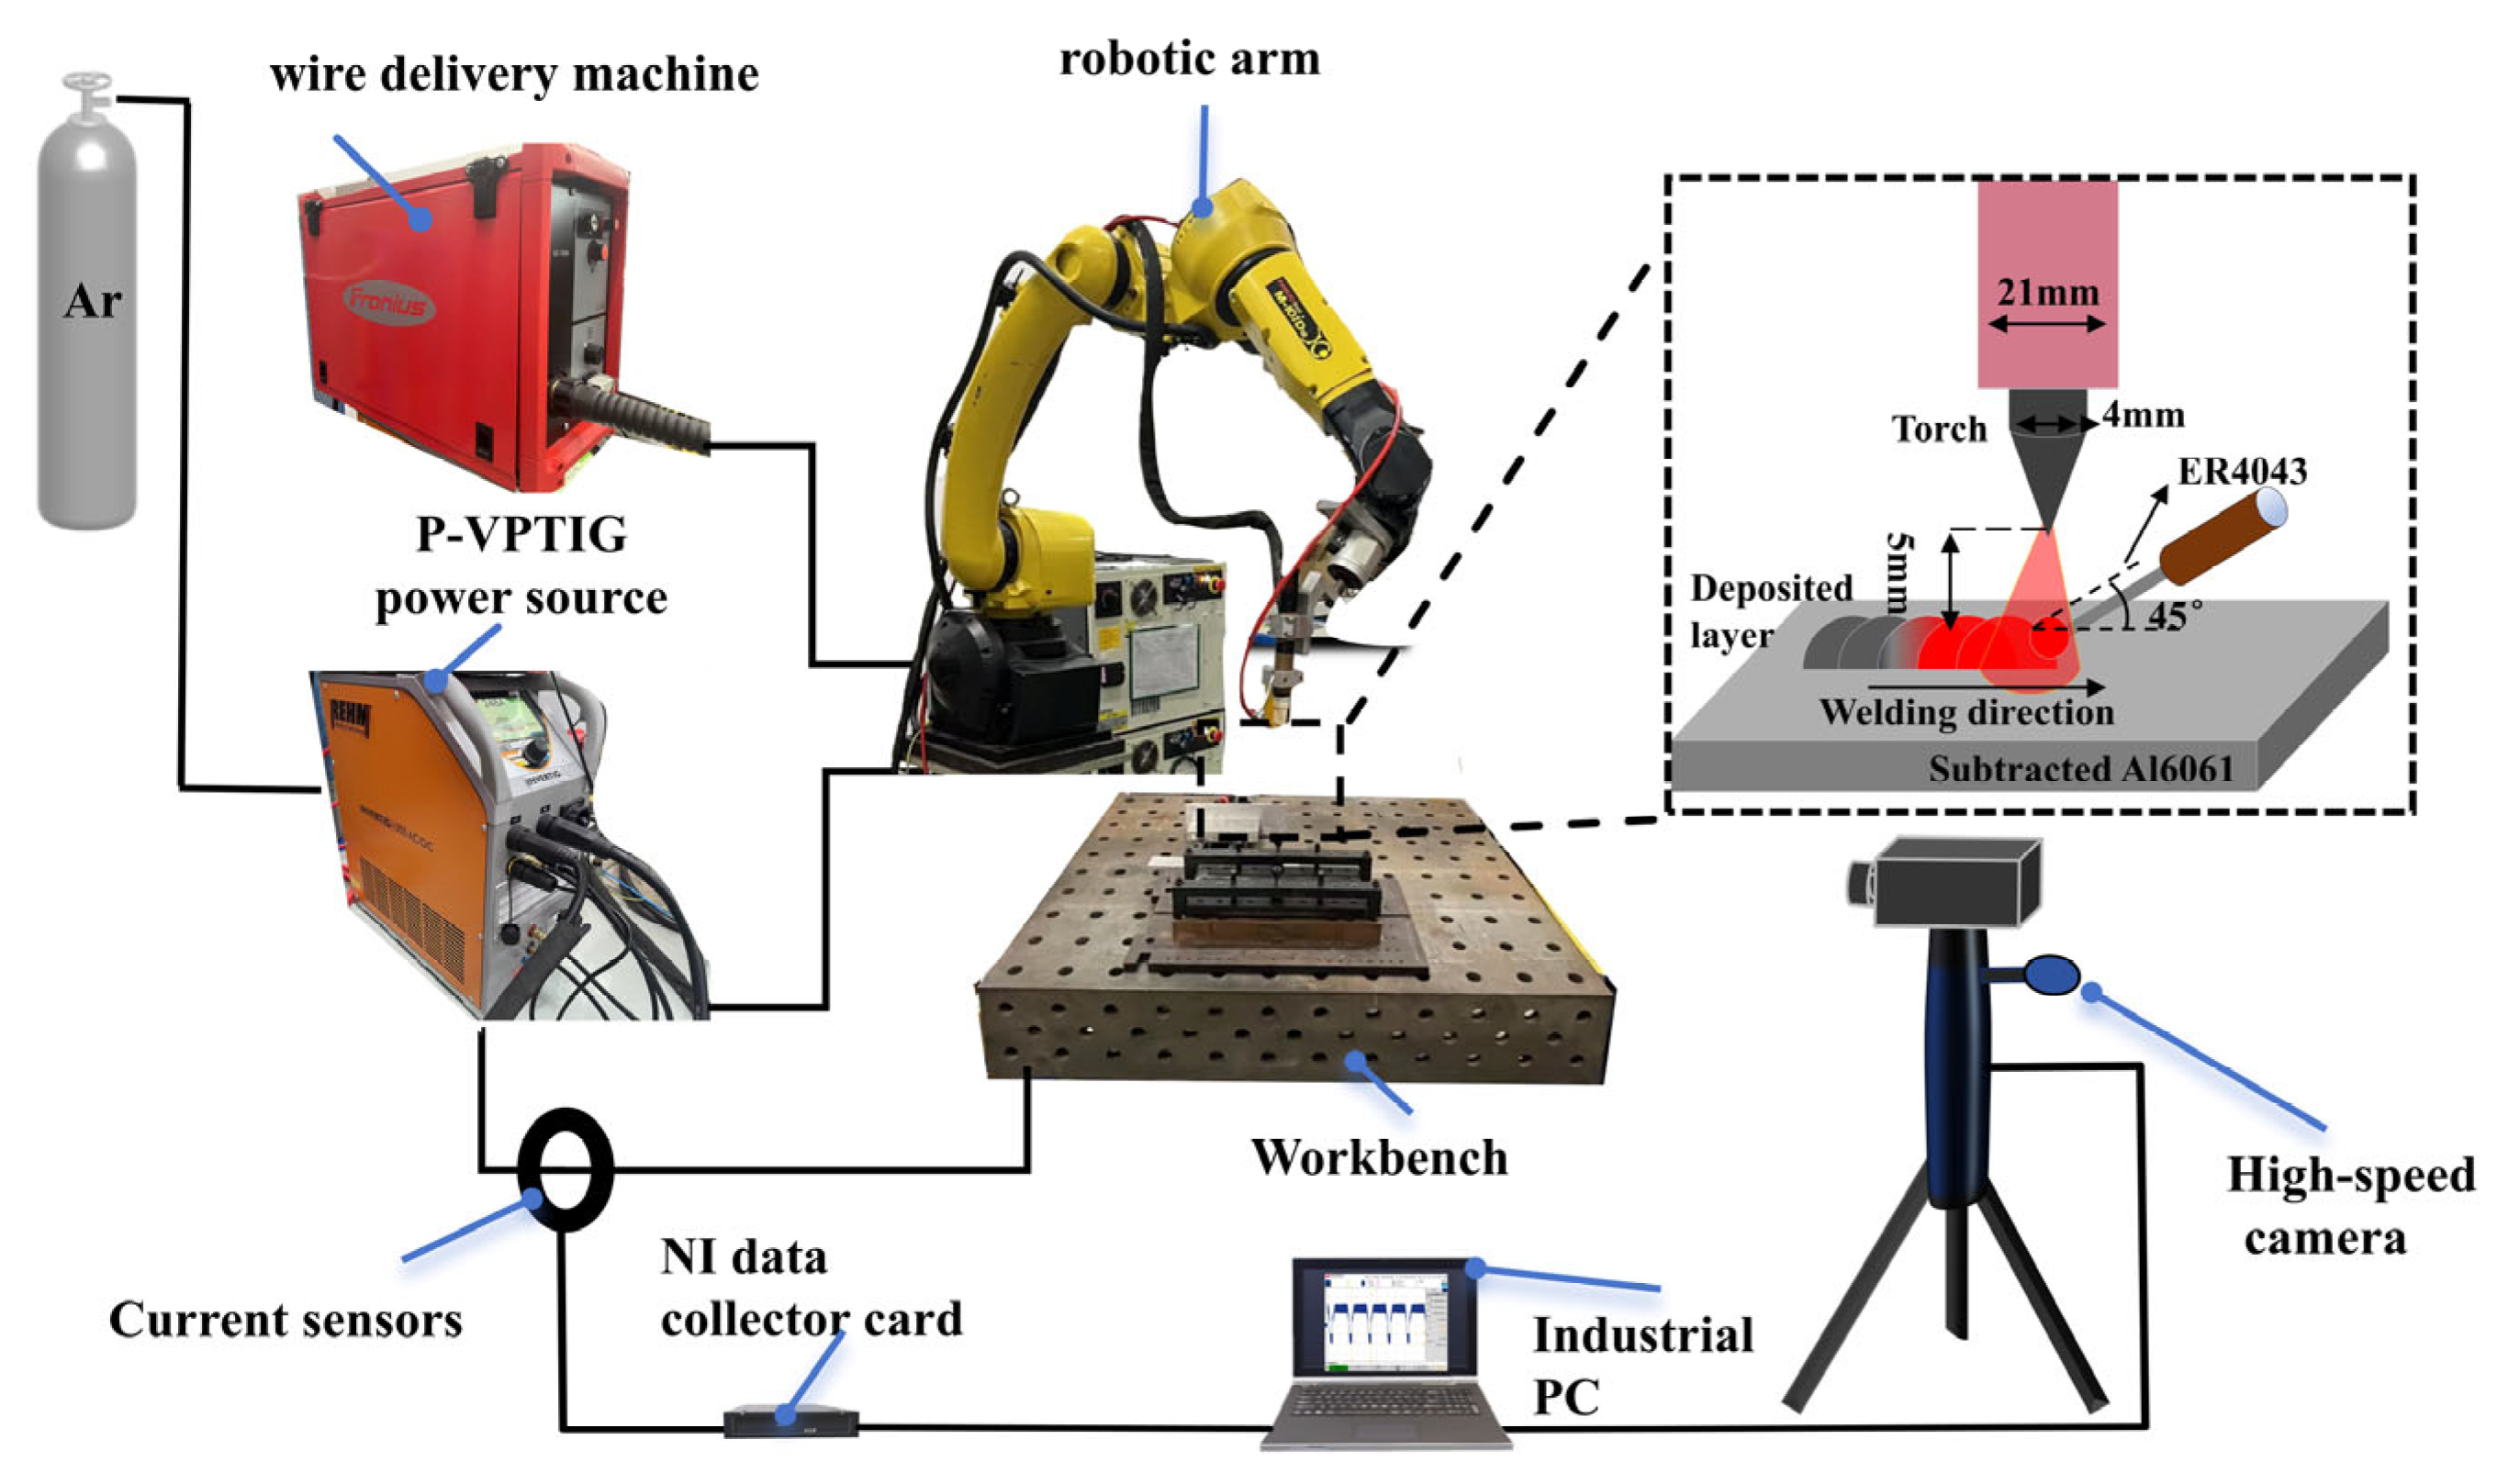
Figure 1. Welding operating system.
Metals 15 01294 g001
Figure 2. Diagram of proportional arc energy.
Metals 15 01294 g002
Figure 3. Schematic diagram of hardness sample testing (ECZ: equiaxed crystals zone, CCZ: columnar crystals zone, FL: fusion line, HAZ: heat affected zone, BM: base metal zone).
Metals 15 01294 g003
Figure 4. Welding current waveform.
Metals 15 01294 g004
Figure 5. Current waveform and arc shape ((a) AC pulse, (b) AC/DC pulse, (c) AC/DC compound 1 kHz pulse).
Metals 15 01294 g005
Figure 6. Arc diameters of three groups of processes.
Metals 15 01294 g006
Figure 7. Average diameter of arc.
Metals 15 01294 g007
Figure 8. Macroscopic welds of different waveform signals.
Metals 15 01294 g008
Figure 9. Macroscopic weld seam testing ((a) testing position for weld depth and width, (b) weld width, (c) weld thickness).
Metals 15 01294 g009
Figure 10. Diagram of molten pool effect by frequency pulsed arc.
Metals 15 01294 g010
Figure 11. Joint sectional metallographic; three sets of process.
Metals 15 01294 g011
Figure 12. Width of growth zone of columnar crystals ((a) AC pulse, (b) AC/DC pulse, (c) AC/DC compound 1 kHz pulse, (d) statistics of average value of columnar crystal regions).
Metals 15 01294 g012
Figure 13. Weld porosity and schematic diagram of surface porosity of welds ((a) AC pulse, (b) AC/DC pulse, (c) AC/DC compound 1 kHz pulse, (d) Position and distribution of pores at the selection box).
Metals 15 01294 g013
Figure 14. (GB + IPF) diagrams, grain statistics, and polar diagrams of centers of three groups of process welds ((a1,a2) AC pulse process weld, (b1,b2) AC/DC pulse process weld, (c1,c2) AC/DC composite 1 kHz pulse process weld).
Metals 15 01294 g014
Figure 15. Grain boundary angles and GOS mapping at centers of three groups of process welds ((a1,a2) AC pulse process weld, (b1,b2) AC/DC pulse process weld, (c1,c2) AC/DC composite 1 kHz pulse process weld).
Metals 15 01294 g015
Figure 16. SEM surface scan distribution of Si elements in each region of Process 3. ((a1,a2) SEM surface scanning morphology and Si distribution of BM, (b1,b2) SEM surface scanning morphology and Si distribution of HAZ, (c1,c2) SEM surface scanning morphology and Si distribution of WM).
Metals 15 01294 g016
Figure 17. SEM images of WM region in Process 3 (wt% statistics of Al, Mg, Si elements in p1 and p2).
Metals 15 01294 g017
Figure 18. Al-Si eutectic area and proportion.
Metals 15 01294 g018
Figure 19. Si content precipitated at grain boundaries of three groups of experiments ((a) Process 1 AC pulse, (b) Process 2 AC/DC pulse, (c) Process 3 AC/DC composite 1 KHZ pulse).
Metals 15 01294 g019
Figure 20. Weld hardness tests of three groups of processes.
Metals 15 01294 g020
Table 1. Chemical composition of 6061 aluminum alloy (mass fraction, %).
AlloySiFeCuMnMgCrZnTiAl
Al60610.4–0.8<0.70.15–0.4<0.150.8–1.20.04–0.350.25<0.15Bal.
Table 2. Chemical composition of ER4043 aluminum alloy welding wire (mass fraction, %).
AlloySiFeCuMnMgOtherZnTiAl
ER40434.50.80.30.050.050.150.10.2Bal.
Table 3. Fixed welding parameters.
ParametersValue
Rated current (A)130
Welding speed Vw (cm, min)20
Wire feed rate Vf (m, min)1.8
The proportion of AC and DC pulse time (AC-0.3 s, DC-0.2 s)3:2
The protective gas is 99.99% industrial pure argon (L, min)15
Table 4. Welding experiment process.
SignalCurrent ValueDCLow-Frequency PulsesHigh-Frequency Pulses
Process Sequence Number Waveform Peak Current Ip, A Background Current Ib, A Yes, No Frequency f1, Hz Duty Cycle θ Frequency f2, kHz Duty Cycle δ
1square00No2005000
2square00Yes2005000
3square17090Yes20050150
Disclaimer/Publisher’s Note: The statements, opinions and data contained in all publications are solely those of the individual author(s) and contributor(s) and not of MDPI and/or the editor(s). MDPI and/or the editor(s) disclaim responsibility for any injury to people or property resulting from any ideas, methods, instructions or products referred to in the content.