Article

The Effect of In-Situ-Grown Graphene from Highland Barley Powder on the Properties of Copper Matrix Materials

College of Chemistry and Materials Science, Qinghai Minzu University, Xining 810007, China
*
Author to whom correspondence should be addressed.
Metals 2025, 15(11), 1217; https://doi.org/10.3390/met15111217
Submission received: 25 September 2025 / Revised: 27 October 2025 / Accepted: 31 October 2025 / Published: 2 November 2025
(This article belongs to the Section Powder Metallurgy)

Abstract

In situ graphene was grown on the surface of copper particles using highland barley powder, which is rich in sucrose and β-glucan, as a carbon source. The graphene content in the graphene-coated copper (Gr@Cu) composite powder was 4.98 wt.%. A characteristic angle of approximately 14° was observed between the graphene and copper crystal planes, indicating strong interfacial bonding. Raman spectroscopy revealed an ID/IG ratio of 0.96 for the graphene. Owing to the in situ growth of graphene, the mechanical properties of the copper matrix are effectively strengthened. At a graphene content of 0.7 wt.%, the graphene was uniformly dispersed within the copper matrix, resulting in optimized mechanical properties of the composite. This composite exhibited a conductivity of 70% IACS and a compressive yield strength of 175 MPa.

1. Introduction

Copper matrix composites are a class of materials formed by incorporating reinforcing phases into a copper matrix [1,2,3]. Currently, commonly used reinforcing phases include carbides, oxides, and nitrides, such as SiC [4], WC [5], TiN [6], TiB [7], and Al3O2 [8]. The addition of these reinforcements significantly enhances the mechanical properties—such as compressive strength and hardness—of copper matrix composites compared to conventional copper materials. However, due to the inherently low electrical conductivity of most ceramic reinforcements, the electrical conductivity of these composites is often considerably reduced in comparison to pure copper. Therefore, achieving an optimal balance between electrical conductivity and mechanical performance is crucial for the advancement and application of copper matrix composites [9]. Graphene (Gr) has emerged as a promising reinforcing agent for copper-based matrices owing to its exceptional mechanical strength and high electrical conductivity [10,11].
Similar to other reinforcing phases, the effective enhancement of copper properties through graphene incorporation requires uniform dispersion of graphene within the copper matrix and strong interfacial bonding [12,13,14,15]. In the development of copper matrix composites, graphene agglomeration has emerged as a critical issue that limits their reinforcing efficiency. The van der Waals forces between graphene sheets tend to induce agglomeration, which severely compromises the continuity and integrity of the matrix material. To address this challenge, researchers have developed various strategies to achieve homogeneous graphene dispersion. Currently, the most widely adopted methods include the ball milling method [16], electrostatic adsorption method [17], molecular mixing method [18], and in situ growth method [19].
The in situ growth method usually refers to the in situ growth of gaseous carbon sources or solid carbon sources on the surface of copper particles into graphene. In situ graphene has a good interfacial bond with the copper matrix, and can overcome the van der Waals forces between the layers to achieve uniform dispersion in the copper matrix. The preparation of graphene using gaseous carbon sources, usually by chemical vapor deposition (CVD) [20], requires high temperatures and is complex to operate, often accompanied by problems such as copper powder consolidation. The preparation of graphene using a solid carbon source is far simpler than using a gaseous carbon source, often requiring only heat treatment and a lower temperature. Sun et al. [21] used the polymer polymethyl methacrylate as a solid carbon source and successfully prepared high-quality graphene on the surface of a copper matrix after conventional annealing treatment at 800 °C. Yang et al. [19] also used pure copper powder as a metal matrix and wheat powder as a solid carbon source to generate high-quality graphene in situ on the surface of copper powder by conventional annealing treatment, and then obtained graphene-coated copper composite powder. They used the prepared composite powder and pure copper powder mixed, using the powder metallurgy method to prepare graphene–copper matrix composite materials. The study shows that the composite exhibits both excellent electrical and mechanical properties thanks to the graphene grown on the surface of copper particles. However, many solid carbon sources are not cheap, so finding cheap and available solid carbon sources is of great significance. Inspired by Yang et al. [19], who used wheat flour as a solid carbon source, this study explores the use of highland barley powder, a characteristic agricultural product of the Qinghai–Tibet Plateau. While both are biomass sources, highland barley powder possesses a distinct chemical composition, notably richer in β-glucan and sucrose compared to wheat flour [22]. These components exhibit different pyrolysis pathways and carbon yields. The higher β-glucan content, a viscous polysaccharide, may influence the coating uniformity of the carbon precursor on copper particles. Furthermore, the specific decomposition kinetics of these components could lead to variations in the defect density and graphitization degree of the in-situ-grown graphene. Therefore, this work not only validates a low-cost and sustainable carbon source but also investigates the effect of a unique biomass composition on the quality of graphene and the subsequent properties of copper matrix composites, providing new insights into the selection and optimization of carbon precursors for metal matrix composites.
In summary, this study uses cheap highland barley powder as a solid carbon source and uses appropriate coating technology to prepare carbon-source-coated copper powder. A graphene-coated copper composite powder (Gr@Cu) was catalyzed by a copper matrix, and graphene/copper composites with different Gr contents (Gr@Cu/Cu) were prepared by a powder metallurgy process. The phase composition and micromorphology of the Gr@Cu composite powder and composites were characterized by XRD, SEM, and TEM. The effect of graphene prepared from highland barley powder on copper matrix composites was analyzed by electrical and mechanical properties tests. In addition, using the purchased graphene and carbon nanotubes as the reinforcement phase, the copper matrix composite material was prepared by the same molding process for the comparison of mechanical properties.

2. Experiment

The preparation of materials mainly includes the preparation of the Gr@Cu composite powder, the formation of the Gr@Cu/Cu composite, and the characterization and testing of the material. The preparation of the Gr@Cu composite powder and the formation of the Gr@Cu/Cu composite are shown in Figure 1.

2.1. Experimental Material

The highland barley powder produced by Gongga Shanzhen Food Company (Chengdu, China) has a particle size of 20 μm; the pure copper powder produced by Maya Reagent Co., Ltd. (Jiaxing, China), has a particle size of 25 μm; the graphene and carbon nanotubes were produced by Sahn Chemical Technology (Shanghai) Co., Ltd. (Shanghai, China). Anhydrous ethanol was produced by Anegi Chemicals (Shanghai, China).

2.2. Gr@Cu Preparation of Composite Powder

(1)
Copper-coated barley powder: According to a ball material ratio of 10:1, high-energy ball milling treatment of barley powder was carried out for 1 h, so that it was more soluble in anhydrous ethanol. Mix the ground barley powder with copper powder in a mass ratio of 1:4 by adding anhydrous ethanol. The beaker was heated to 70 °C, and a copper-powder-coated highland barley powder was obtained after stirring until the alcohol was completely evaporated.
(2)
Graphene growth: A tube furnace was used to heat treat the copper-coated upland barley powder to grow graphene. The rate of temperature increase was 5 °C/min, and nitrogen was introduced as a protective gas; when the temperature was increased to 800 °C, the graphene was held for 10 min with a constant nitrogen flow rate of 200 mL/min. After the holding procedure, the temperature was reduced to room temperature to obtain the Gr@Cu composite powder. A thermogravimetric analysis of carbon-source-coated copper powder was carried out using the same temperature program as that of the tube furnace. It was determined that the Gr content of the Gr@Cu composite powder was about 4.98 wt.%.

2.3. Gr@Cu/Cu Composite Forming

Formation of composite material: The Gr@Cu composite powder and pure copper powder were placed into a ball mill tank (Laibu Technology, Nanjing, China) for 60 min at a speed of 200 r/min. The ball-milled powder was sintered in a vacuum hot-press sintering furnace (Shanghai Chenhua Technology, Shanghai, China) at a pressure of 40 MPa and a temperature of 650 °C for 1 h, and a Gr@Cu/Cu composite was obtained after natural cooling. The Gr@Cu/Cu composites with graphene contents of 0.35 wt.%, 0.70 wt.%, and 1.05 wt.% were prepared by the above method. The Gr/Cu, CNT/Cu, and pure copper composites were prepared by using purchased graphene powder, carbon nanotubes, and copper powder under the same ball milling and sintering parameters and compared with the Gr@Cu/Cu composites prepared in this study.

2.4. Experimental Equipment

The weight variation of the copper precursor coated with highland barley powder was analyzed by a TG209F1 thermogravimetric analyzer produced by Nitsch Thermal Analysis Company (Shanghai, China). The structure of graphene in Gr@Cu was characterized by an In Via Reflex Raman spectrometer produced by Renishaw (Shanghai, China). The phase structure of the composite powder and composite materials was analyzed by an X-ray diffractometer D8 ADVANCE (XRD) from Bruker Instruments, Beijing, China. The micromorphology of the composite powder and composite materials was characterized by a Su-70 model scanning electron microscope (SEM) produced by Tianmei Yituo Experimental Equipment (Shanghai) Co., LTD (Shanghai, China). The element content and distribution of the composite materials and composite powders were characterized by an X-ray energy-dispersive spectrometer (EDS) produced by Oxford Instruments (Shanghai) Co., Ltd. (Shanghai, China). The interface of the composite powder was analyzed by an HT7800 model transmission electron microscope (TEM) manufactured by Hitachi Scientific Instruments (Beijing) Co., Ltd. (Beijing, China).
The electrical conductivity of the composite was measured by an SYT2263 four-probe resistivity meter produced by Suzhou Lattice Electronics Co., Ltd. (Suzhou, China). The density of the composite was measured using an AUY-120 density tester produced by SHIMADZU Company (Shanghai, China). A CMT5105 universal testing machine produced by Mester Industrial Systems (China) Co., Ltd. (Shenzhen, China), was used to test the compression property of the composite at room temperature.

3. Results and Discussion

3.1. Test Characterization of Gr@Cu Composite Powders Prepared from Highland Barley Flour

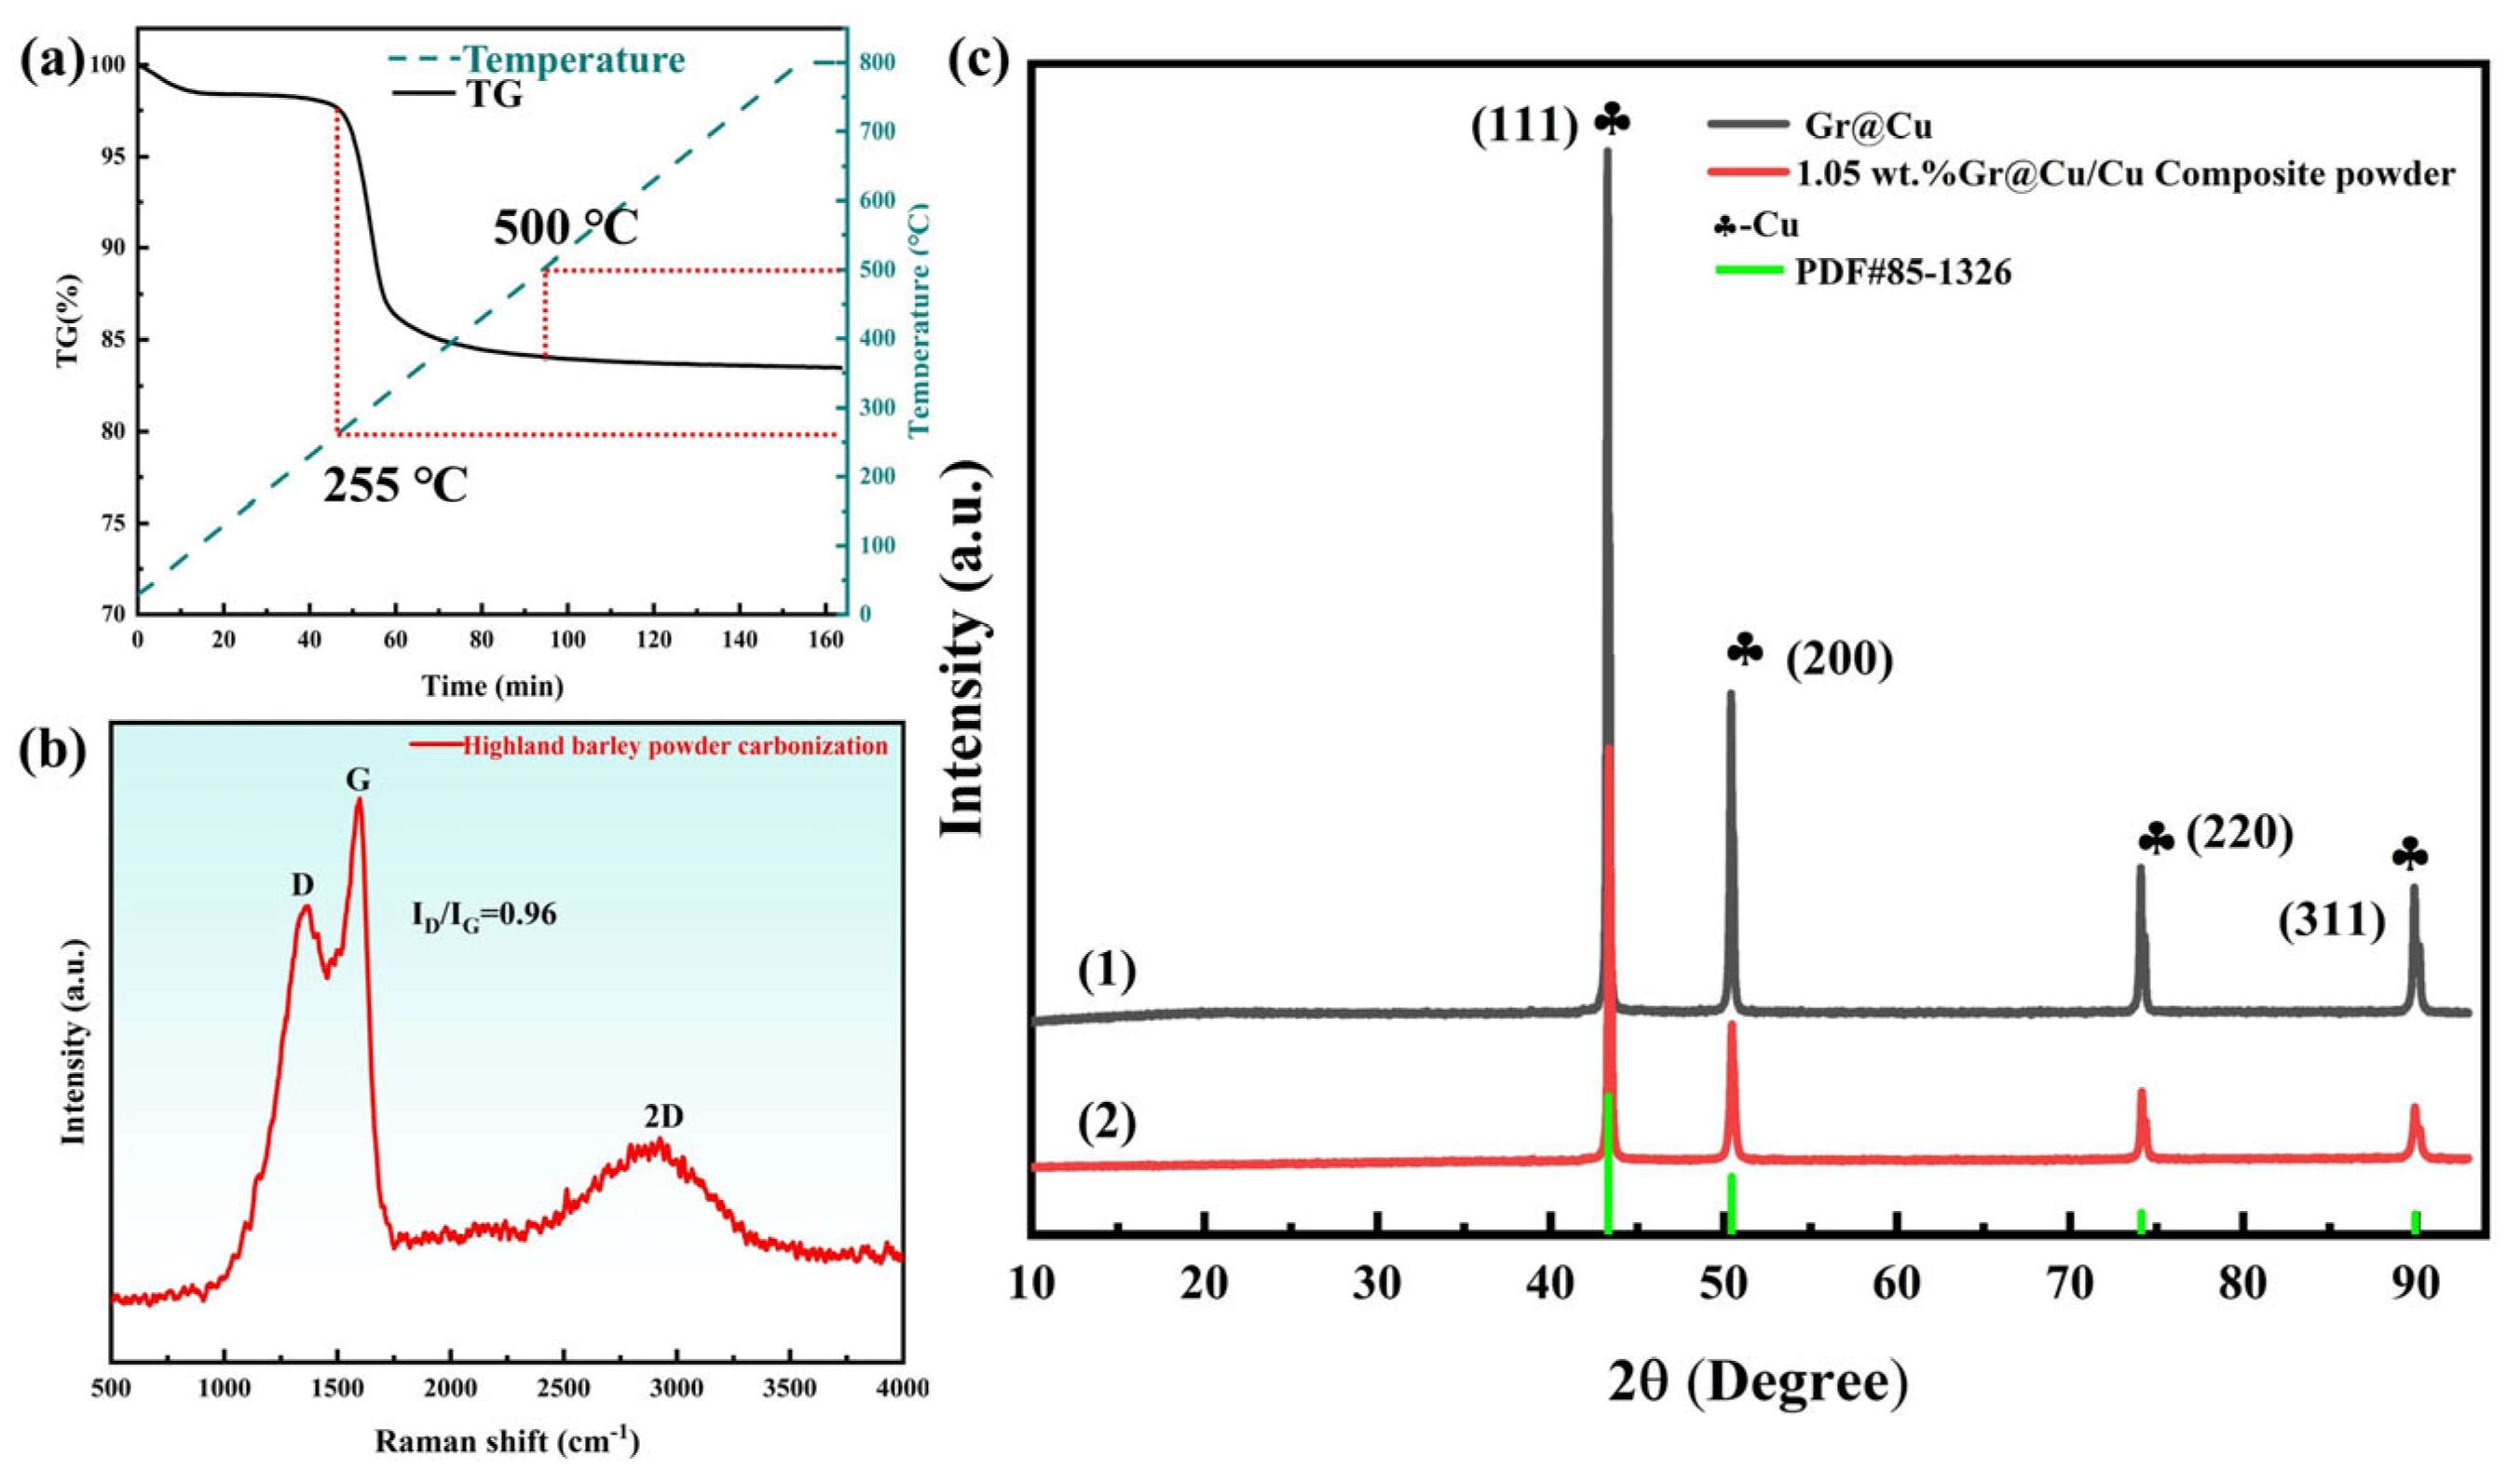
The weight change and temperature change of highland barley powder coated with copper powder in the process of copper matrix catalysis are shown in Figure 2a. The solid black line describes the change in mass, and the dotted green line shows the change in temperature over time. Generally speaking, the higher the growth temperature of graphene, the better, but the copper powder is easily consolidated when the temperature is too high, which is not conducive to the growth of graphene. Therefore, according to a study of Sun et al. [21], the maximum growth temperature of graphene was controlled at 800 °C. As can be seen from Figure 2a, when the temperature rises above 255 °C, the quality of the copper powder coated with highland barley powder decreases significantly. This stage corresponds to the catalytic decomposition process of highland barley powder, and the C-H bond begins to crack in large quantities. When the temperature reaches about 500 °C, the quality of the carbon-source-coated copper powder tends to be stable, and the graphene grows slowly. Finally, the mass of Gr@Cu composite powder is 84.19% of that of the initial highland barley powder coated with copper powder. Considering the mass ratio of the initial highland barley powder to copper powder is 1:4, the content of graphene in the Gr@Cu composite powder can be calculated as 4.98 wt.%.
Figure 2b presents the standardized Raman spectrum of the in-situ-grown graphene. The three characteristic peaks of carbon materials, namely the D, G, and 2D bands, are clearly observed. The intensity ratio I~D~/I~G~ is 0.96, indicating the presence of a certain density of defects in the graphene structure [23,24], which is typical for graphene derived from solid carbon sources. Furthermore, the shape and relative intensity of the 2D band provide critical information about the number of layers. The 2D band is broad and asymmetric, and its intensity ratio to the G band (I~2D~/I~G~) is approximately 0.7. This spectral feature—a low I~2D~/I~G~ ratio coupled with a broad, non-Lorentzian line shape—is a distinctive signature of few-layer graphene (FLG) consisting of three to five layers [25,26]. The estimation based on Raman spectroscopy is in high agreement with the 3–5-layer thicknesses directly measured by high-resolution transmission electron microscopy analysis (Figure 3b), confirming the few-layer nature of graphene successfully synthesized on copper particles. In addition, this value is comparable to that of wheat-flour-derived graphene (I~D~/I~G~ ≈ 0.94), as reported by Yang et al., suggesting similar defect levels. This suggests that despite the differences in the composition of the two biomass sources, the defect levels are comparable due to the similar chemical reduction process that graphene undergoes during synthesis. However, the subtle differences in 2D peak morphology and half-height width may suggest variations in stacking sequences or the number of layers, which can be attributed to the differential pyrolysis behavior of β-glucan versus sucrose in barley.
Figure 2c shows the phase composition of Gr@Cu composite powder. Curve (1) shows the Gr@Cu composite powder, and curve (2) shows the composite powder with a Gr content of 1.05 wt.% after Gr@Cu is mixed with pure copper. Although the Raman characteristic peaks of graphene were detected in Figure 2b, the two curves in Figure 2c only detected the (111), (200), (220), and (311) crystal plane diffraction of Cu. On the one hand, this is because the content of graphene is small; on the other hand, because copper serves as the background, its diffraction peak intensity is too large, making the graphene peak difficult to observe. The diffraction peak of copper in curve (1) is obviously higher than that in curve (2). Gr@Cu confirms the fact that the copper in the composite powder has undergone heat treatment during the growth of graphene, and its crystallinity is obviously higher than that of pure copper powder.
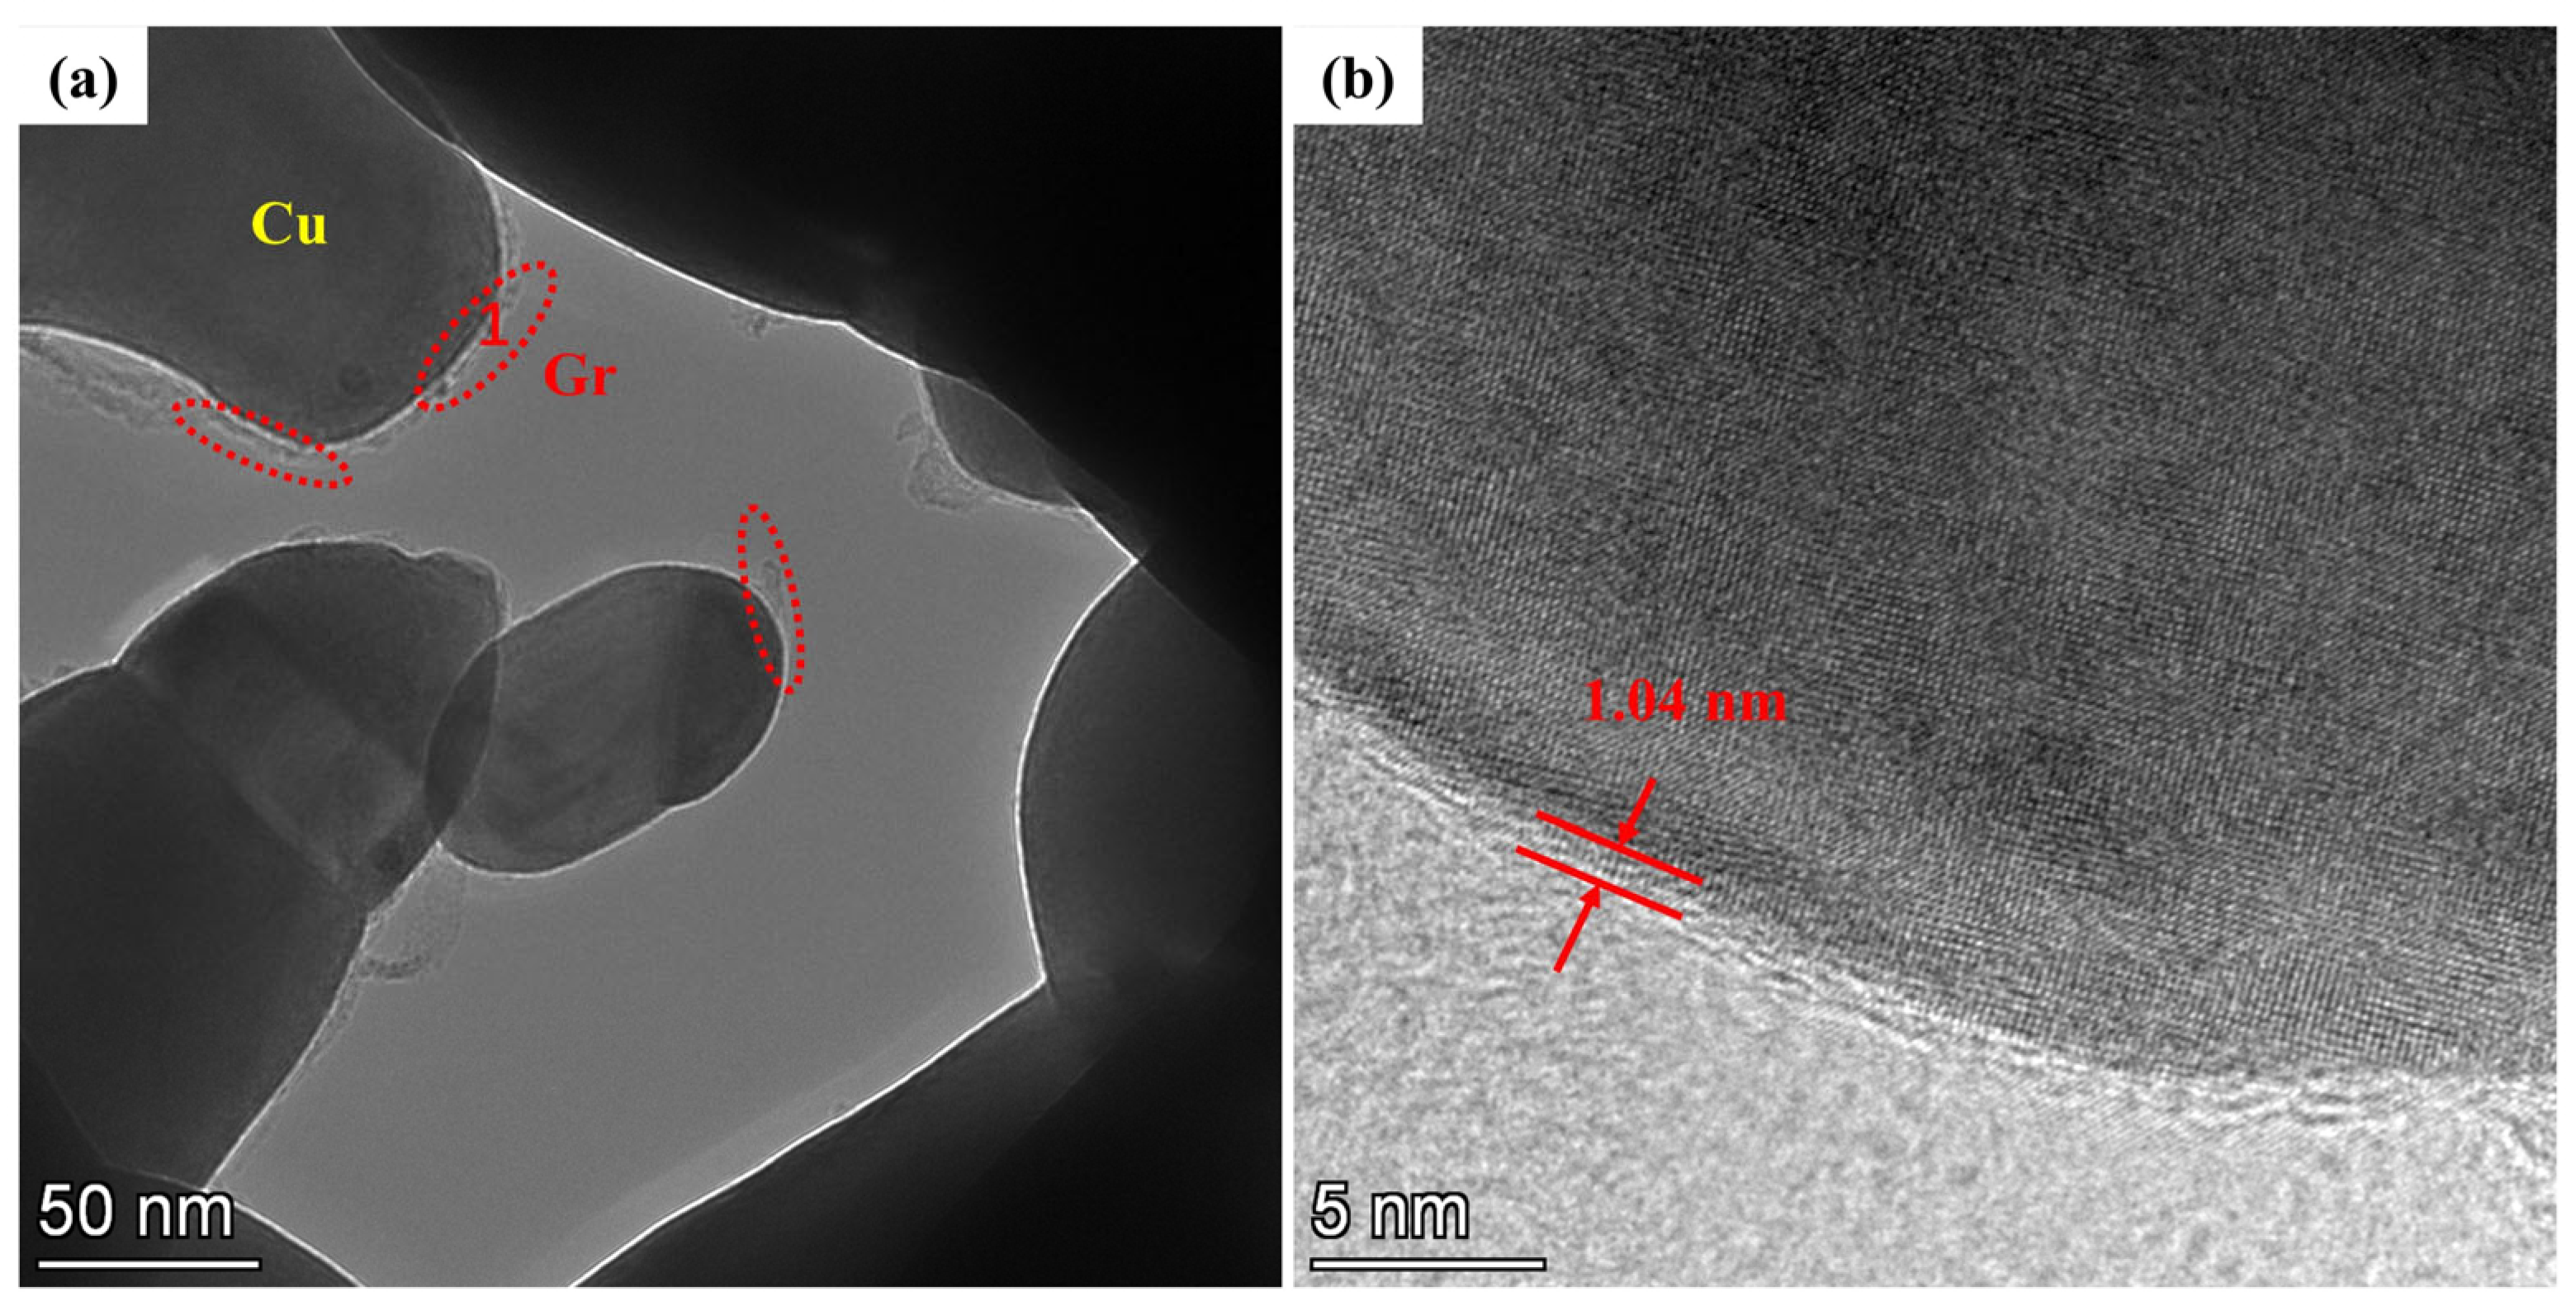
Figure 3 shows the microscopic morphology of the Gr@Cu composite powder under a transmission electron microscope. Figure 3a is a TEM image of the composite powder. Depending on the properties of TEM, copper with a larger atomic number should appear dark, and graphene with a smaller atomic number should appear light. From Figure 3a, it can be clearly seen that the surface of the copper matrix is covered with a layer of transparent yarn-like material, which is graphene. The red oval box in Figure 3a shows several typical graphene morphologies. Figure 3b in Figure 2 is an HRTEM image of the ellipse 1 region in Figure 3a. Through measurement and observation, the thickness of graphene is 1.04 nm, and the number of layers is about 3–5.
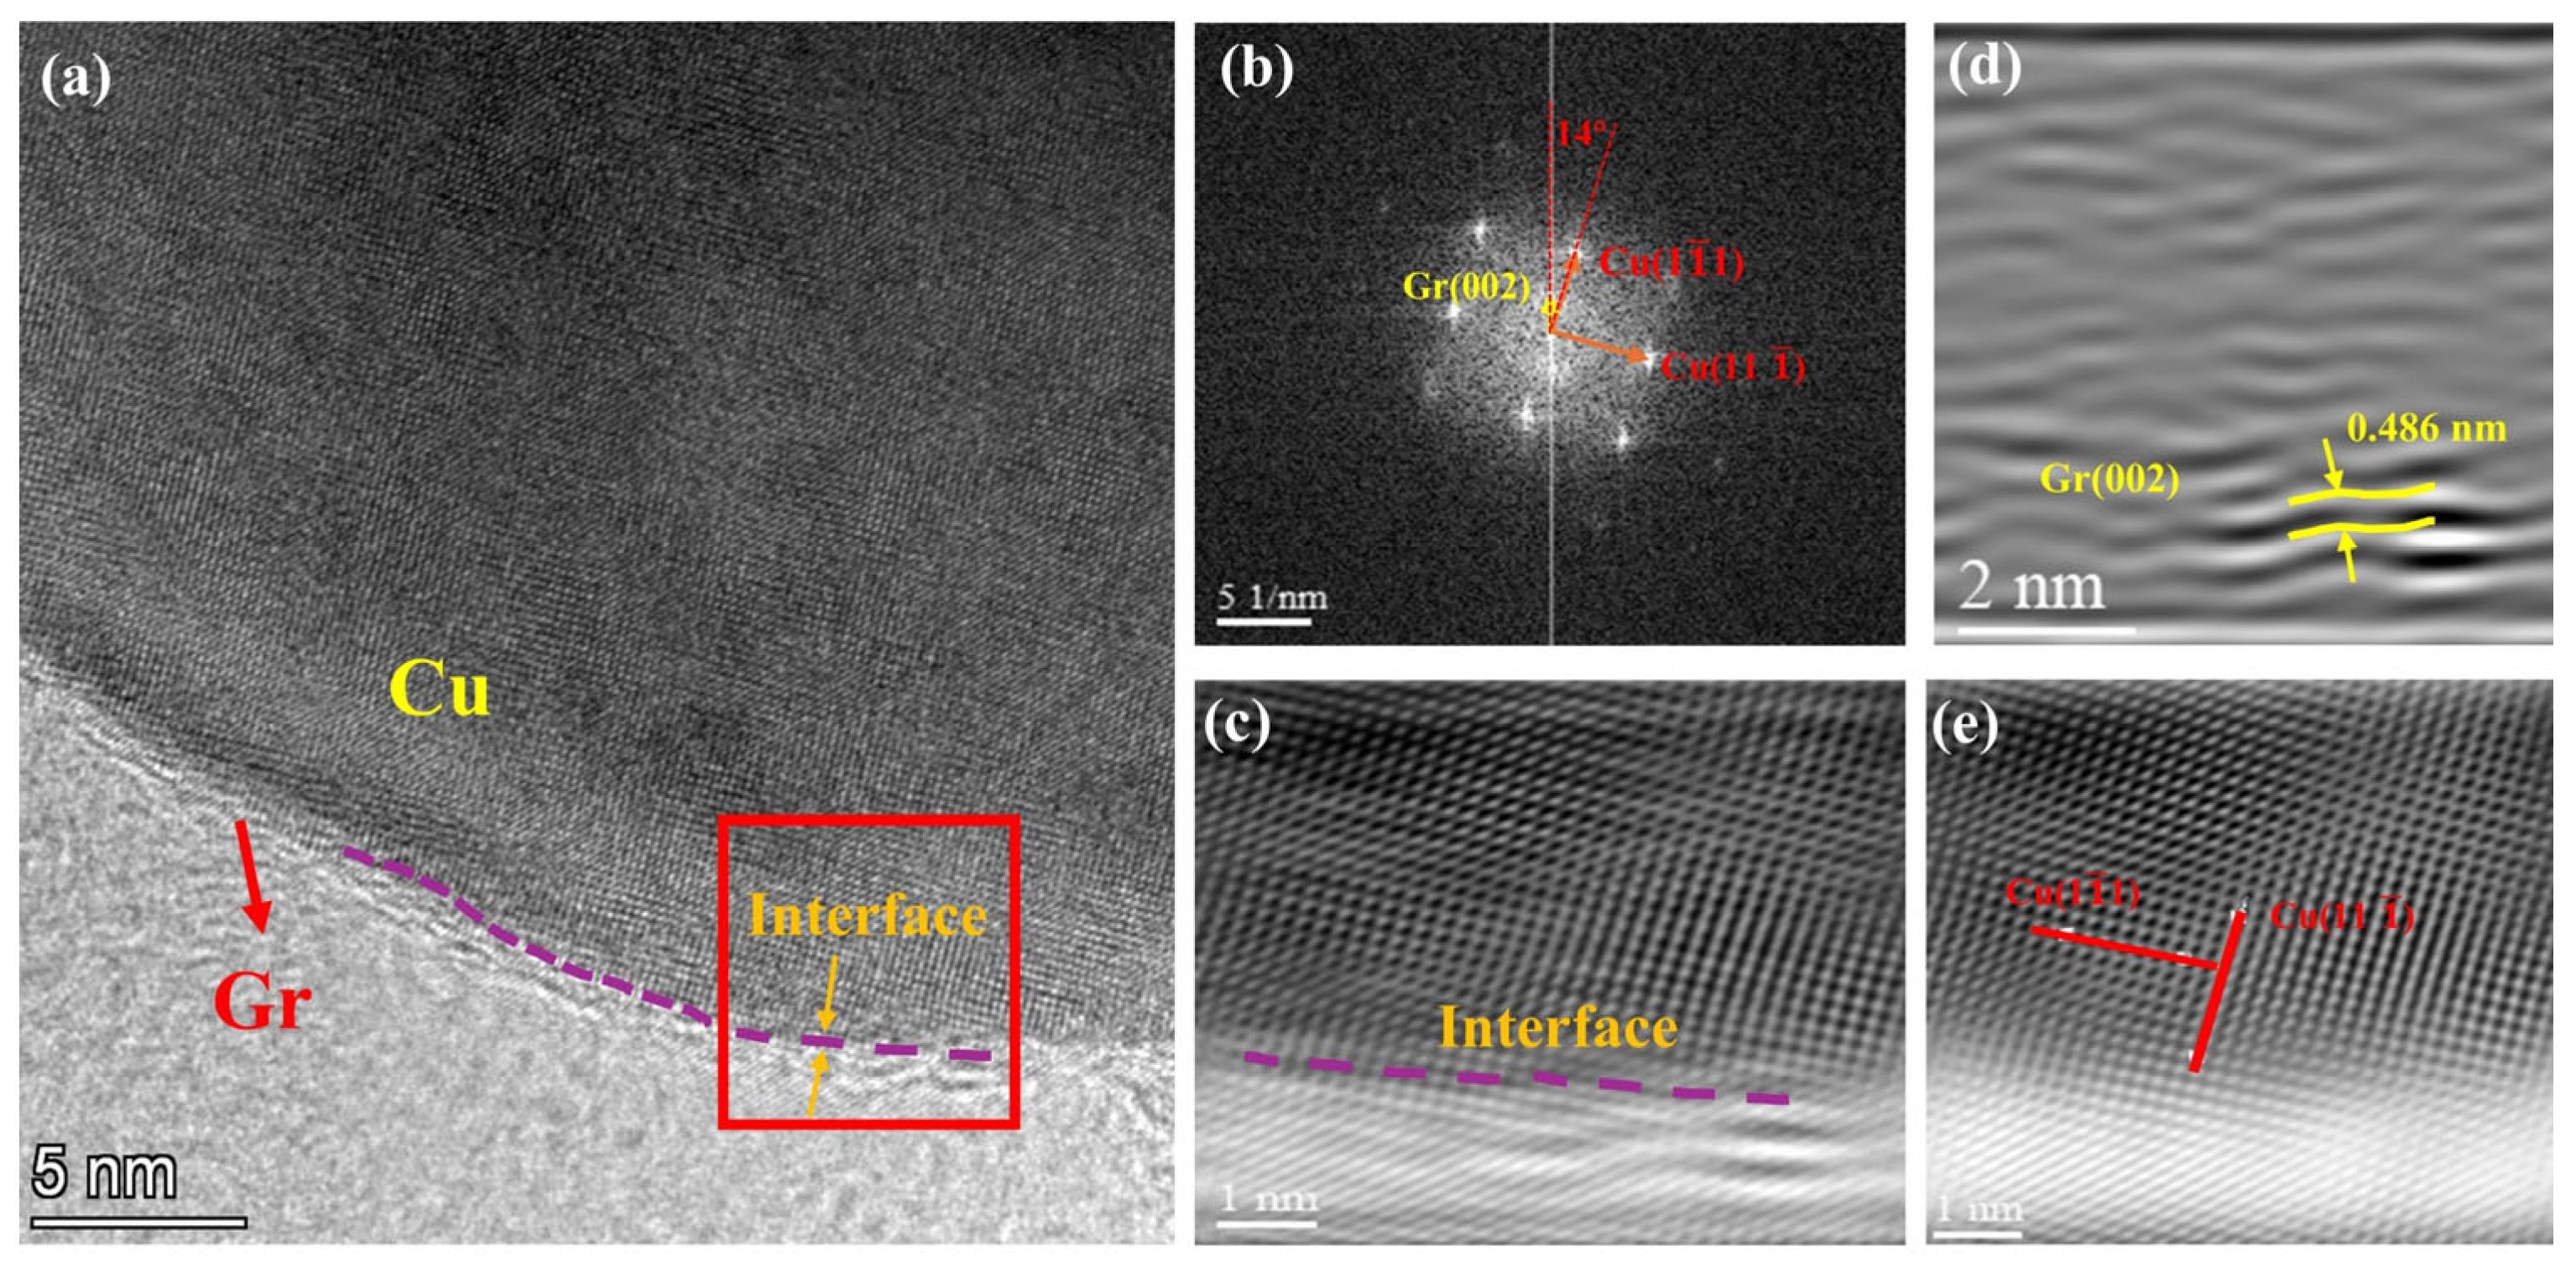
Figure 4 presents a detailed analysis of the interface structure between graphene and the copper matrix in the Gr@Cu composite powder using high-resolution transmission electron microscopy (HRTEM). Figure 4a corresponds to the region marked in Figure 3b, where the graphene–copper interface is delineated by a purple dashed line. A Fast Fourier Transform (FFT) was performed on the area enclosed by the red box in Figure 4a, and the resulting diffraction pattern is shown in Figure 4b. The FFT pattern was indexed, revealing diffraction spots corresponding to the graphene (002) plane and the Cu ( 1 1 ¯ 1 ), ( 11 1 ¯ ), and ( 02 2 ¯ ) planes. The measured angle between the Cu ( 1 1 ¯ 1 ) plane and the line connecting the graphene (002) diffraction spot to the projection center is approximately 14°. Although this local measurement should be interpreted with caution due to the irregular morphology of the copper particles, the observed orientation relationship may contribute to interfacial adhesion [27]. To further examine the interface, an Inverse Fast Fourier Transform (IFFT) was applied to the region defined in Figure 4b, yielding the filtered image in Figure 4c. This image shows a continuous and well-bonded interface between graphene and copper, with no evident gaps [28]. Figure 4d displays the IFFT-filtered image of the graphene (002) lattice fringes, from which an interlayer spacing of approximately 0.486 nm was measured—greater than the typical value of ~0.35 nm for defect-free graphene. This expansion may be due to the significant difference in thermal expansion coefficients between copper and graphene; the thermal expansion coefficients of copper at high temperatures are 17.0 × 10⁻⁶/K, and the thermal expansion coefficients of graphene are (−3.8 ± 0.6) × 10−6/K [26,29]. Meanwhile, the IFFT image in Figure 4e, corresponding to the Cu ( 1 1 ¯ 1 ) and ( 11 1 ¯ ) planes, shows an intact and well-ordered atomic arrangement in the copper matrix, indicating that the copper structure remains unaffected at the interface.
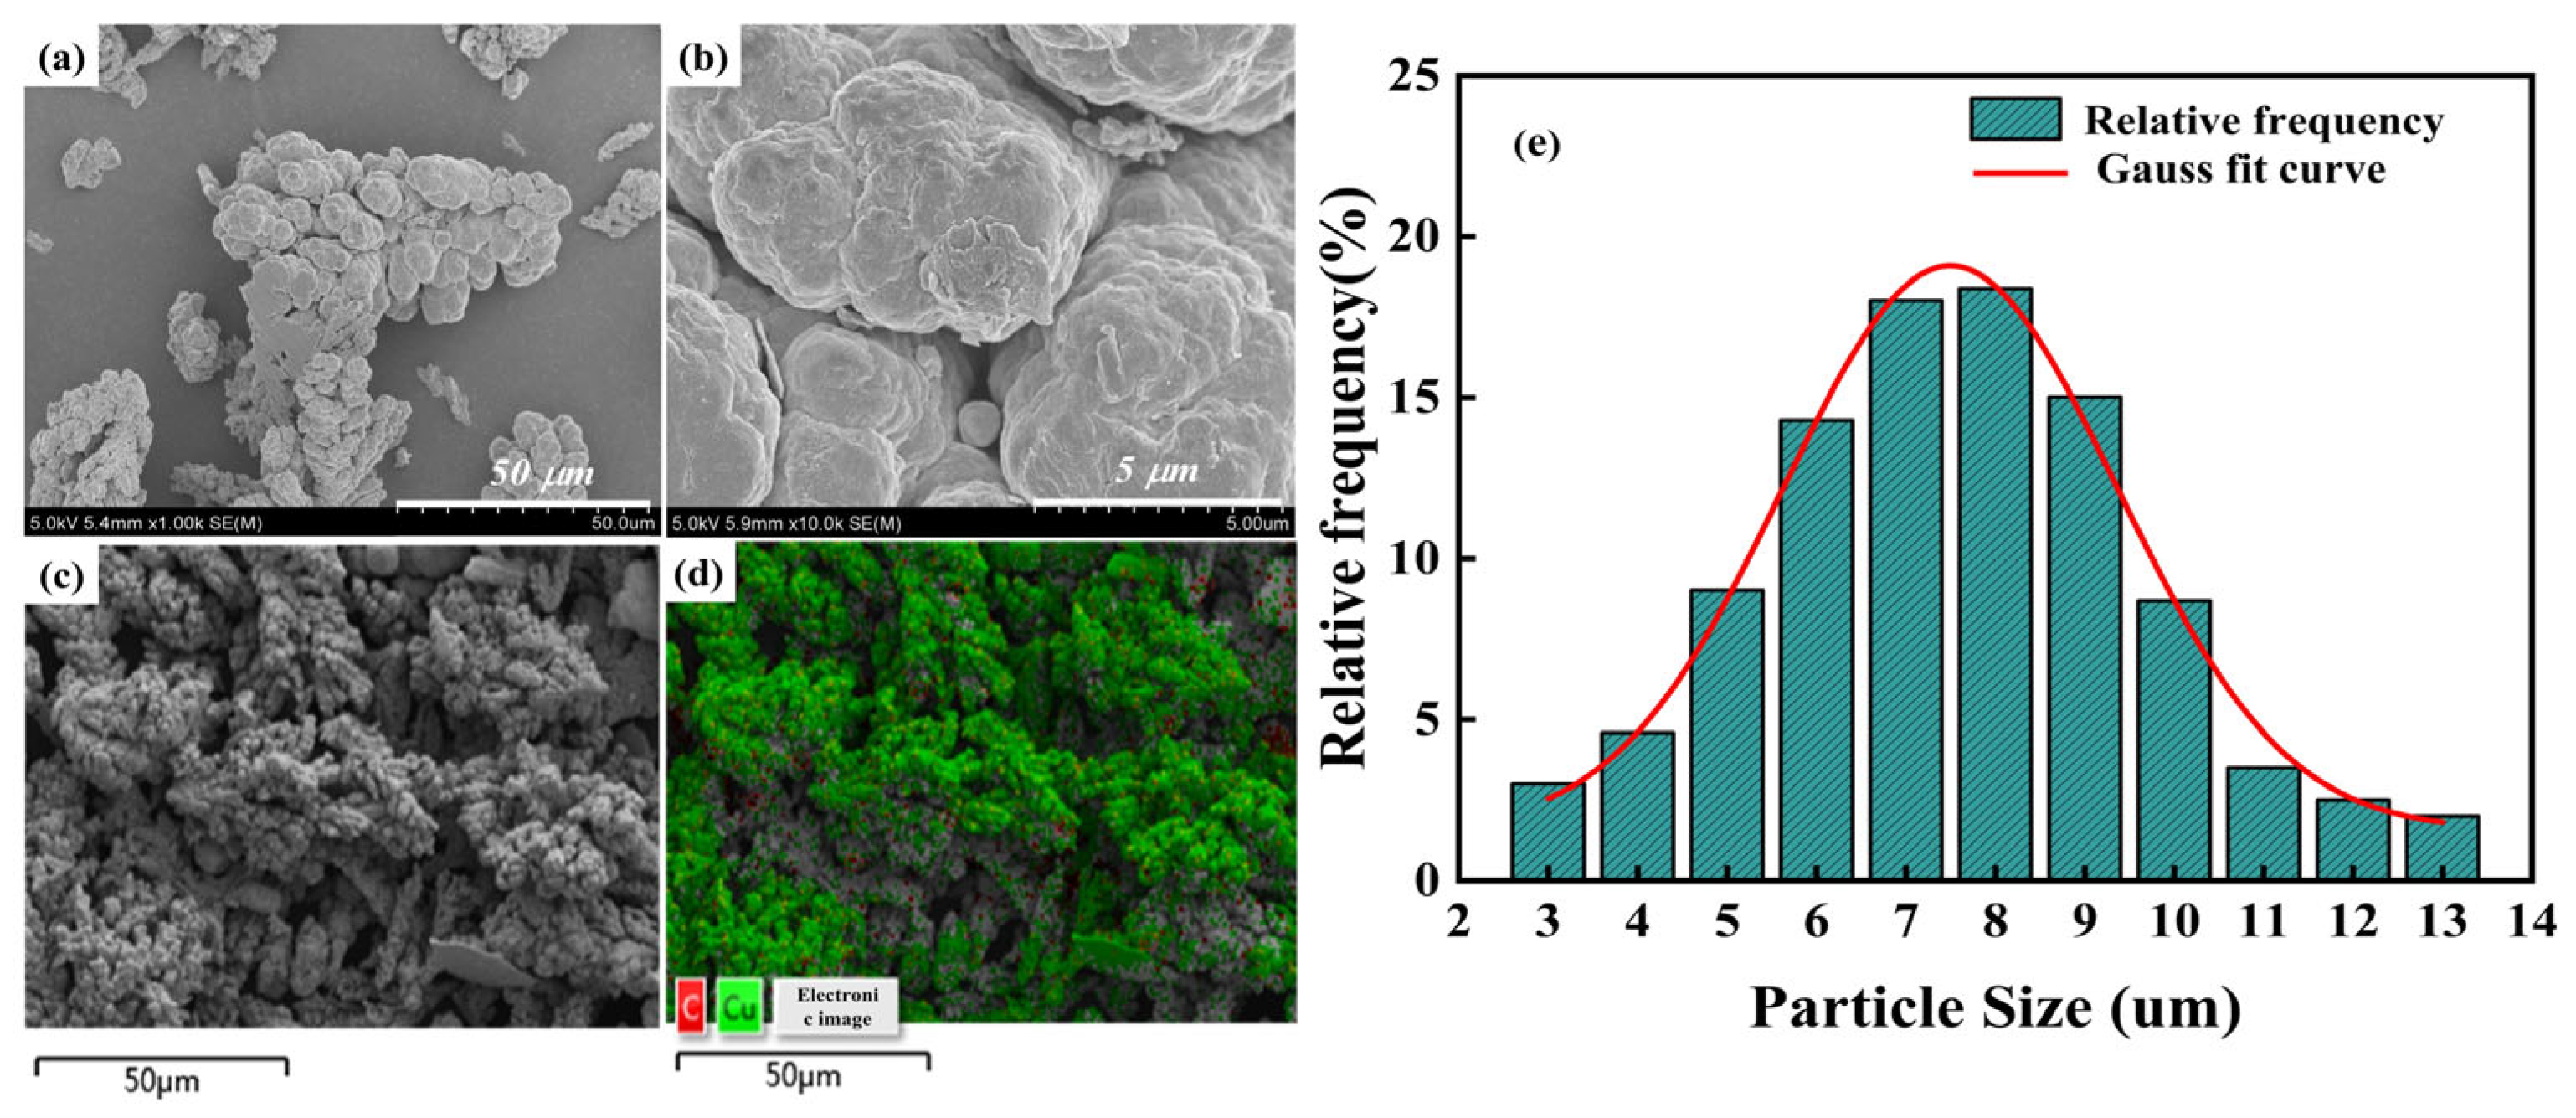
As shown in Figure 5a–c, the microscopic morphology of a typical composite powder with 0.70 wt.%Gr@Cu/Cu after adding pure copper and ball grinding for vacuum hot-press. During ball milling, the energy transfer between the ball, powder, and wall causes some copper powder to gather together and show an irregular shape in clusters, and even a small amount of copper powder is flaked. Figure 5d shows the distribution of the elements in Figure 5c, and it can be seen that most of them are copper, and a small amount of carbon is evenly distributed in the copper matrix, corresponding to a graphene content of only 1.05 wt.%. Figure 5e uses Nanomeasure software (2021) to calculate the particle size of the powder in Figure 5c. According to the statistical results, the particle size of most of the powder (35.29%) after ball milling was about 7 μm, the maximum particle size was about 13 μm, and the minimum particle size was about 3 μm. The particle size of the original 600-mesh copper powder is about 25 μm. Although the ball grinding time is only 70 min, copper is very prone to deformation due to its face-centered cubic crystal structure. Therefore, ball milling reduces the particle size of the powder to a certain extent and changes the morphology of the copper powder.

3.2. Microscopic Characterization of Gr@Cu/Cu Composites

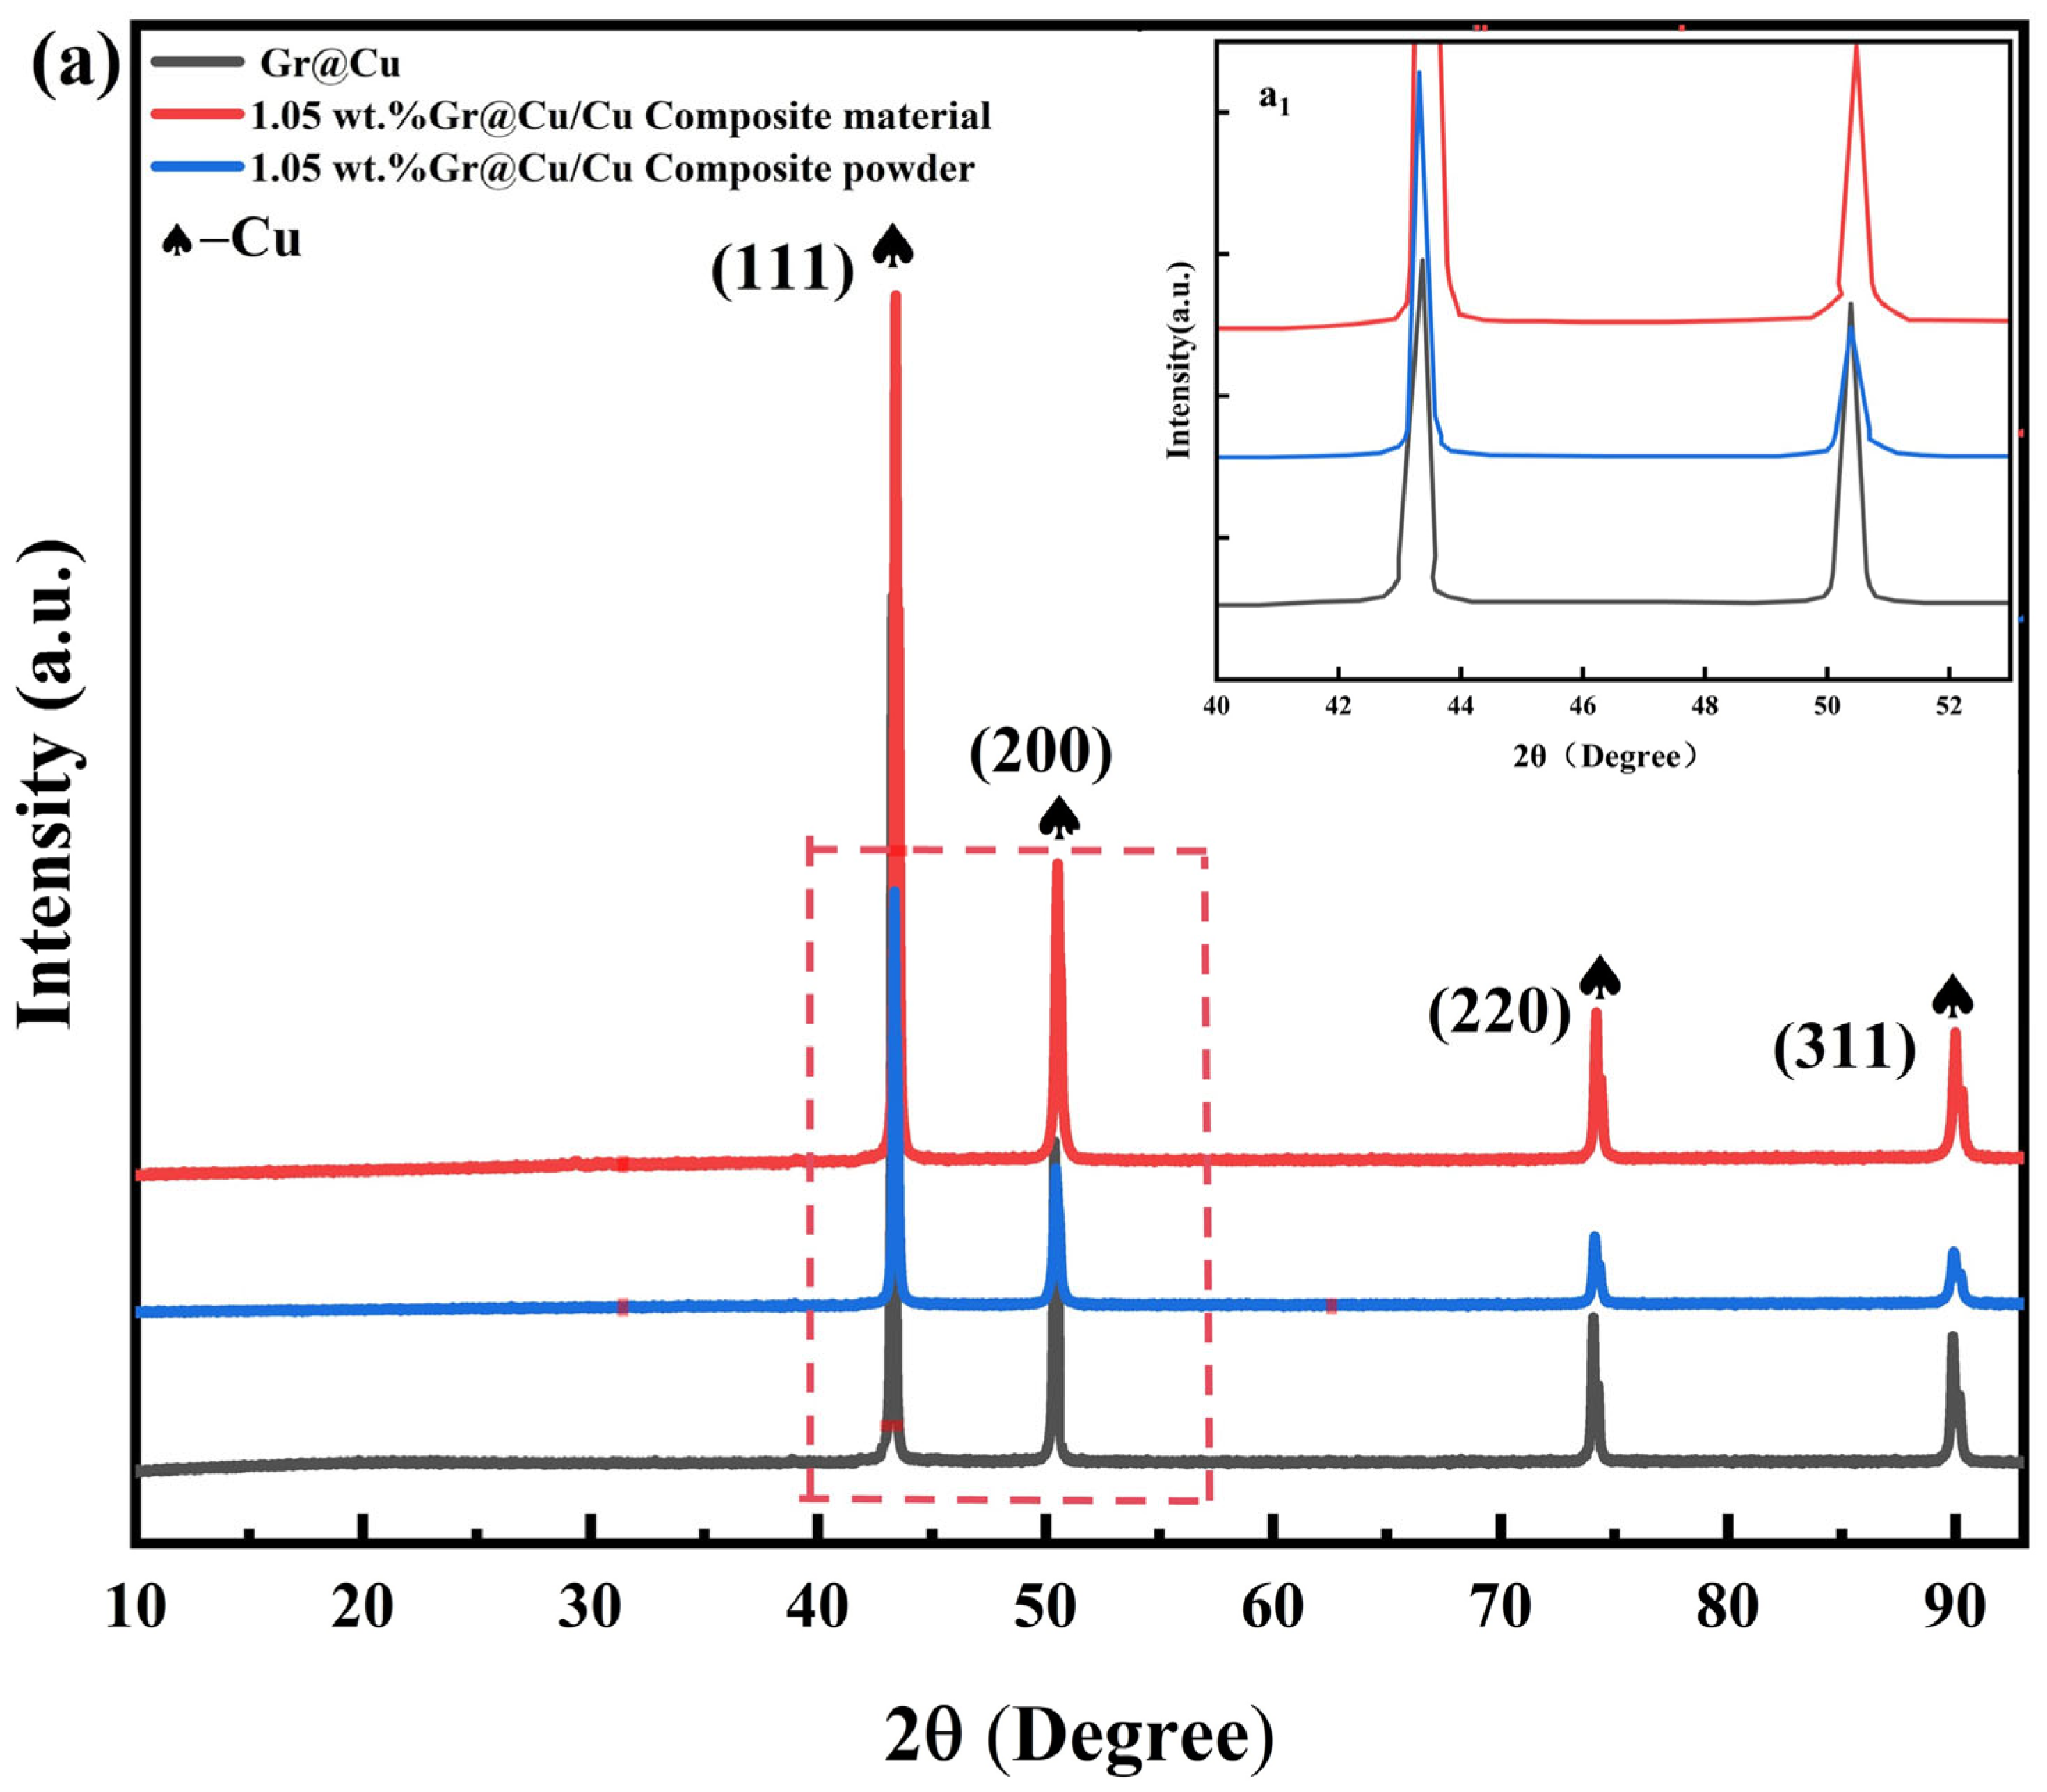
As shown in Figure 6a, in order to detect the XRD characteristic peak of graphene as much as possible, the 1.05 wt.%Gr@Cu/Cu composite material with the highest graphene content was selected as the representative for XRD characterization. In order to better observe the changes in the composite before and after molding, the XRD lines of the composite were compared with the Gr@Cu composite powder and Gr@Cu/Cu composite powder after ball milling with pure copper added contrast. Only the characteristic peaks of four crystal faces of copper are observed in all three spectral lines, and the peak strength of the Gr@Cu/Cu composite powder is the least. The reason is that most of the copper in the Gr@Cu/Cu powder is not superheated and only goes through ball milling, while the composite material undergoes hot-press sintering, and the Gr@Cu powder undergoes heat treatment for graphene growth. Therefore, the copper in the composite material and Gr@Cu composite powder has stronger crystallization and a higher peak value [30]. Figure 6(a1) enlarges the area selected by the red dotted box in Figure 6a. According to Figure 6(a1), it can be clearly seen that the diffraction peaks of copper in the two composite powders correspond one by one, and the diffraction peaks of copper in the composite materials are significantly shifted to the right compared with the two, which indicates that the microstructure of copper has changed when the composite powder is formed by vacuum hot-press sintering. After the formation of the composite material, the diffraction peak of copper shifts to the right, indicating that the lattice constant of copper decreases during the hot-press sintering process. Yang [19] et al.’s study showed the same situation, which was caused by the fact that the atomic size of the carbon atom was much smaller than that of the copper atom. In addition, hot-press sintering will cause graphene to induce stress in the copper matrix, which may be compressive stress or tensile stress, and stress will also affect the lattice structure of copper, thus changing the position of copper diffraction peaks in XRD [30].
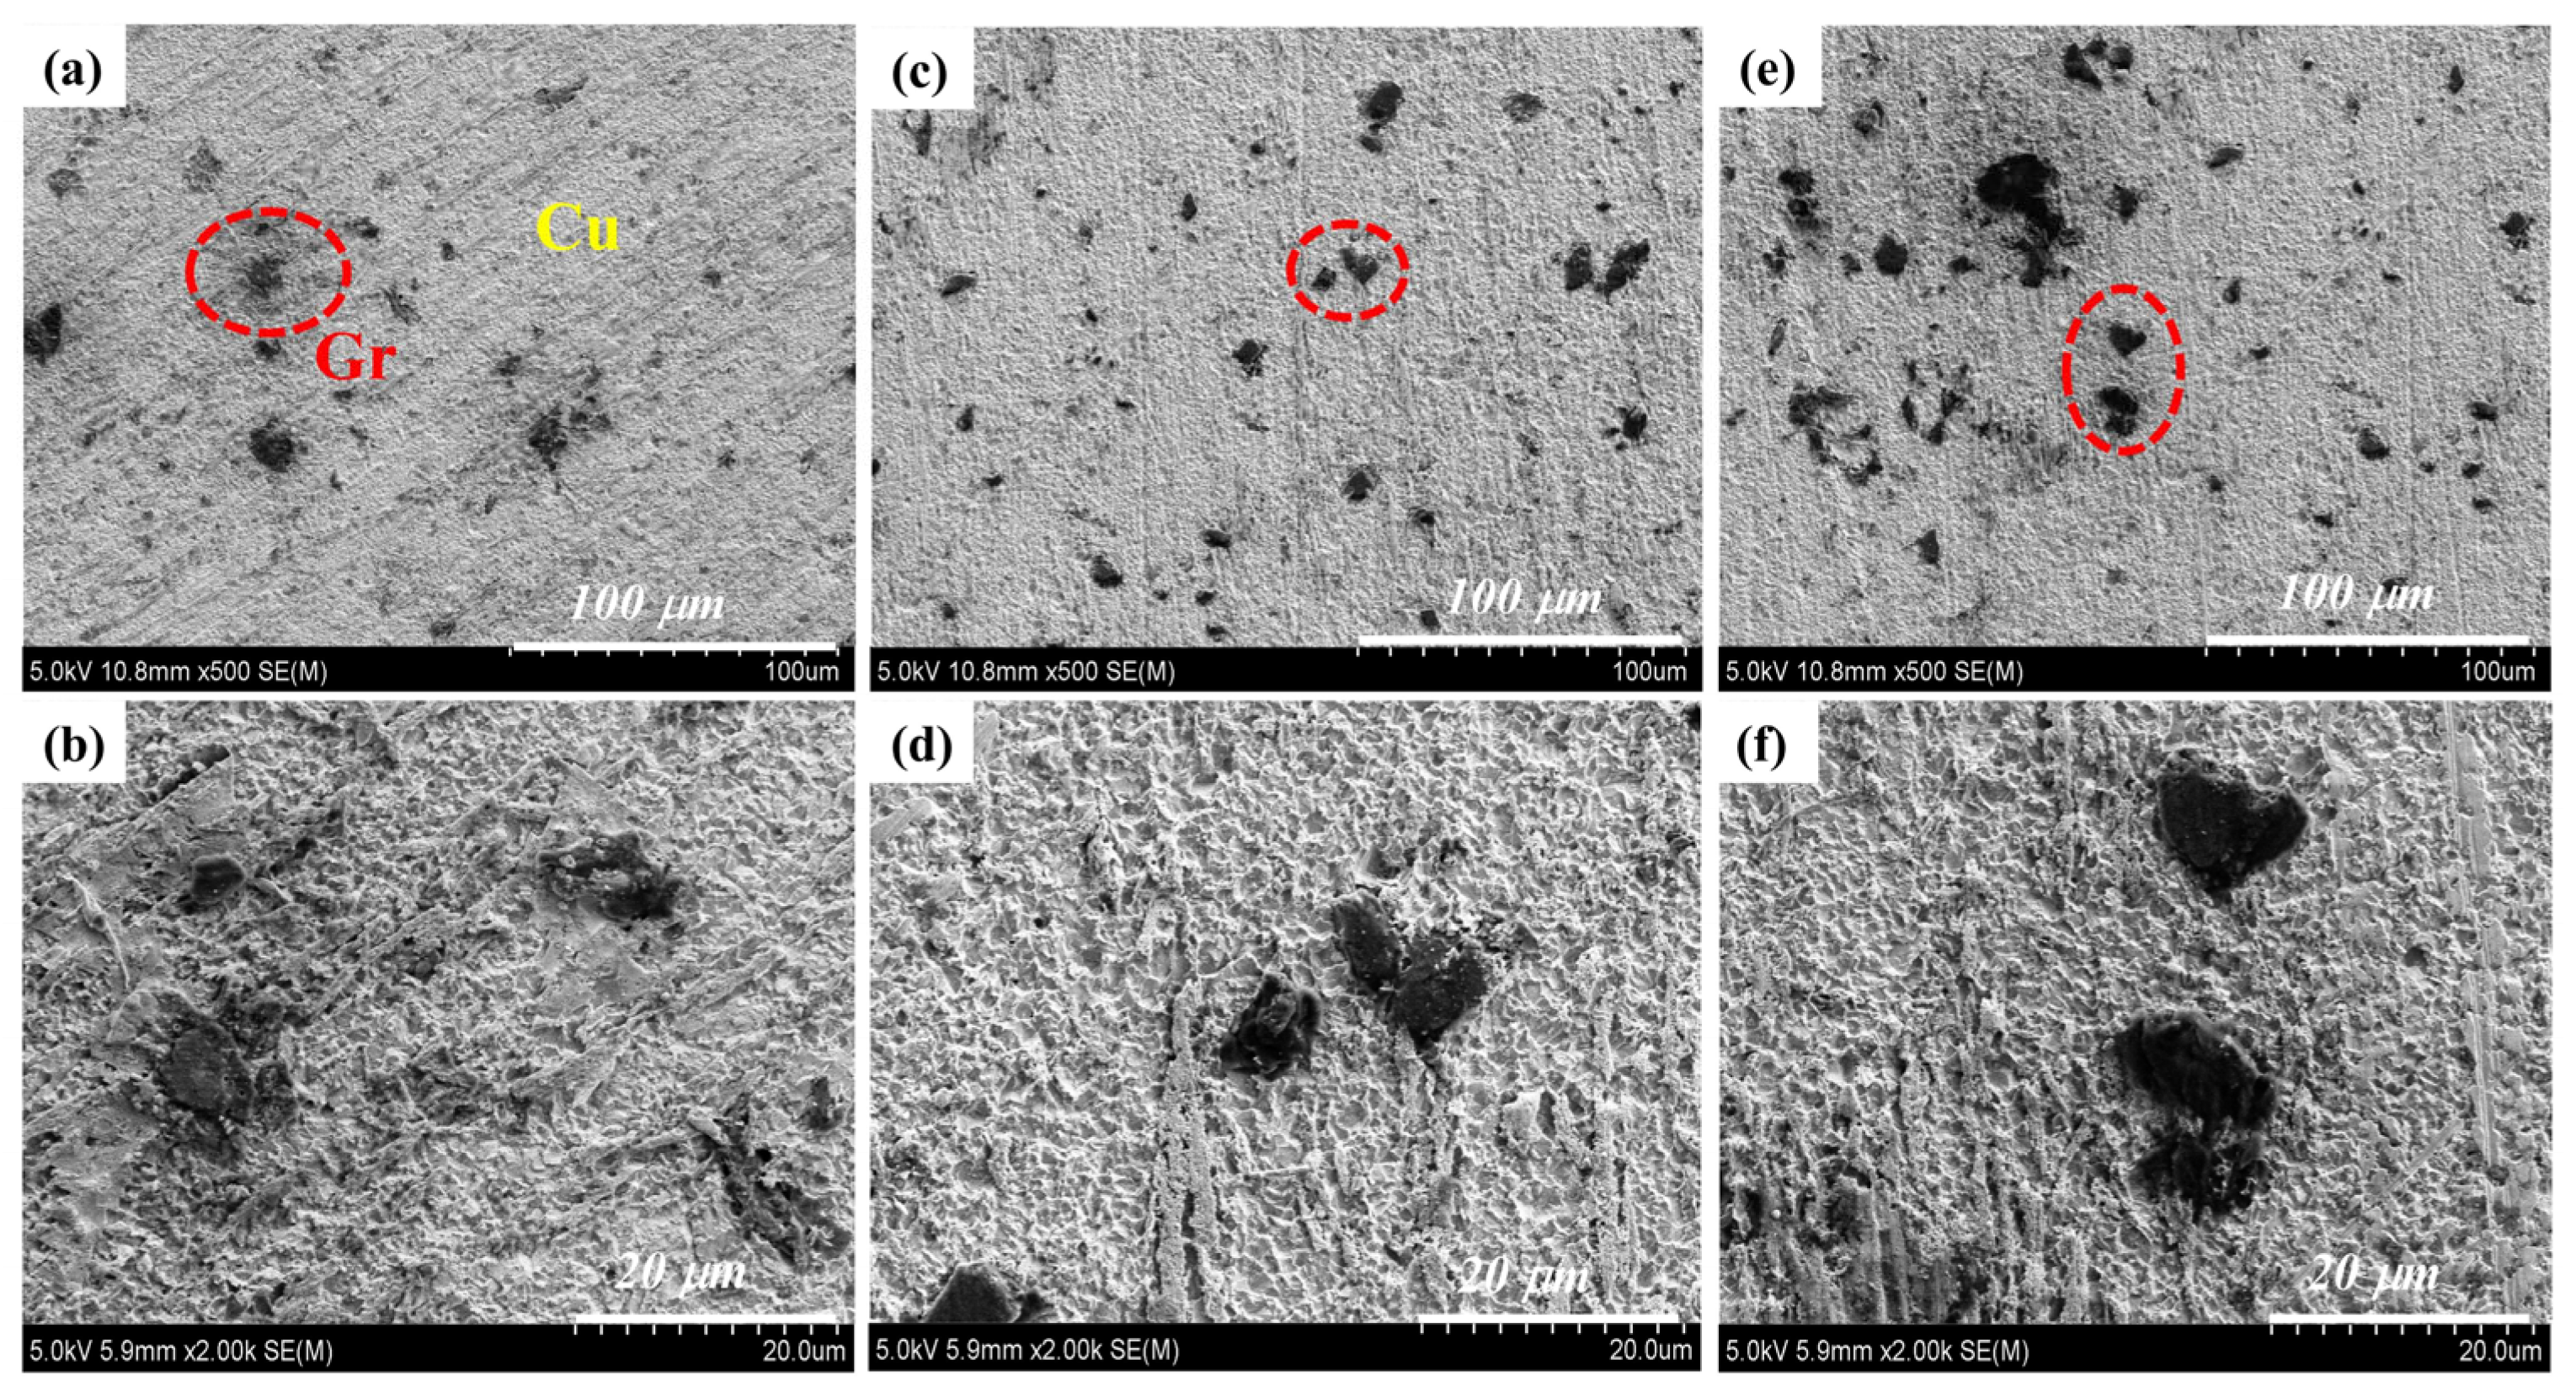
Figure 7’s SEM was used to characterize the surface micromorphologies of composites with different graphene contents. The distribution of graphene in different composites can be clearly seen through the SEM images. The light-gray part of Figure 7 is the copper matrix, and the small black particles are the graphene in the composite material. Typical graphene is circled in Figure 7 using a red oval. Figure 7a,c,e correspond to composites with graphene mass fractions of 0.35%, 0.70%, and 1.05%, respectively, while Figure 7b,d,f correspond to composites with graphene mass fractions of 0.35%, 0.70%, and 1.05%, respectively. The enlarged area image is surrounded by red ellipse. As can be seen from Figure 7a–d, the graphene grown by highland barley powder on the surface of copper particles successfully achieved uniform distribution and good bonding. However, when the graphene content reaches 1.05 wt.%, graphene agglomeration appears, as shown in Figure 7e. According to Yu et al. [31], due to the presence of van der Waals forces between graphene sheets, aggregation occurs when the content reaches 3 wt.%. It is concluded that although the growth of graphene on the surface of copper particles using highland barley powder as a raw material can overcome the van der Waals force between graphene to a certain extent, prevent the aggregation of graphene, and achieve uniform dispersion. But aggregation can still occur when too much graphene is present. The effect of agglomerated graphene on the electrical and mechanical properties of the composite is negative. The concentrated graphene disrupts the continuity of the material’s conductive grid. In addition, stress also accumulates in the graphene, reducing the overall strength of the composite and leading to its premature failure [32].
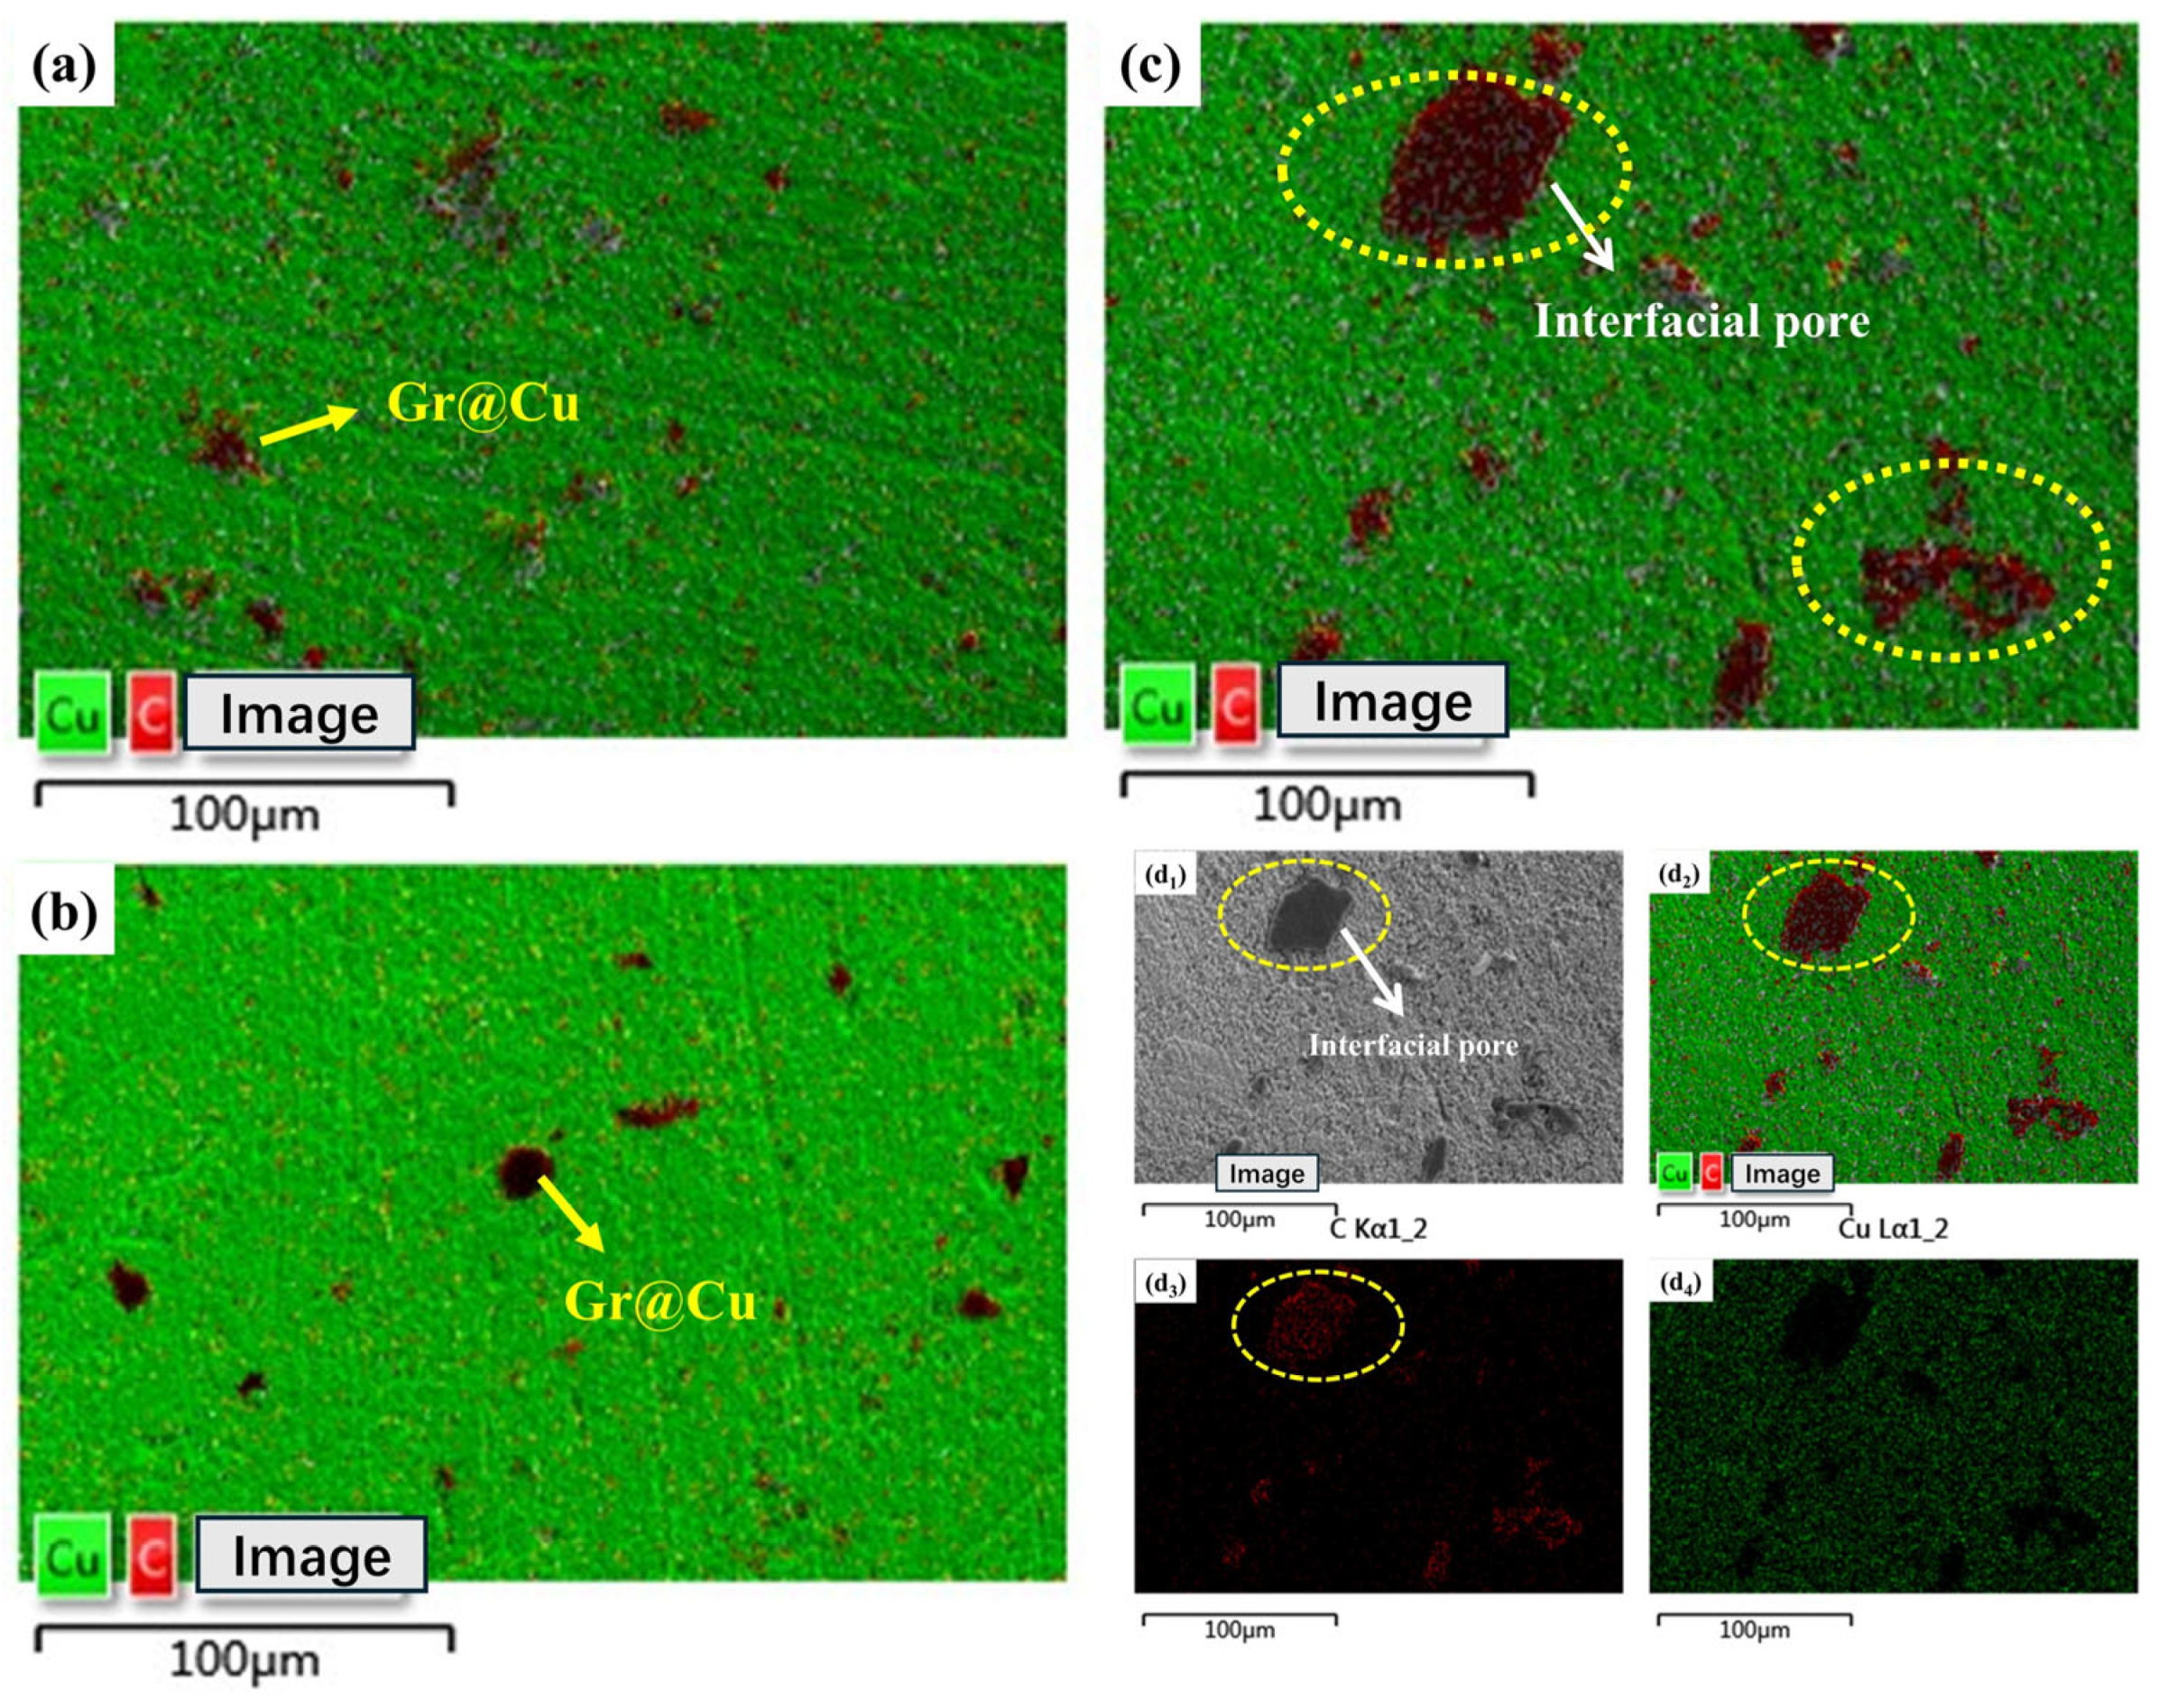
Figure 8 shows the distribution of elements in composites with different graphene contents. Figure 8a–c show the distribution of elements in the composites when the graphene content is 0.35 wt.%, 0.70 wt.%, and 1.05 wt.%, respectively. As a whole, the composite materials contain only two elements—carbon and copper—and the carbon element is evenly distributed in the copper matrix. Despite the Gr@Cu composite powder containing a large amount of carbon, a small amount of carbon is uniformly dispersed in the copper. The preparation of graphene by the metal matrix catalytic method and hot-press sintering process did not introduce other impurities. The accumulation of graphene in 1.05 wt.%Gr@Cu/Cu composites is particularly significant, with a significant carbon accumulation detected, as shown in Figure 8c (yellow dotted ellipse marks), where the volume of graphene is significantly larger than that in Figure 8a,b. This may be caused by too much graphene. Figure 8(d1–d4) characterize the individual distribution of each element in Figure 8c. The yellow dotted ellipse was used to mark the carbon accumulation point, and it was found that the interface between graphene and copper matrix was poor, and there were obvious pores.
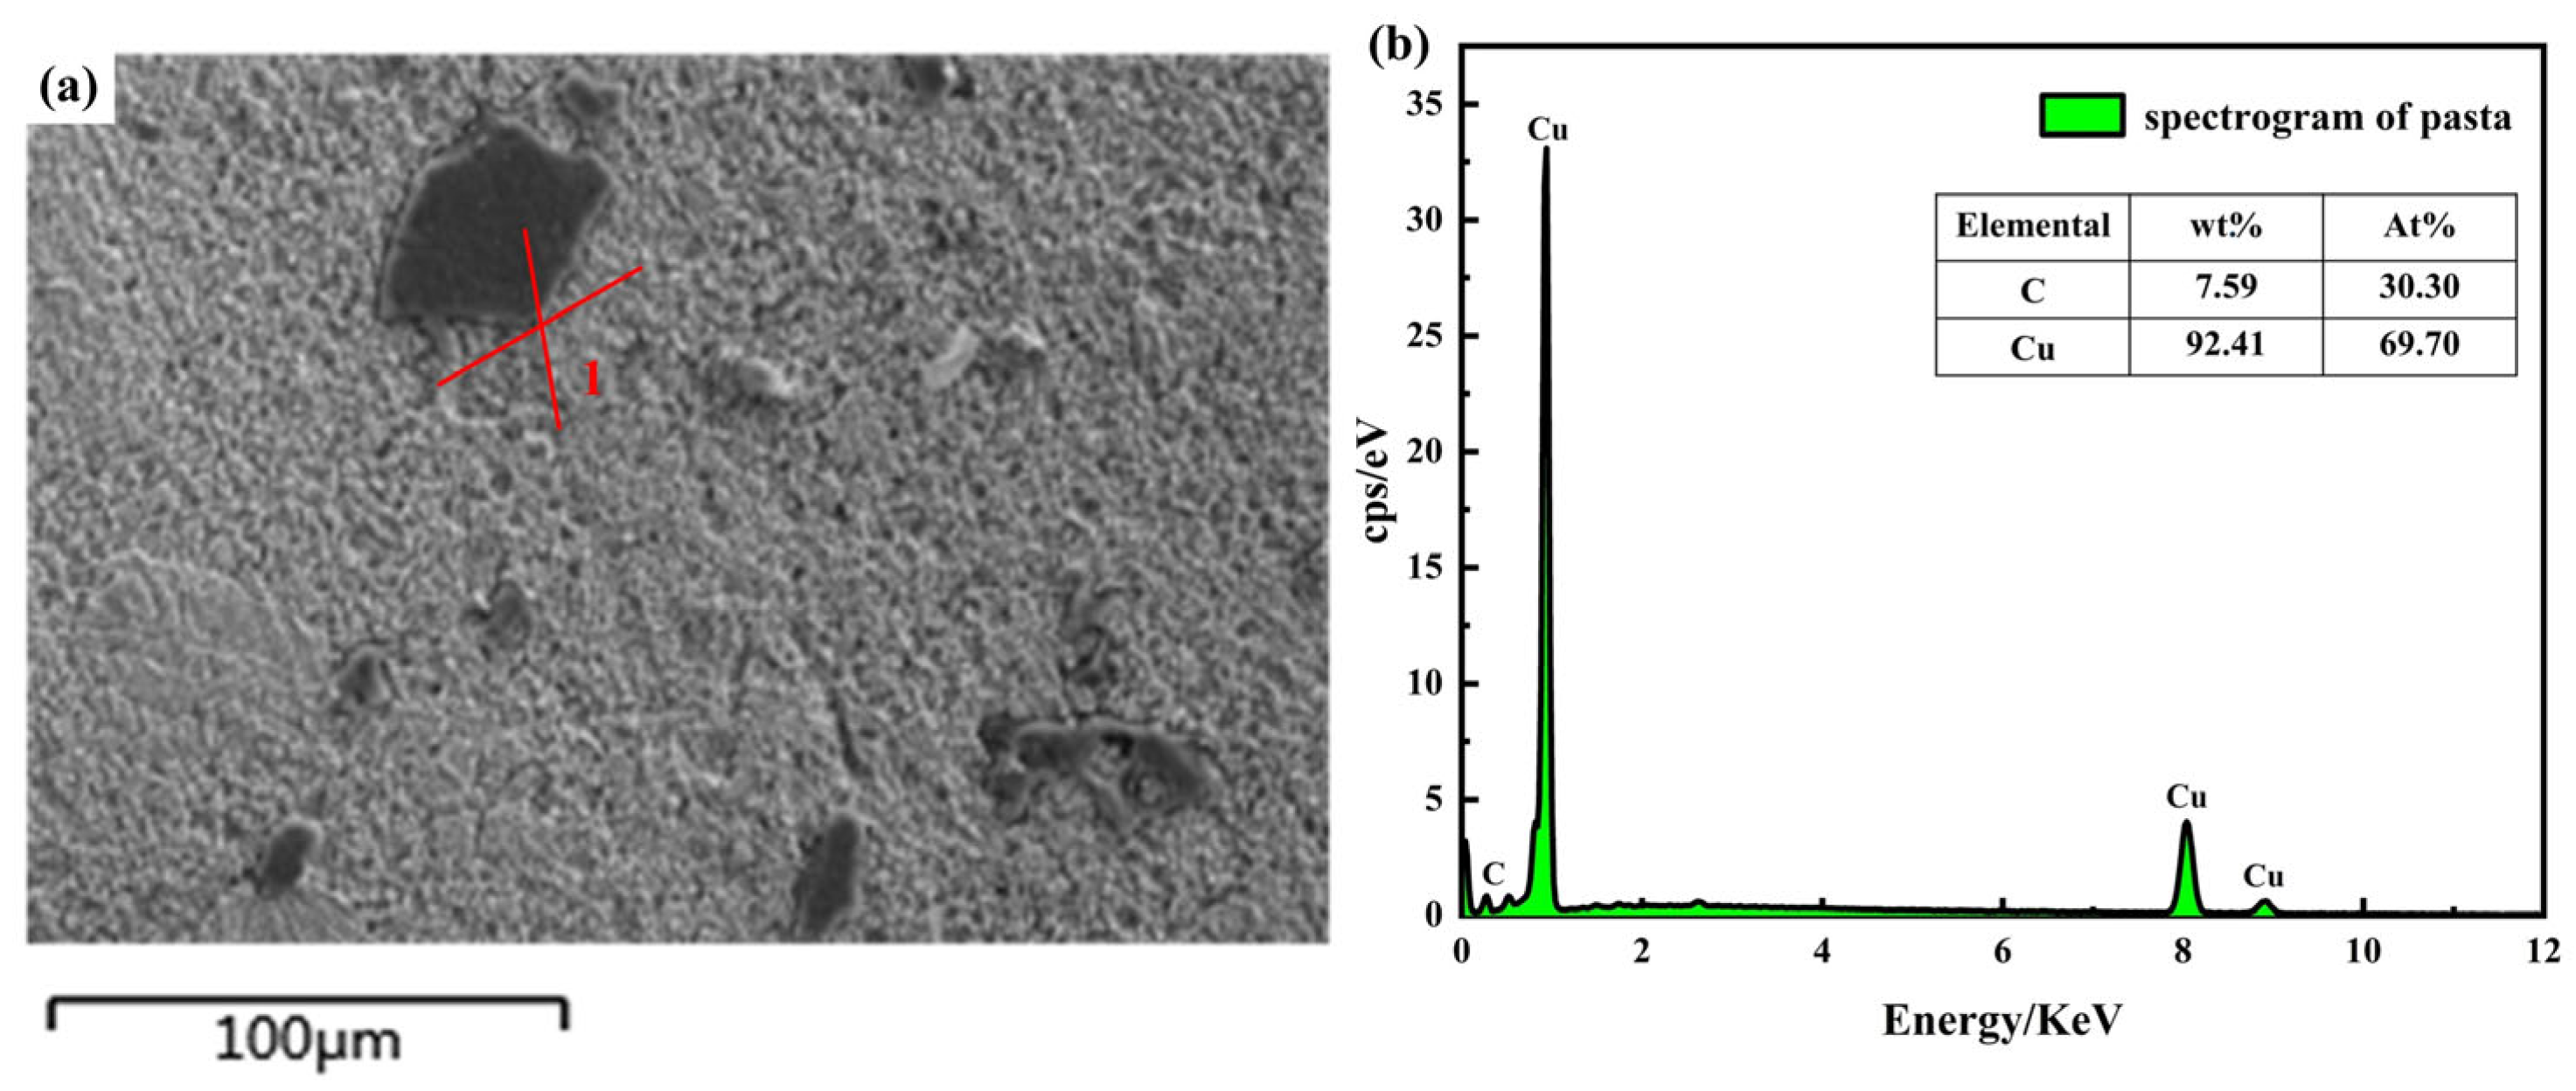
Figure 9 shows the elemental composition and content of the 1.05 wt.%Gr@Cu/Cu composite. In Figure 9a, the proportion of carbon atoms is 30.30%, and the mass fraction is 7.59%, which is much higher than the 1.05% of the composite material itself. In this study, the essence of dispersed graphene is to achieve the dispersion of the Gr@Cu composite powder. On the one hand, the excessive content of graphene here is due to the short milling time and insufficient mixing of Gr@Cu particles with pure copper powder. On the other hand, the overall graphene content reached 1.05 wt.%, and the probability of contact between Gr@Cu composite powders increased during the formation of composite materials, which would lead to graphene aggregation. In addition, the accumulation of highland barley powder and copper powder will also occur when the highland barley powder coated with the copper precursor is prepared. Consistent with the description in Figure 7, the aggregation of graphene leads to stress concentration here, which can worsen the overall properties of the composite.

3.3. Density and Electrical Properties of Gr@Cu/Cu Composites

Figure 10 shows the change in the density and conductivity of the composite material with the increase in graphene content. The electrical conductivity is evaluated with the international electrical conductivity of annealed copper (100%IACS) as the evaluation criteria. As can be seen from the figure, pure copper materials have the highest conductivity, at 85%IACS. When the mass fraction of graphene is 0.35%, 0.70%, and 1.05%, the average conductivity of the composite is 78%IACS, 70%IACS, and 66%IACS, respectively. With the increase in graphene content, the electrical conductivity of the composite decreases gradually. Although both graphene and copper have good electrical conductivity, the interface between graphene and copper has a scattering effect on electrons [19]. With the increase in graphene content, the interface between graphene and copper also gradually increases, and the scattering effect of electron movement is enhanced, resulting in a decrease in the electrical conductivity of the composite. In addition, the probability of contact between graphene increases with the increase in its content, inevitably leading to the occurrence of agglomeration, and after agglomeration, the bond strength between graphene and copper is reduced, often accompanied by the formation of pores, which also hinder the transport of electrons. The density variation of the composite material also shows this point. As shown by the red curve in Figure 10, the densification of the pure copper material reaches 98.84%. With the increase in graphene content, the density of the composite material also gradually decreased, and with the increase in graphene content, the rate of density decline in the composite material also increased. This is illustrated by the presence of pores at the interface between graphene and copper. As shown in Figure 8c, the increase in the graphene content lead to agglomeration, and the interface pores appear. The increase in porosity means that the density of the composite materials decreases.

3.4. Mechanical Properties of Gr@Cu/Cu Composites

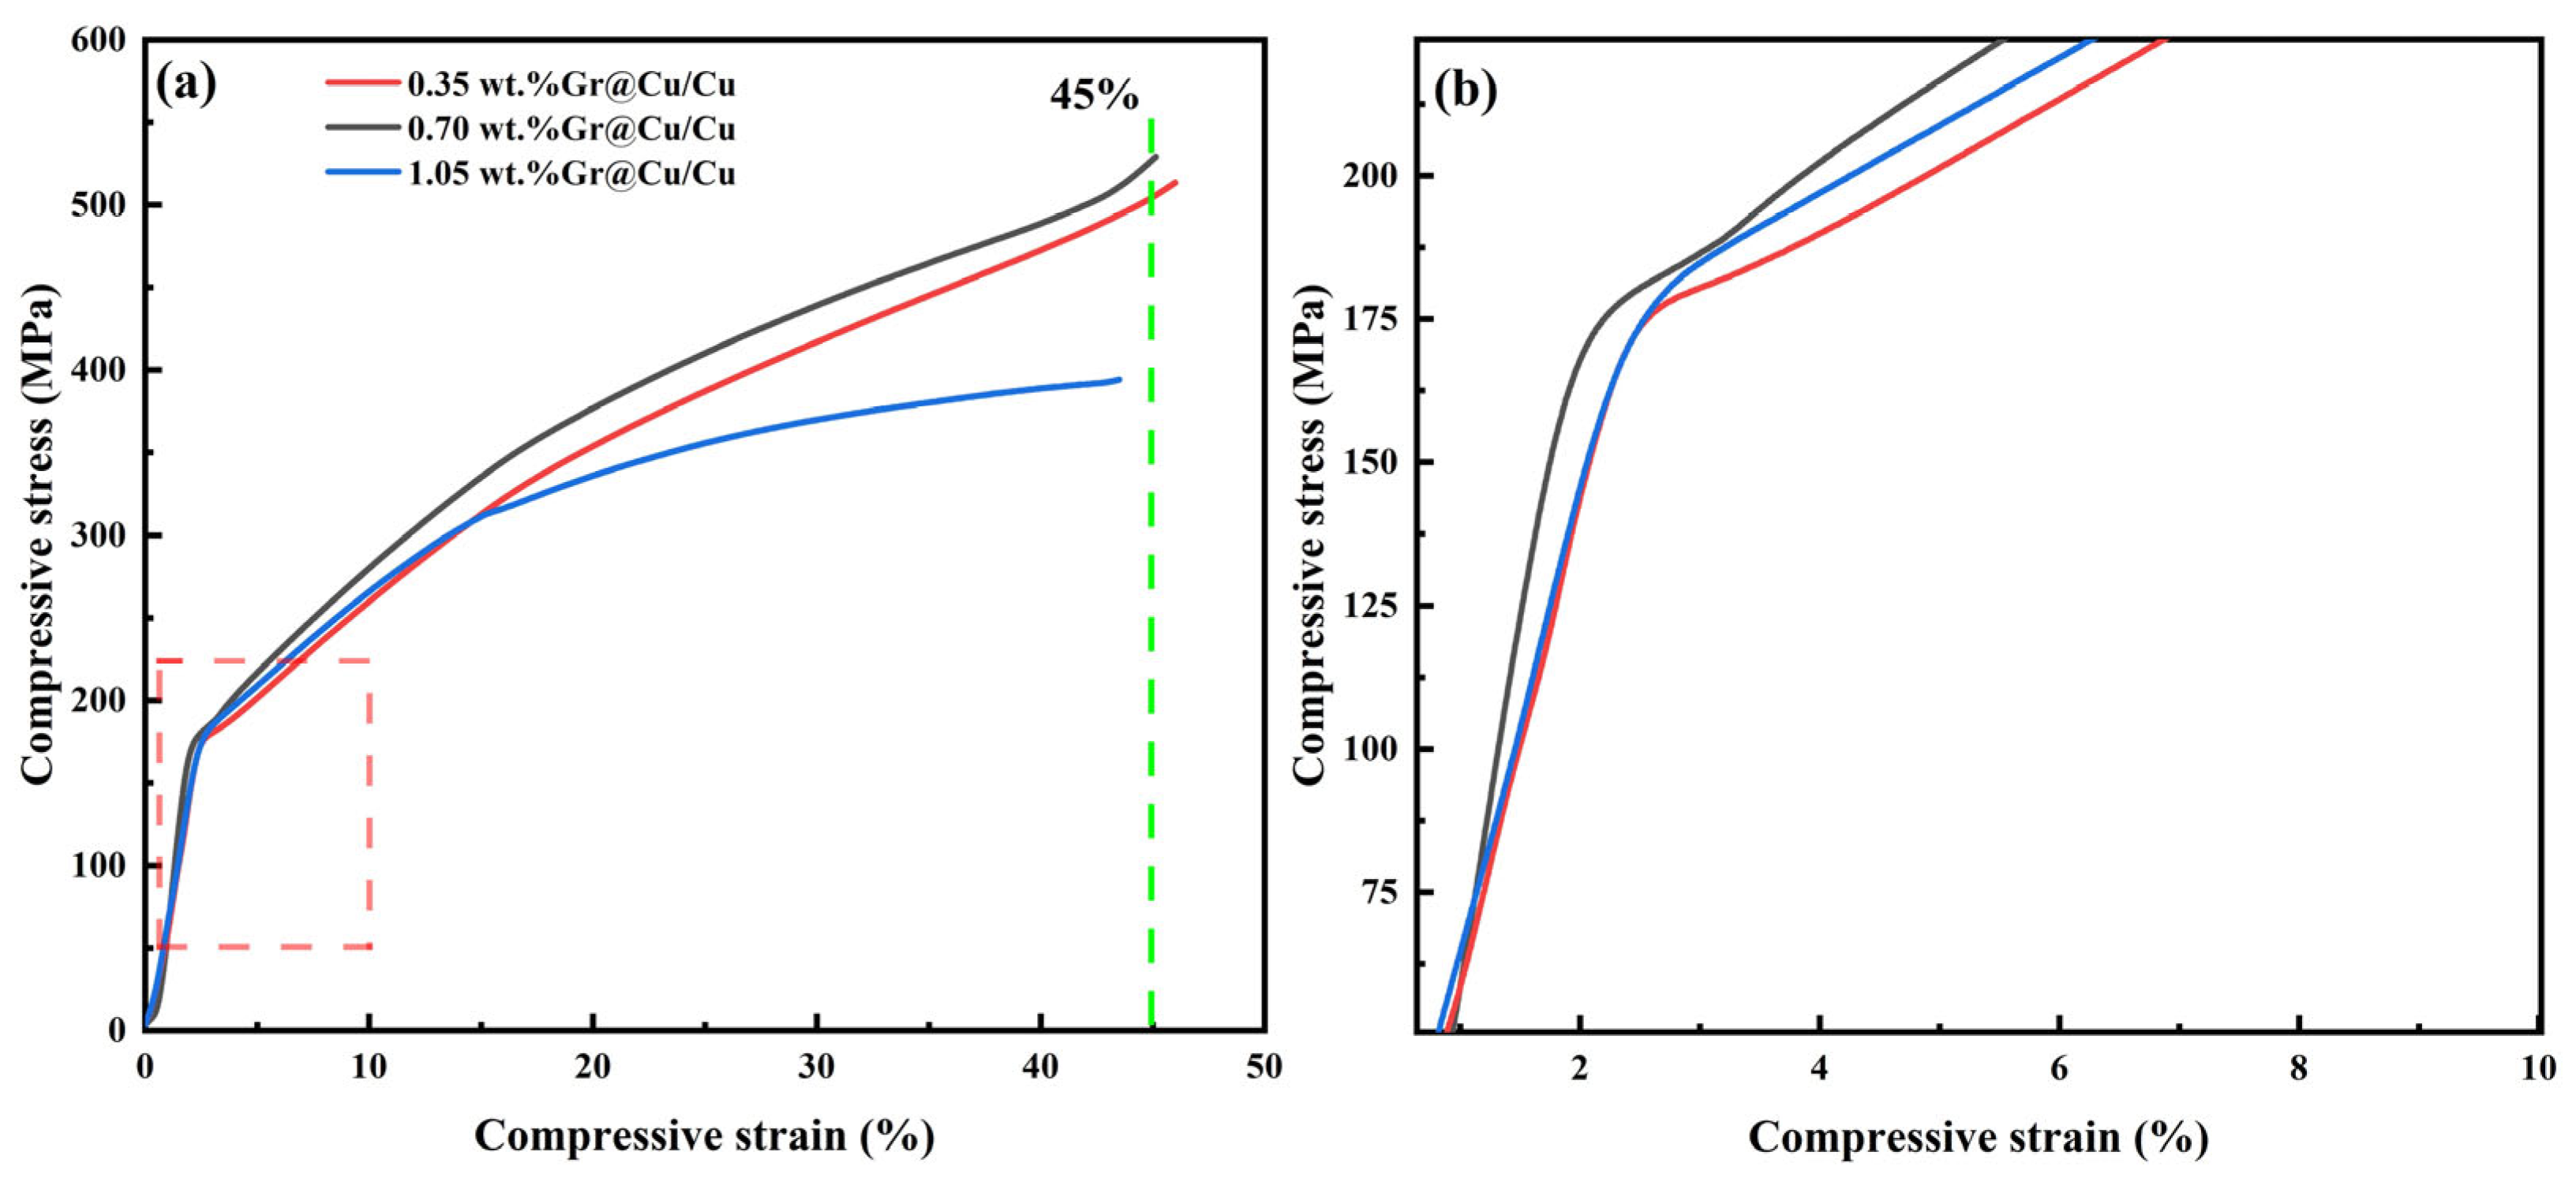
Figure 11a shows the compressive stress–strain curves of the Gr@Cu/Cu composites with different graphene contents, and Figure 11b is an enlarged image of the elastic strain end point of the composite highlighted by the red dashed box in Figure 11a. In Figure 11a, when the content of graphene is 0.35 wt.%, 0.70 wt.%, and 1.05 wt.%, the ultimate compressive strength is 512 MPa, 530 MPa, and 394 MPa, respectively. When the mass fraction of graphene is 0.70%, the mechanical properties of the composites are the best. The compressive strain of the Gr@Cu/Cu composites with 0.70 wt.% and 0.35 wt.% graphene contents is over 45%, both of which maintain excellent ductility, while the compressive strain of the 1.05 wt.%Gr@Cu/Cu composites is significantly lower than that of the other two composites, at only 42%. The elastic strain end points (yield strength) of the three composites were observed through Figure 11b. The yield point of the three composites is about 175 MPa. It seems that the mechanical properties of the composite materials are better when the mass fraction of graphene is 0.70%,composite maintains good ductility. When the mass fraction of graphene reaches 1.05 wt.%, the contact probability of Gr@Cu composite powder is higher, and the agglomeration of graphene in the composite material is intensified, as shown in Figure 7 and Figure 8. The agglomerated graphene-reinforced phase leads to poor interfacial bonding and stress concentration. Mechanisms such as load transfer cannot play an effective role, resulting in a decline in the mechanical properties of composite materials. Therefore, the properties of the composites are excellent when the graphene content is 0.70 wt.%.
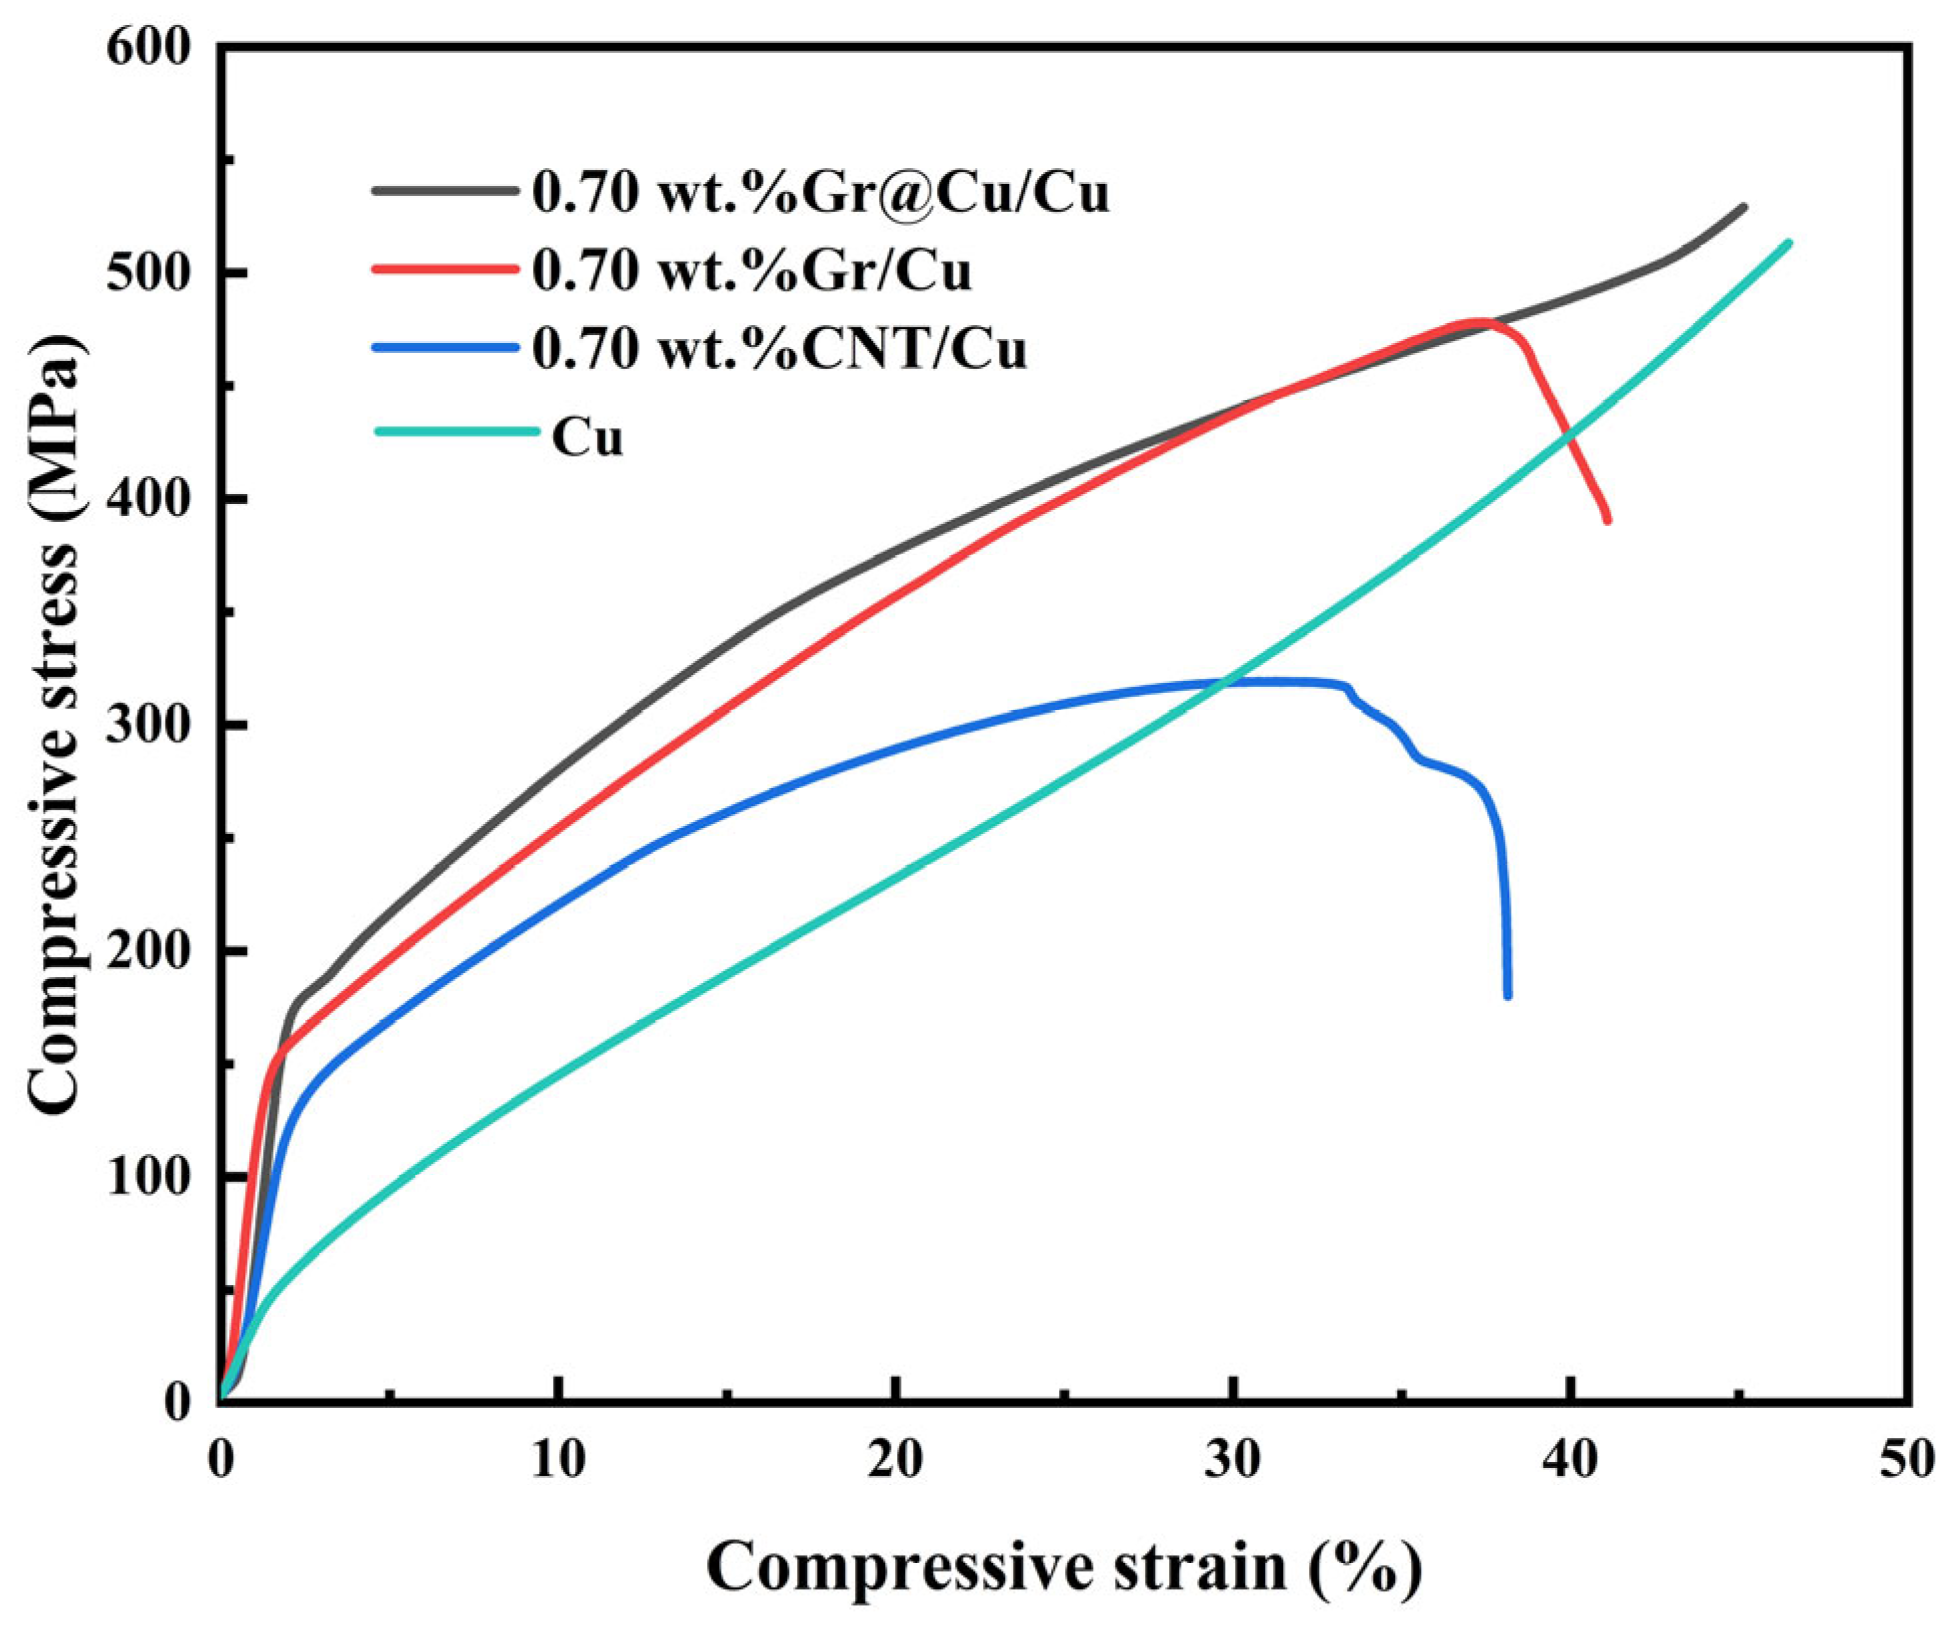
In order to further demonstrate the superiority of preparing graphene-reinforced copper matrix composites with highland barley powder, Gr/Cu and CNT/Cu composites with 0.70 wt.% of pure copper material and reinforcement were prepared by the same material-forming process.
As shown in Figure 12, the compressive yield strength of Gr/Cu and CNT/Cu composites is 149 MPa and 133 MPa, respectively. The compressive strain levels before failure were 37% and 33%, respectively. The maximum compressive strengths are 477 MPa and 317 MPa, respectively. The yield strength of pure copper is 52 MPa, and the compression should also exceed 45%. The above data are lower than those of the Gr@Cu/Cu composites prepared in this study. The yield strength of the Gr@Cu/Cu composites is 236% higher than that of pure copper. Compared with the direct addition of nano carbon materials, the use of highland barley powder to grow graphene on the surface of copper particles can achieve good interfacial bonding, and the presence of Gr@Cu particles makes the graphene overcome the van der Waals force and prevents aggregation to a certain extent. Graphene is uniformly dispersed in composite materials and has a better interface with copper, which can more effectively withstand loads. As a result, the mechanical properties of the Gr@Cu/Cu composites are higher than those of the other composites prepared in this study.
As summarized in Table 1, the Gr@Cu/Cu composite prepared in this work using highland barley powder exhibits a compelling combination of yield strength and electrical conductivity. Compared to the composite using wheat flour [19], our material demonstrates a ~9% higher yield strength (175 MPa vs. ~160 MPa) while maintaining a comparable conductivity level. This suggests that highland barley powder may serve as a slightly more effective carbon source for generating reinforcing graphene structures. More notably, our composite significantly outperforms those prepared by simple ball milling of commercial graphene [16], highlighting the critical advantage of the in situ growth method in achieving superior interface bonding and uniform dispersion. Although composites prepared via CVD [20] or with higher graphene content [18] can achieve higher strength, their conductivity is often compromised, or the process is more complex and costly. Therefore, the in situ growth from low-cost highland barley powder presents an excellent trade-off, offering a >236% increase in yield strength over pure copper while retaining 82% of its conductivity (70% IACS vs. 85% IACS).

4. Conclusions

Graphene was successfully synthesized using highland barley powder as a carbon source. Thermogravimetric results indicated that the Gr content in the Gr@Cu composite powder was 4.98 wt.%. The structure of the graphene was characterized by Raman spectroscopy, which revealed an I~D~/I~G~ ratio of 0.96 and an I~2D~/I~G~ ratio of approximately 0.7, confirming the presence of some defects and the few-layer nature (3–5 layers) of the in-situ-grown graphene. Gr@Cu/Cu composites were successfully fabricated via powder metallurgy. The graphene was uniformly distributed within the composite at contents of 0.35 wt.% and 0.70 wt.%, but slight agglomeration occurred at 1.05 wt.%. The in-situ-grown graphene exhibited strong interfacial bonding with the copper matrix, which facilitated the overcoming of van der Waals forces between graphene layers and promoted uniform dispersion. However, when the graphene content reached 1.05 wt.%, contact between Gr@Cu composite particles became inevitable, leading to graphene aggregation.
In terms of performance, the composite with 0.35 wt.% graphene exhibited the highest density and electrical conductivity, at 98.81% and 78% IACS, respectively. The composite with 0.70 wt.% graphene demonstrated the optimal mechanical properties, with a compressive yield strength of 175 MPa, representing a 236% increase compared to pure copper, while maintaining a respectable conductivity of 70% IACS. This compelling combination of enhanced strength and retained conductivity underscores the composite’s potential for applications as structural conductors and electrical contacts, where both mechanical robustness and electrical performance are critical.

Author Contributions

Conceptualization, D.L. and C.C.; methodology, C.S., C.D., D.L. and C.C.; software, X.T.; validation, X.T. and C.C.; investigation, C.D.; resources, C.C.; data curation, C.D.; writing—original draft, Z.W.; writing—review and editing, Z.W., C.S., X.T., D.L. and C.C.; visualization, Z.W., C.S., X.T. and C.C.; supervision, D.L. and C.C.; project administration, C.C. All authors have read and agreed to the published version of the manuscript.

Funding

This research was funded by Qinghai Minzu University (QHMU) No. 2024XJMA07.

Data Availability Statement

The original contributions presented in this study are included in the article. Further inquiries can be directed to the corresponding author.

Conflicts of Interest

The authors declare no conflicts of interest.

References

  1. Yu, Y.H.; Wang, W.S.; Hu, Y.C.; Tsai, C.H.; Shih, C.J.; Huang, W.C.; Peng, S.M.; Lee, G.H. A study of novel macrocyclic copper complex/graphene–based composite materials for counter electrodes of dye–sensitized solar cells. J. Chin. Chem. Soc. 2019, 66, 996–1007. [Google Scholar] [CrossRef]
  2. Yan, Y.F.; Kou, S.Q.; Yang, H.Y.; Shu, S.L.; Qiu, F.; Jiang, Q.C.; Zhang, L.C. Ceramic particles reinforced copper matrix composites manufactured by advanced powder metallurgy: Preparation, performance, and mechanisms. Int. J. Extrem. Manuf. 2023, 5, 032006. [Google Scholar] [CrossRef]
  3. Jayasathyakawin, S.; Ravichandran, M.; Mohanavel, V.; Kumar, S.D.; Sathish, T.; Rajkumar, S.; Subbiah, R. Copper Based Powder Metallurgy Composite for Electrical Applications. In Materials Science Forum; Trans Tech Publications Ltd.: Bäch, Switzerland, 2022; Volume 1068, pp. 151–158. [Google Scholar]
  4. Xu, Z.; Zhao, J.; Liu, M.; Liu, Z.; Cheng, X.; Chang, J.; Yang, X.; Li, B.; Liu, B.; Liu, R. Enhanced strength and toughness of SiC/C composite ceramics via SiC@graphene core–shell nanoparticles. J. Am. Ceram. Soc. 2025, 108, e20151. [Google Scholar] [CrossRef]
  5. Zhou, W.; Hong, L.; Wang, Y.; Ye, N.; Tang, J. Effect of sintering temperature on microstructure and properties of nano-WC particle reinforced copper matrix composites prepared by hot-pressing sintering. Mater. Res. Express 2020, 7, 126520. [Google Scholar] [CrossRef]
  6. Balashabadi, P.; Larijani, M.M.; Jafari-Khamse, E.; Seyedi, H. The role of Cu content on the structural properties and hardness of TiN–Cu nanocomposite film. J. Alloys Compd. 2017, 728, 863–871. [Google Scholar] [CrossRef]
  7. Jiang, Y.; Wang, C.; Liang, S.; Ren, J.; Du, X.; Liu, F. TiB2 (-TiB)/Cu in-situ composites prepared by hot-press with the sintering temperature just beneath the melting point of copper. Mater. Charact. 2016, 121, 76–81. [Google Scholar] [CrossRef]
  8. Fathy, A.; Shehata, F.; Abdelhameed, M.; Elmahdy, M. Compressive and wear resistance of nanometric alumina reinforced copper matrix composites. Mater. Des. (1980–2015) 2012, 36, 100–107. [Google Scholar] [CrossRef]
  9. Dong, Z.; Peng, Y.; Zhang, X.; Xiong, D.B. Plasma assisted milling treatment for improving mechanical and electrical properties of in-situ grown graphene/copper composites. Compos. Commun. 2021, 24, 100619. [Google Scholar] [CrossRef]
  10. Hu, Z.; Chen, F.; Lin, D.; Nian, Q.; Parandoush, P.; Zhu, X.; Shao, Z.; Cheng, G.J. Laser additive manufacturing bulk graphene–copper nanocomposites. Nanotechnology 2017, 28, 445705. [Google Scholar] [CrossRef]
  11. Nedumthakady, N.; Bhaskar, P.; Smet, V. Magneto-Assisted Graphene Reinforcement: A New Method to Enhance Nanostructure and Properties of Electrodeposited Copper. In Proceedings of the 2023 IEEE 73rd Electronic Components and Technology Conference (ECTC), Orlando, FL, USA, 30 May–2 June 2023. [Google Scholar]
  12. Liu, G.; Tao, J.; Li, F.; Bao, R.; Liu, Y.; Li, C.; Yi, J. Optimizing the interface bonding in Cu matrix composites by using functionalized carbon nanotubes and cold rolling. J. Mater. Res. 2019, 34, 2600–2608. [Google Scholar] [CrossRef]
  13. Xiu, Z.; Ju, B.; Zhan, J.; Zhang, N.; Wang, Z.; Mei, Y.; Liu, J.; Feng, Y.; Guo, Y.; Kang, P.; et al. Microstructure evolution of graphene and the corresponding effect on the mechanical/electrical properties of graphene/Cu composite during rolling treatment. Materials 2022, 15, 1218. [Google Scholar] [CrossRef]
  14. Guiderdoni, C.; Estournès, C.; Peigney, A.; Weibel, A.; Turq, V.; Laurent, C. The preparation of double-walled carbon nanotube/Cu composites by spark plasma sintering, and their hardness and friction properties. Carbon 2011, 49, 4535–4543. [Google Scholar] [CrossRef]
  15. Zhou, Q.; Xu, H.-B.; Du, M.; Lu, Y.-H. Surface modification of carbon nanotubes and its application in copper matrix composites. J. Funct. Mater. 2019, 50, 4201–4206. [Google Scholar]
  16. Yan, Q.; Chen, B.; Zhou, X.; Kondoh, K.; Li, J. Effect of Metal Powder Characteristics on Structural Defects of Graphene Nanosheets in Metal Composite Powders Dispersed by Ball Milling. Crystals 2021, 11, 260. [Google Scholar] [CrossRef]
  17. Zhao, W.M.; Bao, R.; Yi, J.H.; Hou, X.H.; Fang, D.; Liu, C.X. Fabrication of RGO/Cu composites based on electrostatic adsorption. Trans. Nonferrous Met. Soc. China 2020, 30, 982–991. [Google Scholar] [CrossRef]
  18. Nie, H.; Fu, L.; Zhu, J.; Yang, W.; Li, D.; Zhou, L. Excellent tribological properties of lower reduced graphene oxide content copper composite by using a one-step reduction molecular-level mixing process. Materials 2018, 11, 600. [Google Scholar] [CrossRef]
  19. Yang, T.; Chen, W.; Zhang, H.; Ma, L.; Fu, Y.Q. In-situ generated graphene from wheat flour for enhancing mechanical and electrical properties of copper matrix composites. Mater. Sci. Eng. A 2022, 835, 142662. [Google Scholar] [CrossRef]
  20. Chung, T.F.; Shen, T.; Cao, H.; Jauregui, L.A.; Wu, W.; Yu, Q.; Newell, D.; Chen, Y.P. Synthetic graphene grown by chemical vapor deposition on copper foils. Int. J. Mod. Phys. B 2013, 27, 1341002. [Google Scholar] [CrossRef]
  21. Sun, Z.; Yan, Z.; Yao, J.; Beitler, E.; Zhu, Y.; Tour, J.M. Growth of graphene from solid carbon sources. Nature 2010, 468, 549–552. [Google Scholar] [CrossRef]
  22. Obadi, M.; Sun, J.; Xu, B. Highland barley: Chemical composition, bioactive compounds, health effects, and applications. Food Res. Int. 2021, 140, 110065. [Google Scholar] [CrossRef]
  23. Liu, L.; Ryu, S.; Tomasik, M.R.; Stolyarova, E.; Jung, N.; Hybertsen, M.S.; Steigerwald, M.L.; Brus, L.E.; Flynn, G.W. Graphene oxidation: Thickness-dependent etching and strong chemical doping. Nano Lett. 2008, 8, 1965–1970. [Google Scholar] [CrossRef]
  24. Chu, K.; Wang, J.; Liu, Y.; Geng, Z. Graphene defect engineering for optimizing the interface and mechanical properties of graphene/copper composites. Carbon 2018, 140, 112–123. [Google Scholar] [CrossRef]
  25. Ferrari, A.C.; Meyer, J.C.; Scardaci, V.; Casiraghi, C.; Lazzeri, M.; Mauri, F.; Piscanec, S.; Jiang, D.; Novoselov, K.S.; Roth, S.; et al. Raman spectrum of graphene and graphene layers. Phys. Rev. Lett. 2006, 97, 187401. [Google Scholar] [CrossRef]
  26. Agrawal, A.; Charleston, J.; Mirzaeifar, R. Experimental investigation of mechanical behavior at the microstructure of copper-graphene thin films. Mater. Sci. Eng. A 2023, 862, 144492. [Google Scholar] [CrossRef]
  27. Dong, L.L.; Fu, Y.Q.; Liu, Y.; Lu, J.W.; Zhang, W.; Huo, W.T.; Jin, L.H.; Zhang, Y.S. Interface engineering of graphene/copper matrix composites decorated with tungsten carbide for enhanced physico-mechanical properties. Carbon 2021, 173, 41–53. [Google Scholar] [CrossRef]
  28. Jiang, L.; Wen, H.; Yang, H.; Hu, T.; Topping, T.; Zhang, D.; Lavernia, E.J.; Schoenung, J.M. Influence of length-scales on spatial distribution and interfacial characteristics of B4C in a nanostructured Al matrix. Acta Mater. 2015, 89, 327–343. [Google Scholar] [CrossRef]
  29. McQuade, G.A.; Plaut, A.S.; Usher, A.; Martin, J. The thermal expansion coefficient of monolayer, bilayer, and trilayer graphene derived from the strain induced by cooling to cryogenic temperatures. Appl. Phys. Lett. 2021, 118, 203101. [Google Scholar] [CrossRef]
  30. Abdel-Aal, S.K.; Beskrovnyi, A.I.; Ionov, A.M.; Mozhchil, R.N.; Abdel-Rahman, A.S. structure investigation by neutron diffraction and x-ray diffraction of graphene nanocomposite CuO–rGO prepared by low-cost method. Phys. Status Solidi (a) 2021, 218, 2100138. [Google Scholar] [CrossRef]
  31. Yu, Y.; Feng, S.; Liu, Y.; Yan, Z.; Chen, G.; Yang, J.; Zhang, W. Effect of Temperature on the Mechanical Properties, Conductivity, and Microstructure of Multi-layer Graphene/Copper Composites Fabricated by Extrusion. J. Mater. Eng. Perform. 2025, 34, 7773–7785. [Google Scholar] [CrossRef]
  32. Tong, Y.; Wang, L.; Wang, B.; Hu, Y.; Cai, Z.; Ren, J.; Liu, J.; Li, S. Microstructure and mechanical behavior of carbon fiber reinforced carbon, silicon carbide, and copper alloy hybrid composite fabricated by Cu-Si alloy melt infiltration. Adv. Compos. Hybrid Mater. 2023, 6, 25. [Google Scholar] [CrossRef]
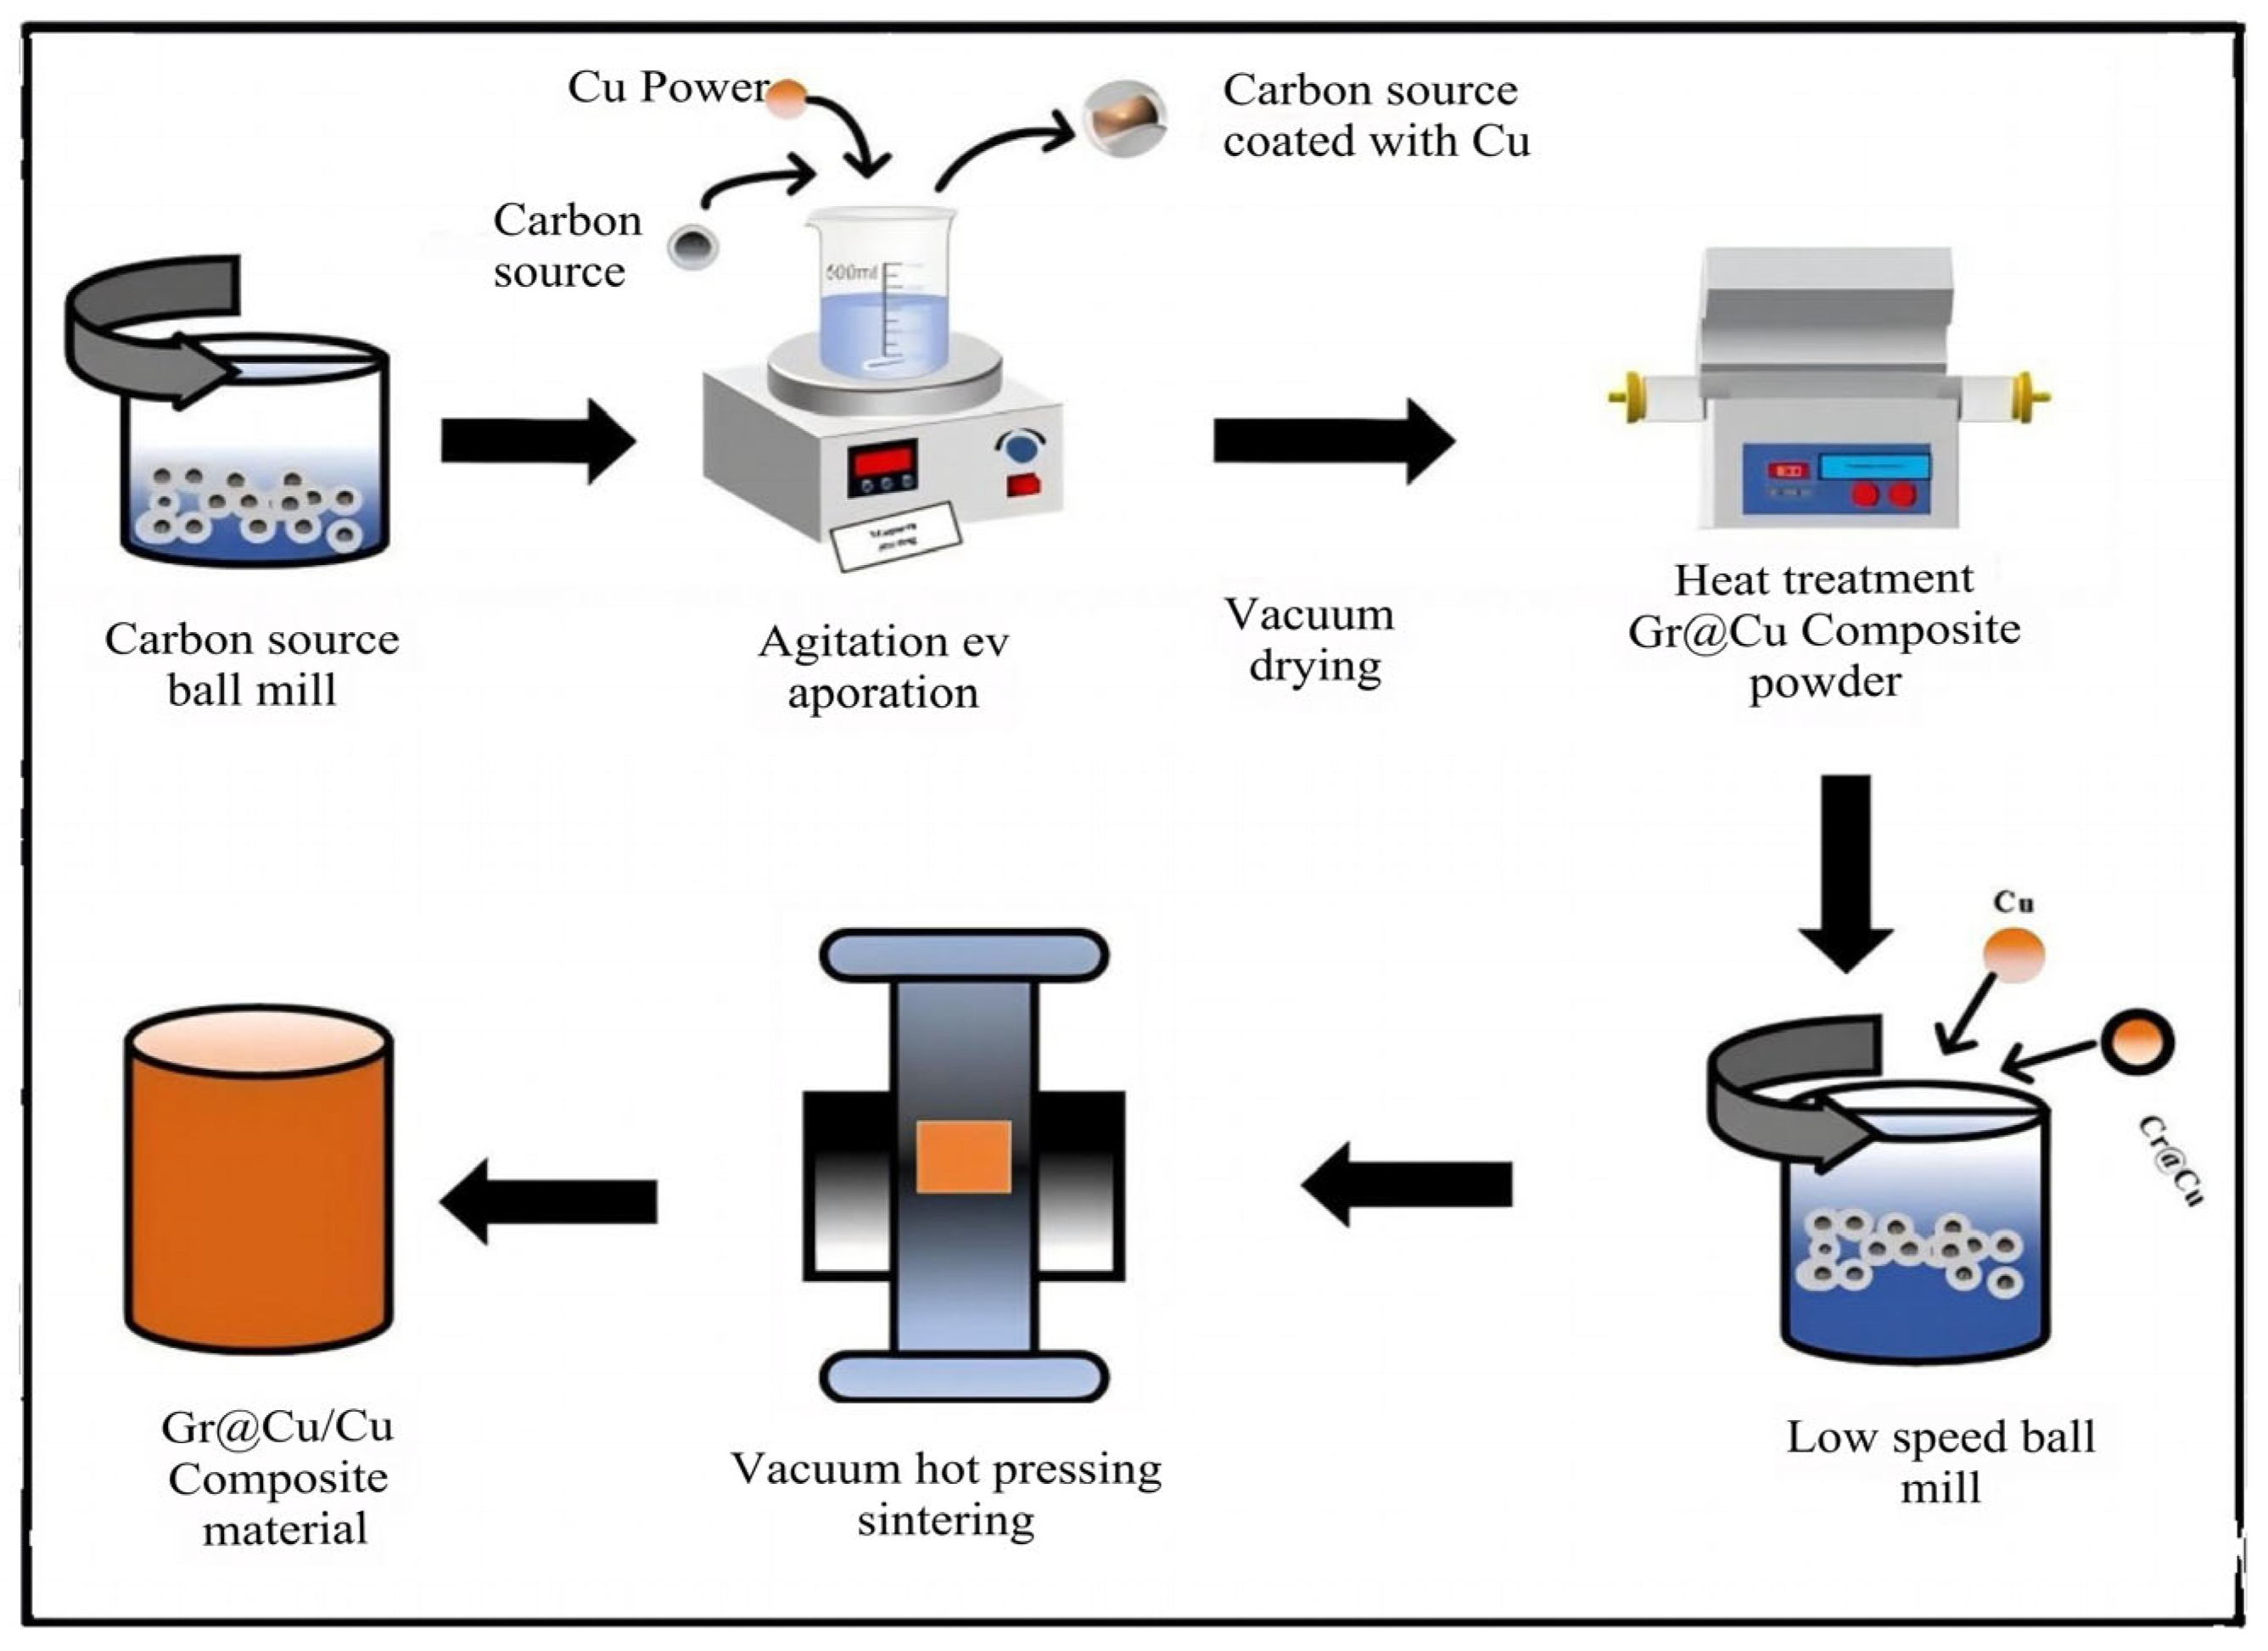
Figure 1. Flowchart of preparation process of Gr@Cu/Cu composites.
Metals 15 01217 g001
Figure 2. (a) Thermogravimetric curve of highland barley powder carbonization to graphene (The green line represents the change in temperature over time); (b) Raman images of graphene prepared from highland barley powder; (c) XRD image of composite powder.
Metals 15 01217 g002
Figure 3. TEM and HRTEM images of Gr@Cu composite powder: (a) TEM; (b) HRTEM.
Metals 15 01217 g003
Figure 4. Microstructure of Gr@Cu composite powder: (a) HRTEM diagram; (b) FFT image of the area in red box; (c) IFFT images; (d) IFFT image of Gr (002) crystal face; (e) IFFT images of Cu ( 1 1 ¯ 1 ) and ( 11 1 ¯ ) crystal faces.
Metals 15 01217 g004
Figure 5. (a,b) Microstructure of 0.7 wt.%Gr@Cu/Cu composite powder; (c,d) the distribution of elements; (e) Particle size distribution in (c).
Metals 15 01217 g005
Figure 6. XRD comparison of Gr@Cu/Cu composite and composite powder, where (a1) is the enlarged image of the red dashed area in (a).
Metals 15 01217 g006
Figure 7. Surface micromorphologies of composites with different Gr contents. (a,b) 0.35 wt.%Gr@Cu/Cu; (c,d) 0.70 wt.%Cu/Cu; (e,f) 1.05 wt.%Gr@Cu/Cu.
Metals 15 01217 g007
Figure 8. Elemental distribution image of the composite material. (a) 0.35 wt.%Gr@Cu/Cu; (b) 0.70 wt.%Gr@Cu/Cu; (c) 1.05 wt.%Gr@Cu/Cu. Fine spectrum of elemental distribution of (d1d4): 1.05 wt.%Gr@Cu/Cu composites.
Metals 15 01217 g008
Figure 9. (a) Microstructure of 1.05 wt.%Gr@Cu/Cu composite; (b) EDS spectra corresponding to the red marked points.
Metals 15 01217 g009
Figure 10. Density and conductivity of Gr@Cu/Cu composites.
Metals 15 01217 g010
Figure 11. Compressive stress–strain curve of Gr@Cu/Cu composite at room temperature. (a) Compressive stress–strain curve; (b) Partial enlarged view.
Metals 15 01217 g011
Figure 12. Compressive stress–strain comparison of different composites.
Metals 15 01217 g012
Table 1. Quantitative comparison of the mechanical and electrical properties of copper matrix composites reinforced with graphene prepared by different methods.
Reinforcement TypePreparation MethodCarbon SourceGraphene Content (wt.%)Yield Strength (MPa)Conductivity (%IACS)Reference
GrIn situ growthHighland barley powder0.7017570This work
GrIn situ growthWheat flour0.75~160~75[19]
GrBall millingCommercial graphene0.50~140~65[16]
GrMolecular-level mixingGO2.50~210~60[18]
GrCVD + PMCH41.80~190~80[20]
CNTBall millingCommercial CNT0.70133(Not reported)This work
Pure CuPowder metallurgy-05285This work
Disclaimer/Publisher’s Note: The statements, opinions and data contained in all publications are solely those of the individual author(s) and contributor(s) and not of MDPI and/or the editor(s). MDPI and/or the editor(s) disclaim responsibility for any injury to people or property resulting from any ideas, methods, instructions or products referred to in the content.