Article

Phase Equilibrium Relationship of CaO-Al2O3-Ce2O3-CaF2 Slag System at 1300~1500 °C

1
Key Laboratory for Ecological Metallurgy of Multimetallic Ores (Ministry of Education), Shenyang 110819, China
2
School of Metallurgy, Northeastern University, Shenyang 110819, China
*
Authors to whom correspondence should be addressed.
Metals 2025, 15(11), 1209; https://doi.org/10.3390/met15111209
Submission received: 30 September 2025 / Revised: 27 October 2025 / Accepted: 28 October 2025 / Published: 30 October 2025

Abstract

CaO-Al2O3-Ce2O3 is a potential new-type basic metallurgical slag system for rare earth steel. To investigate the effects of CaF2 on the melting point and equilibrium phase types of this slag system, the phase equilibrium relationships and extent of the liquid phase region of CaO-Al2O3-Ce2O3-CaF2 slag system at 1300 °C, 1400 °C, and 1500 °C in C/CO were determined by the high-temperature phase equilibrium experiment, Scanning Electron Microscope-Energy Dispersive X-ray Spectrometer (SEM-EDX) and X-ray Diffraction (XRD), and the isothermal phase diagram was plotted. The experimental results show that within the composition range in this study, the slag system has five, seven, and six liquid–solid equilibrium coexistence regions at 1300 °C, 1400 °C, and 1500 °C. The involved multiphase equilibrium regions include five two-phase regions (i.e., Liquid + CaO, Liquid + CaO·2Al2O3, Liquid + 2CaO·Al2O3·Ce2O3, Liquid + 2CaO·3Al2O3·Ce2O3, Liquid + 11CaO·7Al2O3·CaF2), 4 three-phase regions (i.e., Liquid + CaO + 2CaO·Al2O3·Ce2O3, Liquid + 11CaO·7Al2O3·CaF2 + 2CaO·Al2O3·Ce2O3, Liquid + CaO·2Al2O3 + 2CaO·3Al2O3·Ce2O3, Liquid + 11CaO·7Al2O3·CaF2 + 2CaO·3Al2O3·Ce2O3), and 1 four-phase region (i.e., Liquid + CaO + 11CaO·7Al2O3·CaF2 + 2CaO·Al2O3·Ce2O3). Meanwhile, based on liquid phase compositions under liquid–solid multiphase equilibrium, the slag system’s liquid phase ranges at the experimental temperatures were determined as follows: at 1300 °C: w(CaO)/w(Al2O3) = 0.42~0.92, w(Ce2O3) = 1.63%~8.02%, w(CaF2) = 9.17%~21.46%; 1400 °C: 0.28~1.18, 0.9%~12.62%, 1.04%~23.34%, respectively; 1500 °C: 0.23~1.21, 0~14.42%, 0~26.32%, respectively.

1. Introduction

Rare earths play roles like microalloying, molten steel purification, and inclusion modification in iron and steel materials [1], making rare earth steel smelting a key field for light rare earth resource utilization [2]. The traditional CaO-SiO2-CaF2-Na2O continuous casting mold flux experienced intense reactions with rare earths at the slag–metal interface during rare earth steel smelting. For instance, SiO2 and Na2O were heavily reduced by rare earths through this interfacial reaction (reaction equations: 2RE + 3SiO2 = RE2O3 + 3Si, 2RE + Na2O = RE2O3 + 2Na↑), which in turn impaired the stability of the mold flux’s performance [3,4,5]. Moreover, the rare earth oxides from these reactions promote the precipitation of high-melting phases (e.g., Cuspidine) in the flux, increasing its viscosity and crystallization properties [6,7]. What is worse, the surface defects and sticking breakout may be initiated in severe cases. To reduce reactivity during rare earth steel smelting, relevant scholars [8,9,10,11,12,13,14] have developed a new CaO-Al2O3-Ce2O3-CaF2 mold flux system for rare earth steel continuous casting. Among its components, the CaO-Al2O3-based slag system can reduce the activity of SiO2, thereby effectively inhibiting the reaction between rare earths and SiO2. As a fluxing agent, CaF2 can replace Na2O; on the basis of lowering the melting point of the mold flux [15], it can also reduce the slag viscosity and improve heat transfer efficiency.
The thermodynamic properties of molten slag are crucial for guiding metallurgical slag system design and production. Research on the CaO-Al2O3-Ce2O3-CaF2 slag system (its design, development, and physical-chemical properties) is still in its early stages. No studies have been reported on the phase diagram of this system, and the effect of CaF2 on the melting point and phase regions of the rare earth slag system remains unexplored. Only phase diagrams of its sub-systems are available, such as CaO-Al2O3 binary system [16], Liquidus of the CeO2-Al2O3 binary system [17,18], CaO-CaF2 binary system [19], study on the intermediate phases in the CaO-Al2O3-CaF2 system [20], the liquid phase distribution of the CaO-Al2O3-Ce2O3 system in reducing atmosphere at 1500~1600 °C [21,22,23], and the phase equilibrium of the CaO-Al2O3-CeO2 system in air [24]. Since mold flux typically works at 1300~1500 °C [25,26,27], the phase equilibrium relationships and extent of the liquid phase region of CaO-Al2O3-Ce2O3-CaF2 slag system at 1300 °C, 1400 °C, and 1500 °C in C/CO were determined by the high-temperature phase equilibrium experiment, Scanning Electron Microscope- Energy Dispersive X-ray Spectrometer (SEM-EDX) and X-ray Diffraction (XRD), and the isothermal phase diagram was plotted. The data in this paper can, for the first time, fill the gap in the high-temperature experimental phase equilibrium data of the CaO-Al2O3-Ce2O3-CaF2 quaternary slag system. Based on this, it is possible to determine the liquid phase region of this slag system under smelting temperature conditions, as well as identify undiscovered new rare earth-containing phases. In addition, the phase equilibrium data can also provide support for the optimization of the thermodynamic database of the current rare earth-containing slag system.

2. Experimental Procedure

2.1. Slag Sample Preparation

In this experiment, 99.99% pure (mass fraction) CaO, Al2O3, CeO2, and CaF2 reagents were used (Manufacturer: Sinopharm Reagent, Beijing, China). High-purity reagents were calcined in a muffle furnace (Model: TMF-14-09, Manufacturer: Beijing Hexin Tongtong Technology Development Co., Ltd., Beijing, China) at 1000 °C for 4 h to remove the crystalline water and volatile impurities. Next, an electronic balance (Model: JA203H, Precision: 0.0001 g, Manufacturer: Changzhou Maikenuo Instrument Co., Ltd., Changzhou, China) was used to accurately weigh the reagents and prepare 10 g of experimental slag samples. The slag composition was designed based on the composition range of the CaO-Al2O3-Ce2O3 system at 1500 °C [28] and actual production metallurgical slag compositions [29,30,31,32].
To obtain glassy slag samples with uniform composition, the prepared experimental slag was pre-melted as follows: the mixed slag sample was placed in a graphite crucible and heated in a high-frequency induction furnace. Once the slag was fully melted, it was quickly removed and cooled in an ice-water mixture to obtain a glassy sample and prevent crystallization.
After preparation, the slag samples were analyzed via SEM-EDX (Model: Phenom ProX, Manufacturer: Phenom Scientific Instruments, Shanghai, China). As shown in Figure 1, the pre-melted slag samples exhibited a uniform glassy phase, indicating a significant pre-melting effect.
When analyzing the composition of slag samples using EDX (semi-quantitative detection, Model: Phenom ProX, Manufacturer: Phenom Scientific Instruments, Shanghai, China), errors may occur due to factors such as the principle of the instrument and the state of the sample. To verify its reliability, some slag samples were selected for EPMA (Model: JEOL JXA-8530F Manufacturer: JEOL Ltd., Tokyo, Japan) analysis at the same time. The results of the two methods were compared, and the errors were calculated. The results are shown in Table 1. It can be seen from the table that the error range of the detection results between EDX and EPMA is 1.2%~2.1%, which is within the acceptable range. This indicates that in this research scenario, EDX has a certain reliability for slag composition detection and can meet the relevant analysis requirements. Therefore, the actual initial composition of the slag samples was determined based on the EDX results in this experiment to ensure the accuracy of subsequent equilibrium experiment results, as presented in Table 2.

2.2. High Temperature Equilibrium Experiment

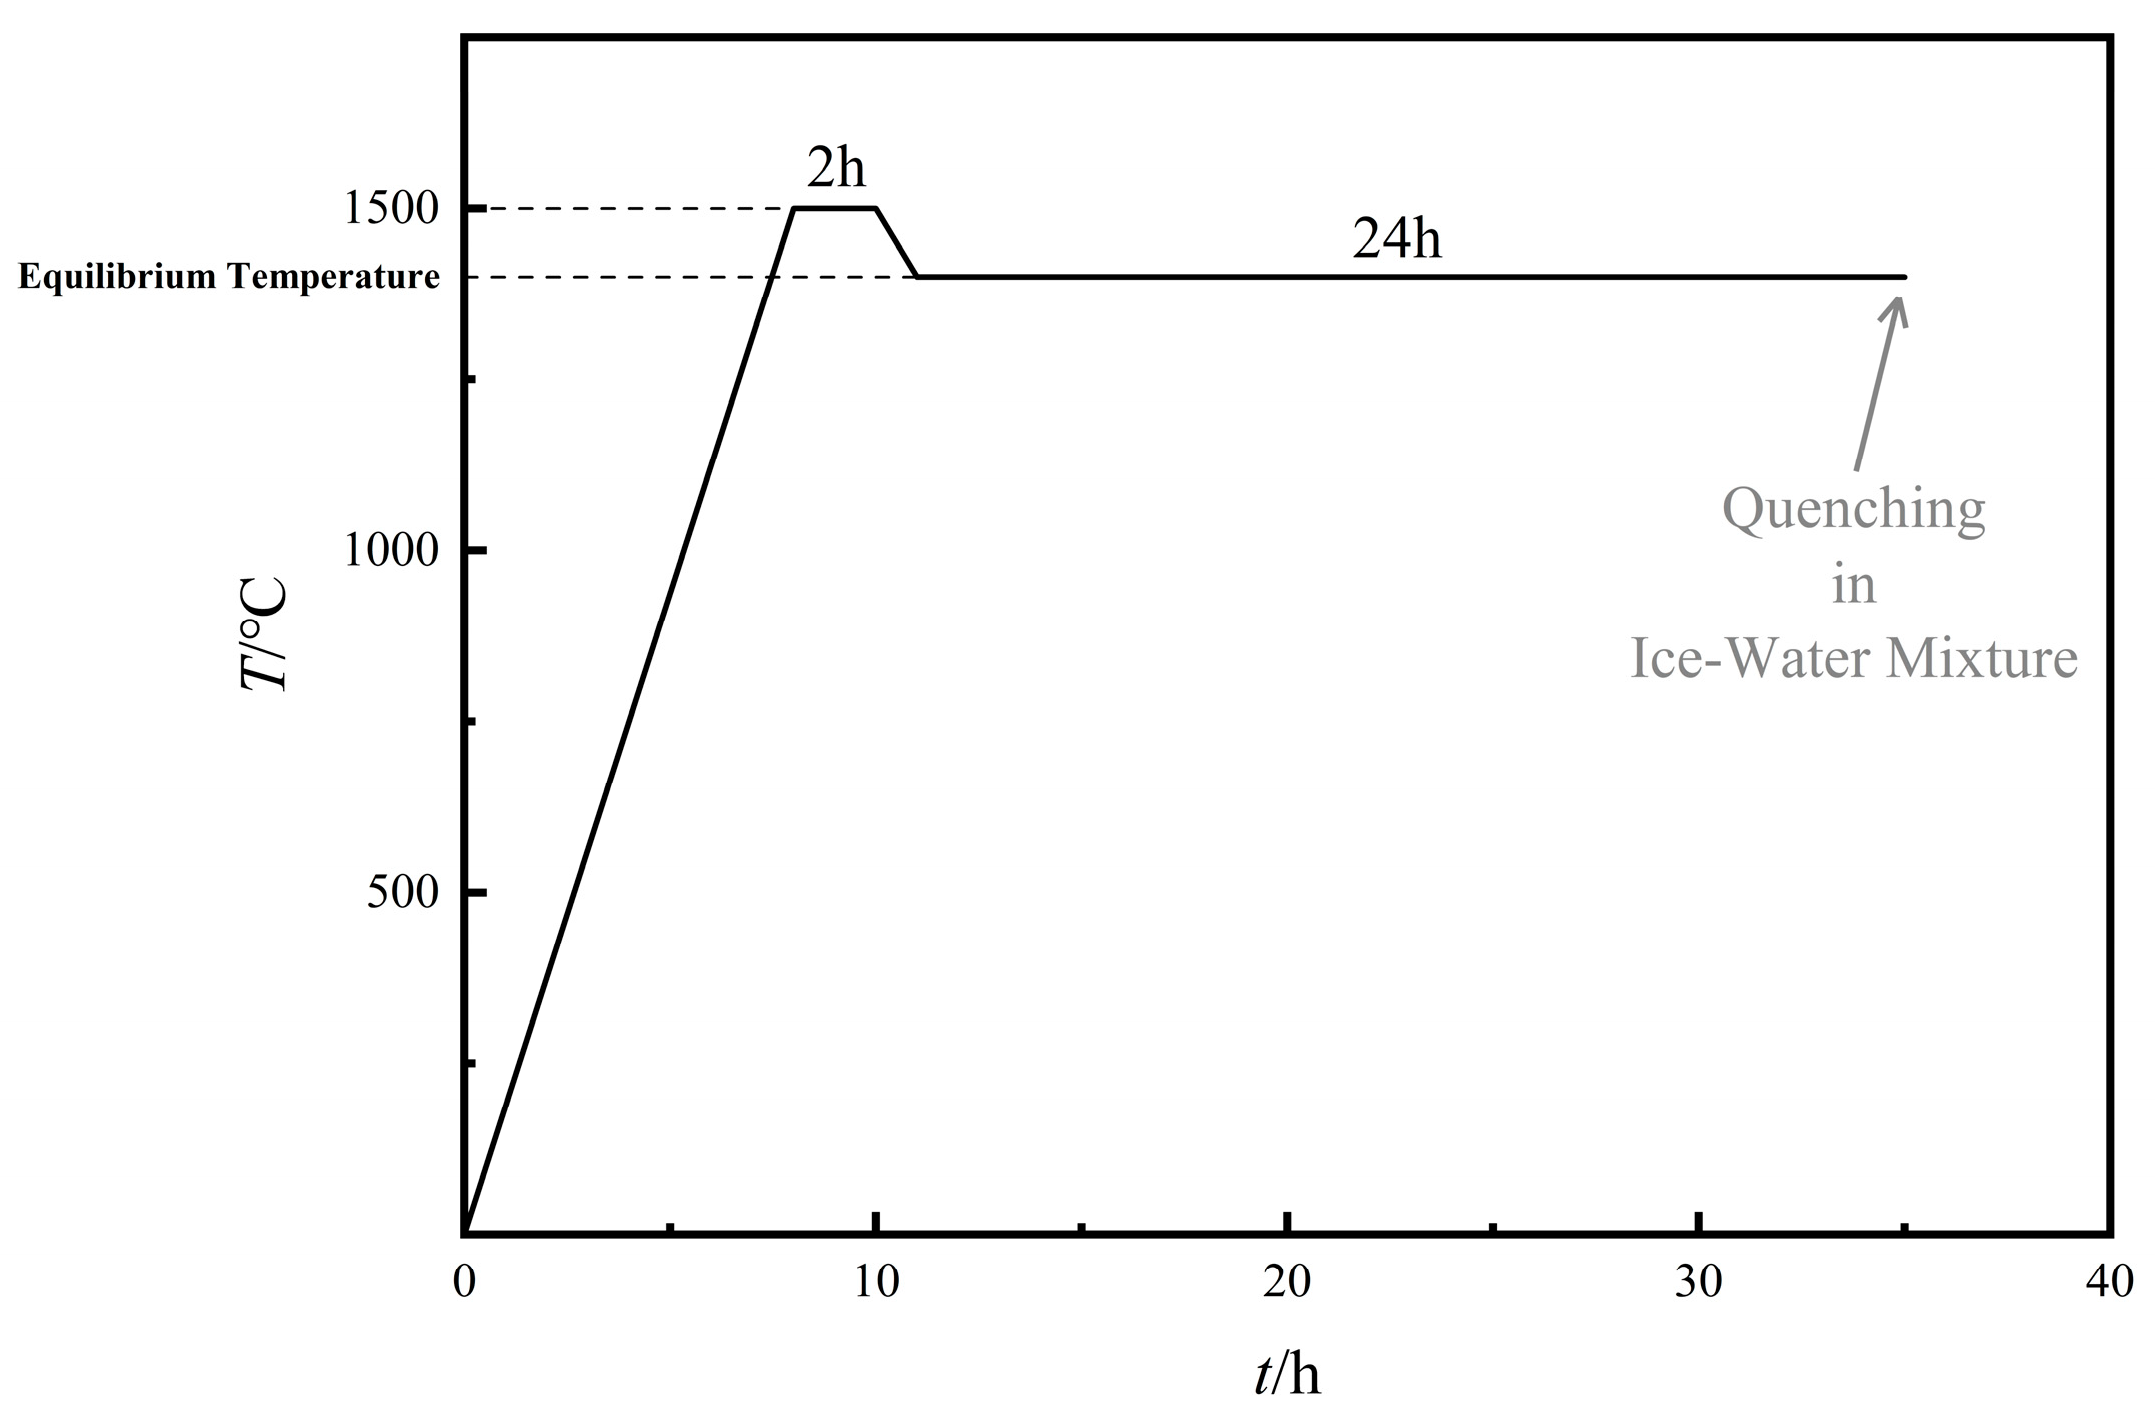
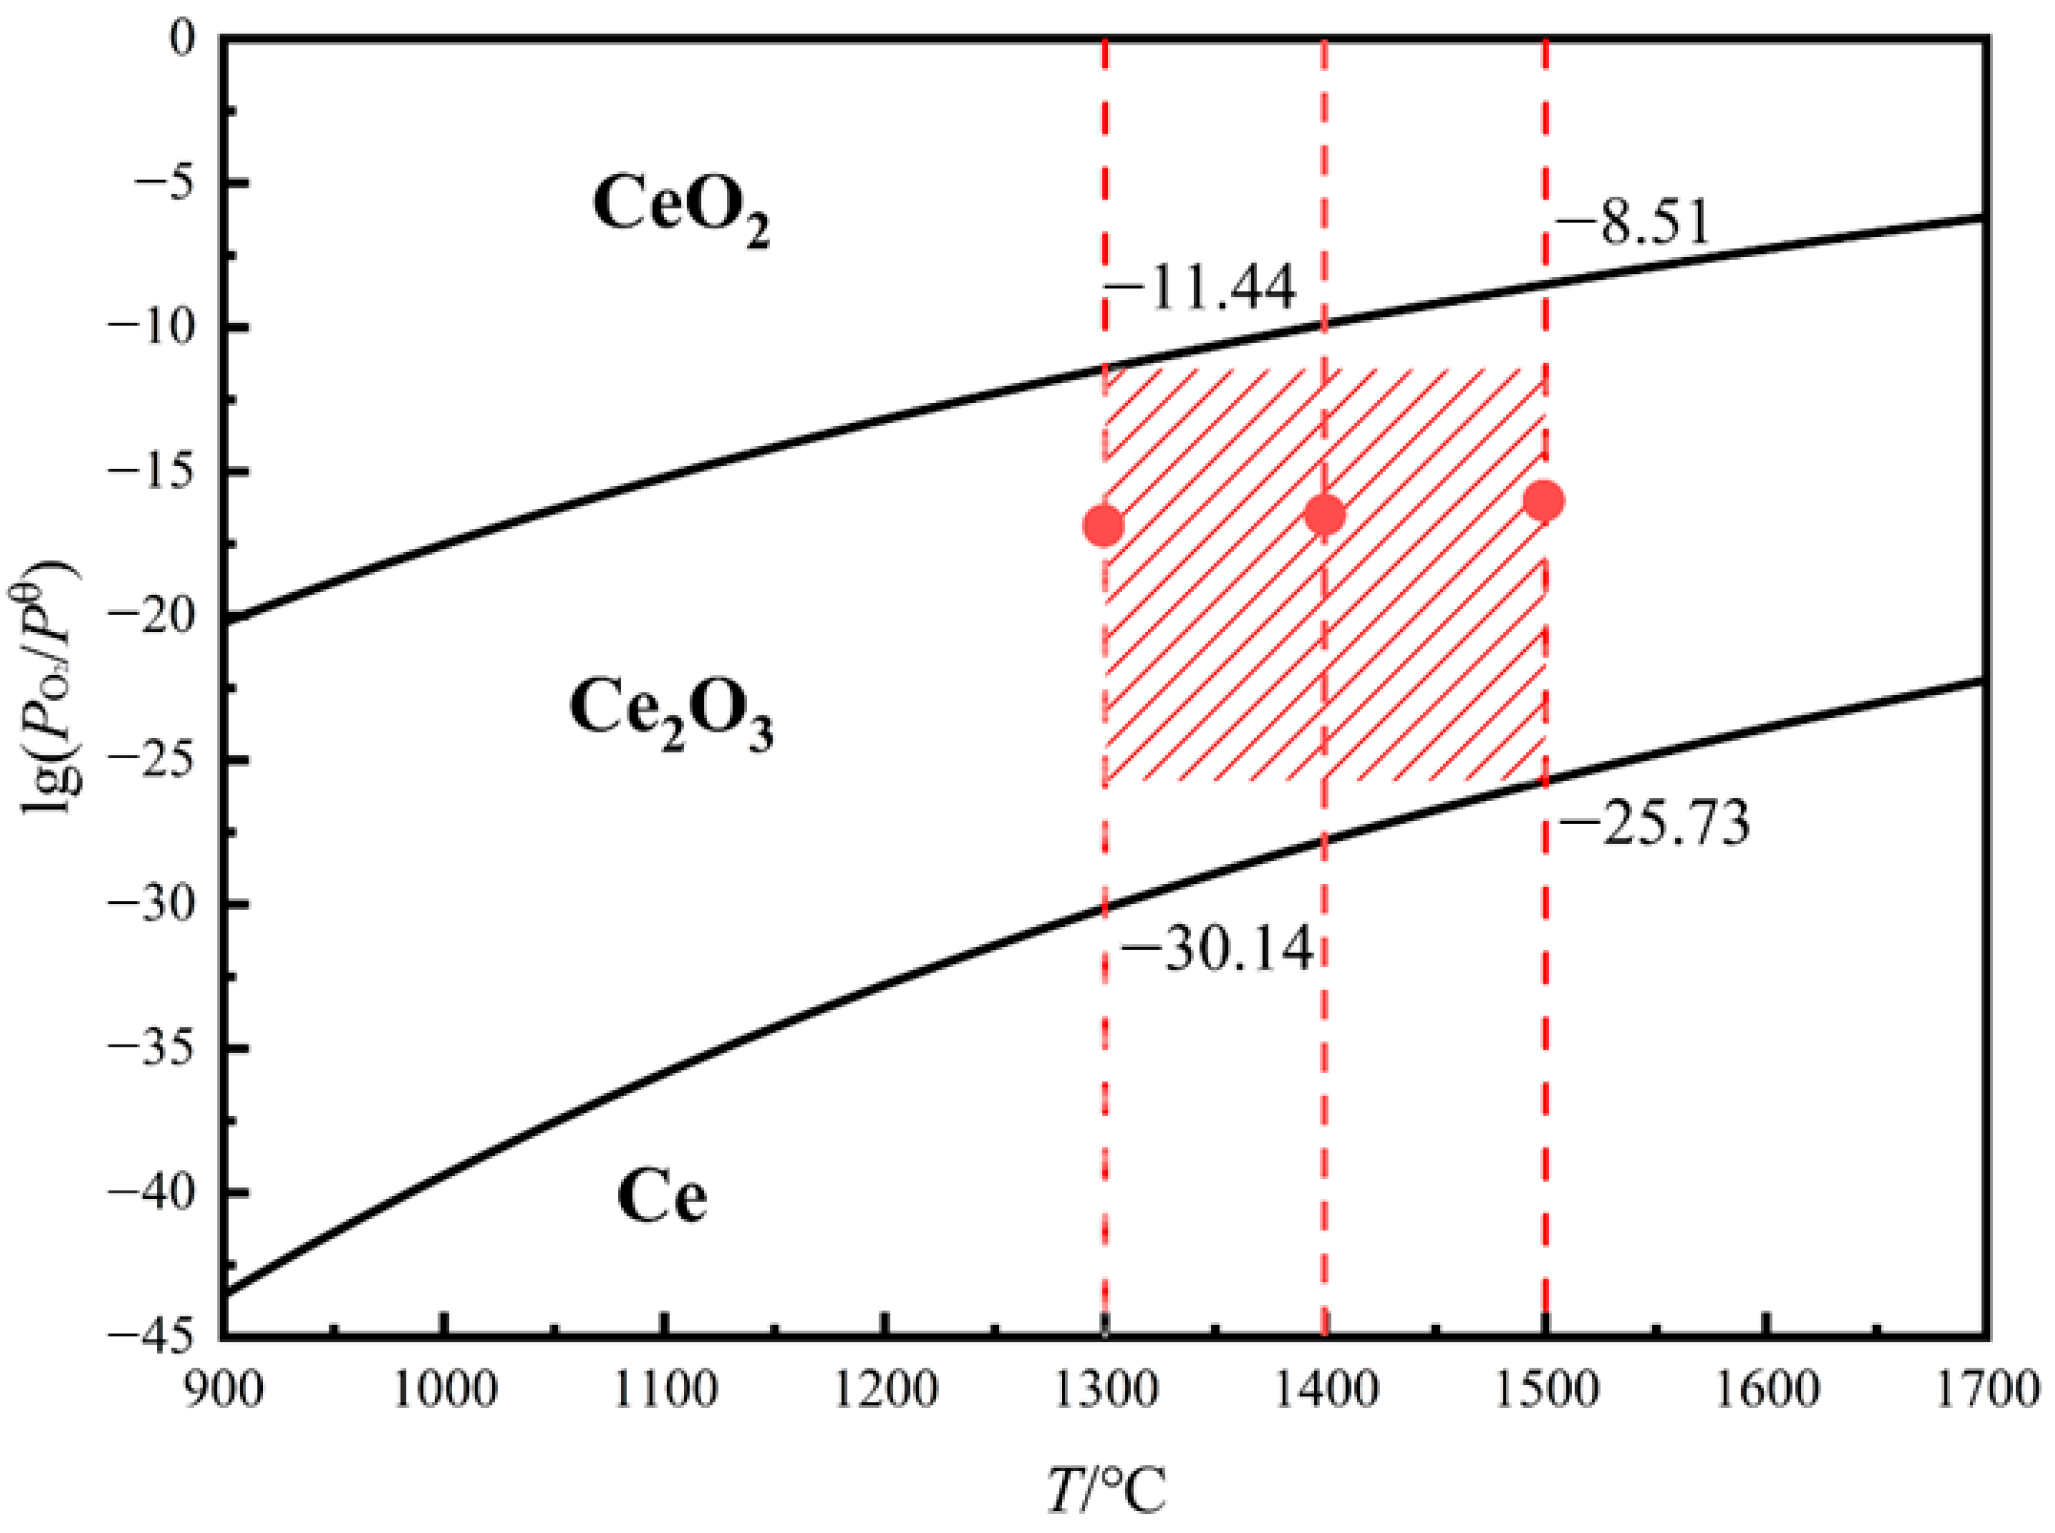
A graphite crucible containing 1.5 g of pre-melted slag was hung in the constant-temperature zone of a quenching furnace for heating (Heater material: MoSi2, thermocouple: platinum-rhodium B type, temperature control accuracy: ±1 °C, temperature measurement accuracy: ±1 °C, gas type: inert gas and reducing gas, gas flow: 0~5 L/min). The temperature control curve during the experiment is shown in Figure 2, and the slag samples were held at equilibrium temperatures (1300 °C, 1400 °C, 1500 °C) for 24 h to ensure they reached thermodynamic equilibrium [33,34,35,36]. To keep Ce stable in the +3 valence state, a graphite crucible/CO atmosphere was used throughout the experiment, as guided by the dominance area diagram of cerium oxides, as shown in Figure 3. The oxygen partial pressure controlled by the reaction 2C(s) + O2(pO2) = 2CO (1 atm) at the experimental temperature was calculated using FactSage 8.3, as indicated by the red dots in Figure 3. As can be seen from the dominance area diagram of cerium oxides, which is well within the stability field of Ce2O3. After thermodynamic equilibrium was achieved, the slag samples were quickly removed and cooled in an ice-water mixture to preserve the high-temperature equilibrium phase composition. At the end of the experiment, the slag samples were dried, crushed, and embedded in metallographic hot mounting powder (Model: SCHM-102, Manufacturer: Shangce Metallographic Instrument Co., Ltd., Hangzhou, China). They were then ground with silicon carbide sandpapers with grits 600#, 1000#, 1500#, 2000#; finally, the sample was polished using diamond lapping paste by a metallographic grinding and polishing machine (Model: GX, MP-1 Manufacturer: Guangxiang Sample Preparation Equipment Co., Ltd., Shanghai, China). The equilibrium phase composition and composition of the slag samples at the target temperatures were determined via SEM-EDX.
To confirm that equilibrium can be achieved within 24 h, a time-dependent experiment was conducted on slag sample 7 at 1300 °C. The samples were held for 24 h and 36 h, respectively, then quenched, and the liquid phase compositions were determined by SEM-EDS. Figure 4 shows the SEM images of slag sample 7 under different holding times, and the table below presents the EDS results of slag sample 7 under different holding times. The results showed no significant differences in phase assemblage or liquid phase composition between the 24 h and 36 h samples, indicating that equilibrium was reached by 24 h.

3. Phase Equilibrium Results

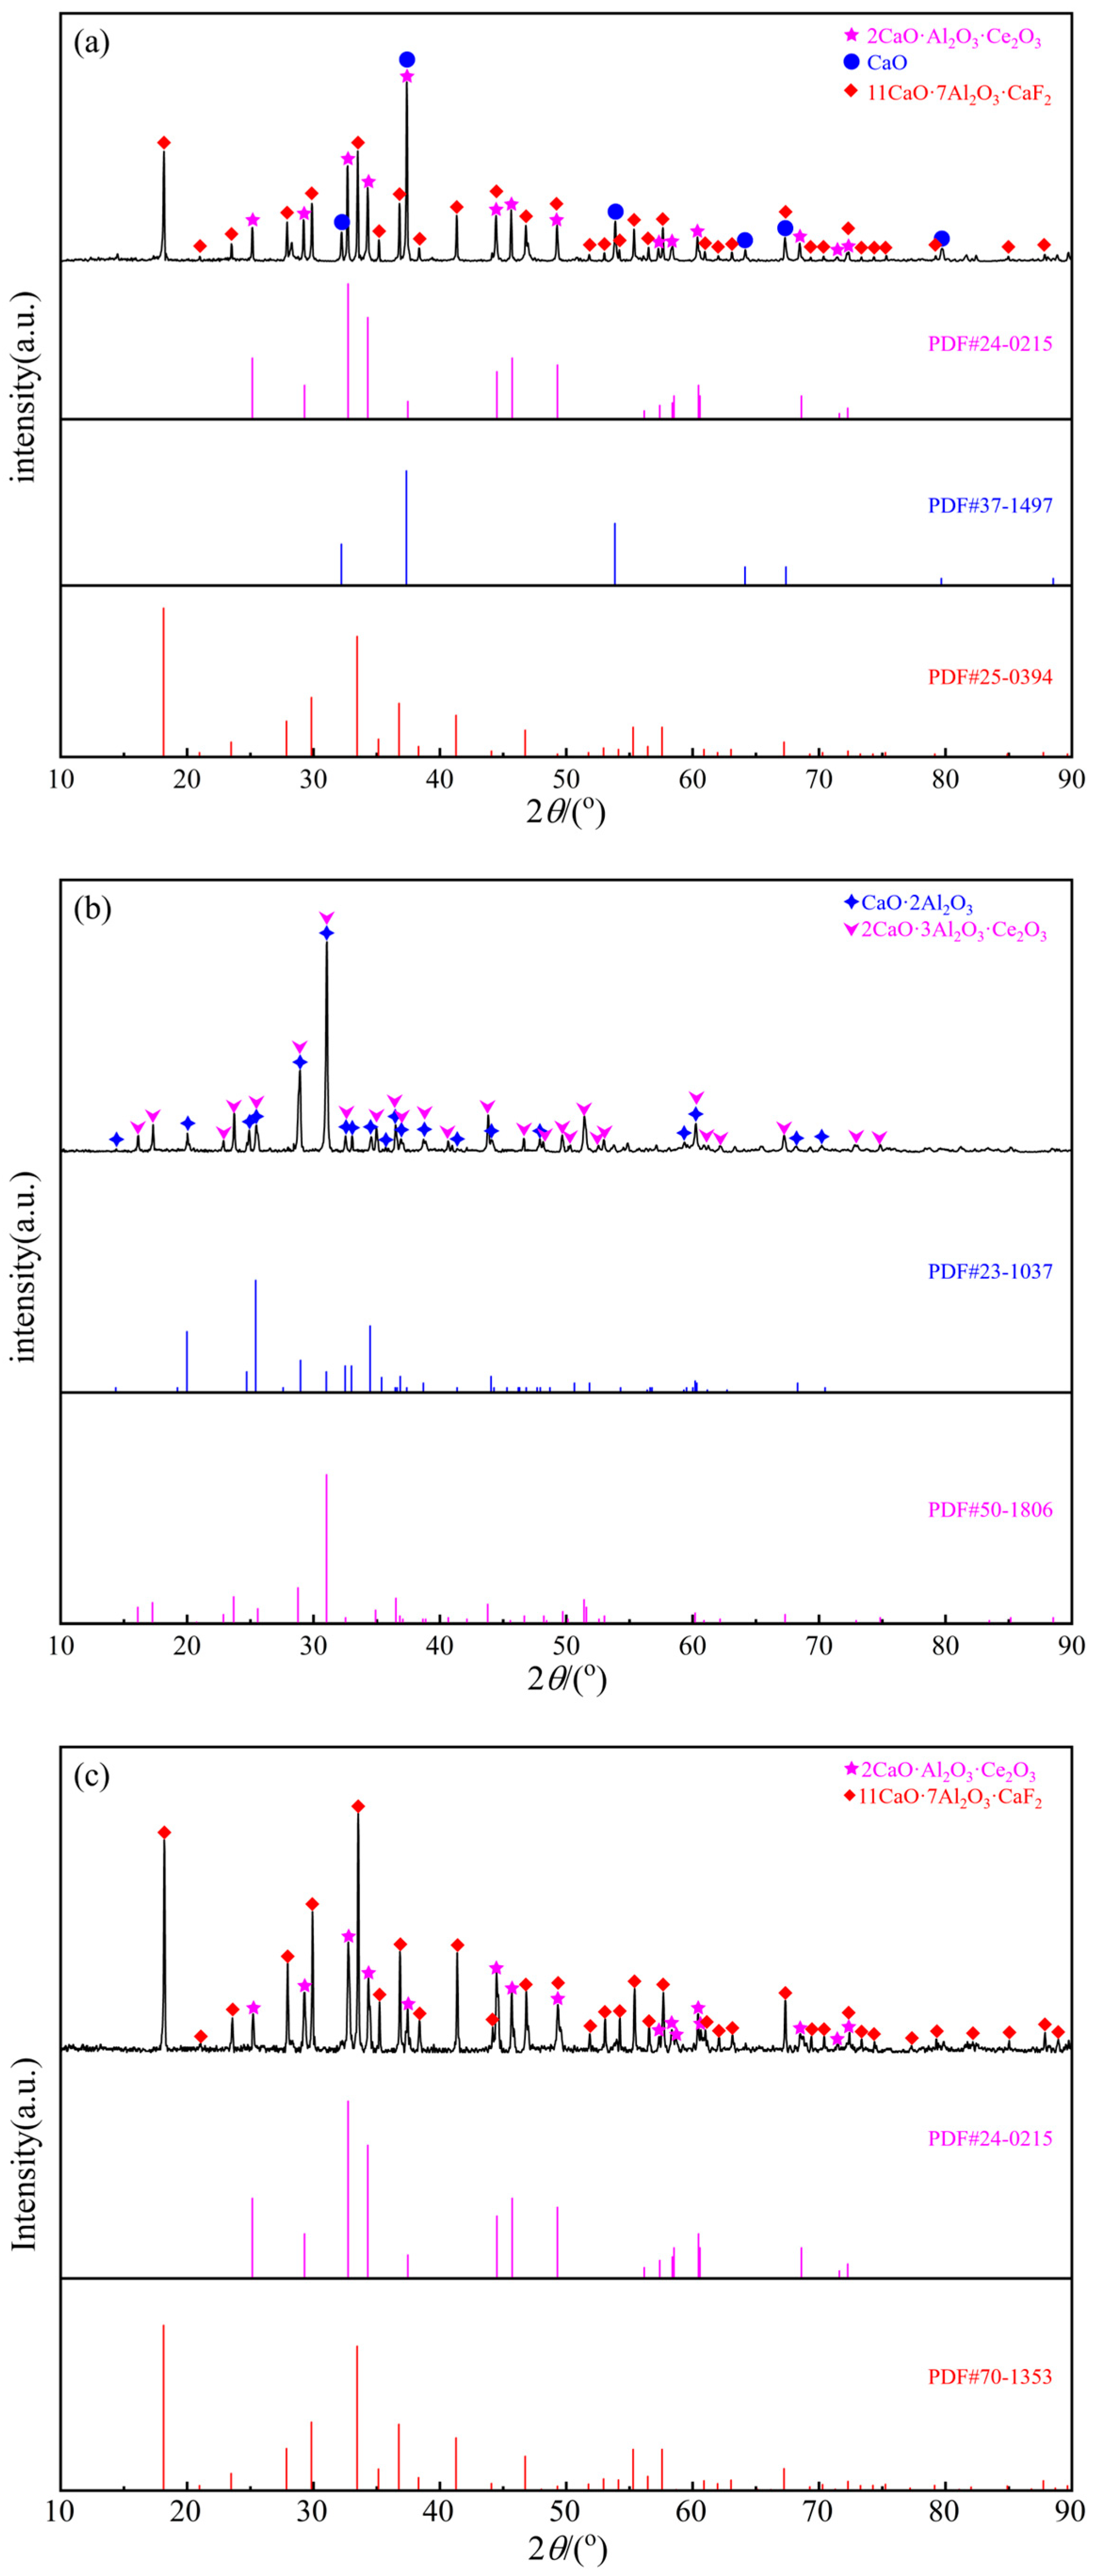
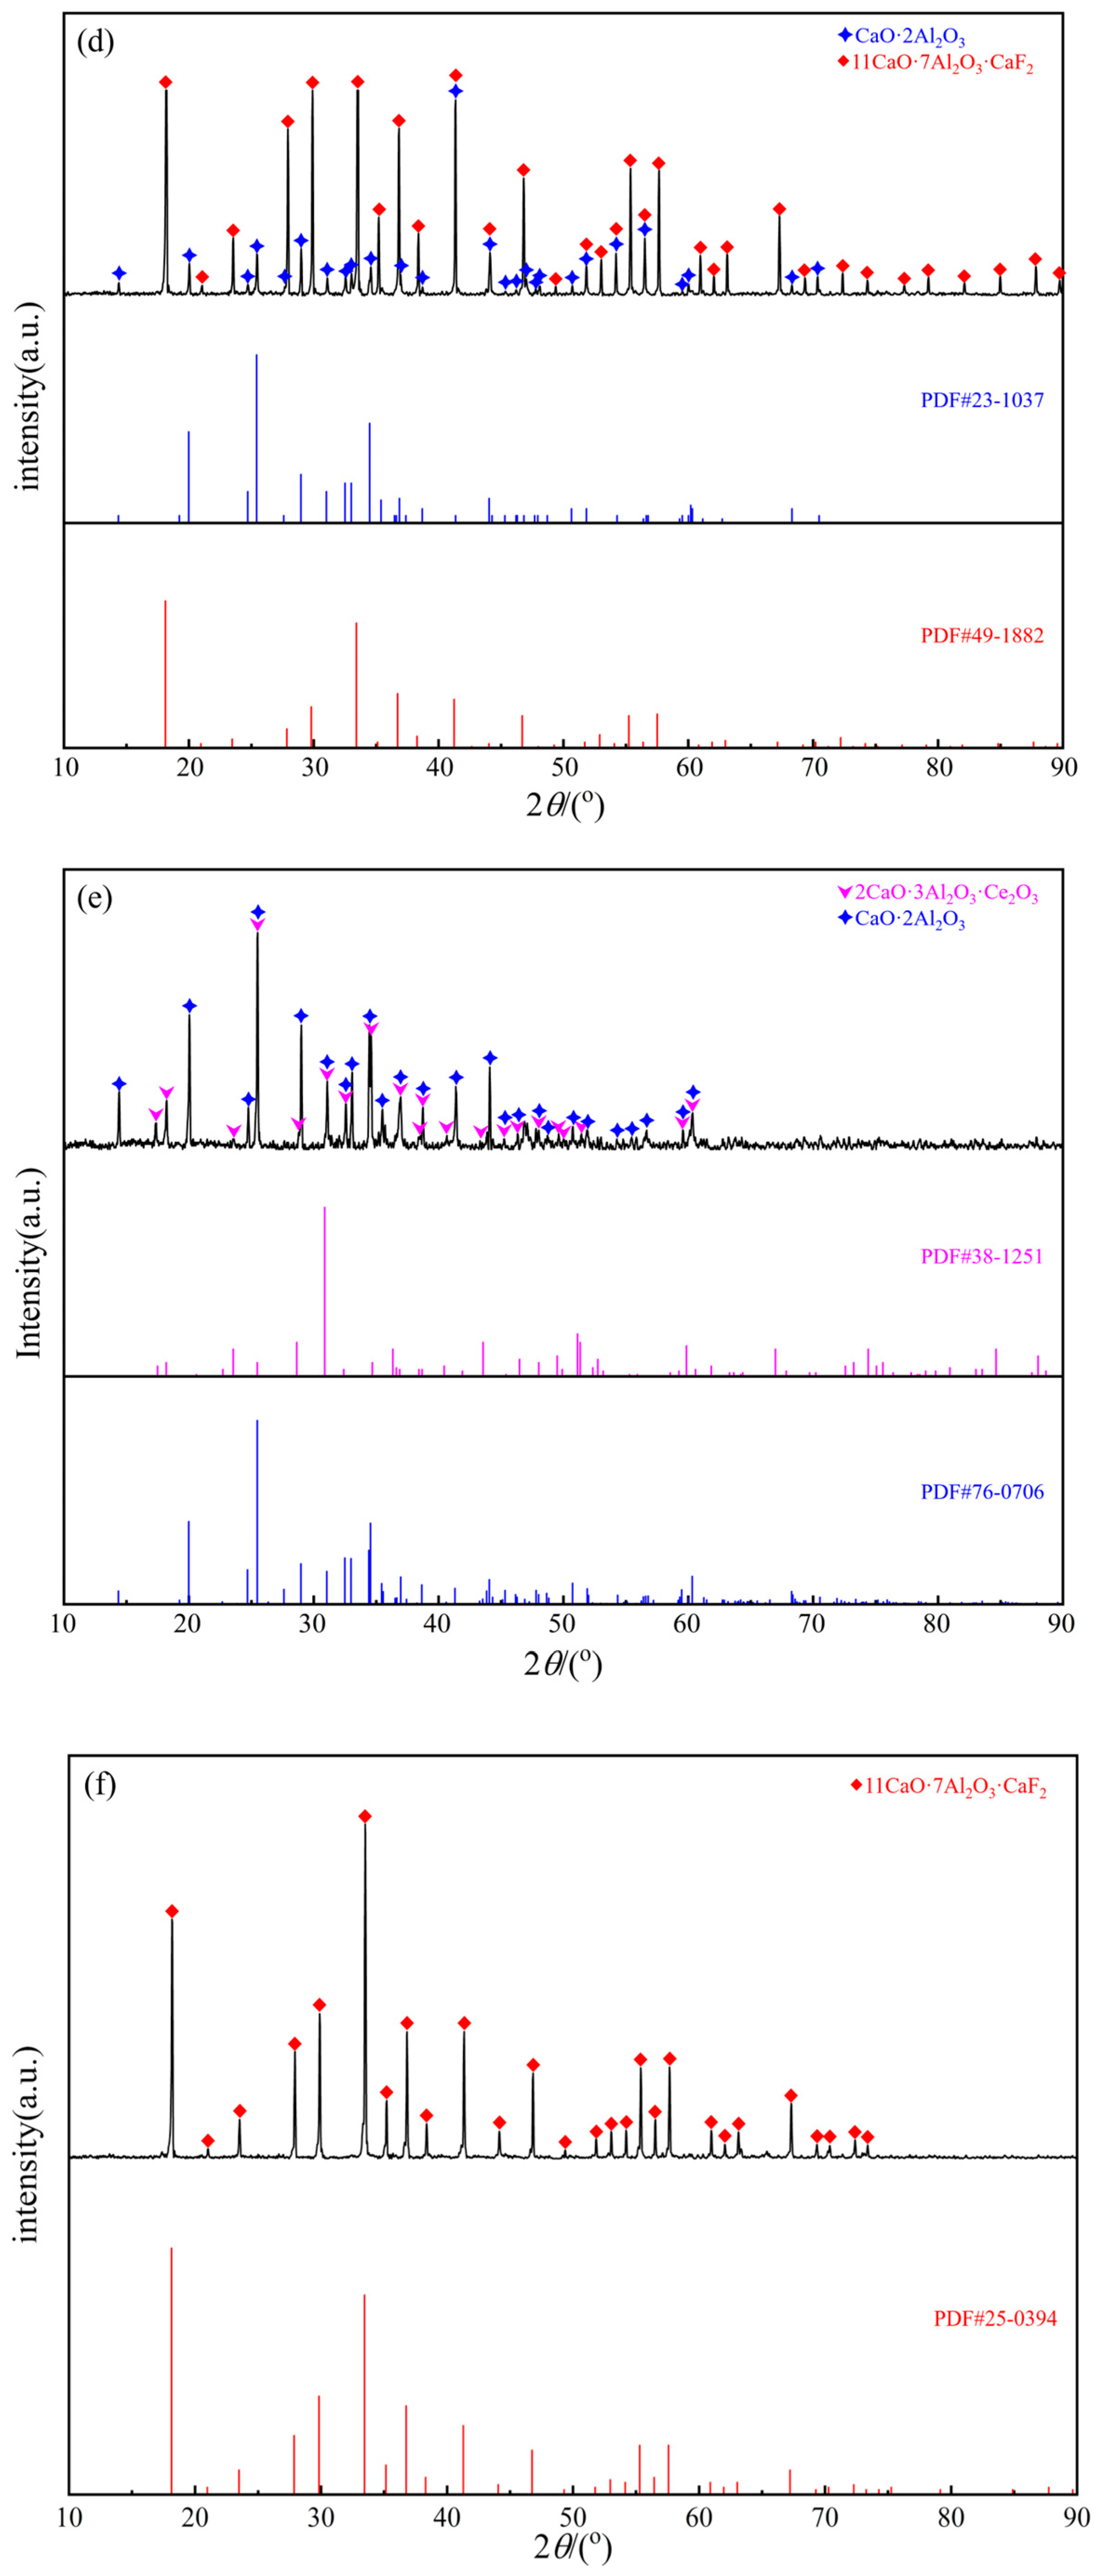
First, X-ray diffraction (XRD) was used to characterize the phase composition of some equilibrium slag samples, with typical XRD patterns shown in Figure 3. By comparing and matching the measured diffraction peaks of each slag sample with the characteristic diffraction peaks of corresponding phases in the standard PDF cards (JCPDS database), the types of precipitated phases in each slag sample at the experimental temperature were finally determined. As can be seen from Figure 5a, the precipitated phases of slag 3 at 1300 °C include CaO, 11CaO·7Al2O3·CaF2, and 2CaO·Al2O3·Ce2O3. It is indicated in Figure 5b,e that slag 7 has the same precipitated phases at 1300 °C and 1400 °C, both being CaO·2Al2O3 and 2CaO·3Al2O3·Ce2O3. From Figure 5c, the precipitated phases of slag 5 at 1400 °C are 11CaO·7Al2O3·CaF2 and 2CaO·Al2O3·Ce2O3. As shown in Figure 5d, the precipitated phases of slag 12 at 1400 °C are 11CaO·7Al2O3·CaF2 and CaO·2Al2O3. It can be known from Figure 5f that only 11CaO·7Al2O3·CaF2 is precipitated in slag 4 at 1500 °C. The 11CaO·7Al2O3·CaF2 mentioned in this study is a well-researched and mature compound in the CaO-Al2O3-CaF2 system. Its crystal structure and physicochemical properties have been fully investigated, and its standard phase information can also be verified by JCPDS cards (e.g., PDF#25-0394) [37].
On this basis, according to the results of high-temperature equilibrium experiments, it was determined that the CaO-Al2O3-Ce2O3-CaF2 system exhibits four, eight, and five types of phase equilibria at 1300 °C, 1400 °C, and 1500 °C, respectively, as presented in Table 3.
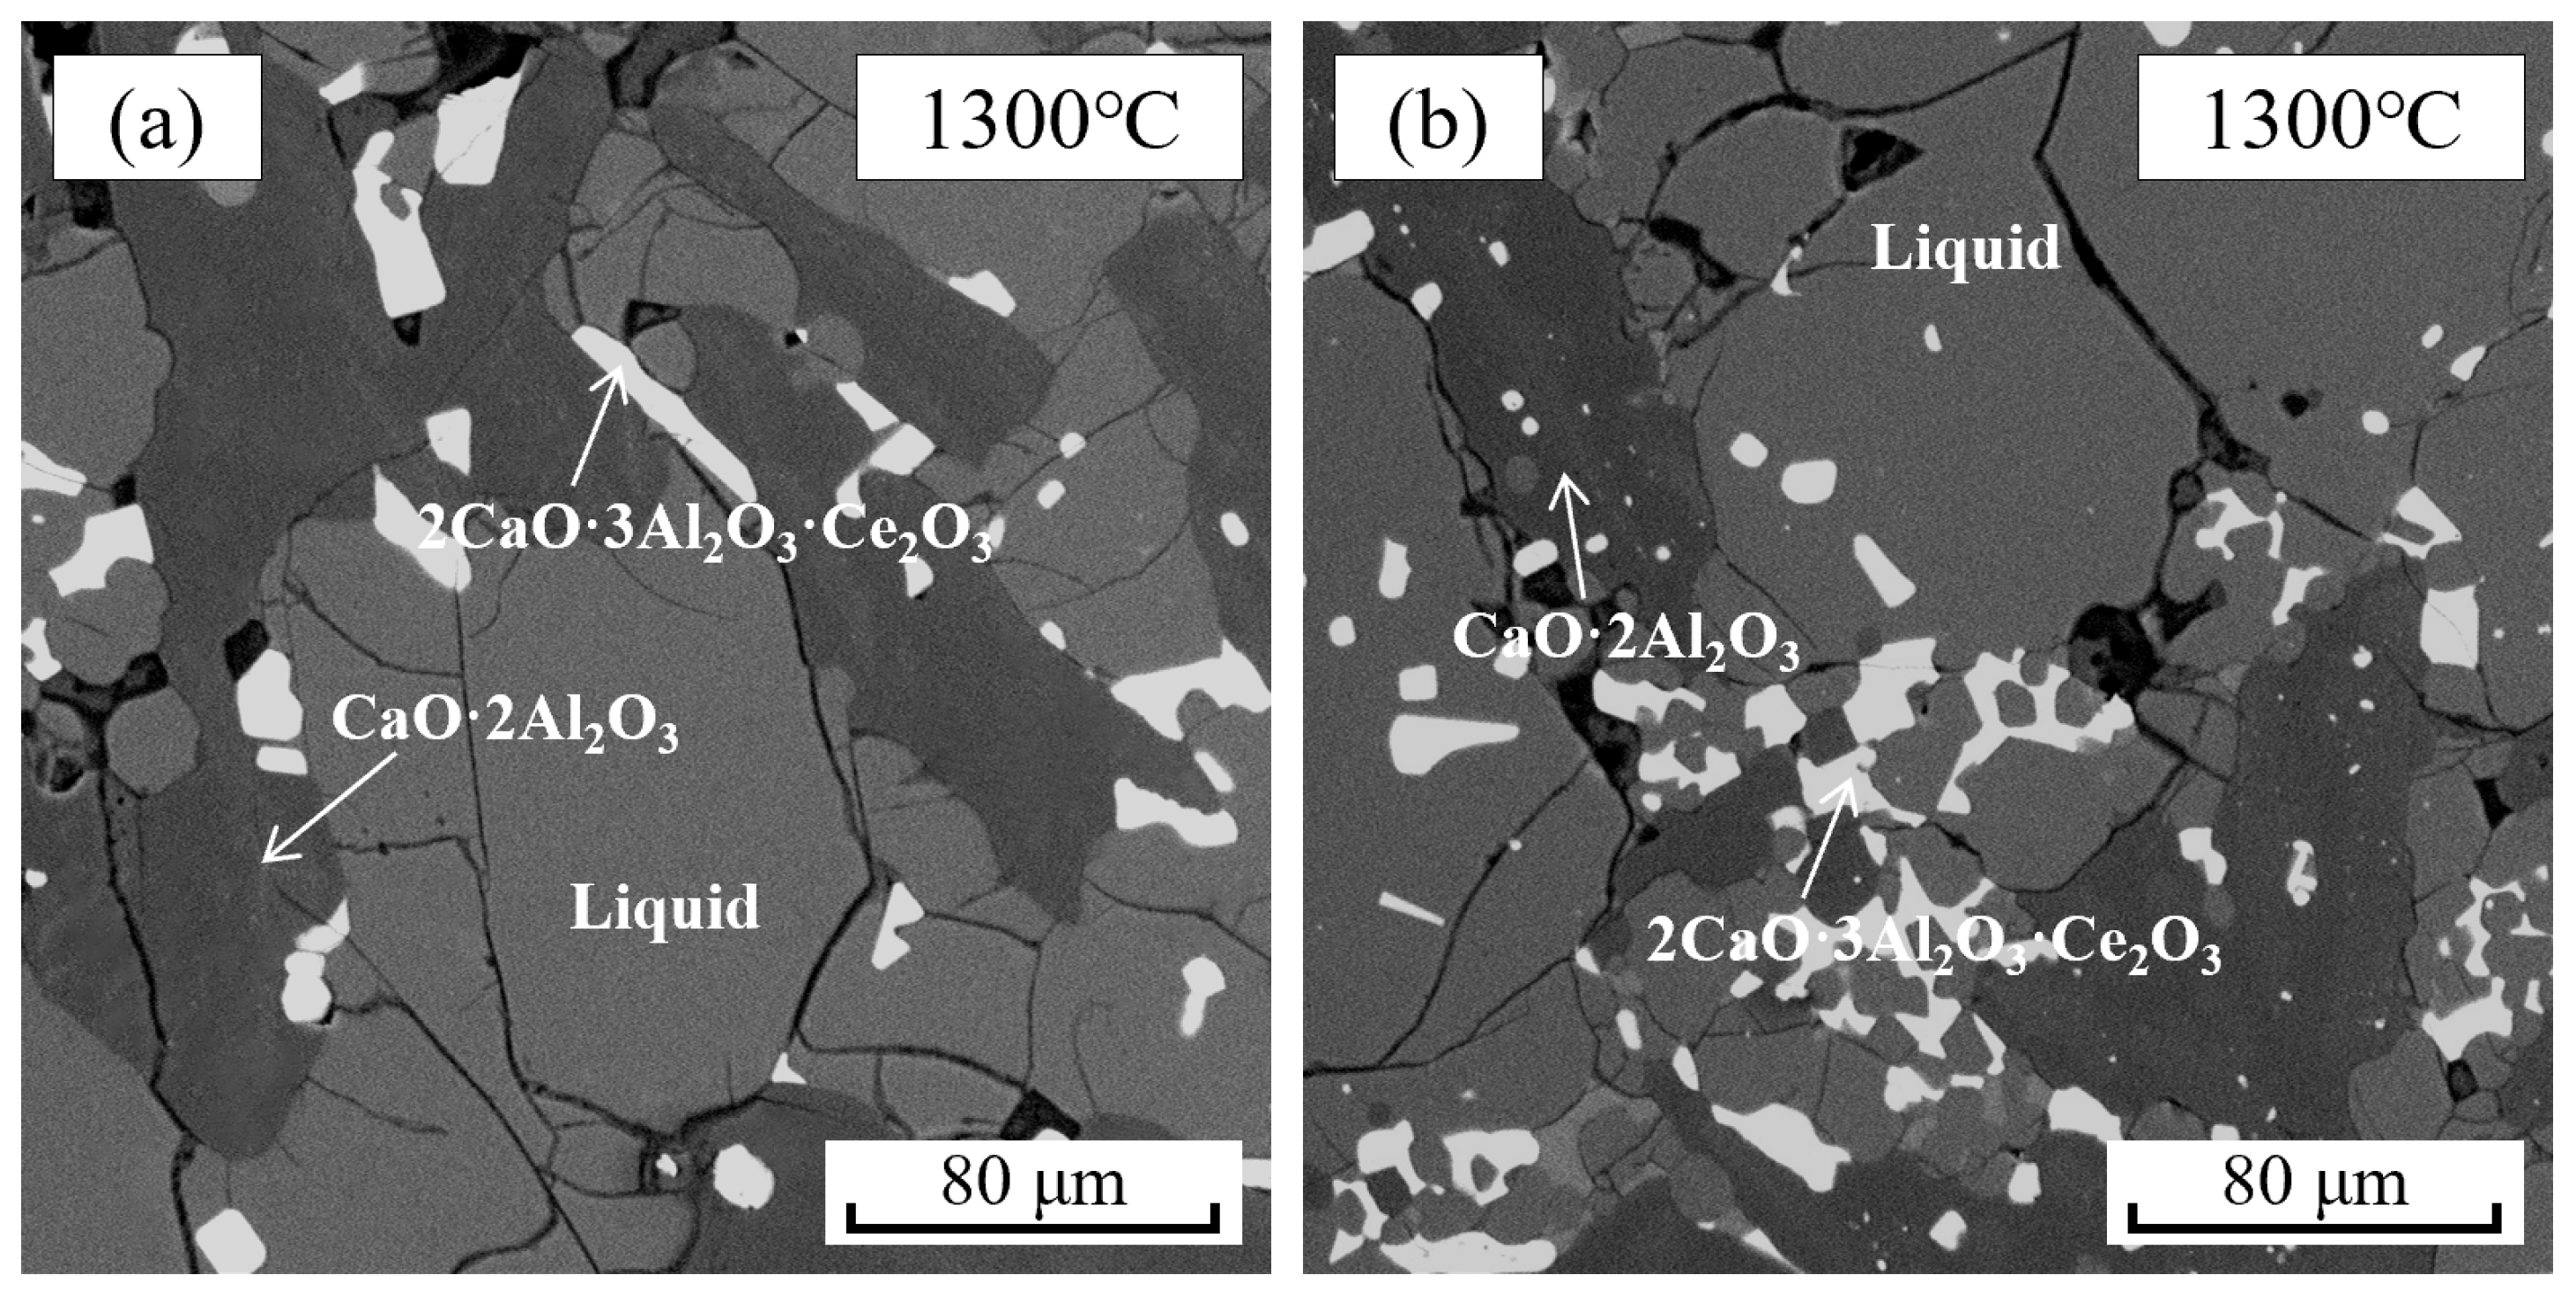
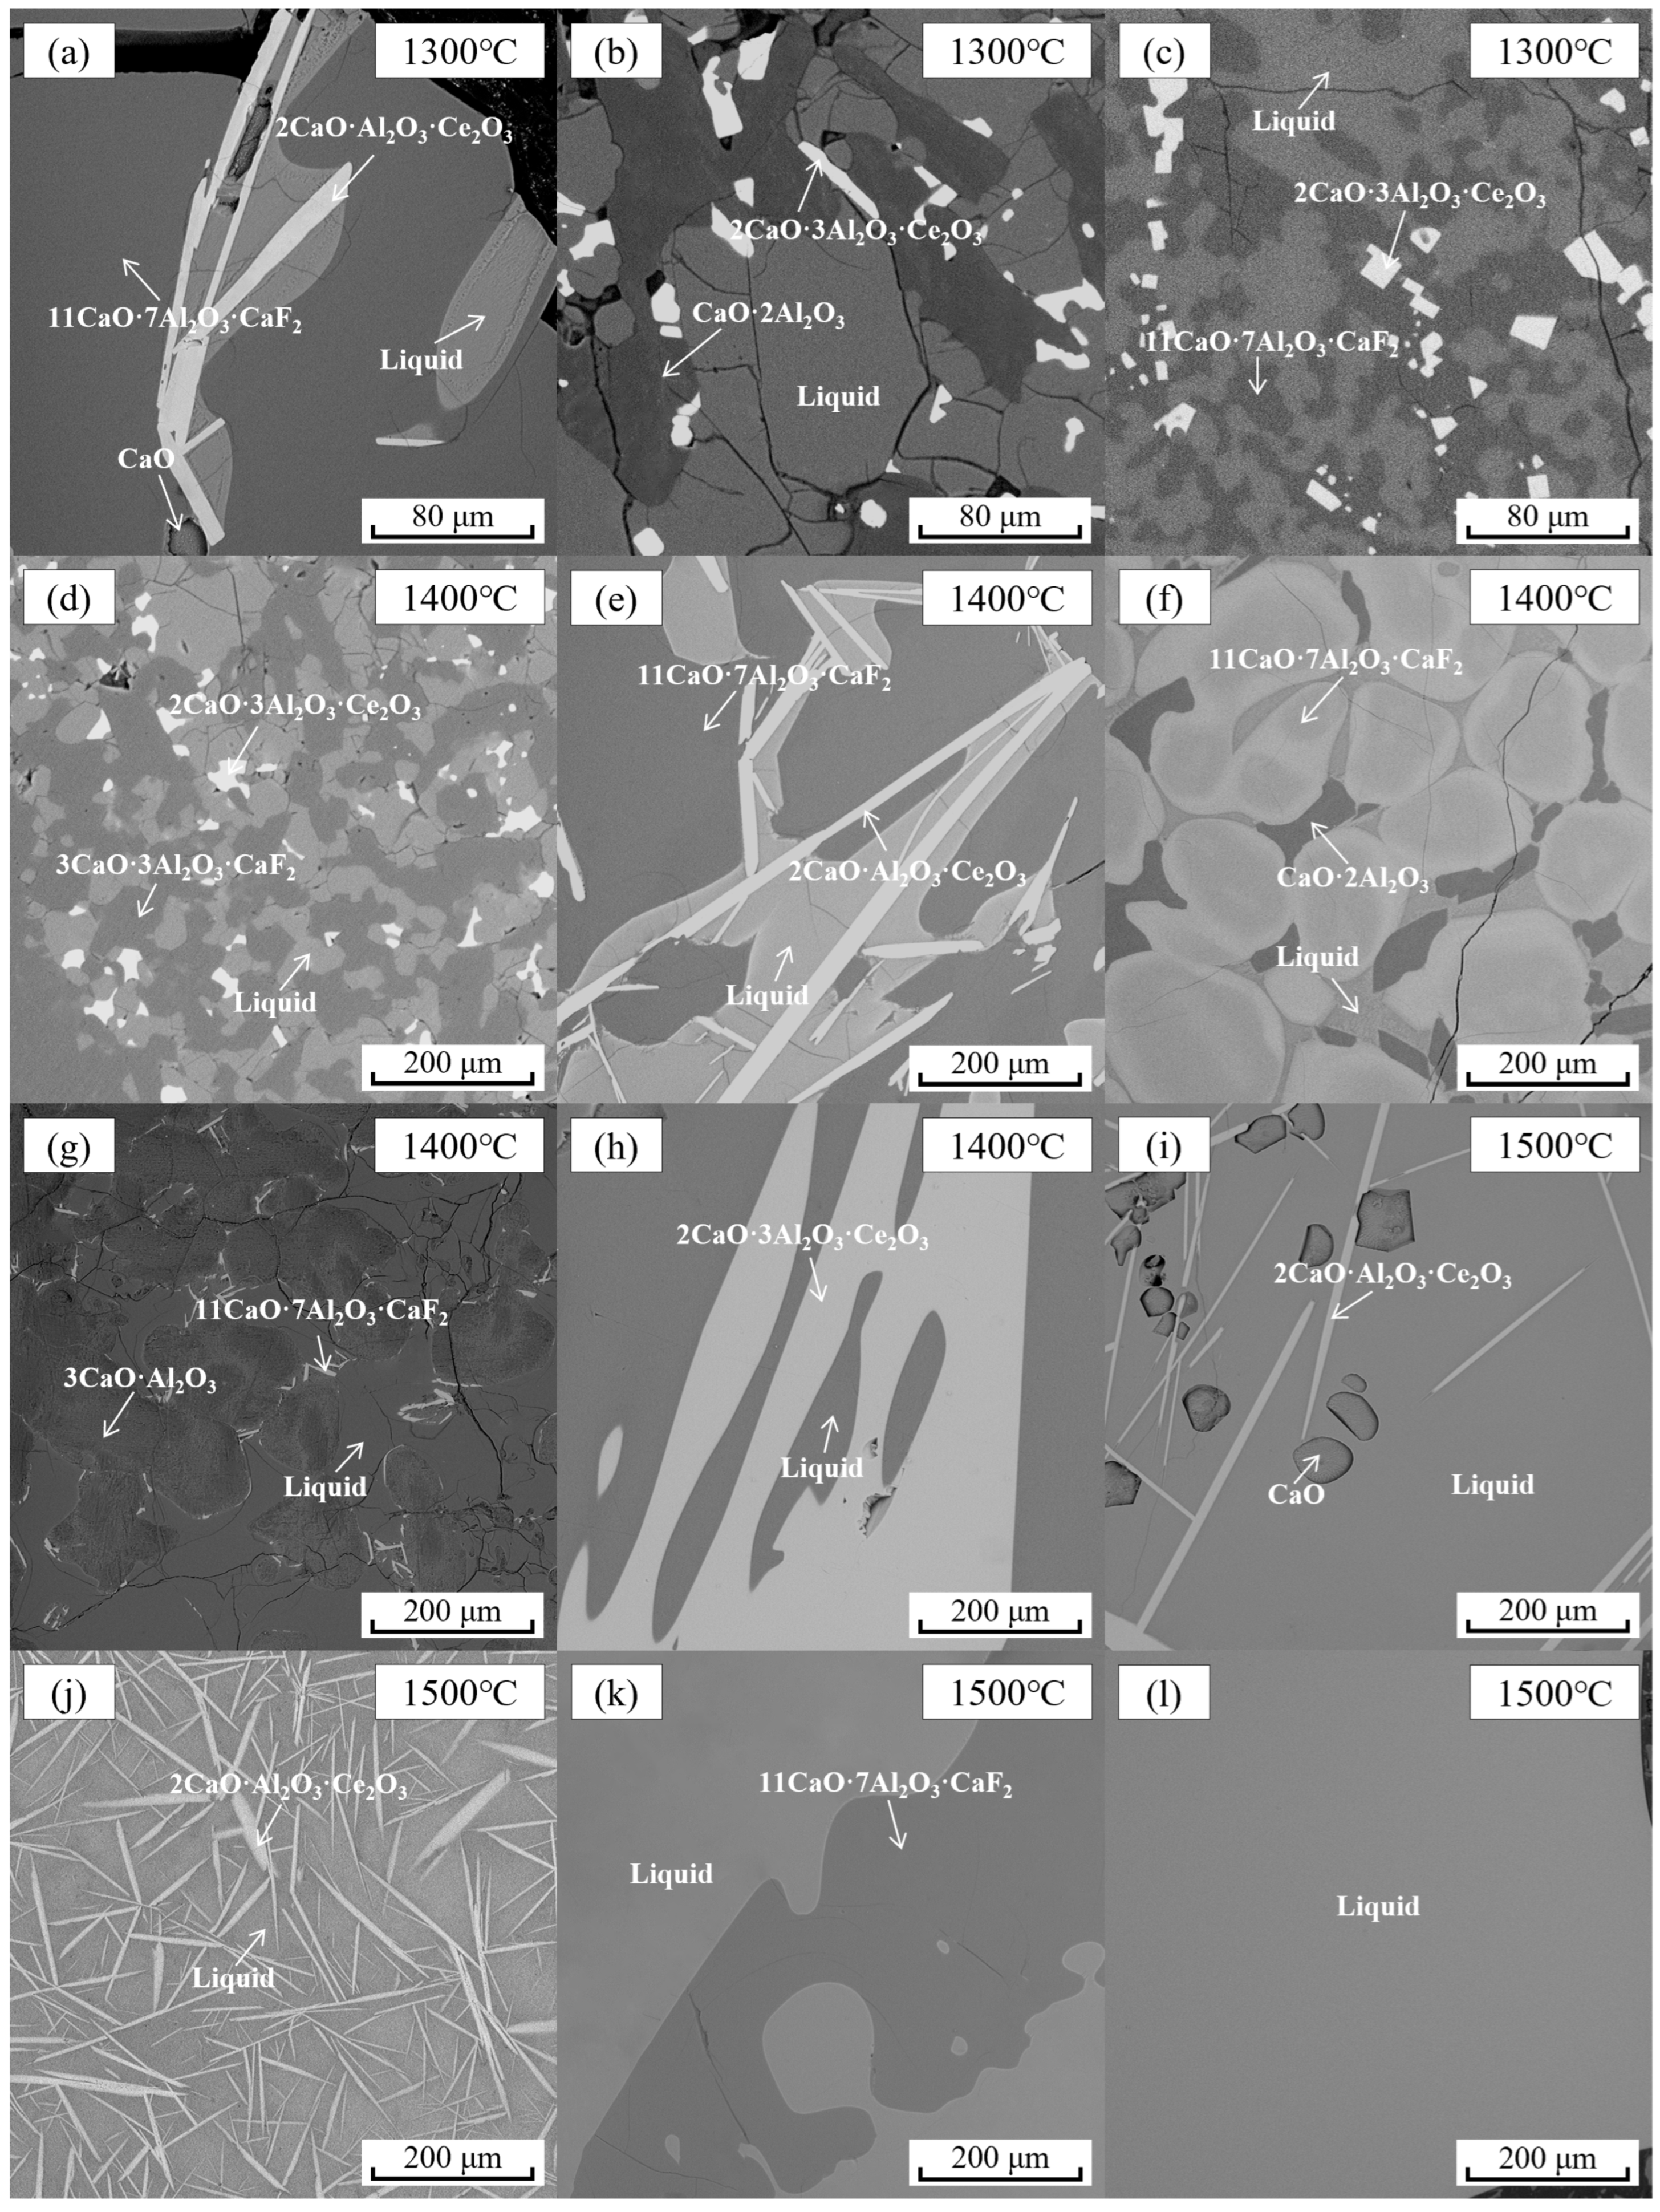
The SEM photos of typical slag samples and the equilibrium phase compositions determined based on the EDX results are shown in Figure 6 and Table 3, respectively. According to the SEM results, the morphological characteristics of each equilibrium phase were as follows: CaO presents a black spherical shape; 2CaO·Al2O3·Ce2O3 is a white strip-shaped phase; 2CaO·3Al2O3·Ce2O3 exhibits an irregular white flake shape; while the dark gray flake-shaped precipitated phases include 11CaO·7Al2O3·CaF2, 3CaO·3Al2O3·CaF2, CaO·2Al2O3 and 3CaO·Al2O3.

4. Drawing of Isothermal Phase Diagram

The construction of a phase diagram relies on the Gibbs phase rule F = CP + n, where F is the degree of freedom, i.e., the number of independent state variables that can be freely changed by us without changing the given phase equilibrium, i.e., the number, the identities and the equilibrium ratios of coexisting phases (F is between 0 and three in our case), C is the number of components (four in our case, which are CaO, Al2O3, Ce2O3 and CaF2, as these components are chemically independent of each other), P is the number of coexisting phases (between one and four in our case) and n is the number of non-compositional state variables (0 in our case, as both pressure and temperature have fixed values) [38]. For the quaternary CaO-Al2O3-Ce2O3-CaF2 slag system under isothermal and isobaric conditions, the phase rule can be simplified to F = 4 − P.
When the system is in four-phase coexistence, P = 4, F = 0: means a single point in a four-component phase diagram, i.e., the average compositions of all the four components in the system must have their fixed values dictated by the laws of nature, and we have no freedom to change any of the average compositions, if we want to keep the same four-phase equilibrium. When in three-phase coexistence, P = 3, F = 1: it means that only the average composition of one the components (selected arbitrarily) in the system can be changed freely, and the average compositions of other two components (selected freely) must be adjusted according to the laws of nature if we want to stay in the same three-phase equilibrium (the average composition of the last component follows from the materials balance = 100% − sum of the other three). When in two-phase coexistence, P = 2, F = 2: it means that only the average compositions of two components (selected arbitrarily) in the system can be changed freely and the average compositions of another 1 component must be adjusted according to the laws of nature if we want to stay in the same two-phase equilibrium (the average composition of the last component follows from the materials balance = 100% − sum of the other three). When in the single-phase state, P = 1, F = 3: it means that the average compositions of three components (selected arbitrarily) in the system can be changed freely and the average compositions of the last component follows from the materials balance = 100% − sum of the other three; thus, we are absolutely free to select the average composition (in a limited region) to stay in the same one-phase equilibrium.
Therefore, based on the equilibrium liquid phase compositions obtained from the EDX analysis results of equilibrium slag samples at 1300 °C, 1400 °C, and 1500 °C (see Table 4), combined with the principles of the phase rule, the isothermal phase diagrams of the CaO-Al2O3-Ce2O3-CaF2 slag system at the aforementioned temperatures were finally constructed.
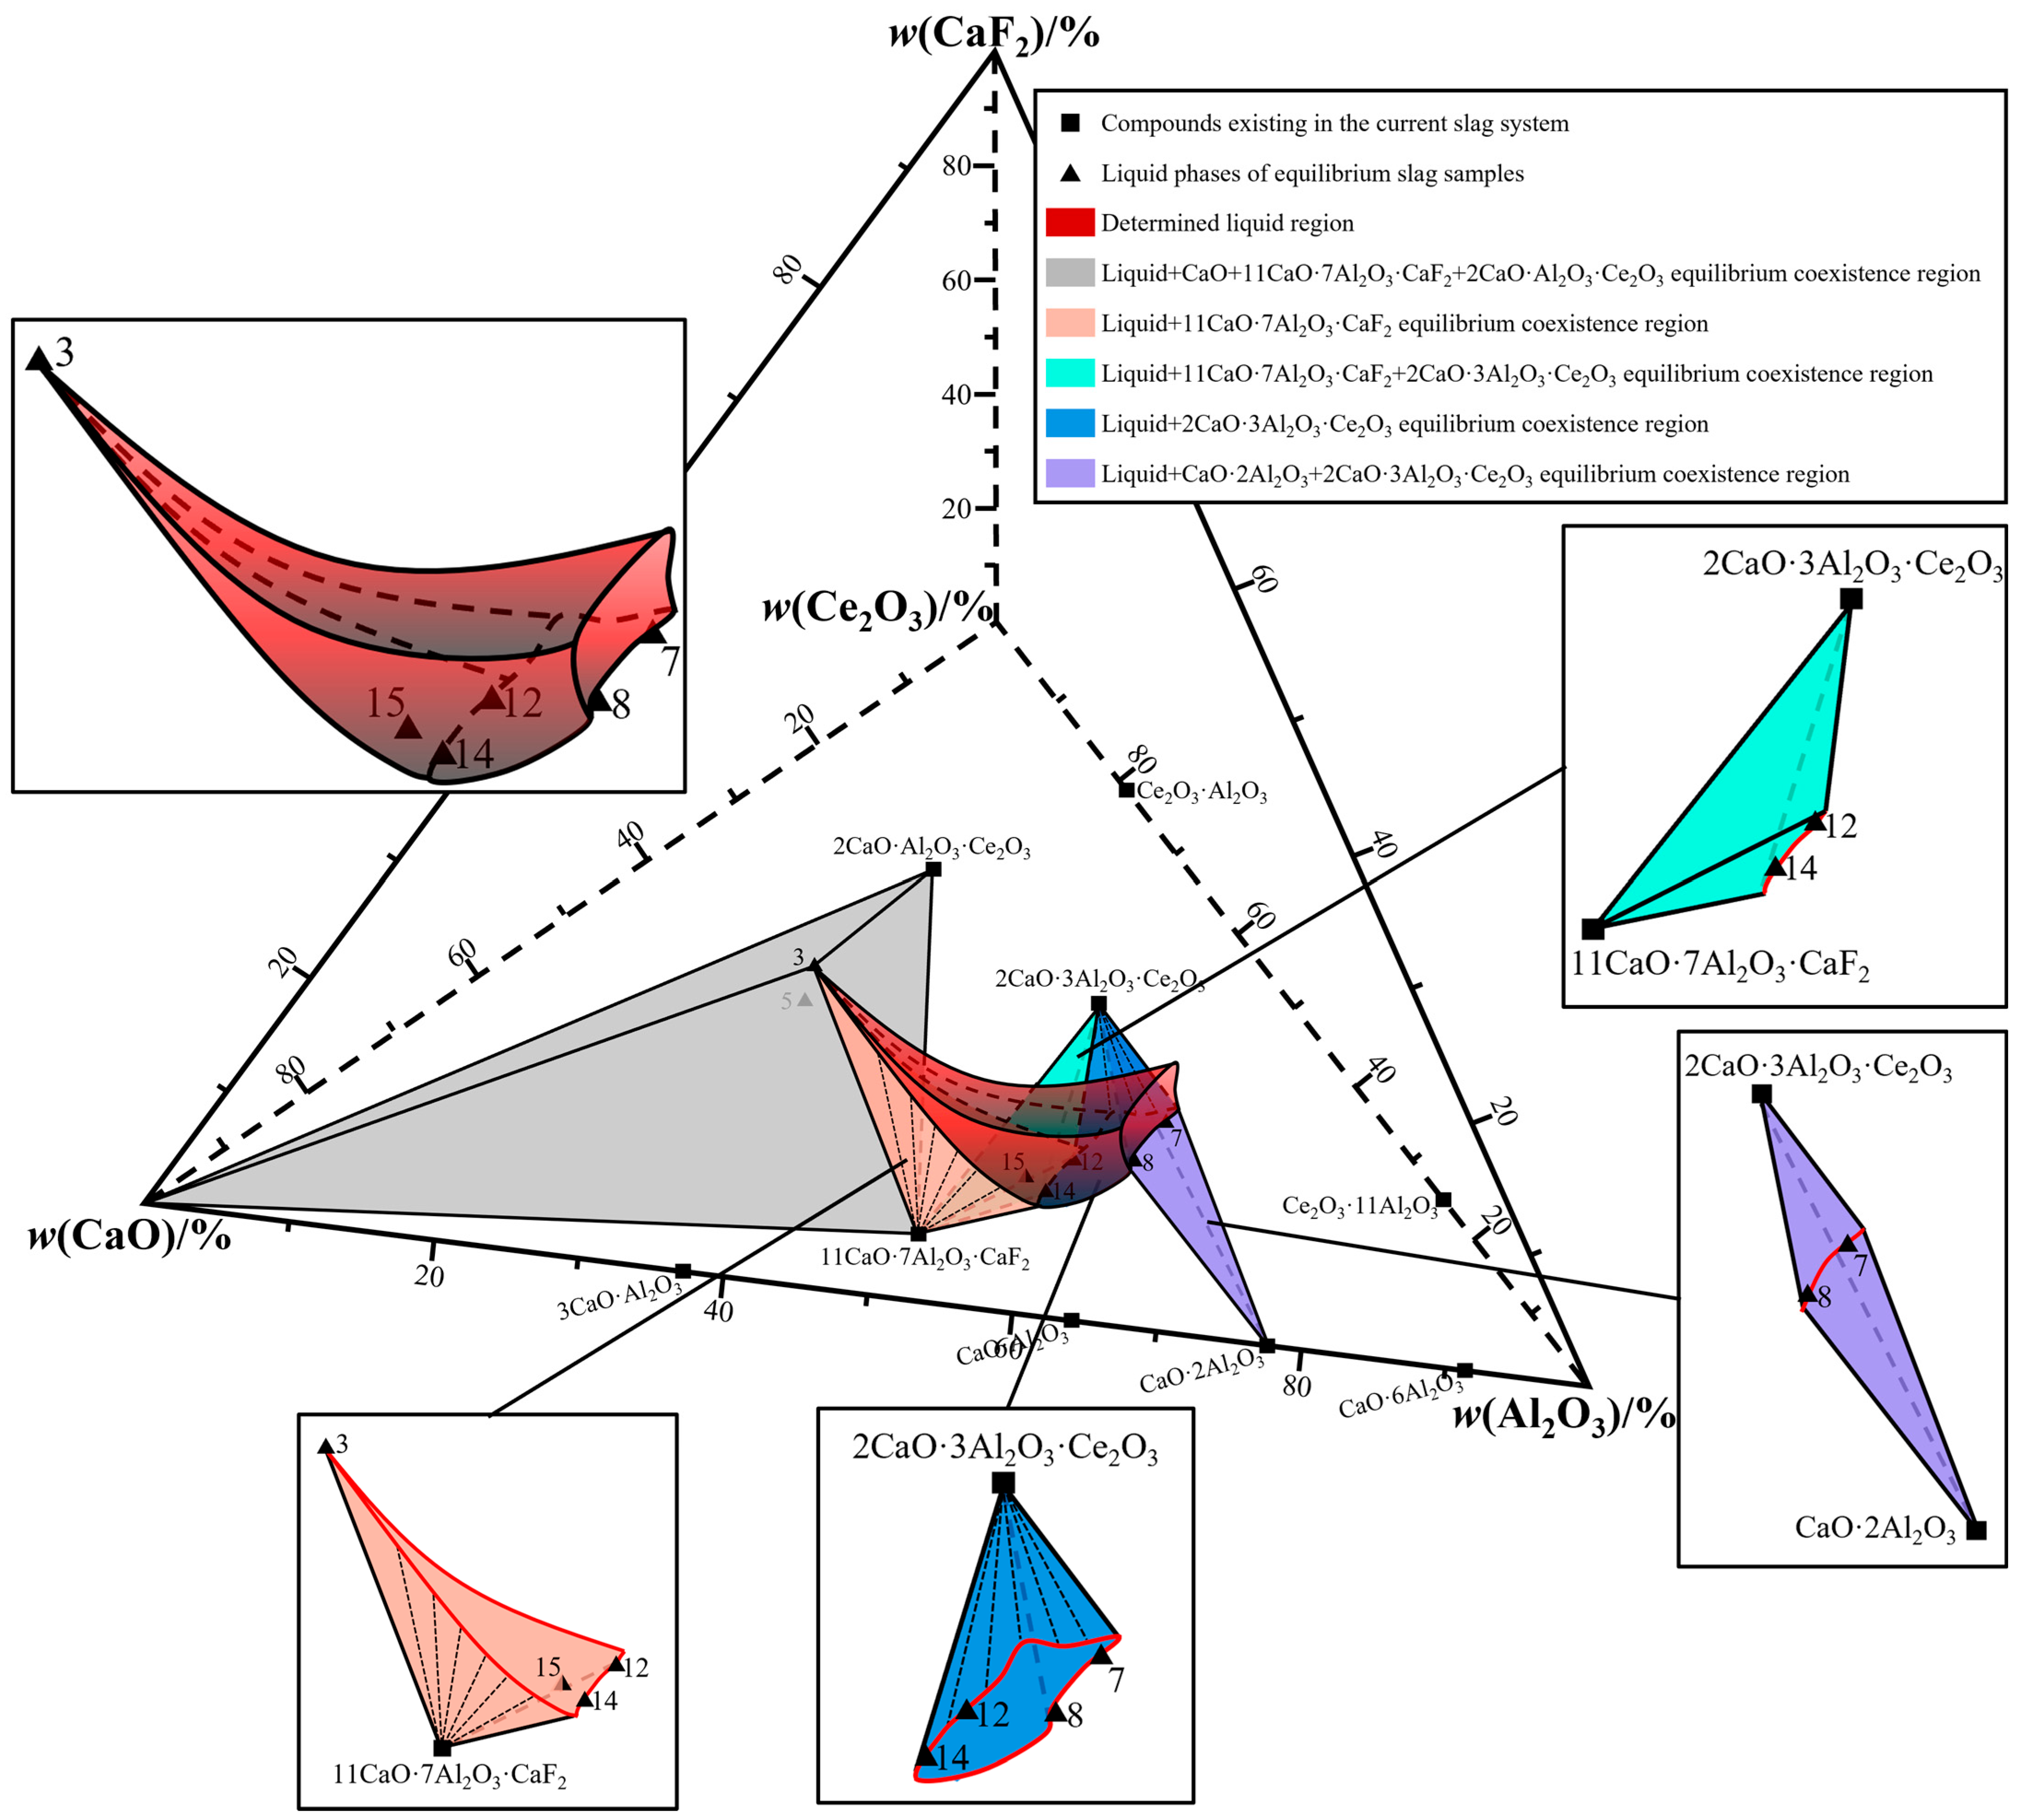
Based on the phase equilibrium relationships of each slag sample at 1300 °C, the isothermal phase diagram of the CaO-Al2O3-Ce2O3-CaF2 slag system at 1300 °C was constructed, as shown in Figure 7.
The phase equilibrium relationship of Slag 12 and 14 at 1300 °C is Liquid + 11CaO·7Al2O3·CaF2 + 2CaO·3Al2O3·Ce2O3. Therefore, their equilibrium liquid phase compositions lie not only on the liquidus line of the three-phase coexistence region (Liquid + 11CaO·7Al2O3·CaF2 + 2CaO·3Al2O3·Ce2O3) but also on the liquidus surface (boundary) of the two-phase coexistence regions (Liquid + 11CaO·7Al2O3·CaF2 and Liquid + 2CaO·3Al2O3·Ce2O3). Similarly, the equilibrium liquid phase compositions of Slag 3 (Liquid + CaO + 11CaO·7Al2O3·CaF2 + 2CaO·Al2O3·Ce2O3) and Slag 15 (Liquid + 11CaO·7Al2O3·CaF2) are also located on the liquidus surface of the two-phase coexistence region (Liquid + 11CaO·7Al2O3·CaF2). The phase equilibrium relationship of Slag 7 and 8 at 1300 °C is Liquid + CaO·2Al2O3 + 2CaO·3Al2O3·Ce2O3, so their equilibrium liquid phase compositions are located not only on the liquidus surface of the Liquid + 2CaO·3Al2O3·Ce2O3 two-phase coexistence region but also on the liquidus line of the Liquid + CaO·2Al2O3 + 2CaO·3Al2O3·Ce2O3 three-phase coexistence region. In summary, the liquidus surface of the Liquid + 11CaO·7Al2O3·CaF2 two-phase coexistence region can be determined based on the equilibrium liquid phase compositions of Slag 3, 12, 14, and 15, while that of the Liquid + 2CaO·3Al2O3·Ce2O3 two-phase coexistence region can be confirmed using the equilibrium liquid phase compositions of Slag 7, 8, 12, and 14.
It contains a single liquid phase region, two two-phase regions (i.e., Liquid + 2CaO·3Al2O3·Ce2O3, Liquid + 11CaO·7Al2O3·CaF2), two three-phase regions (i.e., Liquid + CaO·2Al2O3 + 2CaO·3Al2O3·Ce2O3, Liquid + 11CaO·7Al2O3·CaF2 + 2CaO·3Al2O3·Ce2O3), and one four-phase region (i.e., Liquid + CaO + 11CaO·7Al2O3·CaF2 + 2CaO·Al2O3·Ce2O3).
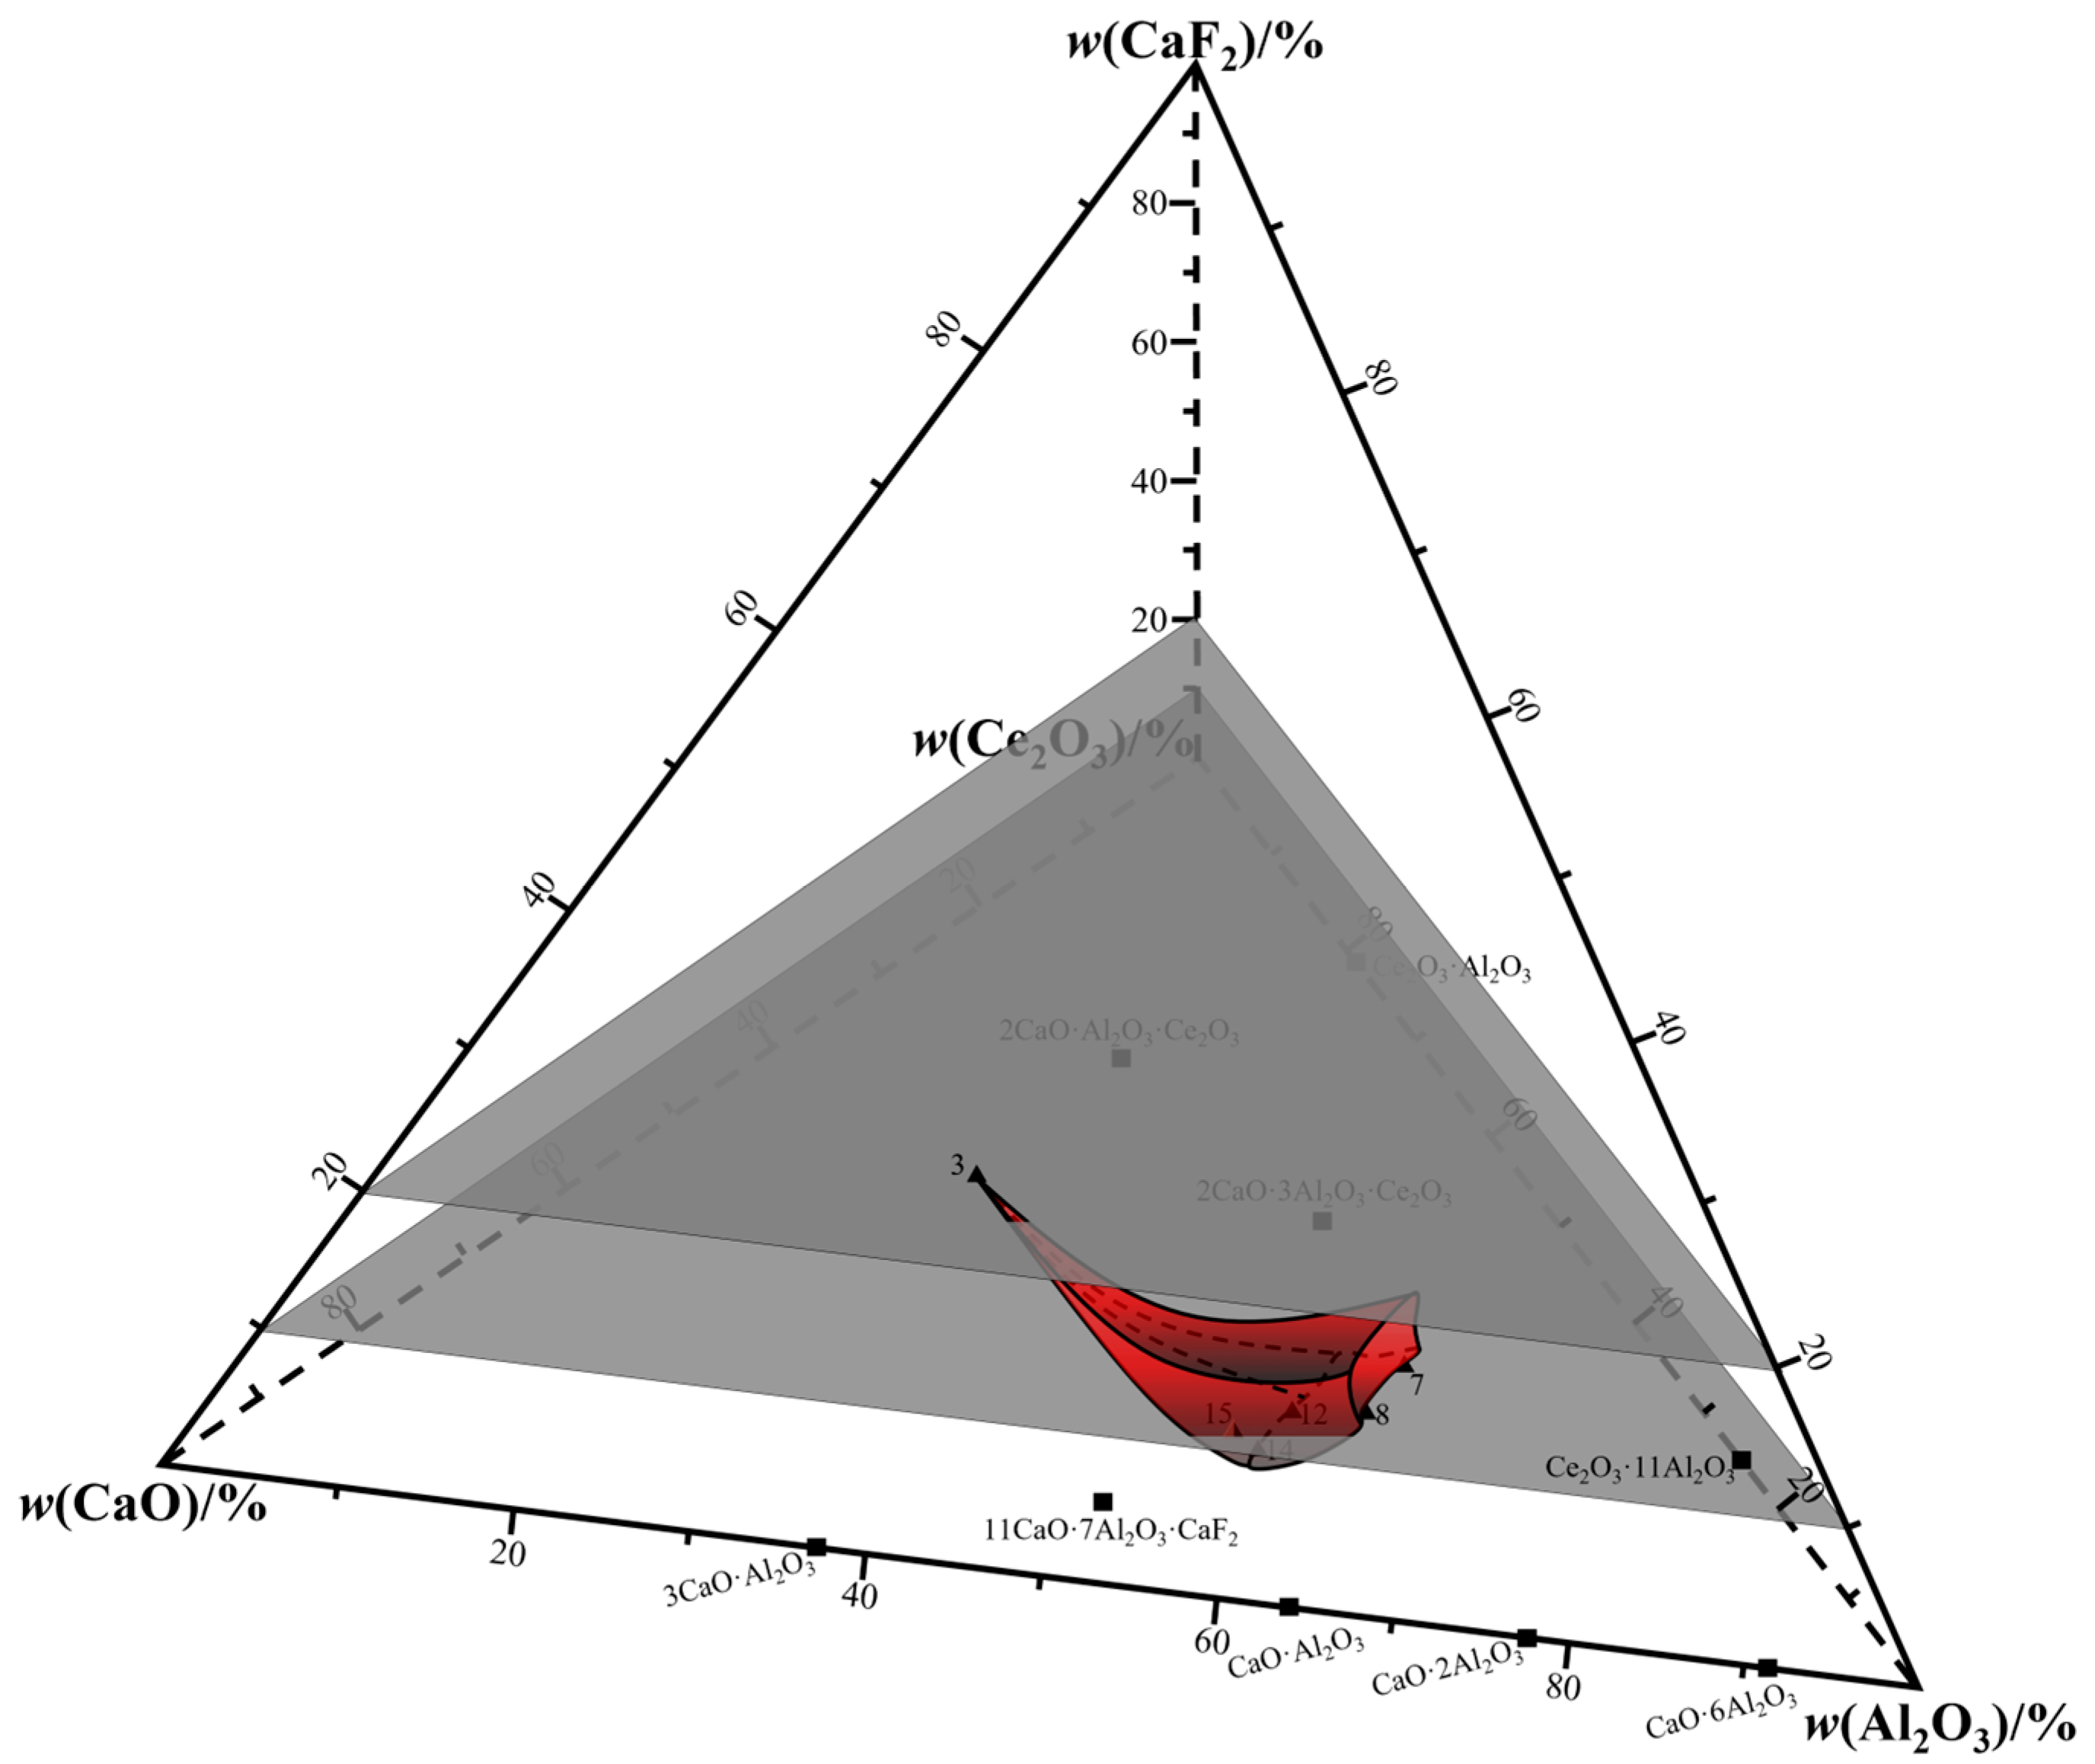
The range of the liquid phase region for the CaO-Al2O3-Ce2O3-CaF2 slag system at 1300 °C can be derived from the equilibrium liquid phase compositions of slag 3, 7, and 8: w(CaO)/w(Al2O3) = 0.42~0.92, w(Ce2O3) = 1.63%~8.02% and w(CaF2) = 9.17%~21.46%.
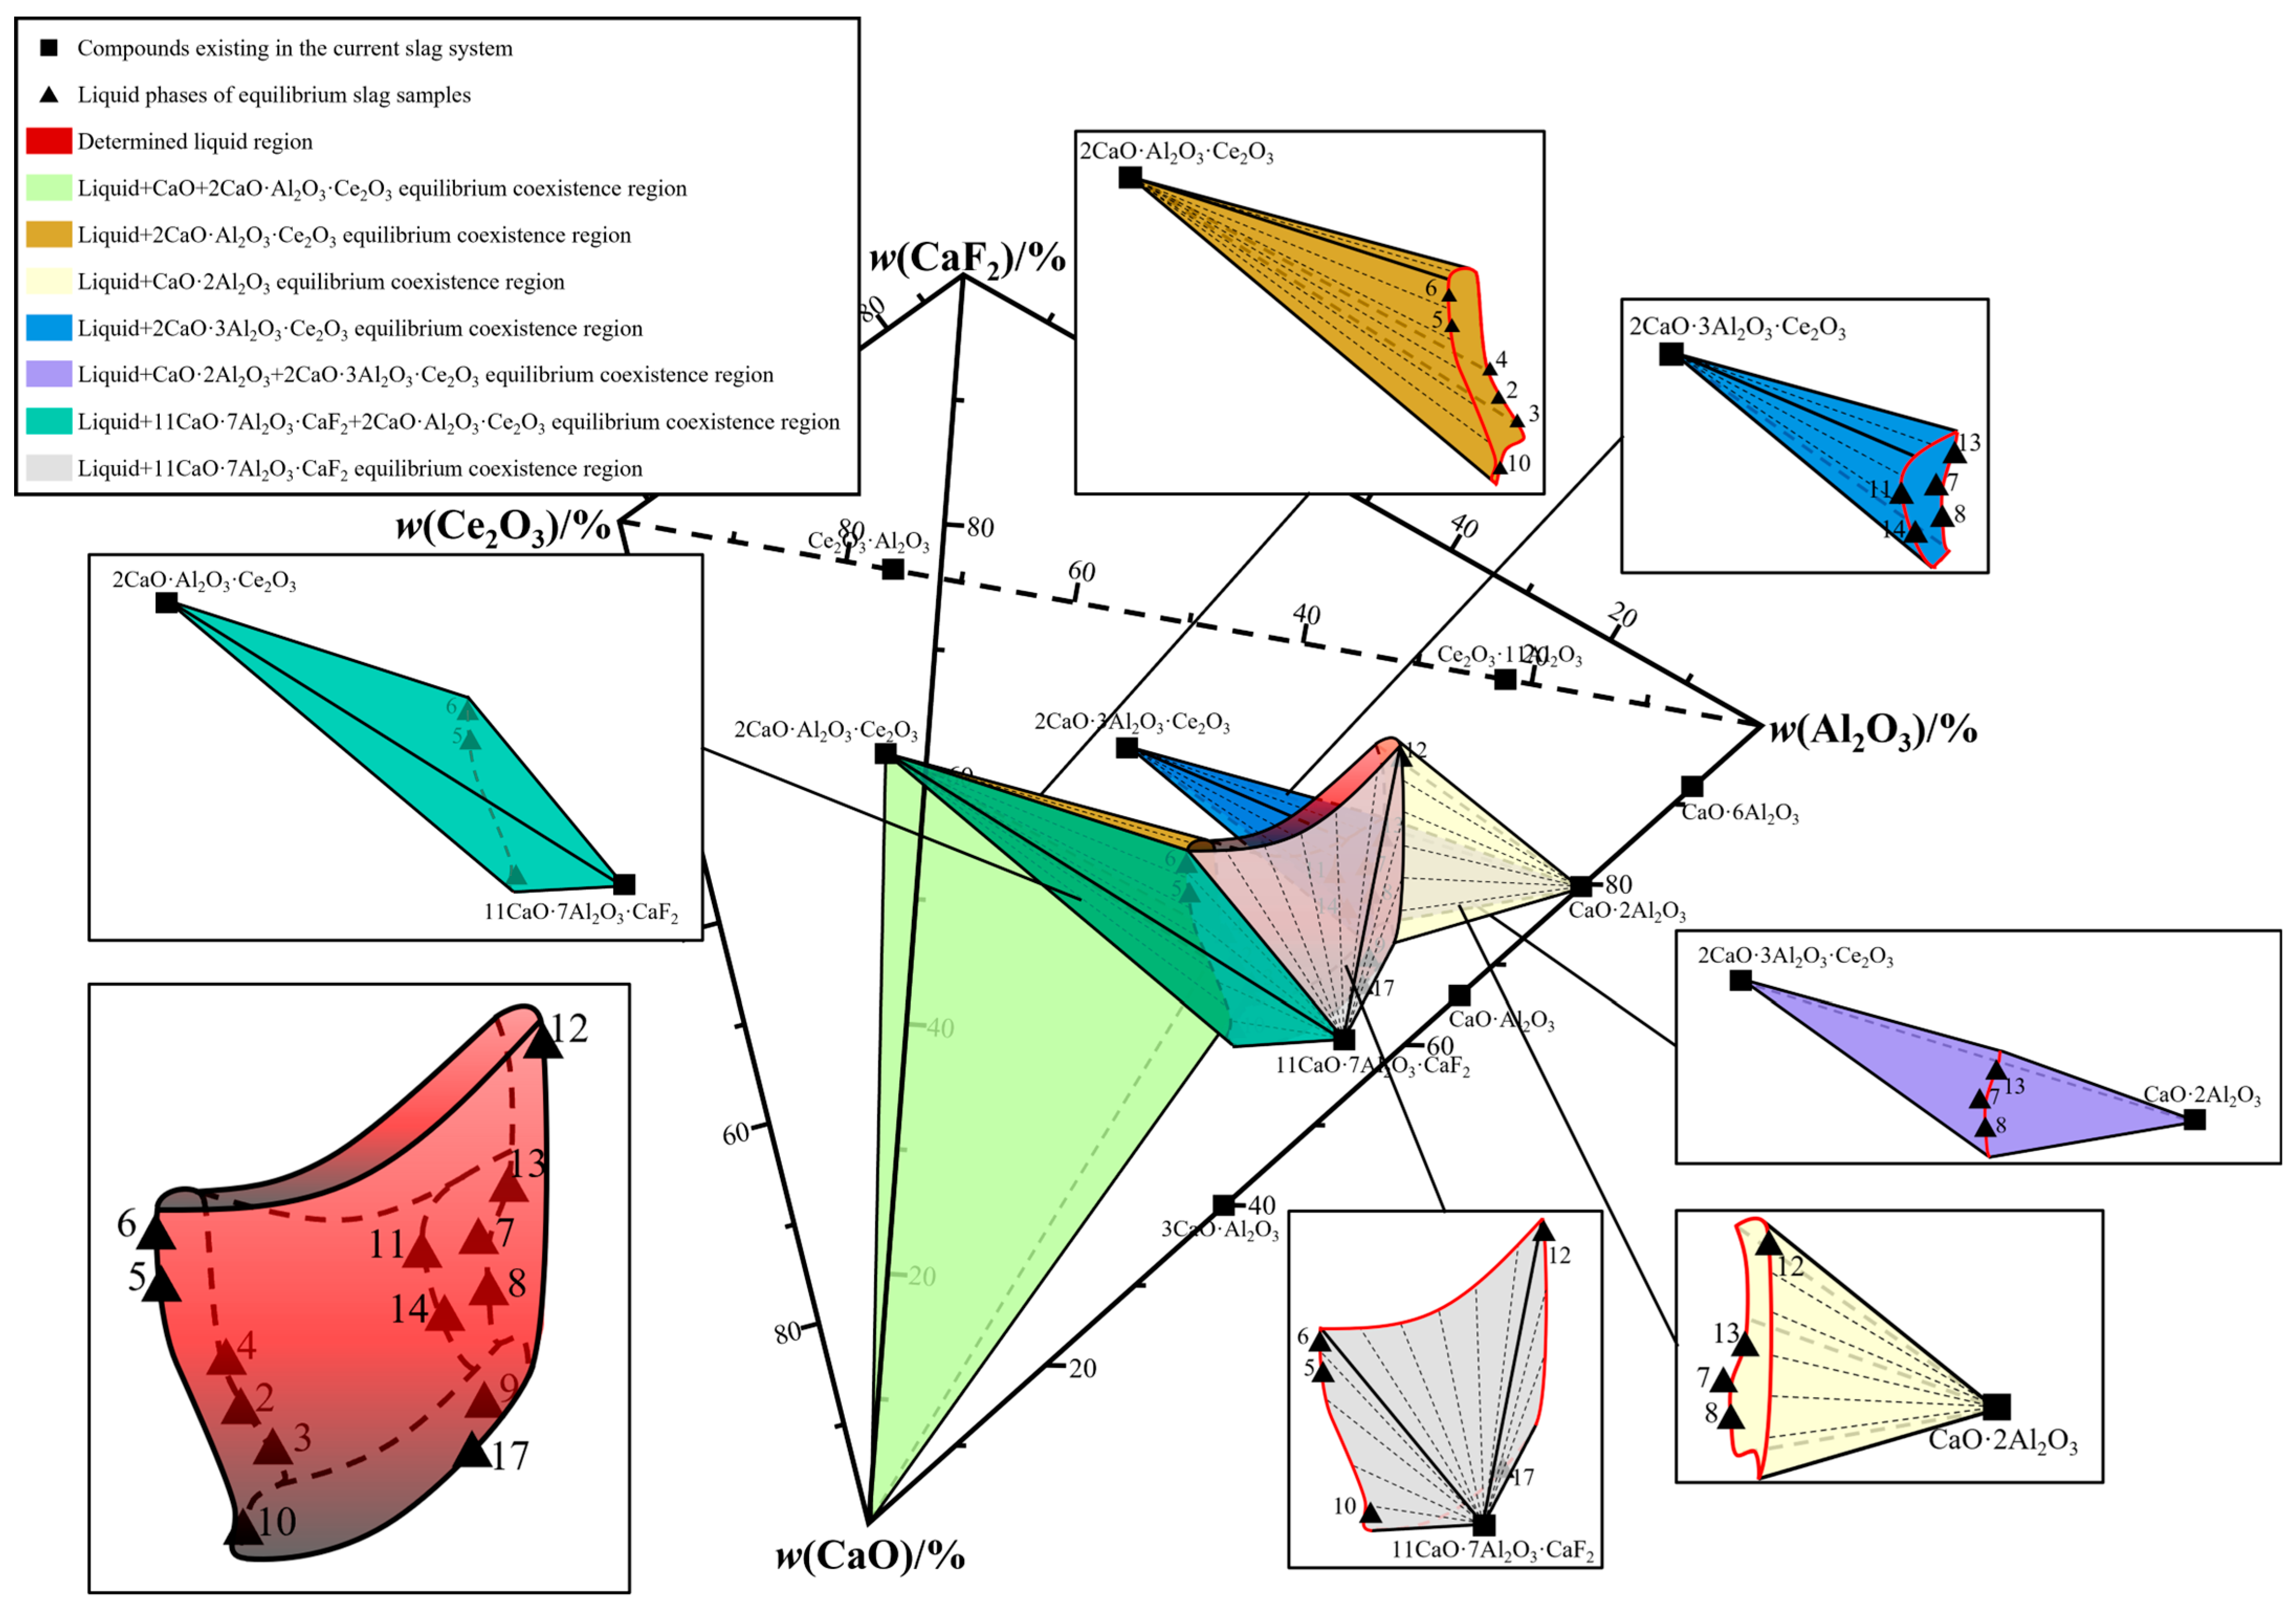
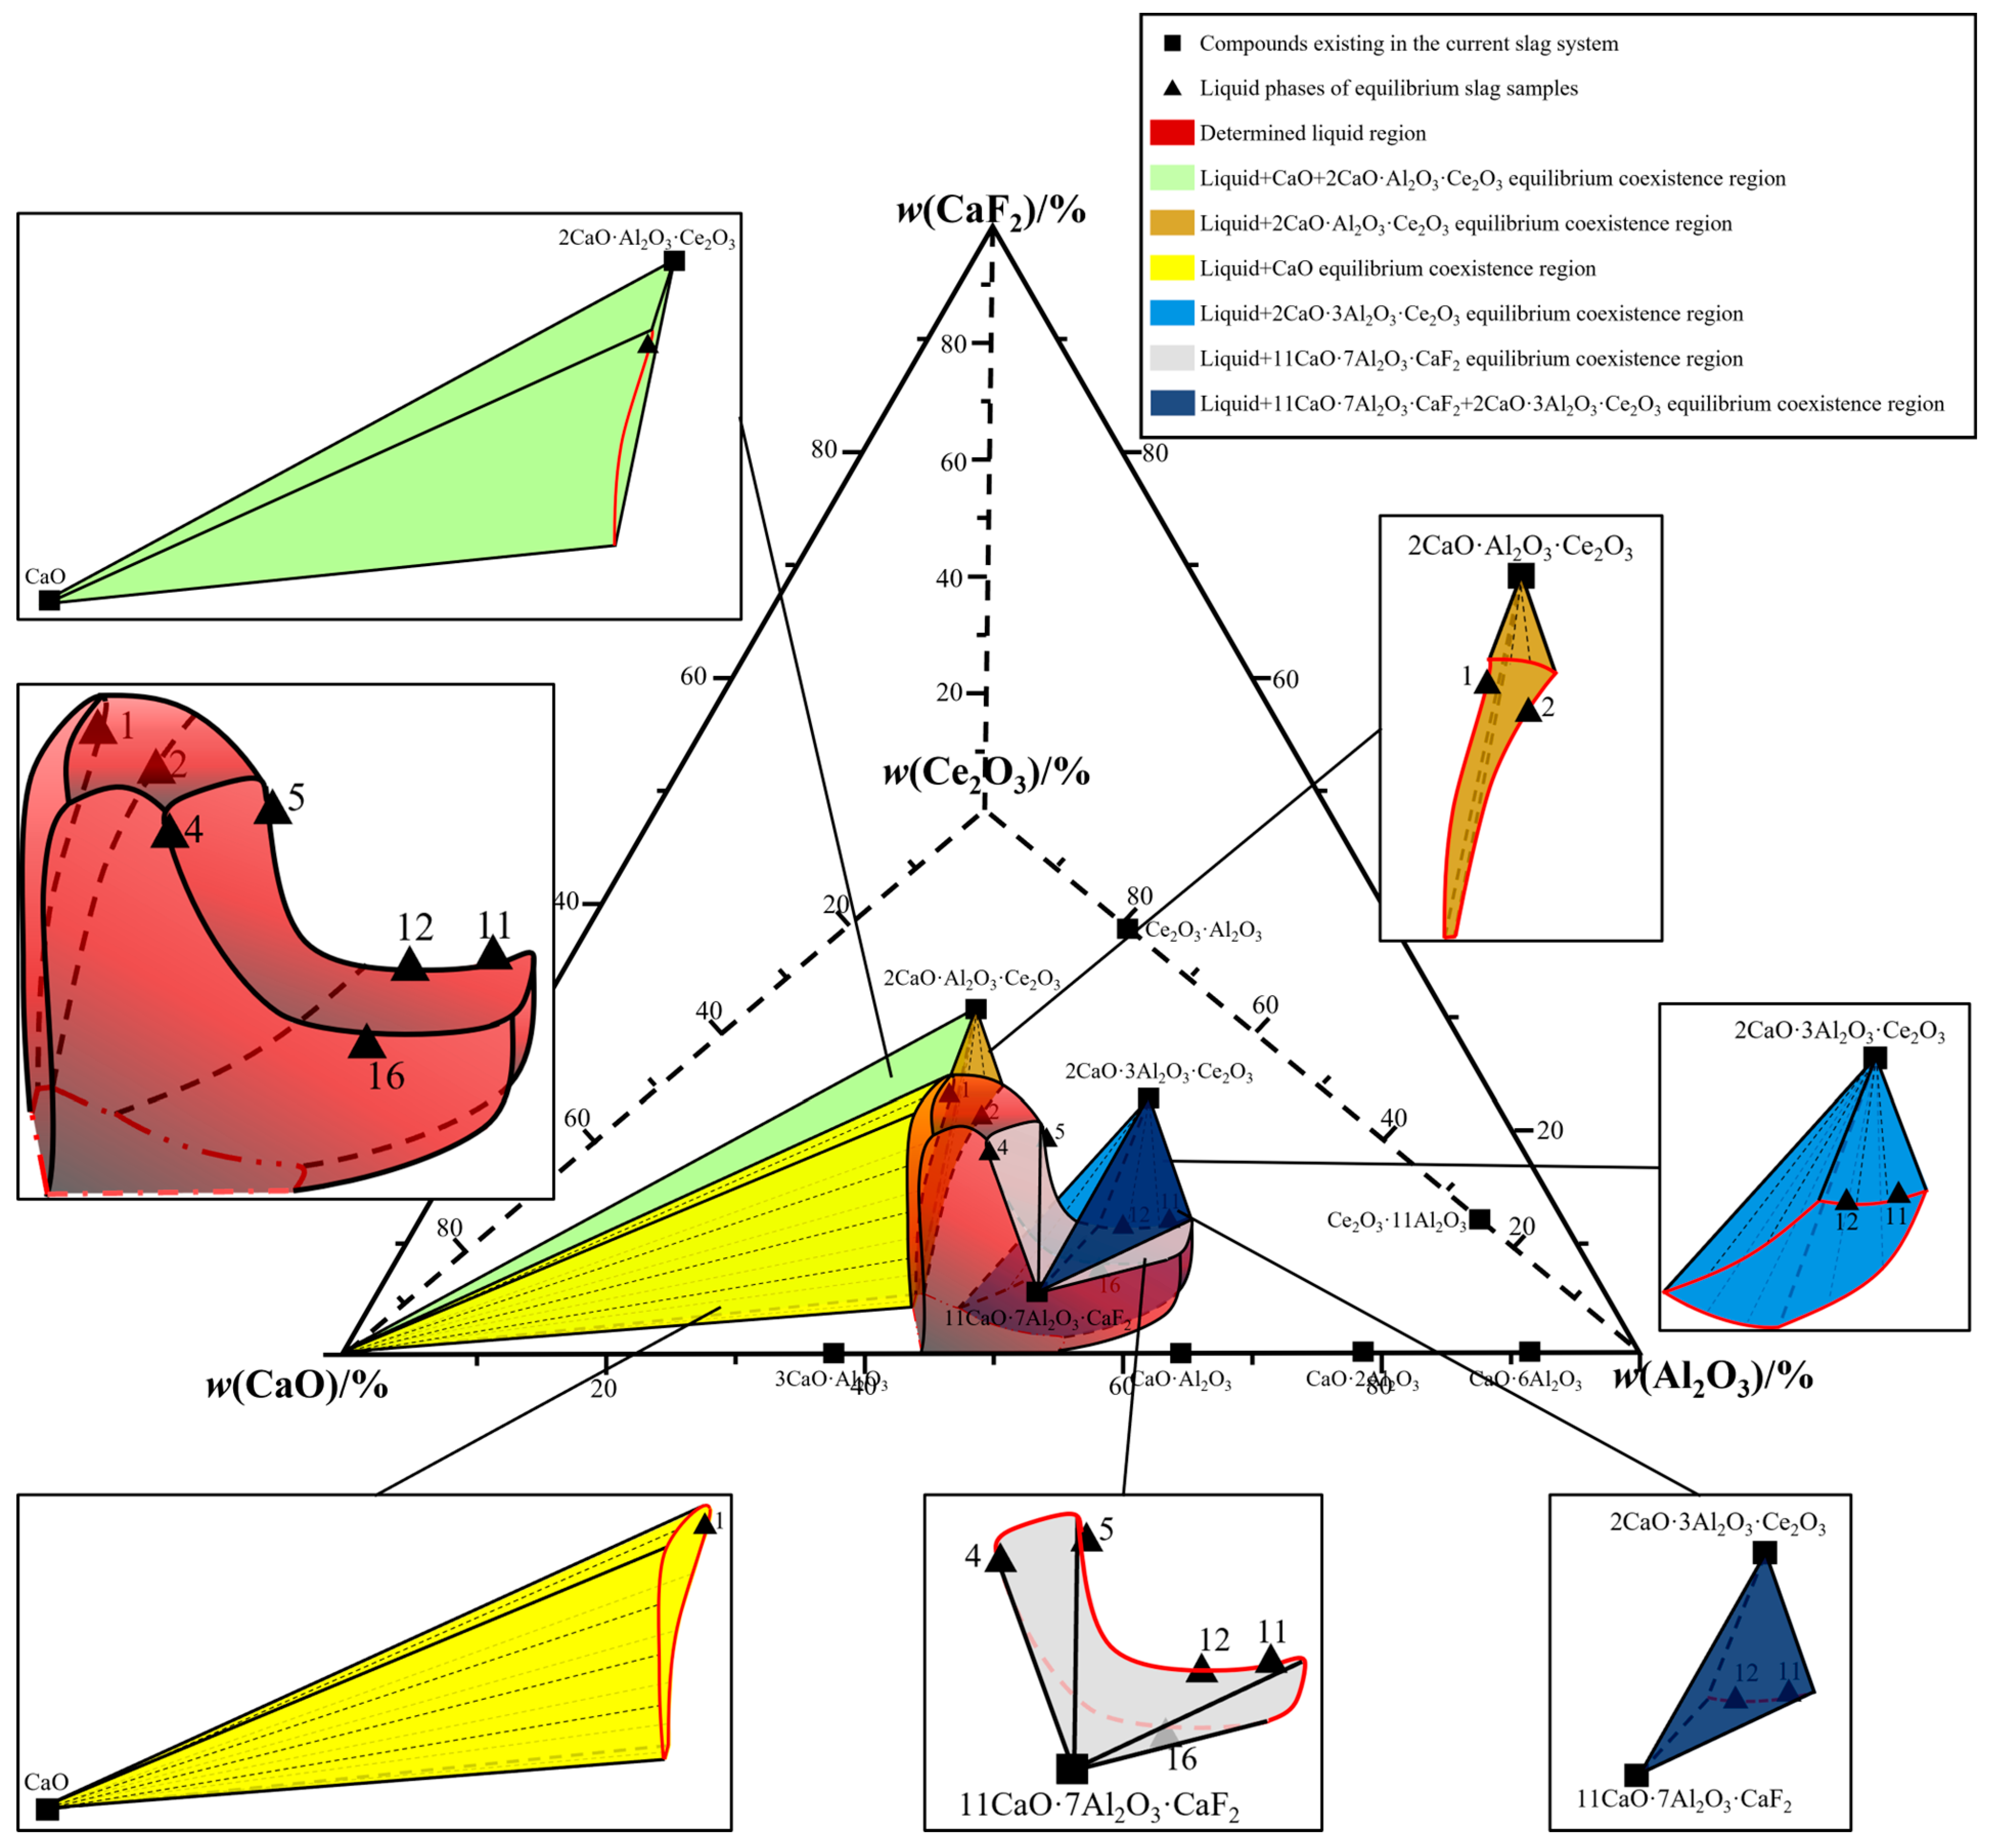
As shown in Figure 8, the equilibrium phases of Slag 7, 8, and 13 at 1400 °C are Liquid + CaO·2Al2O3 + 2CaO·3Al2O3·Ce2O3. Therefore, their equilibrium liquid phase compositions lie not only on the liquidus line of the three-phase coexistence region (Liquid + CaO·2Al2O3 + 2CaO·3Al2O3·Ce2O3) but also on the liquidus surfaces of the two-phase coexistence regions (Liquid + CaO·2Al2O3 and Liquid + 2CaO·3Al2O3·Ce2O3). The equilibrium liquid phase compositions of Slag 11 (Liquid + 2CaO·3Al2O3·Ce2O3) and Slag 14 (Liquid + 2CaO·3Al2O3·Ce2O3 + 3CaO·3 Al2O3·CaF2) are also located on the liquidus surface of the Liquid + 2CaO·3Al2O3·Ce2O3 two-phase coexistence region. That is, the liquidus surface of the Liquid + 2CaO·3Al2O3·Ce2O3 two-phase coexistence region is determined by the equilibrium liquid phase compositions of Slag 7, 8, 11, 13, and 14. Similarly, the liquidus surface of the Liquid + CaO·2Al2O3 two-phase coexistence region is determined by the equilibrium liquid phase compositions of Slag 7, 8, 13, and Slag Sample 12 (Liquid + CaO·2Al2O3 + 11CaO·7Al2O3·CaF2). At 1400 °C, the equilibrium phases of Slag 5, 6, and 10 are Liquid + 2CaO·Al2O3·Ce2O3 + 11CaO·7Al2O3·CaF2, while those of Slag 2, 3, and 4 are Liquid + 2CaO·Al2O3·Ce2O3 + CaO. Their equilibrium liquid phase composition points all lie on the liquidus surface of the Liquid + 2CaO·Al2O3·Ce2O3 two-phase coexistence region. The equilibrium phase of Slag 17 is Liquid + 3CaO·Al2O3 + 11CaO·7Al2O3·CaF2, and its equilibrium liquid phase composition point, together with those of Slag 5, 6, 10, and 12, is located on the liquidus surface of the Liquid + 11CaO·7Al2O3·CaF2 two-phase coexistence region. The isothermal phase diagram of CaO-Al2O3-Ce2O3-CaF2 slag system at 1400 °C was finally drawn.
It contains a single liquid phase region, four two-phase regions (i.e., Liquid + CaO·2Al2O3, Liquid + 2CaO·Al2O3·Ce2O3, Liquid + 2CaO·3Al2O3·Ce2O3, Liquid + 11CaO·7Al2O3·CaF2) and three three-phase regions (i.e., Liquid + 11CaO·7Al2O3·CaF2 + 2CaO·Al2O3·Ce2O3, Liquid + CaO + 2CaO·Al2O3·Ce2O3, Liquid + CaO·2Al2O3 + 2CaO·3Al2O3·Ce2O3).
The liquidus surfaces determined from the liquid–solid two-phase coexistence regions (Liquid + 11CaO·7Al2O3·CaF2, Liquid + 2CaO·3Al2O3·Ce2O3, Liquid + 2CaO·Al2O3·Ce2O3, and Liquid + CaO·2Al2O3) allow the identification of the liquid phase region of the CaO-Al2O3-Ce2O3-CaF2 slag system at 1400 °C. As shown in the red region of Figure 6, the liquid phase region ranges are: w(CaO)/w(Al2O3) = 0.28~1.18, w(Ce2O3) = 0.9%~12.62% and w(CaF2) = 1.04%~23.34%.
When constructing the isothermal phase diagram of the CaO-Al2O3-Ce2O3-CaF2 slag system at 1500 °C, it can be combined with the liquidus data of the CaO-Al2O3-Ce2O3 slag system at the same temperature [26].
At 1500 °C, the equilibrium phase of Slag 1 is Liquid + CaO + 2CaO·Al2O3·Ce2O3, and that of Slag 2 is Liquid + 2CaO·Al2O3·Ce2O3. Their equilibrium liquid phase composition points all lie on the liquidus surface of the Liquid + 2CaO·Al2O3·Ce2O3 two-phase coexistence region. Additionally, the equilibrium liquid phase composition point of Slag 1 can spatially form the liquidus surface of the Liquid + CaO two-phase region together with the liquidus line of the Liquid + CaO two-phase region in the CaO-Al2O3-Ce2O3 ternary system. The equilibrium phases of Slag 11 and 12 are Liquid + 2CaO·3Al2O3·Ce2O3 + 11CaO·7Al2O3·CaF2, while those of Slag 4, 5, and 6 are Liquid + 11CaO·7Al2O3·CaF2. Therefore, their equilibrium liquid phase composition points all locate on the liquidus surface of the Liquid + 11CaO·7Al2O3·CaF2 two-phase coexistence region. Meanwhile, the equilibrium liquid phase composition points of Slag 11 and 12 can also spatially form the liquidus surface of the Liquid + 2CaO·3Al2O3·Ce2O3 two-phase region together with the liquidus line of the Liquid + 2CaO·3Al2O3·Ce2O3 two-phase region in the CaO-Al2O3-Ce2O3 ternary system.
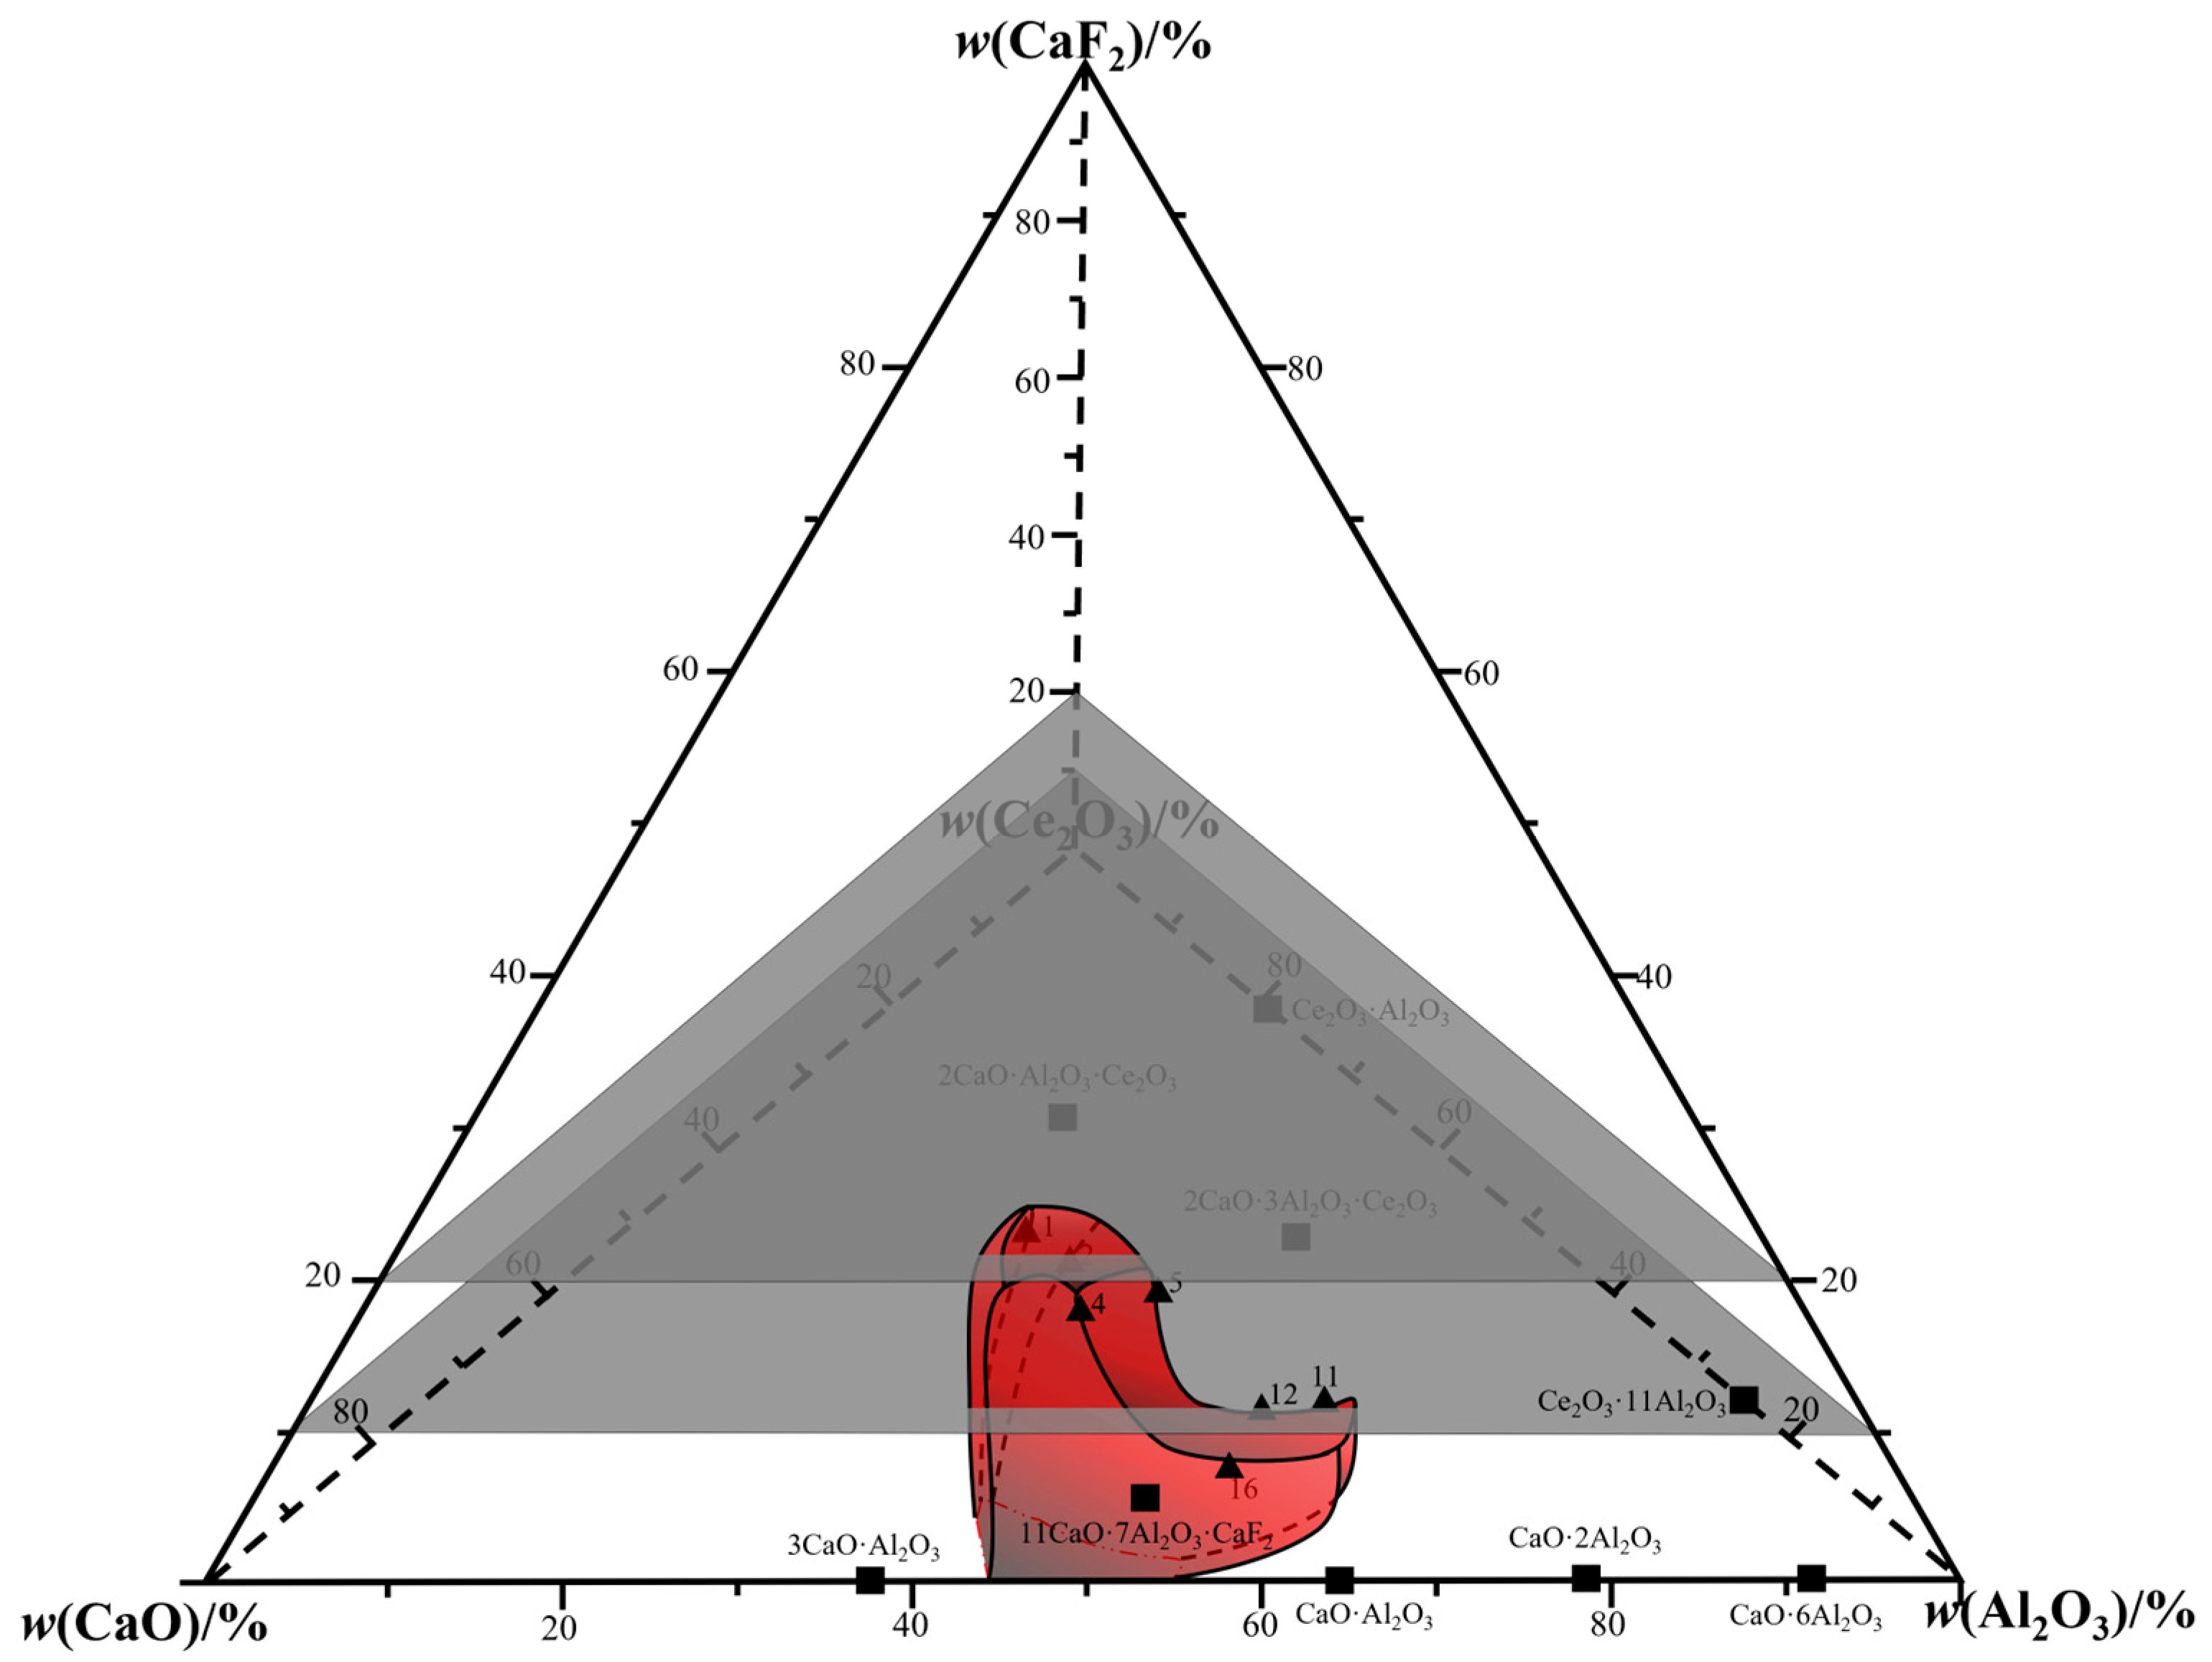
According to the liquid surface (Liquid + 11CaO·7Al2O3·CaF2, Liquid + CaO, Liquid + 2CaO·3Al2O3·Ce2O3 and Liquid + 2CaO·Al2O3·Ce2O3) determined by the liquid–solid two-phase coexistence area of the slag system and the range of the liquid phase area of the CaO-Al2O3-Ce2O3 slag system at 1500 °C, the liquid phase area of the CaO-Al2O3-Ce2O3-CaF2 slag system at 1500 °C can be determined, as shown in the red area in Figure 9. The range of the liquid phase region for the CaO-Al2O3-Ce2O3-CaF2 slag system at 1500 °C can be derived from the equilibrium liquid phase compositions of slag 1, 11, and 16: w(CaO)/w(Al2O3) = 0.23~1.21, w(Ce2O3) = 0~14.42% and w(CaF2) = 0~26.32%.
As shown in Figure 10, Figure 11 and Figure 12, the liquid phase regions of slag samples at 1300 °C, 1400 °C, and 1500 °C are sectioned at CaF2 contents of 10% and 20%, which enables a more quantitative and clear determination of the position and range of the liquid phase regions.
As can be seen from the above experimental results, the number and types of equilibrium coexisting regions in the slag system vary significantly with temperature, essentially due to the regulatory effect of temperature on component solubility and phase stability. At 1300 °C, due to the weak diffusion capacity and low solubility of components at low temperatures, the slag system forms a unique four-phase coexisting region (Liquid + CaO + 11CaO·7Al2O3·CaF2 + 2CaO·Al2O3·Ce2O3) with obvious precipitation of solid phases. If the slag composition falls into this region, the viscosity will rise sharply due to the excessively high proportion of solid phases, which impairs continuous casting fluidity, making it a region to be avoided for low-temperature rare earth steel slags. At 1400 °C, the number of coexisting regions reaches 8. This is because the increased temperature causes some low-temperature solid phases to start dissolving, though not yet fully integrated into the liquid phase. Meanwhile, CaF2 reacts with CaO and Al2O3 to form low-melting intermediate phases such as 3CaO·3Al2O3·CaF2, which provides support for the expansion of the liquid phase region. At 1500 °C, the high temperature significantly enhances the solubility of Ce2O3 and CaF2 in the liquid phase, the four-phase region disappears, and the single liquid phase region expands to the maximum range.
As indicated by the isothermal phase diagrams, the liquid phase region of the slag system expands with increasing temperature and is synergistically regulated by the contents of CaF2 and Ce2O3. At 1500 °C, the liquid phase range of w(CaO)/w(Al2O3) reaches 0.23~1.21, which is significantly wider than that at 1300 °C. This demonstrates that the slag system has stronger adaptability to the CaO/Al2O3 ratio at high temperatures and can be compatible with more metallurgical conditions.
In addition, CaF2 content can be adjusted to suit different temperature zones (1300~1500 °C) of the continuous casting mold: ≥9.17% w(CaF2) is needed at 1300 °C (low-temperature zone) to maintain the liquid phase, while less CaF2 can be added at 1500 °C (high-temperature zone) to cut costs and volatility, showing remarkable engineering adaptability. CaF2 lowers the slag’s melting temperature and promotes solid dissolution. Together with the significant increase in Ce2O3 solubility with temperature (0~14.42% at 1500 °C), this solves the issue of easy solid precipitation from high rare-earth content in traditional slags, enabling the design of slags for high-rare-earth steels.

5. Conclusions

In this study, high-temperature equilibrium experiments combined with SEM-EDX, XRD, and other techniques were used to investigate the phase equilibrium relationships and extent of the liquid phase region of the CaO-Al2O3-Ce2O3-CaF2 slag system at 1300 °C, 1400 °C, and 1500 °C, and the corresponding isothermal phase diagrams were constructed.
(1) Within the composition range studied in this paper, the slag system has five, seven, and six liquid–solid equilibrium coexistence regions at 1300 °C, 1400 °C, and 1500 °C. The involved multiphase equilibrium regions include five two-phase regions (i.e., Liquid + CaO, Liquid + CaO·2Al2O3, Liquid + 2CaO·Al2O3·Ce2O3, Liquid + 2CaO·3Al2O3·Ce2O3, Liquid + 11CaO·7Al2O3·CaF2), four three-phase regions (i.e., Liquid + CaO + 2CaO·Al2O3·Ce2O3, Liquid + 11CaO·7Al2O3·CaF2 + 2CaO·Al2O3·Ce2O3, Liquid + CaO·2Al2O3 + 2CaO·3Al2O3·Ce2O3, Liquid + 11CaO·7Al2O3·CaF2 + 2CaO·3Al2O3·Ce2O3), and 1 four-phase region (i.e., Liquid + CaO + 11CaO·7Al2O3·CaF2 + 2CaO·Al2O3·Ce2O3).
(2) The liquid phase region of the slag system expands significantly with increasing temperature: At 1300 °C, the liquid phase region ranges were w(CaO)/w(Al2O3) = 0.42~0.92, w(Ce2O3) = 1.63%~8.02% and w(CaF2) = 9.17%~21.46%; at 1400 °C, it widens to w(CaO)/w(Al2O3) = 0.28~1.18, w(Ce2O3) = 0.9%~12.62% and w(CaF2) = 1.04%~23.34%; at 1500 °C, it reaches the maximum range of w(CaO)/w(Al2O3) = 0.23~1.21, w(Ce2O3) = 0~14.42% and w(CaF2) = 0~26.32%. Higher temperature expands the liquid phase by improving component solubility, while CaF2 assists via forming low-melting phases; together, they enable precise regulation of the slag’s liquid state.
(3) CaF2 plays a key regulatory role in the slag system: it replaces Na2O in traditional slags to avoid rare earth reduction reactions and ensure stable performance; preferentially forms low-melting phases with CaO and Al2O3 to inhibit high-melting harmful phases and maintain low viscosity/fluidity; and its content can be adjusted to suit the 1300~1500 °C continuous casting temperature range, enabling flexible slag design for different conditions.

Author Contributions

The scope of the work of individual authors during the performance of this project was the same. The authors performed the study together and then analyzed its findings. They wrote the paper together. The authors equally contributed to the paper’s assembly. Conceptualization, L.S. and C.L.; Methodology, L.S., J.Q. and C.L.; Validation, L.S., J.Q. and C.L.; Formal Analysis, J.Y.; literature search, J.Y.; Resources, L.S. and C.L.; Data Curation, J.Y. and J.Q.; Writing—original Draft Preparation, J.Y.; Writing—Review and Editing, L.S., J.Q. and C.L.; Visualization, L.S. and C.L.; Figures, J.Y.; Study design, L.S., J.Y., J.Q. and C.L. All authors have read and agreed to the published version of the manuscript.

Funding

The National Key R&D Program of China (2021YFC2901200), Young Elite Scientists Sponsorship Program by CAST (2022QNRC001), Liaoning Province Science and Technology project (2023-MSBA-050).

Institutional Review Board Statement

Not applicable.

Informed Consent Statement

Not applicable.

Data Availability Statement

The original contributions presented in the study are included in the article. Further inquiries can be directed to the corresponding authors.

Conflicts of Interest

The authors declare no conflicts of interest.

References

  1. Yu, J.; Yu, Z.; Zhang, F. Handbook of Rare Earth Treated Steel; Metallurgical Industry Press: Beijing, China, 1993. [Google Scholar]
  2. China Association for Science and Technology; Chinese Society of Rare Earths. Development Report on Rare Earth Science and Technology; China Science and Technology Press: Beijing, China, 2016. [Google Scholar]
  3. Tang, X.; Song, W.; Yang, H.; Cheng, T.; Zeng, J. Technical Difficulties and Countermeasures in Casting of Rare Earth Treated Steel. Iron Steel Vanadium Titan. 2001, 22, 68–72. [Google Scholar]
  4. Wang, D. Study on the Influence of Rare Earth and Its Oxides on the Physicochemical Properties of Mold Fluxes for Continuous Casting. Ph.D. Thesis, Northeastern University, Shenyang, China, 2004. [Google Scholar]
  5. Liu, Z. Simulation Study on Mold Fluxes for Thin Slab Continuous Casting of Rare Earth Steel and Wire Feeding Process. Master’s Thesis, Chongqing University, Chongqing, China, 2006. [Google Scholar]
  6. Zeng, J.; Chen, T.; Zhao, Q.; Zhang, J.; Xiao, M. Development and Application of Mold Flux for Continuous Casting of Microalloyed Steel. Iron Steel Vanadium Titan. 2000, 4, 9–14. [Google Scholar]
  7. Xiang, S.; Wang, Y.; Xie, B. Effect of Rare Earth Oxides on Physicochemical Properties of Continuous Casting Mold Flux. Iron Steel Vanadium Titan. 2003, 2, 11–13. [Google Scholar]
  8. Blazek, K.; Yin, H.; Skoczylas, G.; McClymonds, M.; Frazee, M. Development and evaluation of lime alumina-based mold powders for casting high-aluminum TRIP steel grades. AIST Trans. 2011, 8, 232–240. [Google Scholar]
  9. Jeong, S.J.; Kim, T.S.; Park, J.H. Relationship between sulfide capacity and structure of MnO-SiO2-Al2O3-Ce2O3 system. Metall. Mater. Trans. B 2016, 48, 545–553. [Google Scholar] [CrossRef]
  10. Shibata, E.; Nakamura, T.; Nishida, T.; Endo, M.; Itou, H.; Takasu, T. Evaluation of Desulphurization Flux in CaO-Al2O3-BaO-CeO2-MgO System. Steel Res. Int. 2004, 75, 308–313. [Google Scholar] [CrossRef]
  11. Park, J.H.; Min, D.J.; Song, H.S. Structural investigation of CaO-Al2O3 and CaO-Al2O3-CaF2 slags via Fourier transform infrared spectra. ISIJ Int. 2002, 42, 38–43. [Google Scholar] [CrossRef]
  12. Zhao, H.; Wang, W.; Zhou, L.; Lu, B.; Kang, Y.-B. Effects of MnO on crystallization, melting, and heat transfer of CaO-Al2O3-based mold flux used for high Al-TRIP steel casting. Metall. Mater. Trans. B 2014, 45, 1510–1519. [Google Scholar] [CrossRef]
  13. Li, M.; Li, R.; Zhang, T. Phase equilibria of SiO2-Ce2O3-CaO-25 wt% Al2O3 system at 1673K-1773K. Ceram. Int. 2022, 48, 31614–31626. [Google Scholar] [CrossRef]
  14. Cao, J.; Li, Y.; Lin, W.; Che, J.; Zhou, F.; Tan, Y.; Li, D.; Dang, J.; Chen, C. Assessment of inclusion removal ability in refining slags containing Ce2O3. Crystals 2023, 13, 202. [Google Scholar] [CrossRef]
  15. Zhao, Z.; Zhao, J.; Wang, Z.; Tan, Z.; Qu, B.; Cui, Y. Analysis on Volatilization Behavior of Typical Fluoride-Containing Slag Systems in Steelmaking. Steelmaking 2020, 36, 75–78. [Google Scholar]
  16. Jerebtsov, D.A.; Mikhailov, G.G. Phase diagram of CaO-Al2O3 system. Ceram. Int. 2001, 27, 25–28. [Google Scholar] [CrossRef]
  17. Wartenberg, H.V.; Eckhardt, K. Schmelzdiagramme chstfeuerfester Oxyde VIII. ZeitschdRfd Ranorganis Cheundall Gemeine Chem. 1937, 232, 179–187. [Google Scholar]
  18. Leonov, A.I.; Andreeva, A.B. High-temperature chemistry of cerium in the systems cerium oxides-Al2O3, Cr2O3, and Ga2O3. Izv. Akad. Nauk SSSR Neorg. Mater. 1996, 2, 517. [Google Scholar]
  19. Kim, D.G.; Van Hoek, C.; Liebske, C.; Van Der Laan, S.; Hudon, P.; Jung, I.H. Phase Diagram Study of the CaO-CaF2 System. ISIJ Int. 2012, 52, 1945–1950. [Google Scholar] [CrossRef]
  20. Zaitsev, A.I.; Korolyov, N.V.; Mogutnov, B.M. Phase equilibria in the CaF2-Al2O3-CaO system. J. Mater. Sci. 1991, 26, 1588–1600. [Google Scholar] [CrossRef]
  21. Ueda, S.; Morita, K.; Sano, N. Activity of AlO1.5 for the CaO-AlO1.5-CeO1.5 system at 1773 K. ISIJ Int. 1998, 38, 1292–1296. [Google Scholar] [CrossRef]
  22. Kitano, R.; Ishii, M.; Uo, M.; Morita, K. Thermodynamic properties of the CaO-AlO1.5-CeO1.5 system. ISIJ Int. 2016, 56, 1893–1901. [Google Scholar] [CrossRef]
  23. Qiu, J.; Wang, H.; Huo, G.; Liu, C. Phase diagram of CaO-Al2O3-CeOx slag system at 1600 °C in reducing atmosphere and air atmosphere. Ceram. Int. 2023, 49, 20447–20455. [Google Scholar] [CrossRef]
  24. Zhu, D. Study and Drawing of Isothermal Phase Diagram of CaO-Al2O3-CeO2 Slag System at 1500 °C in Air Atmosphere. Master’s Thesis, Northeastern University, Shenyang, China, 2021; pp. 41–46. [Google Scholar]
  25. Nakada, H.; Susa, M.; Seko, Y.; Hayashi, M.; Nagata, K. Mechanism of heat transfer reduction by crystallization of mold flux for continuous casting. ISIJ Int. 2008, 48, 446–453. [Google Scholar] [CrossRef]
  26. Cho, J.W.; Emi, T.; Shibata, H.; Suzuki, M. Heat transfer across mold flux film in mold during initial solidification in continuous casting of steel. ISIJ Int. 1998, 38, 834–842. [Google Scholar] [CrossRef]
  27. Sridhar, S.; Mills, K.C.; Afrange, O.D.C.; Carli, L.R. Break temperatures of mould fluxes and their relevance to continuous casting. Ironmak. Steelmak. 2000, 27, 238–242. [Google Scholar] [CrossRef]
  28. Wang, H. Phase Equilibria and CALPHAD Study of CaO-Al2O3-Ce2O3 Slag System at 1600 °C. Master’s Thesis, Northeastern University, Shenyang, China, 2023; pp. 44–45. [Google Scholar]
  29. Brandaleze, E.; Di Gresia, G.; Santini, L.; Martín, A.; Benavidez, E. Mould fluxes in the steel continuous casting process. In Science and Technology of Casting Processes; IntechOpen: London, UK, 2012. [Google Scholar]
  30. He, S.; Li, Z.; Chen, Z.; Wu, T.; Wang, Q. Review of mold fluxes for continuous casting of high-alloy (Al, Mn, Ti) steels. Steel Res. Int. 2019, 90, 1800424. [Google Scholar] [CrossRef]
  31. Van Ende, M.A.; Jung, I.H. Development of a thermodynamic database for mold flux and application to the continuous casting process. ISIJ Int. 2014, 54, 489–495. [Google Scholar] [CrossRef]
  32. Ni, P.; Tanaka, T.; Suzuki, M.; Nakamoto, M.; Ersson, M.; Jönsson, P.G. Mathematical Modelling Study of Dynamic Composition Change of Steel and Mold Flux in Continuous Casting of Steel. ISIJ Int. 2019, 59, 2024–2035. [Google Scholar] [CrossRef]
  33. Thu, H.L.; Annelies, M.; Bart, B.; Guo, M. Phase relations of the CaO-SiO2-Nd2O3 system and the Implication for rare earth recycling. Metall. Mater. Trans. B 2016, 47, 1736–1744. [Google Scholar]
  34. Chen, M.; Zhao, B. Phase equilibrium Studies of “Cu2O”-SiO2-Al2O3 system in equilibrium with metallic copper. J. Am. Ceram. Soc. 2013, 96, 3631–3636. [Google Scholar] [CrossRef]
  35. Wang, N.; Huang, W.; Chen, S.; Chen, M. Effect of oxygen partial pressure on phase equilibria and liquidus in CaO-Al2O3-FeOx system. J. Iron Steel Res. Int. 2012, 19, 8–12. [Google Scholar] [CrossRef]
  36. Jang, K.; Ma, X.; Zhu, J.; Xu, H.; Wand, G.; Zhao, B. Phase equilibria in the system “FeO”-CaO-SiO2-Al2O3-MgO with CaO/SiO2 = 1.3. ISIJ Int. 2016, 56, 967–976. [Google Scholar] [CrossRef]
  37. Yu, Q.; Sugita, S.; Feng, X.; Mi, J. On the preparation of single crystals of 11CaO·7Al2O3·CaF2 and the confirmation of its crystal structure. Cem. Concr. Res. 1997, 27, 1439–1449. [Google Scholar]
  38. Kaptay, G. The Generalized Phase Rule, the Extended Definition of the Degree of Freedom, the Component Rule and the Seven Independent Non-Compositional State Variables: To the 150th Anniversary of the Phase Rule of Gibbs. Materials 2024, 17, 6048. [Google Scholar] [CrossRef] [PubMed]
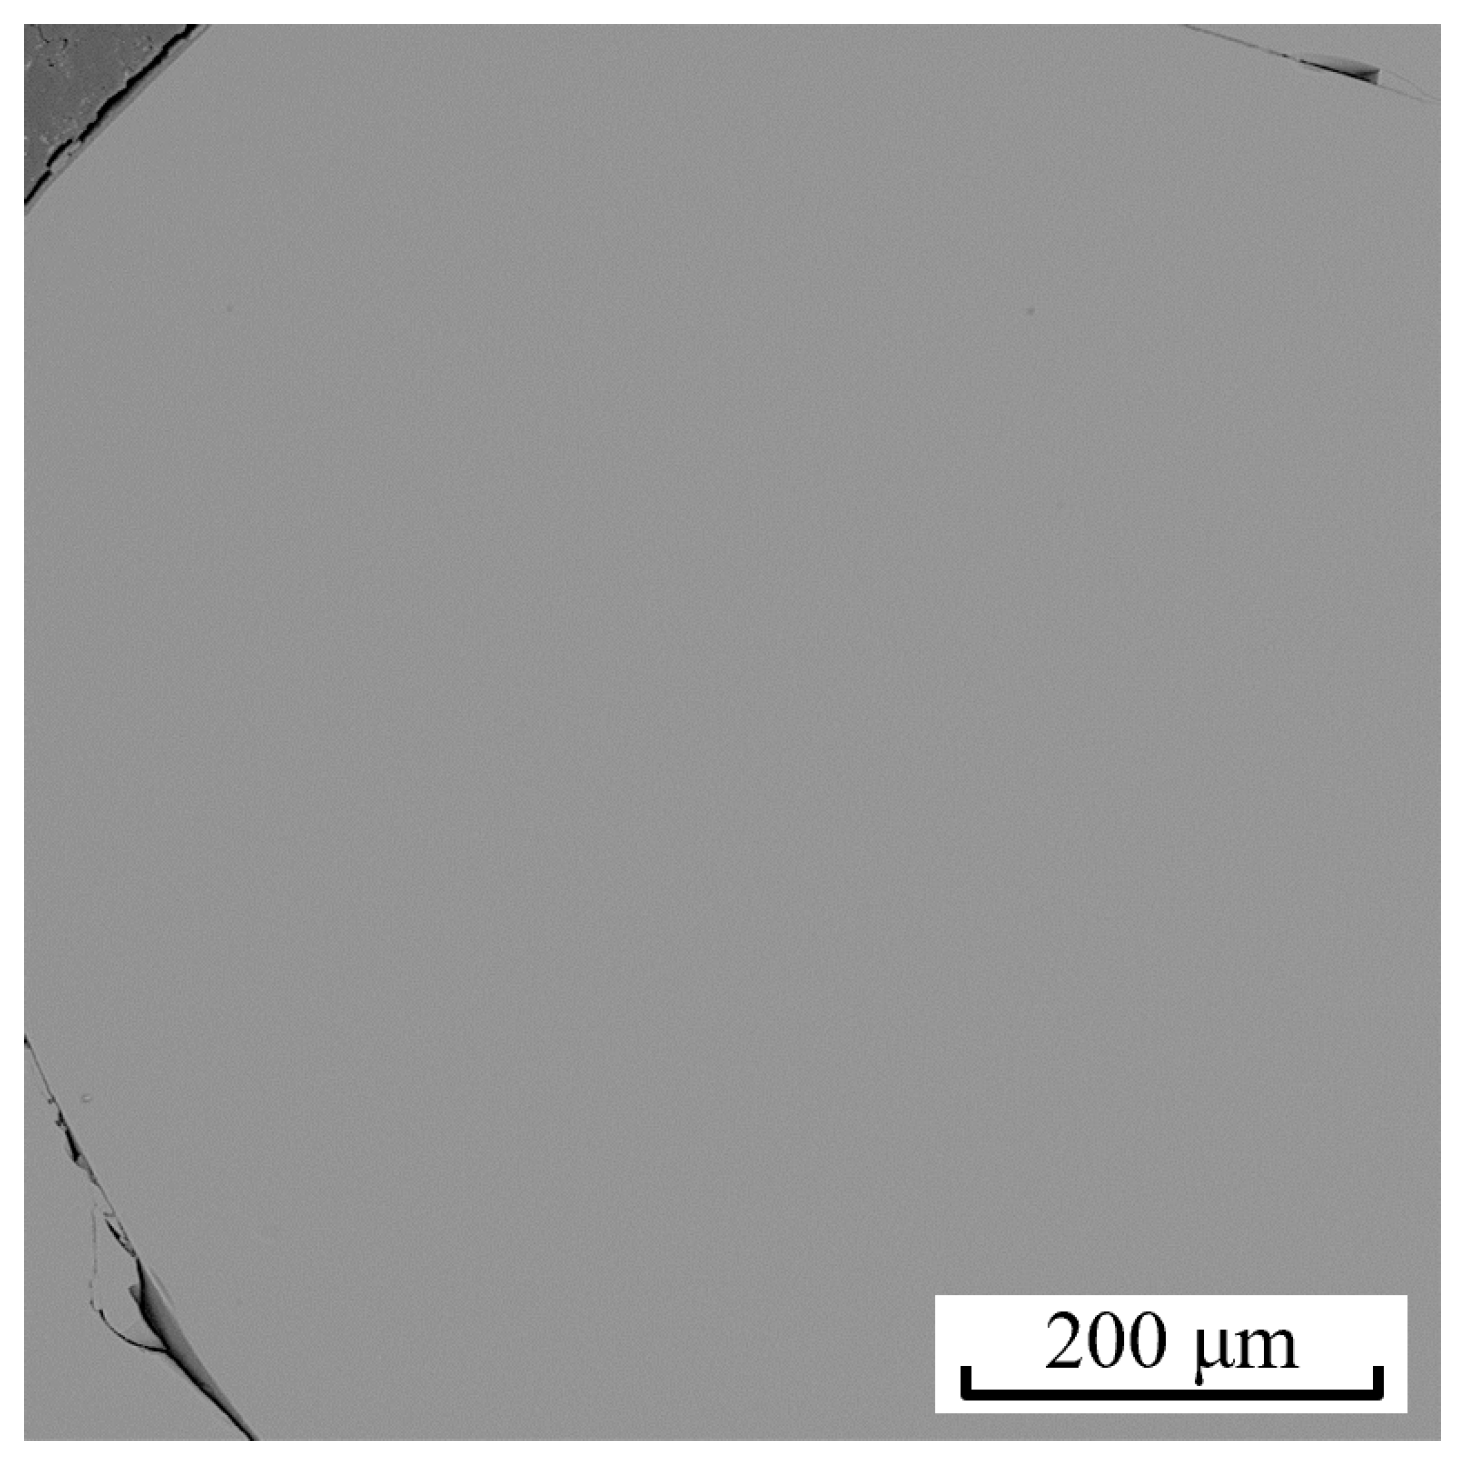
Figure 1. SEM photos of pre-melted slag samples.
Metals 15 01209 g001
Figure 2. Temperature control curve during high-temperature thermodynamic equilibrium experiment.
Metals 15 01209 g002
Figure 3. Dominance area diagram of cerium oxides.
Metals 15 01209 g003
Figure 4. SEM photos of slag sample 7 at different holding times. (a) Heat preservation for 24 h; (b) Heat preservation for 36 h.
Metals 15 01209 g004
Figure 5. XRD results of typical critical phase regions. (a) slag 3 (1300 °C); (b) slag 7 (1300 °C); (c) slag 5 (1400 °C); (d) slag 12 (1400 °C); (e) slag 7 (1400 °C); (f) slag 4 (1500 °C).
Metals 15 01209 g005aMetals 15 01209 g005b
Figure 6. SEM images of typical phase equilibria at 1300 °C, 1400 °C and 1500 °C. (a) slag 3 (1300 °C); (b) slag 7 (1300 °C); (c) slag 12 (1300 °C); (d) slag 14 (1400 °C); (e) slag 5 (1400 °C); (f) slag 12 (1400 °C) (g) slag 17 (1400 °C); (h) slag 11 (1400 °C); (i) slag 1 (1500 °C); (j) slag 2 (1500 °C); (k) slag 4 (1500 °C); (l) slag 6 (1500 °C).
Metals 15 01209 g006
Figure 7. Isothermal phase diagram of CaO-Al2O3-Ce2O3-CaF2 slag system at 1300 °C.
Metals 15 01209 g007
Figure 8. Isothermal phase diagram of CaO-Al2O3-Ce2O3-CaF2 slag system at 1400 °C.
Metals 15 01209 g008
Figure 9. Isothermal phase diagram of CaO-Al2O3-Ce2O3-CaF2 slag system at 1500 °C.
Metals 15 01209 g009
Figure 10. Liquid phase region of CaO-Al2O3-Ce2O3-CaF2 slag system at 1300 °C.
Metals 15 01209 g010
Figure 11. Liquid phase region of CaO-Al2O3-Ce2O3-CaF2 slag system at 1400 °C.
Metals 15 01209 g011
Figure 12. Liquid phase region of CaO-Al2O3-Ce2O3-CaF2 slag system at 1500 °C.
Metals 15 01209 g012
Table 1. Error in EDX determination of slag sample composition.
No.Detection Methodw(CaO)/%w(Al2O3)/%w(CeO2)/%w(CaF2)/%Error
12EDX28.3356.154.4611.051.36%
EPMA28.8655.784.5110.85
13EDX20.1161.0711.447.381.41%
EPMA20.2660.4711.847.42
15EDX28.5857.262.3911.762.01%
EPMA29.1356.902.4711.50
Table 2. Actual initial compositions of experimental slags (mass fraction, %).
No.CaOAl2O3CeO2CaF2CaO/Al2O3
136.6232.1615.1016.111.14
234.3935.4215.0315.160.97
335.1837.7812.1714.880.93
437.0937.789.6815.450.98
531.6244.138.6515.600.72
629.2441.5213.9615.270.70
719.0560.684.3215.960.31
814.4058.4012.1815.020.25
941.8550.232.365.550.83
1033.9145.9013.007.190.74
1124.5353.018.8613.600.46
1228.3356.154.4611.050.50
1320.1161.0711.447.380.33
1432.8759.192.595.350.56
1528.5857.262.3911.760.50
1630.9653.541.6813.810.58
1750.2844.832.322.571.12
Table 3. Phase equilibrium relationship of slag samples at 1300 °C, 1400 °C, and 1500 °C.
TemperatureNo.Equilibrium Phase
1300 °C3, 5Liquid + CaO + 11CaO·7Al2O3·CaF2 + 2CaO·Al2O3·Ce2O3
7, 8Liquid + CaO·2Al2O3 + 2CaO·3Al2O3·Ce2O3
12, 14Liquid + 11CaO·7Al2O3·CaF2 + 2CaO·3Al2O3·Ce2O3
15Liquid + 11CaO·7Al2O3·CaF2
1400 °C9Liquid + 11CaO·7Al2O3·CaF2
11Liquid + 2CaO·3Al2O3·Ce2O3
12Liquid + CaO·2Al2O3 + 11CaO·7Al2O3·CaF2
14Liquid + 2CaO·3Al2O3·Ce2O3 + 3CaO·3Al2O3·CaF2
17Liquid + 3CaO·Al2O3 + 11CaO·7Al2O3·CaF2
2, 3, 4Liquid + CaO + 2CaO·Al2O3·Ce2O3
5, 6, 10Liquid + 2CaO·Al2O3·Ce2O3 + 11CaO·7Al2O3·CaF2
7, 8, 13Liquid + CaO·2Al2O3 + 2CaO·3Al2O3·Ce2O3
1500 °C6Liquid
2Liquid + 2CaO·Al2O3·Ce2O3
1Liquid + CaO + 2CaO·Al2O3·Ce2O3
11, 12Liquid + 2CaO·3Al2O3·Ce2O3 + 11CaO·7Al2O3·CaF2
4, 5, 16Liquid + 11CaO·7Al2O3·CaF2
Table 4. EDX analysis results of equilibrium slag samples at 1300 °C, 1400 °C, and 1500 °C (mass fraction, %).
TemperatureNo.Equilibrium PhaseStoichiometricCaOAl2O3Ce2O3CaF2SEMXRD
1300 °C3Liquid 41.2729.258.0221.46Figure 6aFigure 5a
CaOactual81.0511.572.684.70
ideal100---
11CaO·7Al2O3·CaF2actual37.6153.502.106.78
ideal43.7950.67-5.54
2CaO·Al2O3·Ce2O3actual21.6328.7838.1011.48
ideal21.3119.3759.32-
5Liquid 43.0630.177.8918.88--
CaOactual88.706.272.162.87
ideal100---
11CaO·7Al2O3·CaF2actual36.3855.601.316.71
ideal43.7950.67-5.54
2CaO·Al2O3·Ce2O3actual21.6327.1640.7610.44
ideal21.3119.3759.32-
7Liquid 21.6560.571.6316.15Figure 6bFigure 5b
CaO·2Al2O3actual18.6679.381.050.90
ideal35.4864.52--
2CaO·3Al2O3·Ce2O3actual12.1151.0029.877.02
ideal15.3641.8942.75-
8Liquid 24.7559.864.6010.79--
CaO·2Al2O3actual19.5977.101.911.40
ideal35.4864.52--
2CaO·3Al2O3·Ce2O3actual12.8950.7730.635.71
ideal15.3641.8942.75-
12Liquid 33.5754.384.537.52Figure 6c-
11CaO·7Al2O3·CaF2actual26.8759.830.0013.30
ideal43.7950.67-5.54
2CaO·3Al2O3·Ce2O3actual18.1349.9131.960.00
ideal15.3641.8942.75-
14Liquid 34.8755.163.666.31--
11CaO·7Al2O3·CaF2actual25.1661.920.0012.92
ideal43.7950.67-5.54
2CaO·3Al2O3·Ce2O3actual18.4952.2029.310.00
ideal15.3641.8942.75-
15Liquid 32.9353.266.956.86--
11CaO·7Al2O3·CaF2actual25.9660.740.8912.40
ideal43.7950.67-5.54
1400 °C2Liquid 41.6636.3111.2910.73--
CaOactual89.934.091.794.19
ideal100---
2CaO·Al2O3·Ce2O3actual19.9927.7042.829.48
ideal21.3119.3759.32-
3Liquid 38.6937.289.8114.22--
CaOactual87.697.282.812.22
ideal100---
2CaO·Al2O3·Ce2O3actual22.5225.5242.029.94
ideal21.3119.3759.32-
4Liquid 40.3834.289.8815.46--
CaOactual90.494.414.101.00
ideal100---
2CaO·Al2O3·Ce2O3actual18.9924.2345.7311.05
ideal21.3119.3759.32-
5Liquid 34.7835.8410.6818.70Figure 6eFigure 5c
11CaO·7Al2O3·CaF2actual36.3255.320.807.55
ideal43.7950.67-5.54
2CaO·Al2O3·Ce2O3actual21.3527.0140.7710.87
ideal21.3119.3759.32-
6Liquid 32.5635.1310.3821.93--
11CaO·7Al2O3·CaF2actual34.7055.601.907.80
ideal43.7950.67-5.54
2CaO·Al2O3·Ce2O3actual17.3926.5245.1010.99
ideal21.3119.3759.32-
7Liquid 25.7959.073.7011.45-Figure 5e
CaO·2Al2O3actual18.6979.970.301.04
ideal35.4864.52--
2CaO·3Al2O3·Ce2O3actual10.9851.7129.847.46
ideal15.3641.8942.75-
8Liquid 27.1760.763.408.68--
CaO·2Al2O3actual19.6178.821.110.46
ideal35.4864.52--
2CaO·3Al2O3·Ce2O3actual15.9551.5632.490.00
ideal15.3641.8942.75-
9Liquid 43.4530.299.2617.00--
11CaO·7Al2O3·CaF2actual38.8955.120.895.09
ideal43.7950.67-5.54
10Liquid 50.5342.485.941.04---
2CaO·Al2O3·Ce2O3actual19.0027.5345.877.60
ideal21.3119.3759.32-
11CaO·7Al2O3·CaF2actual37.7756.300.565.38
ideal43.7950.67-5.54
11Liquid 28.2154.723.7713.30Figure 6h-
2CaO·3Al2O3·Ce2O3actual13.2847.9832.885.87
ideal15.3641.8942.75-
12Liquid 15.5555.392.5126.55Figure 6fFigure 5d
CaO·2Al2O3actual17.5980.590.701.11
ideal35.4864.52--
11CaO·7Al2O3·CaF2actual25.6055.155.9613.29
ideal43.7950.67-5.54
13Liquid 24.2561.531.1713.05--
CaO·2Al2O3actual18.6977.362.041.91
ideal35.4864.52--
2CaO·3Al2O3·Ce2O3actual13.3548.1832.765.71
ideal15.3641.8942.75-
14Liquid 30.7556.812.599.85Figure 6d-
2CaO·3Al2O3·Ce2O3actual12.3751.8128.007.83
ideal15.3641.8942.75-
3CaO·3Al2O3·CaF2actual20.9562.030.6816.34
ideal30.4755.39-14.14
17Liquid 36.8255.830.906.45Figure 6g-
3CaO·Al2O3actual57.2429.879.583.31
ideal62.2637.74--
11CaO·7Al2O3·CaF2actual27.7352.734.8514.70
ideal43.7950.67-5.54
1500 °C1Liquid 37.7632.1613.4516.64Figure 6i-
CaOactual86.736.182.174.92
ideal100---
2CaO·Al2O3·Ce2O3actual28.5727.7629.1014.57
ideal21.3119.3759.32-
2Liquid 35.8535.9912.2615.90Figure 6j-
2CaO·Al2O3·Ce2O3actual26.1327.8032.3713.70
ideal21.3119.3759.32-
4Liquid 39.4738.509.0313.01Figure 6kFigure 5f
11CaO·7Al2O3·CaF2actual37.2651.733.867.15
ideal43.7950.67-5.54
5Liquid 36.3529.8320.4213.40--
11CaO·7Al2O3·CaF2actual34.2851.694.519.52
ideal43.7950.67-5.54
6Liquid 29.1543.7111.5815.57Figure 6l-
11Liquid 19.8357.284.6518.24--
11CaO·7Al2O3·CaF2actual31.1252.816.789.30
ideal43.7950.67-5.54
2CaO·3Al2O3·Ce2O3actual12.8348.2031.607.37
ideal15.3641.8942.75-
12Liquid 33.2355.294.826.67--
11CaO·7Al2O3·CaF2actual24.7760.651.7512.83
ideal43.7950.67-5.54
2CaO·3Al2O3·Ce2O3actual12.7749.7730.127.34
ideal15.3641.8942.75-
16Liquid 36.8754.731.536.87--
11CaO·7Al2O3·CaF2actual27.5460.47-11.99
ideal43.7950.67-5.54
Disclaimer/Publisher’s Note: The statements, opinions and data contained in all publications are solely those of the individual author(s) and contributor(s) and not of MDPI and/or the editor(s). MDPI and/or the editor(s) disclaim responsibility for any injury to people or property resulting from any ideas, methods, instructions or products referred to in the content.