Article

Influence of LPBF Parameters and Post-Annealing Temperature on Martensitic Transformation and Superelasticity of Ni-Rich Ni51.9Ti48.1 Alloy

Institute of Machinery Manufacturing Technology, CAEP, Mianyang 621000, China
*
Authors to whom correspondence should be addressed.
These authors contributed equally to this work.
Metals 2025, 15(11), 1180; https://doi.org/10.3390/met15111180
Submission received: 18 September 2025 / Revised: 16 October 2025 / Accepted: 23 October 2025 / Published: 24 October 2025

Abstract

Laser powder bed fusion (LPBF) technology offers an effective approach for fabricating high-performance superelastic NiTi alloys. This study achieved Ni51.9Ti48.1 alloys with outstanding superelastic properties through a triple optimization design of the initial powder composition, printing process parameters, and post-processing. The phase transformation behavior and microstructure of the alloys were systematically investigated. The results indicate that as energy density increases, the size and quantity of pore defects in LPBF-fabricated Ni51.9Ti48.1 alloys increase, phase transformation temperatures rise, and hardness conversely decreases. Ni51.9Ti48.1 alloys produced at lower energy densities exhibit fewer dislocations. After annealing at 600 °C, Ni4Ti3 and R phases form internally, resulting in a maximum superelasticity of 6.64%. Conversely, Ni51.9Ti48.1 alloys produced at higher energy densities exhibited a large number of dislocations and formed subgrains after annealing at 600 °C. Additionally, due to the high void volume fraction, they demonstrated deteriorated superelasticity.

1. Introduction

NiTi shape memory alloys, as a special functional material, exhibit outstanding superelasticity, shape memory effect, thermoelastic properties, and biocompatibility. They have a wide range of applications in aerospace, sensing and actuation, solid-state refrigeration, medical devices, and other fields [1,2,3,4,5]. However, NiTi alloys exhibit accelerated tool wear during machining due to work hardening, and they are prone to forming brittle precipitate phases during welding. Consequently, conventional machining methods struggle to fabricate NiTi components with complex geometries [6]. In recent years, laser powder bed fusion technology has advanced rapidly. Utilizing a high-energy laser as the heat source, it melts the powder layer by layer along a predetermined path, providing an effective approach for fabricating complex NiTi components [7,8,9,10].
For LPBFed NiTi alloys, the superelastic properties are significantly influenced by the initial composition of the NiTi powder and the LPBF process parameters. On one hand, NiTi alloys exhibit high sensitivity to chemical composition and microstructure; a 0.1 at.% change in Ni content can result in phase transition temperature differences of up to approximately 10 °C and phase transition stress differences of up to approximately 70 MPa [11,12,13]. On the other hand, since Ni has a lower boiling point and evaporation enthalpy (374.8 kJ/mol, 2913 °C) than Ti (425.5 kJ/mol, 3287 °C), selective evaporation of Ni occurs during LPBF processing of NiTi. The extent of Ni evaporation loss varies significantly with changes in process parameters. Particularly, when the energy density exceeds 200 J/mm3, Ni evaporation losses surpass 1 at.% [14,15,16]. Therefore, optimizing the initial powder chemical composition and printing process parameters is an effective approach to modulating the mechanical properties and superelastic behavior of NiTi alloys. Saedi et al. [17] investigated the effects of laser power and scanning speed on the microstructure and superelasticity of the LPBFed Ni-rich Ni50.8Ti49.2 alloy, identifying an optimal process window. The resulting NiTi alloy exhibited a strain recovery rate of 5.77% upon initial compression and 5.5% after 10 cycles. Shen et al. [18] investigated the microstructure and superelasticity of the Ni-rich Ni51.0Ti49.0 alloy processed at different energy densities. They concluded that variations in phase transition temperatures and superelastic properties among the different samples stem from differences in Ni content. Xue et al. [19] prepared a Ni-rich Ni51.2Ti48.8 alloy with strong texture and nanoscale precipitates by optimizing LPBF process parameters to eliminate manufacturing defects, regulate Ni evaporation loss, and control oxygen content in the printing atmosphere, achieving 6% tensile superelasticity. Yan et al. [20] prepared NiTi alloys that exhibited 5.71% superelasticity after 30 cycles using Ni-rich Ni51.2Ti48.8 powder. They attributed this superelastic stability to the strong texture resisting plastic deformation and the pinning effect of uniformly coherent Ti4Ni2Ox nano-precipitates on dislocation motion during cyclic loading. The results above indicate that Ni-rich NiTi powder, combined with optimized process parameters, can yield NiTi alloys with excellent superelasticity.
Additionally, it is noteworthy that regulating the phase transformation behavior of NiTi alloys through post-processing, along with controlling the size, distribution, and quantity of precipitated phases, represents another crucial approach to optimizing the mechanical properties and functional characteristics of these alloys. Saedi et al. [21,22] investigated the effects of aging on the phase transformation behavior and superelasticity of the LPBFed Ni-rich Ni50.8Ti49.2 alloy. They found that the phase transformation temperature of the NiTi alloy could be tailored by adjusting the aging temperature and duration, resulting in 5.5% superelasticity. Safdel et al. [23] subjected LPBEed Ni-rich NiTi alloys to aging treatment, which induced nanoscale Ni4Ti3 precipitates and dislocation rearrangement through recovery and recrystallization mechanisms. This process achieved strain recovery rates of 82% and 86% for tensile and compressive deformation, respectively. Yang et al. [24] subjected LPBFed Ni-rich Ni50.7Ti49.3 alloy to aging treatments of varying durations, forming lenticular Ni4Ti3 nano-precipitates that effectively suppressed dislocation generation and achieved 6.36% superelasticity. The aforementioned studies demonstrate the effectiveness of optimizing the initial powder composition, process parameters, and post-processing to achieve high-performance superelastic NiTi alloys. The key lies in compensating for Ni evaporation and regulating phase transformation behavior and microstructure. Therefore, it is necessary to further elucidate the influence mechanisms of process parameters and post-processing on the phase transformation behavior, microstructure, and superelastic properties of LPBFed Ni-rich NiTi alloys, particularly those produced from Ni-rich NiTi powders with higher initial Ni content.
This study aims to achieve high-performance superelastic NiTi alloys by implementing a triple optimization design of initial powder composition, process parameters, and post-treatment, while elucidating the effects of process parameters and post-treatment on phase transformation behavior, microstructure, and superelastic properties. First, to compensate for Ni evaporation losses during printing, a custom Ni-rich Ni51.9Ti48.1 powder was employed for the first time. Second, process optimization was performed on LPBFed Ni51.9Ti48.1 alloy to regulate its phase transformation behavior and microstructure. Finally, to further regulate the microstructure and phase transformation behavior, the prepared Ni51.9Ti48.1 samples underwent annealing treatment. Furthermore, comprehensive analyses were carried out to investigate the effects of process parameters and annealing treatments on pore defects, phase transformation behavior, hardness, and microstructure in the Ni51.9Ti48.1 alloy, thereby establishing a clear correlation between processing conditions, microstructural evolution, and superelastic performance. Concurrently, the underlying mechanisms governing superelasticity were revealed through microstructural analysis. This research provides valuable insights for laser additive manufacturing of high-performance superelastic NiTi alloys.

2. Fabrication and Experimental Procedure

2.1. Powder

The Ni51.9Ti48.1 (at%) powder (Micro-Nano Additive Technology Co., Ltd., Shenzhen, China) was prepared by the electrode induction molten gas atomization (EIGA) process, and its chemical composition is shown in Table 1. The powder’s chemical composition was determined by inductively coupled plasma optical emission spectroscopy (ICP-OES) and infrared absorption spectroscopy. Most of the powder particles are spherical, as shown in Figure 1a. The powder size distribution is shown in Figure 1b, which was measured by the laser diffraction method. This powder exhibits excellent flowability, satisfying the requirements of the LPBF process. The phase transformation behavior of the Ni51.9Ti48.1 powder was determined by differential scanning calorimetry (DSC) with a heating and cooling rate of 10 °C/min. Multiple transformation peaks were observed (Figure 1c). The X-ray diffraction (XRD) pattern in Figure 1d indicates that the Ni51.9Ti48.1 powder is in the austenitic (B2 phase) state at room temperature (RT), which is consistent with the DSC curves in Figure 1c. The Ni51.9Ti48.1 powder was tested using a nanoindenter (SASTest Equipment Co., Ltd., Shenzhen, China) in controlled load mode (maximum load of 30 mN), yielding a room-temperature modulus of 62.96 ± 4.46 GPa and a microhardness of 4.56 ± 0.16 GPa.

2.2. Fabrication Process

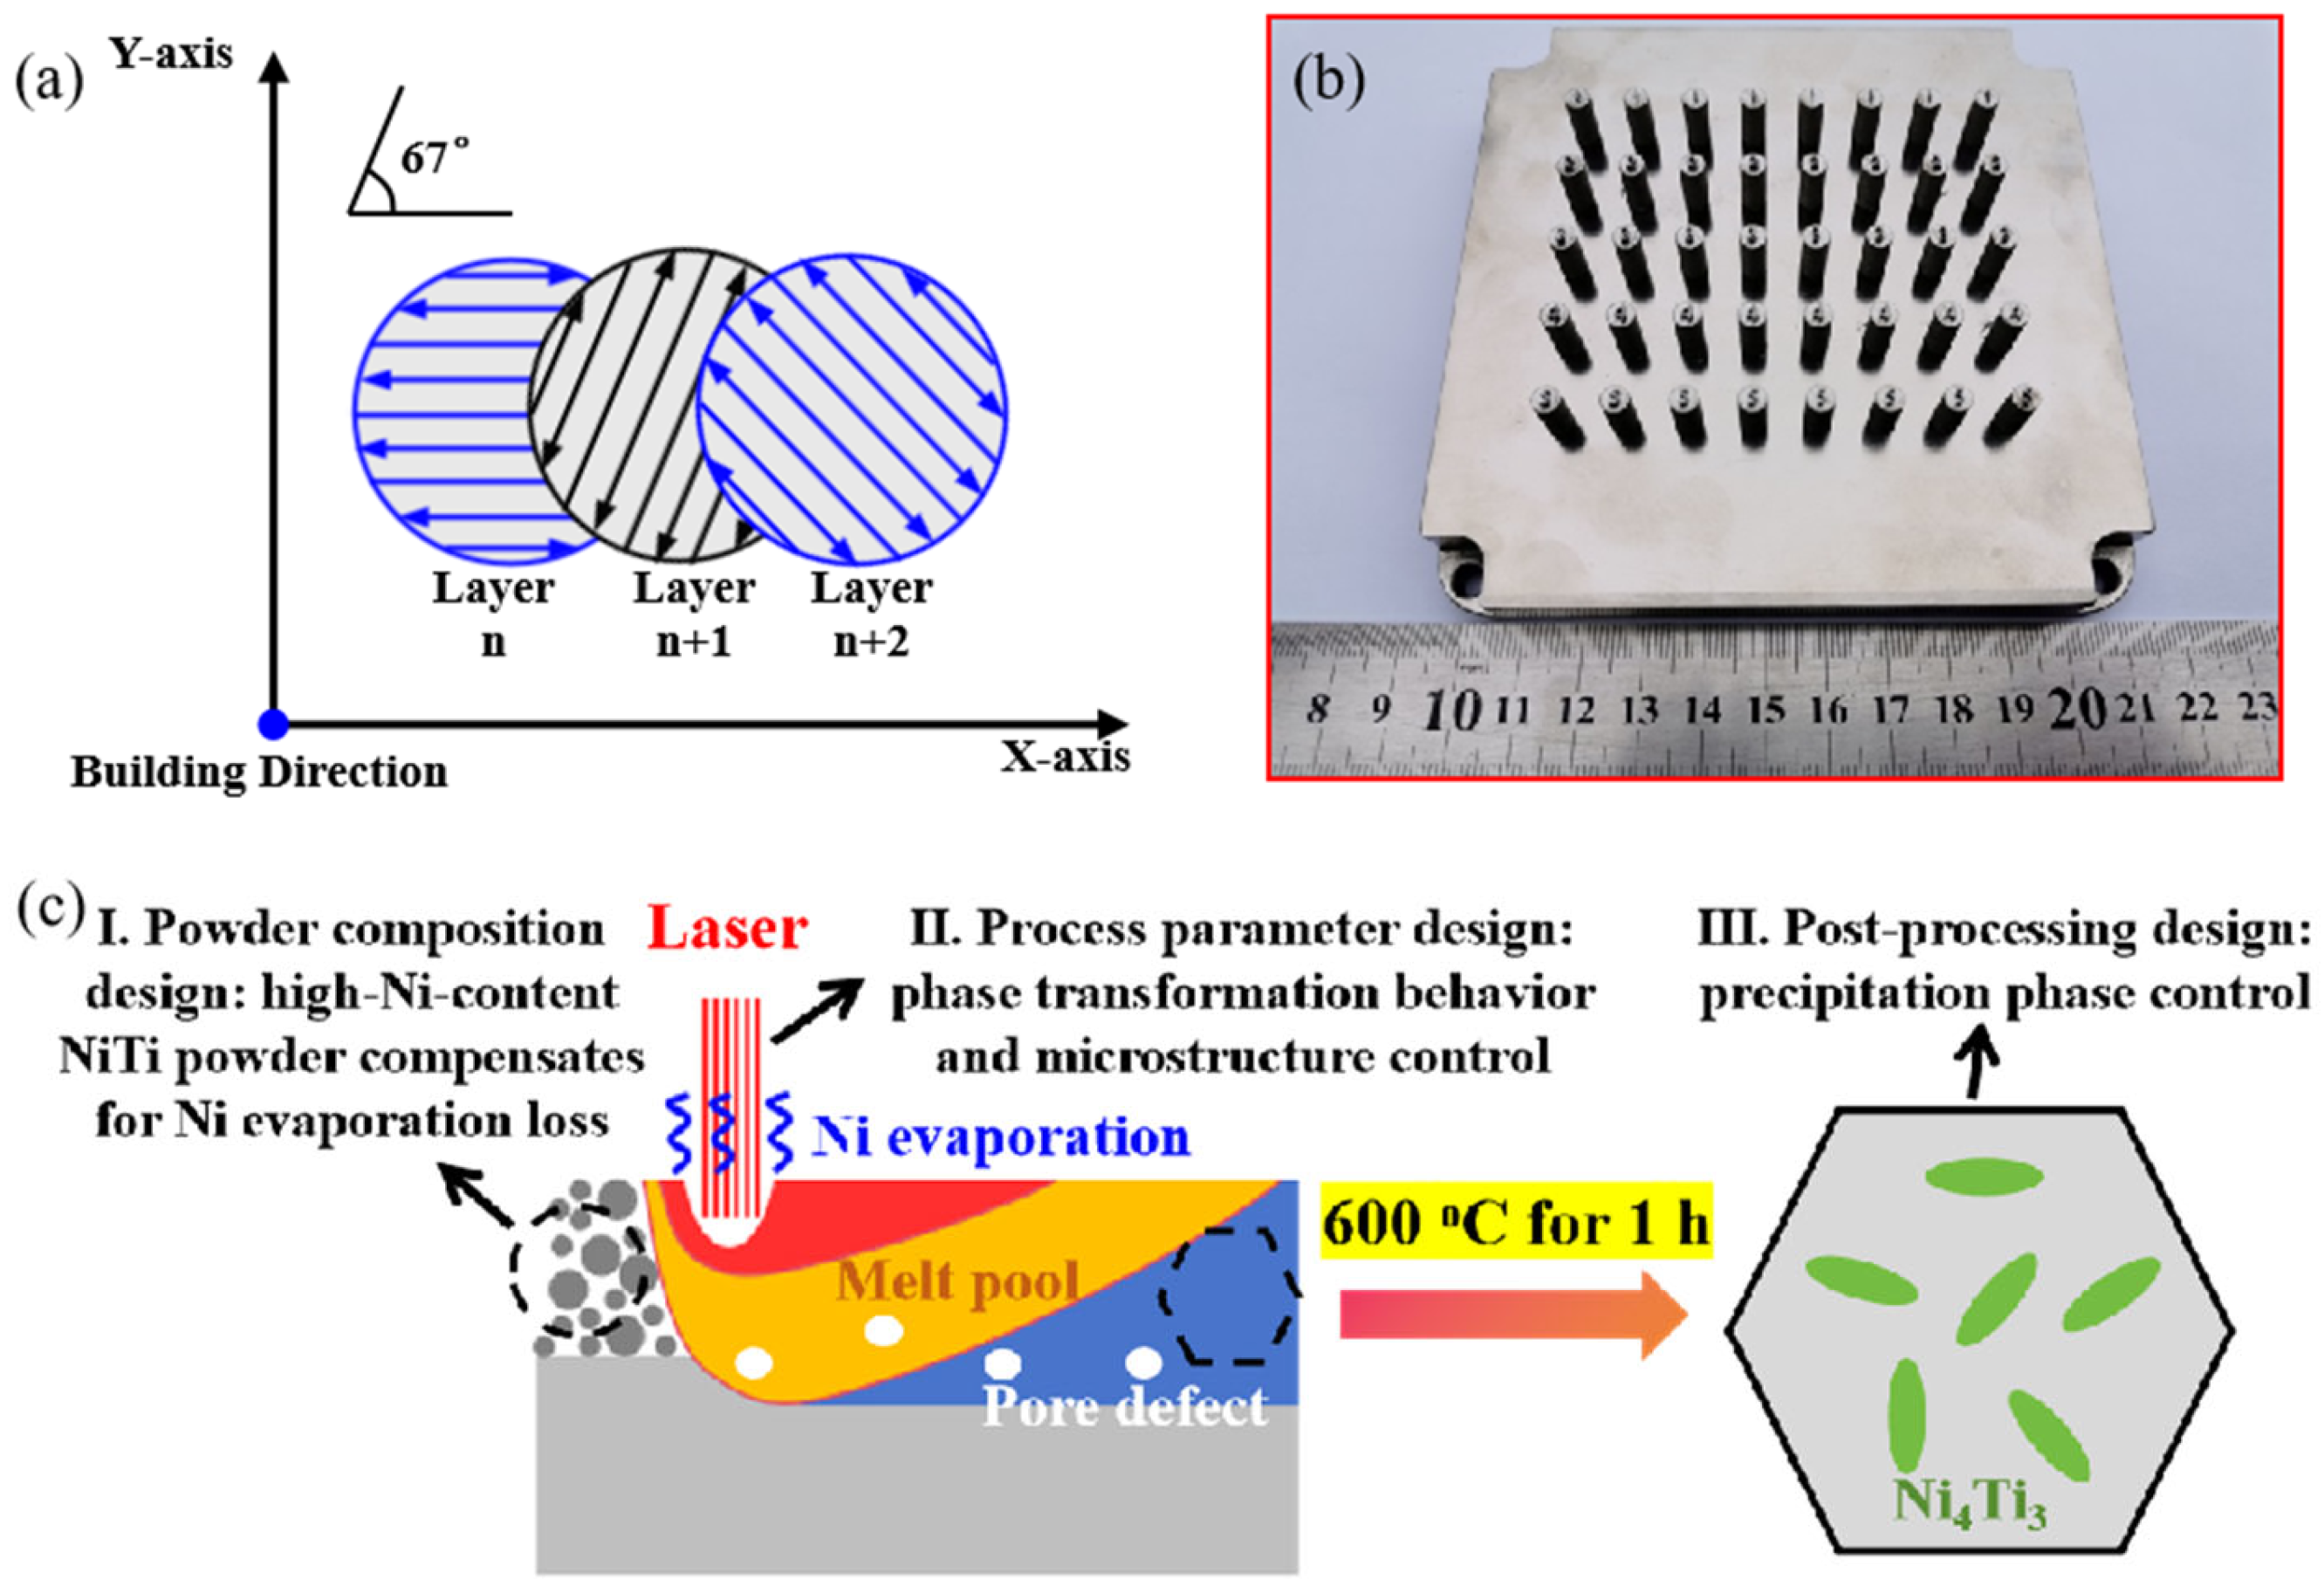
The Laser Powder Bed Fusion system (Nanjing University of Aeronautics and Astronautics, Nanjing, China) with a 200 W ytterbium fiber laser was used to fabricate Ni51.9Ti48.1 samples. The fabrication procedure was carried out under an argon atmosphere, which reduced the oxygen level to less than 60 ppm. Four groups of parameters were utilized to fabricate Ni51.9Ti48.1 samples, as shown in Table 2. The process parameters adopted were based on our previous work [25]. Within this parameter range, the NiTi alloys can be successfully formed without exhibiting severe cracking or oxidation. The energy density (E) is calculated by the equation E = P/(vht), where P is the laser power, v is the scanning velocity, h is the hatch spacing, and t is the layer thickness. The scanning strategy for all groups in the LPBF fabrication process is depicted in Figure 2a. The corresponding LPBFed cylindrical Ni51.9Ti48.1 samples with a length of 10 mm and a diameter of 4.5 mm are shown in Figure 2b. After printing, the Ni51.9Ti48.1 sample was cut using electrical discharge wire cutting, followed by post-processing annealing at 600 °C for 1 h, then air-cooled to room temperature. Figure 2c illustrates the triple optimization strategy employed in this work to achieve superior superelasticity in LPBFed NiTi alloys, comprising: I. Design of NiTi powder with high Ni content to compensate for Ni evaporation losses; II. Process parameter design to regulate phase transformation behavior and microstructure; and III. Post-processing design to control precipitate phase formation.

2.3. Property and Microstructure Characterization

The phase transformation temperature was tested by differential scanning calorimetry (DSC) (Hesheng Instrument Technology Co., Ltd., Shanghai, China) with a cooling/heating rate of 10 °C/min. During the DSC measurement, the samples were first cooled down to −150 °C to reach a fully martensitic state, after which the samples were heated up to 150 °C and then cooled down to −150 °C to investigate the reverse and forward martensitic transformations, respectively. The superelasticity behaviors at RT were studied using an electronic universal testing machine (SASTest Equipment Co., Ltd., Shenzhen, China) based on the corresponding compressive loading-unloading stress–strain responses. During the superelasticity tests, the electronic universal testing machine was under the displacement rate control mode with a strain rate of 1 × 10⁻⁴ s−1. Hardness was identified by an auto Vickers microhardness tester (SASTest Equipment Co., Ltd., Shenzhen, China) with a 500 g load at RT. The hardness values were obtained as the average of 10 measurements.
The defect volume fraction was investigated using micro-focus X-ray computed tomography (micro-CT) (Sanying Precision Instruments Co., Ltd., Tianjin, China) with a high-performance nanofocus X-ray tube. An X-ray diffractometer (XRD) (Haoyuan Instrument Co., Ltd., Dandong, China) with Cu-Kα radiation was used to identify the phase composition at RT with a scanning rate of 2°/min, and the tested surface was the top plane of the cylindrical Ni51.9Ti48.1 sample. Transmission electron microscope (TEM) observation was conducted at 200 kV by a field-emission transmission electron microscope equipped (GIQTEK Technology Co., Ltd., Hefei, China) with an energy dispersive spectrometer (EDS) for chemical composition analysis. TEM specimens were first ground to 100 μm using 2000-grit SiC paper and then polished using a precision ion polishing system.

3. Results

3.1. Defect and Martensitic Transformation Behavior

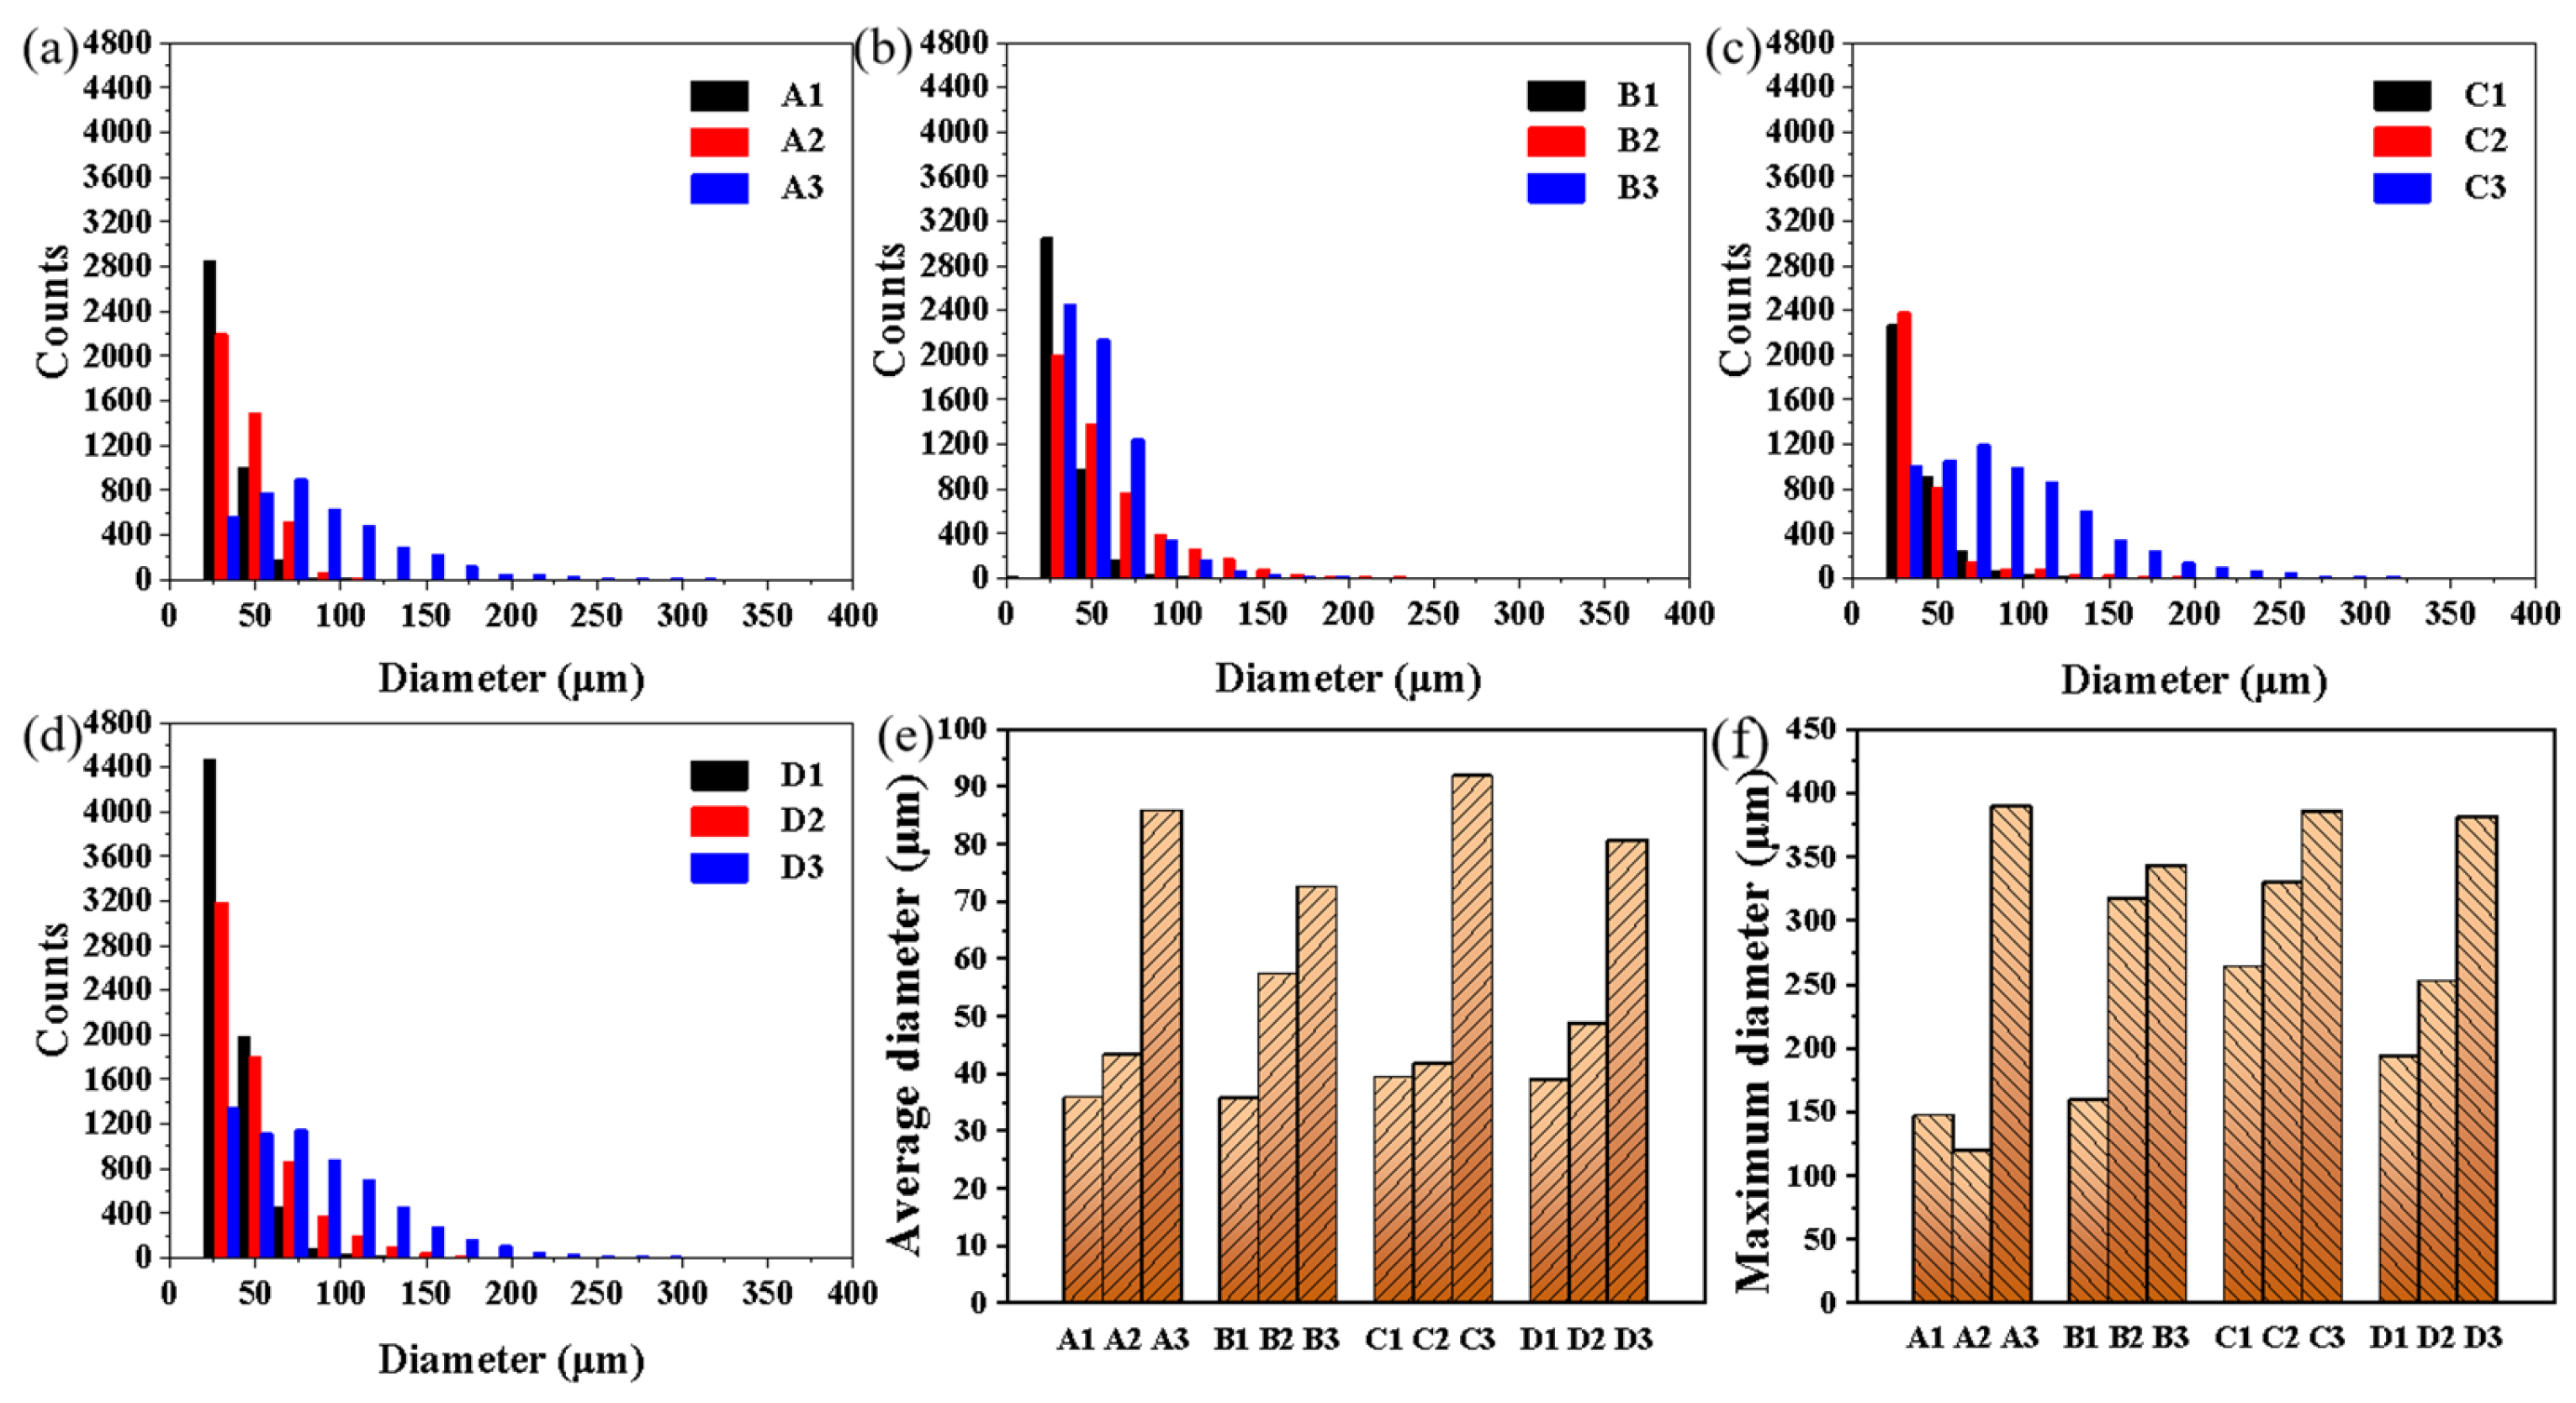
Figure 3 shows the micro-CT results for the Ni51.9Ti48.1 alloy fabricated by LPBF under different processing parameters. Within each group with the same laser power, the pore defect volume increases as the energy density increases. For different groups with nearly the same energy density, the pore defect volume increases as the laser power decreases. Based on the results in Figure 3, the diameter and number distribution of pore defects in Ni51.9Ti48.1 alloys prepared by different processes were statistically analyzed, as shown in Figure 4. It can be observed that for the lower energy density samples A1, B1, C1, and D1, the vast majority of pore defects have diameters less than 50 µm. As the energy density increases, the number of pores with diameters less than 50 µm decreases in the Ni51.9Ti48.1 alloys, while the number of pores with diameters greater than 50 µm increases. Further statistics on the average and maximum diameters of pore defects in the Ni51.9Ti48.1 samples are shown in Figure 4e,f. It can be observed that for the A1, B1, C1, and D1 samples prepared at low energy density, the average diameters of pore defects are 35.78 µm, 35.66 µm, 39.33 µm, and 38.85 µm, respectively, with maximum diameters of 147.00 µm, 158.86 µm, 263.29 µm, and 193.21 µm, respectively. In contrast, for the high-energy-density prepared samples A3, B3, C3, and D3, both values increased sharply, with average pore defect diameters reaching 85.76 µm, 72.43 µm, 91.81 µm, and 80.54 µm, respectively, and maximum diameters reaching 389.00 µm, 342.49 µm, 384.84 µm, and 381.00 µm, respectively. Furthermore, since the annealing temperature did not reach the liquidus temperature of the NiTi alloy, the size of the pore defects remained unchanged before and after annealing.
Figure 5 shows the DSC curves and corresponding phase transition peaks of the LPBFed Ni51.9Ti48.1 alloys fabricated using different processing parameters. For each group with identical laser power, as the energy density increases, the martensite start temperature (Ms), austenite finish temperature (Af), and thermal hysteresis Δ(AfMs) progressively increase. Similarly, within groups featuring nearly identical energy densities, these parameters also exhibit a gradual upward trend as laser power increases.
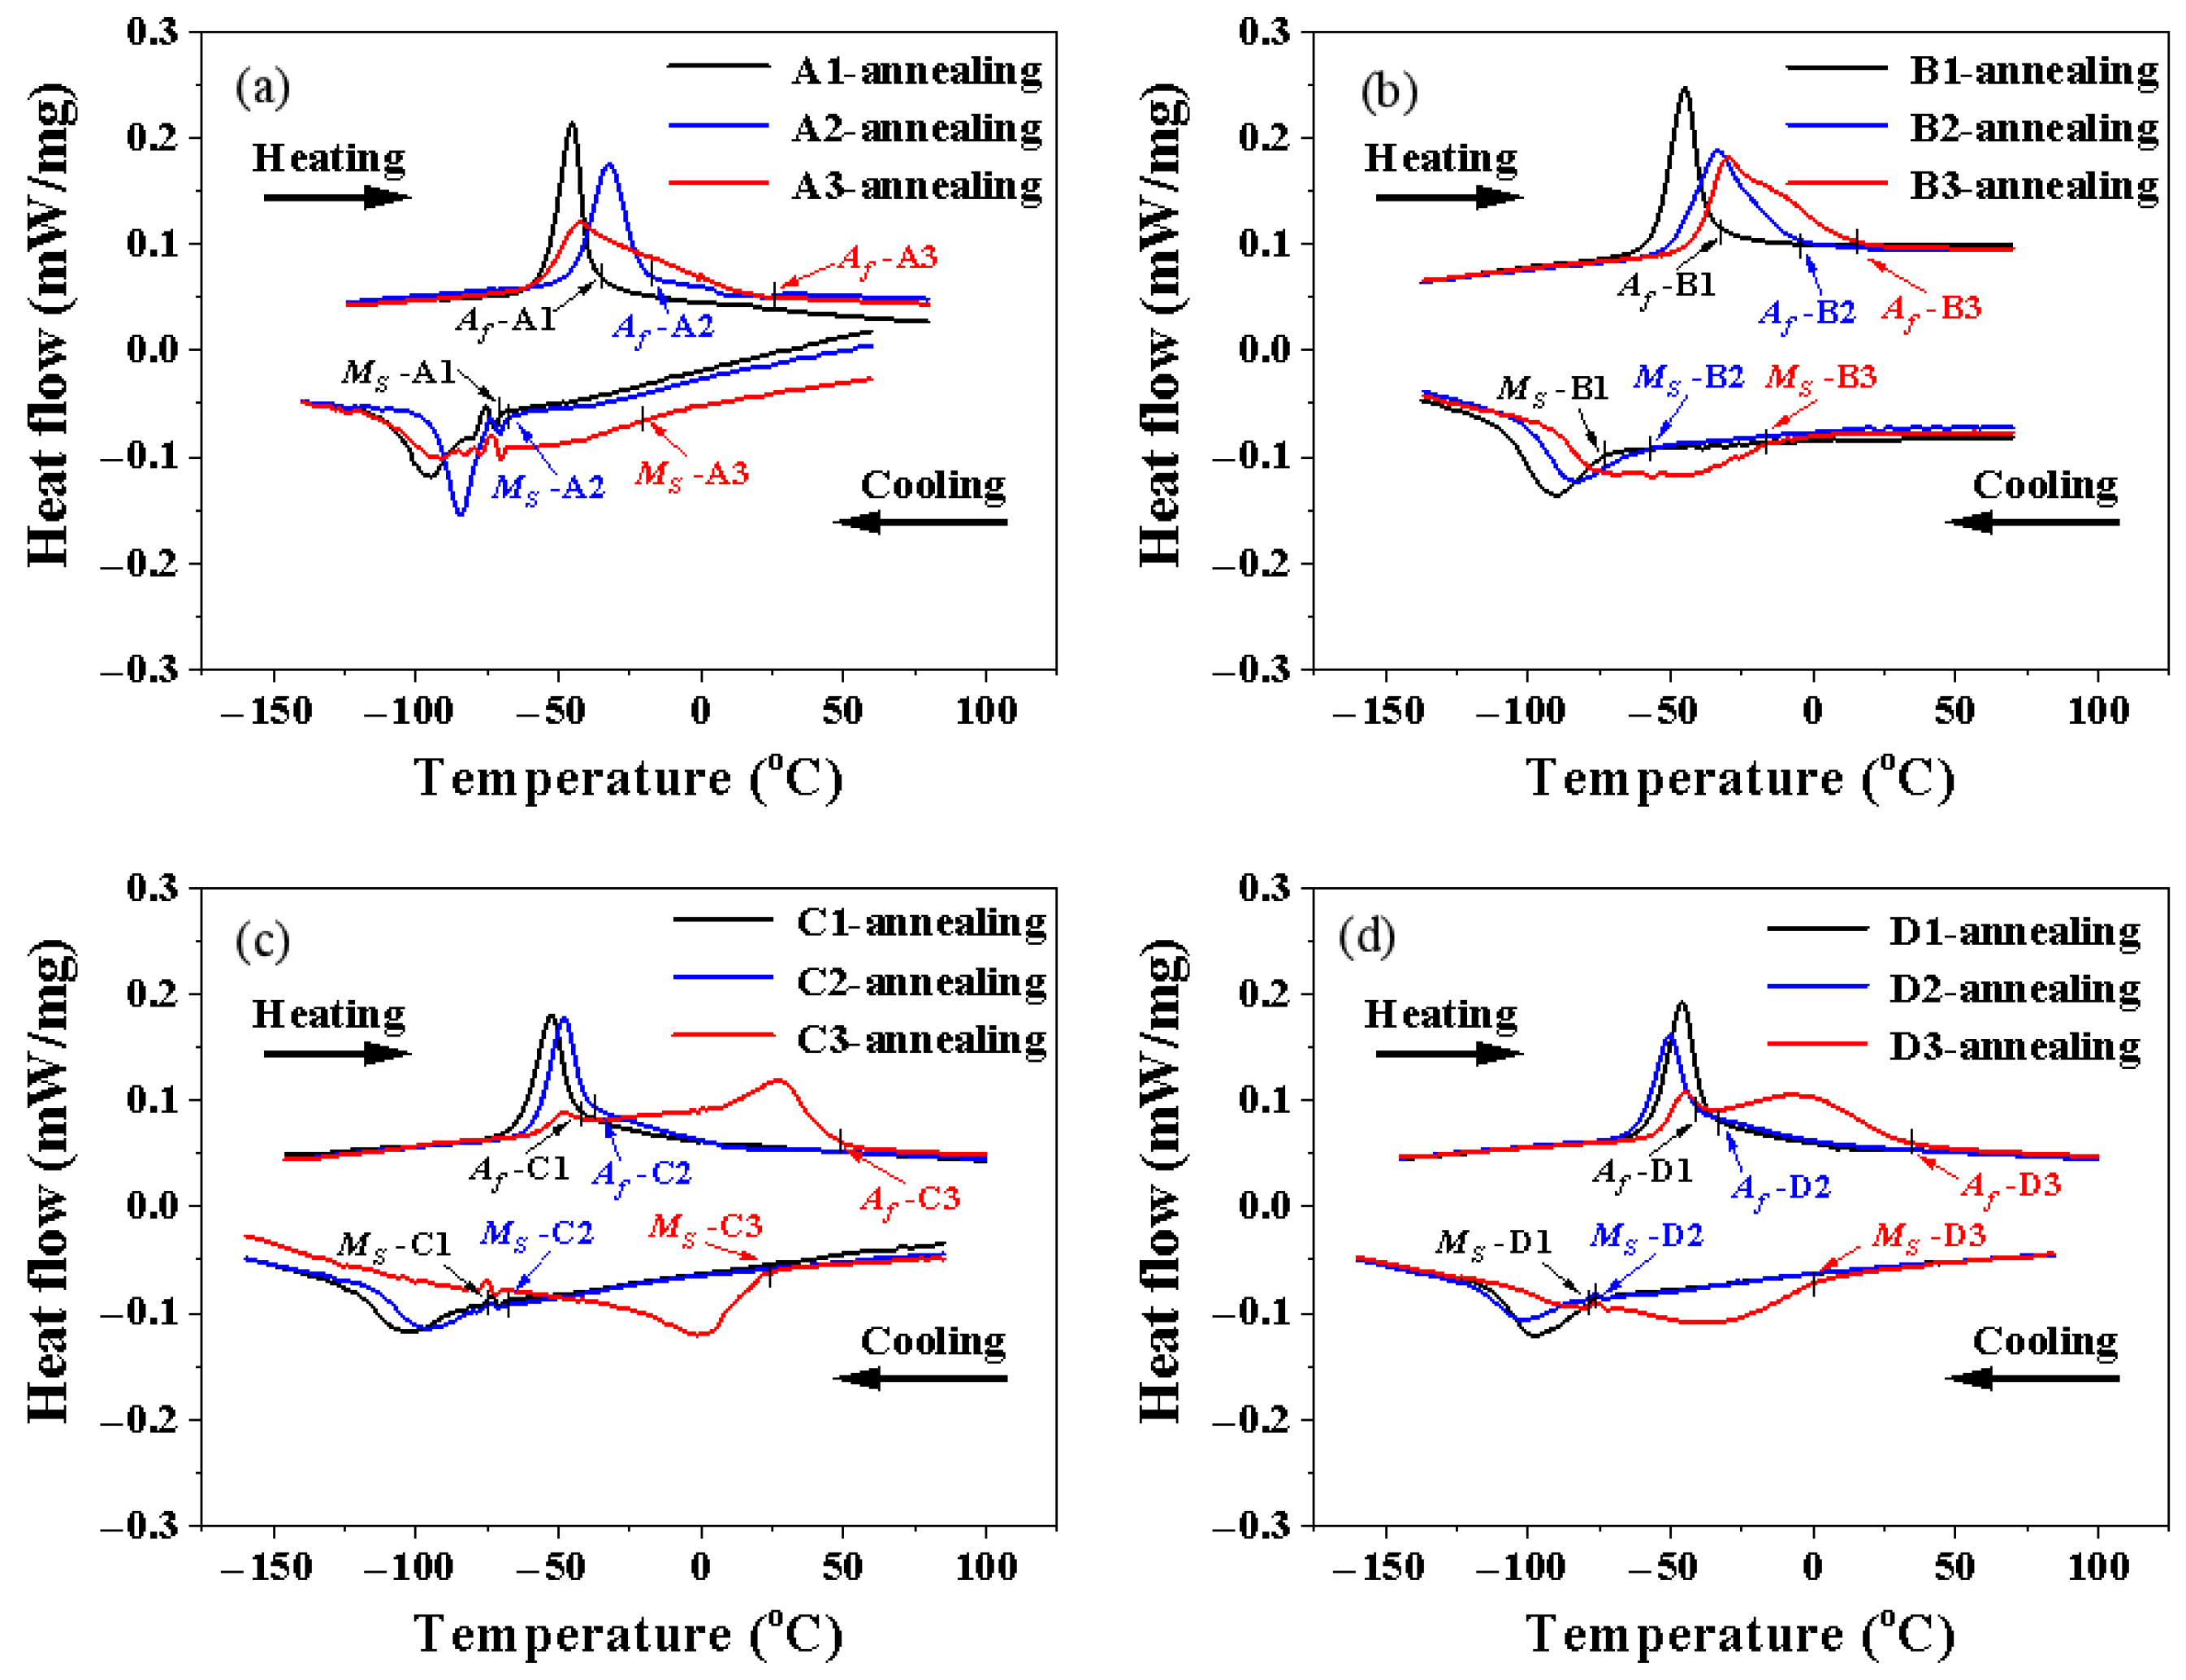
Figure 6 shows the DSC curves for the LPBFed Ni51.9Ti48.1 alloy fabricated using different processing parameters after annealing at 600 °C. For each group, a single transformation peak can be observed in samples prepared using low energy density and medium energy density (samples numbered 1 and 2), while a broader transformation peak can be clearly observed in samples prepared using higher energy density (samples numbered 3). Moreover, it is interesting that some small shoulder peaks appear in the DSC curves as the energy density increases. The phase transition temperatures and thermal hysteresis of different samples were statistically analyzed using the tangent method, as shown in Table 3. It should be noted that the phase transition temperatures (Ms and Af) of all samples decreased to varying degrees after annealing, while the thermal hysteresis Δ(AfMs) increased to varying degrees.

3.2. Hardness and Superelasticity

Figure 7 shows the room-temperature hardness of LPBFed Ni51.9Ti48.1 alloys before and after annealing at 600 °C. It can be observed that, within groups sharing the same laser power, hardness gradually decreases with increasing energy density. This is attributed to the higher phase transformation temperature of Ni51.9Ti48.1 alloys printed at high energy densities, which reduces the difficulty of inducing stress-induced martensitic transformation. Additionally, larger porosity defects in samples fabricated at high energy densities also contribute to the hardness reduction. For the Ni51.9Ti48.1 alloy after annealing, its hardness trend is similar to that before annealing; however, the hardness is significantly increased. This enhancement can be attributed to the formation of precipitated phases such as Ni4Ti3 during annealing, which contribute to precipitation hardening. Among all samples, the annealed A1 sample demonstrates the highest room-temperature hardness of 328.8 HV, a value comparable to that of as-cast NiTi alloys.
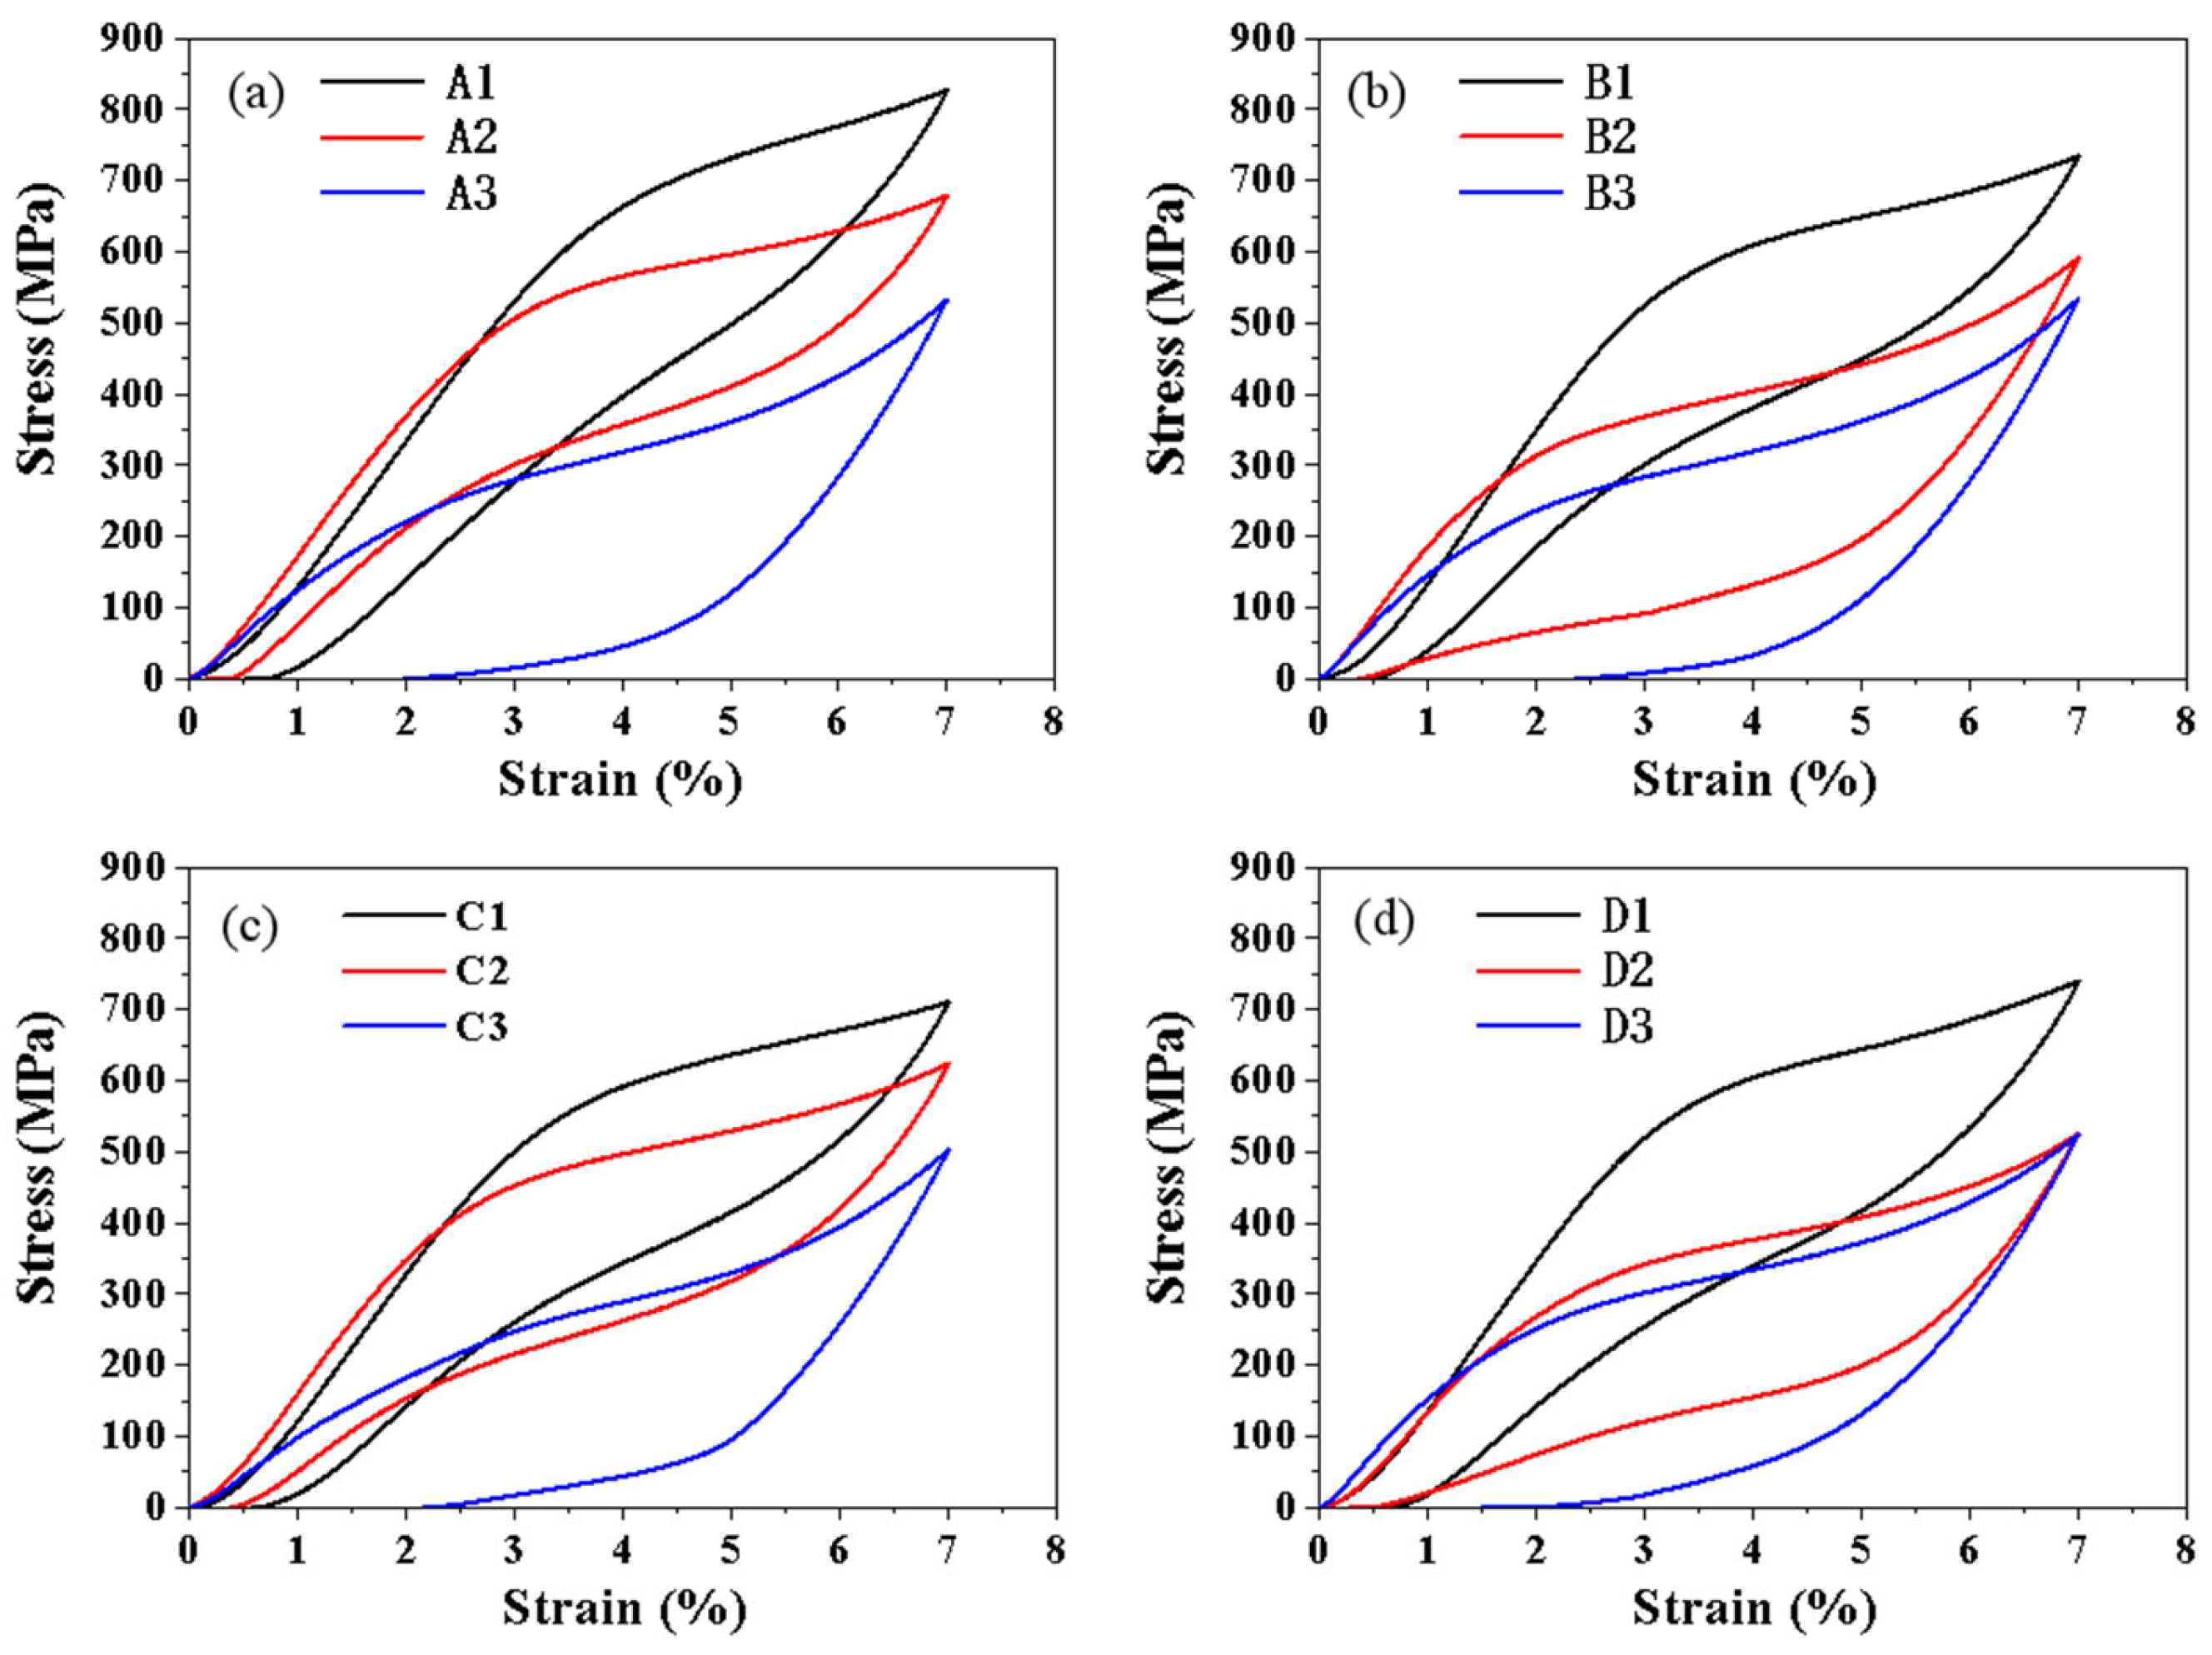
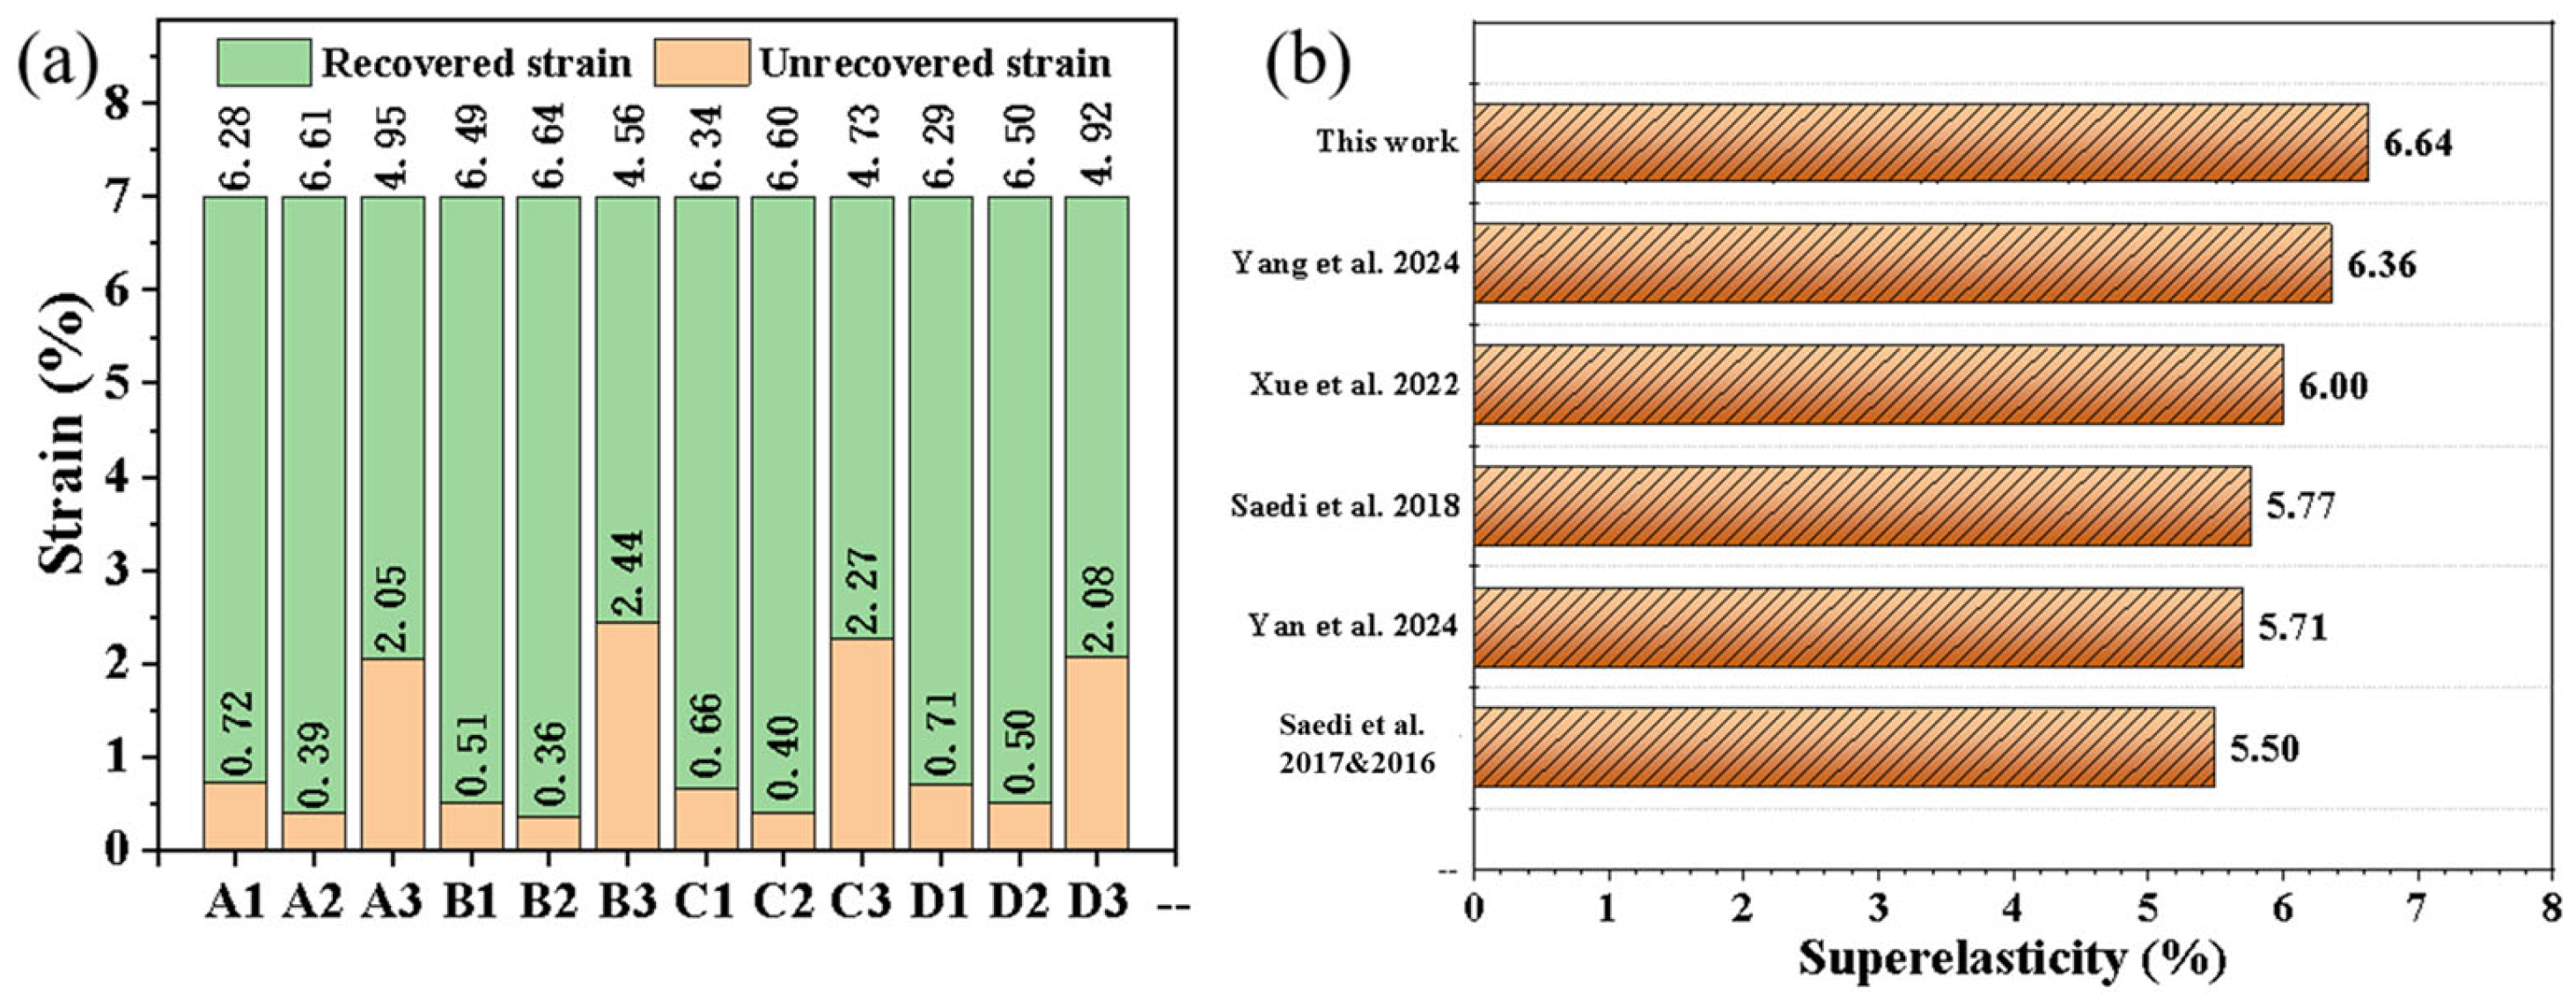
Figure 8 shows the superelastic behavior at RT for the LPBFed Ni51.9Ti48.1 alloy after annealing at 600 °C. The recovery strain and residual strain for each sample are summarized in Figure 9a. It can be observed that within each group, samples prepared at lower and medium energy densities (samples numbered 1 and 2) exhibited superior superelastic properties, with recovery strains exceeding 6.28% after unloading, reaching a maximum of 6.64%. In contrast, samples prepared at higher energy density (samples numbered 3) showed significantly degraded superelastic performance, with recovery strains below 4.95% after unloading. Figure 9b compares the highest superelasticity achieved in this work with that from other published studies. It can be seen that the triple optimization design employed in this work significantly enhances the superelastic properties of LPBFed NiTi alloys.

3.3. Microstructure

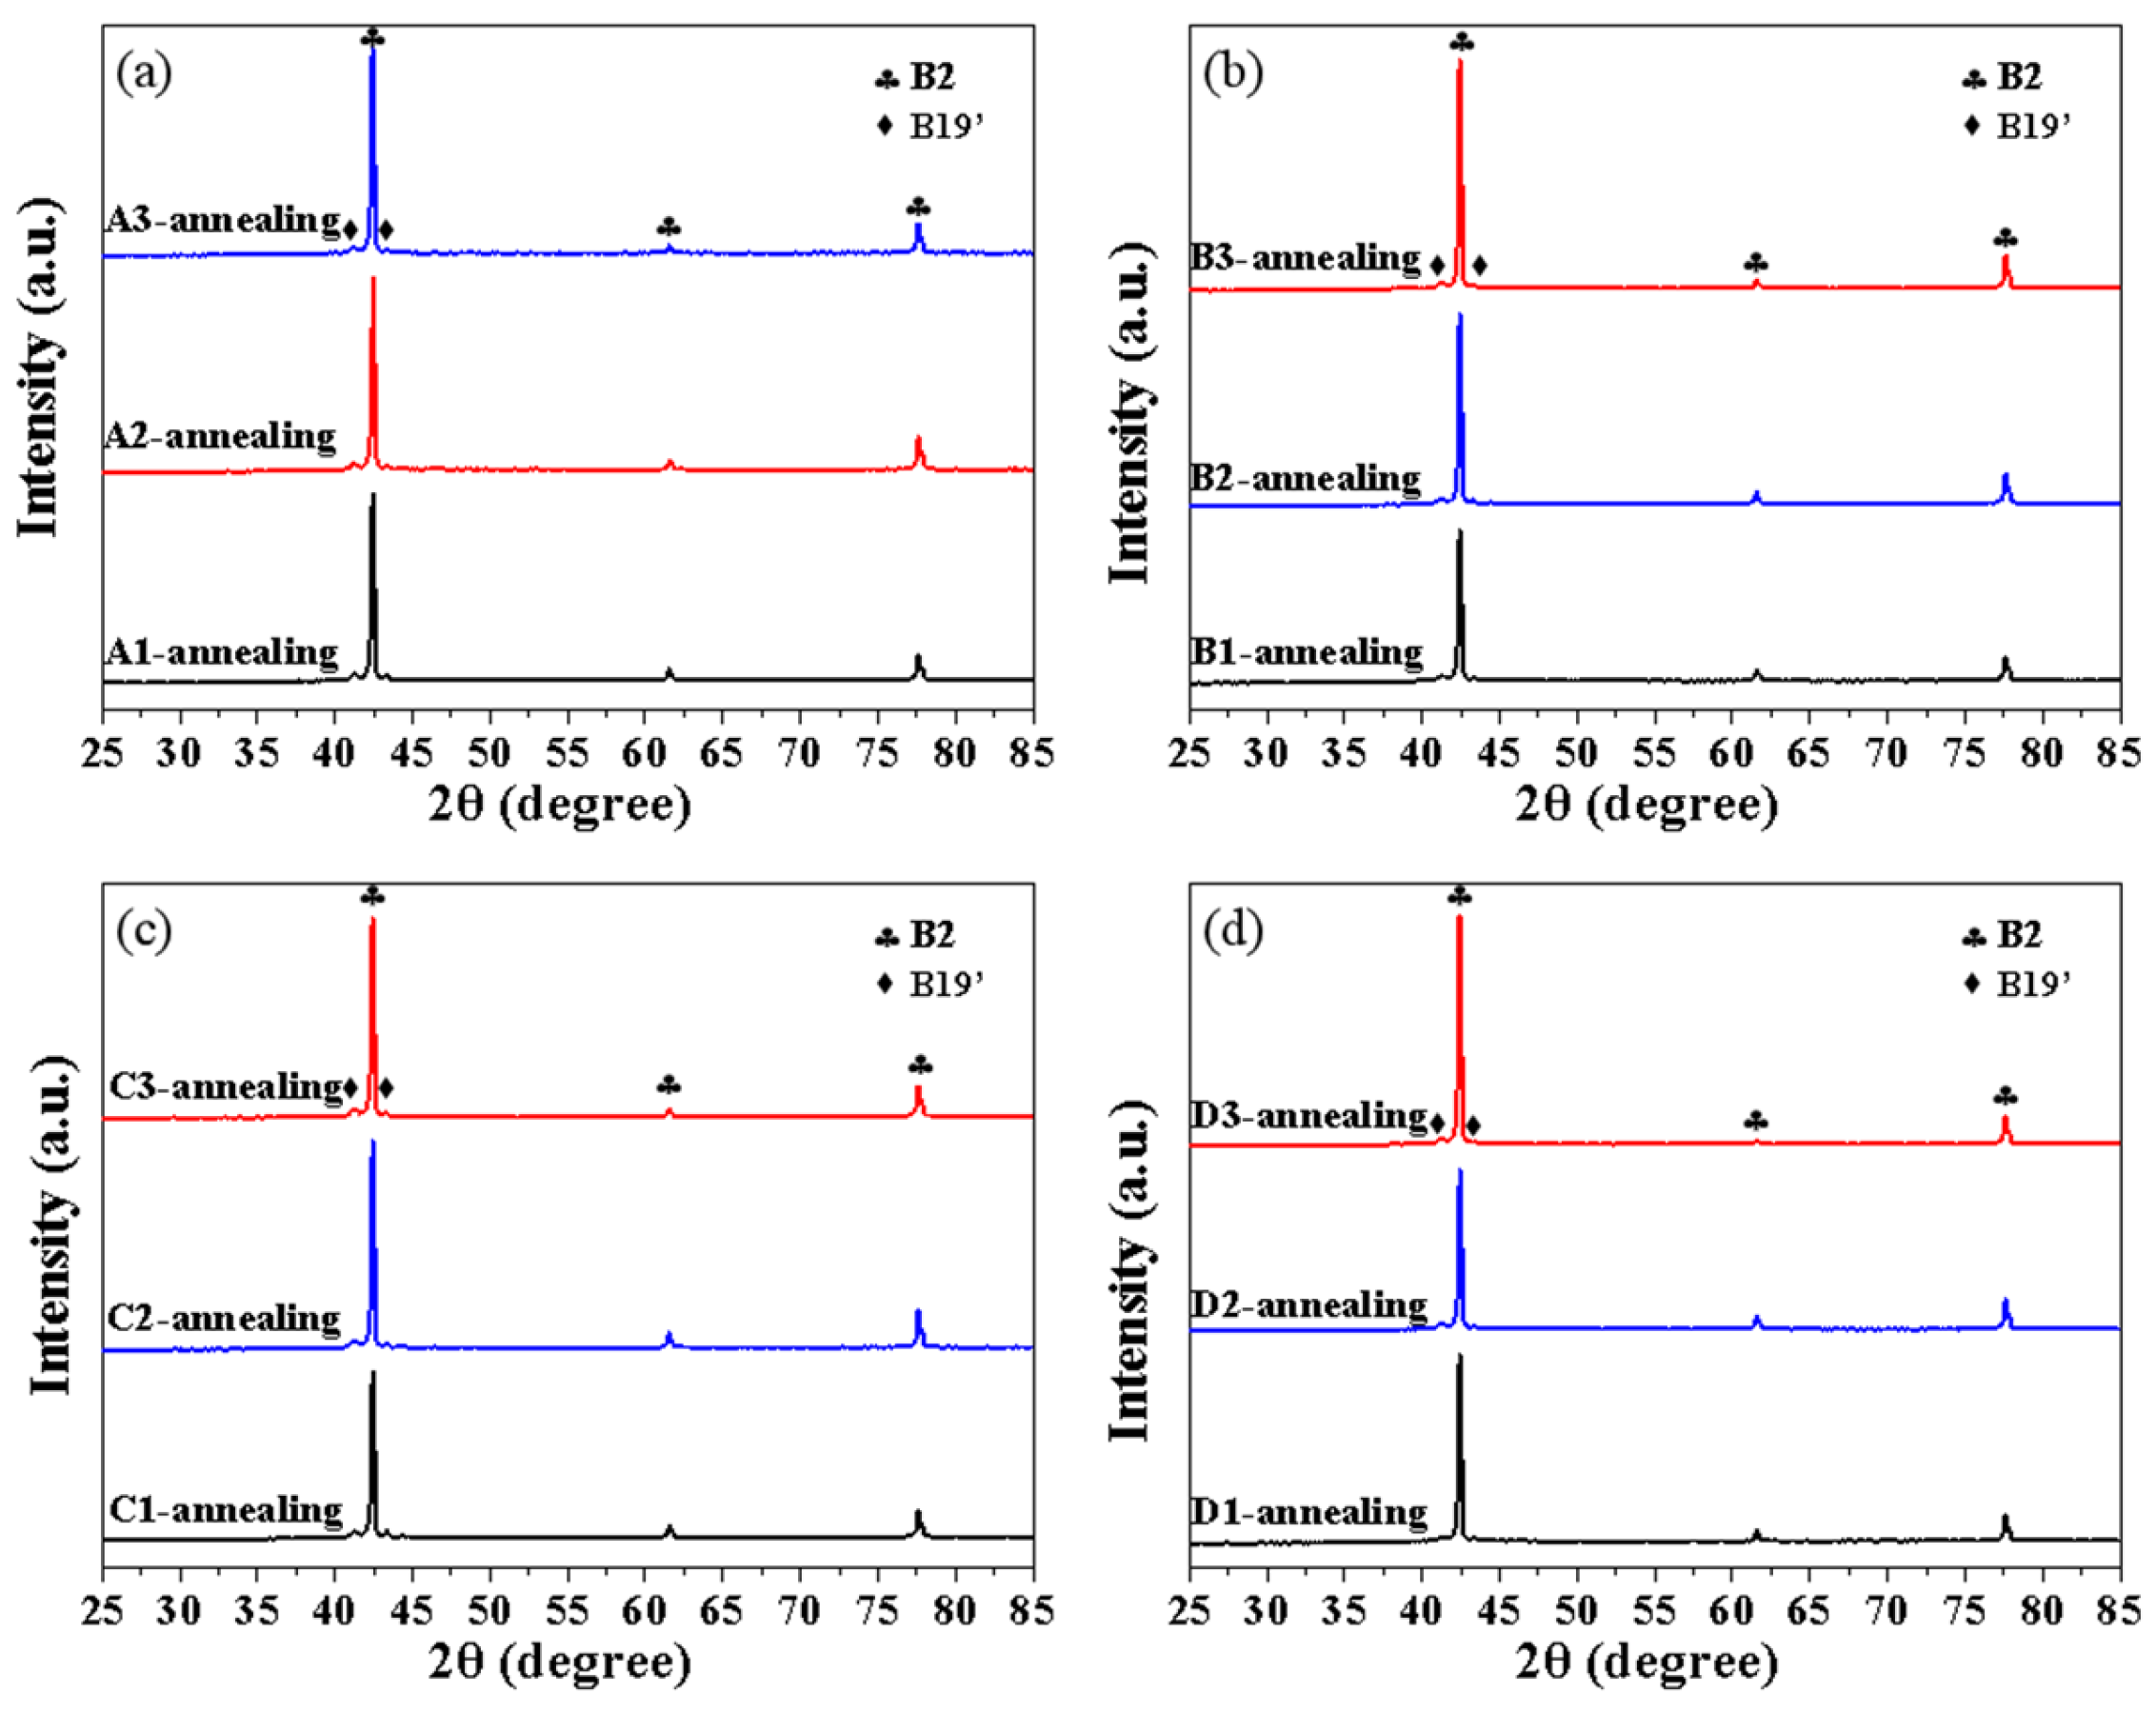
Figure 10 shows the XRD patterns at RT for the LPBFed Ni51.9Ti48.1 alloy under different processing parameters. Strong diffraction peaks of B2 and weak diffraction peaks of B19′ are observed in each group. After annealing, the diffraction peaks of B2 become stronger, while the diffraction peaks of B19′ become very weak, as shown in Figure 11.
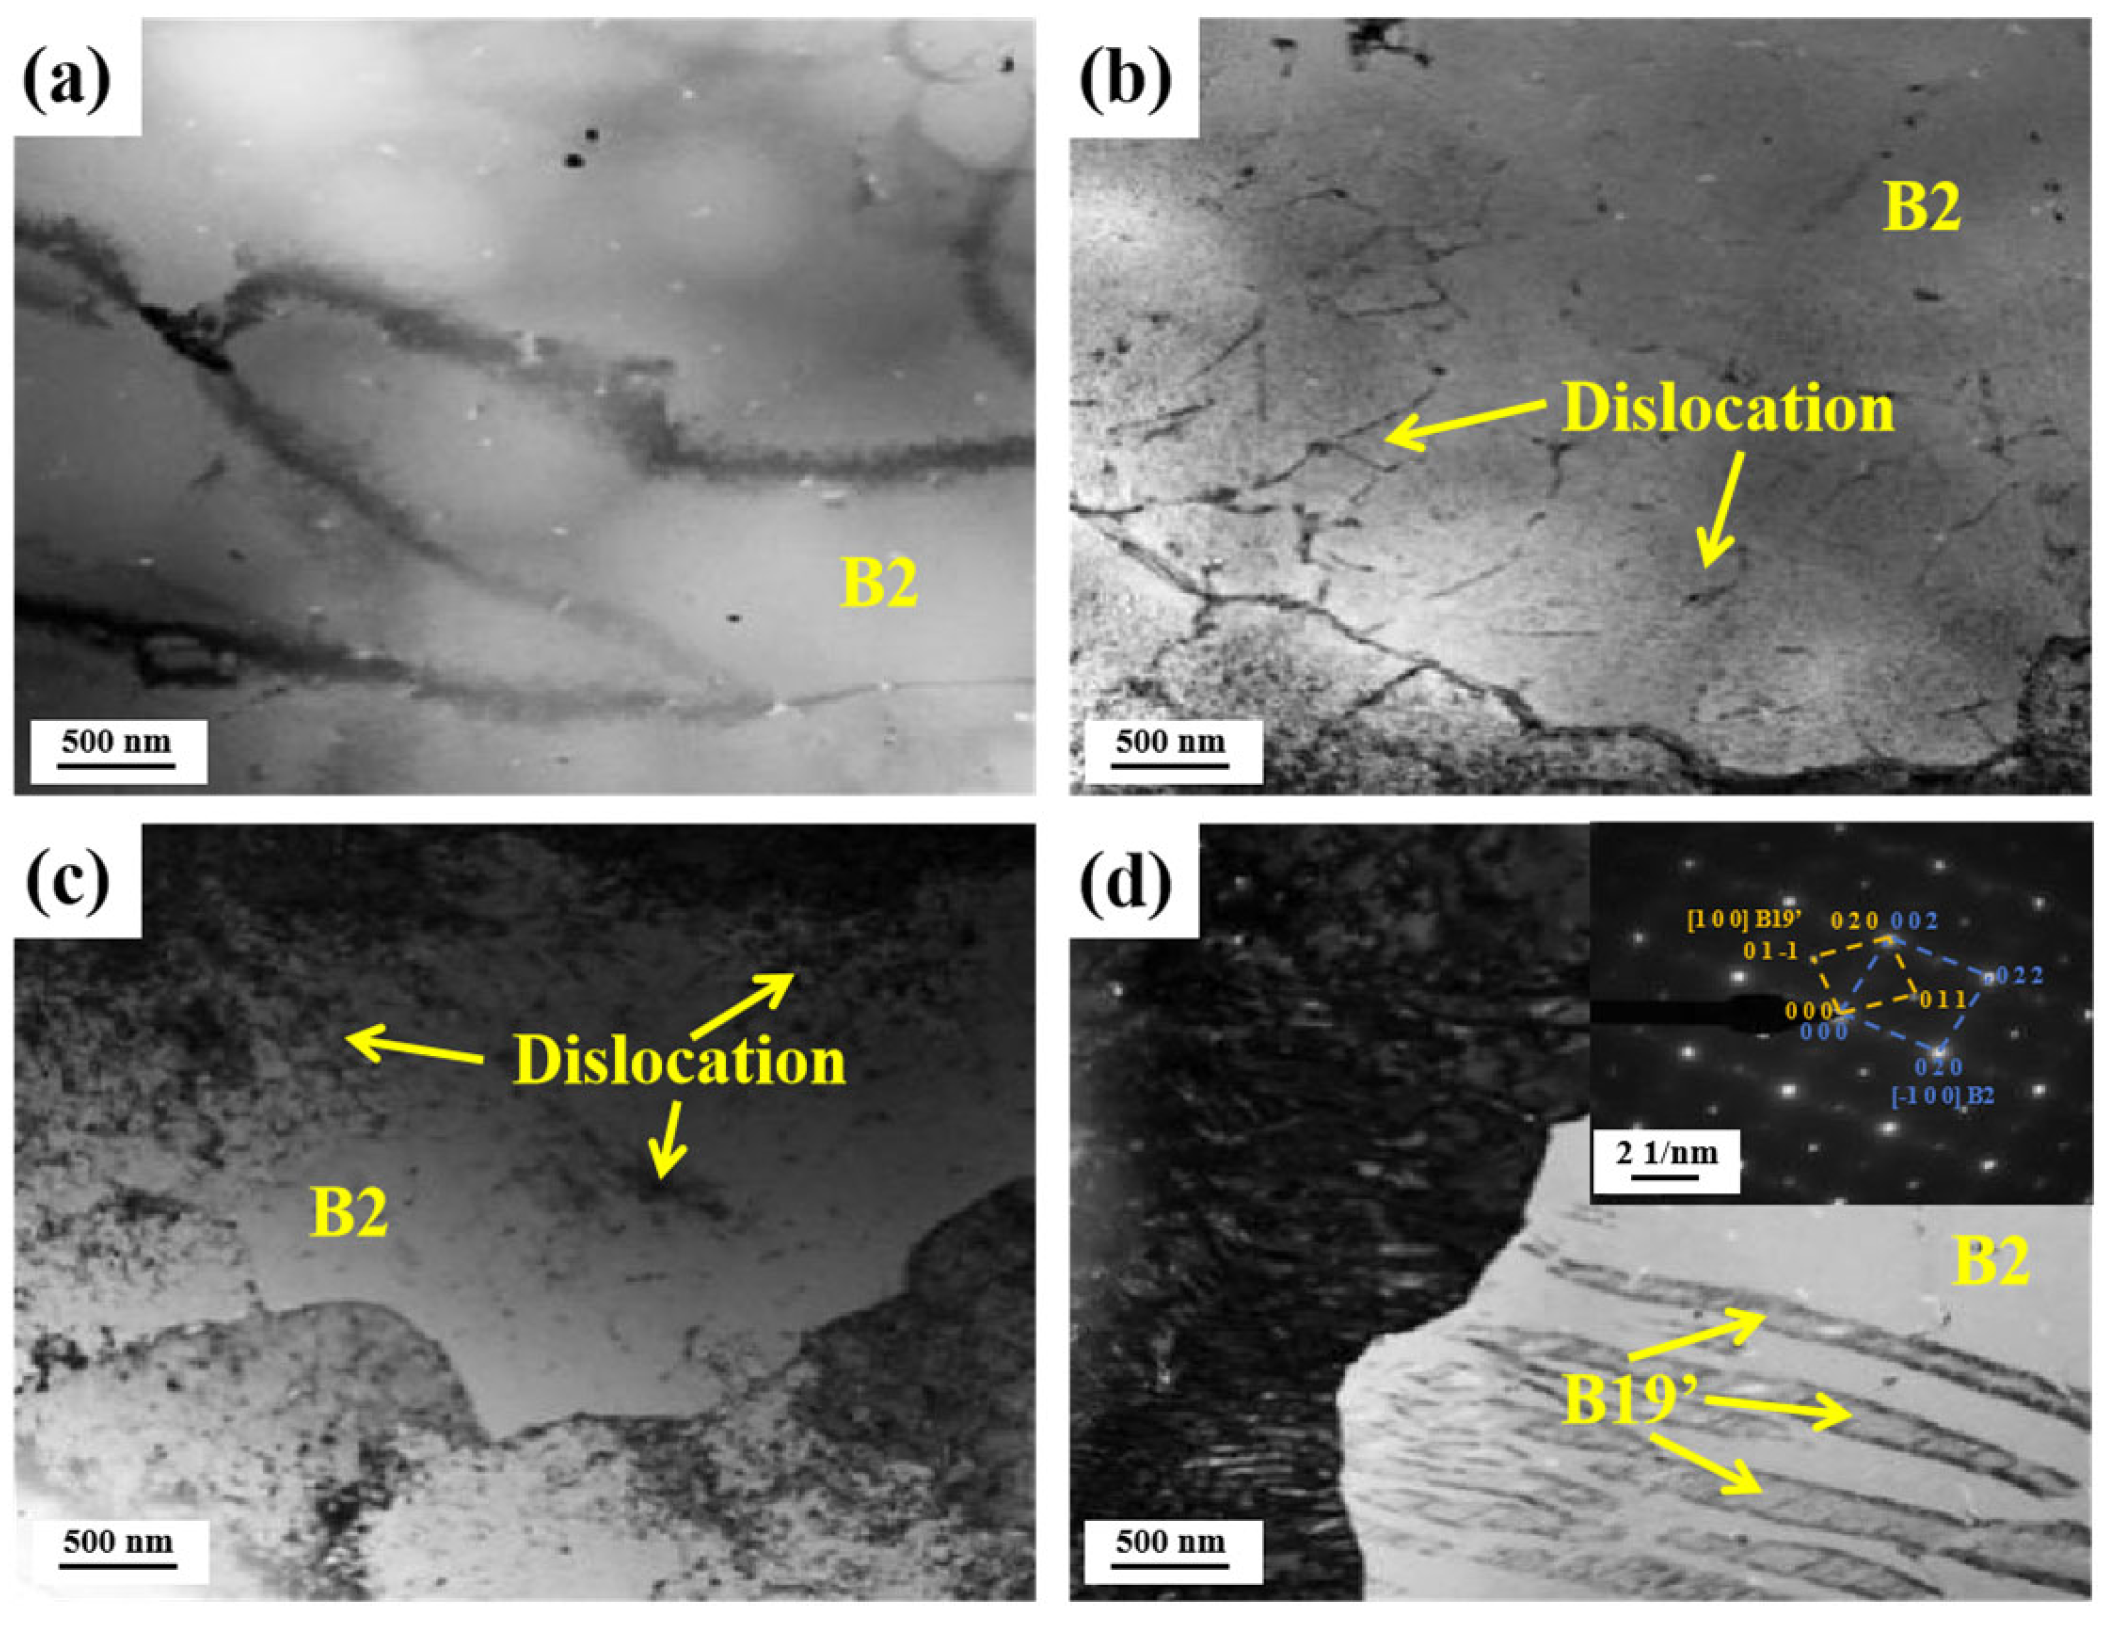
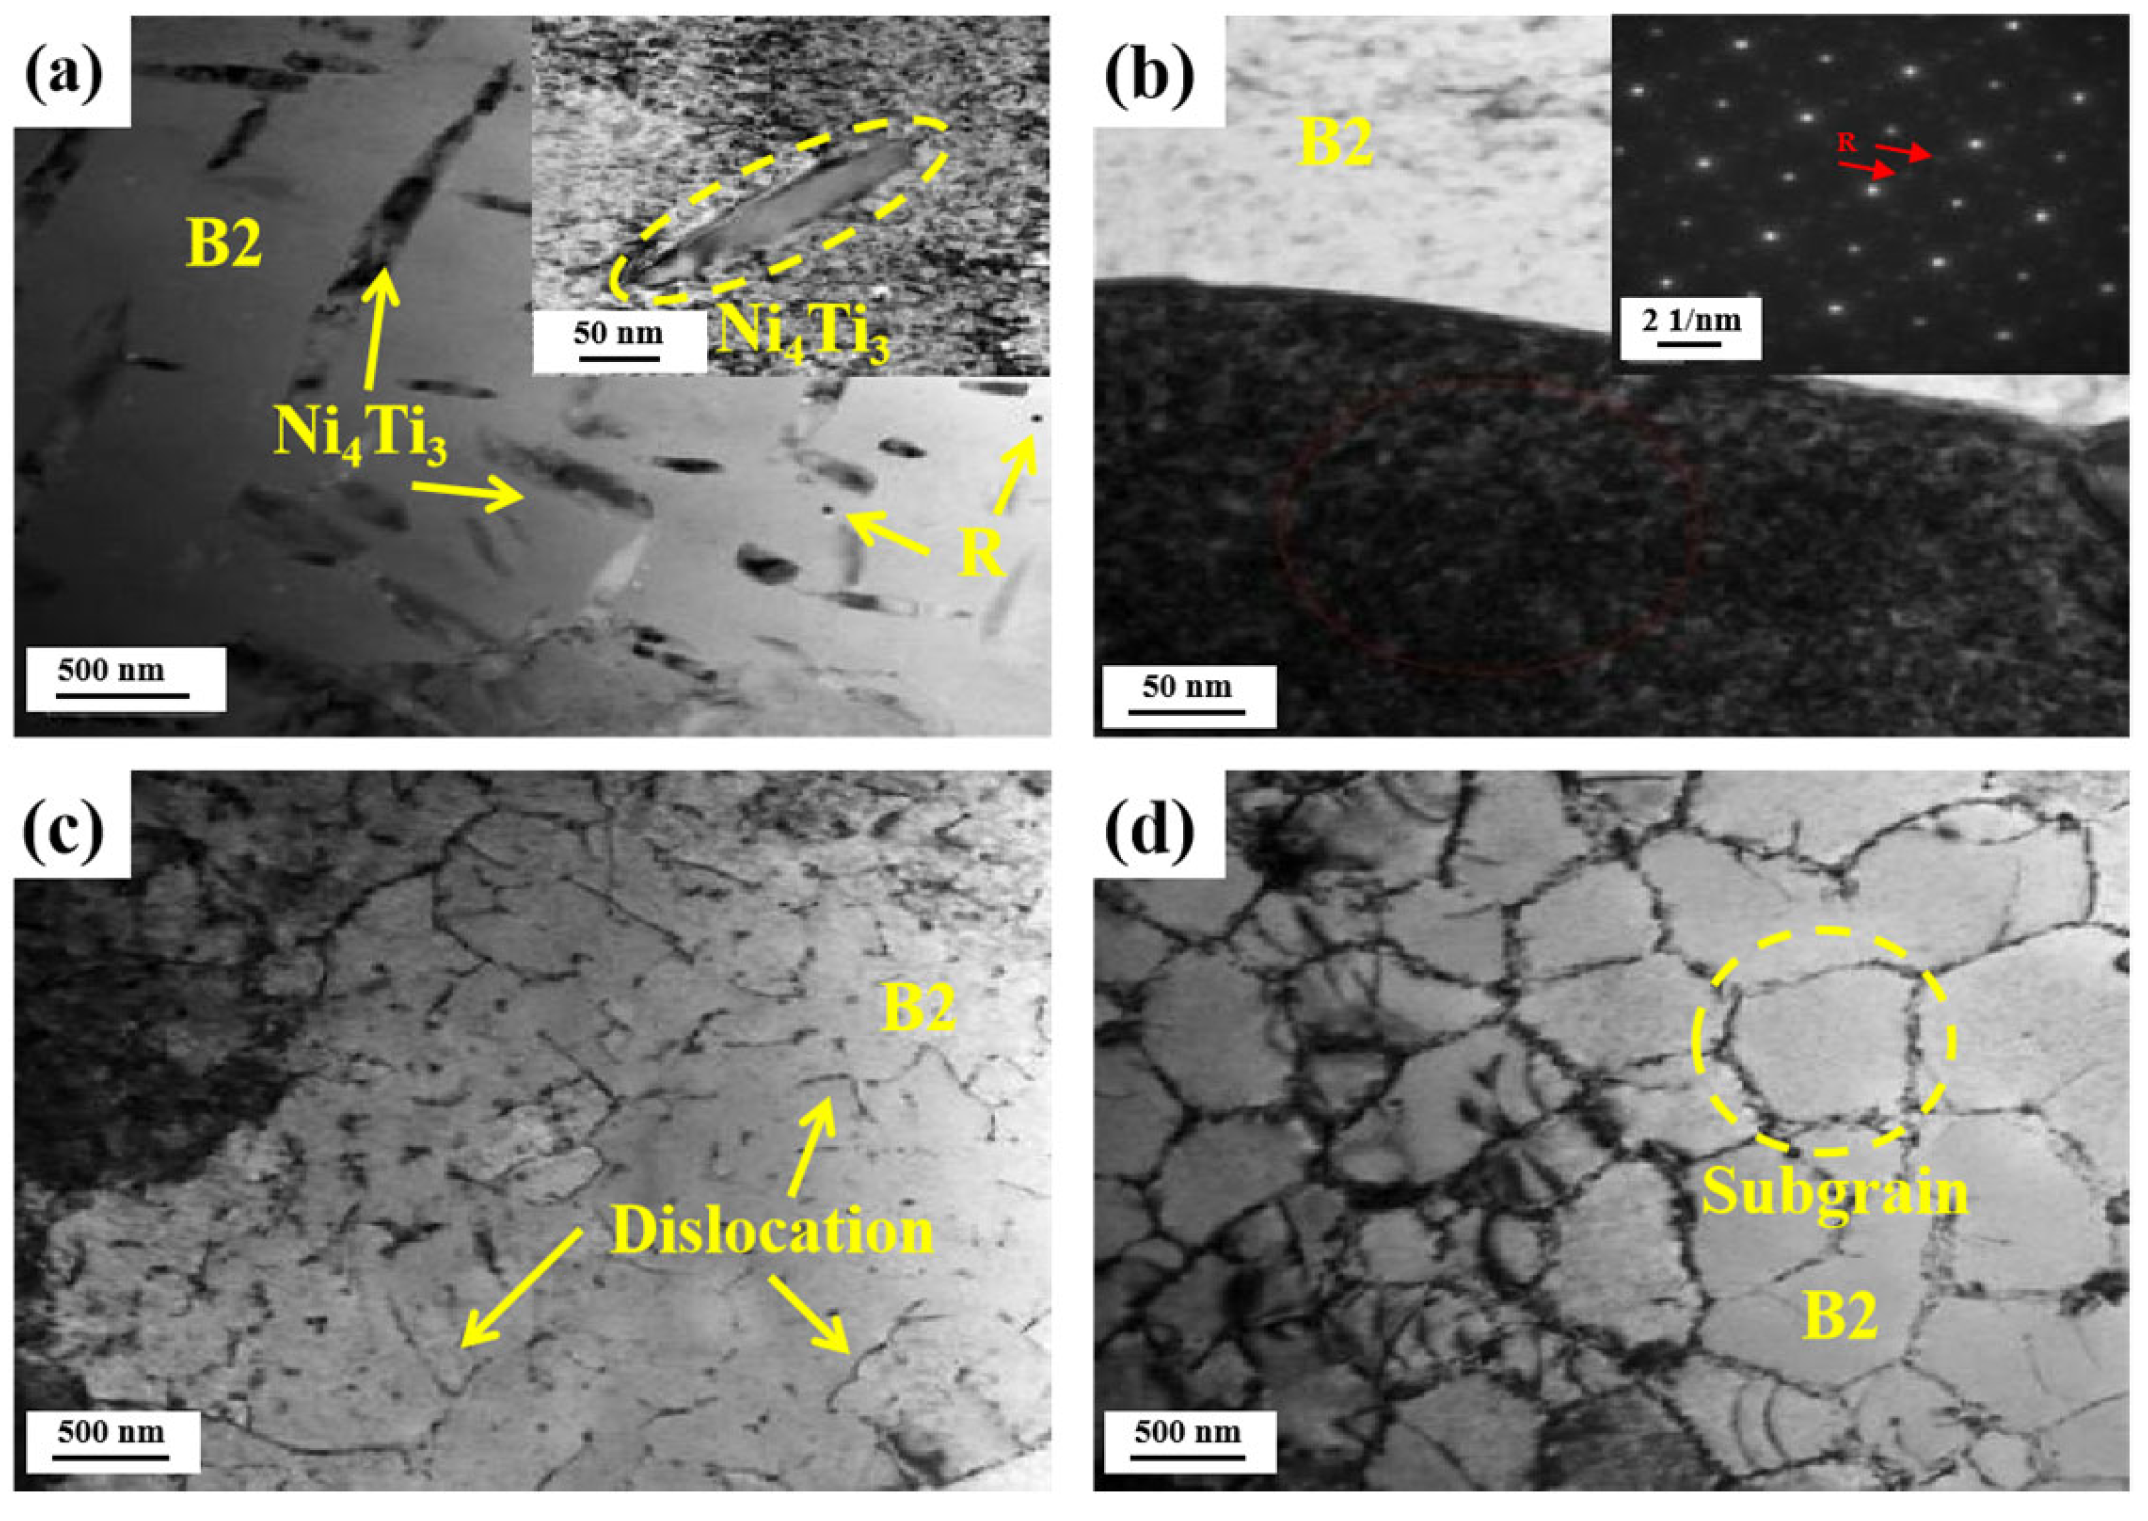
Figure 12 shows the TEM images of the LPBFed Ni51.9Ti48.1 alloys processed under different processing parameters. For the LPBFed A2 sample, the matrix is observed to be B2 austenite with a BCC crystal structure, consistent with DSC and XRD results. Additionally, a small number of dislocation defects are distributed in the B2 matrix of the LPBFed A2 sample (Figure 12b). With the increase in energy density, the LPBFed A3 sample exhibits a denser dislocation network within its B2 austenite matrix (Figure 12c), accompanied by the formation of B19′ martensite plates (Figure 12d). Figure 13 shows the TEM images of the LPBFed Ni51.9Ti48.1 alloys after annealing at 600 °C. For the annealed A2 sample, the matrix remains B2 austenite, but additional lens-shaped Ni4Ti3 precipitates and circular R-phase particles have formed. In contrast, for the annealed A3 sample, dislocation clustering in the B2 matrix has led to the formation of subgrains.

4. Discussion

4.1. Effects of Laser Parameters and Annealing on Martensitic Transformation Behavior

The phase transition temperature of nickel-titanium alloys produced by LPBF is related to nickel evaporation, oxygen absorption, and precipitation during the melting process [26,27,28]. For samples prepared at low and medium energy densities (samples numbered 1 and 2), the phase transition temperature remains low due to limited Ni evaporation loss. In contrast, the phase transition temperature of the samples prepared at high energy density (samples numbered 3) increases significantly due to increased Ni evaporation loss, which is consistent with previous work [15,29]. The increased Ni evaporation loss at higher energy densities stems from greater laser energy input, which elevates the peak temperature of the melt pool, enlarges its size, and prolongs its lifetime. This sequence of events enhances the rate, area, and duration of selective Ni evaporation [30].
Additionally, samples prepared using low and medium energy densities exhibit broad peaks, which can be attributed to compositional inhomogeneity [31,32]. Conversely, samples prepared using high energy densities display relatively narrow peaks. This is due to the enhanced Marangoni forces within the melt pool under high-energy-density laser irradiation, which promote fluid flow and compositional homogenization [33,34]. It is noteworthy that, due to the higher cooling rate resulting from the high energy density, residual stresses in samples prepared via high energy density are amplified, leading to the generation of more dislocations.
After annealing at 600 °C, the phase transformation temperatures of all alloys decreased. Notably, the martensitic transformation temperatures of alloys A1 and A2 decreased significantly by 70 °C. Such a substantial reduction in the martensitic transformation temperature should be attributed to the precipitation of the Ni4Ti3 phase. Although the formation of Ni4Ti3 precipitates reduces the Ni/Ti ratio in the matrix, the small inter-precipitate spacing suppresses martensite formation. Simultaneously, annealing promotes compositional homogenization, resulting in narrower phase transformation peaks in the samples printed at low and medium energy densities after annealing (Figure 6). Additionally, for samples prepared with a high energy density, annealing caused dislocations to aggregate and form subgrains (Figure 13d). Since grain boundaries inhibit the martensitic transformation, two distinct transformation peaks appeared in the DSC curve for the A3 alloy (Figure 6).

4.2. Factors Influencing Recovery Strain

Pore defects are one of the characteristics of LPBF-manufactured alloys, caused by gas entrapment in the melt pool or elemental evaporation. CT results indicate that both the number and size of porosity defects increase with rising energy density (Figure 3). This phenomenon primarily stems from intensified Ni evaporation within the melt pool under high-energy-density conditions, which enhances the vapor recoil force. Consequently, the depth of the melt pool’s keyhole increases and becomes more unstable, raising the probability of keyhole collapse and subsequent entrapment of pores within the melt pool [35,36]. Previous studies indicate that pore defects reduce the recovery strain of LPBFed NiTi alloys [17,18]. In this study, based on CT reconstruction models, the integral volume fraction of pore defects in Ni51.9Ti48.1 alloys after annealing at 600 °C was quantified. The relationship between the defect volume fraction and recovery strain is shown in Figure 14a. It can be observed that when the pore defect volume fraction is below 0.13%, the Ni51.9Ti48.1 alloys achieve a recovery strain exceeding 6.2% (samples A1, A2, B1, B2, C1, C2, and D1, D2). However, when the pore defect volume fraction increases beyond 0.18%, the recovery strain significantly decreases to below 5% (samples A4, B4, C4, and D4). This is because the numerous pore defects present in Ni51.9Ti48.1 alloys prepared via high-energy-density processing tend to cause stress concentration when subjected to loading, thereby increasing the likelihood of irreversible dislocation slip. Thus, pore defects have a detrimental effect on the superelasticity of LPBFed NiTi alloys.
In addition to pore defects, the phase transition temperature significantly influences the superelastic properties of Ni51.9Ti48.1 alloys. Figure 14b illustrates the relationship between the Af temperature and the recovery strain for annealed Ni51.9Ti48.1 alloys. It can be observed that Ni51.9Ti48.1 alloys printed with high energy density (samples A4, B4, C4, and D4) exhibit an Af temperature exceeding 20 °C, indicating that they did not undergo a complete martensitic reverse transformation after unloading. Furthermore, Ni51.9Ti48.1 alloys prepared via high-energy-density processing exhibit a large number of dislocations and form subgrains after annealing (Figure 13d), which further deteriorates their superelasticity.
For Ni51.9Ti48.1 alloys prepared at lower energy densities (samples A1, A2, B1, B2, C1, C2, and D1, D2), the Ni4Ti3 and R phases formed after annealing (Figure 13a,b). These precipitates stabilize the B2 austenite phase and promote martensite nucleation. Furthermore, the strain fields surrounding these precipitates effectively impede dislocation motion [19,21,37]. On the other hand, Ni51.9Ti48.1 alloys prepared at lower energy densities exhibit higher matrix Ni content, enabling the formation of a solid solution-strengthened matrix that effectively enhances the critical slip stress [19,22]. Consequently, through the combined effects of matrix strengthening and precipitation phases, Ni51.9Ti48.1 alloys prepared at lower energy densities exhibit less stable martensite and plastic slip after compression unloading, demonstrating outstanding superelasticity of up to 6.64%.

5. Conclusions

This study utilized Ni-rich Ni51.9Ti48.1 powder to fabricate Ni51.9Ti48.1 alloys with outstanding superelastic properties through LPBF process parameter optimization and annealing treatment. The influence patterns and underlying mechanisms of process parameters and annealing on defect distribution, phase transformation behavior, and superelastic properties were investigated. The conclusions of this research are as follows:
(1)
As energy density increases, the number and volume of pore defects in the LPBFed Ni51.9Ti48.1 alloy increase, the phase transition temperature rises, and the hardness decreases. After annealing at 600 °C, the phase transition temperature of the LPBFed Ni51.9Ti48.1 alloy decreases, the thermal hysteresis increases, and the hardness improves.
(2)
The Ni51.9Ti48.1 alloy prepared at lower energy density exhibits relatively fewer dislocations and forms Ni4Ti3 precipitates and R-phase after annealing. The Ni51.9Ti48.1 alloy prepared at higher energy density contains more dislocations, which aggregate to form subgrains after annealing.
(3)
Due to a large number of pore defects, a high phase transformation temperature, and the formation of subgrains after annealing, the Ni51.9Ti48.1 alloy prepared using high energy density exhibits deteriorated superelastic properties, with a recovery strain after compression of less than 5%.
(4)
The Ni51.9Ti48.1 alloy prepared at a lower energy density exhibits a high matrix Ni content. After annealing, it forms Ni4Ti3 precipitates and R-phase, demonstrating outstanding superelastic properties with a recovery strain of up to 6.64% after compression.

Author Contributions

Conceptualization, Z.X. (Zheng Xiang) and Q.Y.; Data curation, Z.X. (Zheng Xiang), Q.Y. and S.H.; Formal analysis, Z.X. (Zheng Xiang) and Q.Y.; Funding acquisition, Z.X. (Zhihui Xia), M.H. and J.C.; Investigation, Z.X. (Zhihui Xia), M.H. and J.C.; Methodology, Z.X. (Zheng Xiang) and Q.Y.; Project administration, Z.X. (Zhihui Xia), M.H. and J.C.; Resources, Z.X. (Zhihui Xia), M.H. and J.C.; Supervision, Z.X. (Zhihui Xia), M.H. and J.C.; Validation, S.Z., T.Z. and S.H.; Visualization, S.Z., T.Z. and S.H.; Writing—original draft, Z.X. (Zheng Xiang) and Q.Y.; Writing—review & editing, Z.X. (Zhihui Xia), M.H. and J.C. All authors have read and agreed to the published version of the manuscript.

Funding

This research was funded by the National Safety Academic Fund (Grants No. U2130201) and the National Natural Science Foundation of China (Grants No. 52001289).

Data Availability Statement

The original contributions presented in this study are included in the article. Further inquiries can be directed to the corresponding authors.

Conflicts of Interest

The authors declare no conflicts of interest.

References

  1. Biesiekierski, A.; Wang, J.; Abdel-Hady Gepreel, M.; Wen, C. A new look at biomedical Ti-based shape memory alloys. Acta Biomater. 2012, 8, 1661–1669. [Google Scholar] [CrossRef]
  2. Mohd Jani, J.; Leary, M.; Subic, A.; Gibson, M.A. A review of shape memory alloy research, applications and opportunities. Mater. Des. 2014, 56, 1078–1113. [Google Scholar] [CrossRef]
  3. Zhang, Y.; Attarilar, S.; Wang, L.; Lu, W.; Yang, J.; Fu, Y. A Review on Design and Mechanical Properties of Additively Manufactured NiTi Implants for Orthopedic Applications. Int. J. Bioprinting 2024, 7, 340. [Google Scholar] [CrossRef]
  4. Safaei, K.; Abedi, H.; Nematollahi, M.; Kordizadeh, F.; Dabbaghi, H.; Bayati, P.; Javanbakht, R.; Jahadakbar, A.; Elahinia, M.; Poorganji, B. Additive Manufacturing of NiTi Shape Memory Alloy for Biomedical Applications: Review of the LPBF Process Ecosystem. JOM 2021, 73, 3771–3786. [Google Scholar] [CrossRef]
  5. Gangil, N.; Siddiquee, A.N.; Maheshwari, S. Towards applications, processing and advancements in shape memory alloy and its composites. J. Manuf. Process. 2020, 59, 205–222. [Google Scholar] [CrossRef]
  6. Dash, B.; Das, M.; Das, M.; Mahapatra, T.R.; Mishra, D. A Concise Review on Machinability of NiTi Shape Memory Alloys. Mater. Today Proc. 2019, 18, 5141–5150. [Google Scholar] [CrossRef]
  7. Wei, S.; Zhang, J.; Zhang, L.; Zhang, Y.; Song, B.; Wang, X.; Fan, J.; Liu, Q.; Shi, Y. Laser powder bed fusion additive manufacturing of NiTi shape memory alloys: A review. Int. J. Extrem. Manuf. 2023, 5, 032001. [Google Scholar] [CrossRef]
  8. Mohamed, O.A.; Masood, S.H.; Xu, W. Nickel-titanium shape memory alloys made by selective laser melting: A review on process optimisation. Adv. Manuf. 2022, 10, 24–58. [Google Scholar] [CrossRef]
  9. Dadbakhsh, S.; Speirs, M.; Van Humbeeck, J.; Kruth, J.-P. Laser additive manufacturing of bulk and porous shape-memory NiTi alloys: From processes to potential biomedical applications. MRS Bull. 2016, 41, 765–774. [Google Scholar] [CrossRef]
  10. Farber, E.; Zhu, J.-N.; Popovich, A.; Popovich, V. A review of NiTi shape memory alloy as a smart material produced by additive manufacturing. Mater. Today Proc. 2020, 30, 761–767. [Google Scholar] [CrossRef]
  11. Otsuka, K.; Ren, X. Physical metallurgy of Ti–Ni-based shape memory alloys. Prog. Mater. Sci. 2005, 50, 511–678. [Google Scholar] [CrossRef]
  12. Frenzel, J.; Wieczorek, A.; Opahle, I.; Maaß, B.; Drautz, R.; Eggeler, G. On the effect of alloy composition on martensite start temperatures and latent heats in Ni–Ti-based shape memory alloys. Acta Mater. 2015, 90, 213–231. [Google Scholar] [CrossRef]
  13. Lu, H.Z.; Ma, H.W.; Cai, W.S.; Luo, X.; Qu, S.G.; Wang, J.; Lupoi, R.; Yin, S.; Yang, C. Altered phase transformation behaviors and enhanced bending shape memory property of NiTi shape memory alloy via selective laser melting. J. Mater. Process. Technol. 2022, 303, 117546. [Google Scholar] [CrossRef]
  14. Ranaiefar, M.; Honarmandi, P.; Xue, L.; Zhang, C.; Elwany, A.; Karaman, I.; Schwalbach, E.J.; Arroyave, R. A differential evaporation model to predict chemistry change of additively manufactured metals. Mater. Des. 2022, 213, 110328. [Google Scholar] [CrossRef]
  15. Wang, X.; Yu, J.; Liu, J.; Chen, L.; Yang, Q.; Wei, H.; Sun, J.; Wang, Z.; Zhang, Z.; Zhao, G.; et al. Effect of process parameters on the phase transformation behavior and tensile properties of NiTi shape memory alloys fabricated by selective laser melting. Addit. Manuf. 2020, 36, 101545. [Google Scholar] [CrossRef]
  16. Tan, C.; Li, S.; Essa, K.; Jamshidi, P.; Zhou, K.; Ma, W.; Attallah, M.M. Laser Powder Bed Fusion of Ti-rich TiNi lattice structures: Process optimisation, geometrical integrity, and phase transformations. Int. J. Mach. Tools Manuf. 2019, 141, 19–29. [Google Scholar] [CrossRef]
  17. Saedi, S.; Shayesteh Moghaddam, N.; Amerinatanzi, A.; Elahinia, M.; Karaca, H.E. On the effects of selective laser melting process parameters on microstructure and thermomechanical response of Ni-rich NiTi. Acta Mater. 2018, 144, 552–560. [Google Scholar] [CrossRef]
  18. Shen, F.L.; Li, H.Q.; Guo, H.; Guo, N.N.; Fang, X.Y. Effect of energy density on the superelastic property of Ni-rich NiTi alloy fabricated by laser powder bed fusion. Mater. Sci. Eng. A 2022, 854, 143874. [Google Scholar] [CrossRef]
  19. Xue, L.; Atli, K.C.; Zhang, C.; Hite, N.; Srivastava, A.; Leff, A.C.; Wilson, A.A.; Sharar, D.J.; Elwany, A.; Arroyave, R.; et al. Laser Powder Bed Fusion of Defect-Free NiTi Shape Memory Alloy Parts with Superior Tensile Superelasticity. Acta Mater. 2022, 229, 117781. [Google Scholar] [CrossRef]
  20. Yan, A.; Cai, W.S.; Li, H.Z.; Lu, H.Z.; Lin, J.M.; Wang, J.; Zhang, L.C.; Yang, C. Stable superelasticity with large recoverable strain in NiTi alloy via additive manufacturing. Mater. Sci. Eng. A 2024, 911, 146935. [Google Scholar] [CrossRef]
  21. Saedi, S.; Turabi, A.S.; Andani, M.T.; Moghaddam, N.S.; Elahinia, M.; Karaca, H.E. Texture, aging, and superelasticity of selective laser melting fabricated Ni-rich NiTi alloys. Mater. Sci. Eng. A 2017, 686, 1–10. [Google Scholar] [CrossRef]
  22. Saedi, S.; Turabi, A.S.; Taheri Andani, M.; Haberland, C.; Karaca, H.; Elahinia, M. The influence of heat treatment on the thermomechanical response of Ni-rich NiTi alloys manufactured by selective laser melting. J. Alloys Compd. 2016, 677, 204–210. [Google Scholar] [CrossRef]
  23. Safdel, A.; Zaker, N.; Botton, G.A.; Elbestawi, M.A. The role of texture and restoration mechanisms in defining the tension-compression asymmetry behavior of aged NiTi alloys fabricated by laser powder bed fusion. Mater. Sci. Eng. A 2023, 864, 144592. [Google Scholar] [CrossRef]
  24. Yang, Y.; Zhang, Y.Q.; Lu, H.Z.; Luo, Y.; Long, T.H.; Tong, W.T.; Zhang, Y.; Yu, X.; Yang, C. Relationship between the superelasticity and strain field around Ni4Ti3 nano-precipitates in NiTi shape memory alloy via laser powder bed fusion. J. Manuf. Process. 2024, 127, 698–708. [Google Scholar] [CrossRef]
  25. Chen, J.; Wang, Z.; Wang, S.; Xiang, Z.; Shen, X.; Huang, S.; Yang, Q. Mechanical and functional properties of HfH2-decorated NiTi shape memory alloy fabricated by laser powder-bed fusion. J. Alloys Compd. 2022, 913, 165296. [Google Scholar] [CrossRef]
  26. Jamshidi, P.; Panwisawas, C.; Langi, E.; Cox, S.C.; Feng, J.; Zhao, L.; Attallah, M.M. Development, characterisation, and modelling of processability of nitinol stents using laser powder bed fusion. J. Alloys Compd. 2022, 909, 164681. [Google Scholar] [CrossRef]
  27. Chen, W.; Yang, Q.; Huang, S.; Huang, S.; Kruzic, J.J.; Li, X. Laser power modulated microstructure evolution, phase transformation and mechanical properties in NiTi fabricated by laser powder bed fusion. J. Alloys Compd. 2021, 861, 157959. [Google Scholar] [CrossRef]
  28. Haberland, C.; Elahinia, M.; Walker, J.M.; Meier, H.; Frenzel, J. On the development of high quality NiTi shape memory and pseudoelastic parts by additive manufacturing. Smart Mater. Struct. 2014, 23, 104002. [Google Scholar] [CrossRef]
  29. Sequeda Leon, E.M.; Singamneni, S.; Guraya, T.; Chen, Z.W. Effect of laser power in laser powder bed fusion on Ni content and structure of Nitinol. Mater. Today Proc. 2023. [Google Scholar] [CrossRef]
  30. Xiang, Z.; Zhu, T.; Yang, Q.; Tang, J.; Shen, X.; Hao, S.; Zhang, J.; Chen, J.; Huang, S. Optimization of repetitive energy absorption properties of LPBF NiTi porous structures by compositional gradient design. Mater. Sci. Eng. A 2025, 946, 149148. [Google Scholar] [CrossRef]
  31. Lu, H.Z.; Liu, L.H.; Luo, X.; Ma, H.W.; Cai, W.S.; Lupoi, R.; Yin, S.; Yang, C. Formation mechanism of heterogeneous microstructures and shape memory effect in NiTi shape memory alloy fabricated via laser powder bed fusion. Mater. Des. 2023, 232, 112107. [Google Scholar] [CrossRef]
  32. Zhang, Y.; Wu, S.; Guo, Z.; Peng, G.; Wang, L.; Yan, W. Defects caused by powder spattering and entrainment in laser powder bed fusion process: High-fidelity modeling of gas, melt pool and powder dynamics. Acta Mater. 2025, 288, 120816. [Google Scholar] [CrossRef]
  33. Wang, L.; Guo, Z.; Peng, G.; Wu, S.; Zhang, Y.; Yan, W. Evaporation-Induced Composition Evolution in Metal Additive Manufacturing. Adv. Funct. Mater. 2024, 35, 2412071. [Google Scholar] [CrossRef]
  34. Tang, D.; Hu, Y.; Yang, L.; Yan, C.; Shi, Y. Melt Pool Simulation Technology of Laser Powder Bed Fusion: A Review. Jom 2024, 76, 4663–4682. [Google Scholar] [CrossRef]
  35. Cunningham, R.; Zhao, C.; Parab, N.; Kantzos, C.; Pauza, J.; Fezzaa, K.; Sun, T.; Rollett, A. Keyhole threshold and morphology in laser melting revealed by ultrahigh-speed x-ray imaging. Science 2019, 363, 849–852. [Google Scholar] [CrossRef]
  36. Zhao, C.; Guo, Q.; Li, X.; Parab, N.; Fezzaa, K.; Tan, W.; Chen, L.; Sun, T. Bulk-Explosion-Induced Metal Spattering During Laser Processing. Phys. Rev. X 2019, 9, 021052. [Google Scholar] [CrossRef]
  37. Lu, H.Z.; Ma, H.W.; Cai, W.S.; Luo, X.; Wang, Z.; Song, C.H.; Yin, S.; Yang, C. Stable tensile recovery strain induced by a Ni4Ti3 nanoprecipitate in a Ni50.4Ti49.6 shape memory alloy fabricated via selective laser melting. Acta Mater. 2021, 219, 117261. [Google Scholar] [CrossRef]
Figure 1. (a) SEM image of Ni51.9Ti48.1 powder; (b) particle size distribution of Ni51.9Ti48.1 powder; (c) DSC curves of Ni51.9Ti48.1 powder; (d) XRD patterns of Ni51.9Ti48.1 powder at room temperature.
Metals 15 01180 g001
Figure 2. (a) Schematic diagram of the scanning strategy; (b) cylindrical Ni51.9Ti48.1 samples fabricated by LPBF; (c) The triple optimization design adopted: I. Powder composition design, II. Process parameter design, and III. Post-processing design.
Metals 15 01180 g002
Figure 3. Micro-CT results of Ni51.9Ti48.1 alloys fabricated using different processing parameters: (A1A3) The laser power is 190 W, and the scanning speeds are 700, 600, and 500 mm/s, respectively; (B1B3) The laser power is 170 W, and the scanning speeds are 600, 500, and 450 mm/s, respectively; (C1C3) The laser power is 150 W, and the scanning speeds are 550, 500, and 400 mm/s, respectively; (D1D3) The laser power is 130 W, and the scanning speeds are 500, 400, and 350 mm/s, respectively.
Metals 15 01180 g003
Figure 4. The pore defect counts and diameter distribution in Ni51.9Ti48.1 alloys prepared using different parameters: (a) Samples A1, A2, and A3; (b) Samples B1, B2, and B3; (c) Samples C1, C2, and C3; (d) Samples D1, D2, and D3; (e) The average diameter of defects in different samples; (f) The maximum diameter of defects in different samples.
Metals 15 01180 g004
Figure 5. DSC curves of Ni51.9Ti48.1 alloys fabricated using different processing parameters: (a) Samples A1, A2, and A3; (b) Samples B1, B2, and B3; (c) Samples C1, C2, and C3; (d) Samples D1, D2, and D3.
Metals 15 01180 g005
Figure 6. DSC curves of LPBFed Ni51.9Ti48.1 alloys after annealing at 600 °C: (a) Samples A1, A2, and A3; (b) Samples B1, B2, and B3; (c) Samples C1, C2, and C3; (d) Samples D1, D2, and D3.
Metals 15 01180 g006
Figure 7. Hardness of Ni51.9Ti48.1 alloys in fabricated by different processing parameters: (a) LPBF fabrication; (b) 600 °C annealing.
Metals 15 01180 g007
Figure 8. Stress–strain curves of annealed Ni51.9Ti48.1 alloys at room temperature: (a) Samples A1, A2, and A3; (b) Samples B1, B2, and B3; (c) Samples C1, C2, and C3; (d) Samples D1, D2, and D3.
Metals 15 01180 g008
Figure 9. (a) Recovered strain and unrecovered strain of annealed Ni51.9Ti48.1 alloys after unloading; (b) Comparison of the superelasticity obtained in this work with other reported results (adapted from Refs. [17,19,20,21,22,24]).
Metals 15 01180 g009
Figure 10. XRD patterns of Ni51.9Ti48.1 alloys fabricated using different processing parameters: (a) Samples A1, A2, and A3; (b) Samples B1, B2, and B3; (c) Samples C1, C2, and C3; (d) Samples D1, D2, and D3.
Metals 15 01180 g010
Figure 11. XRD patterns of Ni51.9Ti48.1 alloys after annealing at 600 °C: (a) Samples A1, A2, and A3; (b) Samples B1, B2, and B3; (c) Samples C1, C2, and C3; (d) Samples D1, D2, and D3.
Metals 15 01180 g011
Figure 12. TEM of LPBFed Ni51.9Ti48.1 alloys: (a,b) LPBFed A2 alloy; (c,d) LPBFed A3 alloy.
Metals 15 01180 g012
Figure 13. TEM of annealed Ni51.9Ti48.1 alloys: (a,b) annealed A2 alloy; (c,d) annealed A3 alloy.
Metals 15 01180 g013
Figure 14. (a) The relationship between the volume fraction of pore defects and recovery strain for the LPBF-fabricated Ni51.9Ti48.1 samples; (b) the relationship between the austenitic transformation temperature (Af) and recovery strain for the LPBF-fabricated Ni51.9Ti48.1 samples.
Metals 15 01180 g014
Table 1. Chemical composition of the Ni51.9Ti48.1 powder.
ElementsNiTiFeCON
at.%51.89Bal.<0.010.0030.0500.003
Table 2. Processing parameters applied for fabricating Ni51.9Ti48.1 alloy.
SampleLaser Power
P (W)
Scanning Speed
v (mm/s)
Hatch Spacing
h (mm)
Layer Thickness
t (mm)
Energy Density
E (J/mm3)
A11907000.050.03180
A21906000.050.03211
A31905000.050.03253
B11706000.050.03188
B21705000.050.03226
B31704500.050.03252
C11505500.050.03181
C21505000.050.03200
C31504000.050.03250
D11305000.050.03173
D21304000.050.03217
D31303500.050.03248
Table 3. Phase transformation temperatures and thermal hysteresis for LPBFed and annealed Ni51.9Ti48.1 alloy.
SampleLPBF Fabrication600 °C Annealing
Ms (°C)Af (°C)Δ(AfMs) (°C)Ms (°C)Af (°C)Δ(AfMs) (°C)
A1−2−10−8−72−3636
A212175−73−2053
A3174326−121931
B1−6915−73−3340
B201515−58−652
B3224523−161531
C152217−75−4332
C282315−65−4025
C3154025254823
D162822−77−3532
D262923−75−4134
D323502703030
Disclaimer/Publisher’s Note: The statements, opinions and data contained in all publications are solely those of the individual author(s) and contributor(s) and not of MDPI and/or the editor(s). MDPI and/or the editor(s) disclaim responsibility for any injury to people or property resulting from any ideas, methods, instructions or products referred to in the content.