Abstract
This article uses a water model with a ratio of 1:5.75 to study the influence of factors such as the position and flow rate of top and bottom composite argon blowing on the mixing time of molten steel in a 300t ladle at a certain factory. Using engine oil to simulate steel slag, the mass transfer velocity of molten steel under different bottom and top blowing positions and flow rates of the ladle was compared. At the same time, numerical simulation was used to analyze the changes in the flow field of molten steel under different ladle blowing modes. The optimal ladle composite bottom argon process was proposed and industrial experiments were conducted on site. The research results show that the stirring effect of top–bottom composite argon blowing in the ladle is significantly better than that of the pure bottom blowing mode. When the top blowing gun is located 300 mm at the bottom of the ladle, the mixing time of the molten steel is shortest and the stirring efficiency is highest. The higher the insertion depth of the top blowing gun, the faster the flow rate of the molten steel, and the smaller the proportion of dead zones. Top and bottom blowing can improve the mass transfer rate between steel slag and promote the formation of refined slag. Through industrial experiments, it was found that the S content in the molten steel decreased by approximately 22.3% and the total oxygen content decreased by 25% before and after 10 min of composite argon blowing at the top and bottom of the ladle.
1. Introduction
Ladle argon blowing is currently the most widely used method of external refining both domestically and internationally. It not only effectively unifies the composition and temperature of the steel liquid but also carries and adheres inclusions in the steel liquid to the surface through dispersed small bubbles, thereby improving the quality of the steel liquid [1,2,3,4]. The ladle bottom argon blowing system is currently adopted by the vast majority of steel mills due to its simple equipment and low operating cost [5]. Previous researchers have conducted extensive research on the two-phase flow field, inclusion buoyancy, and mixing time during argon blowing in steel ladles through numerical and physical simulations, optimizing process parameters such as the position, number, and flow rate of bottom blowing holes [6,7,8,9,10,11,12].
Lu et al. [6] and Guo et al. [7]. studied the effect of bottom blowing flow rate on ladle mixing time through water simulation experiments, and the results showed that the mixing time decreased with the increase in flow rate. Li et al. [8] pointed out that when the bottom blowing hole of the 70t ladle is at an angle of 135°, the refining effect of the ladle is the best, while Xing et al. [9] pointed out that the best bottom blowing hole for the 130t ladle is at an angle of 120°. Wu et al. [10] compared the types of gas supply components for bottom blowing in a 150t steel ladle through physical simulation and found that the mixing time was the smallest under the dispersed bottom blowing gas supply. Shan et al. [11] studied the bottom blowing process of a 210-ton steel ladle through a physical model and pointed out that the optimal bottom blowing hole position is 0.8 R, with an angle of 110°, and the mixing time decreases as the distance between the blowing position and the center of the steel ladle increases. Wang et al. [12] studied the bottom blowing of a 180t steel ladle through numerical simulation and concluded that the argon blowing mode with the combination of “strong–weak” flow streams has a better refining effect.
At present, there is relatively little research on the flow field and slag steel mass transfer of top and bottom composite argon blowing in steel ladles. For large steel ladles, top–bottom composite argon blowing can better achieve uniform steel composition, temperature, and removal of inclusions. This study is based on a 300-ton steel ladle in a certain factory; a 1:5.75 model was established based on a 300t ladle in a certain factory. A systematic water model study was conducted under the combined top and bottom blowing argon blowing process conditions to find the best process parameters for the factory. Finally, industrial experiments were conducted on this basis, achieving good results.
2. Principles and Methods of Physical Simulation Experiments
2.1. Experimental Plan
In order to clarify the effect of top and bottom blowing on the stirring of steel liquid and the improvement in steel slag, a reasonable blowing system and pre-slag mode are formulated based on this. Industrial experiments were conducted to achieve the goal of fully stirring the steel liquid, effectively improving the quality of steel slag and promoting early slag formation. A physical model with a geometric similarity ratio of 1:5.75 was established based on a 300t ladle in a certain factory. Water was used to simulate the flow characteristics of molten steel, oil was used to simulate slag, and compressed air was used to simulate Ar gas [13,14,15]. This study provides a theoretical basis for optimizing the flow field of the ladle and improving its cleanliness. This study uses a cold physical model to measure the mixing time by changing the bottom blowing gas supply flow rate, top gun gas supply flow rate, and top gun insertion depth. The corresponding mass transfer coefficient is calculated to reflect the blowing process conditions when different parameters are selected, providing a theoretical basis for establishing a reasonable process system. Figure 1 shows the experimental principle diagram of the physical simulation. Table 1 shows the relevant comparative parameters between the prototype and model of the ladle.
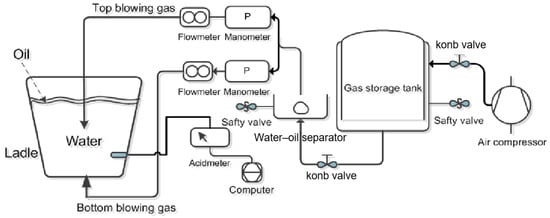
Figure 1.
Sketch map of ladle water experimental system.

Table 1.
Comparison of process parameters between 300t ladle prototype and model.
The experimental setup mainly includes the following:
- (1)
- A blowing system consisting of a converter, spray gun, and melt pool;
- (2)
- A gas flow system composed of a pressure gauge and a rotary flowmeter;
- (3)
- A data recording system composed of conductivity meters and acidity meters.
In the refining process of argon gas blowing in the ladle, the steel liquid is mainly affected by the gravity of the steel liquid itself and the buoyancy of the gas. The main driving force of the steel liquid flow comes from the buoyancy of the top and bottom blowing gases. Therefore, as long as the corrected Froude numbers of the model and the prototype are equal, the following holds:
In the formula, and are the densities of air and Ar at room temperature of 273 k in the standard state, kg·m−3. and are the densities of water and molten steel, kg·m−3; g is the gravitational acceleration, m·s−2; and are the nozzle outlet diameters of the model and prototype, and m; and represent the airflow velocity at the outlet of the model and bottom gun prototype, m·s−1.
The formula for gas supply flow rate is
According to Formulas (1) and (2), the relationship between the flow rate used in the model and the actual flow rate can be obtained:
By inputting relevant parameters into the formula, Formula (4) can be obtained:
The main parameters of bottom blowing and top blowing flow rates in this experiment are shown in Table 2. The position of the ladle top blowing is shown in Table 3.

Table 2.
Physical simulation test parameter design scheme.

Table 3.
The position of the ladle top blowing.
In this experiment, water was used to simulate steel liquid and oil was used to simulate steel slag. Due to the solubility of benzoic acid in both water and oil, benzoic acid was used as a tracer to simulate the oxygen element. By measuring the transfer rate of benzoic acid from oil to water, the transfer rate of the tracer in the two phases under different conditions was investigated.
The experimental process involves injecting a certain amount of water into the model, adjusting parameters such as the top gun position, top blowing flow rate, and bottom blowing flow rate. After blowing for a certain period of time and once the model reaches a stable state, melted benzoic acid oil is added to the melt pool. At the same time, data is recorded using an acidity meter for 15 min, and the acidity meter probe is placed at the bottom of the melt pool.
The concentration of benzoic acid dissolved in the engine oil during the experiment was 0.033 mol/L. The relationship between the concentration of benzoic acid dissolved in water and millivolts (mv) measured in the experiment is
In the formula, v is the voltage, mv.
The total rate of material transfer between oil and water phases is
The concentration of benzoic acid is determined by the dimensionless concentration Ck:
In the formula, Ce is the concentration of benzoic acid in water at equilibrium with oil; Ci represents the concentration of benzoic acid in water at different times; ka represents the capacity mass transfer coefficient, s−1; and t represents time, s.
The mass transfer coefficient ka is
The Ck measured in the preliminary experiment is 0.001456 mol/L.
2.2. Experimental Results and Discussion
2.2.1. The Influence of Bottom Blowing Flow Rate and Top Blowing Flow Rate on Liquid Flow
Figure 2 shows the simulation effect of top and bottom blowing in steel ladles under different process parameters. As shown in Figure 2, without top blowing and with a flow rate of 0.38 Nm3·h−1 flowing through the bottom, there are two upward bubble flows inside the solution, and two circular exposed areas appear on the surface of the solution. On this basis, when adding a top blowing gas with a flow rate of 0.28 Nm3·h−1, an upward bubble extending from the top blowing gun is added inside the solution, and the number of bubbles significantly increases, indicating an enhanced stirring effect of the solution. At the same time, a circular exposed area is added at the center of the solution surface. When the top blowing flow rate is increased to 0.38 Nm3·h−1, the number of bubbles in the solution further increases, and the central circular exposed area on the solution surface increases, merging with the other two exposed areas to form one.
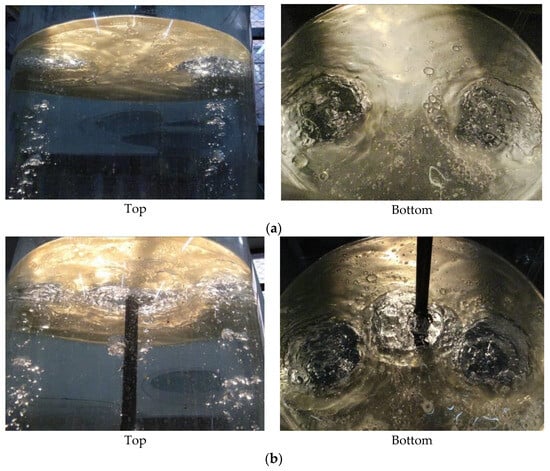
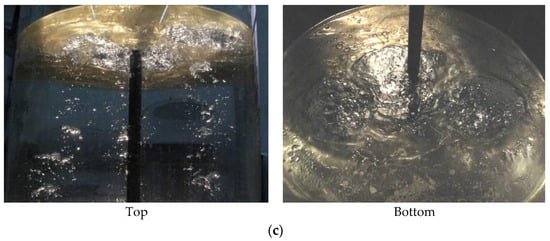
Figure 2.
Physical simulation test effect diagram: (a) Top: 0 Nm3·h−1; Bottom: 0.39 Nm3·h−1. (b) Top: 0.28 Nm3·h−1; Bottom 0.39 Nm3·h−1. (c) Top: 0.39 Nm3·h−1; Bottom: 0.39 Nm3·h−1.
2.2.2. The Influence of Bottom Blowing Flow Rate and Top Blowing Flow Rate on Liquid Mixing Time
The mixing time represents the stirring effect of the top and bottom blowing of the ladle, and the shorter the mixing time, the better the stirring effect of the blowing on the molten steel. Figure 3 shows the effect of different top gun positions on mixing time while keeping the bottom blowing flow rate constant. When the bottom blowing flow rate remains constant, the mixing time of the solution is the shortest when the top gun is located at the bottom of the model, with a minimum mixing time of 56 s. Gradually increasing the position of the top gun from the bottom of the model to the height of 1/2 h of the model increases the mixing time of the solution by more than 20 s. At the same top gun position, the larger the top blowing flow rate, the shorter the mixing time. Figure 4 shows the effect of different bottom blowing flow rates on mixing time while keeping the top blowing flow rate constant. When the top blowing flow rate remains constant, the mixing time of the solution decreases with the increase in the bottom blowing flow rate. Increasing the bottom blowing flow rate from 0.28 Nm3·h−1 to 0.5 Nm3·h−1 reduces the mixing time by more than 12.6%. Here, the most significant reduction in mixing time is when the top gun is located at the bottom of the model, about 27%. As can be seen from the above, the mixing time inside the ladle gradually decreases with the increase in bottom and top blowing flow rates. When the top blowing position is at the bottom of the model, the mixing time is the smallest and the stirring efficiency is the highest.
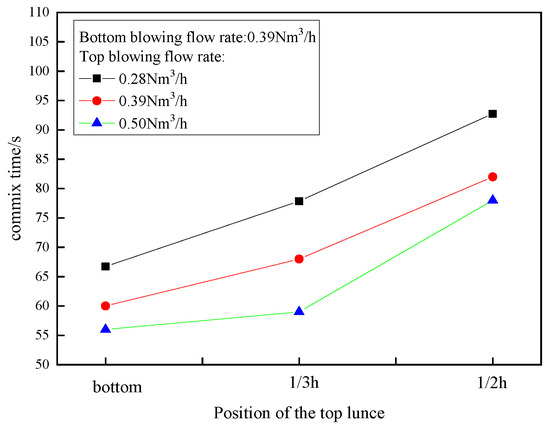
Figure 3.
Influence of top gun position on mixing time.
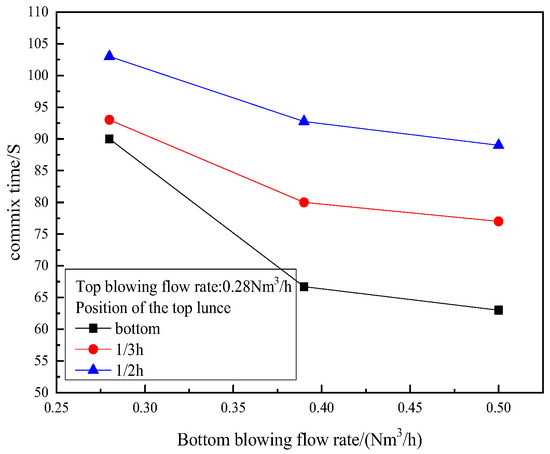
Figure 4.
The influence of bottom blowing flow rate on mixing time.
2.2.3. The Influence of Flow Rate on Mass Transfer in Slag Steel
From the above analysis, it can be concluded that the mixing time is shortest when the flow rate remains constant and the top gun is located at the bottom of the model. On this basis, experiments were conducted to determine the concentration of benzoic acid under different gas supply flow rates, as shown in Figure 5. Figure 5 shows the variation in Ck over time under different gas supply flow rates; the concentration of benzoic acid in water is basically linearly related to the gas supply time. Without top blowing, when the bottom blowing flow rate is 0.39 Nm3·h−1, the mass transfer rate ka = 0.735 × 10⁻⁴ s−1; when the bottom blowing flow rate is 0.670 Nm3·h−1, the mass transfer rate ka = 0.925 × 10⁻⁴ s−1; and when the bottom blowing flow rate is 0.78 Nm3·h−1, the mass transfer rate ka = 1.17 × 10⁻⁴ s−1. As the bottom blowing flow rate increases, the mass transfer rate gradually increases. When the bottom blowing flow rate remains unchanged at 0.39 Nm3·h−1 and the top blowing flow rate is 0.28 Nm3·h−1, the mass transfer rate ka = 1.17 × 10⁻⁴ s−1. When the top blowing flow rate increases to 0.39 Nm3·h−1, the mass transfer rate ka = 1.43 × 10⁻⁴ s−1. An increase in top blowing flow rate will also improve mass transfer speed.
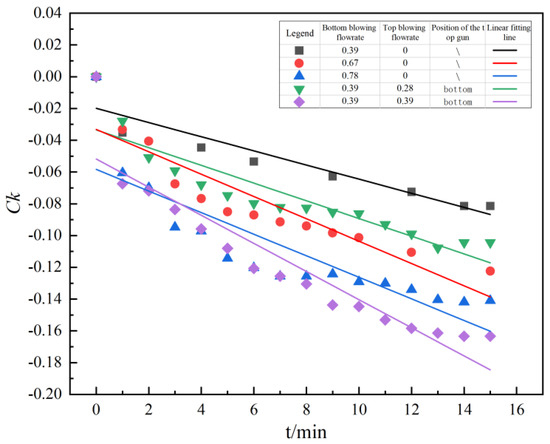
Figure 5.
Effect of flow rate on mass transfer of steel slag.
3. Numerical Simulation
3.1. Basic Assumptions
In the actual production process, the flow of molten steel in the ladle is very complex, accompanied by the interaction of mass and heat transfer. This study used ANSYS 2022 R1 finite element software for numerical calculations. Based on its flow characteristics and our research objectives, the flow action in the ladle can be simplified and assumed as follows [16,17,18,19]:
- (1)
- The flow of each phase in the ladle is treated as incompressible with a fixed viscosity;
- (2)
- The reaction effect of steel slag is neglected.
- (3)
- The molten steel in the ladle is treated as a medium of equal temperature, neglecting heat transfer.
- (4)
- The VOF model is used for calculation, taking into account the surface tension between interfaces; the shape, aggregation, and fragmentation of each phase are determined by the VOF model itself.
- (5)
- Gravity acceleration is loaded on the Z-axis.
The dimensions of the ladle model and initial and boundary conditions are shown in Table 1. The numerical solution is calculated using Fluent software. The calculation adopts the fluid volume function VOF multiphase flow model. The ventilation hole is set as the velocity outlet boundary condition, and the inlet velocity is calculated based on the gas flow rate and the cross-sectional area of the ventilation hole. The inlet direction is the normal velocity of the airflow at the nozzle, and only the gas phase exists at the nozzle. The volume fraction is set to 1. The export adopts pressure outlet boundary conditions. The top horizontal plane of the model is a free liquid level, and the gas maintains its upward velocity when leaving the molten pool, preventing the liquid from leaving the system.
Four types of ladle argon blowing modes were calculated through numerical simulation, namely bottom blowing only and top blowing at a distance of h1 = 300 mm, h2 = 1110 mm, and h3 = 1665 mm from the bottom height. The bottom blowing flow rate is set to 70 Nm3/h and the top blowing flow rate is set to 70 Nm3/h in four modes.
3.2. Experimental Results and Discussion
Firstly, the area where the steel flow velocity v < 0.02 m/s is defined as the flow dead zone. Figure 6 shows the distribution of longitudinal cross-sections of the velocity flow field inside the ladle under four different argon blowing modes. As shown in the figure, the four zones of molten steel in the ladle are mainly located at the bottom of the ladle. In the absence of top blowing, the area of the dead zone is the largest. In the case of top and bottom blowing, the area of the dead zone at the bottom of the ladle gradually decreases with the downward movement of the top blowing position. Figure 7 summarizes the proportion of dead zones in four different scenarios. In the case of only bottom blowing, the dead zone ratio is 7.9%. When the top blowing distance from the bottom is 300, 1110, and 1665 mm, respectively, the dead zone ratio is 2.7%, 6.0%, and 5.6%. Compared with pure bottom blowing, the dead zone ratio is significantly reduced under repeated blowing conditions, especially when the top blowing insertion depth is 300 mm. The top and bottom blowing of the ladle can fully stir the molten steel, reduce the proportion of dead zones, and facilitate the floating of inclusions and mass transfer between steel slag.
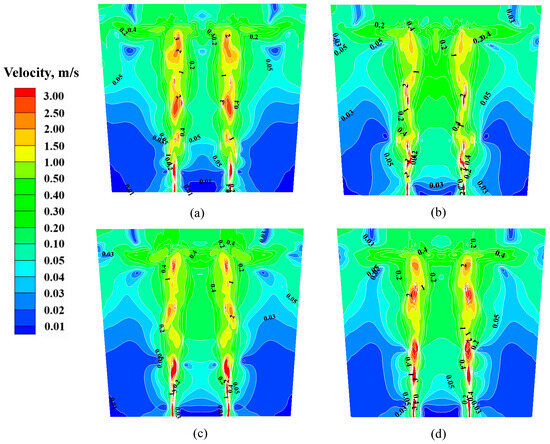
Figure 6.
Longitudinal flow field velocity distribution of argon blowing in steel ladle: (a) no top blowing, (b) top blowing height h1 = 300 mm, (c) top blowing height h2 = 1110 mm, and (d) top blowing height h3 = 1665 mm.
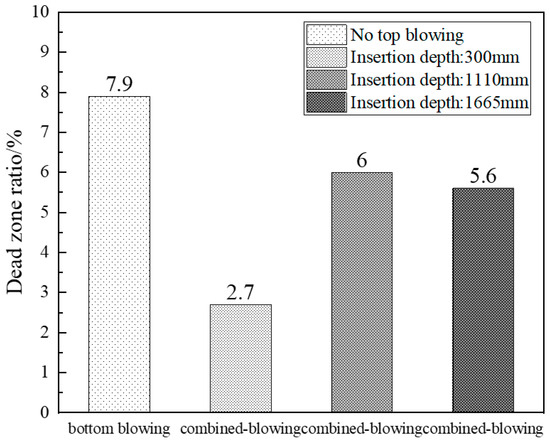
Figure 7.
Changes in dead zone ratio under different ladle argon blowing modes.
Figure 8 shows the cross-sectional distribution of the velocity flow field inside the ladle under four different argon blowing modes. The cross-sectional velocity distribution cloud maps at distances of 1 m, 2 m, and 3 m from the bottom are listed in the figure. It can be clearly compared that the steel flow velocity in the ladle under pure bottom blowing is lower than that under top and bottom blowing, and the maximum steel flow velocity is observed at the top blowing position h1 = 300 mm. Figure 9 summarizes the average flow velocity of the ladle liquid level under four modes. Under the same bottom blowing flow rate, the average liquid surface velocity in the top–bottom combined blowing mode is higher than that in the pure bottom blowing mode, and the average liquid surface velocity gradually increases as the insertion position decreases, reaching its maximum when the top blowing insertion depth is 300 mm.
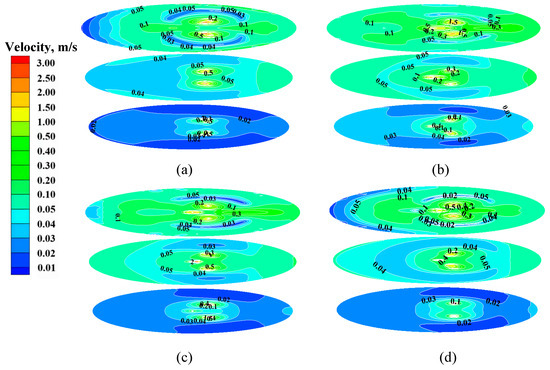
Figure 8.
Velocity distribution diagram of cross-sectional flow field in ladle blowing: (a) no top blowing, (b) top blowing height h1 = 300 mm, (c) top blowing height h2 = 1110 mm, and (d) top blowing height h3 = 1665 mm.
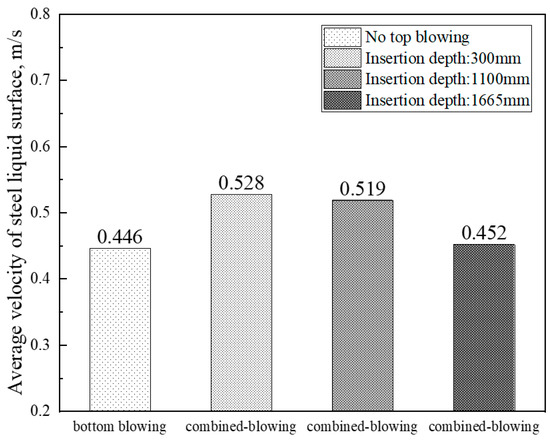
Figure 9.
Changes in average liquid level velocity of ladle under different argon blowing modes. Industrial experiment.
4. Industrial Testing
The above research indicates that the composite argon blowing mode with the top blowing gun located at the bottom of the ladle has the best stirring effect. On this basis, industrial experimental research was conducted: in the later stage of converter steelmaking, refining slag and aluminum particles were added according to the LF refining target slag system and the oxygen content of the molten steel, and the refining slag was pre-formed into slag. Deoxygenation is carried out at the argon blowing station using the ladle composite argon blowing process at the production site. The top blowing gun is inserted at a distance of 300 mm from the bottom of the ladle, and the flow rates for both top and bottom blowing are 70 Nm3/h. Samples of the molten steel before and after argon blowing are taken, and the changes in the composition of the molten steel are analyzed.
4.1. The Influence of the Top and Bottom Blowing Process on Slag Composition Changes in the Ladle
Figure 10 shows the composition change of slag before and after ladle refining. It can be seen that after the top and bottom composite blowing of the ladle, the average content of (FeO + MnO) in the slag decreased from 26.38% to 3.48%; the average content of Al2O3 in the slag increased from 5.12% to 26.01%; the average alkalinity (R) of the slag increased from 4.38 to 5.35; and the average sulfur content of the slag increased from 0.07% to 0.23%.
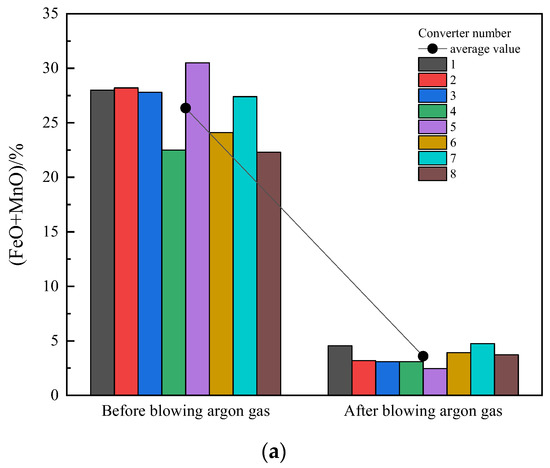
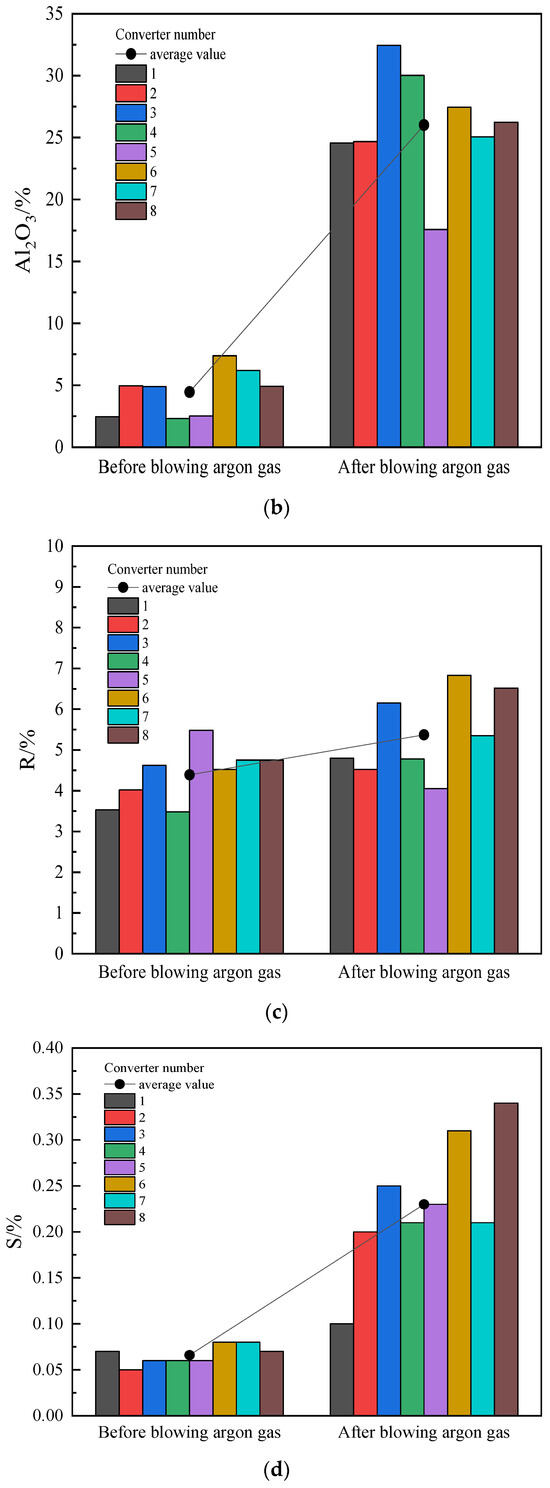
Figure 10.
Slag composition change in and out of Ar station: (a) (FeO + MnO); (b) Al2O3; (c) R; (d) S.
The composition of refined slag is crucial for the removal of inclusions, and the CaO/Al2O3 ratio of refined slag should be less than 2.0 [20,21,22,23]. The ternary phase diagram of the CaO-Al2O3-SiO2 slag system was obtained through thermodynamic calculations using Factstage, as shown in Figure 11. After the top and bottom composite blowing of the ladle, the slag composition is shown in the figure. It can be seen that the average content of CaO/Al2O3 in the slag decreases to 2, and the slag is completely dispersed into the liquid phase zone except for the fifth furnace.
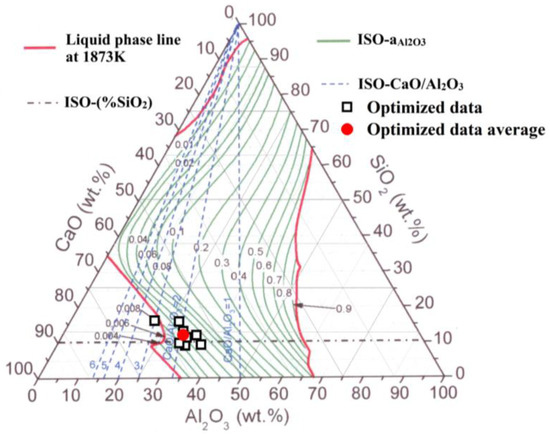
Figure 11.
The ternary phase diagram of the CaO-Al2O3-SiO2 slag system.
4.2. The Influence of the Top and Bottom Combined Blowing Process on the Deoxygenation and Desulfurization Efficiency of the Ladle
Figure 12 shows the changes in the content of [O] and [S] in the steel before and after composite argon blowing in the ladle. From the graph, it can be seen that the average free oxygen content in molten steel decreased from 3.2 × 10⁻⁶ to 1.3 × 10⁻⁶ before and after the experiment; the average sulfur content in molten steel decreased from 0.00475% to 0.0036%, with an average desulfurization rate of 22.3%.
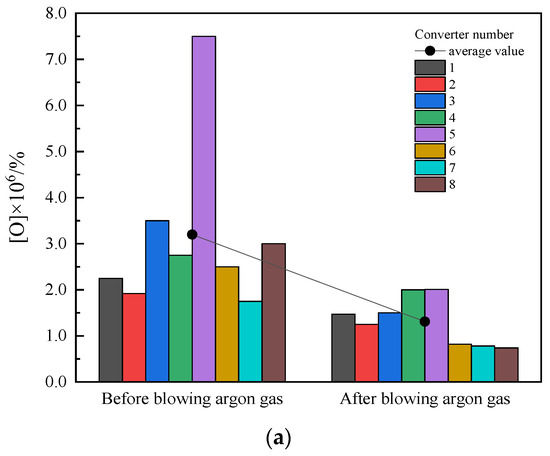
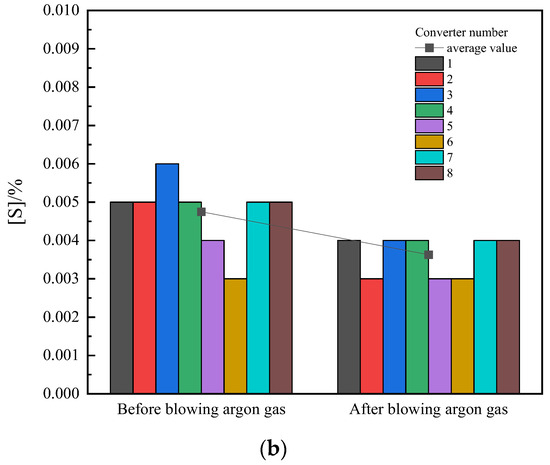
Figure 12.
Changes in the composition of molten steel before and after composite argon blowing in ladles: (a) total oxygen content; (b) sulfur content.
Using the converter ultra-low-sulfur steel smelting process, the average sulfur content in the molten steel at the endpoint is reduced to 0.0047%. Based on this, a top–bottom composite argon blowing pre-desulfurization process is carried out to achieve a treated endpoint [S] of 0.00366%. The top and bottom blowing process of the ladle can pre-form slag for the LF refining process, reducing the [O] and [S] content in the steel.
Figure 13 shows the variation in total oxygen content in molten steel from different sampling furnaces at each smelting station. The magnitude of the total oxygen content in steel represents the cleanliness of the molten steel. As shown in Figure 13, the total oxygen content in steel generally decreases with the increase in smelting process time. Before argon blowing, the average total oxygen content in the steel was 0.0073%. After the top and bottom of the ladle were blown again, the total oxygen content in the steel decreased to 0.0055%, and the average oxygen content decreased by 25%. After LF refining, the oxygen content in the steel was further reduced to 0.0025%. After RH refining, the total oxygen content in the steel finally decreased to around 0.0012%. Not only does it reduce the refining load of the LF furnace, but it is also beneficial in shortening the slag formation time of the LF furnace, accelerating the production rhythm, and ensuring the matching of the furnace and machine.
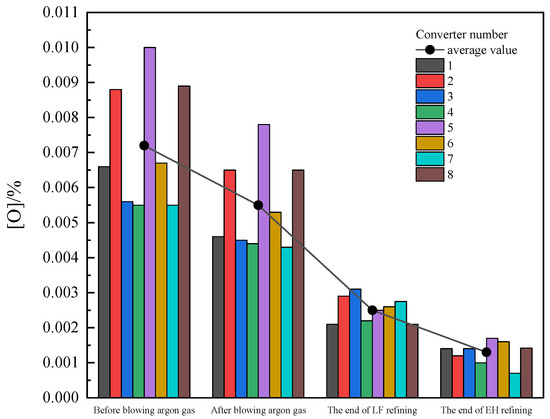
Figure 13.
Changes in total oxygen content in steel.
Larger oxide inclusions have a significant impact on the performance of steel grades. Figure 14 shows the variation in the proportion of inclusions larger than 5 μm in the molten steel. As shown in Figure 14, the average proportion of inclusions larger than 5 μm in the steel liquid before argon blowing is 6.2%. With the progress of the ladle top and bottom blowing process, the proportion of inclusions larger than 5 μm in the steel decreases to 5.2%. After LF and RH refining processes, the proportion of inclusions larger than 5 μm in the steel decreases to 1.93%. In terms of inclusion control, the top and bottom blowing technology of the ladle plays a bridging role in LF and RH refining.
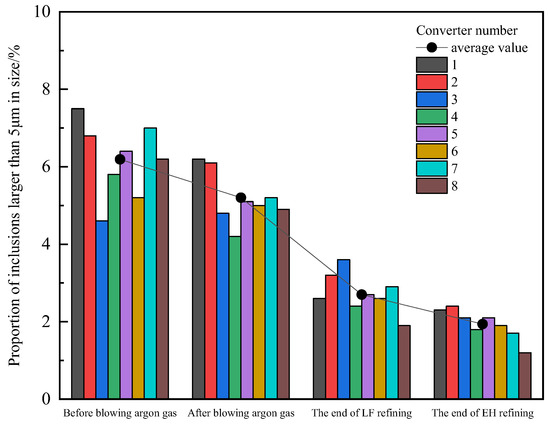
Figure 14.
Changes in the proportion of inclusions in steel.
5. Results and Discussion
(1) Through water model experiments, it was found that for the top and bottom composite argon blowing process of the ladle, when the top blowing gun is located at the bottom of the ladle, the stirring effect on the steel liquid is the best, and the mixing time of the steel liquid gradually shortens with the increase in top blowing flow rate and bottom blowing flow rate. Under the same gas supply intensity in the ladle, top and bottom combined blowing can effectively increase the reaction interface area of steel slag and improve the mass transfer rate. The larger the top blowing flow rate, the faster the mass transfer rate, which is beneficial for improving the speed at which slag is pre-formed.
(2) Through numerical simulation research, it is found that the mixing effect of argon blowing on the top and bottom of the ladle is significantly better than that of pure bottom blowing. The higher the insertion depth of the top blowing gun, the faster the flow velocity inside and on the surface of the molten steel and the smaller the proportion of dead zones in the ladle, which is more conducive to the circulation flow of the molten steel and promotes the upward floating of inclusions.
(3) According to the results of water model and numerical simulation experiments, an industrial test was conducted in a certain factory, and the results before and after the test were compared: the average desulfurization rate of the steel liquid before and after combining argon blowing from the top and bottom of the ladle was 22.3%, the total oxygen content decreased by 25%, and the slag (FeO + MnO) decreased to 3.48%. The composite argon blowing process at the top and bottom of the ladle can shorten the slag formation time of the LF furnace, reduce the refining pressure in the subsequent process, and accelerate the production pace.
Author Contributions
Conceptualization, L.Y.; Methodology, L.Y. and Y.Y.; Software, C.W.; Formal Analysis, L.Y., Y.Y. and J.Z.; Data Curation, Y.Y., C.W. and L.Z.; Writing—Review and Editing, Y.Y., J.Z. and L.Z. All authors have read and agreed to the published version of the manuscript.
Funding
This research was funded by National Key R&D Program of China, grant number 2024YFB3713903.
Data Availability Statement
No new data were created or analyzed in this study. Data sharing is not applicable to this article.
Conflicts of Interest
Authors Libin Yang, Yibo Yuan, Chengyi Wang and Jinxuan Zhao were employed by the company Metallurgical Technology Institute, Central Iron and Steel Research Institute Co., Ltd. Author Luncai Zhu was employed by the company No. 4 Steelmaking and Rolling General Plant, Ma’anshan Iron and Steel Co., Ltd. The remaining authors declare that the research was conducted in the absence of any commercial or financial relationships that could be construed as a potential conflict of interest.
References
- Zhao, J.P.; Tang, G.Z.; Zeng, Y.N. Numerical Simulation on Removal of Inclusions in Molten Steel with Argon Blowing at Bottom of 100t Ladle. J. North China Univ. Sci. Technol. (Nat. Sci. Ed.) 2022, 44, 31–38. [Google Scholar]
- Yuan, Y.B.; Wu, G.C.; Han, Y.F.; Wang, C.Y.; Hao, Z.H.; Yang, L.B. Effect of ladle bottom blowing time on steel liquid cleanness. Jiangxi Metall. 2025, 4, 7. [Google Scholar]
- Li, Y.H.; Bao, Y.P.; Shen, X.W. Inclusions control study of DC06 steel in 300t ladle. Steel Mak. 2014, 30, 38–43. [Google Scholar]
- Tan, F.; He, Z.; Jin, S.; Pan, L.; Li, Y.; Li, B. Physical Modeling Evaluation on Refining Effects of Ladle with Different Purging Plug Designs. Steel Res. Int. 2020, 91, 1900606. [Google Scholar] [CrossRef]
- Yang, F.; Jin, Y.; Zhu, C.; Dong, X.; Lin, P.; Cheng, C.; Li, Y.; Sun, L.; Pan, J.; Cai, Q. Physical Simulation of Molten Steel Homogenization and Slag Entrapment in Argon Blown Ladle. Processes 2019, 7, 479. [Google Scholar] [CrossRef]
- Lu, W.L.; Yi, Y.B.; Zhang, J.M. Water modeling on double porous plugs bottom blowing in a 150t ladle. Jiangxi Metall. 2022, 42, 1–9. [Google Scholar]
- Guo, J.P.; Huang, H.H.; Guo, S.L. Optimization of Bottom agron Blowing Process for 90t Ladle. Hebei Met. 2022, 11, 41–45. [Google Scholar]
- Li, Z.; Ouyang, W.; Wang, Z.; Zheng, R.; Bao, Y.P.; Gu, C. Physical Simulation Study on Flow Field Characteristics of Molten Steel in 70t Ladle Bottom Argon Blowing Process. Metals 2023, 13, 639. [Google Scholar] [CrossRef]
- Xing, L.D.; Xiao, W.; Bao, Y.P. Process optimization of bottom-blown argon for 130t ladle furnace. Ironmak. Steelmak. 2023, 50, 894–899. [Google Scholar] [CrossRef]
- Wu, Q.Q.; Dong, J.F.; Wei, G.S. Physical simulation of bottom blowing argon in 150t ladle. Contin. Cast. 2022, 1, 45–48+61. [Google Scholar]
- Shan, Q.L.; Sun, Y.; Duan, H.J.; Li, Z.H.; Jia, N.; Chen, W. Water modeling on the transport phenomenon during bottom gas injection of a 210t ladle. Steel Mak. 2023, 39, 35–43. [Google Scholar]
- Yang, F.G.; Wang, X.Y.; Zhou, M.X.; Zheng, B.; Xu, D. Effect of Different Argon Blowing Modes on Refining Effect of Molten Steel. Spec. Steel 2024, 45, 54–60. [Google Scholar]
- Conejo, N.A.; Zhao, G.; Zhang, L. On the Limits of the Geometric Scale Ratio Using Water Modeling in Ladles. Metall. Mater. Trans. B 2021, 52, 2263–2274. [Google Scholar] [CrossRef]
- Zhao, Y.; Tao, X.; Li, L.; Guo, Z.; Qi, H.; Wang, J.; Yang, K.; Lin, W.; Fan, J.; Chen, C. Assessment of the Measured Mixing Time in a Water Model of Asymmetrical Gas-Stirred Ladle with a Low Gas Flowrate Part II: Effect of the Salt Solution Tracer Volume and Concentration. Symmetry 2025, 17, 802. [Google Scholar] [CrossRef]
- Wang, Q.G.; Liu, R.Z.; Zhu, R. Technology Research on Combined-blowing Dephosphorization of the 100t Ladle Furnace. Ind. Heat. 2015, 44, 30–33. [Google Scholar]
- Jochymczyk, D.; Warzecha, M.; Hutny, A. Industrial Investigations of S355 Steel-Grade Homogenization in a 100-Tonne Ladle Furnace. Materials 2025, 18, 180. [Google Scholar] [CrossRef]
- Tan, F.; Cao, H.; Lin, G. Mathematical Modeling of the Fluid Hydrodynamics and Refining Effects in a Gas-Stirred Ladle with Pulsed Bottom Blowing. Metall. Mater. Trans. B 2024, 55, 4624–4633. [Google Scholar] [CrossRef]
- Li, Y.; Deng, A.; Li, H.; Yang, B.; Wang, E. Numerical Study on Flow, Temperature, and Concentration Distribution Features of Combined Gas and Bottom-Electromagnetic Stirring in a Ladle. Metals 2018, 8, 76. [Google Scholar] [CrossRef]
- Wang, Y.K.; Liu, C.; Xiao, A.D.; Li, G.Q.; Wang, Q. Numerical simulation and nondimensionalization of slag eye morphology during bottom blowing refining process of ladle. J. Iron Steel Res. Int. 2025, 37, 579–589. [Google Scholar]
- Zhang, H.; Lei, H.; Ding, C.; Chen, S.; Xiao, Y.; Li, Q. Two-Way PBM–Euler Model for Gas and Liquid Flow in the Ladle. Materials 2023, 16, 3782. [Google Scholar] [CrossRef]
- Tabatabaei, Y.; Coley, S.K.; Irons, A.G. Tracking Inclusions during Ladle Refining Using a Kinetic Model for the Compositions of Metal, Slag, and Inclusions. Steel Res. Int. 2019, 90, 1900155. [Google Scholar] [CrossRef]
- Liang, T.; Qin, Z.; Wang, L. Correction: Liang et al. Effect of Al2O3 on Inclusion Removal in H13 Steels Using High-Basicity LF (Ladle Furnace) Refining Slags. Metals 2023, 13, 1592. Metals 2025, 15, 252. [Google Scholar] [CrossRef]
- Zonghui, L.; Guodong, S.; Zhiyin, D. Effect of slag adjustment on inclusions in Si–Mn-killed steel during ladle furnace (LF) refining process. Ironmak. Steelmak. 2021, 48, 893–900. [Google Scholar]
Disclaimer/Publisher’s Note: The statements, opinions and data contained in all publications are solely those of the individual author(s) and contributor(s) and not of MDPI and/or the editor(s). MDPI and/or the editor(s) disclaim responsibility for any injury to people or property resulting from any ideas, methods, instructions or products referred to in the content. |
© 2025 by the authors. Licensee MDPI, Basel, Switzerland. This article is an open access article distributed under the terms and conditions of the Creative Commons Attribution (CC BY) license (https://creativecommons.org/licenses/by/4.0/).