Article

Effects of Multi-Crack Initiation in High-Speed Railway Wheel Subsurface on Tread Peeling Lifetime

1
Zhan Tianyou College (CRRC College), Dalian Jiaotong University, Dalian 116028, China
2
CRRC TANGSHAN Co., Ltd., Tangshan 064000, China
3
School of Mechanical Engineering, Southwest Jiaotong University, Chengdu 610031, China
*
Authors to whom correspondence should be addressed.
Metals 2025, 15(10), 1148; https://doi.org/10.3390/met15101148
Submission received: 28 July 2025 / Revised: 1 October 2025 / Accepted: 3 October 2025 / Published: 16 October 2025
(This article belongs to the Special Issue Recent Advances in High-Performance Steel)

Abstract

The evolution characteristics of multi-source-fatigue-crack propagation in the subsurface of a high-speed wheel’s tread and its influence on tread peeling life are the basis for accurately evaluating wheel service lifetime. This study explores the influence of morphology distribution and the size of cracks in the tread on peeling life. The results show that the crack propagation mode in the wheel is mainly mode II and mode III composite propagation caused by shear stress. A fatigue crack inside the wheel with an angle of 45° represents the most dangerous situation. The maximum value of the von Mises stress inside the wheel increases with the increase in the number of multi-source cracks. The equivalent stress intensity factor (SIF) for multi-source cracks is higher than for a single crack. Also, mode III propagation has higher sensitivity to the number of cracks. The existence of multi-source cracks also increases the initial driving force ΔKeq of crack propagation. The results are useful for the evaluation of the service life of high-speed wheels.

1. Introduction

As one of the important load-bearing components of the high-speed train bogie, the service reliability of wheels is related to the service safety of trains. During the service process of high-speed trains, wheels usually need to bear complex multi-axial rolling contact fatigue (RCF) loads [1,2]. Under extreme loading conditions, the surface and subsurface of the wheel tread are prone to fatigue damage, leading to the initiation of one or more fatigue micro-cracks [3,4].
Once the cracks initiate on the wheel tread, stress concentration occurs at the crack tip under cyclic external loads, causing the initial cracks to propagate until wheel fracture. Existing research studies have shown that internal fatigue cracks in wheels typically exhibit complex multi-axial fatigue crack propagation. For multi-axial fatigue, the evaluation method is extremely crucial. Zhu et al. [5] proposed a new multi-axial fatigue elastoplastic model for high-speed train wheels and explored the evolution law of multi-axial fatigue damage in wheel steel. Yang et al. [6] proposed a fatigue reliability evaluation method that considers the influence of multi-axial fatigue loads on high-speed train wheels; this method can obtain equivalent stresses through multi-axial models and fatigue experiments and then predict multi-axial fatigue life. Peixoto et al. [7] established a two-dimensional FE model of wheel and rail coupled with subsurface cracks in the wheel; it was found that wheel cracks propagate with the combined action of tension and shear stress. The maximum shear stress criterion was used to calculate the crack propagation direction and the SIF during propagation. Nejad et al. [8] studied fatigue crack propagation in wheels by establishing a complete three-dimensional FE model of the wheel, considering the influence of existing residual stress after wheel heat treatment. Under normal conditions, the fatigue cracks of the wheel mainly propagate driven by the II and III mixed mode, but if residual stress exists, mode I accelerates crack propagation and reduces the fatigue lifetime of the wheel. From the above studies, based on the finite element method (FEM) and experimental tests, simplified models are usually established to evaluate complex multi-axial fatigue crack initiation and propagation in railway wheels. In addition, high-speed railway wheels is usually serviced under different conditions, such as linear conditions and curve conditions, where the wheels present complex multi-axial fatigue crack initiation and propagation characteristics. Yan et al. [9] tested and performed an FE analysis on the crack growth rates of I–II mixed-mode cracks at different angles in high-speed train wheels. The results show that the mode II SIF of mixed-mode cracks under different wheel roundness conditions is the main driving force for crack propagation. Zhang et al. [10] investigated the effects of the loading ratio on the fatigue limit and fatigue life of ER8 steel, commonly used in high-speed train wheels under multi-axial fatigue loads. The results show that the cyclic micro-plastic strain patterns and fatigue damage behaviors caused by multi-axial fatigue undergo significant changes.
Accurately mastering the propagation characteristics and evolution laws of micro-cracks on the tread of high-speed train wheels under harsh rolling contact loads is the theoretical basis for determining the coupled competition between fatigue and wear during the wheel RCF process, predicting the remaining service life of wheels, and formulating reasonable maintenance cycles. For fatigue crack propagation, the combination of the FEM and damage tolerance theory has become an effective approach; it has been widely used by researchers at home and abroad. Zeng et al. [11] studied the influence of surface defects on the RCF of railway wheel steel. The increase in defect size increases the stress concentration, thereby reducing RCF life. The Fatemi–Socie multi-axial fatigue parameter combined with critical distance theory can be used to predict the effect of defect size on RCF life. Haidemenopoulos et al. [12] analyzed the initiation and propagation of rail RCF cracks from the perspective of geometric characteristics such as crack length, depth from the surface, crack propagation angle, and crack spacing. Through metallographic analysis of the fracture surfaces, the crack initiation zone and quasi-cleavage zone were identified. Liu et al. [13] proposed a subsurface crack propagation analysis method for the RCF problem of wheels and rails. This method can characterize complex wheel–rail contact stresses and consider the influence of non-proportional loads. The sub-model method was employed to construct a wheel–rail FE model and calculate the SIF. The effects of wheel diameter, vertical load, and initial-crack size and position on SIF amplitude were investigated. Cho et al. [14] proposed a three-dimensional FEM for studying inclined RCF cracks. By comparing it with the existing two-dimensional FE model, the correctness of the model was verified. The effects of main factors such as crack depth and inclination angle on the SIF distribution were studied, and the SIF distributions at the crack tip were obtained. Meray et al. [15] proposed a three-dimensional simulation method for modeling non-planar RCF crack propagation. By combining the semi-analytical method (SAM) with the extended finite element method (X-FEM), this approach can simulate crack propagation under RCF loads. It is effective in rapidly and accurately modeling the complex propagation behavior of three-dimensional cracks. Ringsberg et al. [16] proposed an FE calculation method to predict the propagation pattern of short cracks under RCF loads. By comparing the elastoplastic and linear elastic models, it was found that the elastoplastic model can better simulate the propagation of short cracks with a length of 0.1–0.2 mm. Butini et al. [17] developed a modeling method for railway applications by combining wheel–rail wear and RCF. This model can simultaneously account for the wear conditions of both wheels and rails, as well as RCF crack propagation, and can also predict the location and size of wheel–rail RCF cracks. From the above publications, the FEM and related models are effective in evaluating the wheel RCF process.
When multi-source cracks initiate within a wheel, they may be located at different positions in the subsurface of the wheel tread, with varying distances and spatial configurations among the cracks. How secondary or third cracks affect the propagation of the main crack is crucial to accurately determining the remaining fatigue life of the wheel and formulating reasonable maintenance cycles. Huang et al. [18] studied the formation and damage mechanism of surface cracks in wheel–rail materials under RCF conditions and in dry environments. Secondary cracks with a layered structure were generated in the subsurface of the wheel, and after 1.5 × 10⁵ cycles, significant changes in vertical forces notably affected crack propagation. Dubourg et al. [19,20] studied structural multiple-crack propagation by using fracture mechanics, and it was found that the distance between cracks, the structural loading area, and the friction coefficient between crack surfaces affect the interactions among multiple cracks.
Based on the above studies, although there are some studies on surface fatigue crack initiation and propagation in wheels and other types of mechanized equipment, research on the propagation and interaction of subsurface cracks when multiple fatigue cracks initiate in the subsurface tread of high-speed railway wheels is very limited. However, these aspects are very important to formulating maintenance plans and evaluating the remaining life of wheels. These studies serve as the theoretical basis for accurately determining wheel tread maintenance plans and evaluating the remaining service life of wheels.

2. Analysis of the Peeling of the Wheel Tread

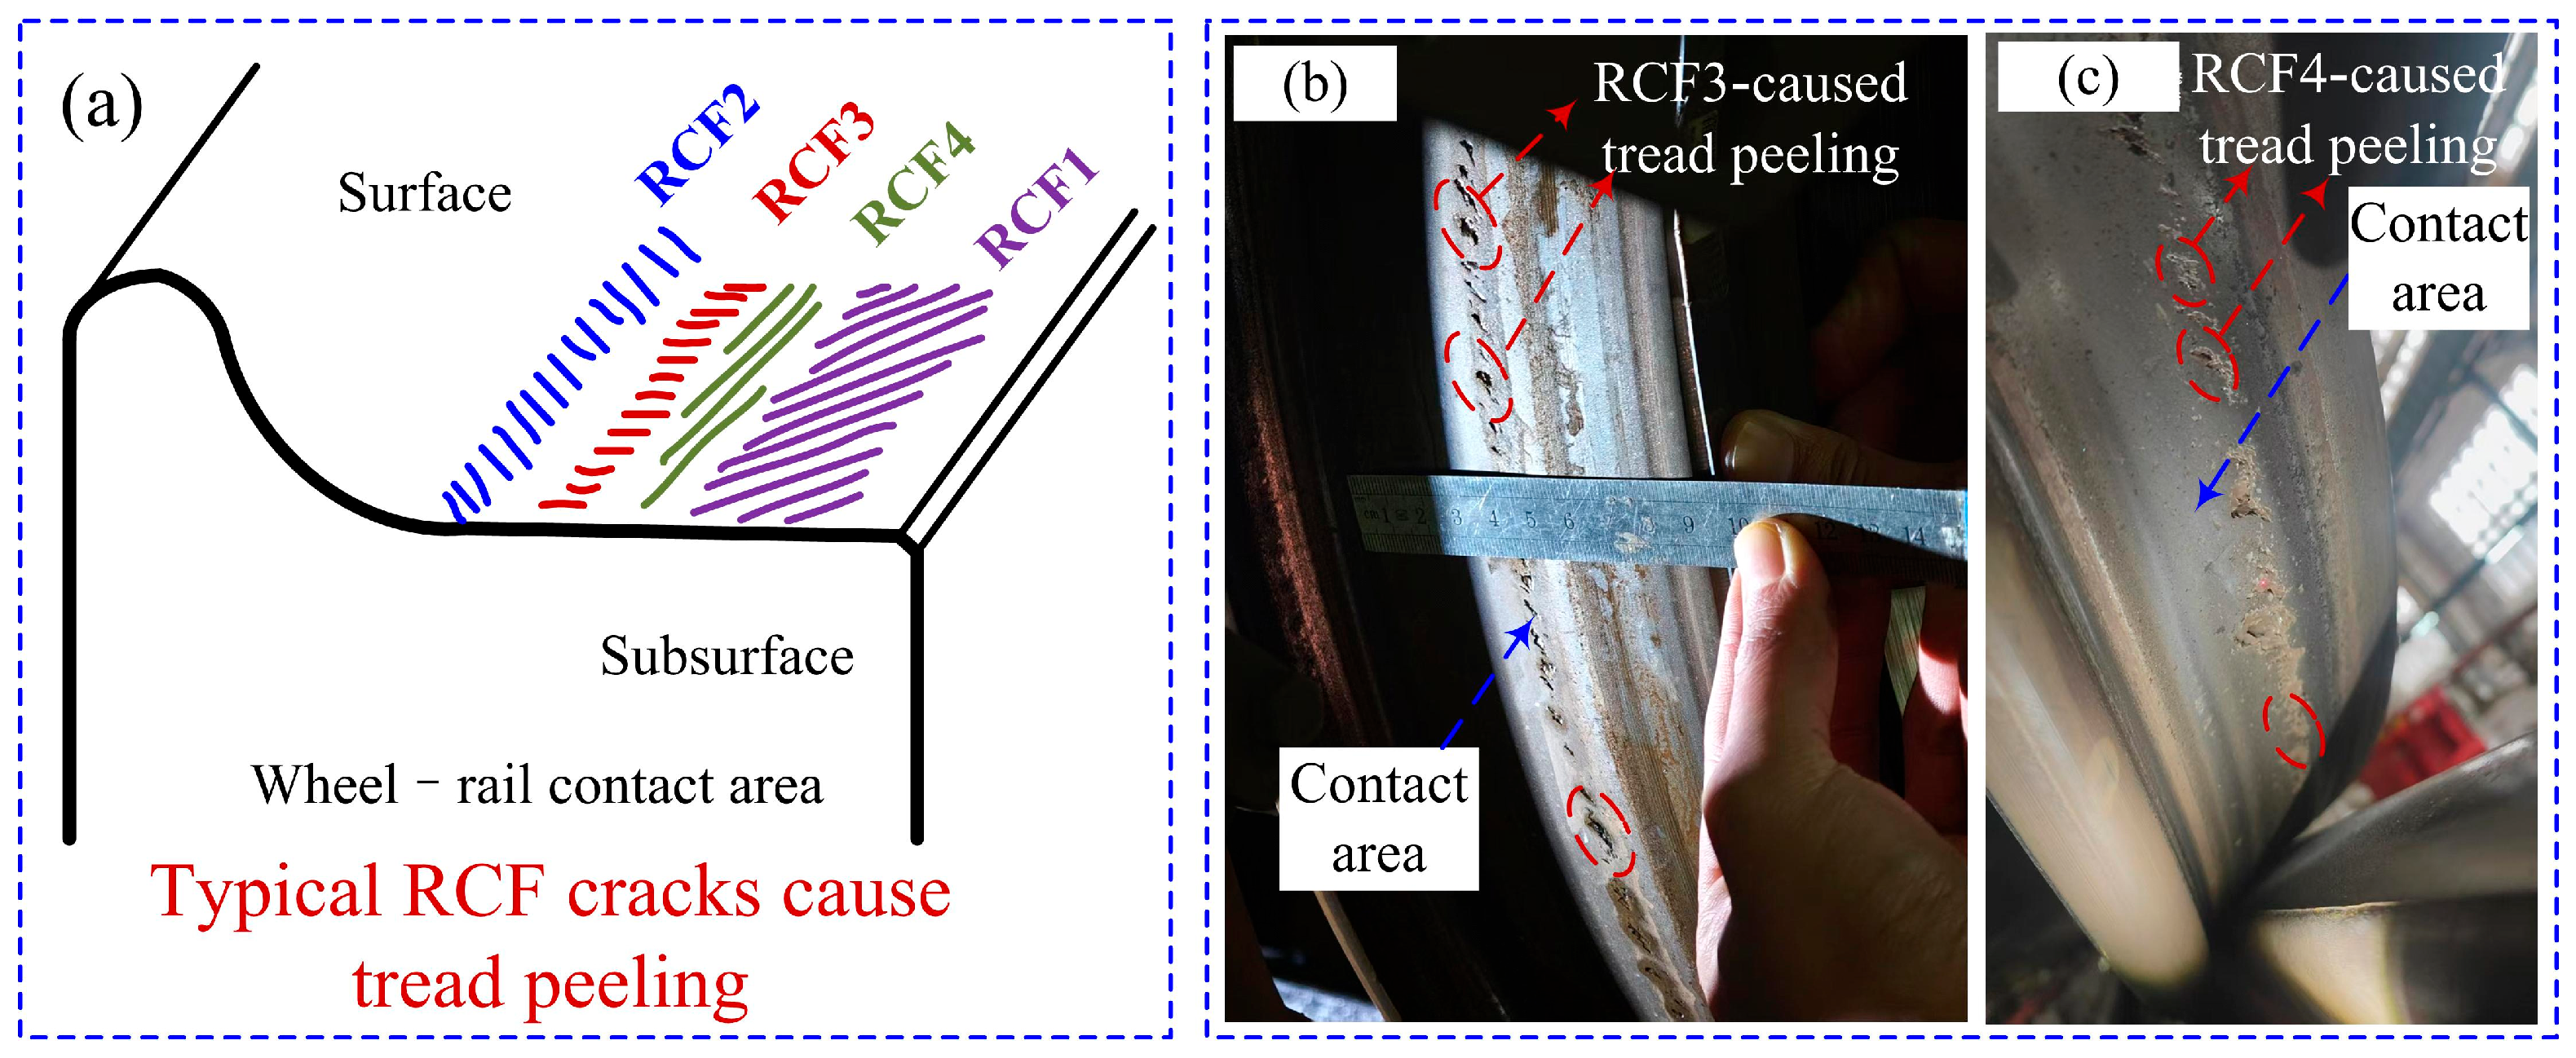
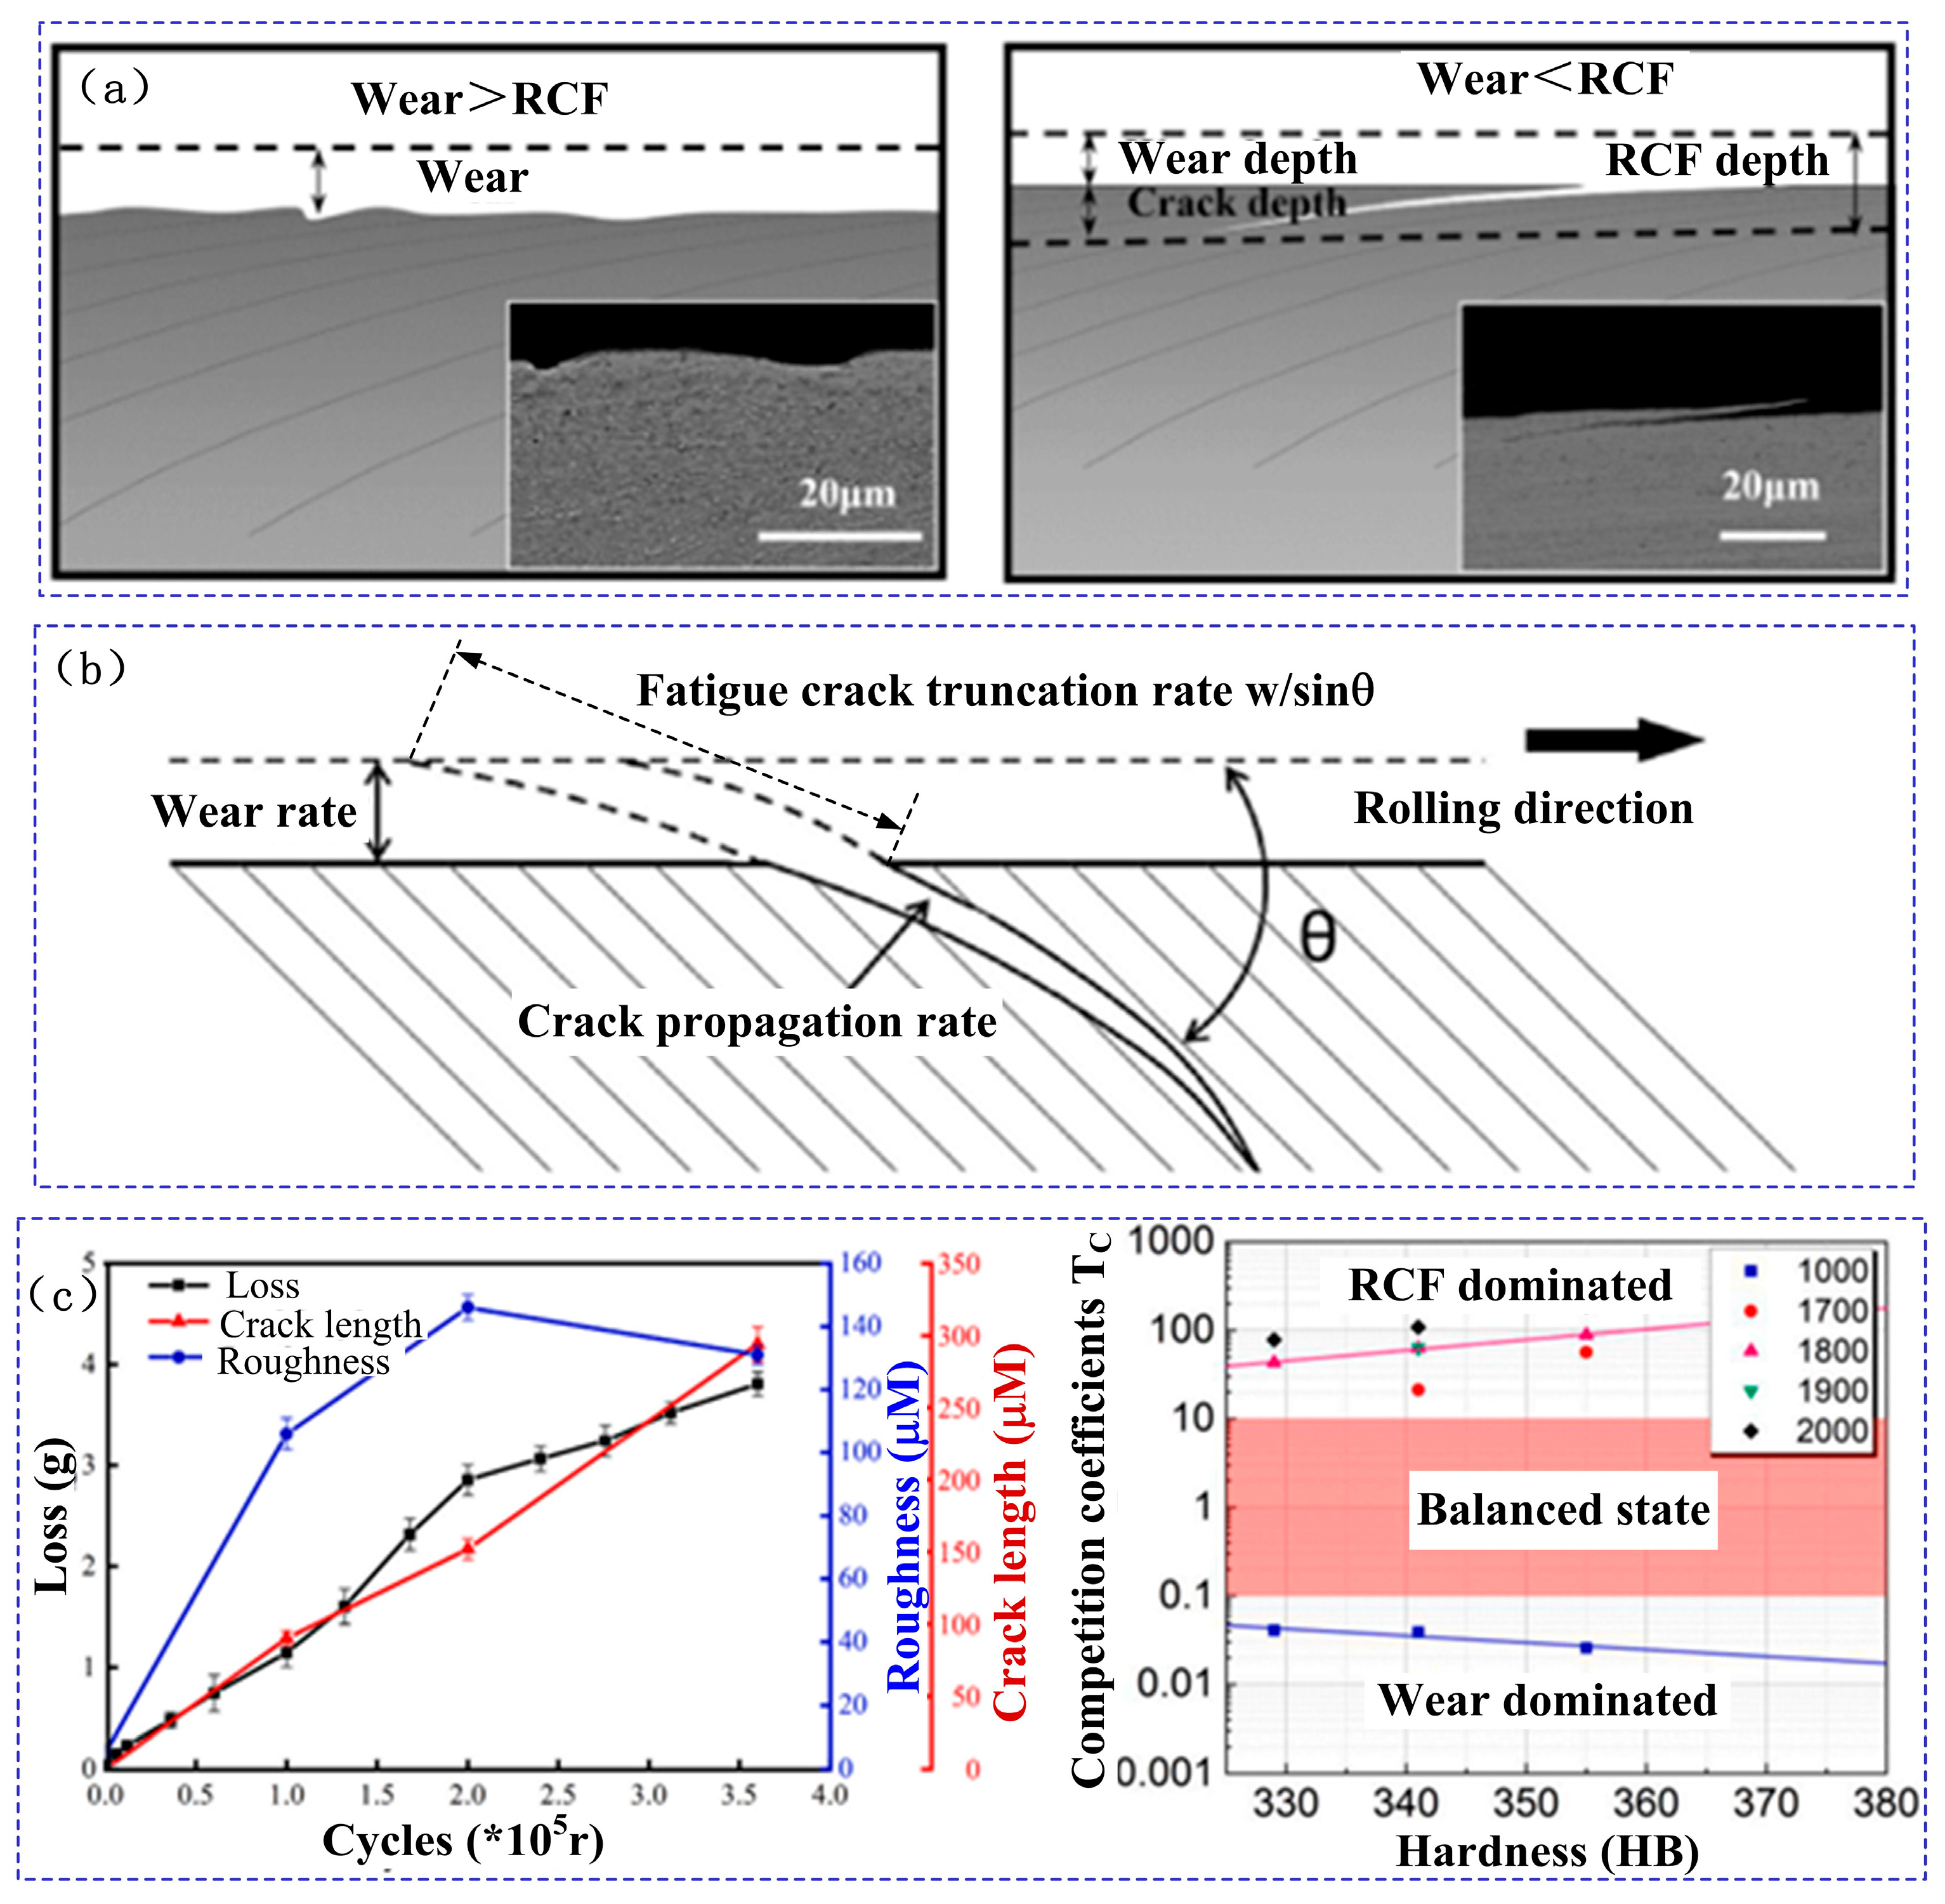
Fatigue crack initiation and propagation on the railway wheel tread are related to both surface wear and fatigue processes. As shown in Figure 1a, during the continued service process of wheels, if the propagation rate of micro-cracks initiated on the tread surface is low, the cracks are usually removed by wear under the tangential load between the wheel and the rail, which does not result in fatigue failure such as tread peeling. However, if micro-cracks initiate on the surface or in the subsurface of the wheel tread, they propagate at a high rate due to the competition between fatigue and wear during the wheel’s continuous service process; the propagation rate of fatigue cracks exceeds the wear rate of wheel surface materials, and if wheel tread reprofiling is not timely performed, it will cause tread peeling and even lead to wheel rim fracture, seriously affecting the service safety of high-speed trains [2], as shown in Figure 1b, where typical large-scale tread peeling is presented. Therefore, determining the anti-fatigue crack propagation characteristics of high-speed train treads is of great theoretical and engineering significance.
During the actual service conditions of high-speed train wheels, RCF damage between the wheel and the rail often occurs, and then, fatigue micro-cracks appear on the tread surface. According to the different service conditions of railway vehicles, the RCF micro-cracks generated on the wheel tread are mainly of four types, namely, rolling contact fatigue 1 (RCF1), rolling contact fatigue 2 (RCF2), rolling contact fatigue 3 (RCF3), and rolling contact fatigue 4 (RCF4), as shown in Figure 2a. RCF1 mainly occurs close to the outer side of the wheel tread, forming an angle of approximately 30° to 45° with the axial direction; the repetitively longitudinal and transverse rolling frictional sliding force usually induces the appearance of this type of fatigue damage when the train passes through a curve. RCF2 mainly occurs close to the inner side of the wheel tread, with an angle of approximately 30° to 60° with the axial direction; the repetitively longitudinal and transverse rolling frictional sliding forces often cause the initiation of these cracks when the train passes through a curve. RCF3 mainly occurs at the contact position of the rolling circle of the wheel tread, with an angle of approximately 0 to 10° with the axial direction. It mainly occurs when the wheel slips or idles with the train traveling at a relatively low speed. RCF4 mainly occurs on the outer side of the rolling circle of the wheel tread, with an angle of approximately 0 to 80° with the axial direction; the initiation of these cracks is caused by relatively high transverse rolling frictional sliding force.
Through the tracking and investigation of in-service high-speed trains in China, it is found that tread peeling usually occurs due to RCF [21,22], as shown in Figure 2. After a certain period of service, new wheels often experience tread peeling near the rolling contact area of the wheel and the rail, exhibiting the characteristic of multi-point peeling, as shown in Figure 2b. After the damaged wheel is resurfaced and continues to be in service, RCF damage will occur once again. Continued tread peeling will often occur near the area of the contact region and will still exhibit the characteristic of multi-point peeling, as shown in Figure 2c.
The RCF damage occurring during the actual service of high-speed trains is the result of the combined effects of fatigue and sliding wear. Whether rapid peeling will occur depends on the coupling and competitive relationship between fatigue and wear. At present, some progress has been made in research on the coupling and competitive relationship between fatigue and wear. The coupling and competitive relationship between wear and fatigue is shown in Figure 3. Scholars generally hold that the coupling and competitive relationship between fatigue and wear during the RCF damage process of wheels and rails is actually the competitive relationship between the wear rate and the fatigue crack propagation rate during RCF [23,24,25,26,27]. If the propagation rate of fatigue cracks is higher than the wear rate, contact fatigue damage will cause structural failure. Conversely, if the wear rate is higher than the propagation rate of fatigue cracks, surface wear will lead to structural failure.
From the above analysis, during the RCF damage process of high-speed train wheel treads, if the propagation rate of tread fatigue cracks is significantly higher than the wear rate, it will result in rapid tread peeling. If the tread peeling size is large enough, it will cause the wheel to be scrapped. On the other hand, during RCF damage to the tread, numerous micro-cracks are usually initiated along the circumferential direction of the wheel. Therefore, for the multi-source micro-cracks induced by RCF damage in the dangerous area of the wheel tread, determining the crack propagation resistance characteristics is of great engineering and theoretical significance.
To investigate the mutual influence of initiation, propagation, and peeling multi-point fatigue cracks, in this paper, by means of the FEM, on the basis of identifying the dangerous area of the wheel under wheel–rail contact load, the mutual effects of single-fatigue-crack initiation and multi-source-fatigue-crack initiation on crack propagation and the tread peeling life of the ER8 wheel are comparatively studied.

3. Simulation Analysis Method of Fatigue Crack Propagation

In this paper, the FEM is employed to establish the wheel–rail contact model, and co-simulations of fatigue crack propagation behavior under different conditions are performed using the software programs ABAQUS 2020 and FRANC3D. This method enables us to conveniently and accurately obtain the mode I, mode II, and mode III SIFs, as well as the equivalent SIF and fatigue crack propagation path for different normalized distances of the crack front, based on M-integration. The ABAQUS software program is utilized for preprocessing the FE model, while the FRANC3D software program is used to simulate crack propagation.

3.1. FE Models

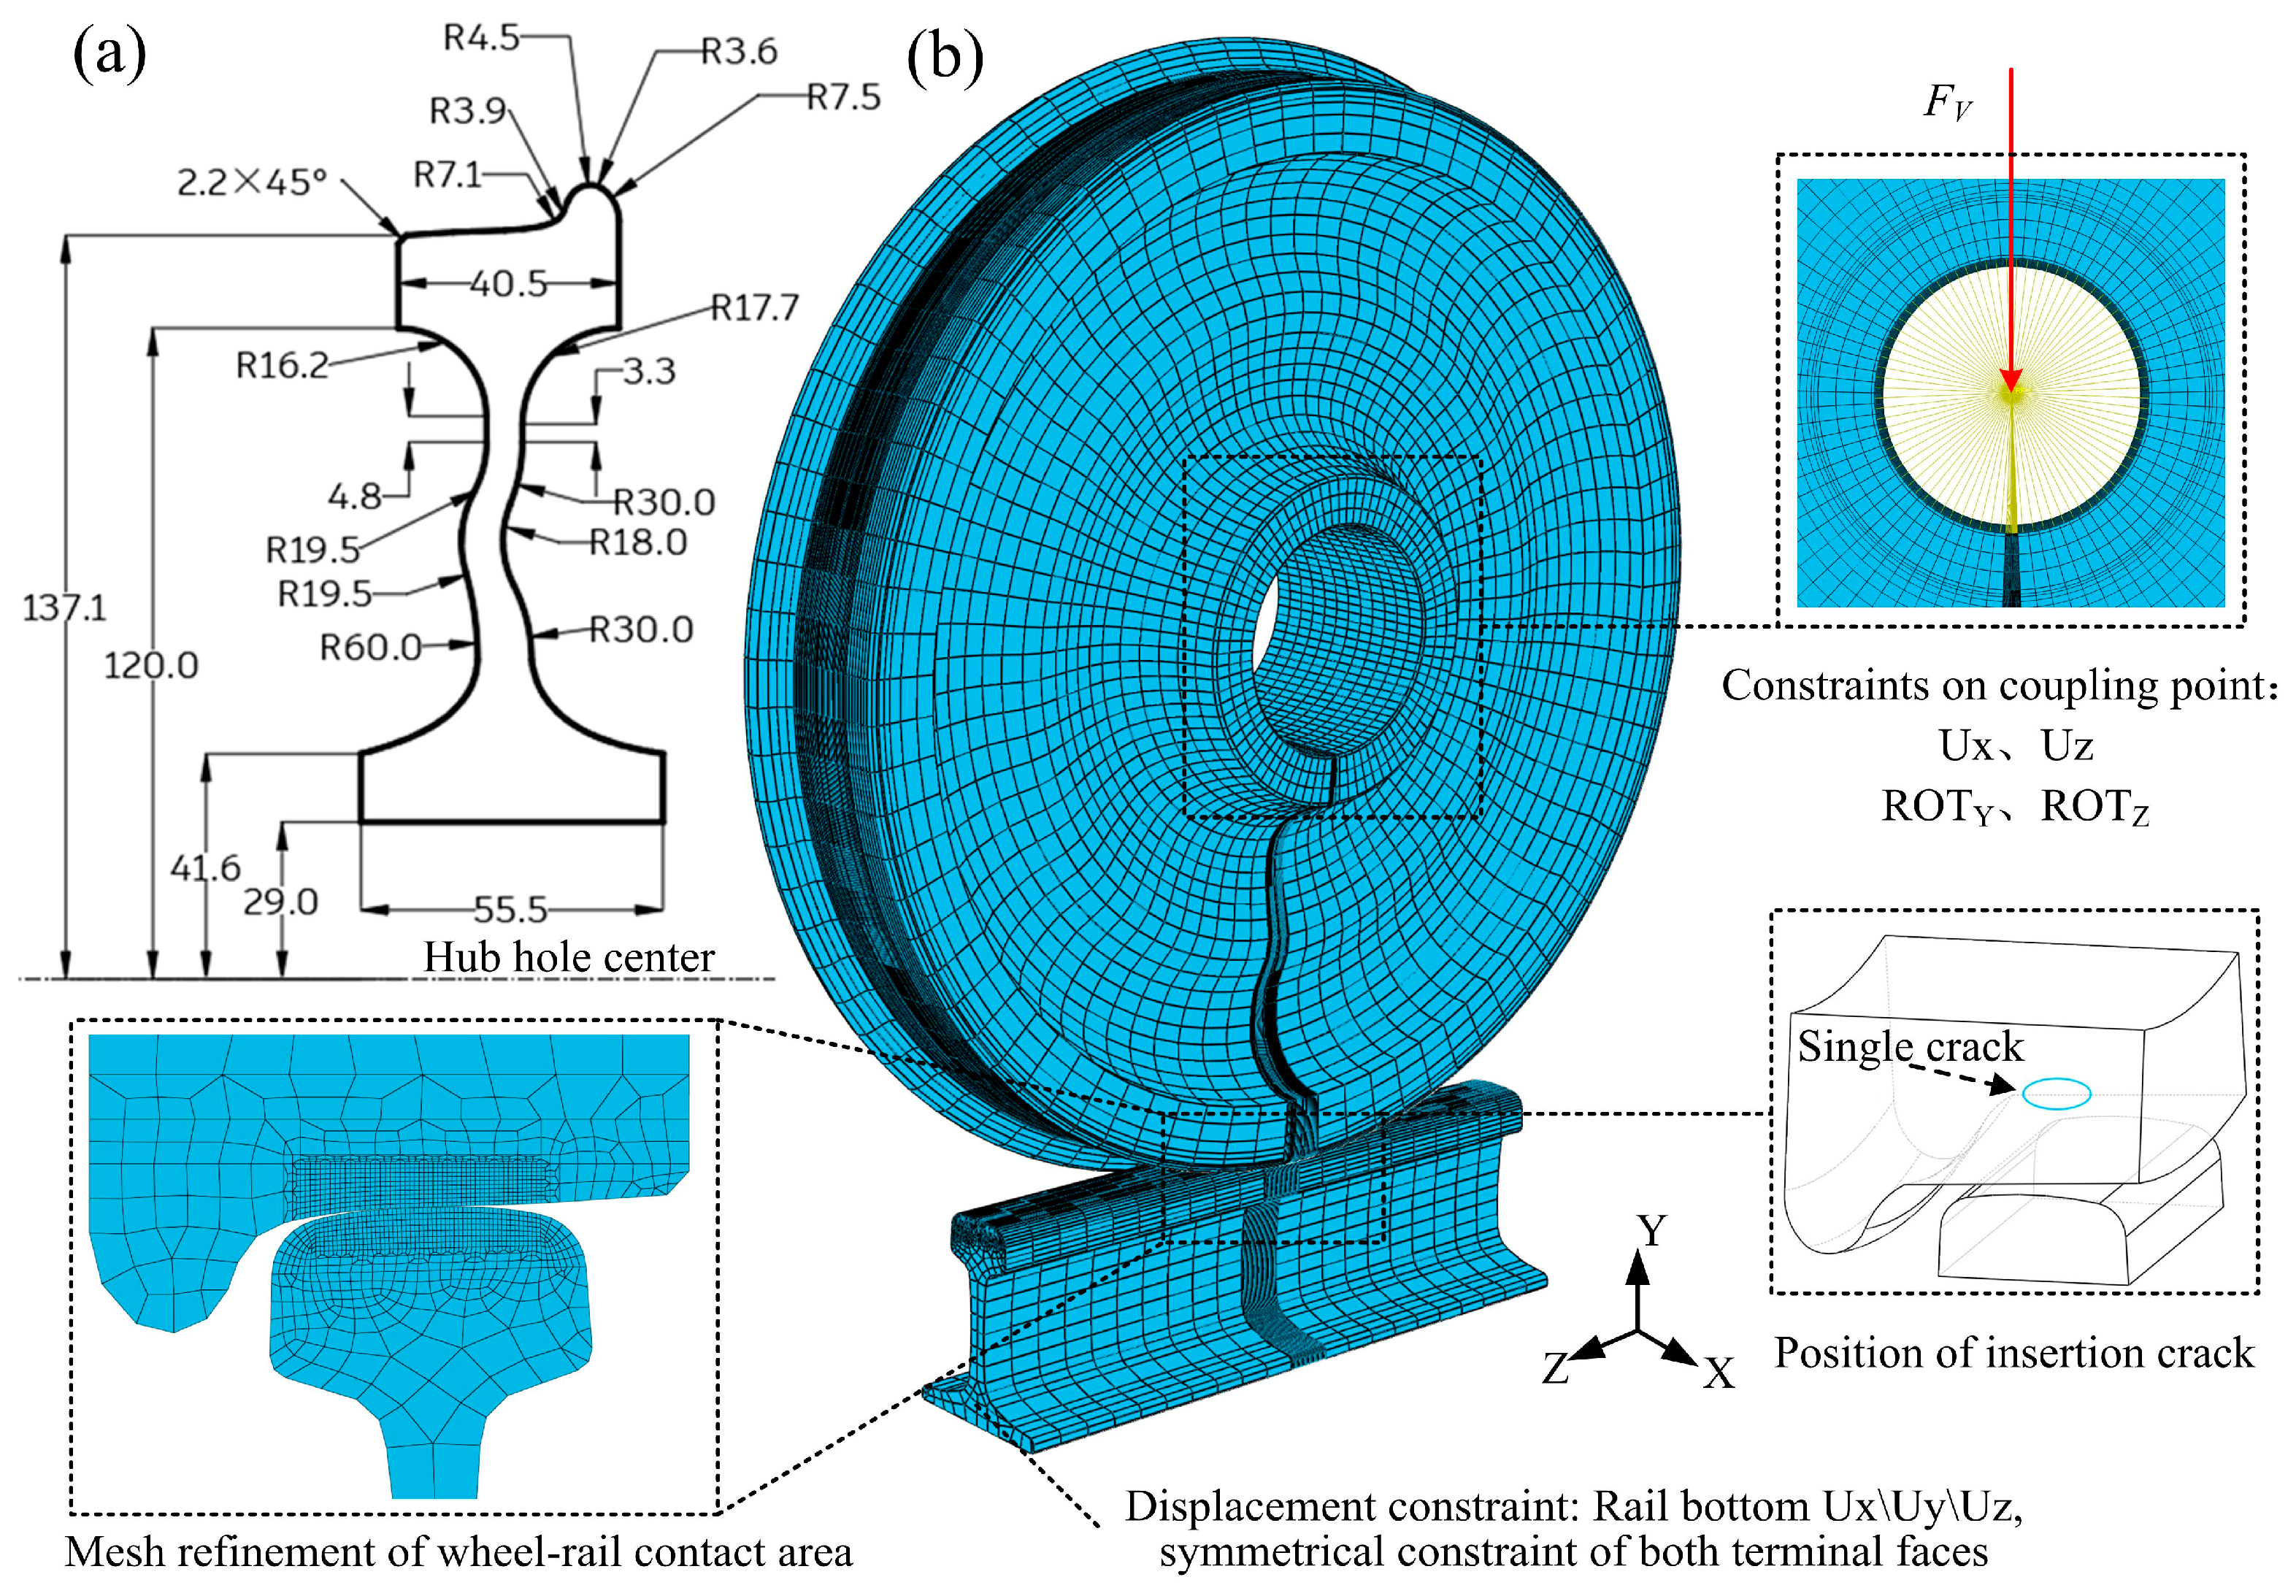
This paper takes the wheels of the Chinese high-speed EMU train as the research object, and the wheel dimensions are shown in Figure 4a. The material is of Grade ER8 in accordance with EN 13262. The diameter of the wheel’s rolling circle is 920 mm. The S1002CN-type tread is adopted, and the rail is a 60 rail. It is assembled in accordance with the standard requirements. The rail base slope is 1:40. A rectangular coordinate system is established, where the transverse direction serves as the X-axis, the vertical direction as the Y-axis, and the advancing direction of the vehicle as the Z-axis, as shown in Figure 4. To improve the calculation accuracy and efficiency of the model, a local refinement method is adopted when creating the FE mesh at the contact zone or in stress concentration areas; the FE size was set to 1 mm for the railway wheel and rail after conducting a mesh sensitivity study, and a quadratic shape function was used. The model had a total of 169,178 nodes and 156,480 C3D8R elements. To discuss the influence of multi-source cracks on the propagation behavior of the main fatigue crack, this paper inserts an initial crack in the area with the maximum stress and carries out a simulation analysis of the propagation behavior of the initial crack under the action of fatigue load.

3.2. Boundary Conditions

The boundary conditions were set as shown in Figure 4. Normal hard contact with a friction coefficient of 0.15 was defined between the wheel and the rail to avoid normal penetration. Full constraints were imposed on the bottom of the rail, and symmetric constraints were applied to the rail’s end face. A reference point was established at the wheel’s center, and the nodes on the inner surface of the hub hole were coupled to this reference point. The translational movements in the X and Y directions and the rotational movements in the Y and Z directions of the coupling point were constrained. A vertical load FV was applied at the coupling point. For static calculations, FV was set to half of the 17-ton axle load, as the wheel under calculation originates from a bogie with a 17-ton axle load. The material parameters of the wheel and rail are listed in Table 1.
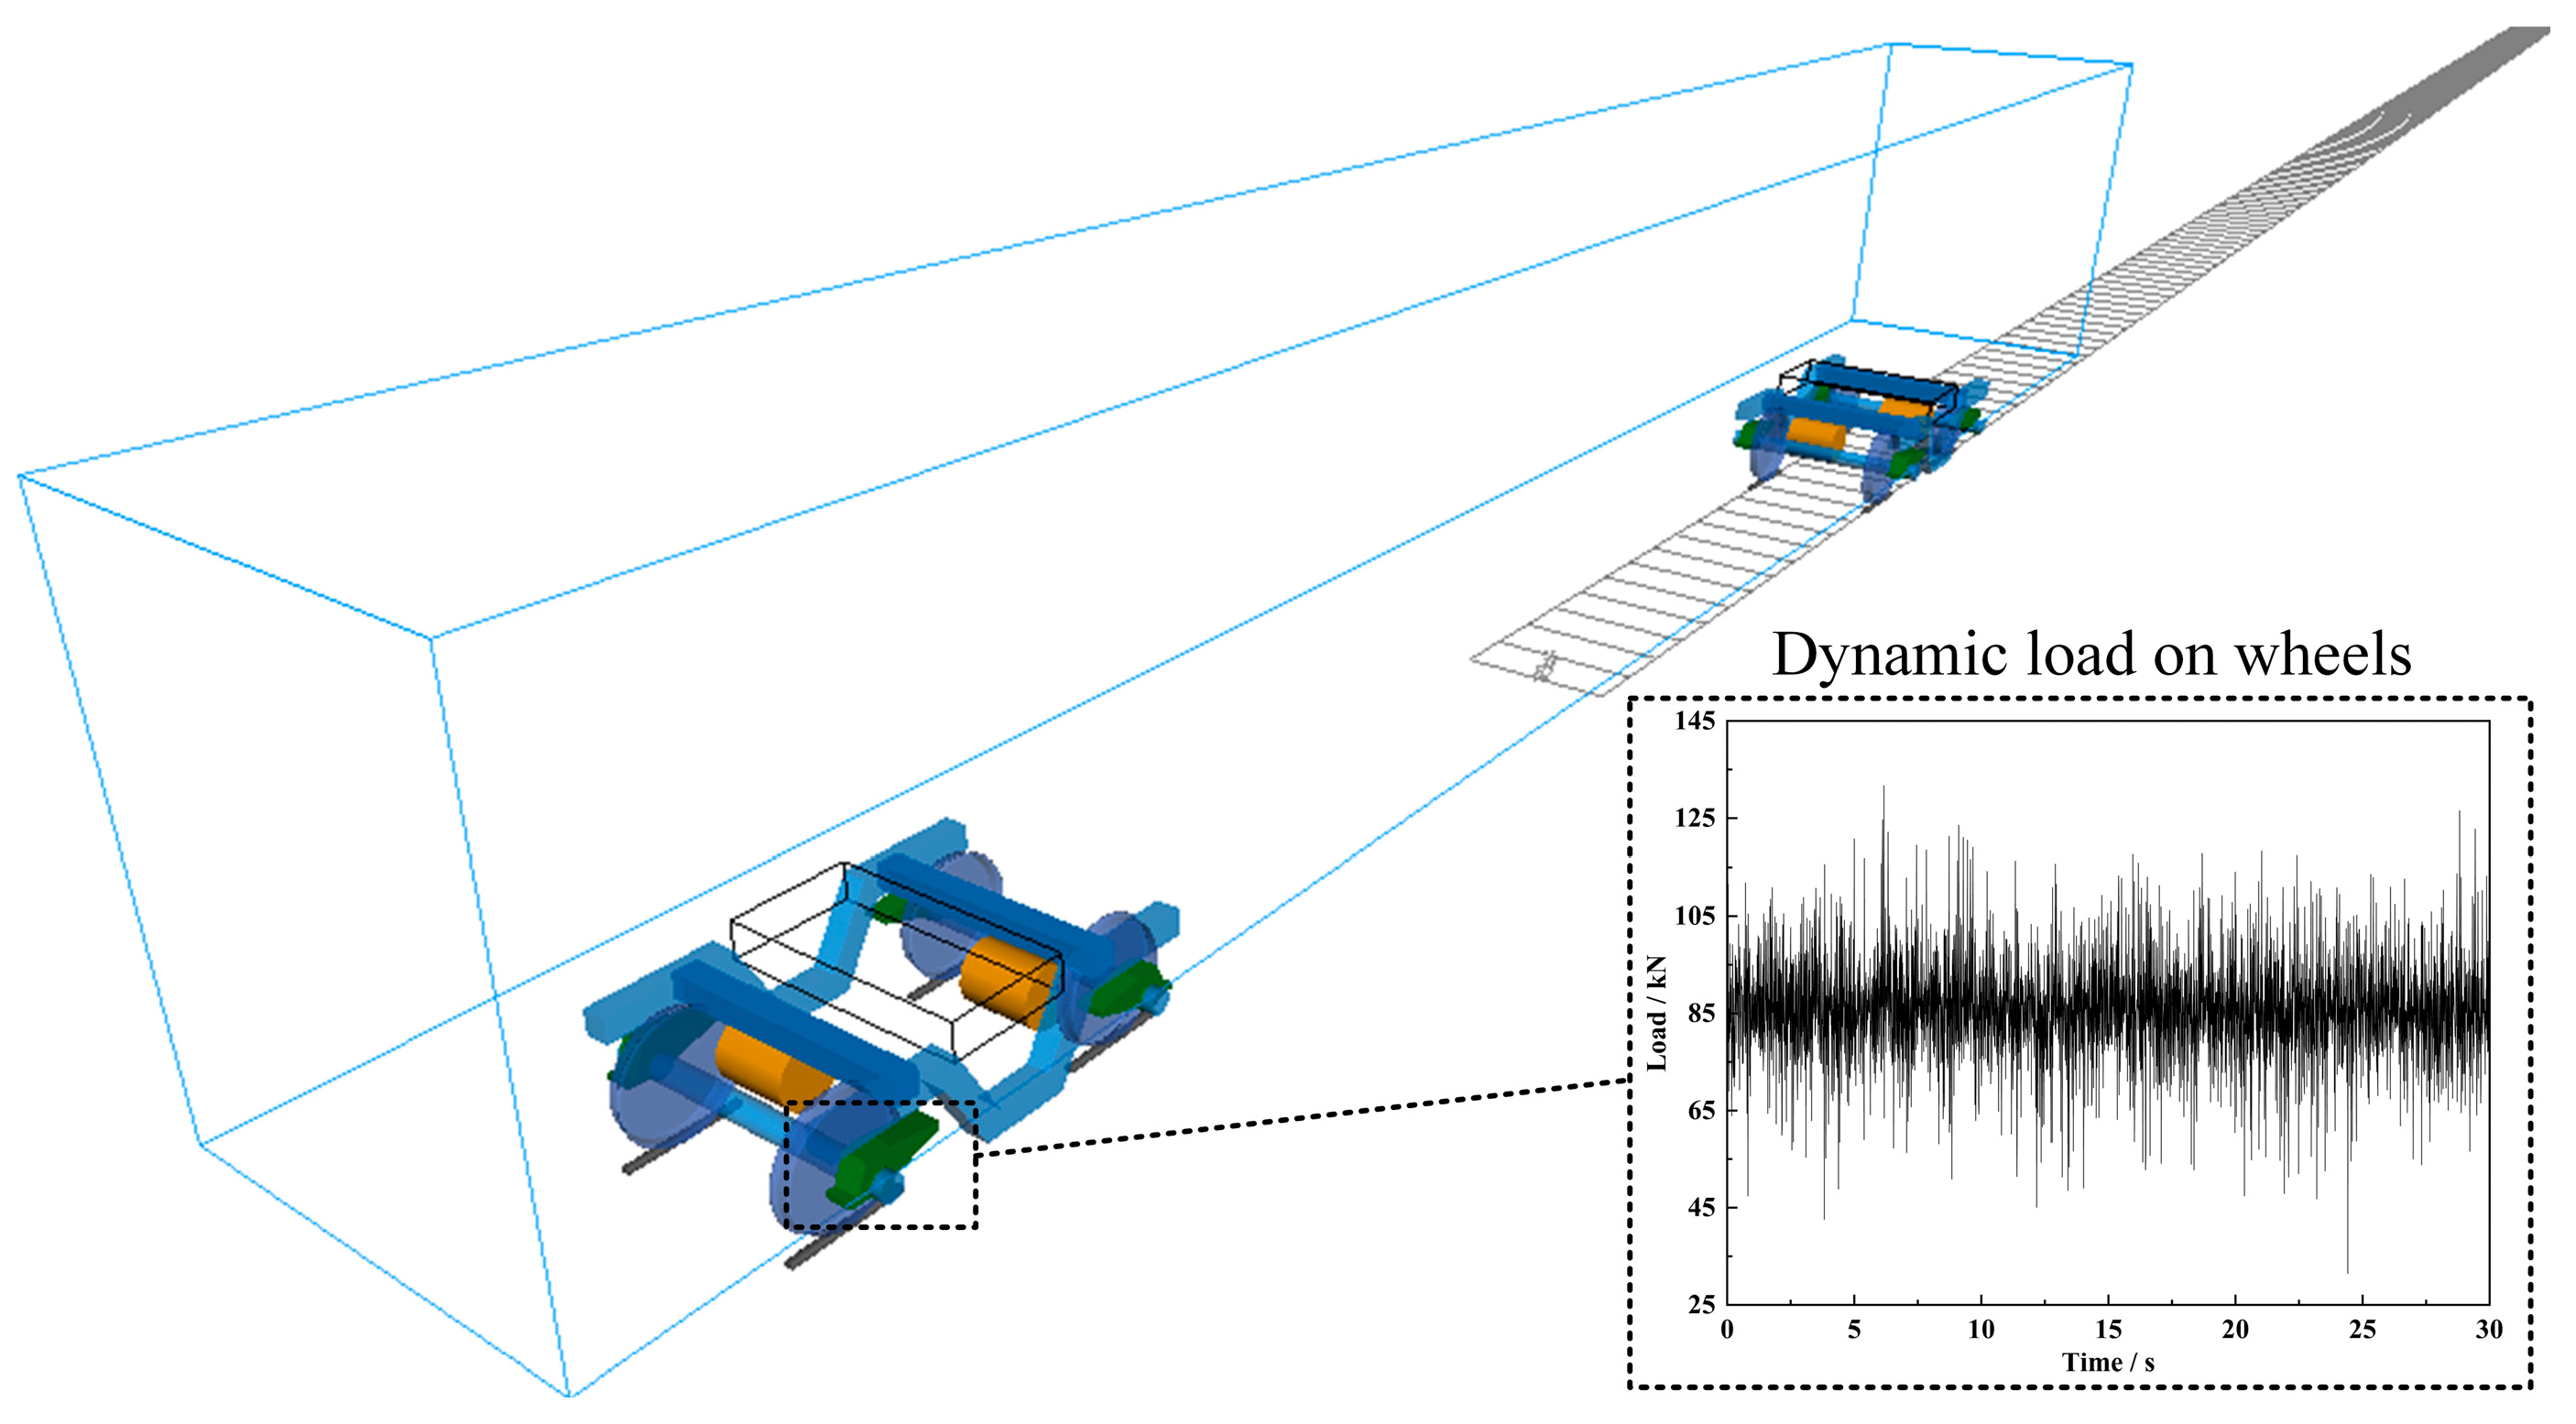
During the normal service process of a train, the load on the wheel is not constant but fluctuates. Therefore, in this paper, the software program SIMPACK 2019x was utilized to perform dynamic simulation according to the typical service parameters of the Chinese high-speed EMU train. The dynamic load on the wheel during vehicle operation was extracted, and the vehicle dynamics simulation model is shown in Figure 5.
Before conducting the dynamic analysis, the correctness of the model was verified. Taking the service speed of 350 km/h as the analysis speed, the service curve radius was chosen as 7000 m, and the high-speed railway spectrum was selected as the excitation spectrum; the maximum values of various dynamic indicators were chosen for analysis and verification, and the results are listed in Table 2. In accordance with the standard “Evaluation and Test Identification Specification for the Dynamic Performance of Locomotives and Vehicles” [29], all indexes of the vehicle dynamics model met the requirements, indicating that the model was correctly established.
Since the train is mostly in service under linear working conditions, this paper conducted research based on the vehicle’s linear working condition. Figure 2 shows the dynamic load exerted on the wheels when the train is running at a speed of 350 km/h. As the load fluctuation law is basically the same, only the data within 30 s of driving were extracted for analysis. The data were processed using the rain flow counting method to obtain the load spectrum of the wheels under linear conditions, as listed in Table 3.

3.3. Determination Method of SIFs

The SIF is one of the key parameters for evaluating the stress field and displacement field at the crack tip [30]. The calculation method for the multi-axial SIF of a crack under external load refers to the paper published by the author’s research team [31].
The fatigue crack growth rate can be described by the Paris formula [30,32], and its expression is as follows:
d a d N = C K e q m
where C and m are material-related parameters, with ln(C) = −17.62 and m = 2.52 [33]. Keq denotes the equivalent stress intensity factor, and its expression is given in Equation (2) [28,31].
K e q = K I n + β K II n + γ K III n 1 n
where β and γ are weight factors. Through FE simulation, the Δa and ΔN after each cycle of crack propagation can be obtained. According to Δa/ΔN ≈ da/dN, the crack growth rate Δai/ΔNi corresponding to the crack growth amount Δai under the driving force of the equivalent SIF ΔKeq can be obtained, thus enabling the acquisition of the da/dN−ΔKeq curve for any crack propagation path.

4. Analysis of Fatigue Crack Propagation in the Dangerous Area of the Wheel

4.1. Determination of the Dangerous Area of the Wheel

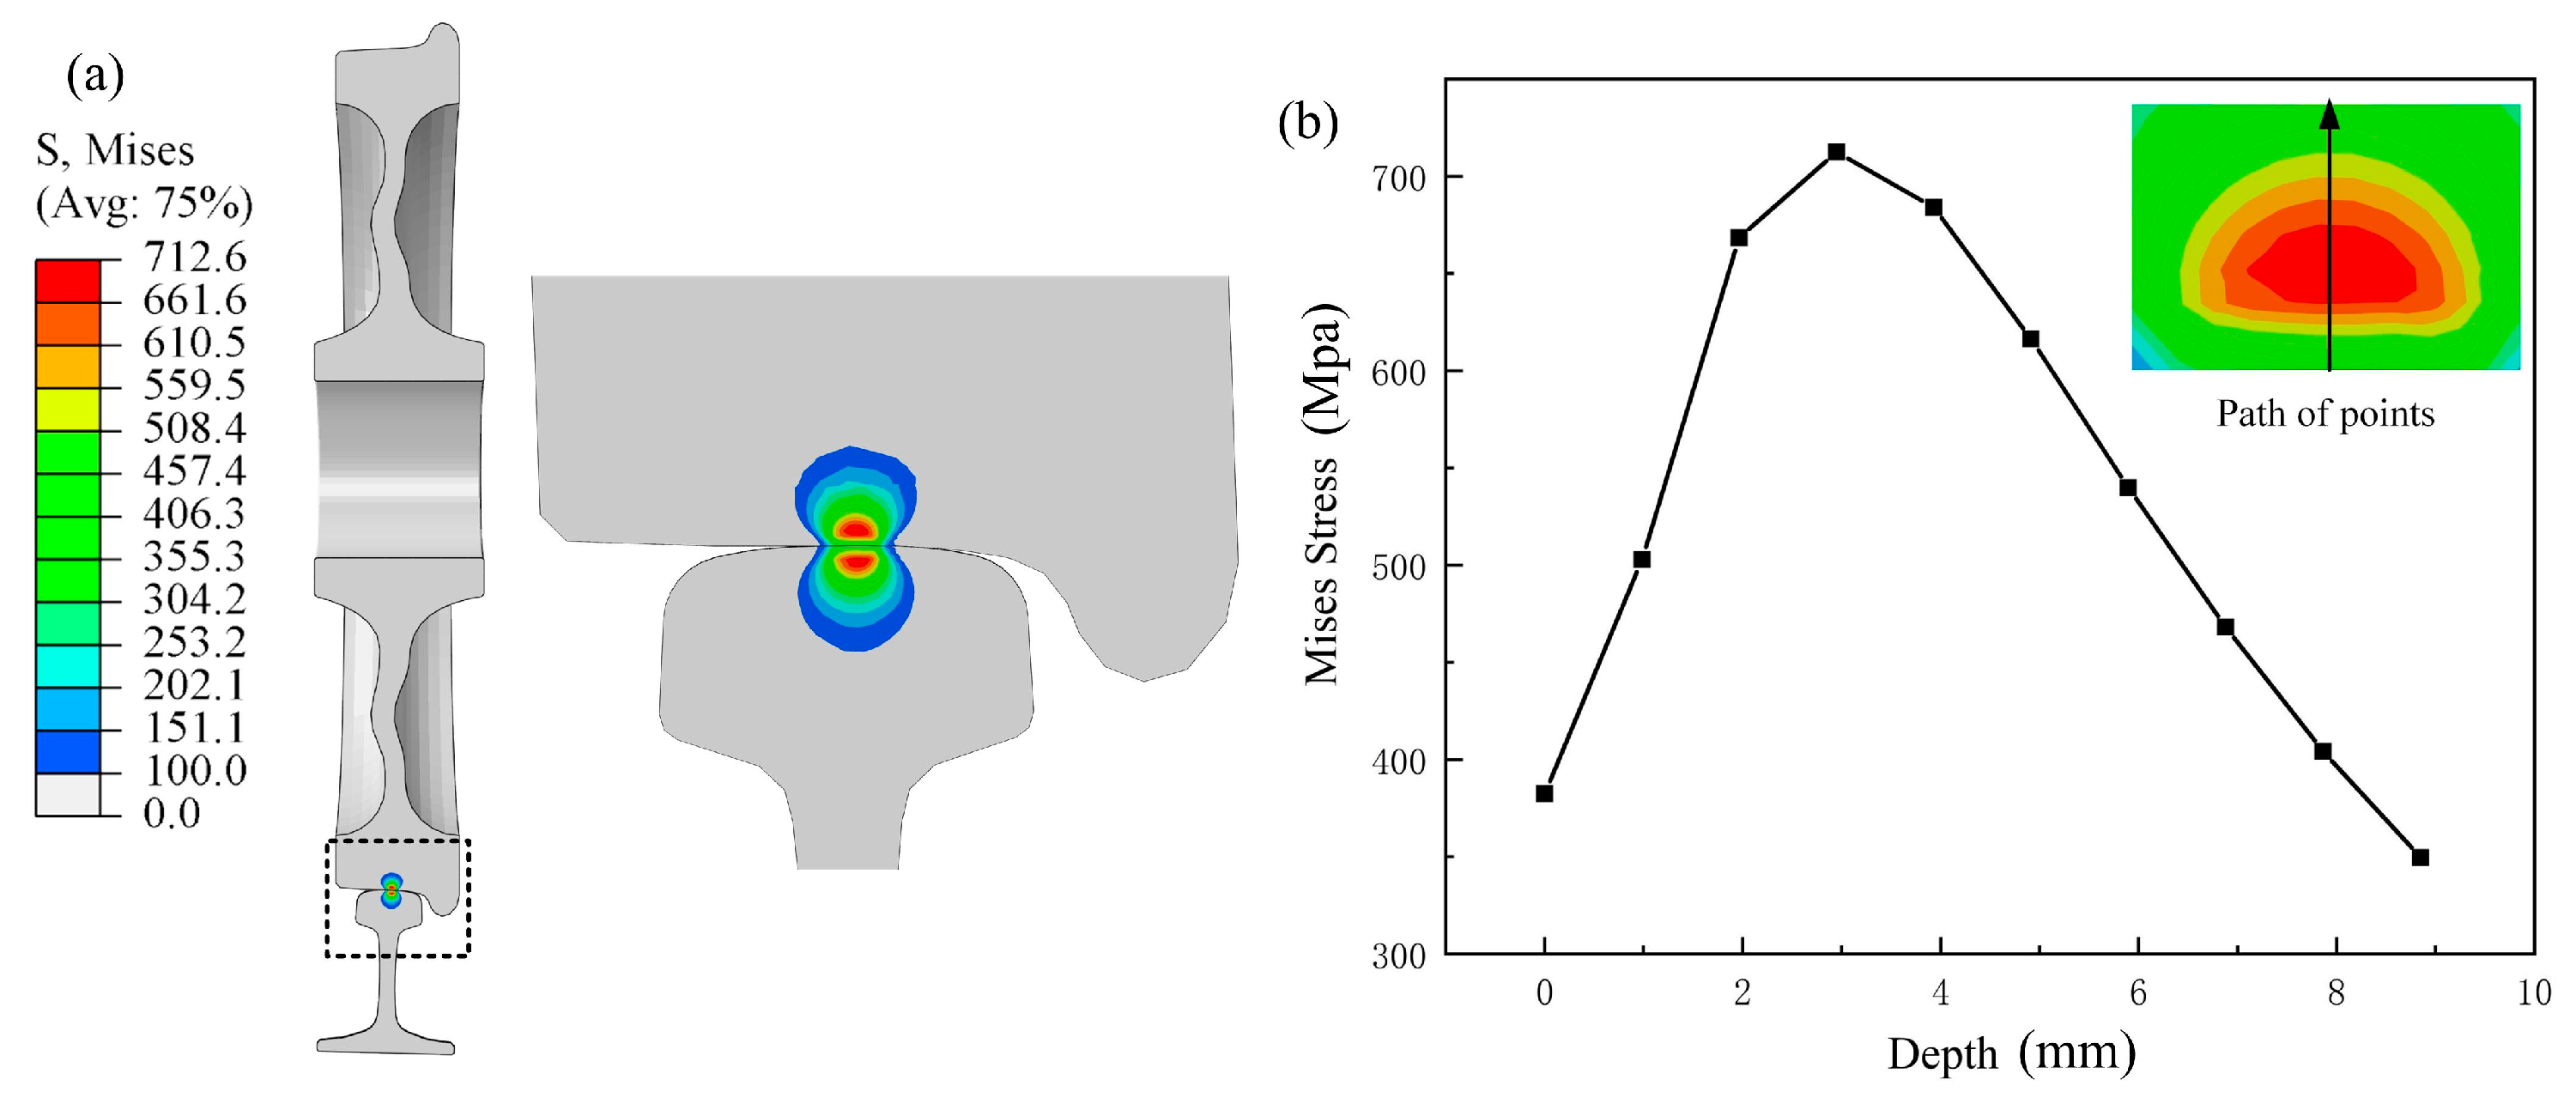
First, a static strength analysis was conducted for the wheel–rail model. Based on the von Mises criterion, the area of the wheel with the maximum von Mises stress was identified as the dangerous area. An initial crack was introduced at this location to study the fatigue crack propagation characteristics. Figure 6a shows the von Mises stress contour of the cross-section in the wheel–rail contact area from the FE model’s static strength analysis. The maximum von Mises stress of the wheel is 712.6 MPa, occurring in the area below the tread. Figure 6b shows the von Mises stress distribution along the depth of the wheel tread. As can be seen from the figure, the stress first increases and then decreases along the path direction, reaching its maximum at a position 3 mm below the tread surface.

4.2. Effects of Initial Crack on Propagation

4.2.1. The Influence of the Crack Distribution Pattern on the Remaining Life of Wheel Peeling

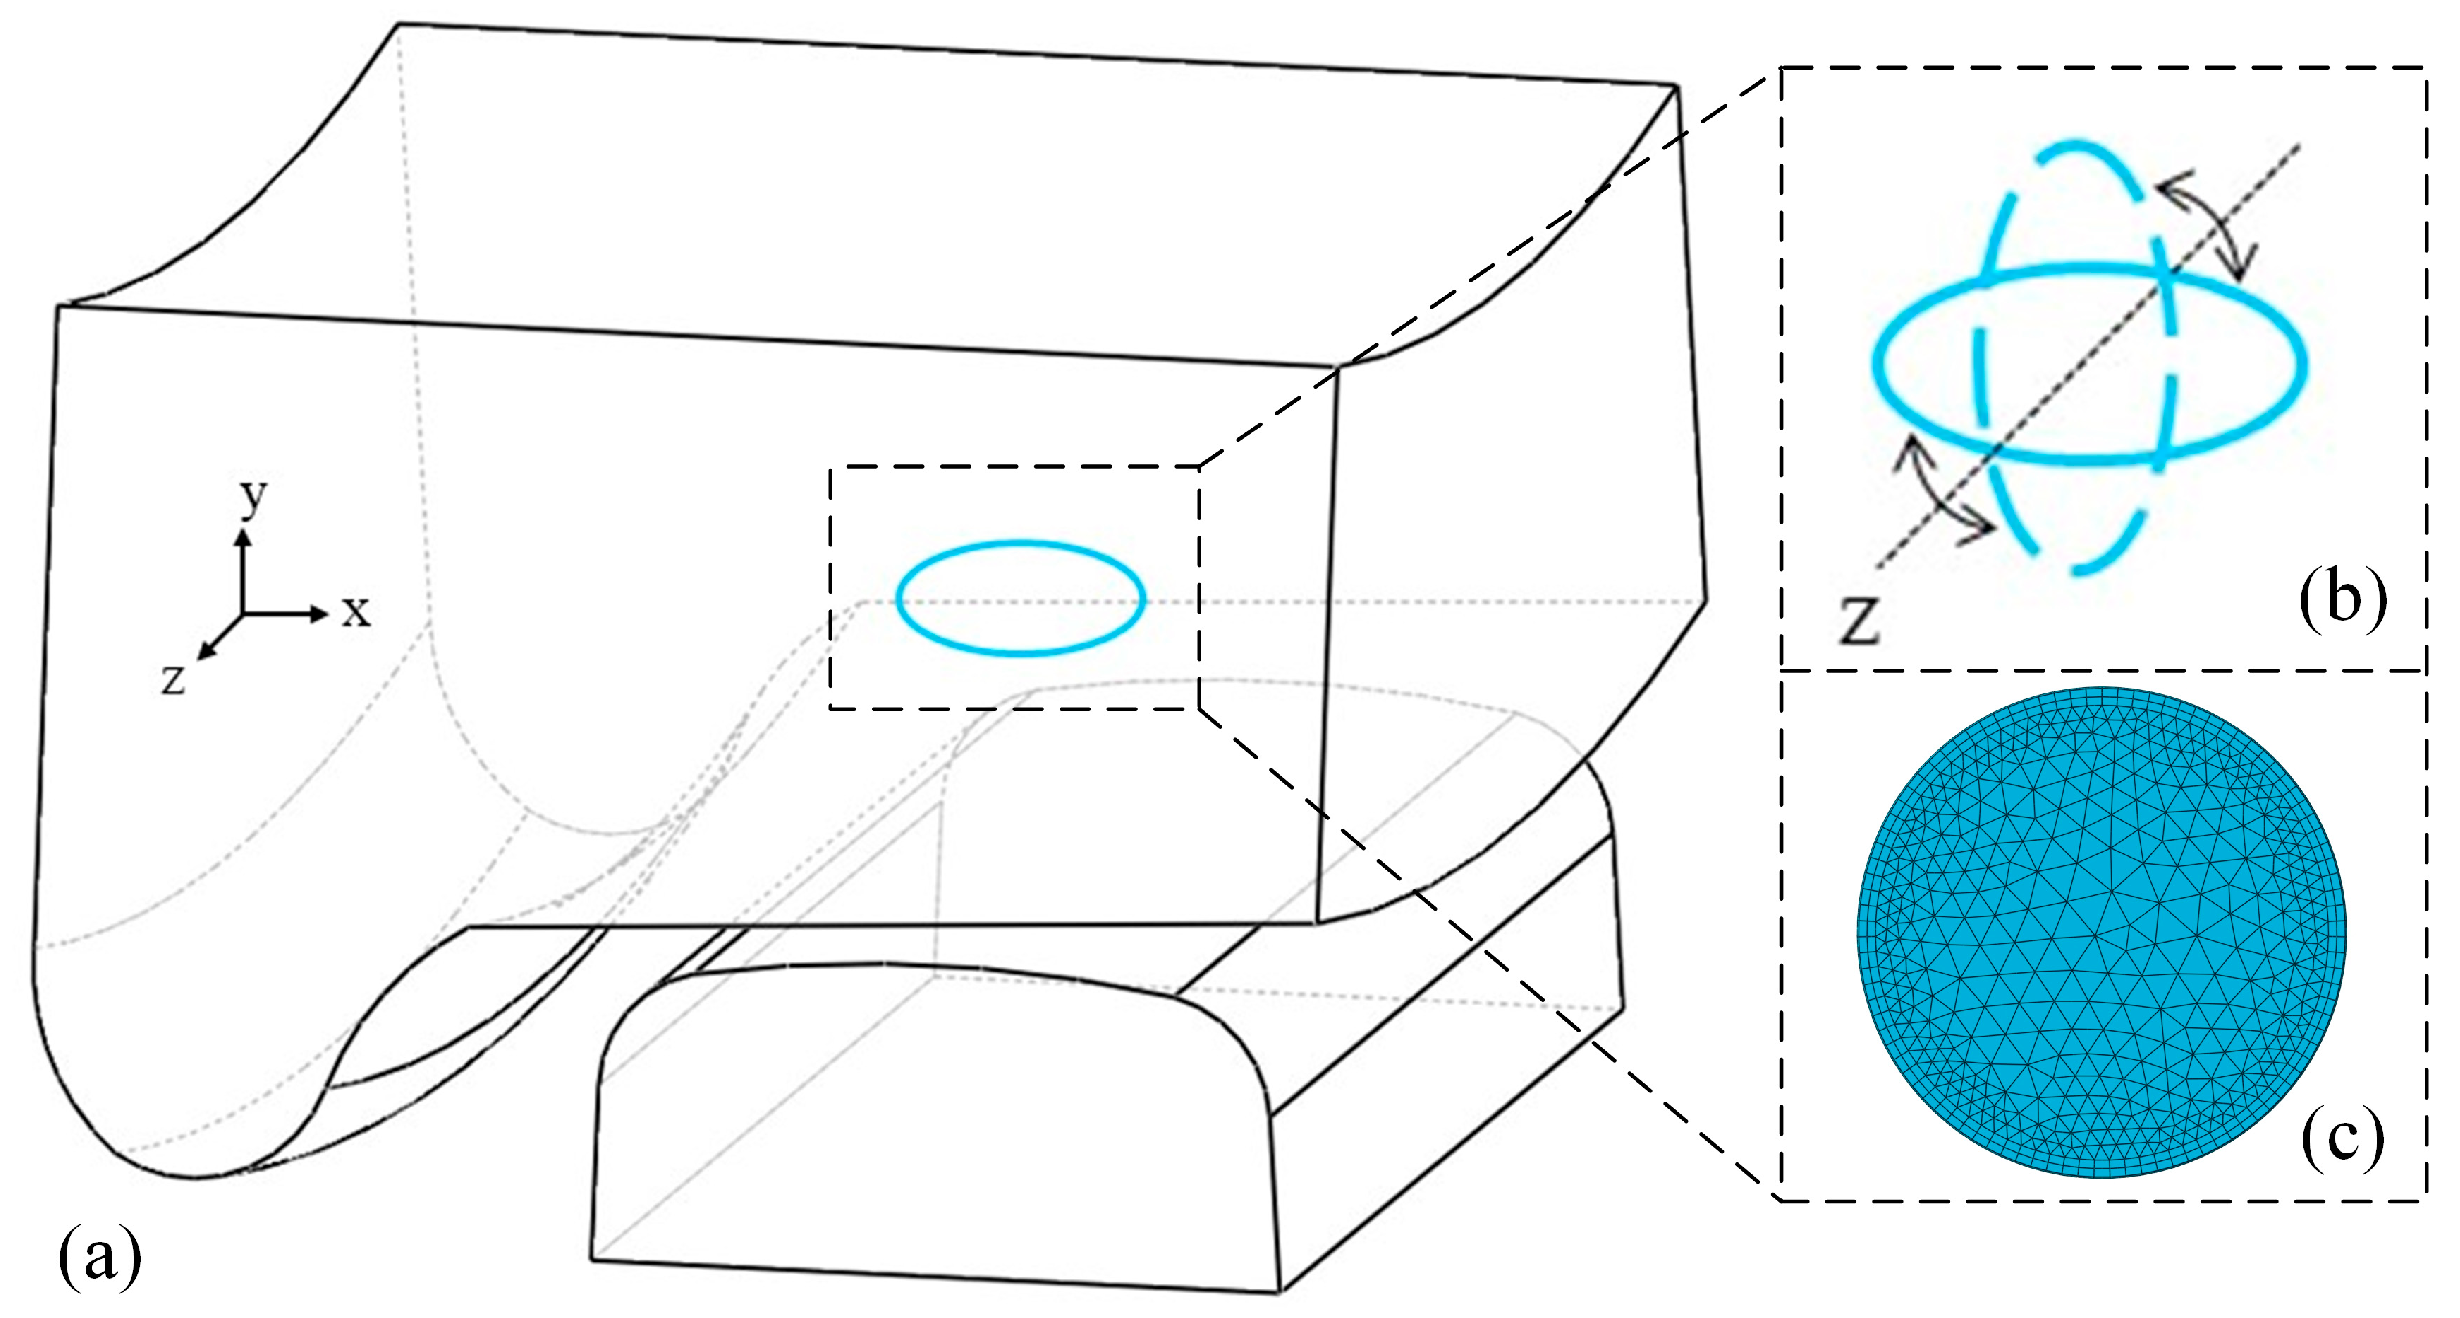
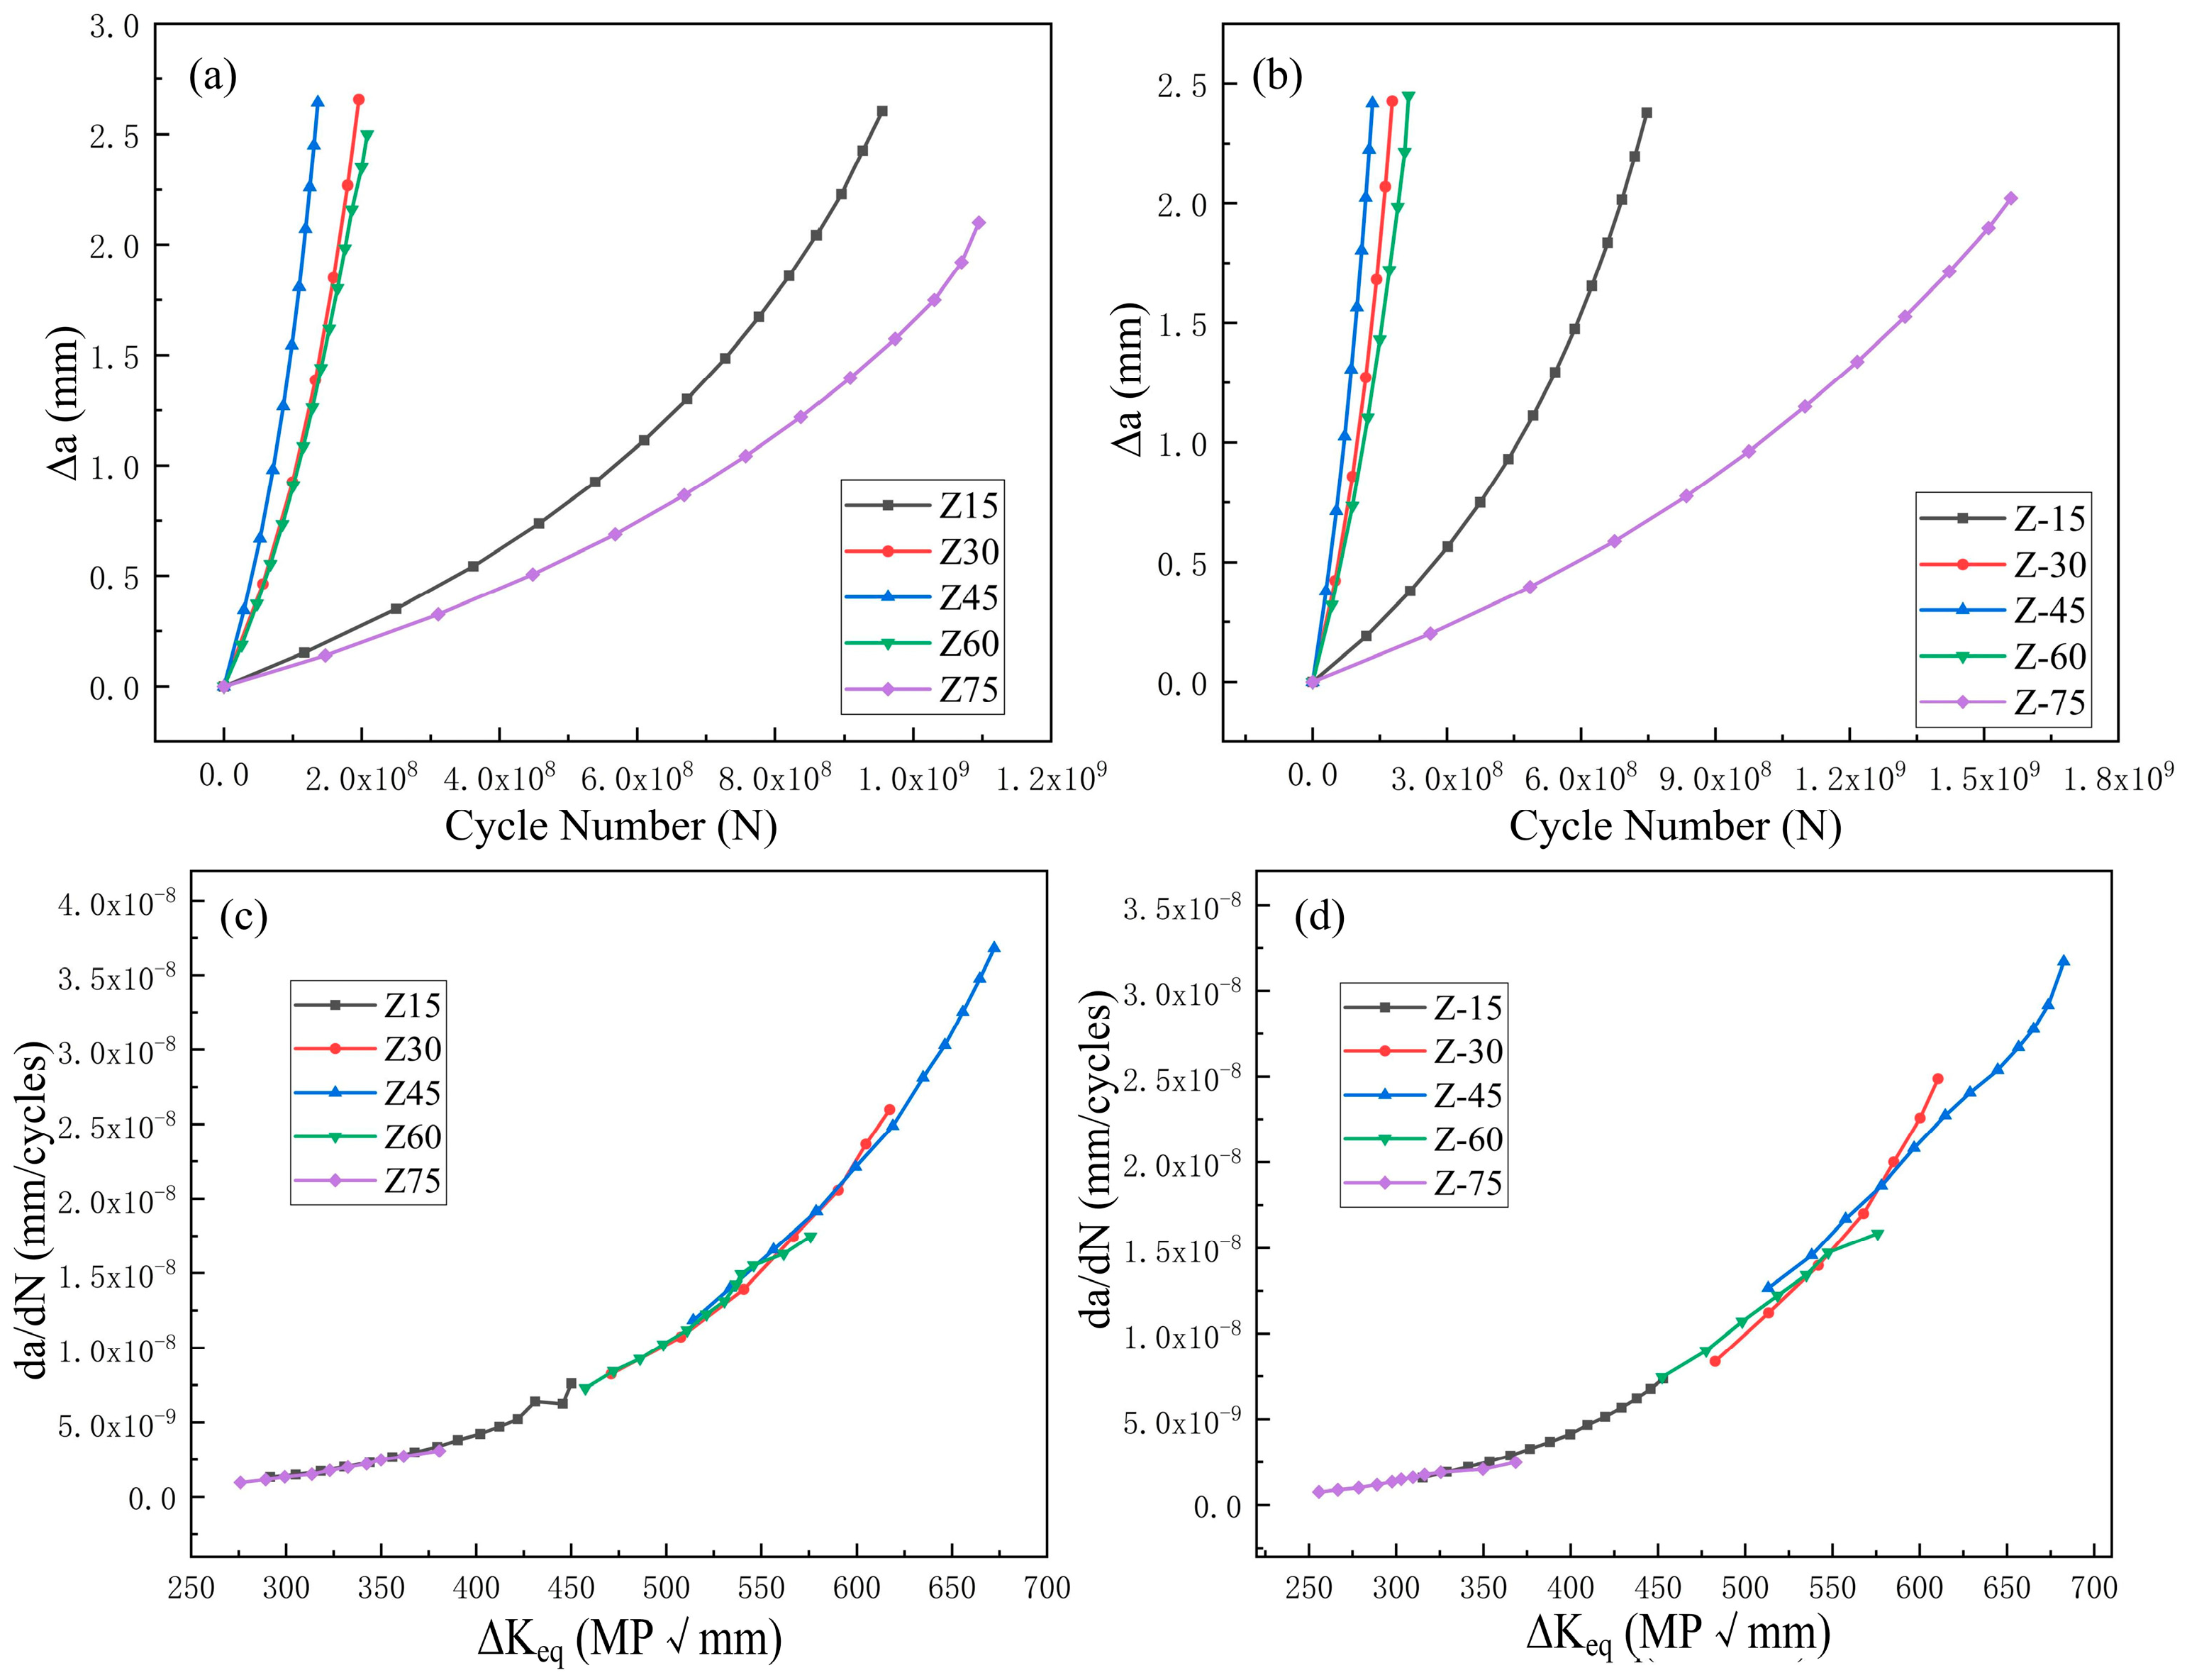
To obtain the most dangerous initial-crack angle beneath the wheel tread and the most critical fatigue crack propagation path, a circular initial crack with a radius of 1 mm was inserted at a depth of 3 mm below the wheel tread, as shown in Figure 7a. Taking the crack parallel to the horizontal plane (X0Z) as the reference, it was rotated around the Z-axis, as shown in Figure 7b. The clockwise rotation angle around the Z-axis is defined as positive and the counterclockwise rotation angle as negative. For example, “Z45” represents the crack after a 45° clockwise rotation along the Z-axis relative to the reference crack. Initial cracks at different angles were inserted, and their fatigue crack propagation behaviors were calculated to determine the situation where the crack propagates the fastest, which is also the most dangerous condition for the wheel with an initial fatigue crack, laying the foundation for subsequent research. The mesh of the initial crack is shown in Figure 7c.
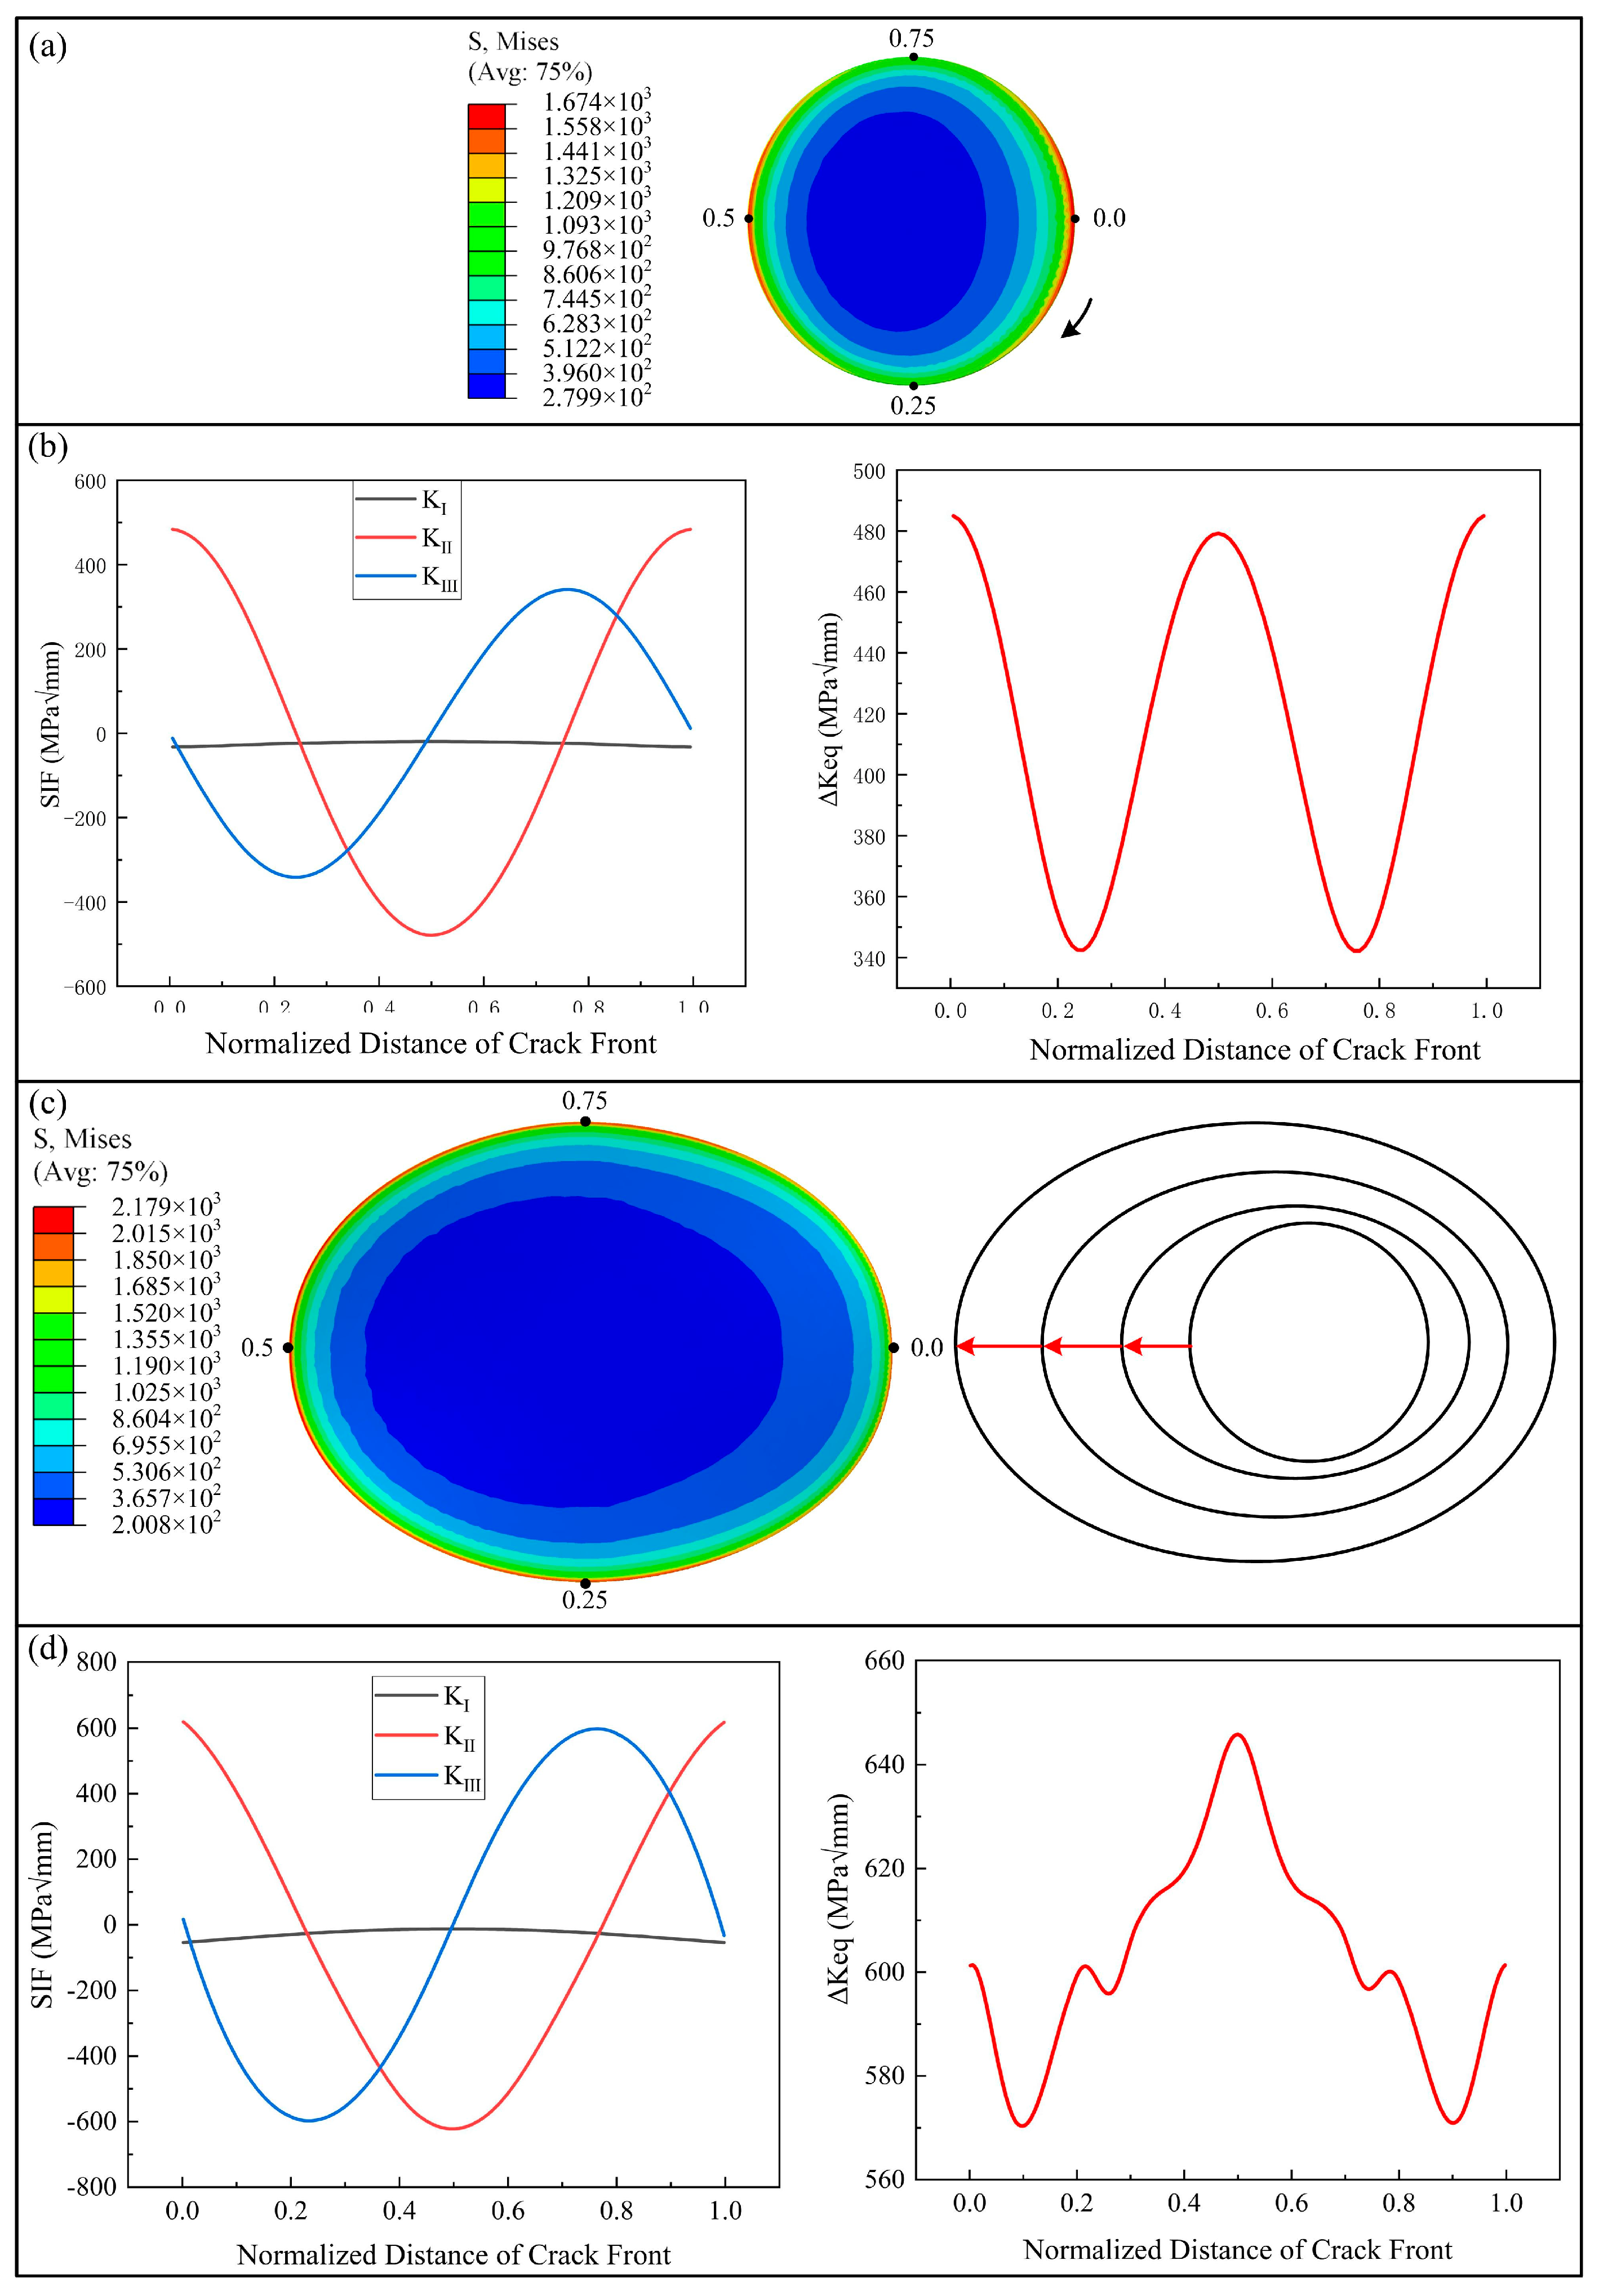
Figure 8a,b show the von Mises stress contour and the distribution of the crack SIF after introducing a Z45 crack into the FE model. Since the stress and SIF distribution patterns of cracks at various angles are basically consistent, the crack yielding the most distinct results is selected for presentation. It can be observed that the mode I SIF KI at the crack tip is negative and close to 0, whereas the mode II and mode III SIFs exhibit a continuous distribution, with the maximum value of KII exceeding that of KIII. The positive and negative values of the SIF denote the propagation direction of the crack tip. From this, it is evident that KI is initially negative and near 0, indicating that the crack remains in a compressed and closed state during propagation. Although normal contact is imposed on the crack surface to prevent penetration, calculation errors may still exist, resulting in negative values. Secondly, subsurface cracks in wheels are primarily induced by shear stress under wheel–rail interaction, leading to II and III mixed-mode propagation, with mode II propagation being dominant. Thirdly, by integrating the von Mises stress contour of the crack with the distribution of the equivalent SIF at the crack tip, it is found that the equivalent SIF is the largest at crack front position 0. This suggests that the crack will propagate in this direction in the initial state, and the von Mises stress in this direction is also the highest, reaching 1674 MPa.
The cracks inserted into the wheel subsurface undergo fatigue propagation under the action of the load spectrum. Figure 8c shows the von Mises stress contour and the fastest fatigue crack propagation path. The direction with the maximum equivalent SIF at the crack tip corresponds to the direction of the fastest crack propagation. In this direction, both the von Mises stress and the crack propagation driving force ΔKeq reach their peak values. Figure 8d presents the distribution of the SIFs and the equivalent SIF at the crack tip. Compared with the initial crack, the distribution patterns of the three SIFs remain largely unchanged, yet their amplitudes all increase. The maximum value of the equivalent SIF shifts from crack front position 0 to 0.5, and its magnitude is higher than that in the initial state; the SIF distributions are consistent with the authors’ previous work on rail [28]. By comparing the real fracture surface of the fatigue crack growth path [34] with the numerical simulation results in Figure 8c, it is found that the final fatigue crack growth simulation using the FRANC3D software program is consistent with the actual results.
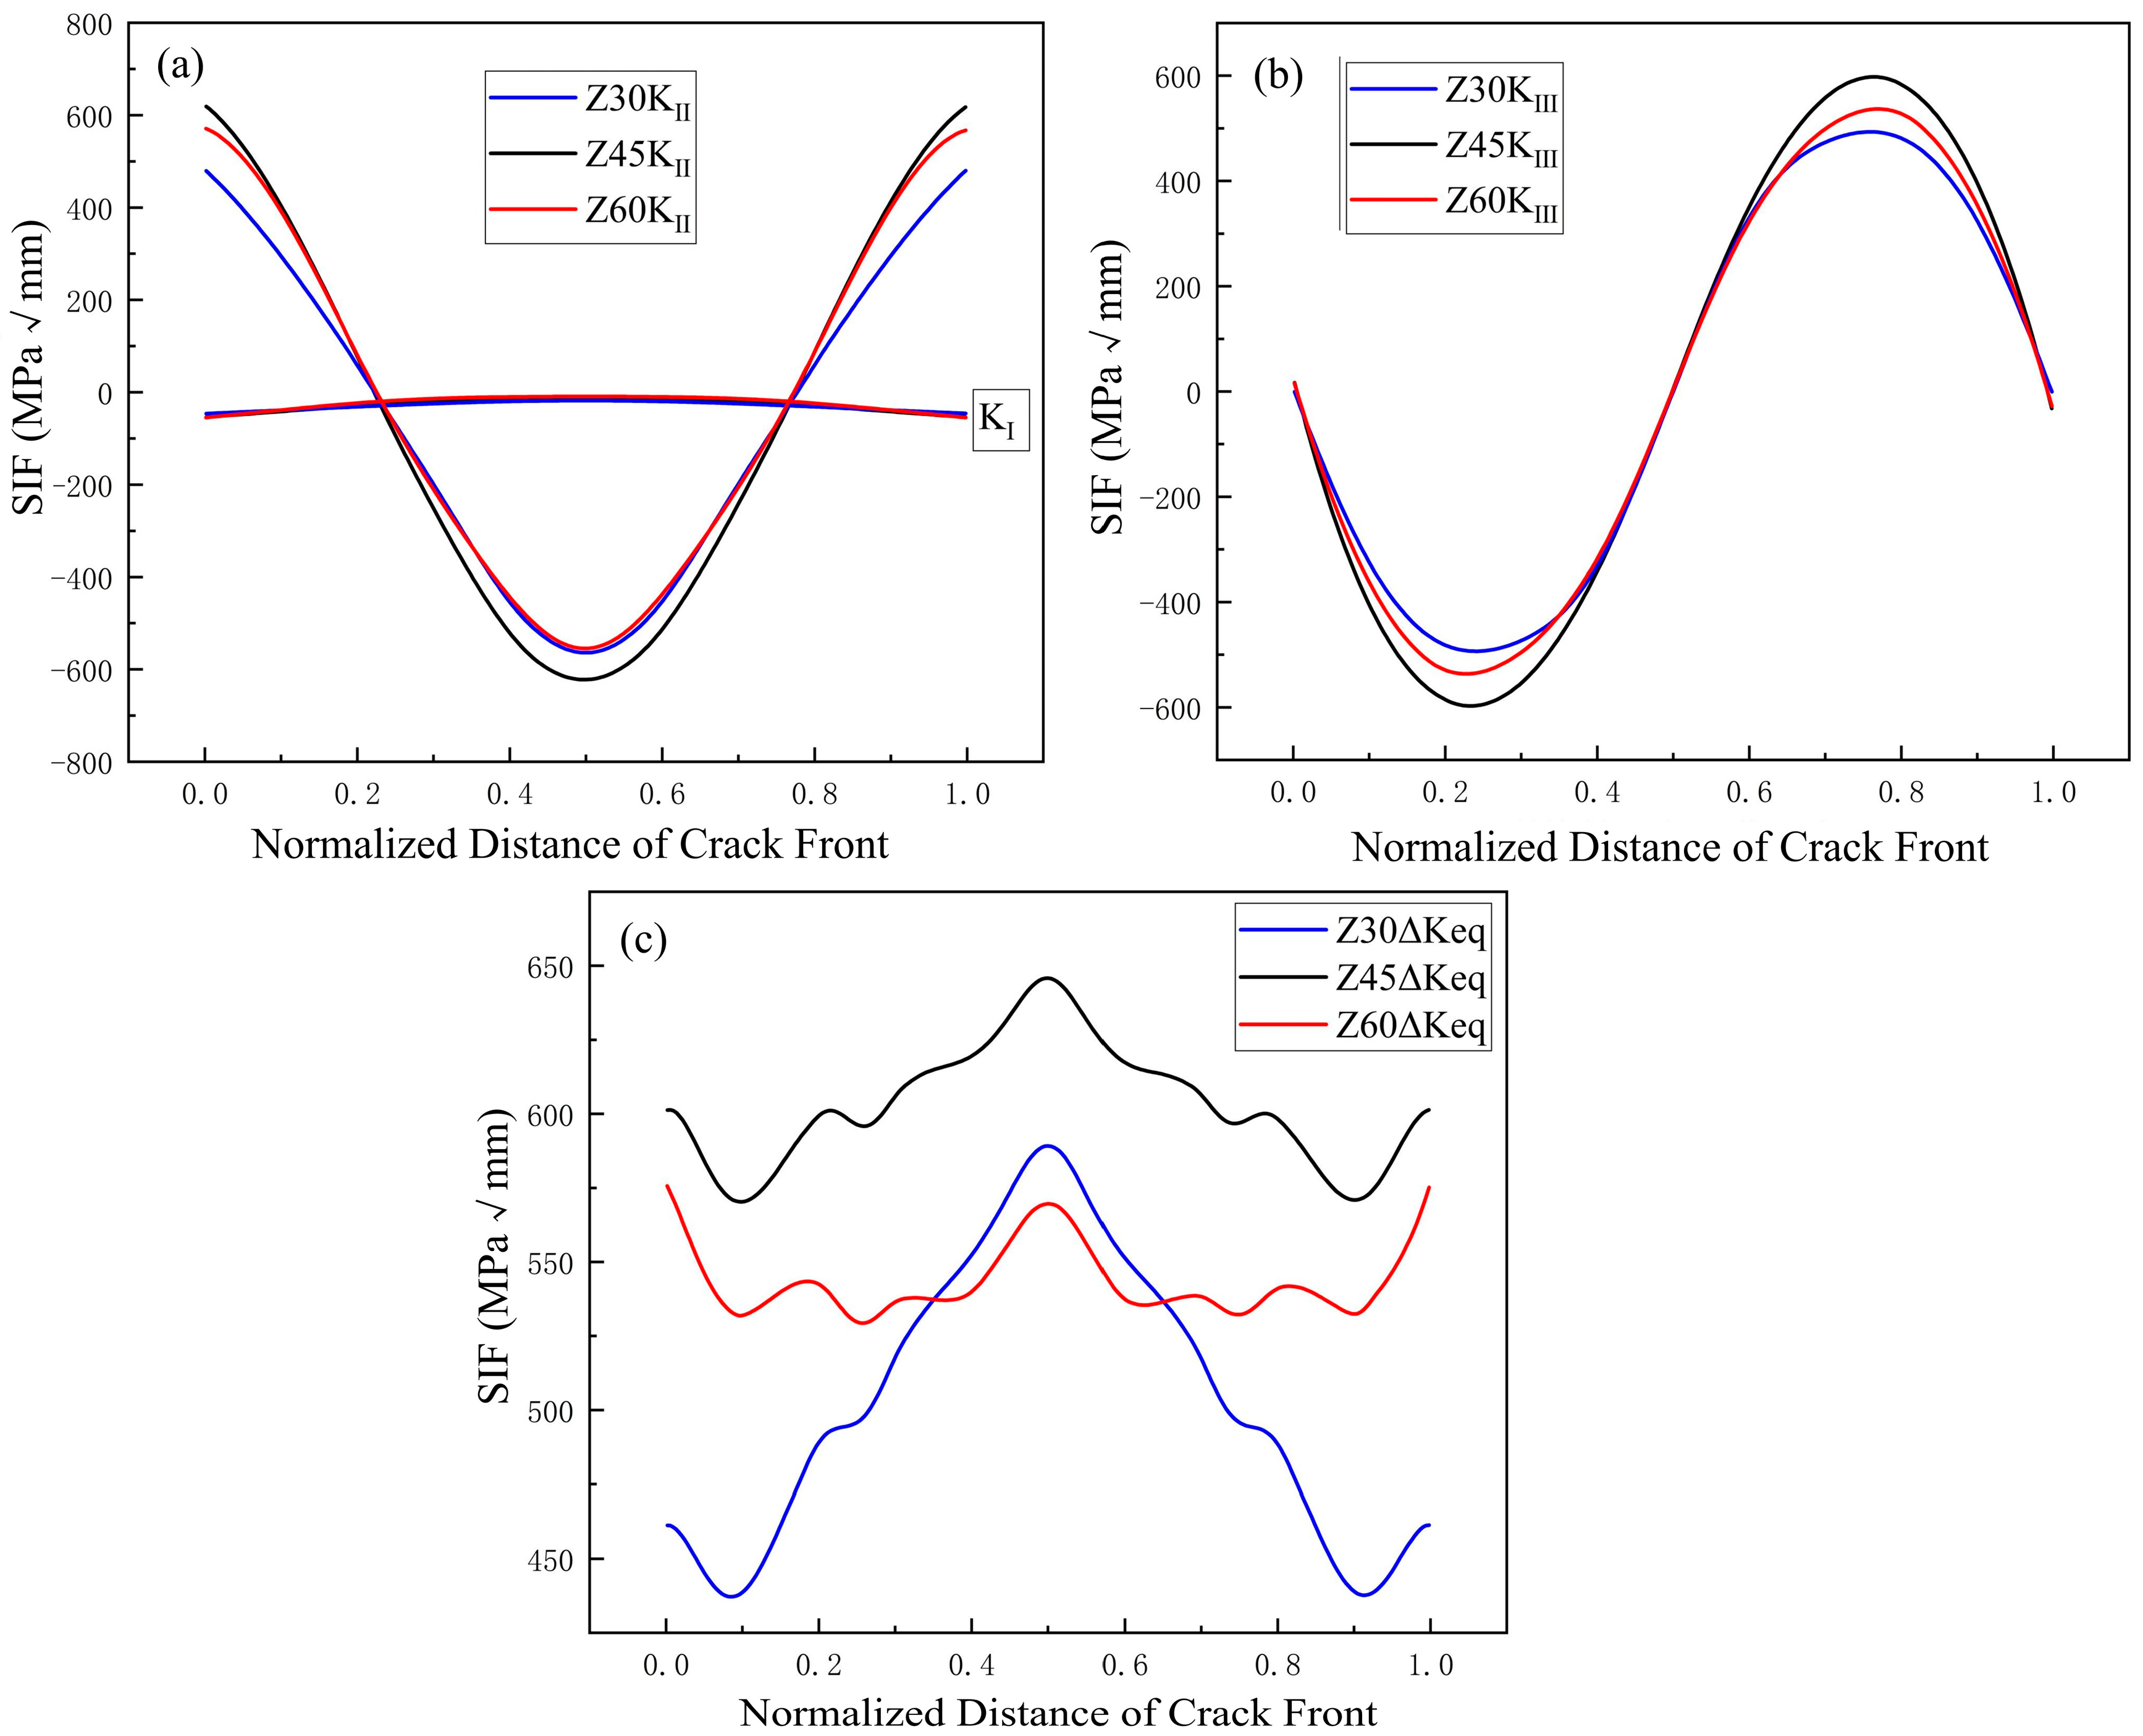
Figure 9 shows the SIF distributions of Z30, Z45, and Z60 cracks after they have propagated for a certain length. It can be observed that the KI for all three cracks is negative and close to 0, indicating that the cracks are all in a compressive state. As the crack rotation angle increases, both KII and KIII exhibit a distribution that first increases and then decreases, and Z45 corresponds to the maximum values of KII and KIII. It can be seen from Figure 9c that the equivalent SIF of the Z45 crack is the largest, indicating that the crack at this position is more prone to propagation under the same conditions, and the wheel will suffer fatigue failure faster. When the crack is rotated 30° clockwise around the Z-axis, the maximum value of ΔKeq appears at crack front position 0.5. As the rotation angle increases, the maximum value gradually transfers to position 0 of the crack front, indicating that the fastest crack propagation path changes with the rotation of the crack, gradually shifting from the initial propagating direction toward the interior of the wheel and then in the wheel tread direction.
A statistical analysis was conducted to investigate the variation in the equivalent SIF ΔKeq during crack propagation. The path where the maximum ΔKeq occurs during propagation was taken as the path with the fastest crack growth, and the number of cycles corresponding to the crack propagation length along this path was calculated. Figure 10a,b show the curves of the number of crack propagation cycles versus the propagation length when the crack is rotated around the Z-axis. For the same propagation length, there is a significant difference in the number of cycles among different cracks, indicating that the initial crack inclination angle has a substantial influence on the fatigue crack propagation life of the wheel. As the crack rotation angle increases, the number of crack propagation cycles first decreases and then increases, reaching a minimum value at a 45° angle from the horizontal direction. Based on the relationship between the number of crack propagation cycles and the propagation length, the crack propagation rates da/dN ≈ Δa/ΔN were calculated to obtain the relationship between the propagation rate and the equivalent stress intensity factor ΔKeq. As shown in Figure 10c,d, the average propagation velocity of each crack first increases and then decreases with the crack rotation angle, reaching the maximum value at a 45° angle from the horizontal direction. Comprehensive analysis indicates that the influence of the initial crack rotation angle on crack propagation is actually an influence on the equivalent SIF of the crack. The larger the ΔKeq, the faster the crack propagates, and the shorter the remaining life of the wheel. Compared with other cracks, the Z45 crack has the smallest number of cycles and the fastest crack propagation for the same propagation length, corresponding to the largest ΔKeq. Therefore, the morphology after the crack rotates by 45° clockwise around the Z-axis is the most dangerous condition for the wheel with an initial crack, and this dangerous angle is consistent with the authors’ previous work on rails [28].

4.2.2. Influence of Crack Shape on the Remaining Life of Wheel Peeling

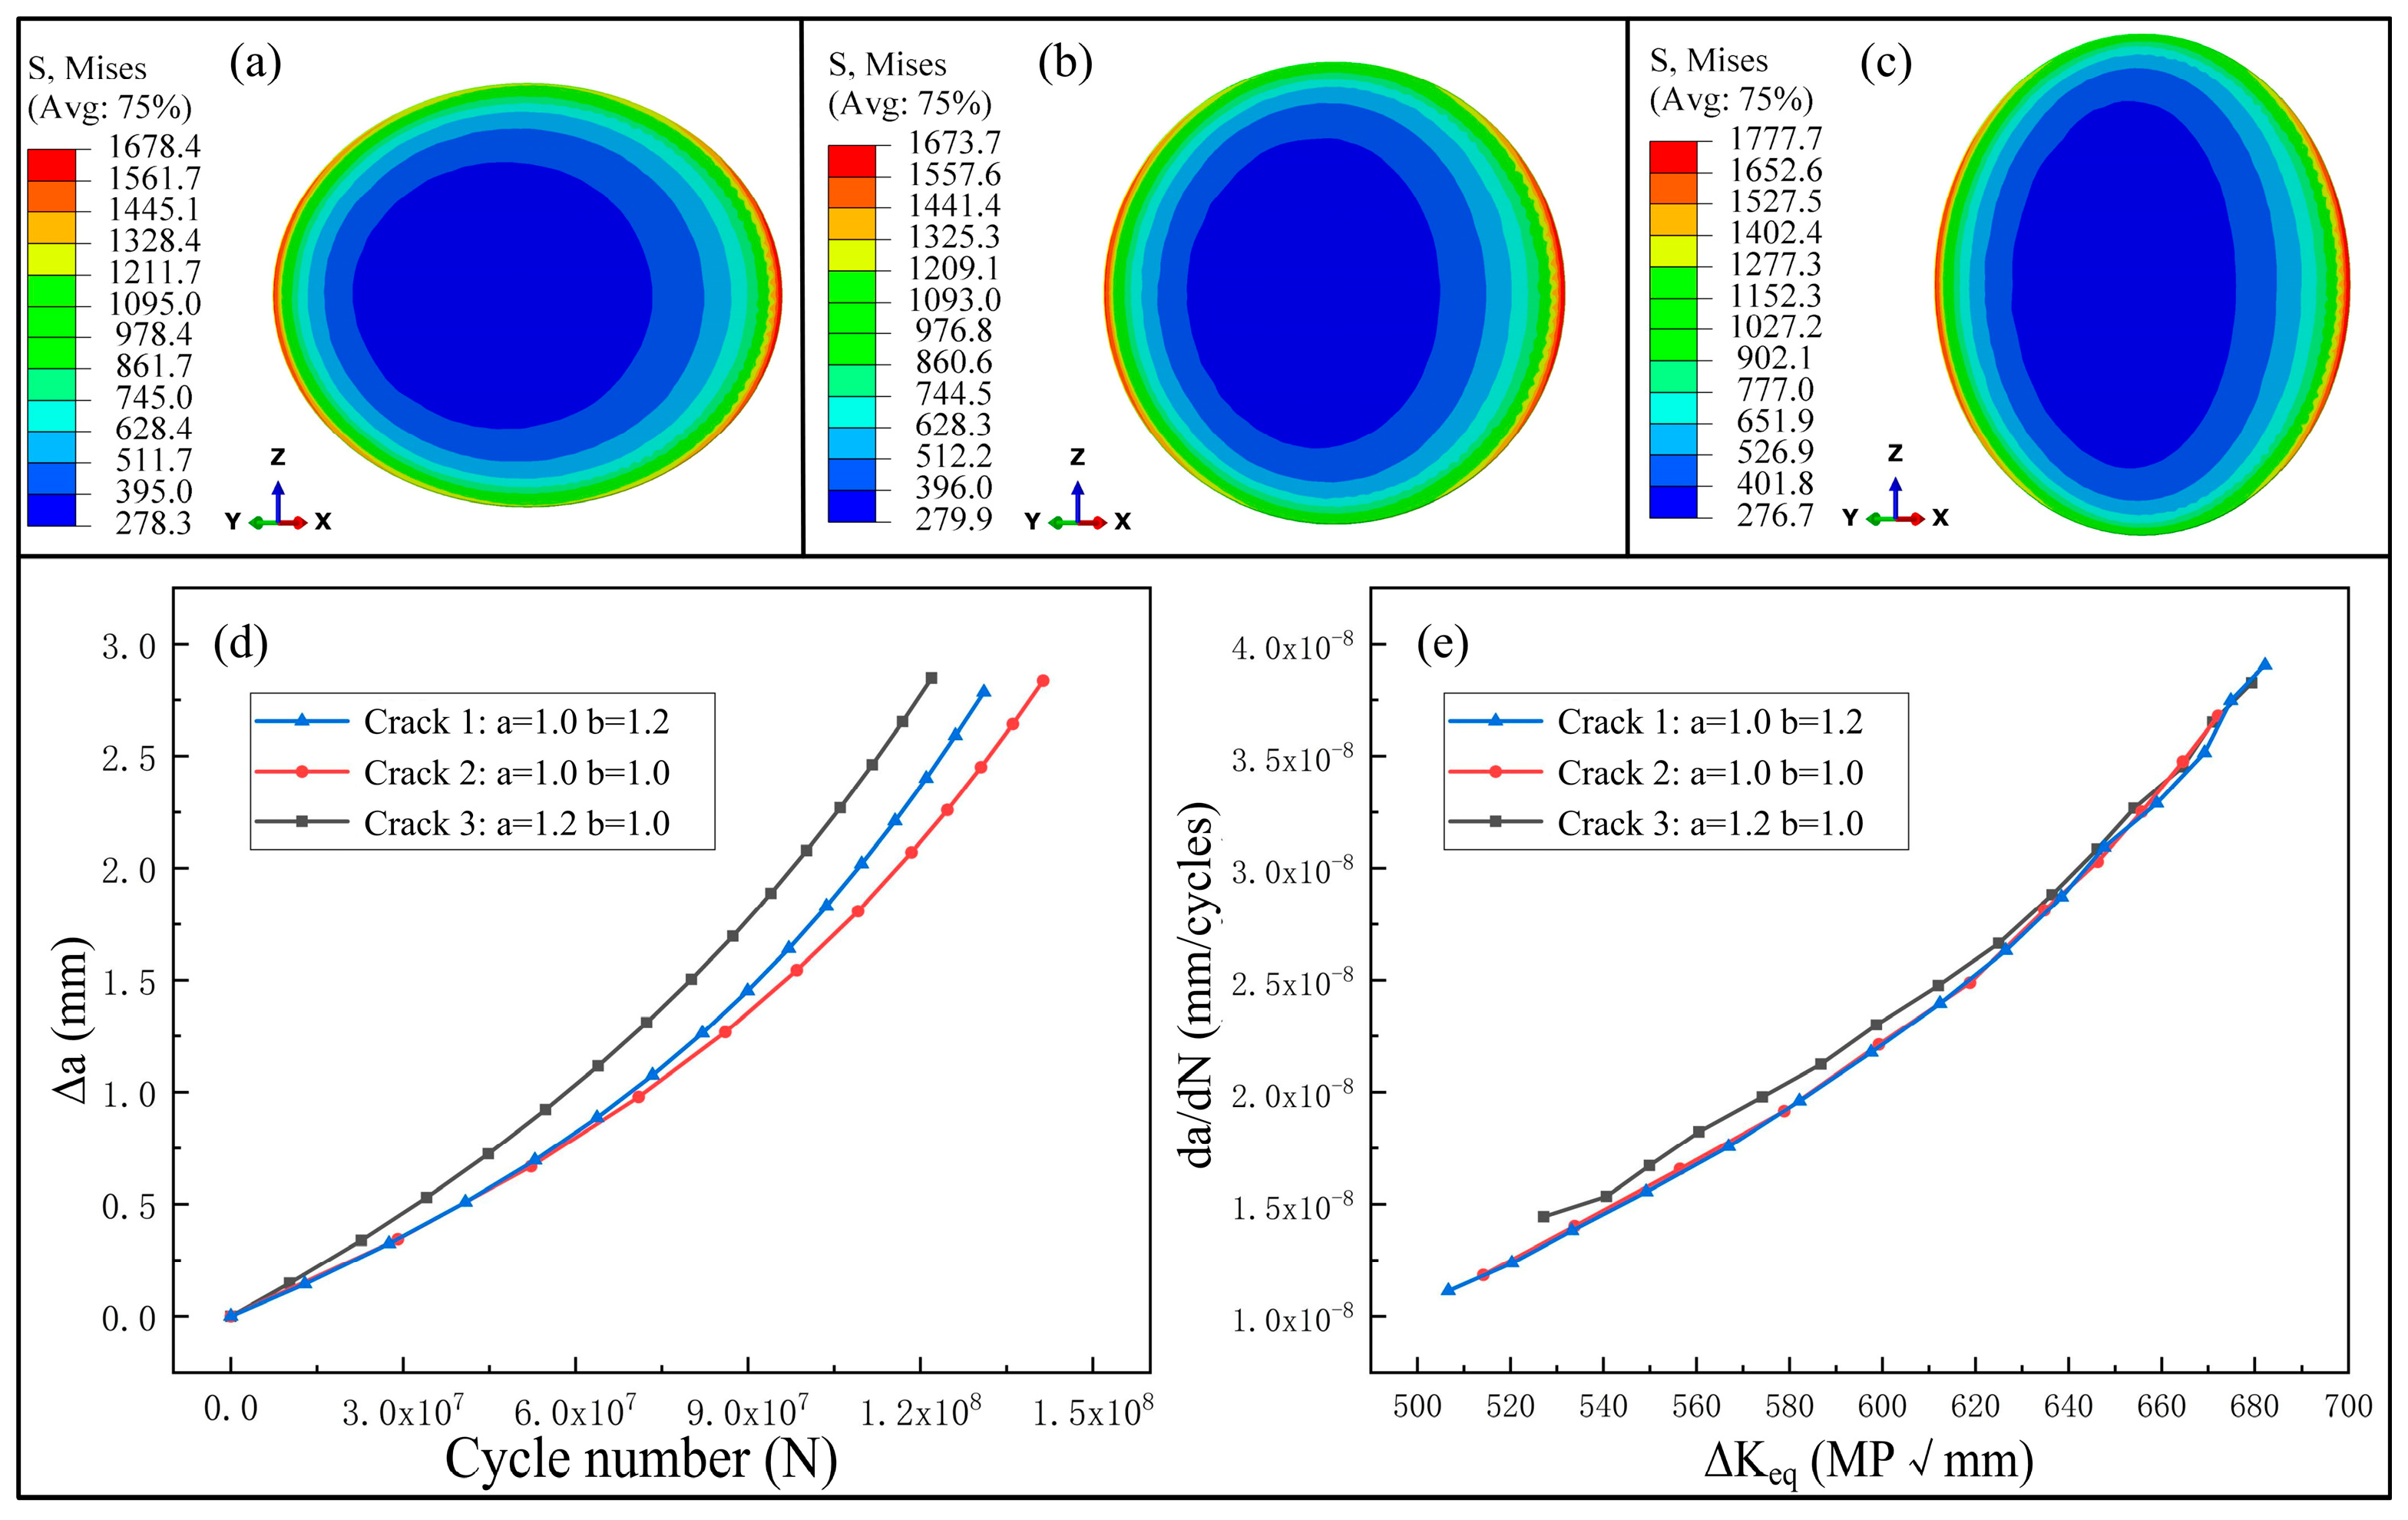
Under actual service conditions, most cracks in wheels are elliptical. Therefore, this section investigates the influence of different elliptical aspect ratios on fatigue crack propagation. The diameter of the ellipse along the Z-axis direction is defined as “a”, and the diameter in the other direction is defined as “b”. At a depth of 3 mm below the wheel tread, cracks with different morphologies are inserted into the most dangerous case mentioned above. Figure 11a–c show the von Mises stress contour of the initial elliptical cracks. It can be seen from the figures that the maximum von Mises stress of the three cracks is located on the right side of the cracks. The stress of the circular crack is lower than that of the elliptical cracks, and the elliptical crack with a = 1.2 and b = 1 exhibits the highest stress. This indicates that the elliptical crack does not alter the initial propagation direction of the crack (i.e., the position with the maximum von Mises stress), but it increases the initial von Mises stress of the crack, making the crack more susceptible to fatigue propagation.
Figure 11d shows the curves of crack propagation cycles versus the propagation length. When the propagation length is 2.8 mm, Crack 2 exhibits the maximum propagation cycles, while Crack 3 shows the minimum. Figure 11e depicts the curves of crack propagation rates versus the equivalent ΔKeq. In the early stage of crack propagation, the propagation rates of Crack 1 and Crack 2 are relatively close, whereas the propagation rate of Crack 3 is higher than that of the other two cracks. As the propagation cycles increase, the propagation rates of the three cracks become essentially consistent. It can be concluded that elliptical cracks with different aspect ratios affect the overall crack propagation by influencing the propagation rate in their initial state. When the increase in the diameter of the elliptical crack is the same, changes in the diameter perpendicular to the crack propagation direction have a more significant effect on the crack propagation rate than those along the crack propagation direction, and both accelerate the crack propagation rate.
Based on the above comprehensive analysis, it can be concluded that at a depth of 3 mm below the wheel tread, the crack rotated by 45° clockwise around the Z-axis (with the tread as the reference) is the most dangerous case. In this case, the initial crack propagates the fastest, and the remaining life is the shortest.

4.3. The Influence of Secondary Cracks on Primary-Crack Propagation

4.3.1. The Influence on the Propagation Rate of the Main Crack

During the normal service of a train, the wheels are subjected to complex wheel–rail loads, leading to uncertainties in the initiation of internal cracks. Cracks of different sizes, positions, and shapes may occur, and even multiple cracks may initiate. Based on the single-subsurface-crack model of the wheel studied previously, multi-source cracks are introduced to investigate their influence on the fatigue crack propagation characteristics of the wheel.
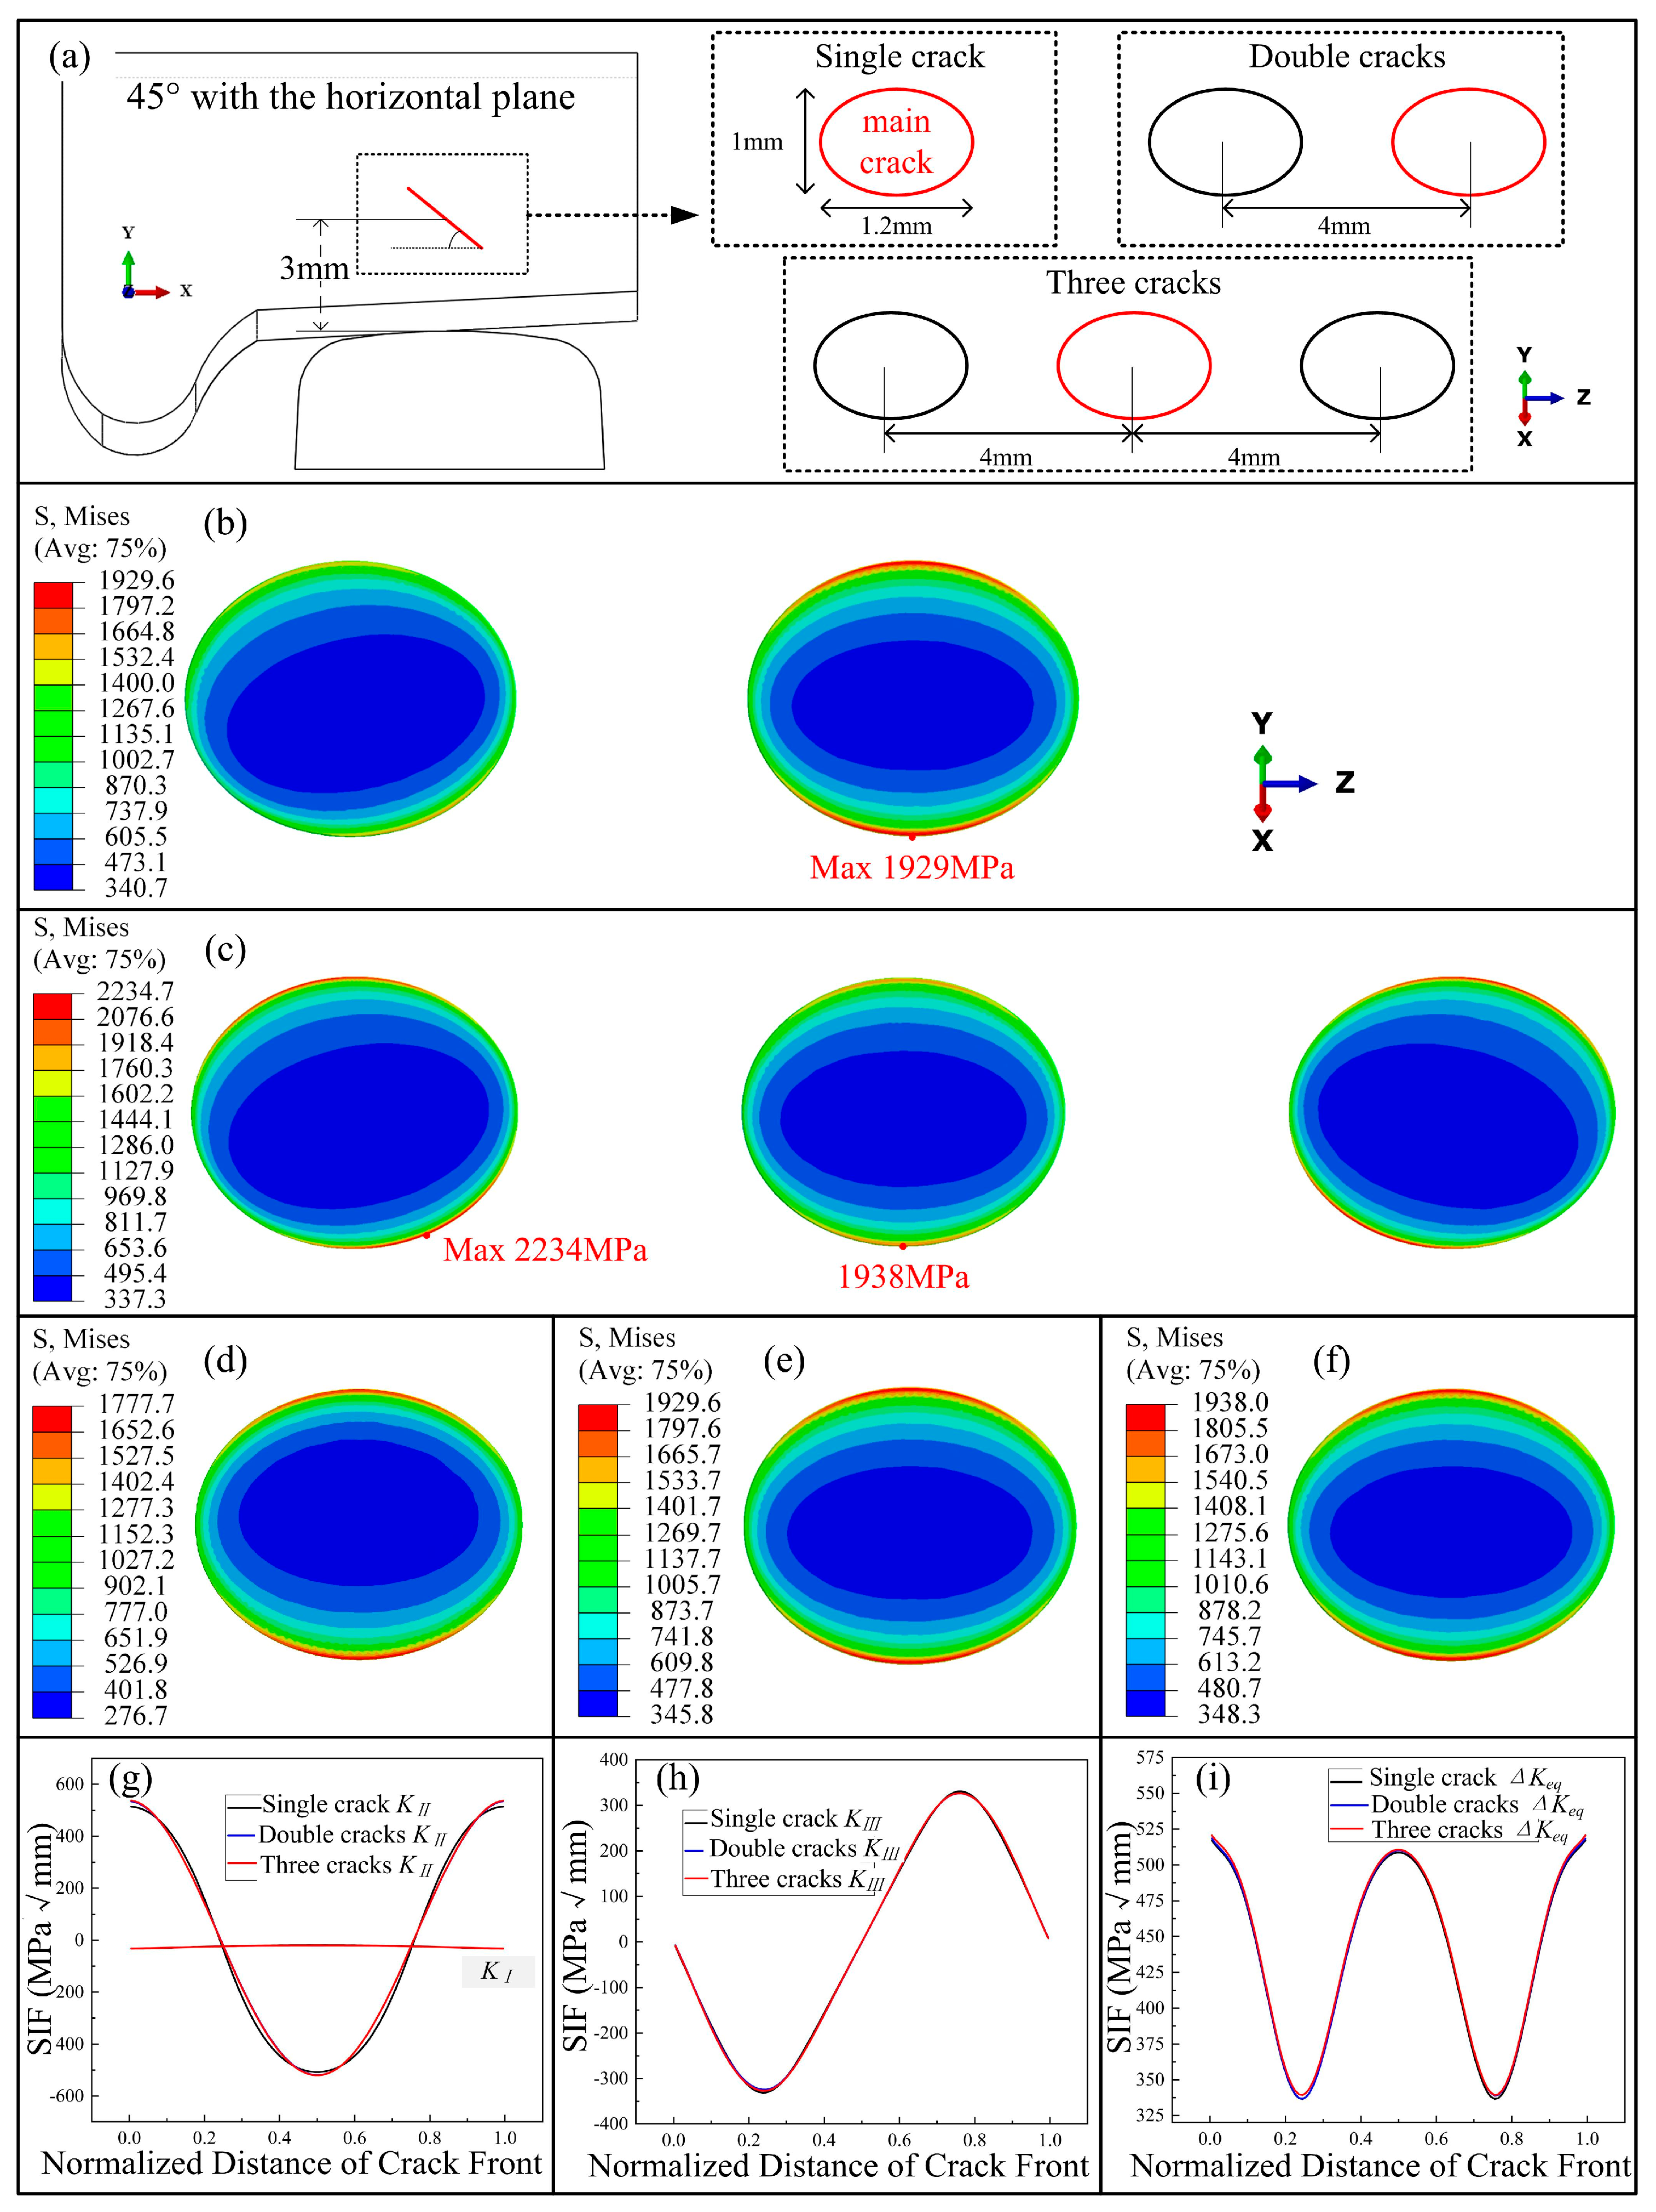
As shown in Figure 12a, the crack defined as the main crack is located 3 mm below the wheel tread, with elliptical diameters of a = 1.2 and b = 1, and is rotated by 45° clockwise around the Z-axis. The additionally inserted cracks are defined as multi-source cracks. These multi-source cracks are inserted along the Z-axis direction to study their influence on crack propagation, with the distance between the centers of each crack being 4 mm. Figure 12b,c show the von Mises stress contours of the cracks after the insertion of multi-source cracks. In the double-crack model, the maximum stress occurs on the main crack, with a value of 1929.6 MPa. In the triple-crack model, the maximum stress occurs on the secondary crack, with a value of 2234.7 MPa. Figure 12d–f present the von Mises stress contours of the main cracks in each model. As shown in the figures, the stress distributions of the main cracks in each model are basically consistent. The stress of the reference crack in the single-crack model is the smallest, while that in the triple-crack model is the largest, and the position of the maximum stress is at the bottom of the crack, as shown in Figure 12. This indicates that the initial stress distribution of the main crack is less affected by multi-source cracks, but the maximum value of von Mises stress increases with the increase in the number of cracks. The distributions of the SIF of the main crack in different crack models (single crack, double cracks, and triple cracks) are shown in Figure 12g–i. It can be seen from the figures that in the initial state, the secondary cracks have little influence on the SIF at the tip of the main fatigue crack, which is mainly due to the relatively large distance between the established main fatigue crack and the other cracks.
During train service, if there are multiple cracks in the wheel, the distance between the cracks will gradually decrease as the service cycles increase. When two cracks come into contact, crack coalescence will occur. The propagation rate of the merged crack will increase significantly, accelerating the wheel’s fatigue failure. Therefore, crack coalescence should be avoided in engineering.
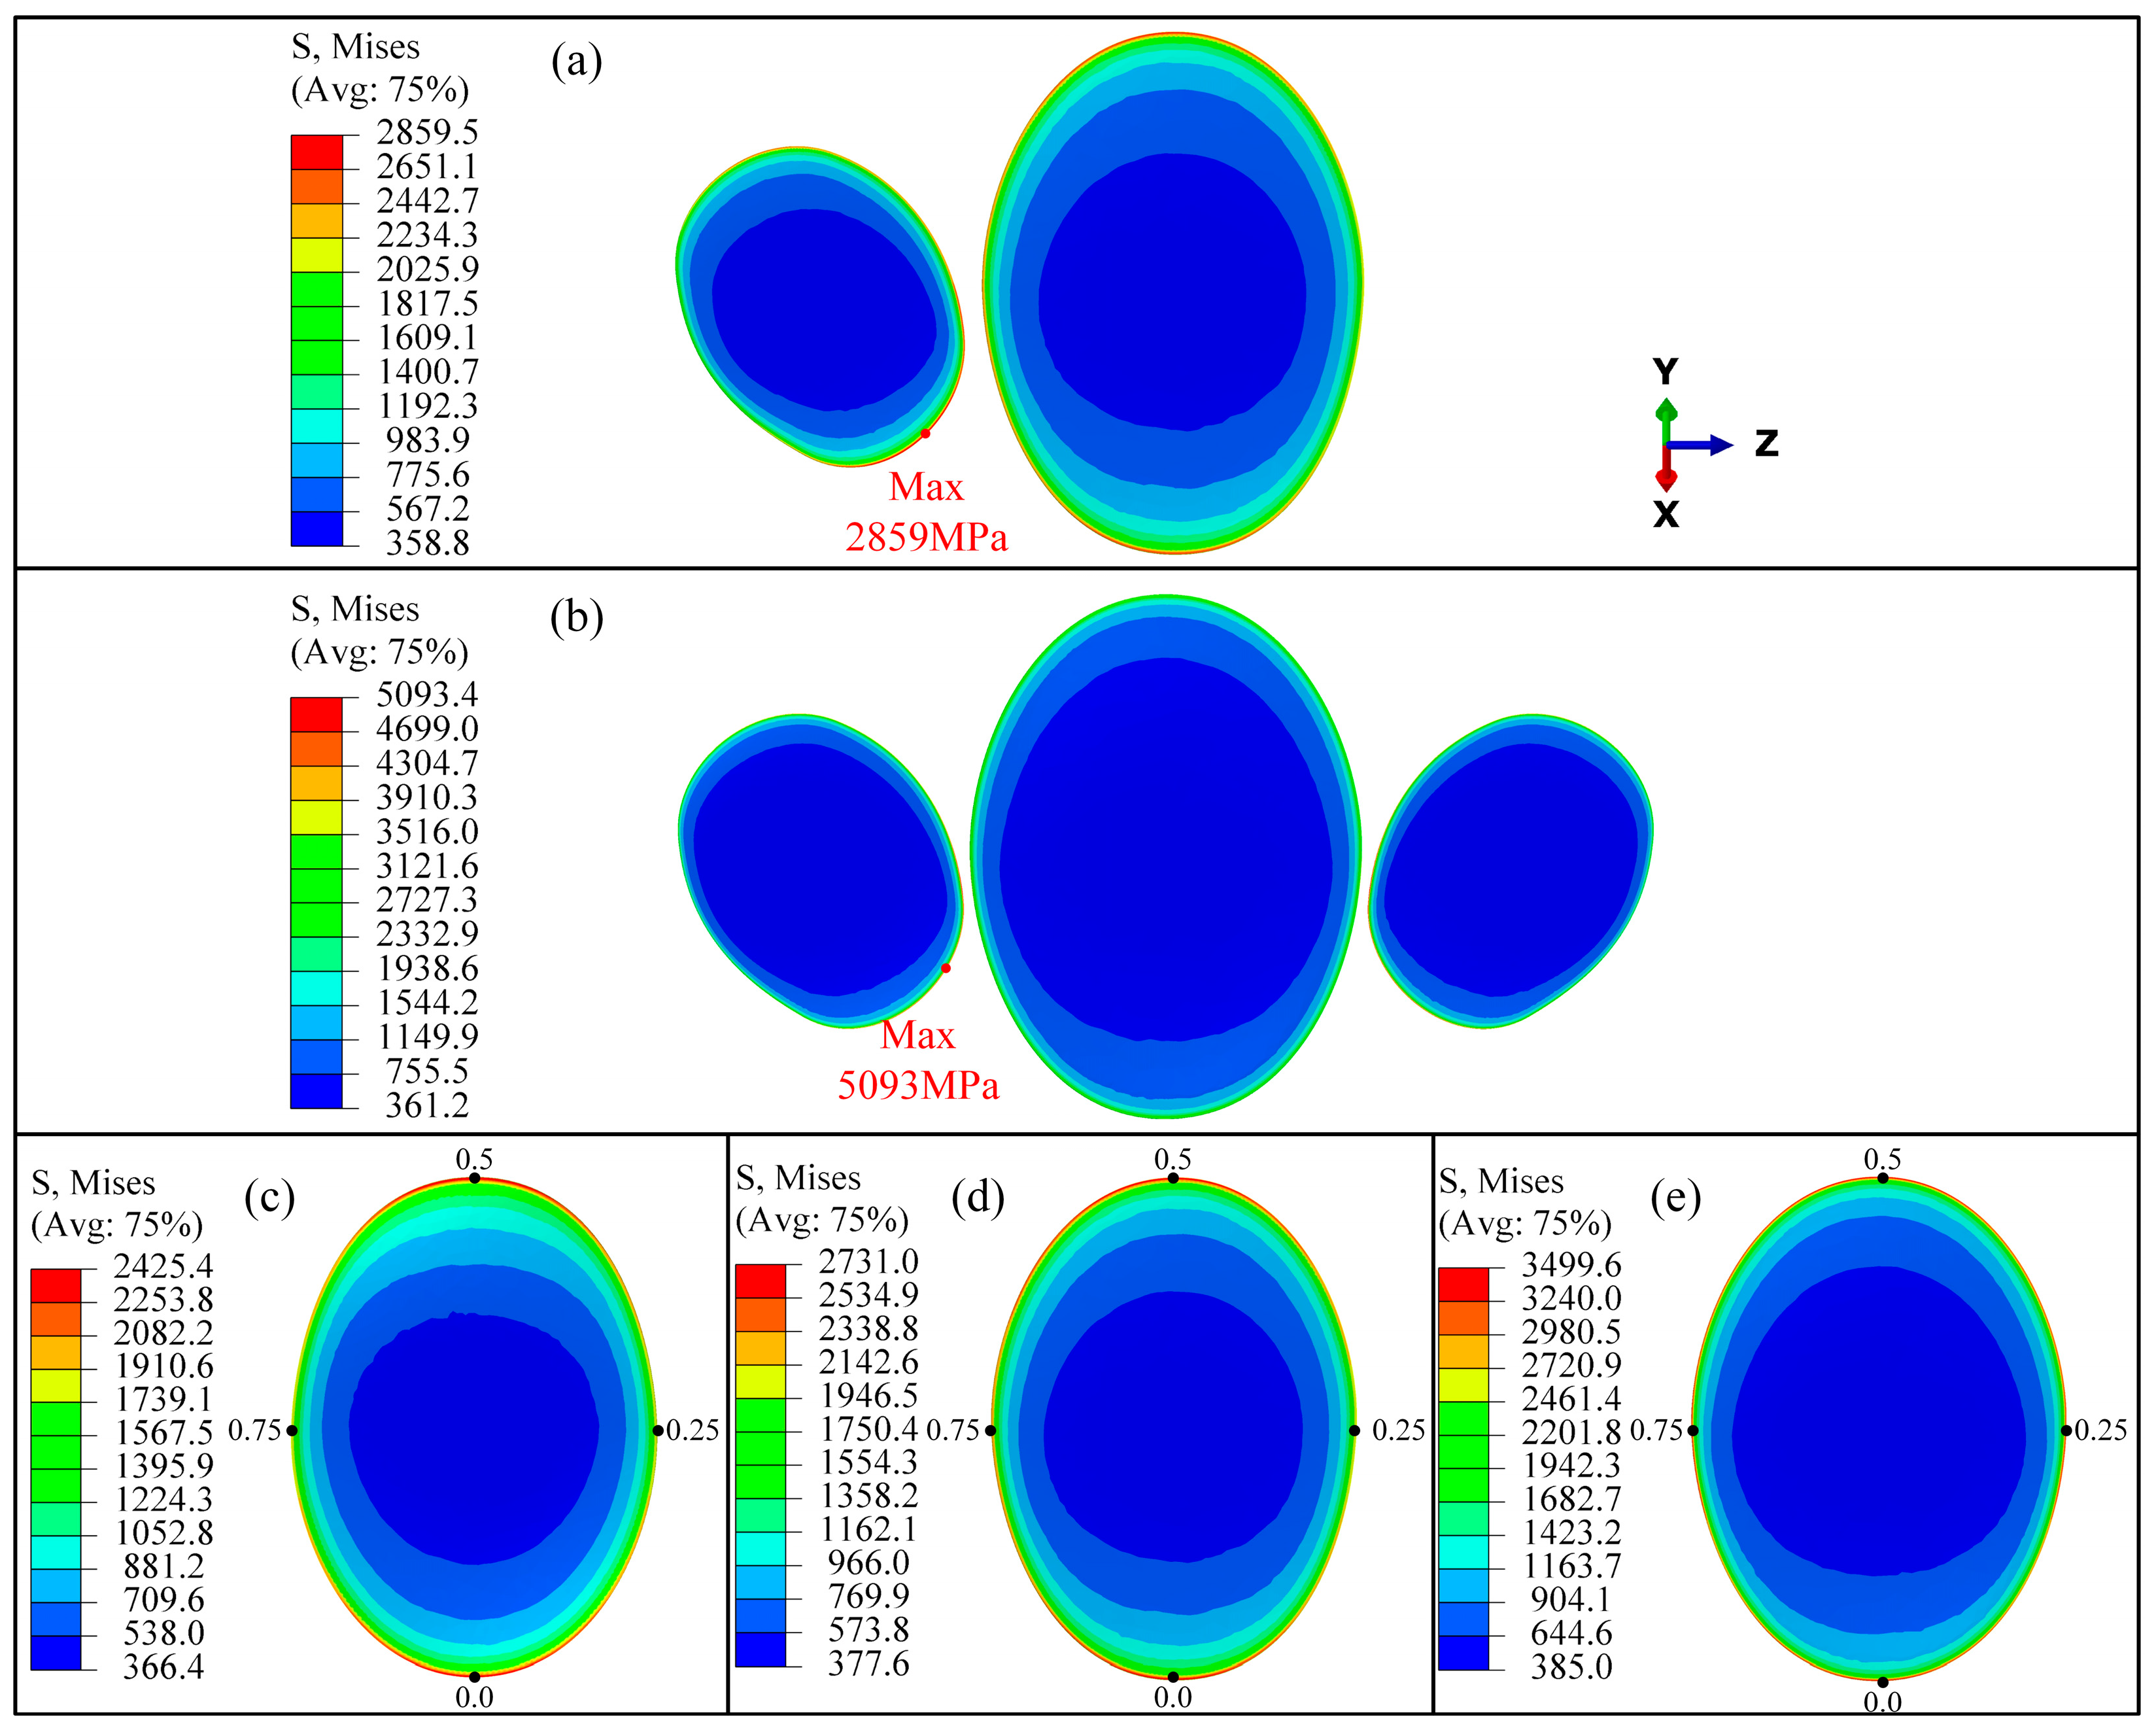
Fatigue crack propagation occurs in each model under the load spectrum, ending before crack coalescence takes place. The von Mises stress contours of the multi-crack models at the end of crack propagation are shown in Figure 13a,b. In the double-crack model, the maximum stress occurs for the secondary crack, with a value of 2859.5 MPa. In the triple-crack model, the maximum stress also occurs for the secondary crack, reaching 5093.4 MPa. Figure 13c–e present the von Mises stress contours of the reference cracks at the end of propagation for each model. The stress of the reference crack in the single-crack model is the smallest, whereas that in the triple-crack model is the largest, with the maximum stress being located at the uppermost position of the crack, as shown in Figure 13. Based on a comprehensive analysis of the above results, it is concluded that the insertion of multi-source cracks alters the stress distribution of the wheel. The presence of secondary cracks makes the stress singularity at the crack tips more pronounced, thereby increasing the overall von Mises stress. The main cracks in the multi-crack models exhibit different stress distributions from those in the single-crack model in the direction of the secondary cracks, demonstrating that the reference cracks gradually propagate toward the secondary cracks before crack coalescence occurs.
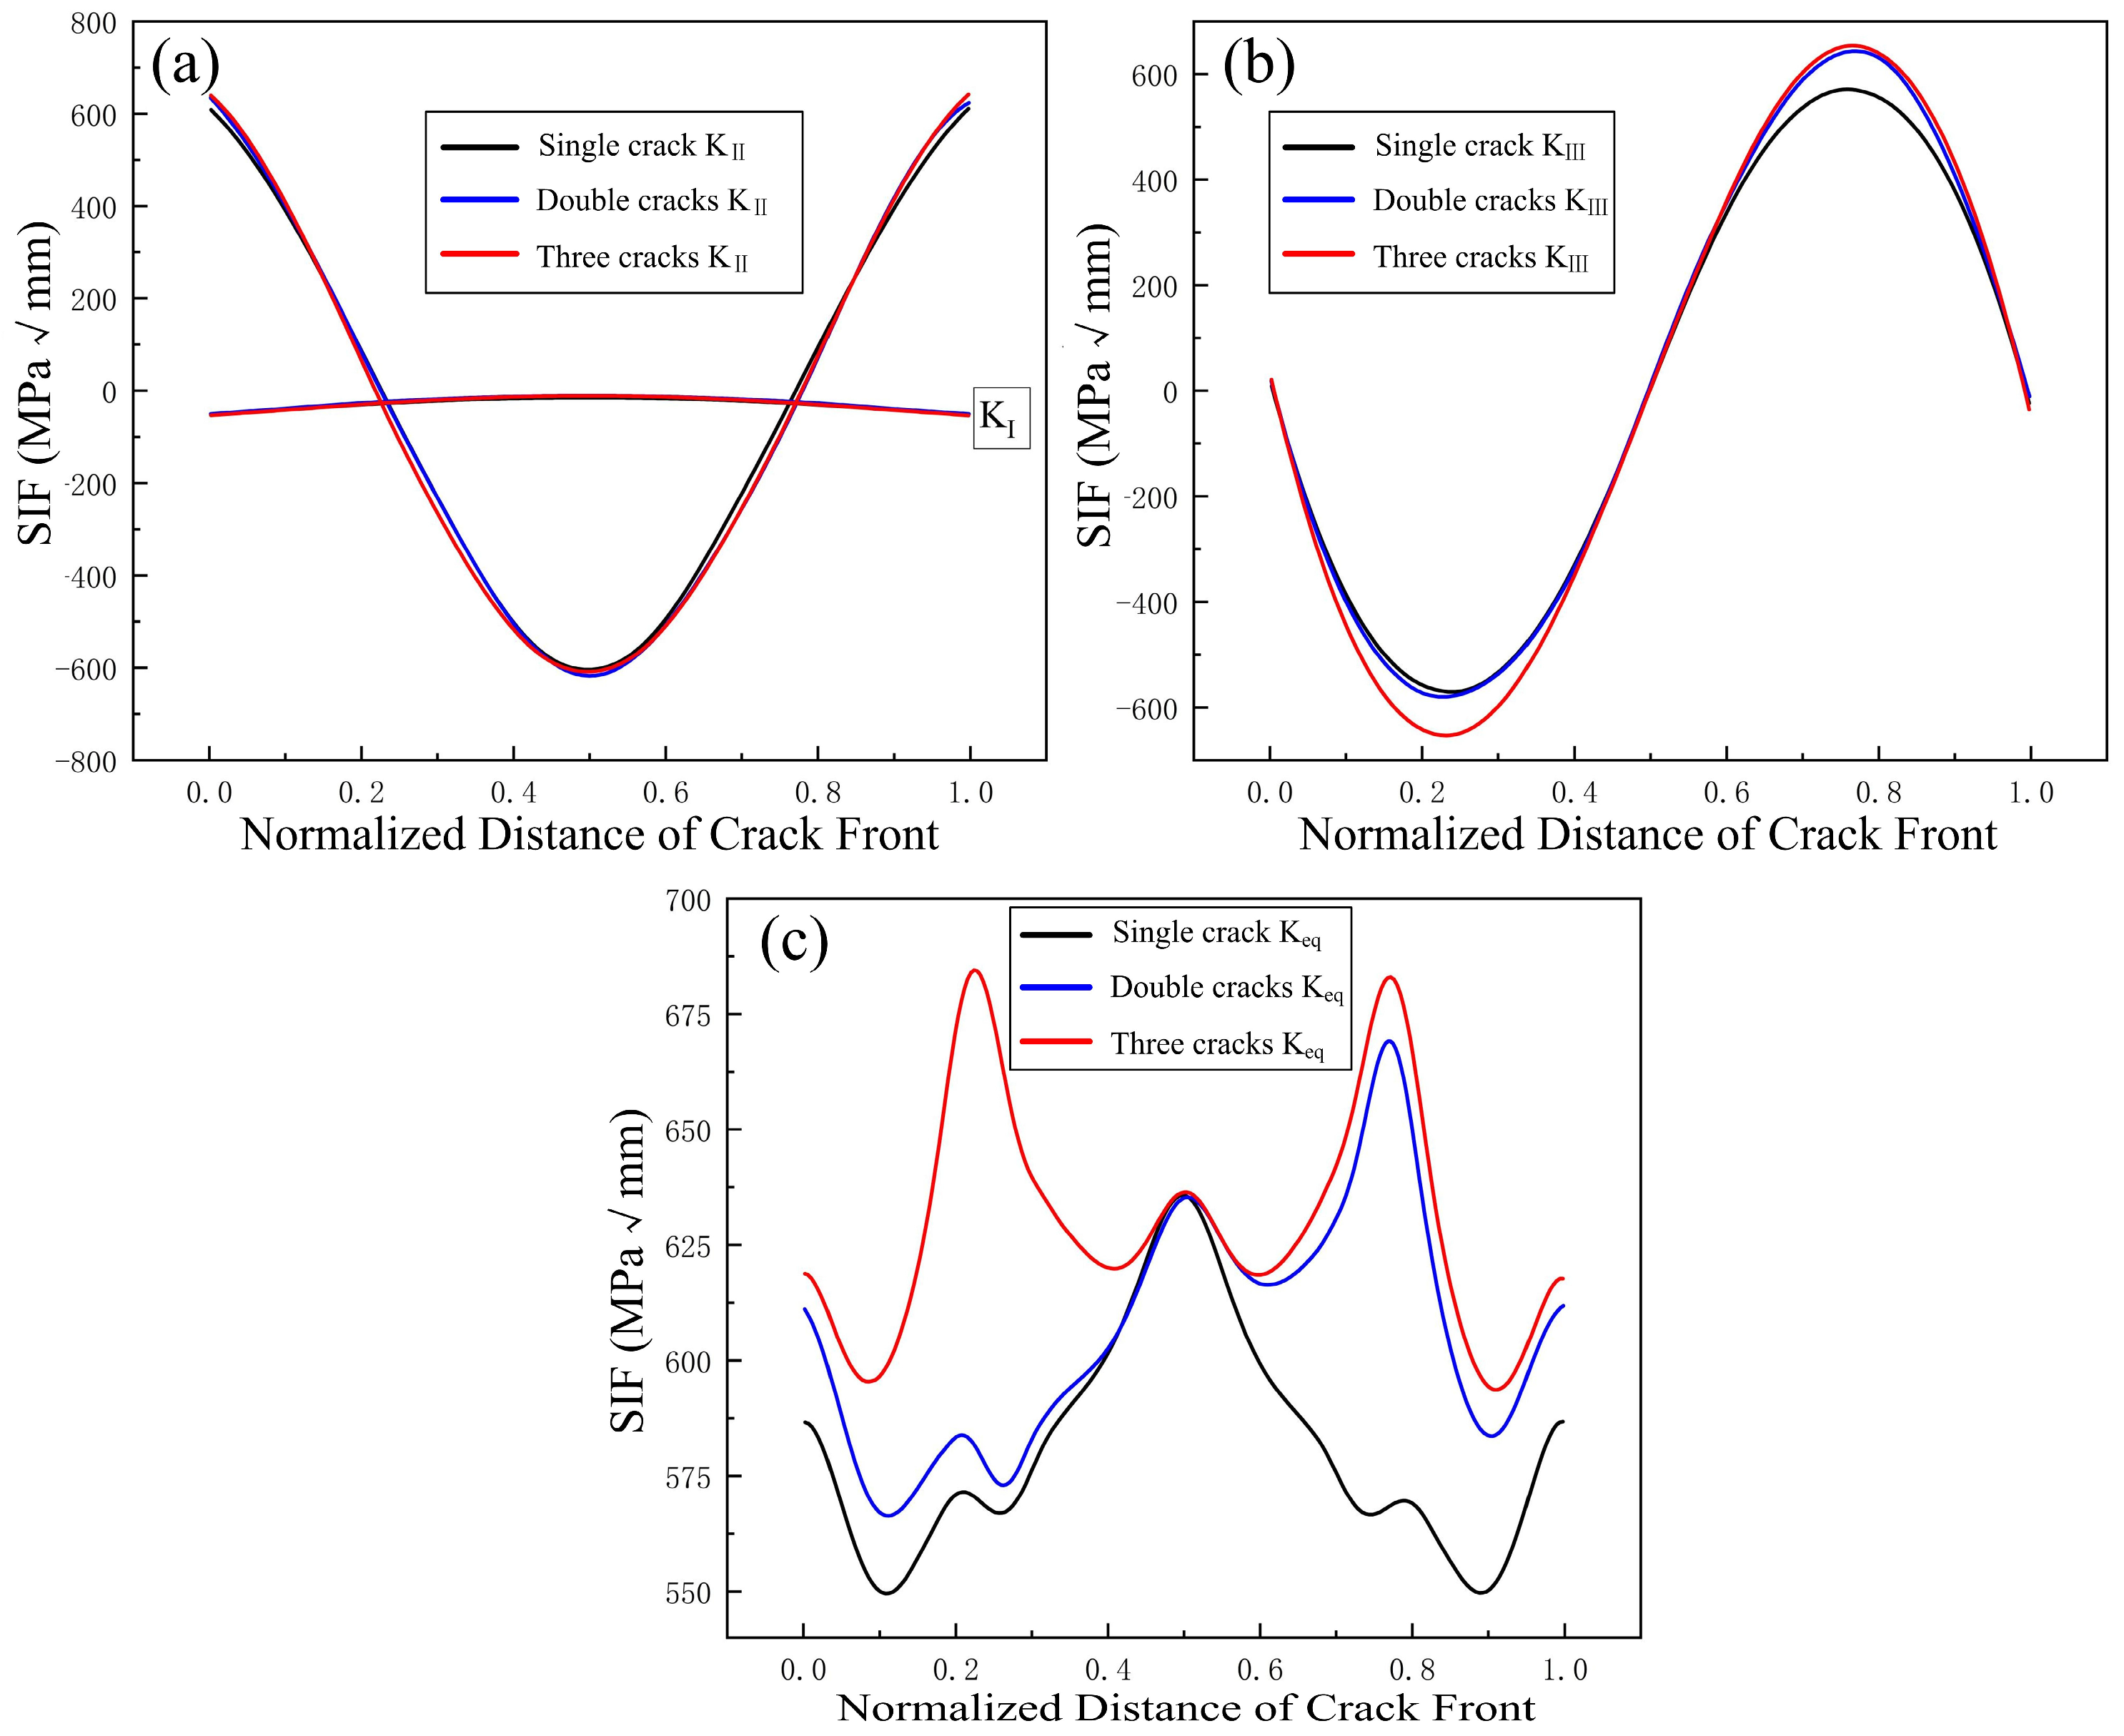
The distributions of the SIFs of the main cracks in the three models are shown in Figure 14a,b. It can be seen from the figures that the KI and KII of the cracks in each model are basically consistent, but KIII shows obvious differences. At the crack front of 0.25, the SIF of the triple-crack model is greater than those of the other two models, because the main crack is close to one of the secondary cracks at this position. Similarly, at the crack front of 0.75, both the double-crack and triple-crack models have secondary cracks, so their SIFs are relatively large. As shown in Figure 14c, the equivalent SIF at the crack front of 0.5 (i.e., the position with the fastest propagation in the single-crack model) is basically the same for each model, and the equivalent SIFs are larger in the directions of the secondary cracks in their respective models (double-crack model: 0.75; triple-crack model: 0.25, 0.75).
Comprehensive analysis shows that the presence of secondary cracks has little effect on the mode I and mode II propagation of the main crack but has a greater impact on mode III propagation. Before crack coalescence occurs, the fastest crack propagation path gradually deviates toward the direction of the secondary cracks, and the maximum equivalent SIF even exceeds that of the main crack. Moreover, as shown in Figure 14c, at the crack front of 0.25, even though there are no secondary cracks at this position in both the single-crack model and the double-crack model, the existence of other cracks in the double-crack model leads to a larger equivalent stress SIF. Similarly, at the crack front of 0.75, both the double-crack and triple-crack models have cracks at this position, but the presence of the secondary crack causes the equivalent SIF of the triple-crack model to be larger. Therefore, the presence of multi-source cracks increases the overall equivalent SIF of the cracks, enhances the driving force for crack propagation, and makes fatigue cracks more prone to propagate. These are the reasons why the reference cracks gradually propagate toward the secondary cracks before crack coalescence occurs.
Figure 15 shows the distributions of KII, KIII, and equivalent SIFs of the main crack in each model after crack propagation (as the crack is in a closed state, KI has basically no impact on crack propagation). It can be observed from the figure that as the crack propagates, the values of KII and KIII gradually increase, while their distributions remain largely unchanged. However, the magnitude of the change in KII is smaller than that of KIII. KIII increases significantly in the direction of the secondary cracks, yet KII does not exhibit a similar distribution pattern. The overall equivalent SIF of the crack gradually increases with crack propagation. In the early stage of propagation, the crack propagates along the direction of the fastest path of the main crack (crack front 0.5). In the double-crack and triple-crack models, the equivalent SIFs in the direction of the secondary cracks increase slowly as the crack propagates. Until the end of propagation, the factor reaches its maximum value, and the fastest propagation path also shifts toward the direction of the secondary cracks. Comprehensive analysis shows that the influence of multi-source cracks on the SIFs of the main crack mainly affects the distribution pattern of KIII, thereby influencing the distribution of the equivalent SIFs and changing the crack propagation pattern.

4.3.2. Influence on the Propagation Path of the Main Crack

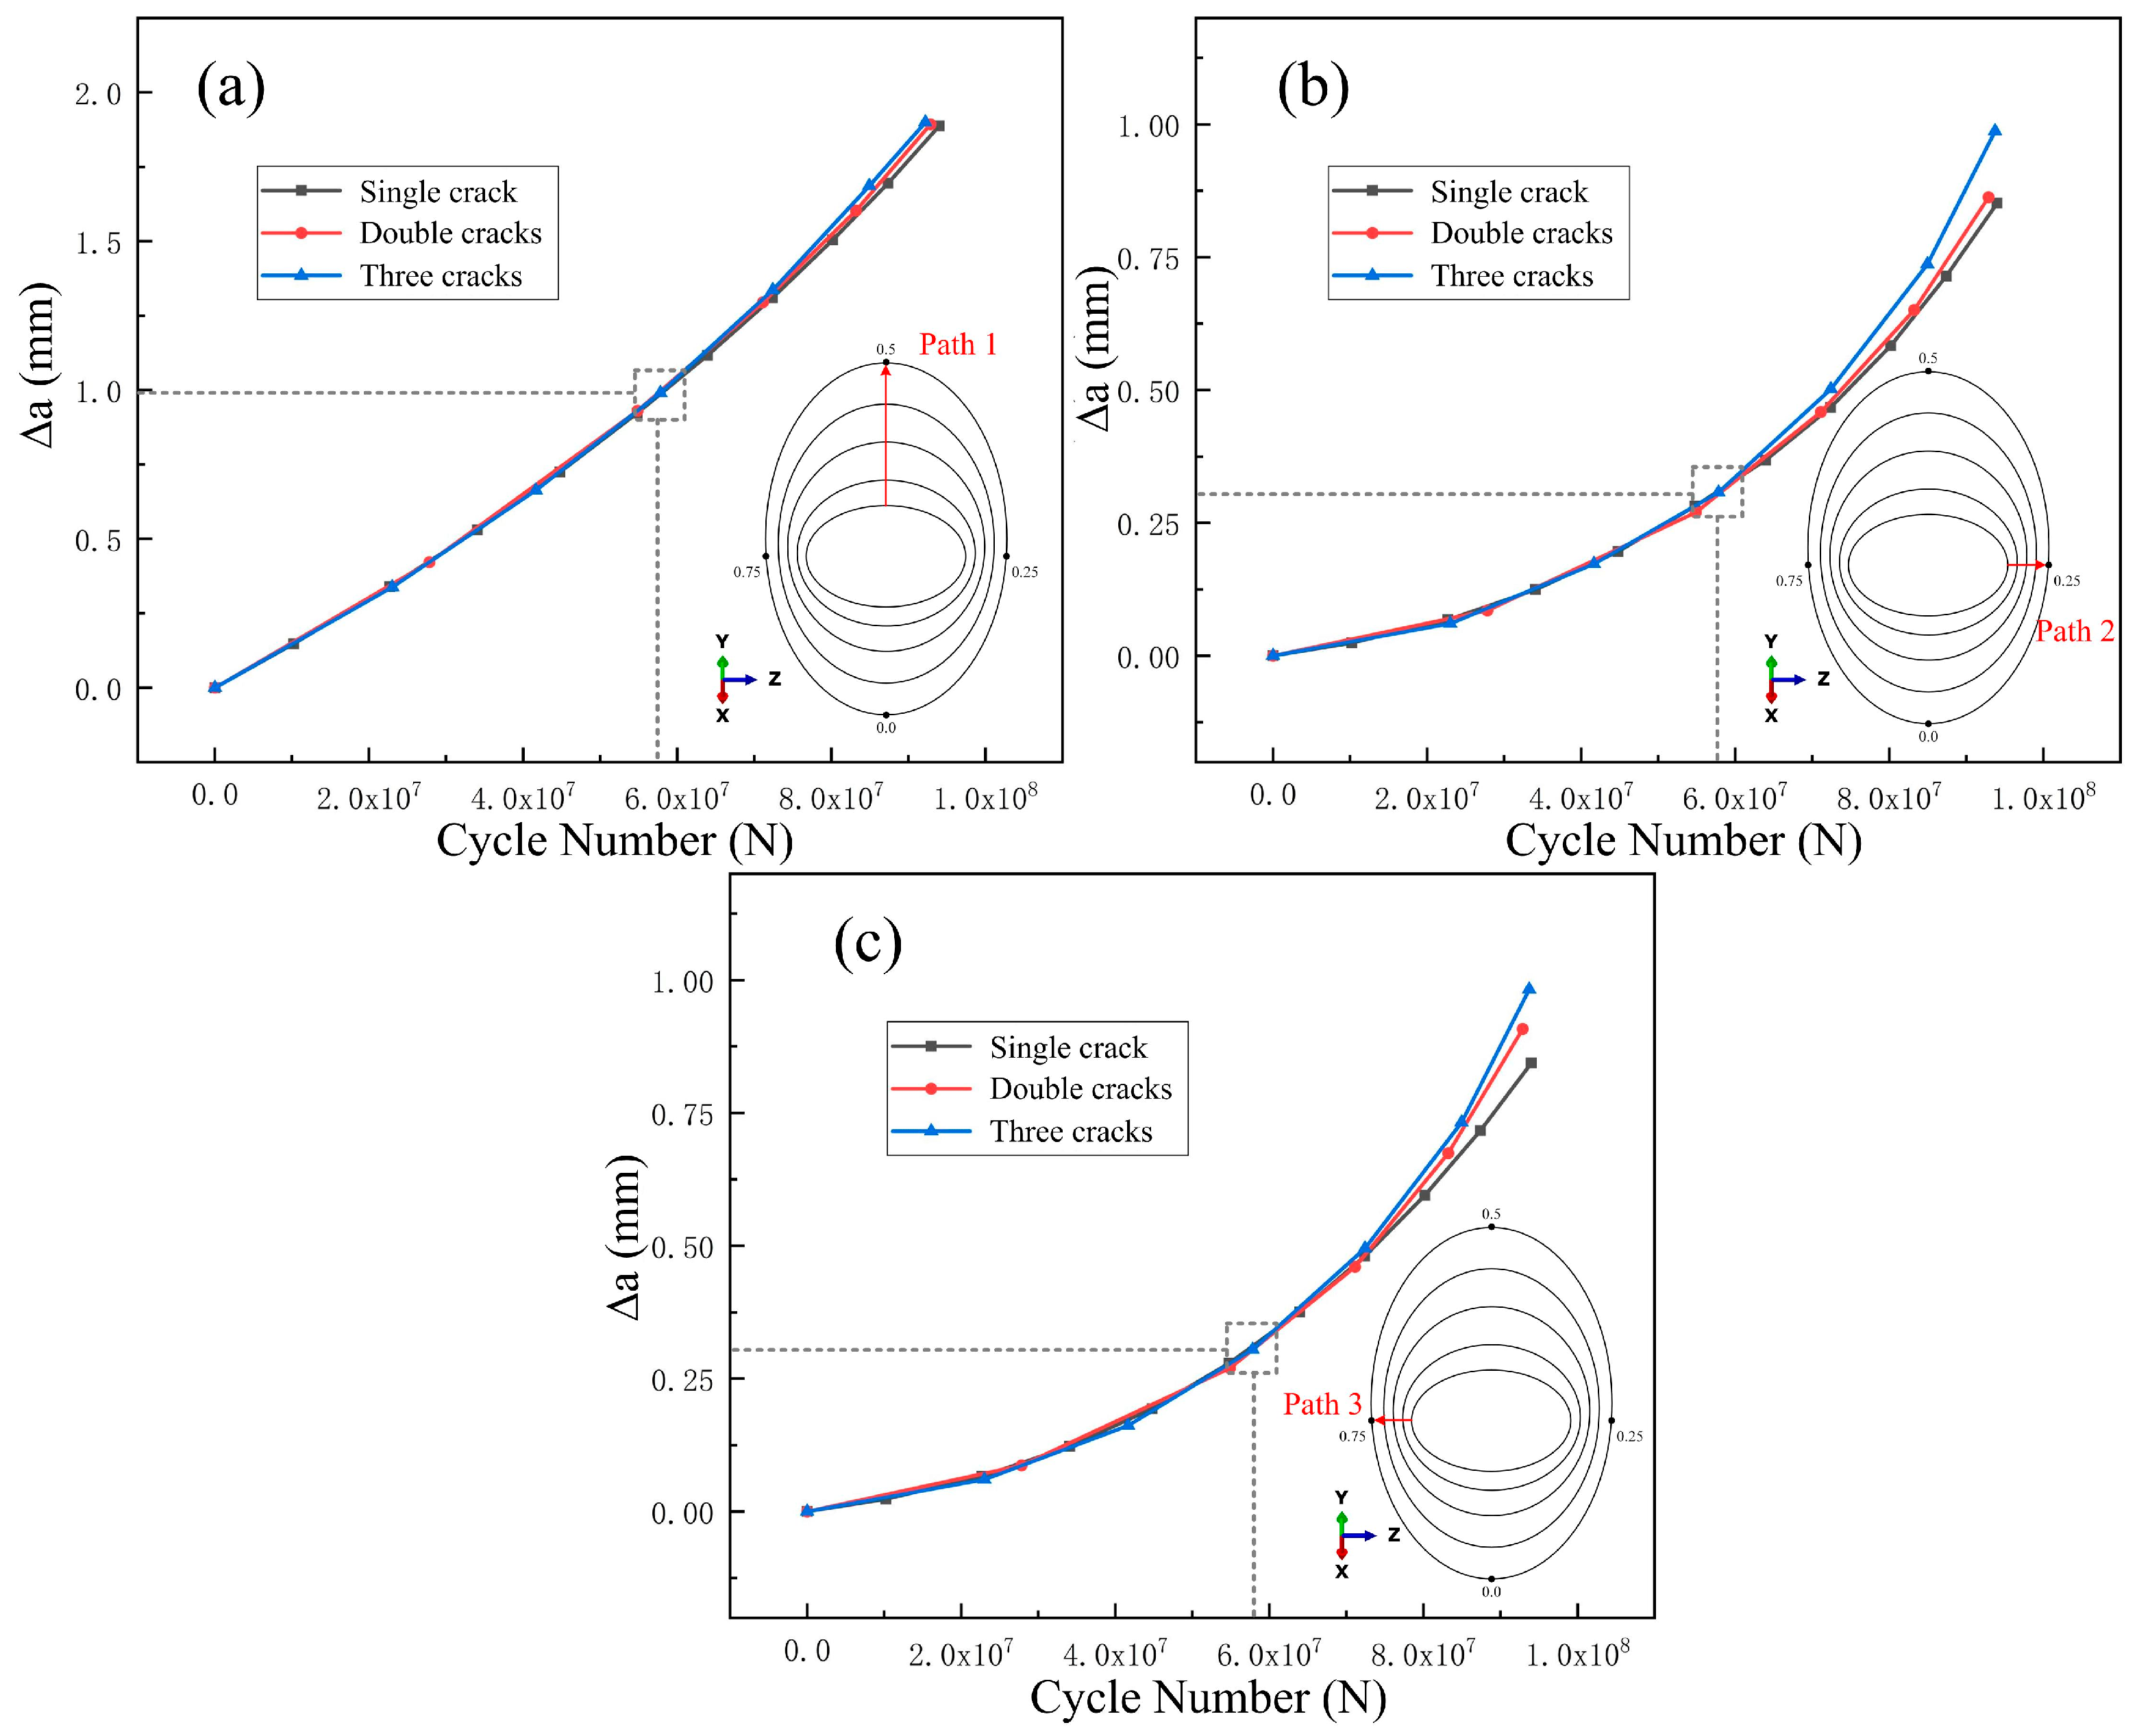
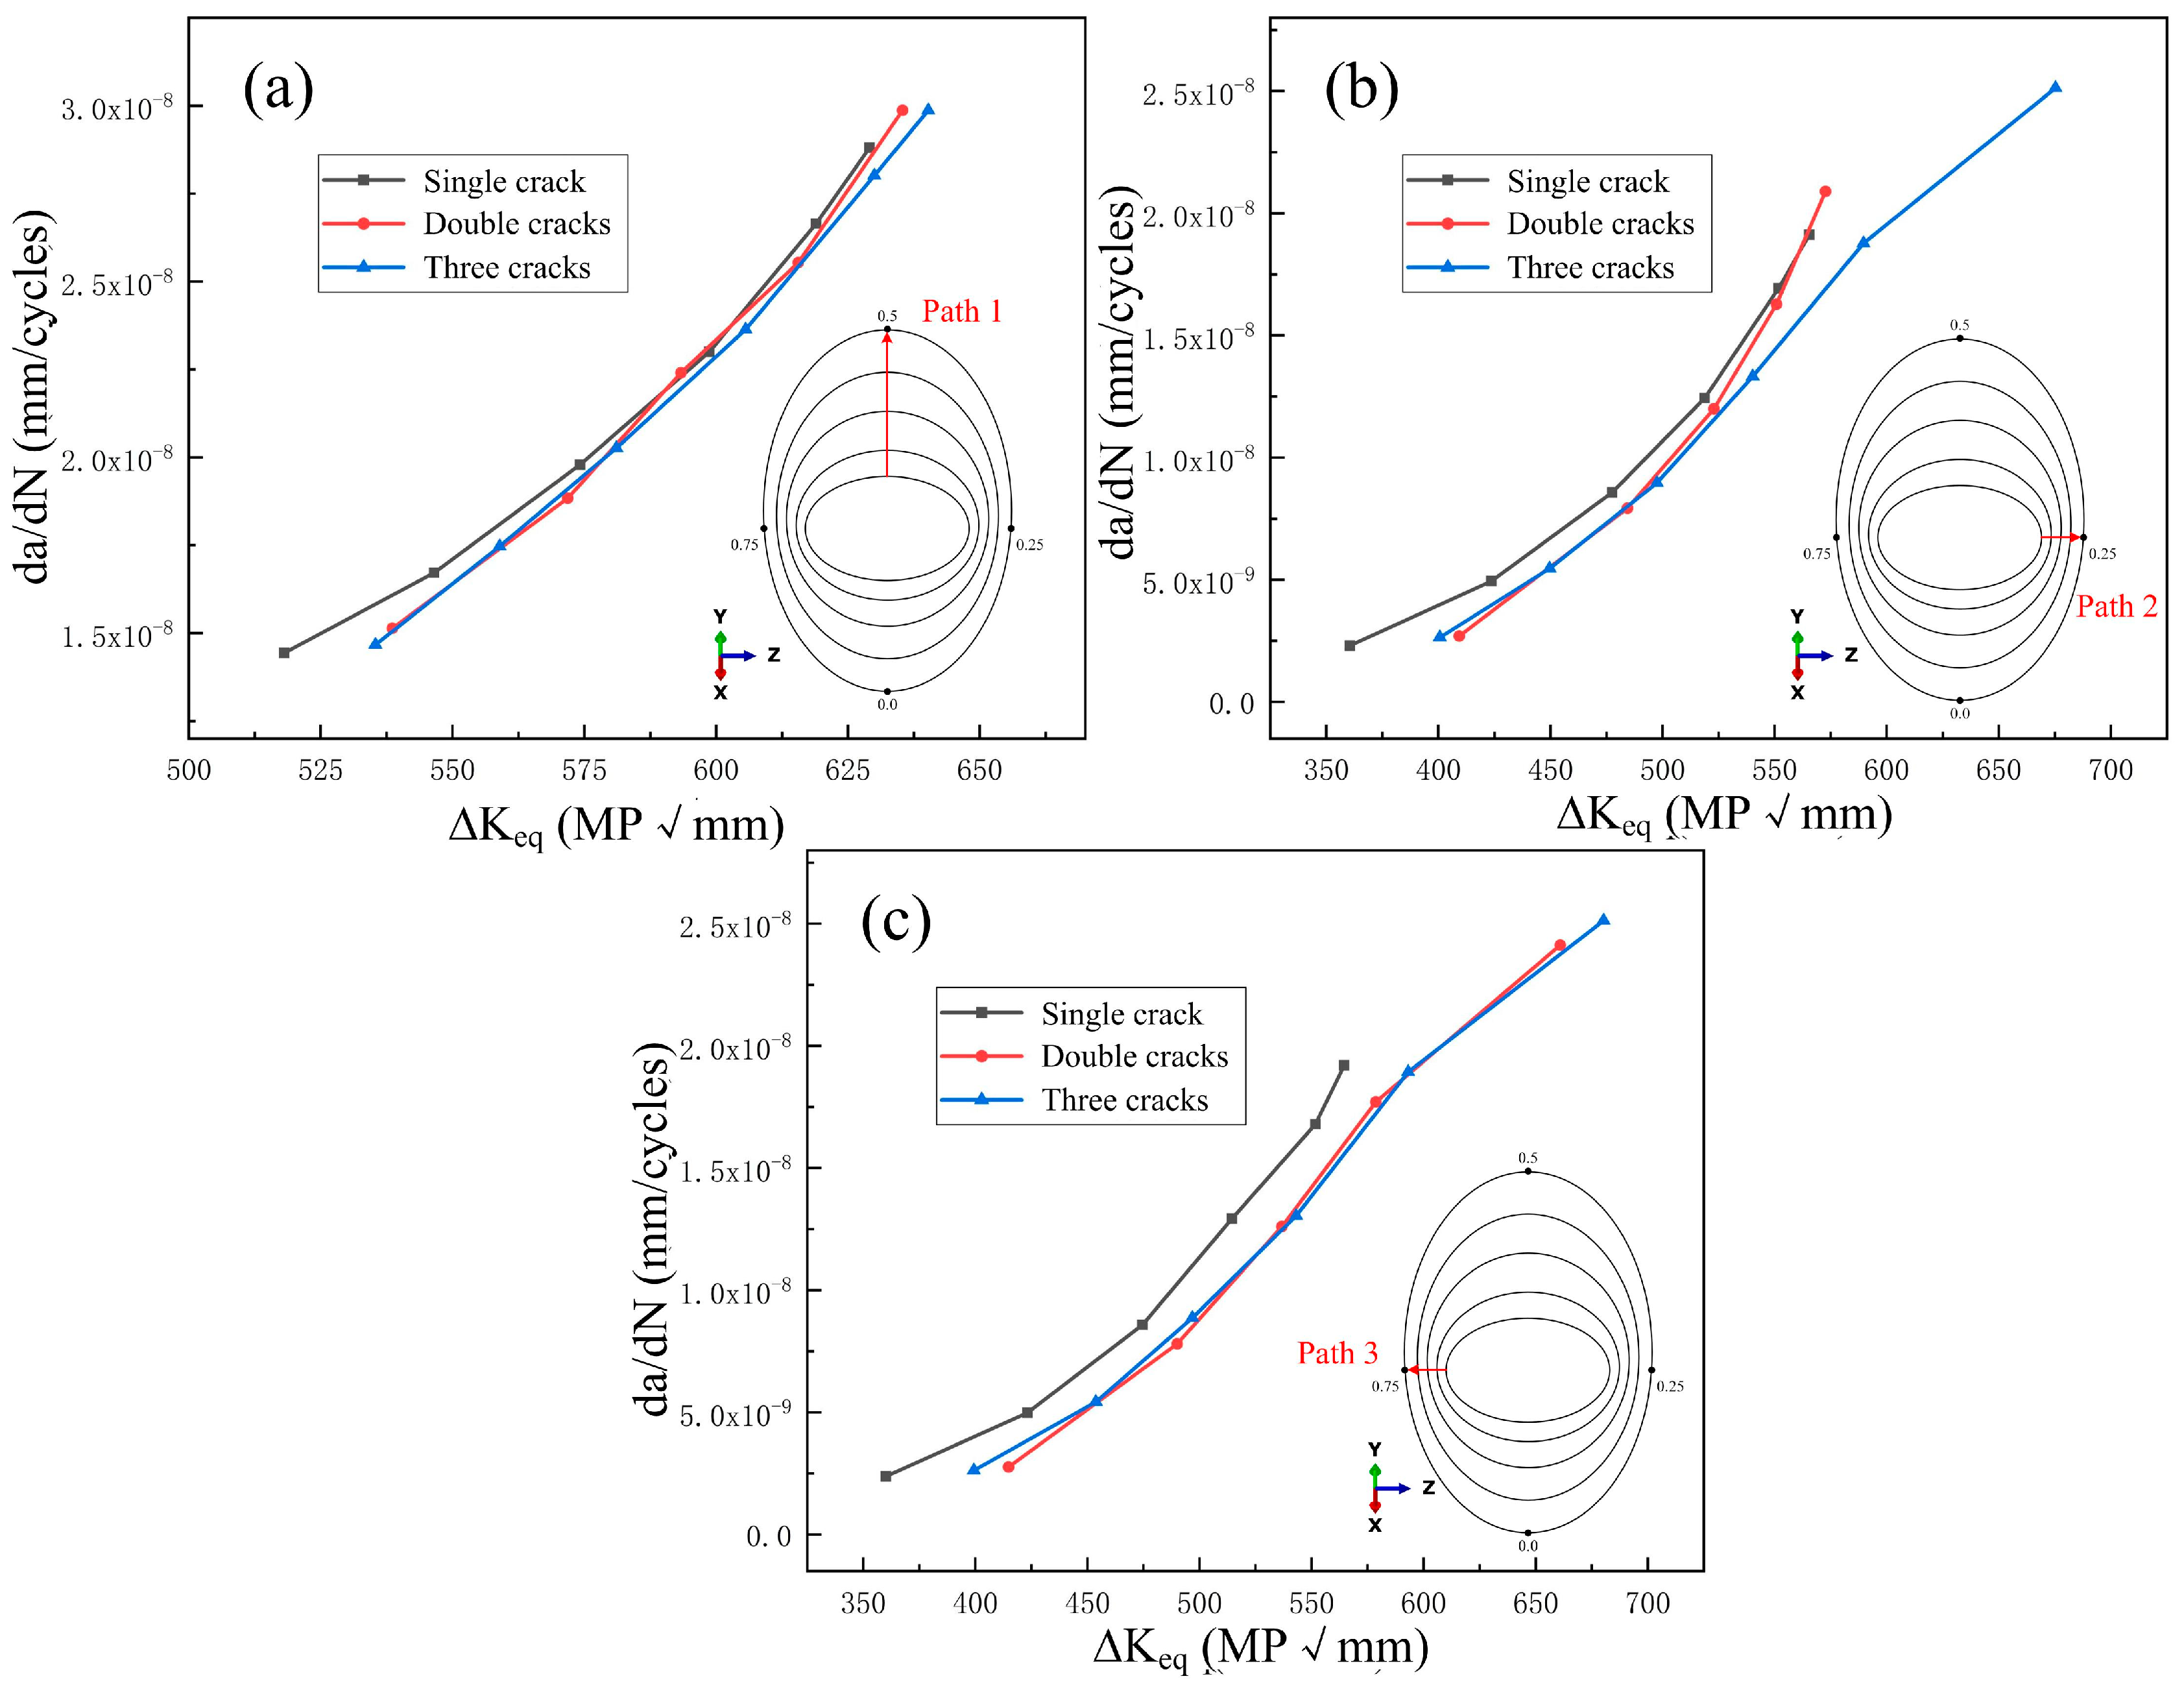
To further study the influence of secondary cracks on the main crack, three paths are defined. Path 1 represents the propagation direction of the reference crack in the single-crack model, while Paths 2 and 3 correspond to the directions of multi-source cracks relative to the reference crack in the multi-crack model.
Figure 16 shows the curves of the propagation amount of the reference crack in each model for different paths as a function of cycles. The curves for the three paths diverge when the cycles reach 5.7 × 10⁷, defined as the cyclic boundary cycles. As shown in the figure, after reaching the cyclic boundary cycles, the propagation rate of the reference crack in the multi-crack model accelerates. The degree of change in Path 1 is significantly smaller than that in the other two cases, and the reference crack on Paths 2 and 3 propagates rapidly toward the direction of the secondary cracks. Figure 17 shows the curves of the propagation rate of the reference crack in each model for different paths as a function of the equivalent SIF. The curves of the three models on Path 1 are basically consistent, indicating that the crack propagation rates are relatively close. On Path 2, the equivalent SIF of the double-crack model gradually approaches that of the single-crack model as the propagation rate increases, while the crack propagation driving force ΔKeq of the triple-crack model is always larger than that of other models. On Path 3, the driving force of the multi-crack model is always greater than that of the single-crack model, and the changes between the two multi-crack models are also basically consistent. In summary, the presence of multi-source cracks increases the initial driving force ΔKeq of crack propagation. As the propagation rate increases, the driving force in the direction without secondary cracks gradually returns to the normal level, while the driving force in the direction of the secondary cracks keeps increasing. During crack propagation, multi-source cracks have little influence on the original propagation path of the crack. After a certain number of cycles, the main crack rapidly propagates toward the secondary cracks until crack coalescence occurs, making the crack more dangerous.
In summary, the presence of secondary cracks can alter the stress distribution in the wheel, increase the SIF of the cracks, enhance the stress at the crack tips, and accelerate crack propagation. As the distance among cracks decreases, the influence of secondary cracks on main crack propagation gradually intensifies. Once the crack spacing reaches a certain critical value, two cracks will rapidly propagate toward each other until crack coalescence occurs.

4.4. Discussion on Residual Peeling Lifetime

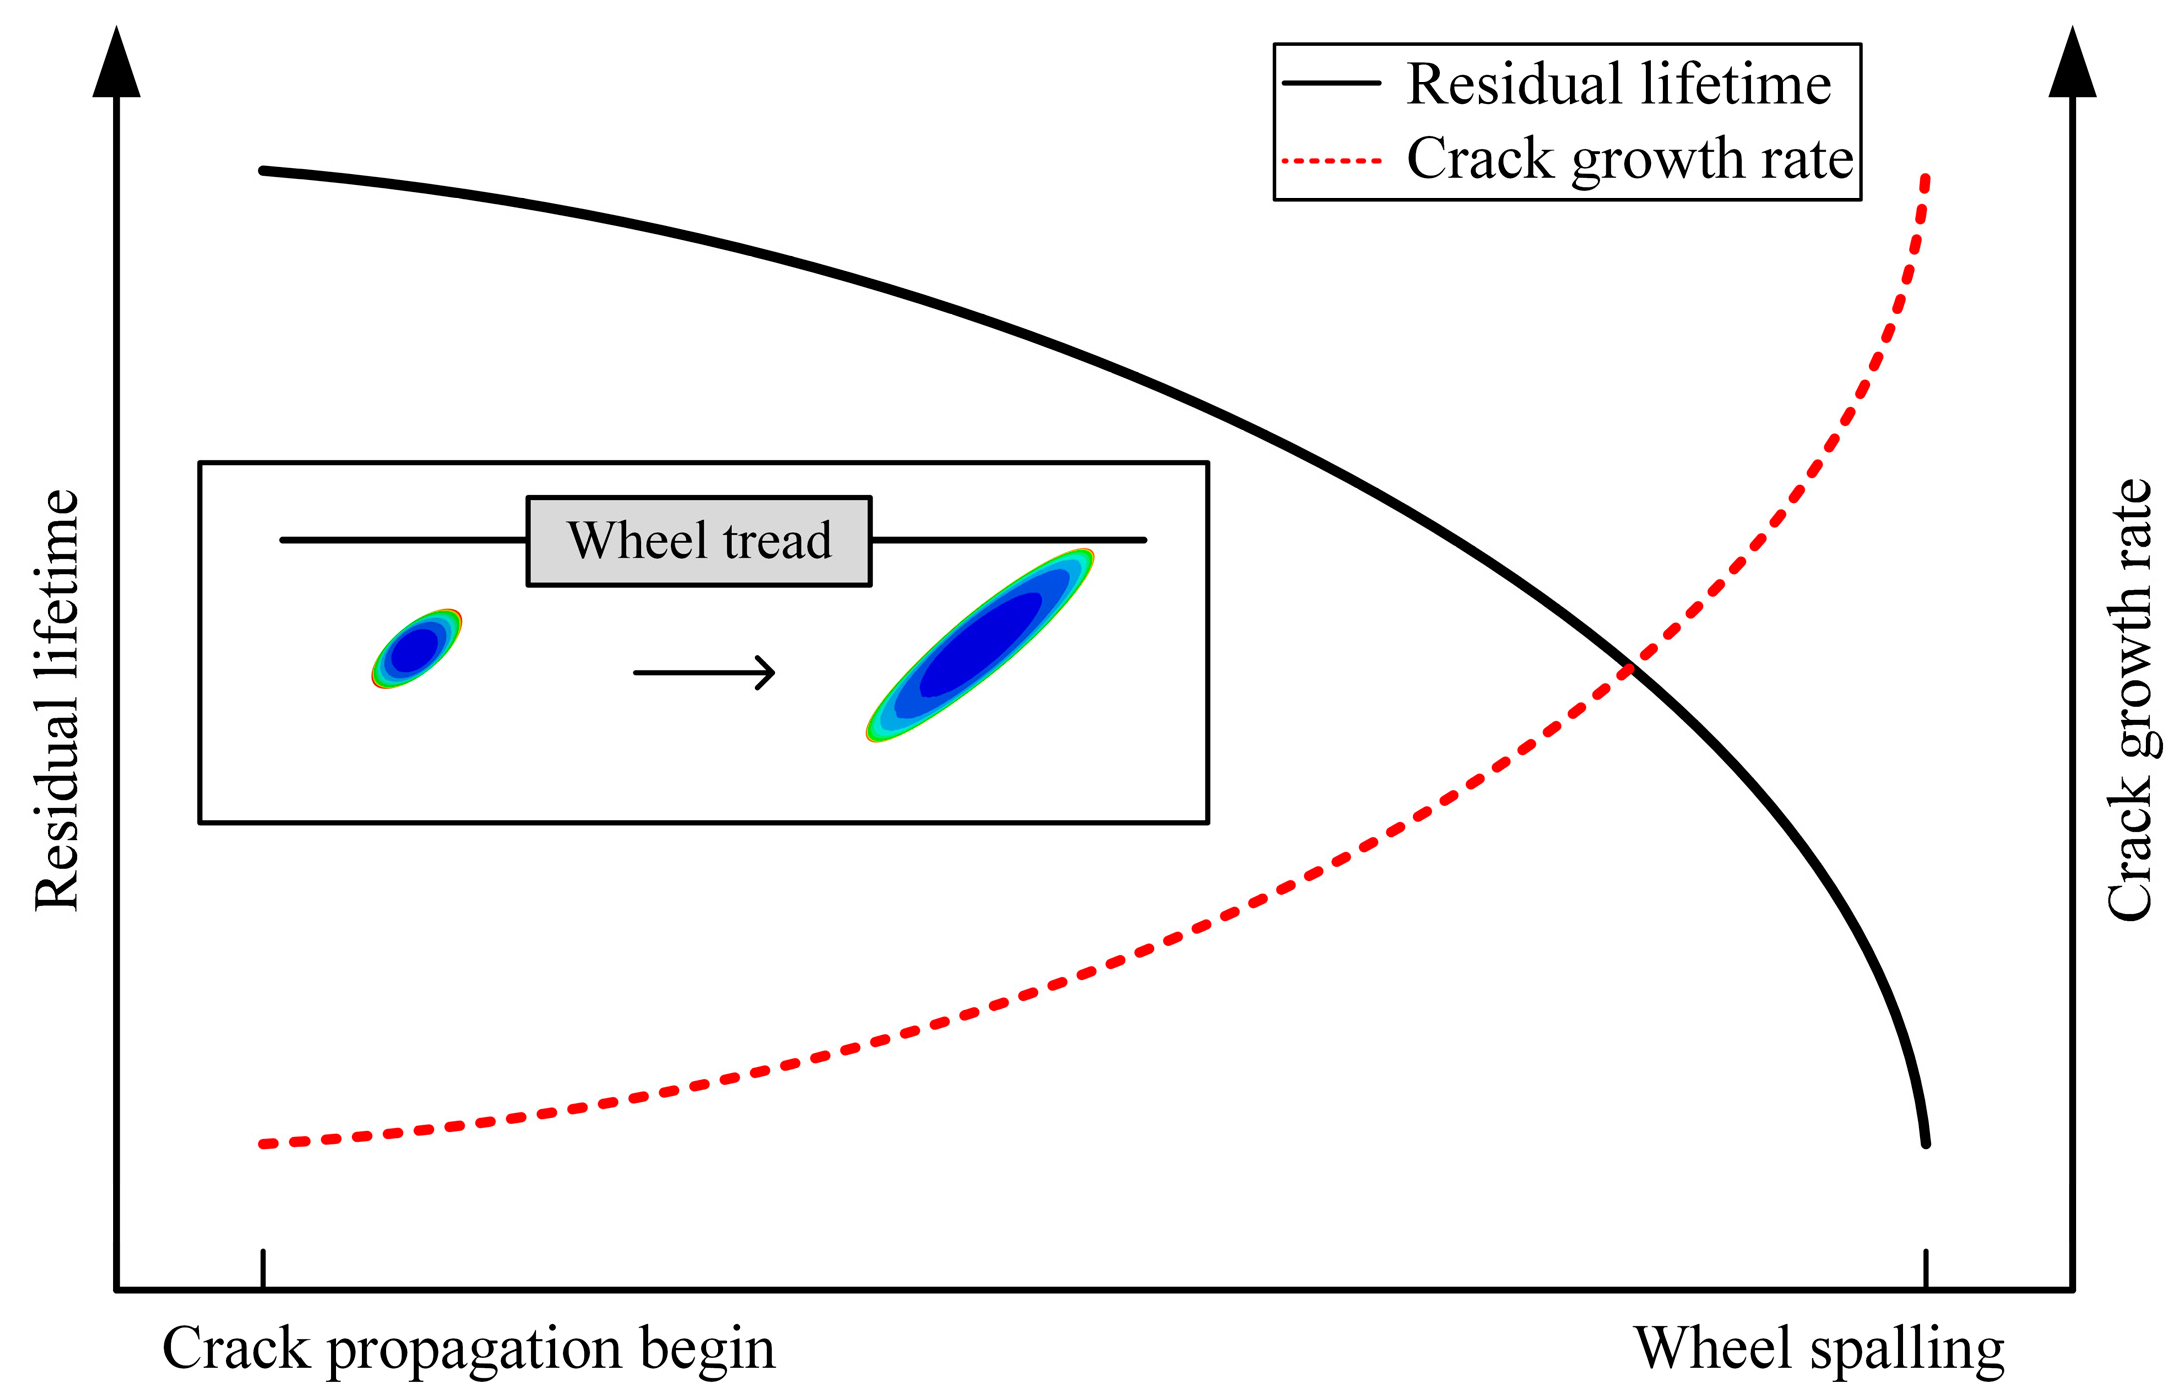
Based on the aforementioned research results, the subsurface fatigue cracks in the wheel lie in a slow-propagation region in the early stage of propagation, featuring a relatively low crack growth rate. However, as the crack propagation length increases and enters the rapid-propagation zone, the crack growth rate gradually accelerates, and the reduction rate of the wheel’s remaining peeling life speeds up, as shown in Figure 18. It is specified that when the crack propagates to the wheel tread, severe peeling occurs in the wheel. Therefore, subsurface fatigue cracks in the wheel should be detected, and maintenance should be carried out as early as possible to prevent cracks from entering the rapid-propagation zone and causing wheel failure.
The presence of multi-source cracks alters the internal stress distribution in the wheel and affects the SIF of the cracks, thereby modifying the crack propagation rate. Figure 19 is a schematic diagram illustrating the influence of secondary cracks on the propagation of the reference crack. In the early stage of crack propagation, the presence of secondary cracks has minimal impact on the reference crack, which propagates following its original law. As the crack growth length reaches a certain threshold, the influence of secondary cracks on the reference crack intensifies. The reference crack accelerates its propagation toward the direction of the secondary cracks, leading to a rapid increase in the crack propagation rate and a sharp decrease in the wheel’s remaining peeling life. When different cracks come into contact, crack coalescence occurs. The coalesced crack becomes larger, making the wheel extremely prone to fatigue failure. It is defined that wheel peeling initiates when multi-crack coalescence occurs. Although the crack has not propagated to the tread at this time, the evaluation parameters of the coalesced crack are all higher than those of ordinary cracks, making this the most dangerous case when secondary cracks exist and crack coalescence takes place. Therefore, for wheels with multi-cracks in the subsurface, timely maintenance should be carried out before the crack propagation length reaches the critical value affected by secondary cracks.

5. Conclusions

Based on the relevant parameters of the Chinese high-speed EMU train, this paper constructs FE models of high-speed train wheels. To make the simulation more realistic, a dynamic model is established in accordance with the relevant parameters of the Chinese high-speed EMU train, so as to obtain the load spectrum and apply it to the wheels under the train’s linear service conditions. This study explores the influence of the crack angle between the fatigue crack and the horizontal plane, the crack shape, and the crack size on the crack propagation behavior and remaining peeling life of wheels. Additionally, the effect of secondary cracks on the propagation of the main subsurface fatigue crack in wheels is studied, focusing on how secondary cracks influence the main crack’s stress distribution, crack tip SIF, and crack propagation for different paths. The following conclusions are drawn:
(1)
Under the complex loads acting on the wheel, the propagation mode of subsurface cracks in wheels is mainly a mixture of modes II and III caused by shear stress, with mode II propagation being dominant. This is consistent with the authors’ previous work on rails. Since the cracks remain in a closed state during propagation, the influence of the mode I SIF on crack propagation is minimal.
(2)
When the fatigue crack inside the wheel forms a 45° angle with the wheel–rail contact horizontal plane, it represents the most dangerous condition. Cracks at this angle propagate the fastest, resulting in the shortest remaining life of the wheel. Compared with circular cracks, elliptical cracks exhibit a greater driving force in the early stage of crack propagation, leading to an accelerated crack growth rate and a reduced remaining peeling life of the wheel.
(3)
The presence of secondary cracks has little influence on the initial stress distribution of the main crack, but it makes the stress singularity at the crack tip more prominent. The maximum von Mises stress of the wheel increases as the number of multi-source cracks increases. In the multi-crack model, the reference crack exhibits a stress distribution different from that in the single-crack model in the direction of secondary cracks, which proves that the reference crack gradually propagates toward the secondary cracks before crack coalescence occurs.
(4)
The presence of multi-source cracks has little effect on the mode I and mode II propagation of the main crack but has a significant impact on mode III propagation. Additionally, it increases the overall equivalent SIF of the crack and enhances the driving force for crack propagation, making fatigue cracks more prone to propagation and reducing the peeling life of the wheel.
(5)
The presence of secondary cracks increases the initial driving force ΔKeq for crack propagation. During crack propagation, secondary cracks have little influence on the original propagation path of the crack. After a certain number of cycles, the original crack rapidly propagates toward the secondary cracks until crack coalescence occurs, making the cracks more dangerous.
This study explores fatigue crack propagation behaviors, and the results provide a fundamental basis for formulating operation and maintenance plans for high-speed railway wheels. However, accurate fatigue lifetime evaluation methods based on the fatigue crack propagation results for the wheel are needed for future research.

Author Contributions

T.G.: Writing—original draft, Writing—review and editing, and Data curation; B.C.: Writing—review and editing and Supervision; X.F.: Writing—review and editing, Conceptualization, and Supervision. All authors have read and agreed to the published version of the manuscript.

Funding

This research study received no external funding.

Data Availability Statement

The original contributions presented in the study are included in the article, further inquiries can be directed to the corresponding authors.

Conflicts of Interest

Author Tao Guo was employed by CRRC TANGSHAN Co., Ltd. The remaining authors declare that the research was conducted in the absence of any commercial or financial relationships that could be construed as a potential conflict of interest.

Abbreviations

The following abbreviations are used in this paper:
SymbolMeaning
SIFStress intensity factor
FEFinite element
FEMFinite element method
RCFRolling contact fatigue
FVVertical load
Δa/ΔNCrack growth rate
ΔKeqEquivalent stress intensity factor
KIMode I crack
KIIMode II crack
KIIIMode III crack

References

  1. Reis, L.; Li, B.; de Freitas, M. A multiaxial fatigue approach to Rolling Contact Fatigue in railways. Int. J. Fatigue 2014, 67, 191–202. [Google Scholar] [CrossRef]
  2. Cong, T.; Han, J.M.; Hong, Y.S.; Domblesky, J.P.; Liu, X.L. Shattered rim and shelling of high-speed railway wheels in the very-high-cycle fatigue regime under rolling contact loading. Eng. Fract. Mech. 2019, 97, 556–567. [Google Scholar] [CrossRef]
  3. Cantini, S.; Cervello, S.J.W. The competitive role of wear and RCF: Full scale experimental assessment of artificial and natural defects in railway wheel treads. Wear 2016, 366, 325–337. [Google Scholar] [CrossRef]
  4. Gullers, P.; Dreik, P.; Nielsen, J.C.; Andersson, L. Track condition analyser: Identification of rail rolling surface defects, likely to generate fatigue damage in wheels, using instrumented wheelset measurements. Proceedings of the Institution of Mechanical Engineers, P.I. Mech. Eng. F.-J. Rai. 2011, 225, 1–13. [Google Scholar]
  5. Zhu, Z.Y.; Zhu, Y.L.; Wang, Q.Y. Fatigue mechanisms of wheel rim steel under off-axis loading. Mat. Sci. Eng. A-Struct. 2020, 773, 138731. [Google Scholar] [CrossRef]
  6. Yang, L.Q.; Hu, M.; Zhao, D.M.; Yang, J.; Zhou, X. A method for assessing wheel fatigue reliability considering multiaxial stress state. Adv. Mech. Eng. 2020, 12, 1–14. [Google Scholar] [CrossRef]
  7. Peixoto, D.F.; de Castro, P.M.S.T. Modelling of the fracture of a railway wheel. Procedia Struct. Integr. 2016, 2, 1904–1911. [Google Scholar] [CrossRef]
  8. Nejad, R.M.; Farhangdoost, K.; Shariati, M.J.E.F.A. Numerical study on fatigue crack growth in railway wheels under the influence of residual stresses. Eng. Fail. Anal. 2015, 52, 75–89. [Google Scholar] [CrossRef]
  9. Yan, R.G.; Wang, W.J.; Guo, Y.T.; Liu, X.L.; Wu, S.C.; Zhang, Z.X. Influence of wheel out-of-roundness on the remaining life of railway wheels under mixed-mode fatigue loading. Fatigue Fract. Eng. Mater. Struct. 2022, 45, 2072–2085. [Google Scholar] [CrossRef]
  10. Zhang, Q.S.; Caraballo, I.T.; Li, Q.Z.; Han, J.C.; Han, J.; Zhao, J.W.; Dai, G.Z. Tension-shear multiaxial fatigue damage behavior of high-speed railway wheel rim steel. Int. J. Fatigue 2020, 133, 105416. [Google Scholar] [CrossRef]
  11. Zeng, D.F.; Xu, T.; Liu, W.D.; Lu, L.T.; Zhang, J.W.; Gong, Y.H. Investigation on rolling contact fatigue of railway wheel steel with surface defect. Wear 2020, 203207, 446–447. [Google Scholar] [CrossRef]
  12. Haidemenopoulos, G.; Sarafoglou, P.; Christopoulos, P.; Zervaki, A.D. Rolling contact fatigue cracking in rails subjected to in-service loading. Fatigue Fract. Eng. Mater. Struct. 2016, 39, 1161–1172. [Google Scholar] [CrossRef]
  13. Liu, Y.; Liu, L.; Mahadevan, S.J.E.F. Analysis of subsurface crack propagation under rolling contact loading in railroad wheels using FEM. Eng. Fract. Mech. 2007, 74, 2659–2674. [Google Scholar] [CrossRef]
  14. Cho, D.H.; Seong, H.; Kim, Y.J.; Choi, J.B.; Jun, H.K.; Seo, J.W.; Kim, D.S. Parametric study on the fatigue life of railways under rolling contact fatigue by three-dimensional numerical analysis. J. Mech. Sci. Technol. 2012, 26, 359–365. [Google Scholar] [CrossRef]
  15. Meray, F.; Chaise, T.; Gravouil, A.; Depouhon, P.; Descharrieres, B.; Nélias, D. A novel SAM/X-FEM coupling approach for the simulation of 3D fatigue crack growth under rolling contact loading. Finite Elem. Anal. Des. 2022, 206, 103752. [Google Scholar]
  16. Ringsberg, J.W.; Bergkvist, A.J.F.; Materials, F.O.E. On propagation of short rolling contact fatigue cracks. Fatigue Fract. Eng. Mater. Struct. 2003, 26, 969–983. [Google Scholar] [CrossRef]
  17. Butini, E.; Marini, L.; Meacc, M.; Meli, E.; Rindi, A.; Zhao, X.J.; Wang, W.J. An innovative model for the prediction of wheel-Rail wear and rolling contact fatigue. Wear 2019, 436, 203025. [Google Scholar] [CrossRef]
  18. Huang, Y.B.; Shi, L.B.; Zhao, X.J.; Cai, Z.B.; Liu, Q.Y.; Wang, W.J. On the formation and damage mechanism of rolling contact fatigue surface cracks of wheel/rail under the dry condition. Wear 2018, 400–401, 62–73. [Google Scholar] [CrossRef]
  19. Dubourg, M.; Villechaise, B. Analysis of multiple fatigue cracks—Part I: Theory. J. Tribol. T. Asme 1992, 114, 455–461. [Google Scholar] [CrossRef]
  20. Dubourg, M.; Godet, M.; Villechaise, B. Analysis of multiple fatigue cracks—Part II: Results. J. Tribol. T. Asme 1992, 114, 462–468. [Google Scholar] [CrossRef]
  21. Tao, G.Q.; Tan, M.S.; Yuan, X.Y.; Wen, B.G.; Wen, Z.F. Influence of wheel wear on the rolling contact fatigue of metro wheels in the central area of the wheel tread. Wear 2025, 571, 205777. [Google Scholar] [CrossRef]
  22. Deuce, R. Wheel Tread Damage-An Elementary Guide, Bombardier Transportation Gmbh, Netphen; Technical Report: Berlin, Germany, 2007. [Google Scholar]
  23. Luo, K.L.; Liu, X.L.; Yang, Y.; Cong, T.; Zhang, F.; Wang, W. Modeling the competitive relationship between wear and rolling contact fatigue of railway wheel steel. Wear 2025, 205615, 560–561. [Google Scholar] [CrossRef]
  24. Zhang, R.J.; Zheng, C.L.; Chen, C.; Lv, B.; Gao, G.; Yang, Z.; Yang, Y.; Zhang, F. Study on fatigue wear competition mechanism and microstructure evolution on the surface of a bainitic steel rail. Wear 2021, 203978, 482–483. [Google Scholar] [CrossRef]
  25. Liu, H.L.; Liu, H.J.; Zhu, C.C.; Tang, J. Study on gear contact fatigue failure competition mechanism considering tooth wear evolution. Tribol. Int. 2020, 147, 106277. [Google Scholar] [CrossRef]
  26. Wang, H.H.; Wang, W.J.; Han, Z.Y.; Wang, Y.; Ding, H.H.; Lewis, R.; Lin, Q.; Liu, Q.Y.; Zhou, Z.R. Wear and rolling contact fatigue competition mechanism of different types of rail steels under various slip ratios. Wear 2023, 522, 204721. [Google Scholar] [CrossRef]
  27. Basseville, S.; Cailletaud, G. An evaluation of the competition between wear and crack initiation in fretting conditions for Ti-6Al-4V alloy. Wear 2015, 328, 443–455. [Google Scholar] [CrossRef]
  28. Fang, X.Y.; Zhang, H.N.; Ma, D.W. Influence of initial crack on fatigue crack propagation with mixed mode in U71Mn rail subsurface. Eng. Fail. Anal. 2022, 136, 106220. [Google Scholar] [CrossRef]
  29. GB/T 5599-2019; Specification for Dynamic Performance Assessment and Testing Verification of Rolling Stock. State Administration for Market Regulation, Standardization Administration of China: Bei Jing, China, 2019.
  30. Ai-Mukhtar, A.M.; Biermann, H.; Hubner, P.; Henkel, S. Determination of some parameters for fatigue life in welded joints using fracture mechanics method. J. Mater. Eng. Perfor. 2010, 19, 1225–1234. [Google Scholar] [CrossRef]
  31. Fang, X.Y.; Zhang, H.N.; Ma, D.W.; Wu, Z.J.; Huang, W. Influence of welding residual stress on subsurface fatigue crack propagation of rail. Eng. Fract. Mech. 2022, 271, 108642. [Google Scholar] [CrossRef]
  32. Paris, P.C.; Gomez, R.E.; Anderson, W.E. A rational analytic theory of fatigue. Trend Eng. 1961, 13, 9–14. [Google Scholar]
  33. Fang, X.Y.; Cai, Z.B.; Wang, J.G.; Yang, X.F. Evaluation of temperature-sensitive fatigue crack propagation of a high-speed railway wheel rim material. Fatigue Fract. Eng. Mater. Struct. 2019, 42, 815–1825. [Google Scholar] [CrossRef]
  34. Richard, H.A.; Fulland, M.; Sander, M.; Kullmer, G. Fracture in a rubber-sprung railway wheel. Eng. Fail. Anal. 2005, 6, 986–999. [Google Scholar] [CrossRef]
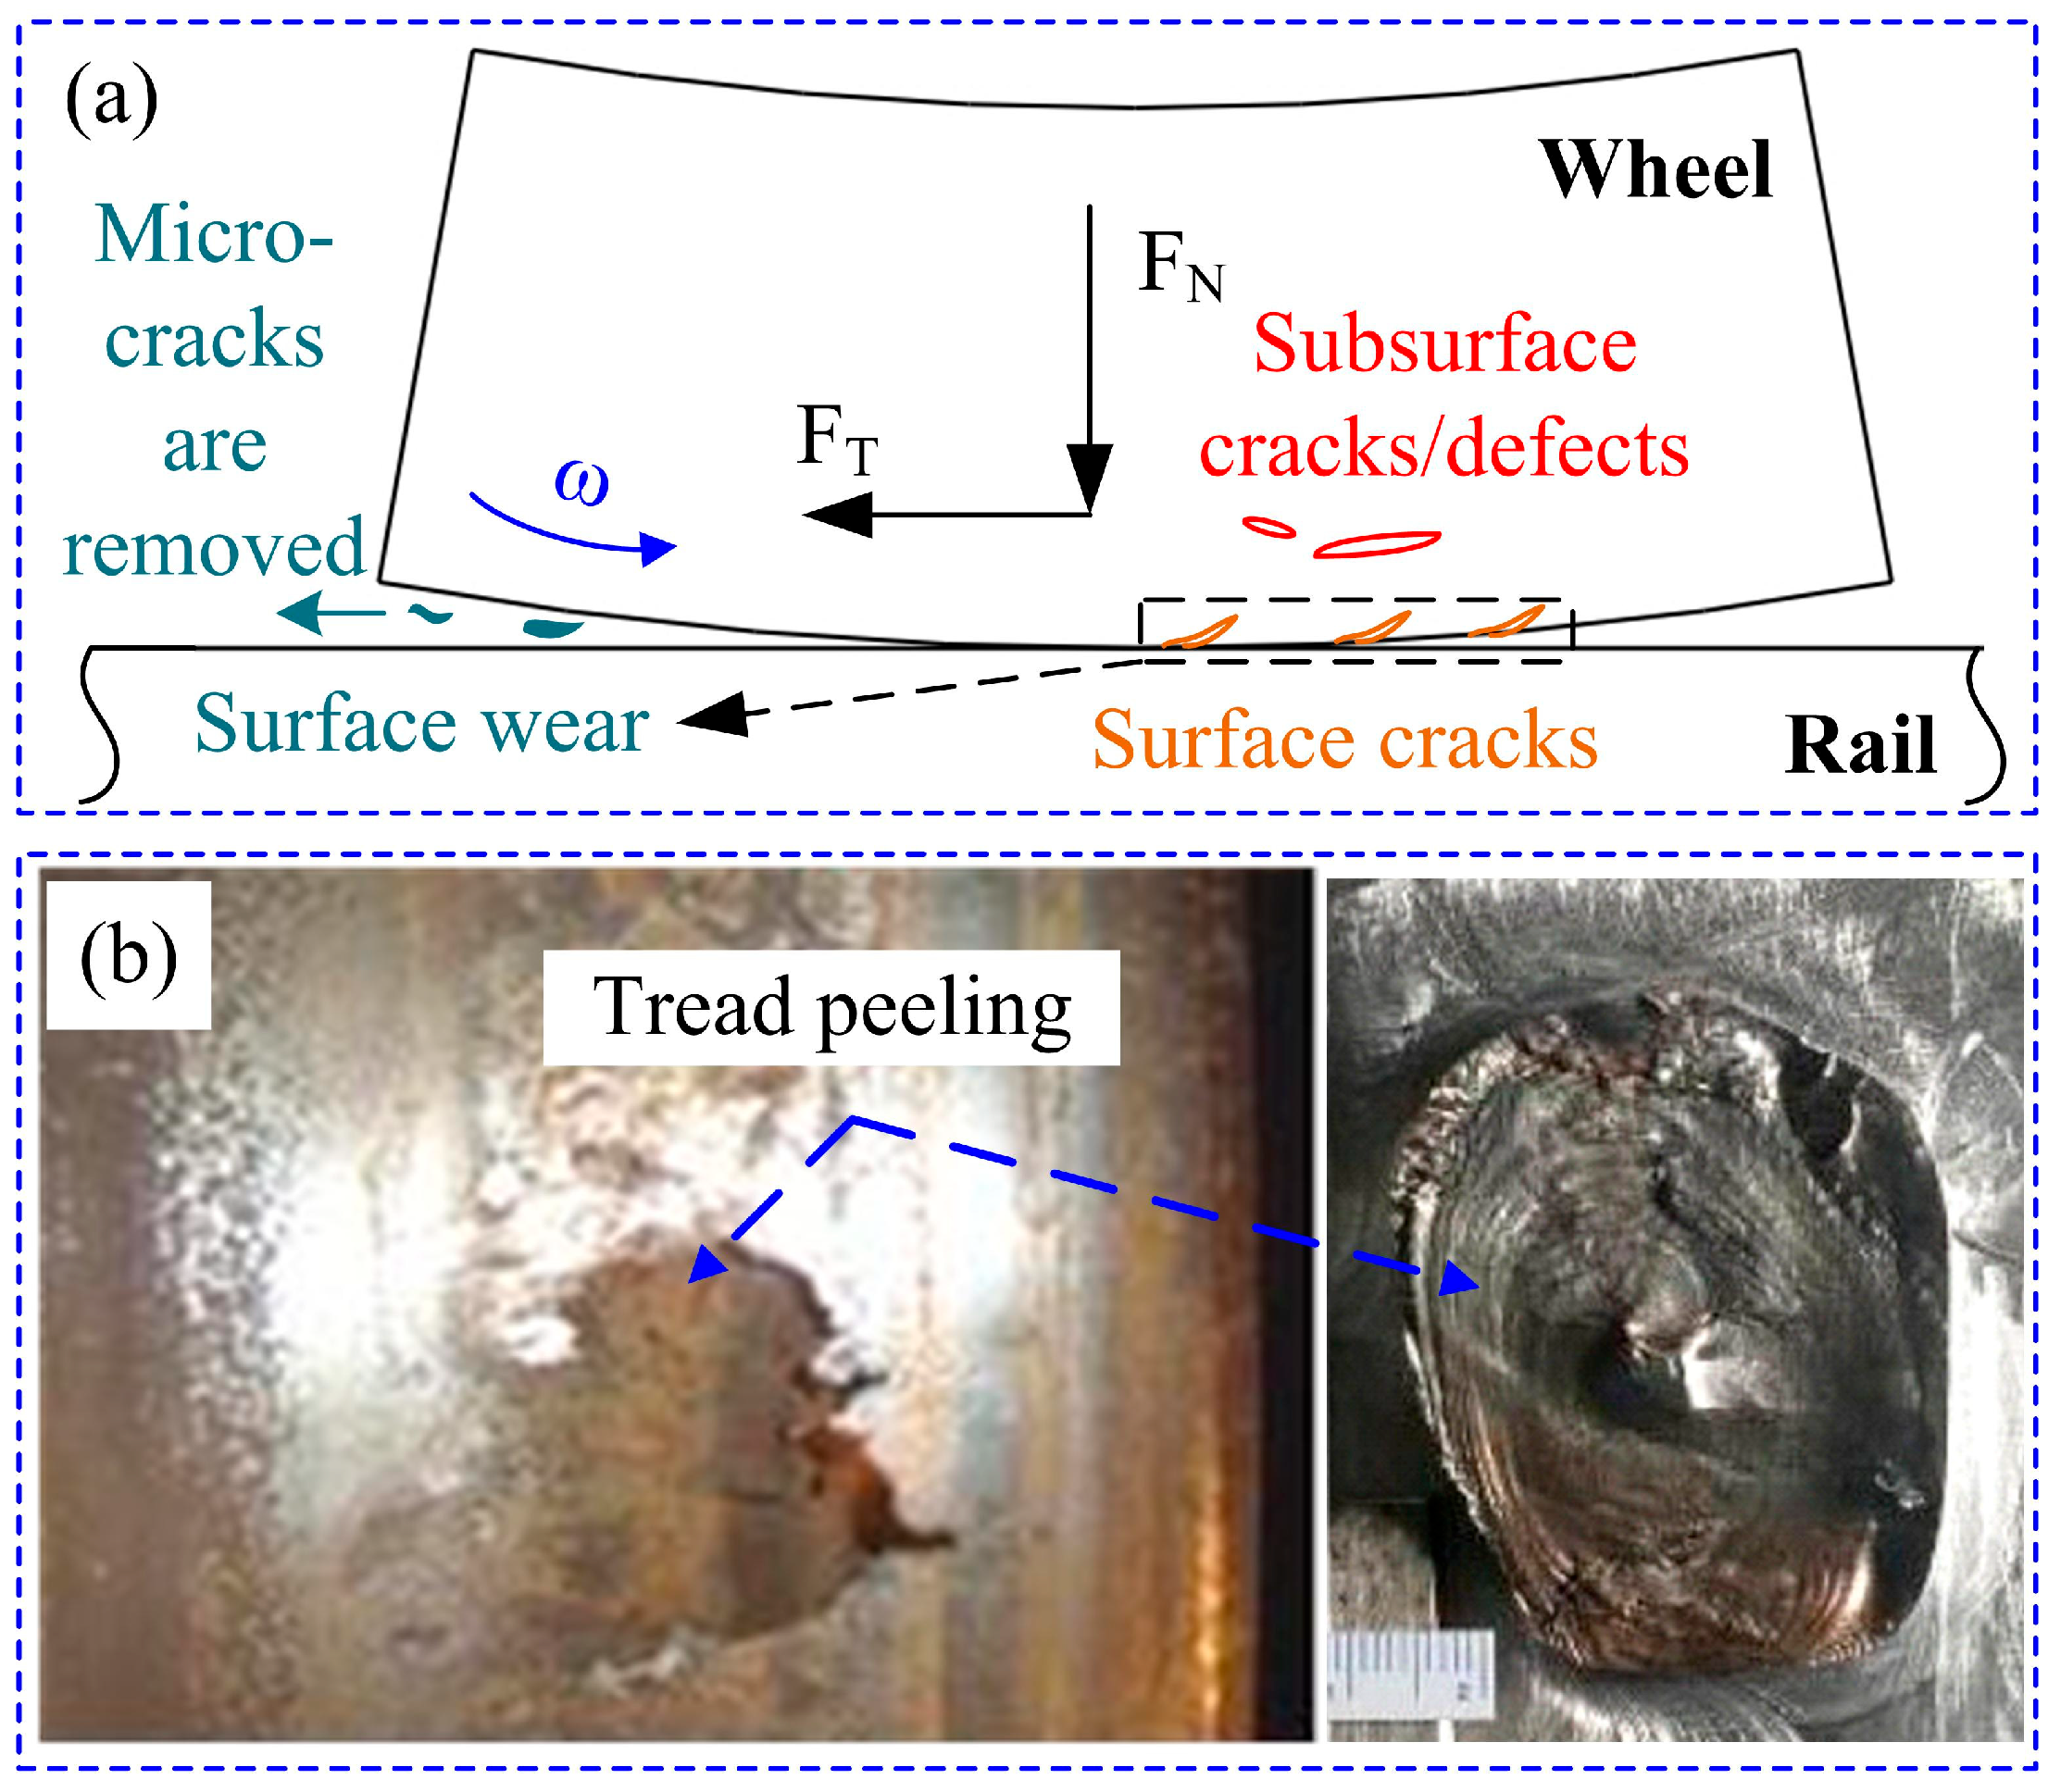
Figure 1. (a) Schematic diagram of tread peeling on wheel tread caused by RCF loads. (b) Typical surface morphology of tread peeling [3]. (Reprinted with permission from ref. [3]. 2025, ELSEVIER).
Metals 15 01148 g001
Figure 2. (a) Tread peeling characteristics; (b,c) the tread peeling caused by the RCF of in-service high-speed trains in China.
Metals 15 01148 g002
Figure 3. (a) The coupling and competitive relationship between wear and fatigue in the process of tread peeling and (b) competitive between wear and fatigue. (c) Wear rate and crack growth rate at different cycles [23,24,26]. (Reprinted with permission from ref. [23,24,26]. 2025, ELSEVIER).
Metals 15 01148 g003
Figure 4. FE model of wheel and rail for single crack: (a) schematic diagram with wheel dimensions; (b) mesh of model, boundary conditions, and initial-crack location.
Metals 15 01148 g004
Figure 5. The dynamics model for dynamic stress calculation and the load applied to the wheels for dynamics stress simulation.
Metals 15 01148 g005
Figure 6. (a) The von Mises stress contour of the cross-section of the wheel–rail contact area; (b) the distribution of von Mises stress in the wheel along the depth direction starting from the wheel–rail contact point.
Metals 15 01148 g006
Figure 7. The wheel model with an initial crack in the subsurface: (a) The insertion position of the initial crack at a depth of 3 mm below the wheel tread. (b) The crack rotated along the z-axis. (c) The mesh of the initial crack.
Metals 15 01148 g007
Figure 8. Crack rotated by 45° clockwise along the Z-axis: (a) von Mises stress contour of the initial crack; (b) distribution of multi-axial SIF and equivalent SIF at the tip of the initial crack; (c) von Mises stress contour and the fastest crack propagation path; (d) distribution of SIFs and equivalent SIF at the crack tip after the completion of crack propagation.
Metals 15 01148 g008
Figure 9. Crack rotated clockwise along the Z-axis. (a) The distribution of KI and KII at the crack tip, (b) the distribution of KIII at the crack tip, and (c) the distribution of ΔKeq at the crack tip.
Metals 15 01148 g009
Figure 10. Curves of crack propagation cycles versus propagation length: (a) crack rotated clockwise around the Z-axis; (b) crack rotated counterclockwise around the Z-axis. Curves of crack propagation rate versus equivalent stress intensity factor: (c) crack rotated clockwise around the Z-axis; (d) crack rotated counterclockwise around the Z-axis.
Metals 15 01148 g010
Figure 11. The von Mises stress contour of initial elliptical cracks: (a) Crack 1: a = 1, b = 1.2; (b) Crack 2: a = 1, b = 1; (c) Crack 3: a = 1.2, b = 1. The propagation behavior of elliptical cracks: (d) the curves of the number of the crack propagation cycles versus the propagation amount and (e) the curves of the crack propagation rate versus the equivalent ΔKeq.
Metals 15 01148 g011
Figure 12. (a) The interaction among the multi-source cracks. The von Mises stress contours of cracks in the multi-crack model: (b) double cracks and (c) triple cracks. The von Mises stress contour and SIF of the main crack: (d,g) single crack, (e,h) double cracks, and (f,i) triple cracks.
Metals 15 01148 g012
Figure 13. The von Mises stress contours at the end of crack propagation in multi-crack models: (a) double cracks and (b) triple cracks. The von Mises stress contour of the main crack: (c) single crack, (d) double cracks, and (e) triple cracks.
Metals 15 01148 g013
Figure 14. SIFs of the reference cracks in each model: (a) Distributions of KI and KII at the crack tip. (b) Distribution of KIII at the crack tip. (c) Distribution of ΔKeq at the crack tip.
Metals 15 01148 g014
Figure 15. Curves of KII for the main crack varying with crack propagation: (a) single-crack model, (b) double-crack model, and (c) triple-crack model. Curves of KIII for the main crack varying with crack propagation: (d) single-crack model, (e) double-crack model, and (f) triple-crack model. Curves of crack equivalent SIF for the main crack varying with crack propagation: (g) single-crack model, (h) double-crack model, and (i) triple-crack model.
Metals 15 01148 g015
Figure 16. Curves of crack propagation length versus propagation cycles: (a) Path 1; (b) Path 2; (c) Path 3.
Metals 15 01148 g016
Figure 17. Curves of crack propagation rate versus equivalent SIF: (a) Path 1; (b) Path 2; (c) Path 3.
Metals 15 01148 g017
Figure 18. Schematic diagram of single-subsurface-fatigue-crack propagation in the wheel.
Metals 15 01148 g018
Figure 19. Schematic diagram of the influence of secondary cracks on the propagation life of the main crack.
Metals 15 01148 g019
Table 1. The material properties of the wheel and rail [28]. (Reprinted with permission from ref. [28]. 2025, ELSEVIER.)
Material
Parameter
Elastic Modulus
(GPa)
Poisson’s
Ratio
Yield Limit
(MPa)
Tensile Limit
(MPa)
Threshold (MPa·m1/2)Fracture Toughness
(MPa·m1/2)
Wheel1970.36059035.5984
Rail2100.35509982.247
Table 2. The analysis results of vehicle dynamics.
Dynamic ParameterValue
Derailment coefficient0.11
Wheel unloading rate0.64
Wheel rail lateral force (kN)10.4
Stability indexVertical index2.26
Horizontal index2.39
Maximum acceleration (m·s−2)Vertical acceleration1.96
Transverse acceleration1.75
Table 3. The load spectrum when the train travels on a straight line at a speed of 350 km/h.
Load (kN) 40557085100115130
Frequency (%) 0.74.320.841.925.26.40.7
Disclaimer/Publisher’s Note: The statements, opinions and data contained in all publications are solely those of the individual author(s) and contributor(s) and not of MDPI and/or the editor(s). MDPI and/or the editor(s) disclaim responsibility for any injury to people or property resulting from any ideas, methods, instructions or products referred to in the content.