Abstract
In steel continuous casting, the secondary cooling zone is usually equipped with air-mist nozzles. Spray nozzle clogging is a common problem that reduces cooling efficiency and affects product quality. This study uses a 3D CFD model to investigate its impact on heat transfer. The model includes the full-size caster geometry and actual nozzle layout to analyze the effect of clogging on the cooling process. The solidification process is modeled using the enthalpy-porosity method. Spray cooling is defined through empirical HTC correlations on the slab surface. The study focuses on how nozzle clogging changes the surface temperature, cooling rate, and metallurgical length (ML). Simulation results show that clogging raises the local surface temperature by about 100 K and increases the ML. More clogged nozzles lead to a longer ML. Clogging near the meniscus has a stronger impact, showing that early-stage cooling plays an important role in solidification. Even a single clogged nozzle can increase the ML by 3.2%, highlighting the significant effect of nozzle clogging on the casting process.
1. Introduction
In the steel industry, molten steel is solidified into slab, billet, or bloom through a continuous casting process. Liquid steel begins to solidify as soon as it contacts the surface of the water-cooled copper mold. The thickness of the solidified shell gradually increases towards the exit of the mold. Beyond the mold, further solidification of the liquid steel inside the shell is accomplished by water spray from air-mist nozzles arranged across the width and along the length of the strand. These air-mist nozzles play a crucial role in maintaining the desired thermal conditions, ensuring that the steel cools at an appropriate rate to achieve the necessary physical properties [1].
The numerical simulation of solidification in a continuous casting process has become a cutting-edge field in the development of this discipline. Due to the negligible heat transfer along the direction of casting compared to the cross-sectional situation, Ma et al. [2], employed two-dimensional slice heat transfer models. Furthermore, Louhenkilpi et al. [3] developed 3-D solidification heat transfer models for continuous casting processes, predicting the solidification endpoint position. Xie et al. [4] developed a heat transfer model to study the effects of superheat and casting speed on a steel slab’s temperature and solidification. Their findings show that increasing superheat and speed shifts the solidification endpoint further away from the meniscus. Gao et al. [5] analyzed heat dissipation in a 10 mm thick section of a casting slab, revealing a significant thickness difference between the slab’s narrow and wide faces. They suggested increasing cooling on the wide face to improve heat distribution and prevent defects. B.G. Thomas et al. [6] found that the solidified shell thickness varies from 20 mm to 25 mm at the mold outlet, consistent across both the broad face (BF) and narrow face (NF). As the slab moves into secondary cooling, the encased liquid steel continues to solidify, primarily due to vigorous spray cooling. Hanao [7] reported that solidification below the meniscus initially experiences a delay, but during the secondary period, the shell grows faster and thickens linearly with time, as quantified by a specific equation. Early in the solidification process (0.1–1 s), the cooling rate fluctuates with changes in casting speed, potentially leading to longitudinal surface cracking due to variations in heat or fluid flow. Zhen et al. [8] discovered that increasing the casting speed by 0.05 m/min shifts the solidification endpoint away from the meniscus by 4.54 m and raises the core temperature by 81 °C. A 10% reduction in specific water volume moves the endpoint away from the meniscus by about 0.33 m, and a 5 °C increase in superheat moves it by roughly 0.38 m.
The solidification process can significantly impact the quality of steel products. The process often experiences uneven cooling, leading to inconsistent solidification rates at different locations, particularly across the width of the slab. Uneven cooling and the resulting uneven solidification can cause defects such as shrinkage cavities, segregation, and cracks [9]. Sun et al. [10] found that uneven cooling causes overcooling around the center region of the slab. Due to uneven solidification, an elongated solidification end is formed. Jiang [11] suggests that this solidification front across the slab’s width is associated with the cooling approach. In areas with significant undercooling at the center, Sun et al. [10] subsequently changed the original “2-1-2” nozzle arrangement to a “2-2-2” configuration, thus changing the coverage area of each nozzle, strengthening the flow density on both sides of the centerline and weakening the central overcooling. Safonov [12] observed the same temperature distribution. They developed an algorithm to state the optimized nozzle positions. It was found that variations in casting speed by ±1 m/min and cooling rates by ±10% did not result in significant changes to the optimal layout, whereas changing the slab width did lead to changes in the layout they proposed. Han et al. [13] discovered that nozzle distance affects the transverse distribution of water flux on the billet surface; as the spray distance increases, the spray coverage expands, and water distribution uniformity improves. However, this reduced transverse cooling uniformity. They proposed a nozzle arrangement to optimize cooling: gradually increasing the spray distance along the casting direction in each section of the secondary cooling zone, enhancing cooling uniformity both transversely and longitudinally. The research by Yao [14] discusses the impact of nozzle arrangements on the quality of continuously cast slabs, specifically addressing issues of solidification and segregation in a W-shaped pattern. Transverse nozzle spray flux is used to represent different types of nozzles. The study concludes that utilized a dual nozzle can improve temperature and carbon concentration distribution, thereby enhancing the quality and economic value of the casting process. Bi et al. [15] are focusing on nozzle layout and its impact on heat removal from solidifying steel. It was found that alternating the water density between odd and even rows, along with a mutual vertical arrangement of nozzles, can mitigate issues like temperature variation and improve product quality. A two-dimensional heat transfer model was developed to support these findings, emphasizing that a 22.5° spray angle is more effective than a 45° angle for minimizing temperature fluctuations on the billet’s surface. Qi [16] found that the round nozzles cause overcooling on the sides of the billet, leading to inward denting and the formation of corner cracks. The work by Zhang et al. [17] revealed that the sequence of solidification completion is as follows: the NF sides first, then the slab center, with the final solidification occurring near the quarter-width of the slab. There is a significant difference in the temperature uniformity across the width of slabs of different widths; the wider the slab, the greater the non-uniformity. Consequently, the shape of the liquid cavities becomes more complex, and the metallurgical length (ML) increases. Fan et al. [18] reported that extending the secondary cooling length and adjusting the misalignment angle of nozzles to 30° significantly reduce both longitudinal and transverse surface reheating of the bloom. Additionally, reducing the specific water rate (SWR) effectively minimizes surface reheating. The PID algorithm was used in Guo’s work [19] to adjust the water flow by monitoring the surface temperature. They removed the nozzles in the final segment, resulting in a significant increase in surface temperature. However, the temperature at the center of the slab remained nearly the same. Therefore, soft cooling in the lower part of the secondary cooling zone is beneficial for producing high-temperature slabs. Patil and Manasir [20] found that when the nozzle overlap percentage exceeds 12.5%, noticeable heat transfer coefficient (HTC) spikes occur within the overlap region, affecting the uniformity of heat transfer across the slab. Further research by Ma [21] indicates that while nozzle spacing has minimal impact on shell thickness, the cooling profile is highly sensitive to nozzle arrangement. Comparing to a rectangular arrangement, in a staggered arrangement the additional spray suppresses the variation in cooling rate in the overlap region, providing more uniform cooling.
These studies highlight the importance of uniform cooling. However, in actual production, nozzle clogging is a prevalent issue, leading to compromised cooling efficacy [22]. Cooling nozzle clogging is mainly caused by suspended materials in the cooling water. The suspended matter includes iron oxide particles, mud, and precipitates of salts in the water, along with microbes, hydraulic oil, and lubricating oil [22,23,24,25,26]. The consequence of nozzle clogging is reduced cooling efficiency, which can lead to temperature differentials of several hundred degrees Celsius within the slab [23]. This can cause uneven shell solidification and may lead to defects in the continuously cast slabs, such as segregation and cracks due to the non-uniform cooling and solidification. Controlling the clogging rate to below 3% has become a significant challenge for many steel companies [24]. Hence, researching the impact of nozzle clogging is crucial, as it significantly affects the uniformity of cooling and solidification, potentially leading to serious quality issues in the final steel product.
While the above studies revealed the effects of different cooling patterns and nozzle arrangements, little attention has been paid to the effects of spray nozzle clogging on heat transfer and solidification. The objective of this study is to explore the impact of nozzle clogging in the secondary cooling zone and highlight how such clogging can increase surface temperatures and extend the ML of steel slabs. This study builds upon and expands a previous work [25].
2. Methodology
This study simulated the phase change in a semi-solid steel slab throughout the casting process using a detailed Computational Fluid Dynamics (CFD) model. The use of a single model that focuses on accurately predicting the metallurgical length within the slab reduces computational cost.
2.1. Governing Equations
The flow model estimated turbulence using the Reynold Averaged Navier–Stokes (RANS) shear stress transport k-ω model. Through a mix of functions, the SST k-ω model combines the standard k-ε model with the k-ω model. This model employs blending functions, enhancing its efficiency in dealing with barriers like walls and baffles compared to the conventional k-ω model. Additionally, the SST k-ω model exhibits greater precision and reliability across various flow field conditions. It provides more accurate predictions for flows with separation and unfavorable pressure gradients [27].
Continuity equation:
Momentum equation:
where S is the momentum source term acting on the porous region and can be derived from Darcy’s law equation
Turbulent kinetic energy equation:
Turbulent dissipation rate equation:
The enthalpy-porosity method is commonly used to simulate solidification and melting in numerical models. This method does not track the phase boundary directly. Instead, it uses a variable called “liquid fraction” to describe the phase change. When porosity drops to zero, it means the material is fully solid and no flow occurs. A small value of porosity is used to distinguish liquid metal flow from a fully liquid state. The region where the liquid fraction is between 0 and 1 is known as the mushy zone. In this area, the liquid gradually turns into solid, and the flow slows down accordingly. As shown in Figure 1, the velocity becomes zero once the material is fully solidified.
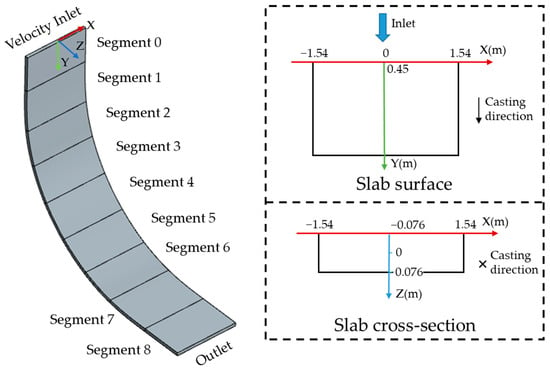
Figure 1.
Computational domain.
This study applies the Carman–Kozeny permeability model to describe flow resistance in the mushy zone. It helps to capture the flow behavior during solidification without defining a separate porous medium. The model adjusts the velocity field based on changes in solid fraction. Flow resistance only appears where part of the material has solidified and is applied throughout the domain [28].
The governing equation for heat transfer and solidification can be expressed as:
where H represents the total sum of enthalpy for steel, which includes both sensible heat and latent heat. represents the energy exchange between liquid and solid phase. is turbulent viscosity , where α* is the damping coefficient for turbulent viscosity.
The liquid and solid fraction is calculated using the following formulas:
2.2. Computational Domain and Boundary Conditions
An integrated model is applied to the full-sized caster geometry. The full-size caster has a length of 16.45 m, a width of 3.08 m, and a thickness of 0.3 m, as shown in Figure 1. The domain only includes the secondary cooling zone, which is the main focus of this study. The secondary cooling zone starts 0.45 m below the meniscus. Based on variations in nozzle water flow rate, the slab is divided into nine sections, designated as “Section 0” to “Section 8”, instead of being equally divided by geometric length. The inlet is set as a velocity inlet, with the velocity determined from data extracted from mold exit [29,30]. The HTC on the broad faces (BFs) is defined using an HTC input profile. HTC of narrow faces (NFs) accounts for natural convection and radiation, and is set to a constant value. Several assumptions were made to define the boundary conditions. First, the physical properties of steel were determined using the software JMatPro v13.3, which considered to be variable, dependent on changes in temperature as shown in Figure 2. However, some properties are constants and are listed in Table 1. Secondly, outside the spray regions, heat transfer is assumed to occur through natural convection and radiation. Additionally, the surrounding environment is assumed to maintain a constant room temperature. Finally, the dendrite arm spacing is assumed to be constant. The casting operation conditions are listed in Table 2.
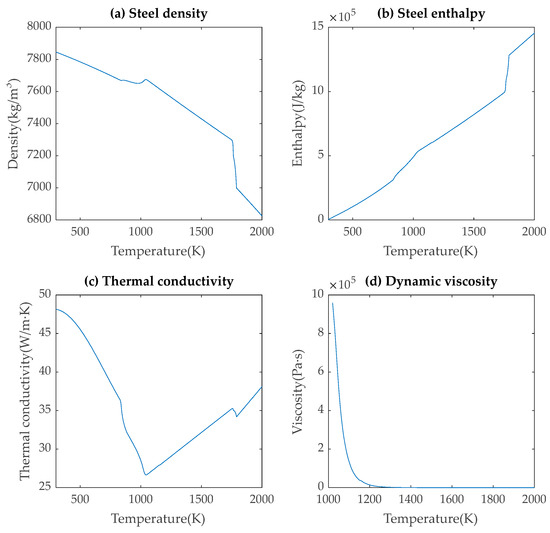
Figure 2.
Physical properties of steel.

Table 1.
Constant thermal properties of steel.

Table 2.
Operating parameters.
The configuration of nozzles and the process parameters shape the performance of the spray cooling system. Heat transfer by water spray has been widely studied. Typically, factors considered include water flux, radiation, natural convection, and heat conduction to the rolls [31]. While some researchers use the average value [31,32], most describe the HTC distribution as a function of spray water temperature and water flux [31,32,33,34,35]. In this study, the HTC distribution for each individual nozzle is defined using a previously developed HTC correlation [36], which also accounts for the influence of rollers. This approach considered various factors such as spray angle, water flow rate, casting speed, air pressure, and stand-off distance. The local HTC is given by:
where and are the normalized coordinates of the ith (jth) point with respect to its minimum and maximum values. Lumped heat transfer coefficient is expressed as [21]:
, , , , , , and represent water flow flux (L/m2·s), distance between nozzle centers (mm), stand-off distance (mm), spray water temperature (K), casting speed (m/min), distance between adjacent nozzle rows (mm), spray angle (degree) and air pressure (psi), respectively. represents the spray direction, and the numbers 1 and 0.85 are denoted for the top and bottom spray.
These individual HTC profiles were then assembled based on the nozzle locations on the caster to provide complete and realistic boundary conditions for the CFD model. Figure 3 shows the calculated heat transfer coefficients (HTCs) for both the front and back surfaces. The front-side nozzles are arranged in a symmetrical pattern. In contrast, the nozzle layout on the back side is not symmetrical—there are more nozzles on the left than on the right. Also, segments 7 and 8 do not include edge nozzles.
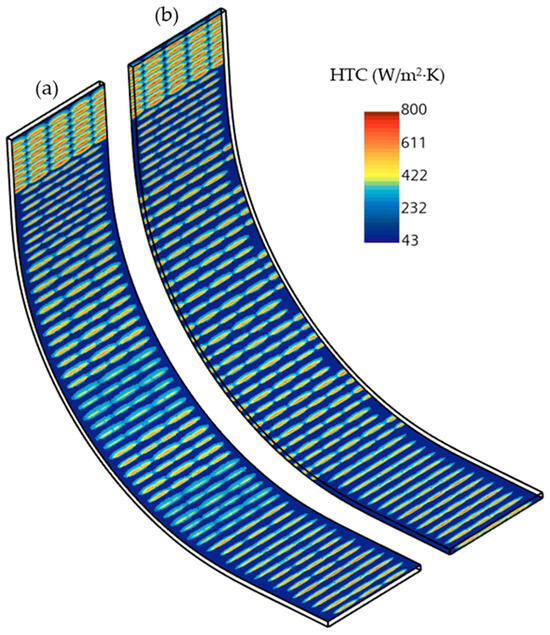
Figure 3.
HTC distribution for (a) front broad face and (b) back broad face.
3. Results and Discussion
The solidification model was previously validated by Resa et al. [29]. The shell thickness measurement was carried out from a recovered breakout shell located near a quarter of the mold width. The measured segment was approximately 200 mm wide and 1 m in length. The thickness values were recorded at 5 mm intervals along both sides of the outer surface, covering a distance from the meniscus to 0.8 m below. A larger deviation was observed near the meniscus due to partial breakage of the shell during recovery, while the overall comparison showed good agreement, with an average percentage error of 11.5%.
3.1. Baseline Results
3.1.1. Surface Temperature Distribution
The surface temperature shows significant changes, as shown in Figure 4. When the slab exits the mold, the strong cooling intensity in Seg. 0 causes a rapid temperature drop. After leaving Seg. 0, the surface temperature rises again before gradually decreasing under continued cooling. Due to two-dimensional heat transfer, the temperature of the slab corners decreases faster than the center. The lowest temperature, at 704 K, occurs near the corners adjacent to the mold exit.
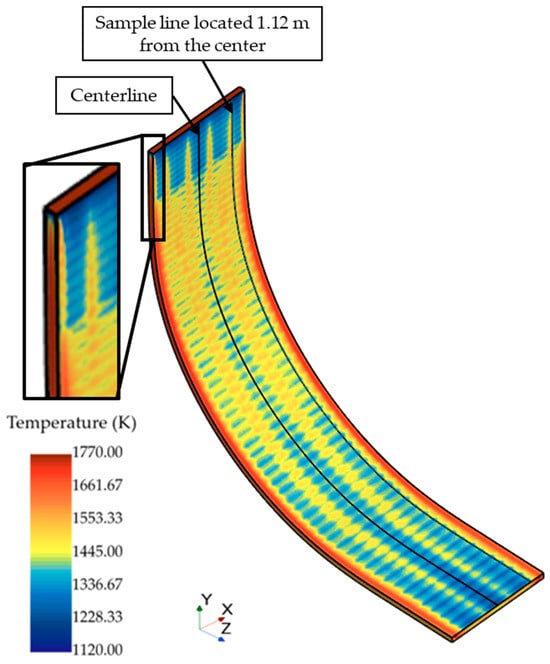
Figure 4.
Surface temperature distribution including location of the sample lines (centerline and 1.12 m from centerline).
Figure 5a,b plot the surface temperatures along the centerline and a sample line located 1.12 m from the center, which corresponds to the center of the nozzle that is clogged in later cases. These locations were selected to facilitate comparison in subsequent analysis. The temperature at the centerline tends to be lower than at the sample line, particularly after segment 6, because it is cooled from both sides. Further examinations of temperature distributions at the cross-sections of Segments 1, 3, and 5 are presented in Figure 6a. It can be seen that the central hot region gradually decreases in size as casting progresses. However, the overall distribution remains non-uniform, with high temperatures remaining near the NF, confirming that the slab undergoes uneven cooling.
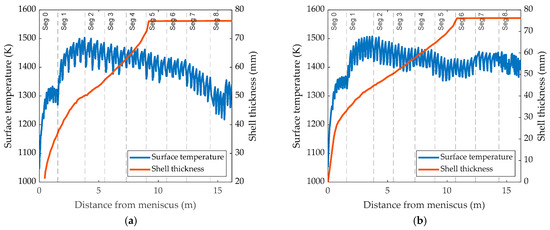
Figure 5.
Temperature distribution and solidification profile at (a) centerline; (b) sample line located 1.12 m from the center. Segments 0 to 8 represent the segments of the slab divided in the analysis.
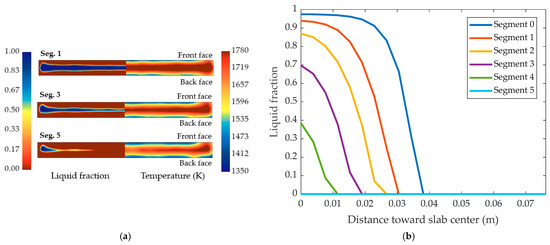
Figure 6.
(a) Liquid fraction and temperature distribution on different planes; (b) quantitative analysis along the center of solidification profiles.
3.1.2. Shell Thickness and Metallurgical Length
The temperature distribution directly affects solidification and thus influences shell thickness, as shown in Figure 5a,b. Shell thickness increases gradually as solidification proceeds. When solidification is complete, half of the slab thickness (76 mm) is taken as the shell thickness. The point where the thickness reaches 76 mm is the solidification end, and the distance from this point to the meniscus is known as the metallurgical length (ML). ML is important for ensuring slab uniformity and overall quality. In this case, the ML values at the two locations are 9.35 m and 10.84 m, respectively. The shorter ML along the centerline is due to lower temperatures that accelerate solidification.
Figure 6a shows the liquid fraction of different cross-sections, with a closer look at the center liquid fraction as plotted in Figure 6b. At Segment 5, the central region is fully solidified, while liquid cavities remain near the narrow faces. This corresponds to the high temperature regions at the same cross-section. In addition, the shell thickness on the front surface is thinner near the narrow edge than on the back surface. This is because more nozzles are installed on the back surface from Segment 2 to 6.
3.1.3. Cooling Rate Analysis
As the slab progresses through the spray zone, its surface temperature undergoes rapid fluctuations, initially dropping and then rising, creating a pattern known as reheat. These temperature fluctuations are attributed to the alternating cooling mechanisms of the nozzles and rollers. Specifically, as the slab passes under a spray nozzle, its surface undergoes rapid cooling due to direct water impingement. Once the spray passes, the surface is no longer actively cooled, and heat from the hotter interior region of the slab causes the surface temperature of the strand to rise. This reheat effect is most pronounced in Segment 1, with its intensity diminishing in the subsequent segments. To further examine the cooling effects, an analysis of the cooling rate is undertaken. The cooling rate (CR) is quantified using the following formula:
Figure 7 illustrates the cooling rate in different segments. In the figure, blue indicates the regions that are cooled down by the spray, red shows the reheating zones, and the solid–liquid interface is marked by dashed lines. Cooling moves from the surface inward toward the shell. Due to the casting speed, the area with the highest cooling rate on the shell shifts slightly downstream compared to the surface. In Segment 0, the cooling is stronger, nozzle coverage is wider, and the spacing between nozzles is tighter. These factors reduce the reheating effect. In contrast, Segment 1 shows a strong reheating at the beginning. At this point, the steel has just left the mold, and the temperature of the liquid core is still very high. The reheating weakens as cooling progresses during casting. From the liquid core to the surface, a significant increase in the cooling rate can be observed at the solid–liquid interface. This is because the hot liquid core releases a large amount of heat when it begins to solidify. As solidification progresses, the liquid core continues to lose heat. However, moving downstream, the temperature of the liquid core gradually decreases, reducing its heat dissipation capacity and consequently leading to a lower cooling rate.
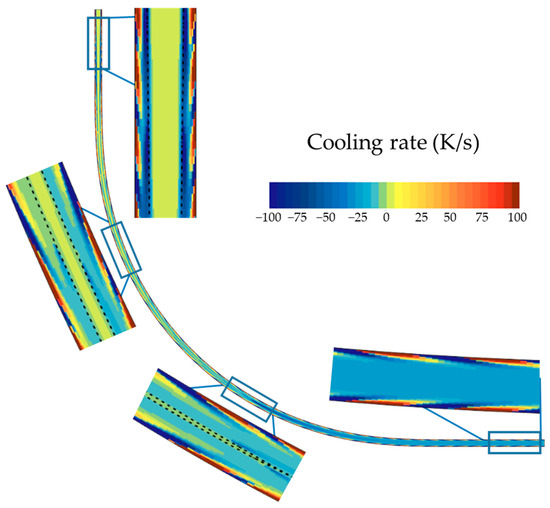
Figure 7.
Cooling rate of center plane.
3.2. Effects of Nozzle Clogging
Nozzle clogging can occur during casting operations. In severe cases, within a short time after the start of casting, the number of nozzles clogged can reach over 100, resulting in cracks appearing on the surface of the slab [23]. Hence, it is particularly important to investigate the impact of nozzle clogging. Several scenarios investigated include lengthwise clogging, where nozzles clog along the casting direction of the caster; crosswise clogging, where nozzles clog across the width of the caster; single and double nozzle clogging, when one or more nozzles clog at the same time. Diagrams depicting various scenarios are illustrated in Figure 8. In this study, nozzles in segments 0, 1, and 2 were identified as being clogged, located at positions 0.9 m, 2.7 m, and 4.7 m from meniscus. The specific position of the clogged edge nozzles is 1.12 m along the x-axis. These scenarios were developed using the methodology described in Section 2. The water flow rate of each nozzle is calculated by dividing the total flow assigned to one segment by the number of nozzles in that segment. After nozzles clog, the flow rate from the remaining unclogged nozzles can increase by 2–5%. Natural convection and radiative heat transfer were assumed at the clogged nozzle locations. In the following context, the analysis of the impacts of nozzle clogging will be divided into two groups: longitudinal clogging and transverse clogging.
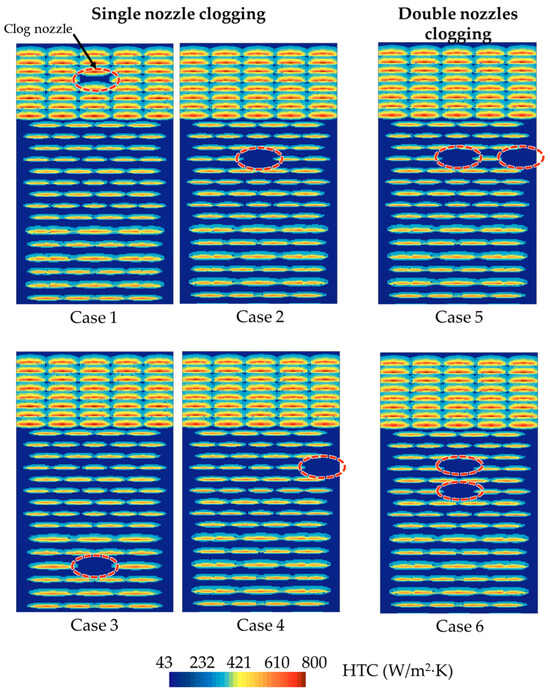
Figure 8.
Nozzle clogging scenarios.
3.2.1. Effects on Surface Temperature
This study evaluated how nozzle clogging affects surface temperature. Specifically, Figure 9 and Figure 10 show the surface temperature at the centerline and sample line, while Figure 11 captures the temperature difference. Nozzle clogging typically leads to an increase in surface temperature, with the most significant rise occurring at the clogging location. A noticeable temperature increase can be observed in the next 3 to 4 rows of nozzles, with even higher temperatures seen outside the spray region. From the clogging location to the end of the secondary cooling zone, there is a slight increase in temperature along both the centerline and sample line. Similar trends are observed in Figure 9a,b and Figure 10a,b. Figure 10a illustrates the temperature distribution along the sample line under longitudinal clogging scenarios, where no nozzles are clogged on the sample line itself, however, a slight temperature increase is still observed. Similarly, in Figure 10b, the temperature with two nozzles clogged transversely is higher than with a single nozzle clogged at the edge. These observations reflect the impact of nozzle clogging on transverse heat transfer. While Figure 9 and Figure 10 provide detailed insights into the temperature variations along specific lines on front face, Figure 11 offers a comprehensive visualization of the temperature differences across the surface. As shown in Figure 11, single nozzle clogging at the center results in a temperature difference of up to 100 K, with the temperature increase concentrated in the center region, where the nozzle is clogged. In Figure 11b, single nozzle clogging at the edge also leads to a temperature rise of up to 100 K, but this increase is concentrated at the edge. Figure 11c,d illustrate the case of double nozzle clogging; if another nozzle clogs along the downstream path, the surface may reheat by up to 120 K. In the secondary cooling of continuous casting, it is recommended by Kulkarni and Babu [37] to limit surface reheating to a maximum of 100 K. However, instances of nozzle clogging can lead to reheating levels that exceed this threshold, which is likely to introduce various issues, including potential adverse effects on the quality and structural integrity of the cast product. Additionally, nozzle clogging can lead to increased water flow rate through other nozzles, which also disrupts the transverse uniformity of heat transfer. Figure 12 shows the temperature distribution on the cross-section at the clogging position, with the sampling lines indicated as shown in Figure 13. It can be seen from the figure that the nozzle’s influence depth is approximately 0.015 m. The steel in the center of the slab maintains a superheat of 32 K, and the surface heat conduction is not affected. The temperature gradient within the mushy and solid regions is nearly linear, resulting from heat conduction being the dominant mechanism in these areas.
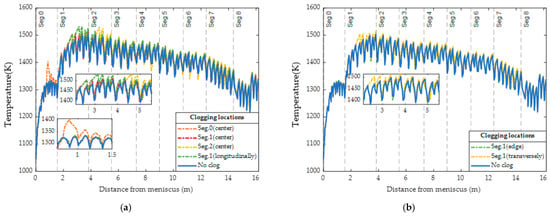
Figure 9.
Temperature distribution on the front surface along centerline under (a) longitudinal clogging scenarios and (b) transverse clogging scenarios.
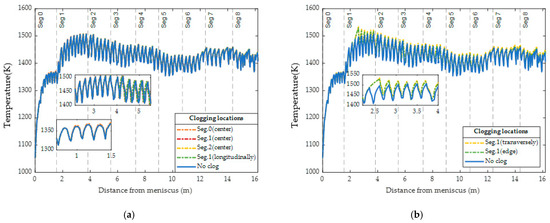
Figure 10.
Temperature distribution along the front surface along sample line located 1.12 m from the center under (a) longitudinal clogging scenarios and (b) transverse clogging scenarios.
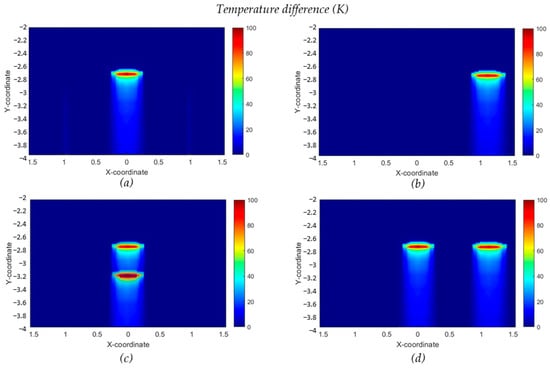
Figure 11.
Temperature difference for nozzle clogging in Segment 1. (a) Single nozzle clogging at center; (b) Single nozzle clogging at edge; (c) Double nozzle clogging longitudinally; (d) Double nozzle clogging transversely.
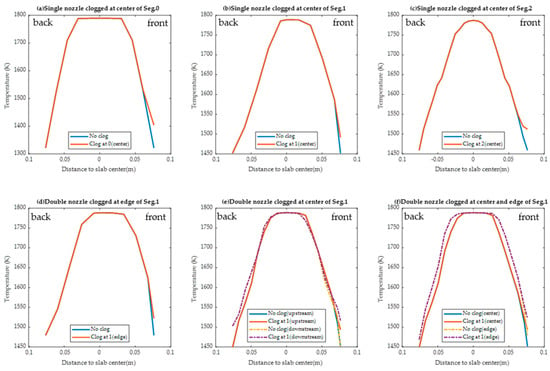
Figure 12.
Temperature distribution along the sample lines under the clogged nozzles.
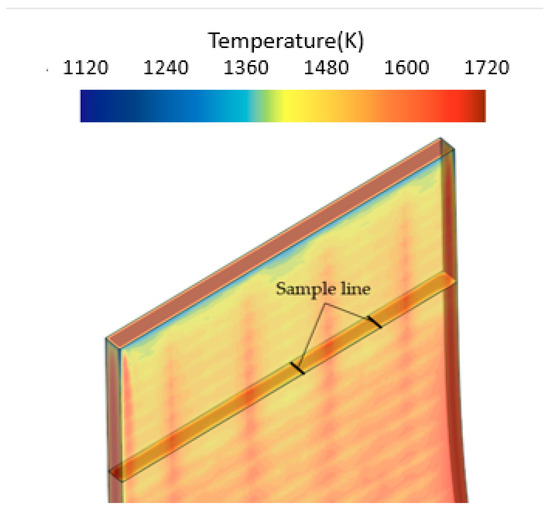
Figure 13.
Schematic of sample lines under the clogged nozzles.
3.2.2. Impact on Cooling and Reheating Rates
Figure 14 and Figure 15 illustrate the cooling rates when nozzles are clogged longitudinally and transversely, respectively, with Figure 14 showing the cooling rates on the center plane parallel to the NF, and Figure 15 depicting the cooling rates on a sampling plane 1.12 m away from the center plane. In Figure 14d, the scenario shows two nozzles longitudinally clogged at segment 1. In Figure 15c, the scenario shows two nozzles transversely clogged at segment 1. All other scenarios involve a single nozzle being clogged. Nozzle clogging leads a reduction in the local cooling rate, causing uneven cooling across the slab surface. At the positions where the nozzles are clogged, the high cooling rate area at the solid–liquid interface becomes “thinner,” and this impact may persist until the liquid core is completely solidified. When two nozzles are clogged, this thinning effect is further obvious. There is only one nozzle clogged at selected plane shown in Figure 15c, yet a similar phenomenon occurs, indicating that nozzle clogging can also have a significant transverse impact on heat transfer. Due to the reduced local cooling rate, the reheating effect in the clogged nozzle areas becomes more visible, which can further impact the overall cooling process. This behavior is observed in Segments 0, 1, and 2 alike.
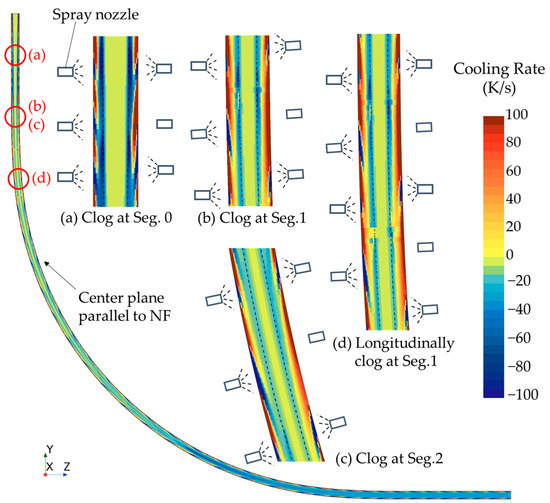
Figure 14.
Cooling rate at the center plane when the nozzles are longitudinally clogged at center of (a) Seg. 0, (b) Seg. 1, and (c) Seg. 2 with (d) double nozzle clogging in Seg. 1.
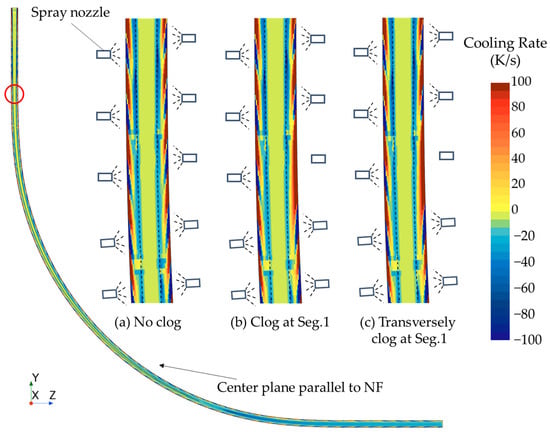
Figure 15.
Cooling rate at the sample plane when the nozzles are transversely clogged at edge: (a) no clogging; (b) Seg. 1; (c) double nozzle clogging in Seg. 1.
Figure 16 shows the average reheating for each segment (Segments 0 to 8) under different nozzle clogging conditions. Each segment corresponds to multiple-colored bars representing different clogging scenarios: no clog, clog at Segment 0, clog at Segment 2, longitudinal clog at Segment 1, transverse clog at Segment 1, and so on. Reheating generally decreases after entering the first segment. Specific clogging positions result in a significant increase in reheating for the respective segment, indicating that clogging has a substantial impact on local reheating and that this effect can extend downstream. After clogging, the average reheating value for the segment can exceed 80 K. The most significant impact occurs when there are two nozzles clogged longitudinally, while the least impact is caused by a single nozzle clog at the edge.
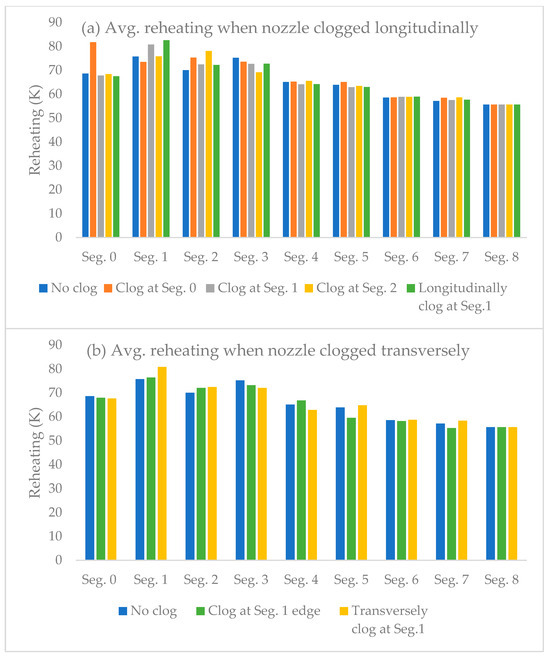
Figure 16.
Average reheating when nozzles are (a) longitudinally clogged and (b) transversely clogged.
3.2.3. Effects on Shell Thickness and Metallurgical Length
Both shell thickness and metallurgical length are strongly influenced by nozzle clogging. The shell-thickness profile is illustrated in Figure 17. When nozzle clogging occurs, the shell growth rate slows down near the clogged location because less heat is removed, which reduces the solidification rate. In addition, the higher temperature decreases the viscosity of liquid steel, allowing overheated steel to reach the solidification front, where it delivers additional heat and washes the interface, further delaying shell growth.
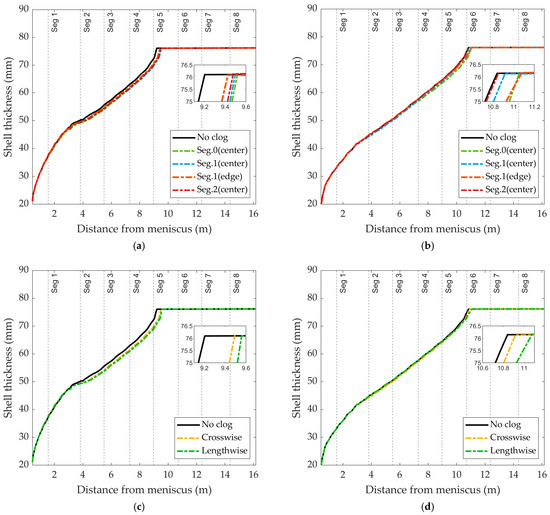
Figure 17.
Shell thickness at different positions under various scenarios: (a) Single nozzle clogging, sampling along the centerline; (b) Single nozzle clogging, sampling along the sample line; (c) Double nozzle clogging, sampling along the centerline; (d) Double nozzle clogging, sampling along the sample line.
The influence of nozzle clogging on shell thickness is analyzed from two perspectives: longitudinal clogging and transverse clogging. In the case of longitudinal clogging, it is evident that clogging in Segment 0 has the most significant impact, whereas the effect in Segment 2 is minimal. This indicates that clogging at upstream positions generally has a stronger influence on the solidification process. The reason is that, when the slab has just left the mold, its surface temperature remains very high and the temperature difference with the spray water reaches a maximum, leading to peak local heat flux. A clogged nozzle in this region prevents timely heat removal, and the excess heat significantly slows shell growth. Since the initial stage of the secondary cooling zone is also the period of fastest shell growth, clogging here forces the downstream shell to continue developing on a thinner base. The thicker shell downstream introduces greater thermal resistance. At this stage, cooling disturbances mainly cause surface reheating, while their effect on the solidification front and overall shell thickness becomes much weaker than in the upstream region. Moreover, the heat not removed upstream must then be dissipated in the downstream region. However, the cooling capacity gradually decreases along the casting direction, which requires a longer metallurgical length to complete solidification. This uneven shell growth increases the risk of breakout and may cause serious quality issues such as surface longitudinal cracks and centerline segregation.
Additionally, an analysis is conducted on a sample line taken 1.12 m away from the centerline at the point of clogging to determine the transverse effects of the clogging. Nozzle clogging in the transverse direction typically has a less substantial impact on overall shell growth. The difference in ML at the centerline between these two clogging scenarios is only 72 mm. In cases of transverse clogging, the difference in ML at the centerline is greater than that of longitudinal clogging. This indicates that heat transfer in the casting direction is less significant than transverse heat transfer. Notably, clogging at the edge has the least impact on ML, while dual nozzle clogging along the centerline results in significant ML variation, with the maximum observed difference being 0.36 m. When clogging occurs at the center, the heat cannot be effectively dispersed by lateral conduction, leading to strong concentration in the middle of the slab. By contrast, at the slab edges the heat can dissipate from the sides, so the overall impact is more limited. This highlights the critical role of central nozzles in maintaining uniform heat transfer across the slab.
The variations in metallurgical length under different clogging scenarios are summarized in Table 3. The results reveal that nozzle clogging leads to elevated surface temperatures and an extension of the metallurgical length. Clogging near the meniscus plays an important role, as shown in Case 0, where a single upstream clog increased the ML more than the two downstream clogs in Case 5. Upstream region requires to remove a large amount of heat, therefore clogging here severely slows shell growth and has a stronger impact than downstream clogging. In the transverse direction, centerline clogging produces a greater effect than edge clogging, since heat in the central region is more difficult to dissipate, while edge heat can be released through the slab sides. These findings all signify an uneven cooling distribution. To eliminate the presence of two liquid phase cavities at the domain outlet, a modification of the nozzle’s layout is required to achieve a more uniform cooling distribution.

Table 3.
Metallurgical length increase rate under different clogging scenarios.
4. Conclusions
This study investigated the impact of spray nozzle clogging in a full-scale continuous caster with realistic nozzle layout and heat transfer boundary conditions. Simulation results show that nozzle clogging can raise local surface temperatures by up to 100 K and slightly increase the metallurgical length. Even a single clogged nozzle can extend the ML by as much as 3.2%. Nozzles located near the meniscus and at the centerline are shown to have the greatest influence on solidification behavior. Clogging near the meniscus has a more pronounced impact due to the thinner initial shell and higher thermal gradients in this region. Clogging at the centerline also leads to larger metallurgical length variations, as the central region is cooled from both sides and is more sensitive to cooling imbalance. The findings highlight the importance of nozzle performance in continuous casting and enhance the understanding of its broader effects.
Author Contributions
Conceptualization, A.K.S., Y.W., S.A. and D.B.; Methodology, D.M. and A.K.S.; Software, D.M.; Validation, D.M., Y.W. and S.A.; Formal analysis, D.M., S.B.N. and A.K.S.; Investigation, D.M. and S.B.N.; Resources, A.K.S., Y.W., S.A., D.B. and C.Z.; Data curation, D.M. and S.B.N.; Writing—original draft, D.M.; Writing—review & editing, A.K.S. and Y.W.; Visualization, D.M.; Supervision, A.K.S., Y.W., S.A. and C.Z.; Project administration, A.K.S. and C.Z.; Funding acquisition, C.Z. All authors have read and agreed to the published version of the manuscript.
Funding
This research received no external funding.
Data Availability Statement
The datasets presented in this article are not readily available because the operation conditions considered in this study are proprietary to industry partner. Data release needs to be authorized by the Steel Manufacturing Simulation and Visualization Consortium. Requests to access the datasets should be directed to the corresponding author.
Acknowledgments
The authors would like to thank the Steel Manufacturing Simulation and Visualization Consortium for its unwavering support and the resources it provided, which were crucial to the success of this research.
Conflicts of Interest
Authors Yufeng Wang, Sunday Abraham, and Dallas Brown were employed by the company SSAB Americas. The remaining authors declare that the research was conducted in the absence of any commercial or financial relationships that could be construed as a potential conflict of interest.
References
- University of Michigan. Continuing Engineering Education. In Continuous Casting of Steel; University of Michigan, College of Engineering: Ann Arbor, MI, USA, 1978. [Google Scholar]
- Ma, J.; Zhi, X.; Jia, G. Applying of real-time heat transfer and solidification model on the dynamic control system of billet continuous casting. ISIJ Int. 2008, 48, 1722–1727. [Google Scholar] [CrossRef][Green Version]
- Louhenkilpi, S.; Mäkinen, M.; Vapalahti, S.; Räisänen, T.; Laine, J. 3D steady state and transient simulation tools for heat transfer and solidification in continuous casting. Mater. Sci. Eng. A 2005, 413, 135–138. [Google Scholar] [CrossRef]
- Xie, J.; Luo, G.; Liu, L.; Wang, C. Numerical Simulation Calculation of Heat Transfer Behavior During Continuous Casting of Q235B Steel Plate Billets. Spec. Steel 2020, 41, 10–14. [Google Scholar]
- Gao, X.; Li, J.; Yang, S.; Liu, C.; Zhang, Q.; Chen, H. Numerical Simulation of the Solidification Process of 2520mm Wide and Thick Plate Continuous Casting. In Proceedings of the 17th (2013) National Metallurgical Reaction Engineering Academic Conference, Conference Organizing Committee, Taiyuan, China, 1 August 2013; pp. 335–341. [Google Scholar]
- Thomas, B.G.; O’Malley, R.; Shi, T.; Meng, Y.; Creech, D.; Stone, D. Validation of fluid flow and solidification simulation of a continuous thin-slab caster. In Proceedings of Conference Held August; Cognitive Science Society: Philadelphia, PA, USA, 2000; Volume 20, p. 25. [Google Scholar]
- Hanao, M.; Kawamoto, M.; Yamanaka, A. Growth of solidified shell just below the meniscus in continuous casting mold. ISIJ Int. 2009, 49, 365–374. [Google Scholar] [CrossRef][Green Version]
- Zhen, X.; Yu, K.; Zhang, P.; Xu, L. Study on Solidification Process Simulation of Q355NE Extra Heavy Steel Slab. Wide Heavy 2024, 30, 1–7. [Google Scholar][Green Version]
- Long, M.; Dong, Z.; Chen, D.; Liao, Q.; Ma, Y. Effect of uneven solidification on the quality of continuous casting slab. Int. J. Mater. Prod. Technol. 2013, 47, 216–232. [Google Scholar] [CrossRef]
- Sun, M.; Wang, Y.; Shen, H. Analysis and optimization of spray nozzles arrangement in slab casting by numerical simulation. J. Iron Steel Res. 2011, 4, 013. [Google Scholar]
- Jiang, M. Decreasing porosities in continuous casting thick slab by soft reduction technology. Metall. Mater. Trans. B 2021, 52, 2753–2759. [Google Scholar] [CrossRef]
- Safonov, D.S.; Logunova, O.S.; Chistiakov, D.V. Optimization of nozzle layout in continuous casting machine. Bull. South Ural State Univ. Ser. “Math. Model. Program. Comput. Softw.” 2016, 9, 114–122. [Google Scholar] [CrossRef]
- Han, Y.; Zhang, J.; Zou, L.; Zeng, F.; Guan, M.; Liu, Q. Effect of nozzle spray distance on the secondary cooling uniformity of continuous casting billet. Chin. J. Eng. 2020, 42, 739–746. [Google Scholar]
- Yao, C.; Wang, M.; Ni, Y.; Gong, J.; Liu, Q.; Zhang, M.; Xing, L.; Bao, Y. Numerical study on the effect of different spray characteristics of casting nozzles on W-shape solidification and segregation during continuous casting of slabs. Int. J. Heat Mass Transf. 2024, 218, 124803. [Google Scholar] [CrossRef]
- Bi, Y.; Chen, D.; Zhang, J.; Wang, S. Investigation on Nozzle Layout at Secondary Cooling Zone of Round Billet Continuous Casting. Mater. Sci. Forum 2012, 704, 1356–1362. [Google Scholar] [CrossRef]
- Qi, Y. Influence of secondary cooling nozzle shape and layout on quality of continuous casting slab. Teshugang 2004, 25, 55–57. [Google Scholar]
- Zhang, F.; Wang, X. Simulation of Uneven Cooling Along the Width of Continuous Cast Slab in Secondary Cooling Zone. Metals 2006, 9, 30–32+36. [Google Scholar] [CrossRef]
- Fan, H.; Long, M.; Yu, S.; Chen, D.; Liu, T.; Duan, H.; Chen, H. Uniform secondary cooling pattern for minimizing surface reheating of the strand during round bloom continuous casting. JOM 2018, 70, 237–242. [Google Scholar] [CrossRef]
- Guo, L.; Tian, Y.; Yao, M.; Shen, H. Temperature distribution and dynamic control of secondary cooling in slab continuous casting. Int. J. Miner. Metall. Mater. 2009, 16, 626–631. [Google Scholar]
- Patil, N.; Al Manasir, R.; Silaen, A.K.; Walla, N.; Zhou, C. Spray Overlap and Heat Transfer Coefficient Uniformity in the Continuous Casting. In Heat Transfer Summer Conference; American Society of Mechanical Engineers: New York, NY, USA, 2023; Volume 87165, p. V001T07A006. [Google Scholar]
- Ma, H. On Heat Transfer Mechanisms in Secondary Cooling of Continuous Casting of Steel Slab. Ph.D. Thesis, Purdue University, West Lafayette, IN, USA, 2021. [Google Scholar]
- Chen, Z.; Zhou, Y.; Zhou, D. Analysis and countermeasures of blockage in the secondary cooling water nozzle of CSP continuous casting machine. Metall. Power 2014, 3, 55–56+58. [Google Scholar] [CrossRef]
- Yang, Z. Causes Analysis of Secondary Cooling Water Nozzle Blockage of Continuous Casting and Comprehensive Solution. Metall. Power 2012, 1, 55–58. [Google Scholar] [CrossRef]
- Li, Y.; Yu, Q. Analysis on Cause to Secondary Cooling Nozzle Clogging and Countermeasures. Wisco Technol. 2008, 46, 41–45. [Google Scholar]
- Meng, D.; Nandipati, S.B.; Silaen, A.; Zhou, C. Investigating the Effects of Spray Nozzle Clogging in Continuous Casting of Steel. In ASME International Mechanical Engineering Congress and Exposition; American Society of Mechanical Engineers: New York, NY, USA, 2024; Volume 88674, p. V009T11A048. [Google Scholar]
- Guo, S. Analysis and countermeasures of blockage in the secondary cooling water nozzle of slab continuous casting machine. Sci. Techonology Vis. 2014, 20, 115+210. [Google Scholar] [CrossRef]
- Menter, F.R. Two-equation eddy-viscosity turbulence models for engineering applications. AIAA J. 1994, 32, 1598–1605. [Google Scholar] [CrossRef]
- Carman, P.C. Fluid flow through granular beds. Trans. Inst. Chem. Eng. Lond. 1937, 15, 150–156. [Google Scholar] [CrossRef]
- Resa, J.; Moore, M.; Zhou, X.; Ma, H.; Silaen, A.K.; Zhou, C.Q. Analysis of Solidification and Thermal-Mechanical Behaviors in Continuous Casting. In TMS 2020 149th Annual Meeting & Exhibition Supplemental Proceedings; Springer International Publishing: Cham, Switzerland, 2020; pp. 1175–1187. [Google Scholar]
- Zhou, X.; Moore, M.T.; Ma, H.; Silaen, A.K.; Zhou, C.Q. Adaptive mesh refinement of the solidification front in continuous caster simulations. In ASME International Mechanical Engineering Congress and Exposition; American Society of Mechanical Engineers: New York, NY, USA, 2019; Volume 59452, p. V008T09A052. [Google Scholar]
- Meng, Y.; Thomas, B.G. Heat-transfer and solidification model of continuous slab casting: CON1D. Metall. Mater. Trans. B 2003, 34, 685–705. [Google Scholar] [CrossRef]
- Mosayebidorcheh, S.; Gorji-Bandpy, M. Local and averaged-area analysis of steel slab heat transfer and phase change in continuous casting process. Appl. Therm. Eng. 2017, 118, 724–733. [Google Scholar] [CrossRef]
- Nozaki, T.; Matsuno, J.-I.; Murata, K.; Ooi, H.; Kodama, M. A secondary cooling pattern for preventing surface cracks of continuous casting slab. Trans. Iron Steel Inst. Jpn. 1978, 18, 330–338. [Google Scholar] [CrossRef]
- Long, M.; Chen, H.; Chen, D.; Yu, S.; Liang, B.; Duan, H. A combined hybrid 3-D/2-D model for flow and solidification prediction during slab continuous casting. Metals 2018, 8, 182. [Google Scholar] [CrossRef]
- Xia, G.; Schiefermüller, A. The influence of support rollers of continuous casting machines on heat transfer and on stress-strain of slabs in secondary cooling. Steel Res. Int. 2010, 81, 652–659. [Google Scholar] [CrossRef]
- Ma, H.; Silaen, A.; Zhou, C. Numerical development of heat transfer coefficient correlation for spray cooling in continuous casting. Front. Mater. 2020, 7, 577265. [Google Scholar] [CrossRef]
- Kulkarni, M.; Babu, A.S. Optimization of continuous casting using simulation. Mater. Manuf. Process. 2005, 20, 595–606. [Google Scholar] [CrossRef]
Disclaimer/Publisher’s Note: The statements, opinions and data contained in all publications are solely those of the individual author(s) and contributor(s) and not of MDPI and/or the editor(s). MDPI and/or the editor(s) disclaim responsibility for any injury to people or property resulting from any ideas, methods, instructions or products referred to in the content. |
© 2025 by the authors. Licensee MDPI, Basel, Switzerland. This article is an open access article distributed under the terms and conditions of the Creative Commons Attribution (CC BY) license (https://creativecommons.org/licenses/by/4.0/).